
The value of source data verification: an
example from cancer
Catrin Tudur Smith
North West Hub for Trials Methodology Research
Cancer Research UK Liverpool Cancer Trials Unit
Deborah Stocken, Janet Dunn, Paula Ghaneh, Trevor
Cox, David Cunningham, John Neoptolemos
PLEASE DO NOT REPRODUCE

Approaches to monitoring
Oversight of the quality of the trial
o Central monitoring - use of centralised procedures
for quality control of trial data
o On-site monitoring – use of procedures for quality
control of trials data undertaken during on-site
visits
PLEASE DO NOT
REPRODUCE

Purpose of monitoring
Verify that :
(a) The rights and well-being of human subjects are protected.
(b) The reported trial data are accurate, complete, and
verifiable from source documents.
(c) The conduct of the trial is in compliance with the currently
approved protocol / amendment(s), with GCP and with the
applicable regulatory requirement(s).
(ICH GCP 5.18)
PLEASE DO NOT
REPRODUCE

Source data verification
• The procedure used to check that the data
contained in the Case Report Form match the
primary source (e.g. medical record)
• Undertaken during on-site monitoring
PLEASE DO NOT
REPRODUCE

Source data verification
“The most effective way to assure the accuracy of
the data submitted to FDA is to review individual
subject records and other supporting documents
and compare those records with the report
prepared by the investigator for submission to the
sponsor.”
Guideline for the Monitoring of Clinical
Investigations
U.S. Federal Register 1988
PLEASE DO NOT
REPRODUCE

ICH GCP
„.... In general there is a need for on-site monitoring
before, during and after the trial; however in exceptional
circumstances the sponsor may determine that central
monitoring in conjunction with procedures such as
investigators‟ training and meetings … can assure appropriate
conduct of the trial in accordance with GCP‟
(ICH GCP 5.18.3)
PLEASE DO NOT
REPRODUCE
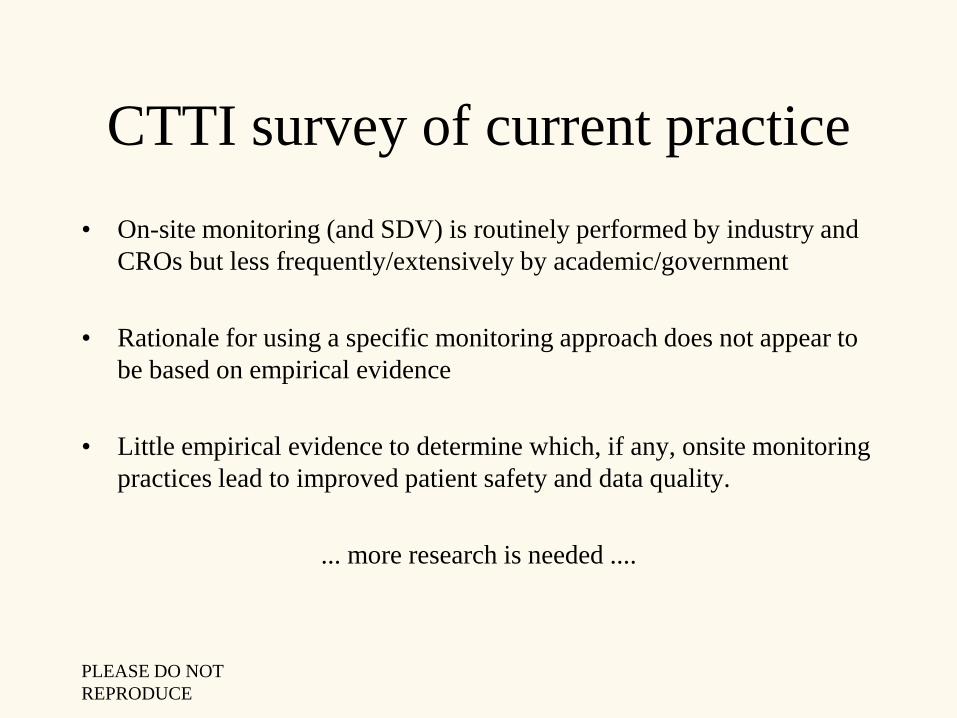
CTTI survey of current practice
• On-site monitoring (and SDV) is routinely performed by industry and
CROs but less frequently/extensively by academic/government
• Rationale for using a specific monitoring approach does not appear to
be based on empirical evidence
• Little empirical evidence to determine which, if any, onsite monitoring
practices lead to improved patient safety and data quality.
... more research is needed ....
PLEASE DO NOT
REPRODUCE

Empirical example from cancer
• Non-commercial cancer trial designed and initiated pre-
2004 UK regulations
• Parallel, open-label, multicentre (UK), phase III,
superiority RCT comparing control chemotherapy with
experimental chemotherapy
• At the close of recruitment 100% SDV initiated
• All source verified data entered onto a „new‟ database
Comparison of original data and source verified data
PLEASE DO NOT
REPRODUCE
Aims
• Estimate error rates for key data
• Compare analyses of key end-points
• Estimate cost of SDV
• Future work to compare SDV against
„central monitoring‟
PLEASE DO NOT
REPRODUCE

Strengths/limitations
• Strengths
– Independent review of data
– Independent database
– Rare for 100% SDV to be performed in non-
commercial trials
• Limitations
– Original „un-monitored‟ data may not represent current
practice
– SDV may have changed trial conduct towards end of
the trial
PLEASE DO NOT
REPRODUCE

Outcomes
• Primary outcome
– Overall Survival (OS)
• Secondary outcomes
– Progression Free Survival (PFS)
– Objective Response
– Serious Adverse Events
PLEASE DO NOT
REPRODUCE
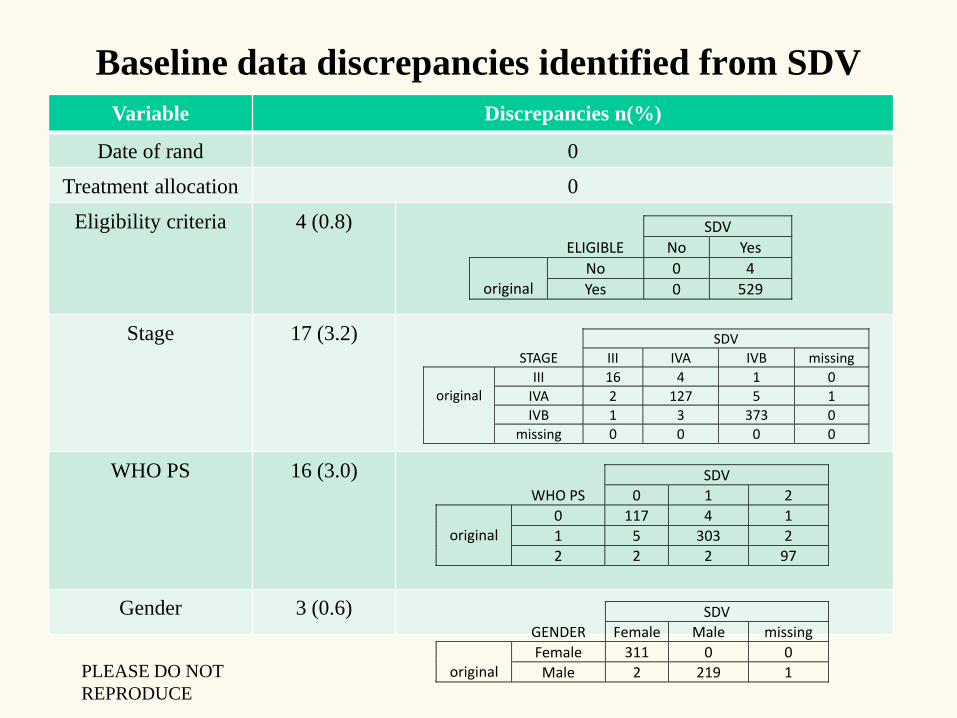
Baseline data discrepancies identified from SDV
Variable Discrepancies n(%)
Date of rand 0
Treatment allocation 0
Eligibility criteria 4 (0.8)
Stage 17 (3.2)
WHO PS 16 (3.0)
Gender 3 (0.6)
SDV
STAGE III IVA IVB missing
original
III 16 4 1 0
IVA 2 127 5 1
IVB 1 3 373 0
missing 0 0 0 0
SDV
ELIGIBLE No Yes
original
No 0 4
Yes 0 529
SDV
WHO PS 0 1 2
original
0 117 4 1
1 5 303 2
2 2 2 97
SDV
GENDER Female Male missing
original
Female 311 0 0
Male 2 219 1
PLEASE DO NOT
REPRODUCE

Baseline data discrepancies identified from SDV
Variable Discrepancies
n* (%)
Date of birth 12 (2.3)
Ethnic group 7 (1.3)
Date of diagnosis 53 (9.9)
Discrepancy (days)
original - SDV
-3653 -1461 -122 -60 -3 0 1 7 30 61 303
Number of patients
2 1 1 2 1 521 1 1 1 1 1
SDV
ETHNICITY White Asian Black Other Missing
original
White 508 5
Asian 4
Black 10
Other 3
Missing 2 1
PLEASE DO NOT
REPRODUCE

Baseline data discrepancies
• All discrepancies were equally distributed
– Across treatment group
– Across sites
– No systematic patterns
PLEASE DO NOT
REPRODUCE

Overall survival
Variable
Discrepancies n (%)
Control Experimental Total
(n=266) (n=267) (n=533)
Date of death 21 (7.9) 22 (8.2) 43 (8.1)
Death status
(„Alive‟ in un-
monitored „Dead‟
in SDV)
15 (5.6) 14 (5.2) 29 (5.4)
PLEASE DO NOT
REPRODUCE

Overall survival
Non-
monitored
data
Source
verified data
HR (95% CI)* 1.19
(0.99 to 1.42)
1.18
(0.99 to 1.41)
Number of
patients
533 533
Deaths 469 498
Log-rank
statistic
3.33 3.44
Log-rank p-
value
0.068 0.064
*HR>1 indicates benefit to E
PLEASE DO NOT
REPRODUCE
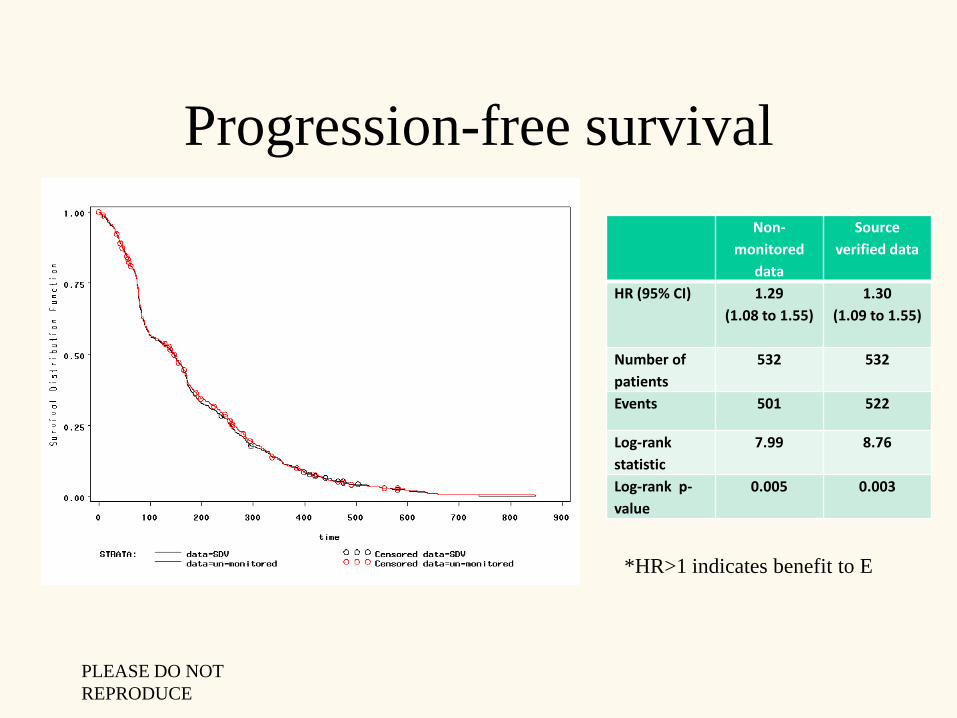
Progression-free survival
Non-
monitored
data
Source
verified data
HR (95% CI) 1.29
(1.08 to 1.55)
1.30
(1.09 to 1.55)
Number of
patients
532 532
Events 501 522
Log-rank
statistic
7.99 8.76
Log-rank p-
value
0.005 0.003
*HR>1 indicates benefit to E
PLEASE DO NOT
REPRODUCE

RECIST Response criteria (2000)
• Complete response (CR): disappearance of all target lesions
• Partial response (PR): At least a 30% decrease in the sum of the
longest diameter of target lesions, taking as reference the baseline sum
longest diameter
• Stable disease (SD): Neither sufficient shrinkage to qualify for partial
response nor sufficient increase to qualify for progressive disease, taking as
reference the smallest sum longest diameter since the treatment started
• Progressive disease (PD): At least a 20% increase in the sum of the
longest diameter of target lesions, taking as reference the smallest sum
longest diameter recorded since the treatment started or the appearance of
one or more new lesions
PLEASE DO NOT
REPRODUCE

Response
SDV classification
CR PR SD PD missing Total
Original
CR 5 0 0 0 0 5
PR 1 75 17 4 8 105
SD 0 18 202 17 20 257
PD 0 0 5 116 7 128
missing 7 23 48 47 0 125
Total 13 116 272 184 35 620
CR: complete response PR: partial response
SD: stable disease PD: progressive disease
PLEASE DO NOT
REPRODUCE
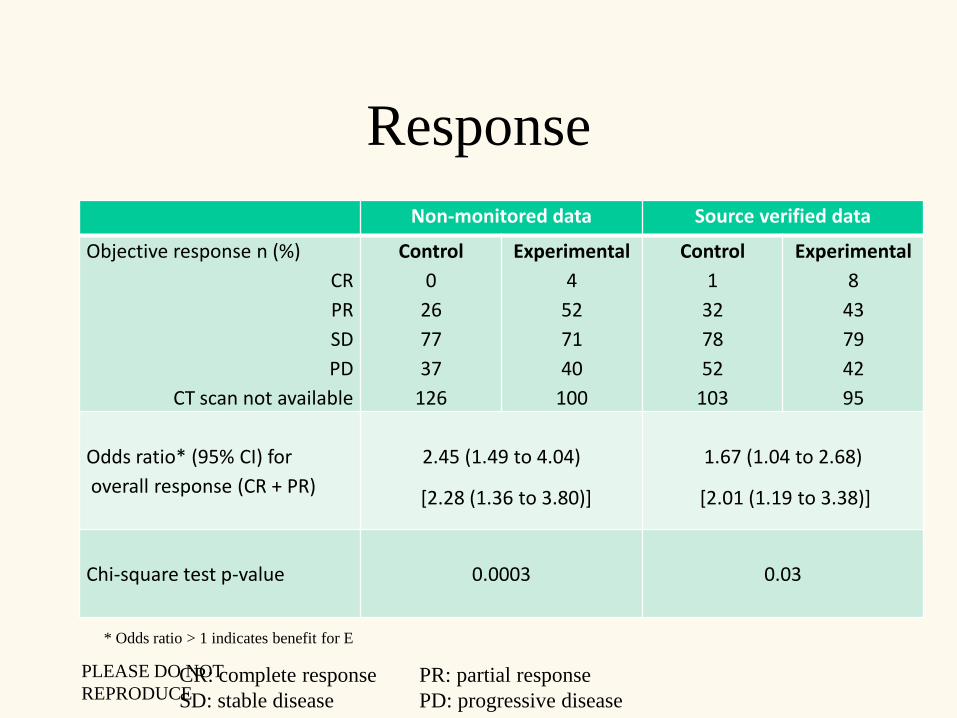
Response
CR: complete response PR: partial response
SD: stable disease PD: progressive disease
Non-monitored data Source verified data
Objective response n (%)
CR
PR
SD
PD
CT scan not available
Control
0
26
77
37
126
Experimental
4
52
71
40
100
Control
1
32
78
52
103
Experimental
8
43
79
42
95
Odds ratio* (95% CI) for
overall response (CR + PR)
2.45 (1.49 to 4.04) 1.67 (1.04 to 2.68)
Chi-square test p-value 0.0003 0.03
* Odds ratio > 1 indicates benefit for E
[2.28 (1.36 to 3.80)] [2.01 (1.19 to 3.38)]
PLEASE DO NOT
REPRODUCE

Serious adverse events
Number of patients with discrepancies in number of SAEs
Control Experimental Total
Original data but not SDV
SDV but not original
22
34
11
37
33
71
Overall 56 49 104
Preliminary Data! PLEASE DO NOT
REPRODUCE
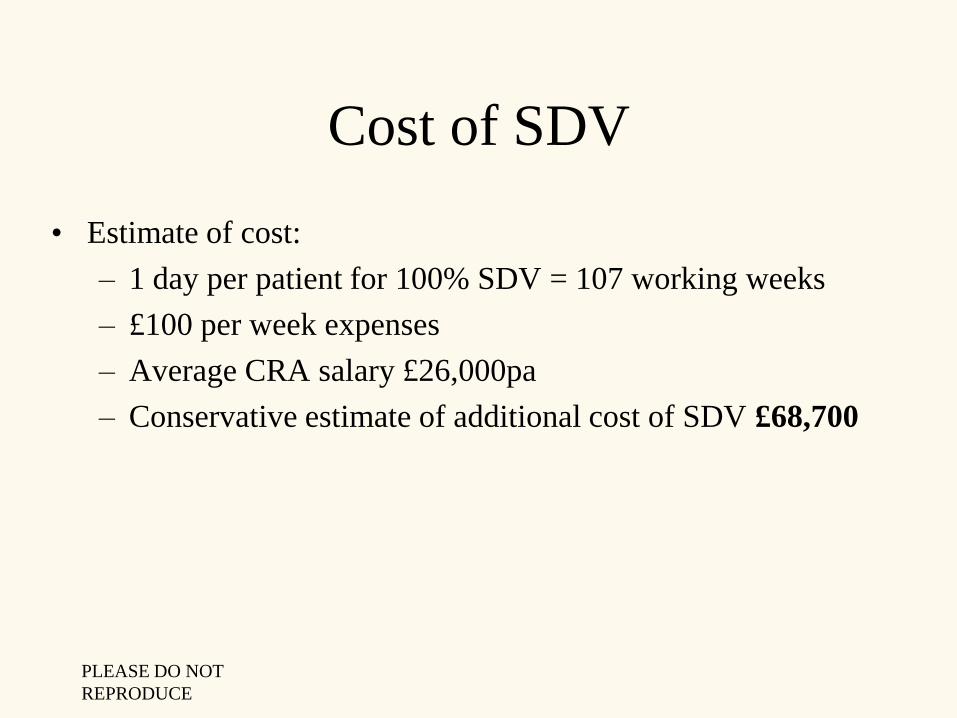
Cost of SDV
• Estimate of cost:
– 1 day per patient for 100% SDV = 107 working weeks
– £100 per week expenses
– Average CRA salary £26,000pa
– Conservative estimate of additional cost of SDV £68,700
PLEASE DO NOT
REPRODUCE
Central monitoring for OS
• Discrepancies in death data – not clear
whether SDV accurate
• Central collection of death data from ONS
• Provides a „third‟ data set for comparison
PLEASE DO NOT
REPRODUCE

Central monitoring for OS
• Original consent form prohibited disclosure
of patient identifiers
• Section 60 approval requested from Patient
Information Advisory Group (PIAG) to
obtain name and NHS number from sites
• Time from approval to data lock (of death
data) ~ 7 months
• Cost of this process ~ £500
PLEASE DO NOT
REPRODUCE
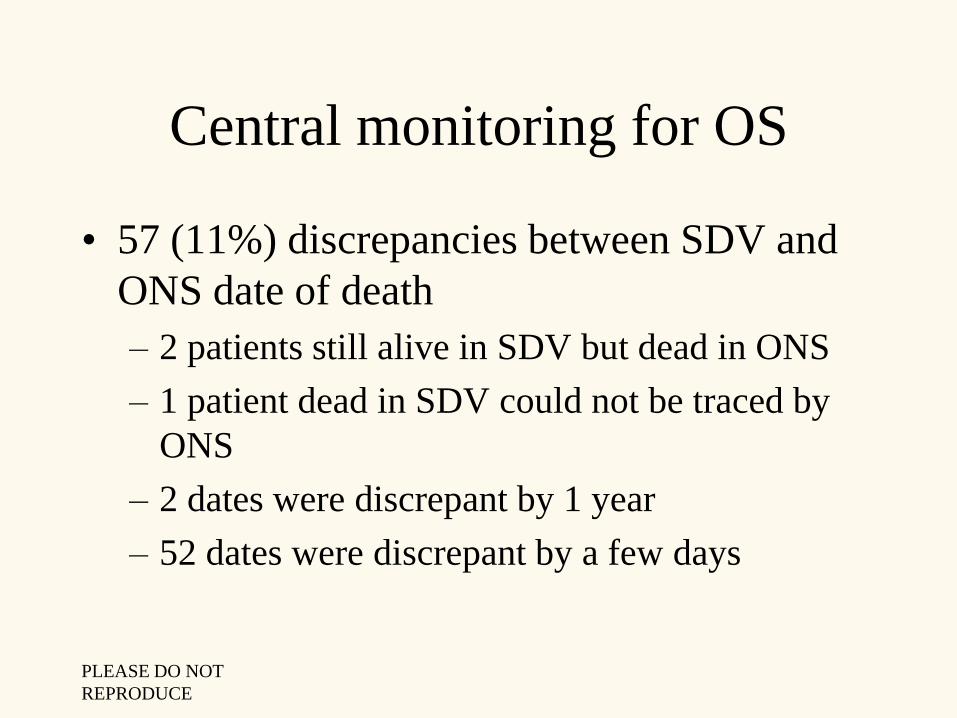
Central monitoring for OS
• 57 (11%) discrepancies between SDV and
ONS date of death
– 2 patients still alive in SDV but dead in ONS
– 1 patient dead in SDV could not be traced by
ONS
– 2 dates were discrepant by 1 year
– 52 dates were discrepant by a few days
PLEASE DO NOT
REPRODUCE

Central monitoring for OSNon-
monitored
data
Source verified
data
Central
monitored
data
HR (95% CI)* 1.19
(0.99 to 1.42)
1.18
(0.99 to 1.41)
1.18
(0.99 to 1.40)
Number of
patients
533 533 533
Deaths 469 498 499
Log-rank
statistic
3.33 3.44 3.22
Log-rank p-
value
0.068 0.064 0.073
*HR>1 indicates benefit to EPLEASE DO NOT
REPRODUCE

Overall survival
*HR>1 indicates benefit to E0. 00
0. 25
0. 50
0. 75
1. 00
t i me
0 200 400 600 800 1000 1200
STRATA: dat a=ONS Censor ed dat a=ONS
dat a=SDV Censor ed dat a=SDV
dat a=un- moni t or ed Censor ed dat a=un- moni t or ed
PLEASE DO NOT
REPRODUCE

Conclusions
In this empirical example....
• Error rates
– Similar to published rates in other areas
– High for critical data
– Equally distributed across groups and sites
• SDV identified errors, BUT
– Errors did not impact analysis of OS or PFS
– Central monitoring suggested possible errors in SV data
– Central monitoring for OS more efficient and accurate
PLEASE DO NOT
REPRODUCE
Conclusions
• SDV did impact response data
– Data collection difficult/subjective for these outcomes
– Higher risk of error
– Suggests a need to focus training research staff
– Tracking of „missing data‟
• SDV resource intensive and may not necessarily provide error
free data
– End of trial „checklist‟ of critical data to site staff may be an
alternative more efficient approach for some data?
PLEASE DO NOT
REPRODUCE

“the first and foremost goal of quality assurance in clinical
trials is the prevention of problems. Subsequent goals are to
detect problems and to take appropriate, prompt, and
effective action to correct them”
Knatterud et al (1998)
PLEASE DO NOT
REPRODUCE


