Vanguard S&P Mid-Cap 400 Index Funds
Vanguard S&P Mid-Cap 400 Index Fund
Vanguard S&P Mid-Cap 400 Value Index Fund
Vanguard S&P Mid-Cap 400 Growth Index Fund
Annual Report | August 31, 2017
Contents
Please note: The opinions expressed in this report are just that—informed opinions. They should not be considered promisesor advice. Also, please keep in mind that the information and opinions cover the period through the date on the front of thisreport. Of course, the risks of investing in your fund are spelled out in the prospectus.
See the Glossary for definitions of investment terms used in this report.About the cover: Nautical images have been part of Vanguard’s rich heritage since its start in 1975. For anincoming ship, a lighthouse offers a beacon and safe path to shore. You can similarly depend on Vanguard to putyou first––and light the way––as you strive to meet your financial goals. Our client focus and low costs,stemming from our unique ownership structure, assure that your interests are paramount.
Vanguard’s Principles for Investing Success
We want to give you the best chance of investment success. Theseprinciples, grounded in Vanguard’s research and experience, can put you onthe right path.
Goals. Create clear, appropriate investment goals.
Balance. Develop a suitable asset allocation using broadly diversified funds.
Cost. Minimize cost.
Discipline. Maintain perspective and long-term discipline.
A single theme unites these principles: Focus on the things you can control.We believe there is no wiser course for any investor.
Your Fund’s Performance at a Glance. . . . . . . . . . . . . . . . . . 1
Chairman’s Perspective. . . . . . . . . . . . . . . . . . . . . . . . . . . . . 4
S&P Mid-Cap 400 Index Fund. . . . . . . . . . . . . . . . . . . . . . . . 8
S&P Mid-Cap 400 Value Index Fund. . . . . . . . . . . . . . . . . . .28
S&P Mid-Cap 400 Growth Index Fund. . . . . . . . . . . . . . . . . 47
Your Fund’s After-Tax Returns. . . . . . . . . . . . . . . . . . . . . . . 67
About Your Fund’s Expenses. . . . . . . . . . . . . . . . . . . . . . . . 68
Trustees Approve Advisory Arrangements. . . . . . . . . . . . . .70
Glossary. . . . . . . . . . . . . . . . . . . . . . . . . . . . . . . . . . . . . . . . 72
Your Fund’s Performance at a Glance
1
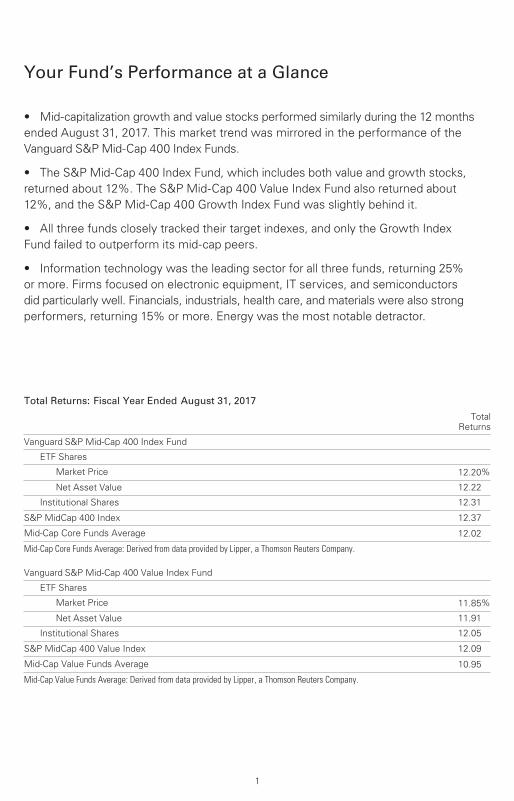
Total Returns: Fiscal Year Ended August 31, 2017
TotalReturns
Vanguard S&P Mid-Cap 400 Index Fund
ETF Shares
Market Price 12.20%
Net Asset Value 12.22
Institutional Shares 12.31
S&P MidCap 400 Index 12.37
Mid-Cap Core Funds Average 12.02
Mid-Cap Core Funds Average: Derived from data provided by Lipper, a Thomson Reuters Company.
Vanguard S&P Mid-Cap 400 Value Index Fund
ETF Shares
Market Price 11.85%
Net Asset Value 11.91
Institutional Shares 12.05
S&P MidCap 400 Value Index 12.09
Mid-Cap Value Funds Average 10.95
Mid-Cap Value Funds Average: Derived from data provided by Lipper, a Thomson Reuters Company.
• Mid-capitalization growth and value stocks performed similarly during the 12 months
ended August 31, 2017. This market trend was mirrored in the performance of the
Vanguard S&P Mid-Cap 400 Index Funds.
• The S&P Mid-Cap 400 Index Fund, which includes both value and growth stocks,
returned about 12%. The S&P Mid-Cap 400 Value Index Fund also returned about
12%, and the S&P Mid-Cap 400 Growth Index Fund was slightly behind it.
• All three funds closely tracked their target indexes, and only the Growth Index
Fund failed to outperform its mid-cap peers.
• Information technology was the leading sector for all three funds, returning 25%
or more. Firms focused on electronic equipment, IT services, and semiconductors
did particularly well. Financials, industrials, health care, and materials were also strong
performers, returning 15% or more. Energy was the most notable detractor.
2
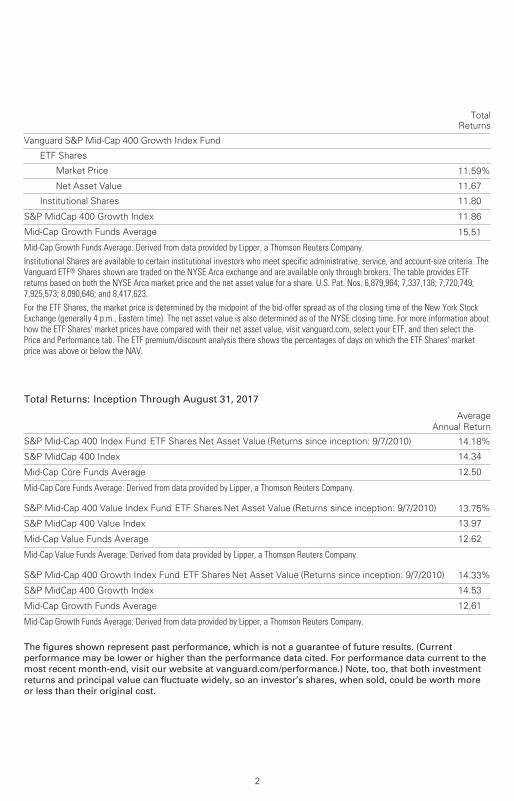
TotalReturns
Vanguard S&P Mid-Cap 400 Growth Index Fund
ETF Shares
Market Price 11.59%
Net Asset Value 11.67
Institutional Shares 11.80
S&P MidCap 400 Growth Index 11.86
Mid-Cap Growth Funds Average 15.51
Mid-Cap Growth Funds Average: Derived from data provided by Lipper, a Thomson Reuters Company. Institutional Shares are available to certain institutional investors who meet specific administrative, service, and account-size criteria. TheVanguard ETF® Shares shown are traded on the NYSE Arca exchange and are available only through brokers. The table provides ETFreturns based on both the NYSE Arca market price and the net asset value for a share. U.S. Pat. Nos. 6,879,964; 7,337,138; 7,720,749;7,925,573; 8,090,646; and 8,417,623.For the ETF Shares, the market price is determined by the midpoint of the bid-offer spread as of the closing time of the New York Stock Exchange (generally 4 p.m., Eastern time). The net asset value is also determined as of the NYSE closing time. For more information about how the ETF Shares' market prices have compared with their net asset value, visit vanguard.com, select your ETF, and then select the Price and Performance tab. The ETF premium/discount analysis there shows the percentages of days on which the ETF Shares' market price was above or below the NAV.
Total Returns: Inception Through August 31, 2017
Average
Annual Return
S&P Mid-Cap 400 Index Fund ETF Shares Net Asset Value (Returns since inception: 9/7/2010) 14.18%
S&P MidCap 400 Index 14.34
Mid-Cap Core Funds Average 12.50
Mid-Cap Core Funds Average: Derived from data provided by Lipper, a Thomson Reuters Company.
S&P Mid-Cap 400 Value Index Fund ETF Shares Net Asset Value (Returns since inception: 9/7/2010) 13.75%
S&P MidCap 400 Value Index 13.97
Mid-Cap Value Funds Average 12.62
Mid-Cap Value Funds Average: Derived from data provided by Lipper, a Thomson Reuters Company.
S&P Mid-Cap 400 Growth Index Fund ETF Shares Net Asset Value (Returns since inception: 9/7/2010) 14.33%
S&P MidCap 400 Growth Index 14.53
Mid-Cap Growth Funds Average 12.61
Mid-Cap Growth Funds Average: Derived from data provided by Lipper, a Thomson Reuters Company.
The figures shown represent past performance, which is not a guarantee of future results. (Current performance may be lower or higher than the performance data cited. For performance data current to the most recent month-end, visit our website at vanguard.com/performance.) Note, too, that both investment returns and principal value can fluctuate widely, so an investor’s shares, when sold, could be worth more or less than their original cost.
3
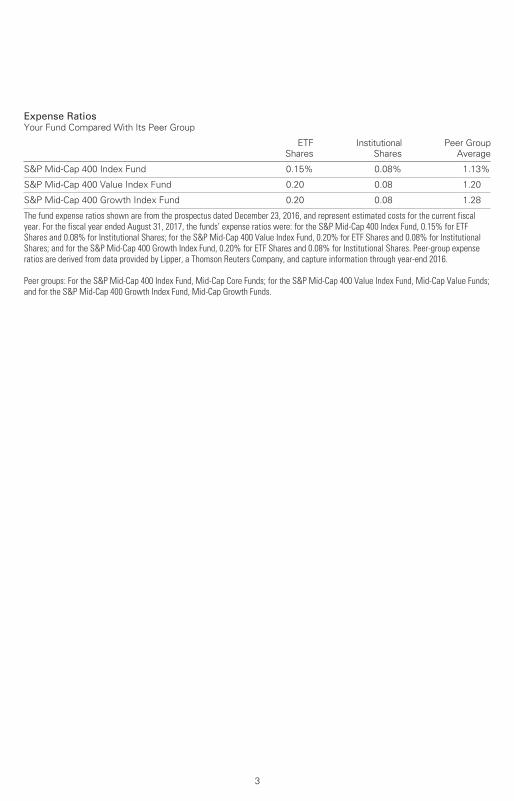
Expense RatiosYour Fund Compared With Its Peer Group
ETF
Shares
Institutional
Shares
Peer Group
Average
S&P Mid-Cap 400 Index Fund 0.15% 0.08% 1.13%
S&P Mid-Cap 400 Value Index Fund 0.20 0.08 1.20
S&P Mid-Cap 400 Growth Index Fund 0.20 0.08 1.28
The fund expense ratios shown are from the prospectus dated December 23, 2016, and represent estimated costs for the current fiscalyear. For the fiscal year ended August 31, 2017, the funds’ expense ratios were: for the S&P Mid-Cap 400 Index Fund, 0.15% for ETFShares and 0.08% for Institutional Shares; for the S&P Mid-Cap 400 Value Index Fund, 0.20% for ETF Shares and 0.08% for InstitutionalShares; and for the S&P Mid-Cap 400 Growth Index Fund, 0.20% for ETF Shares and 0.08% for Institutional Shares. Peer-group expenseratios are derived from data provided by Lipper, a Thomson Reuters Company, and capture information through year-end 2016.
Peer groups: For the S&P Mid-Cap 400 Index Fund, Mid-Cap Core Funds; for the S&P Mid-Cap 400 Value Index Fund, Mid-Cap Value Funds;and for the S&P Mid-Cap 400 Growth Index Fund, Mid-Cap Growth Funds.
Dear Shareholder,
Since mid-August we’ve been reaching
out to you about the proposals put forth
by the Vanguard funds that, if approved,
will enable us to manage the funds more
efficiently and effectively. As the November
deadline for voting approaches, I’d like to
offer some perspective on a few of the
proposals that I believe are important to
the way Vanguard operates and manages
your investments. I hope you consider this
information and promptly cast your ballot.
Your biggest advocateThe main driver for this proxy solicitation
is to ask all our fund shareholders to elect
a full slate of trustees who oversee each
U.S.-based Vanguard mutual fund. These
trustees serve an important role, making
sure your funds are managed in your
best interests. This includes monitoring
fund performance, approving advisory
agreements, and ensuring that we’re
keeping your investment costs as low
as possible. Simply put, they are your
biggest advocate.
Each trustee brings a variety of skills and
professional experiences that contribute
to the board’s strength and diversity.
Of the 12 nominees, nine currently
serve on the board, and three are new.
If elected, the new board would include
ten independent members, meaning they
have no affiliation with Vanguard or the
funds apart from any investments they
may choose to make as private individuals.
Chairman’s Perspective
Bill McNabbChairman and Chief Executive Officer
4
These are the proposed new trustees:
• Sarah Bloom Raskin is a former
member of the Federal Reserve Board
of Governors and former deputy secretary
of the U.S. Treasury Department. She is
an expert in cybersecurity—a critically
important issue at Vanguard, as we place
a premium on protecting clients’ assets
and sensitive data.
• Deanna Mulligan is chief executive
officer of The Guardian Life Insurance
Company of America. It’s rare to find
a CEO such as Deanna who leads a
company with a mutual ownership
structure similar to Vanguard’s.
• Tim Buckley is president and a director
of Vanguard and will succeed me in
January as CEO. (I’ll remain chairman for
a period to be determined by the board.)
I interviewed Tim when he applied for his
first job here in 1991 and again when he
was graduating from Harvard Business
School. I was thrilled he picked Vanguard
as a place to build his career, and I’ve
been delighted to see him take on several
leadership positions, including as head of
our Retail Investor Group, chief information
officer, and chief investment officer. I can
think of no one better prepared to
succeed me.
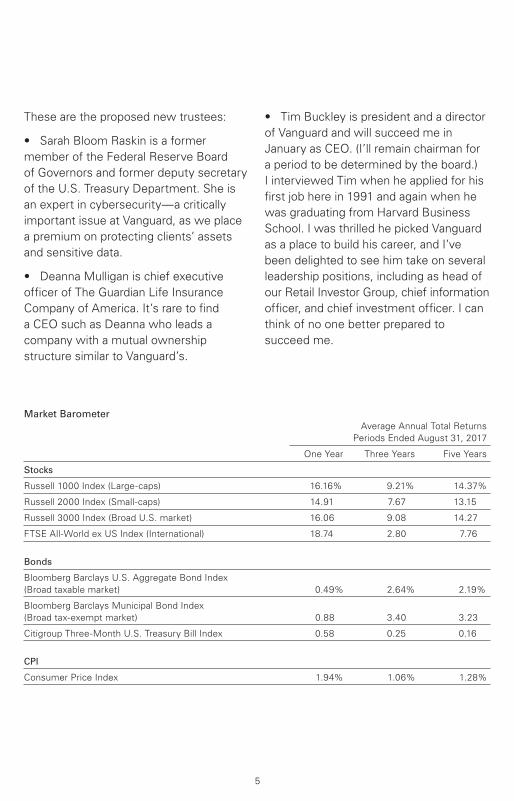
Market Barometer Average Annual Total Returns
Periods Ended August 31, 2017
One Year Three Years Five Years
Stocks
Russell 1000 Index (Large-caps) 16.16% 9.21% 14.37%
Russell 2000 Index (Small-caps) 14.91 7.67 13.15
Russell 3000 Index (Broad U.S. market) 16.06 9.08 14.27
FTSE All-World ex US Index (International) 18.74 2.80 7.76
Bonds
Bloomberg Barclays U.S. Aggregate Bond Index
(Broad taxable market) 0.49% 2.64% 2.19%
Bloomberg Barclays Municipal Bond Index
(Broad tax-exempt market) 0.88 3.40 3.23
Citigroup Three-Month U.S. Treasury Bill Index 0.58 0.25 0.16
CPI
Consumer Price Index 1.94% 1.06% 1.28%
5
Vanguard believes that diversity of
thought, background, and experience, as
well as diversity of personal characteristics,
meaningfully contributes to the board’s
ability to effectively serve shareholders.
If Sarah and Deanna are elected, women
will account for 40% of the board’s
independent trustees.
I should note that even as Vanguard is
nominating three new board members,
we’re saying goodbye to trustee Rajiv
Gupta. Rajiv was a legendary CEO of
Rohm and Haas Co., and Vanguard
and our clients have benefited greatly
from his expertise. I wish him a happy
retirement.
Summarizing the proposalsAmong the trustees’ leading responsibilities
is overseeing the funds’ internal and
external investment advisory agreements.
The trustees, in consultation with our
Global Investment Committee and our
Portfolio Review Department, choose the
investment advisors that manage client
assets. Over decades, we have built a
strong track record of picking advisors
whose portfolio management strategies
have served clients well.
Two proposals in the proxy focus on this
oversight responsibility. Shareholders of
48 Vanguard funds have already voted to
allow the board to make external advisor
changes without obtaining prior shareholder
approval. The new proposals would extend
that policy across our entire U.S.-based
fund lineup and expand it to include
internal advisory agreements with
Vanguard subsidiaries. Eliminating the
need for shareholder approval removes
a step that is costly and time-consuming
if done frequently or on an individual fund
basis. Although there are no current plans
to employ the policy on any Vanguard-
managed funds, standardizing it enables
the trustees to retain an advisory firm
to diversify a fund’s management team
or ensure management continuity should
a contingency arise.
I also encourage shareholders of several
specific Vanguard index funds to read the
proxy proposals that affect those funds.
One proposal would change the investment
objective of Vanguard REIT Index Fund
and Vanguard Variable Insurance Fund
REIT Index Portfolio to include real estate-
related securities, aligning the funds with
updated industry-sector classification
methodology. Another proposal seeks
to change the diversification status of
the REIT Index Fund to enable it to better
track its benchmark. Finally, we seek your
approval of the Funds’ Service Agreement
for Vanguard Institutional Index Fund and
Vanguard Institutional Total Stock Market
Index Fund. If approved, this arrangement
would then be standardized across
Vanguard’s entire publicly available U.S.
mutual fund lineup. It should also reduce
costs and minimum initial investment
requirements in select share classes.
6

At the ballot boxWe hope you’ll make it a priority to
cast your ballot. We want to avoid
the added time and cost of soliciting
sufficient votes should we not obtain
a quorum by the shareholder meeting
on November 15, when voting concludes.
Ultimately, we believe the proposals I’ve
discussed are in your best interest as
Vanguard fund shareholders, and the
trustees recommend that you vote in
favor of them. For more information,
visit vanguard.com and enter the
search term “proxy.”
As always, thank you for investing
with Vanguard.
Sincerely,
F. William McNabb III
Chairman and Chief Executive Officer
September 14, 2017
7
S&P Mid-Cap 400 Index Fund
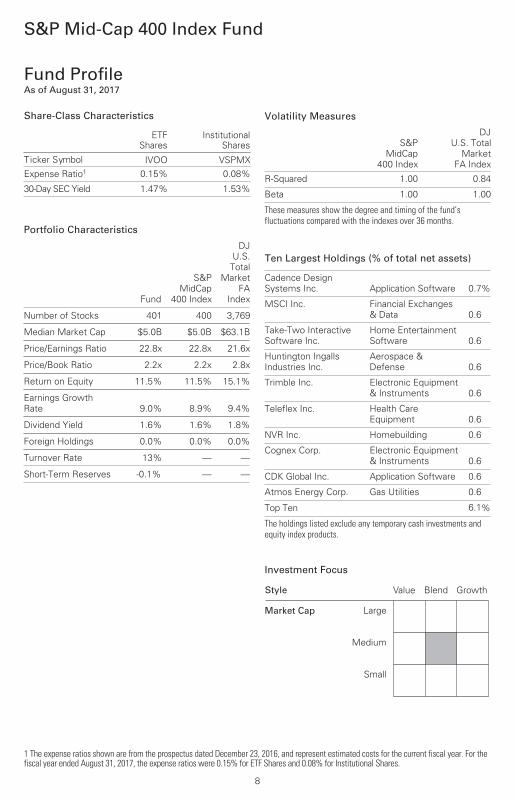
Fund ProfileAs of August 31, 2017
1 The expense ratios shown are from the prospectus dated December 23, 2016, and represent estimated costs for the current fiscal year. For the fiscal year ended August 31, 2017, the expense ratios were 0.15% for ETF Shares and 0.08% for Institutional Shares.
8
Volatility Measures
S&P
MidCap
400 Index
DJ
U.S. Total
Market
FA Index
R-Squared 1.00 0.84
Beta 1.00 1.00
These measures show the degree and timing of the fund’s fluctuations compared with the indexes over 36 months.
Portfolio Characteristics
Fund
S&P
MidCap
400 Index
DJ
U.S.
Total
Market
FA
Index
Number of Stocks 401 400 3,769
Median Market Cap $5.0B $5.0B $63.1B
Price/Earnings Ratio 22.8x 22.8x 21.6x
Price/Book Ratio 2.2x 2.2x 2.8x
Return on Equity 11.5% 11.5% 15.1%
Earnings Growth
Rate 9.0% 8.9% 9.4%
Dividend Yield 1.6% 1.6% 1.8%
Foreign Holdings 0.0% 0.0% 0.0%
Turnover Rate 13% — —
Short-Term Reserves -0.1% — —
Share-Class Characteristics
ETFShares
InstitutionalShares
Ticker Symbol IVOO VSPMXExpense Ratio1 0.15% 0.08%
30-Day SEC Yield 1.47% 1.53%
Ten Largest Holdings (% of total net assets)
Cadence Design
Systems Inc. Application Software 0.7%
MSCI Inc. Financial Exchanges
& Data 0.6
Take-Two Interactive
Software Inc.
Home Entertainment
Software 0.6
Huntington Ingalls
Industries Inc.
Aerospace &
Defense 0.6
Trimble Inc. Electronic Equipment
& Instruments 0.6
Teleflex Inc. Health Care
Equipment 0.6
NVR Inc. Homebuilding 0.6
Cognex Corp. Electronic Equipment
& Instruments 0.6
CDK Global Inc. Application Software 0.6
Atmos Energy Corp. Gas Utilities 0.6
Top Ten 6.1%
The holdings listed exclude any temporary cash investments andequity index products.
Investment Focus
Market Cap
Value
Large
Medium
Small
Blend Growth Style
S&P Mid-Cap 400 Index Fund
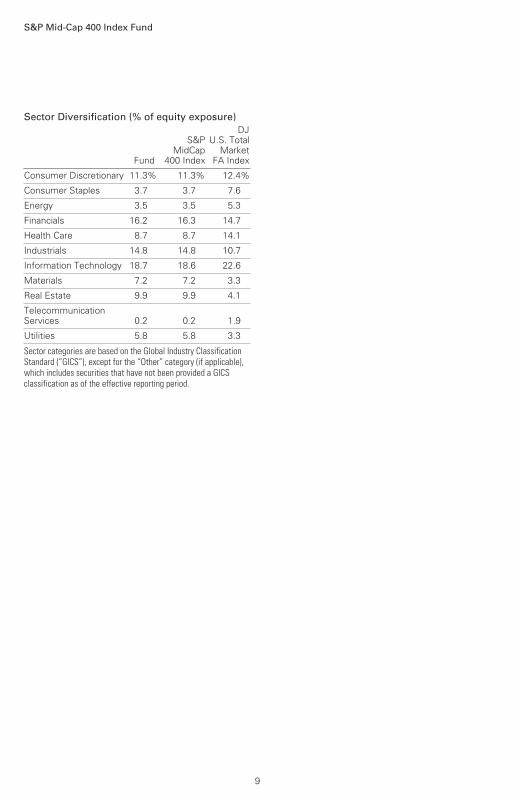
Sector Diversification (% of equity exposure)
Fund
S&PMidCap
400 Index
DJU.S. Total
MarketFA Index
Consumer Discretionary 11.3% 11.3% 12.4%
Consumer Staples 3.7 3.7 7.6
Energy 3.5 3.5 5.3
Financials 16.2 16.3 14.7
Health Care 8.7 8.7 14.1
Industrials 14.8 14.8 10.7
Information Technology 18.7 18.6 22.6
Materials 7.2 7.2 3.3
Real Estate 9.9 9.9 4.1
TelecommunicationServices 0.2 0.2 1.9
Utilities 5.8 5.8 3.3
Sector categories are based on the Global Industry ClassificationStandard (“GICS”), except for the “Other” category (if applicable),which includes securities that have not been provided a GICSclassification as of the effective reporting period.
9

All of the returns in this report represent past performance, which is not a guarantee of future results that may be achieved by the fund. (Current performance may be lower or higher thanthe performance data cited. For performance data current to the most recent month-end, visitour website at vanguard.com/performance.) Note, too, that both investment returns and principal value can fluctuate widely, so an investor’s shares, when sold, could be worth more or less than their original cost. The returns shown do not reflect taxes that a shareholder would pay
on fund distributions or on the sale of fund shares.
Performance Summary
S&P Mid-Cap 400 Index Fund
See Financial Highlights for dividend and capital gains information.
10
Cumulative Performance: September 7, 2010, Through August 31, 2017Initial Investment of $10,000
2017201620152014201320122011
$30,000
7,000
25,238
Average Annual Total Returns
Periods Ended August 31, 2017
OneYear
FiveYears
SinceInception
(9/7/2010)
Final Valueof a $10,000Investment
S&P Mid-Cap 400 Index Fund*ETFShares Net Asset Value 12.22% 13.84% 14.18% $25,238
S&P Mid-Cap 400 Index Fund*ETFShares Market Price 12.20 13.84 14.18 25,236
• • • • • • • • S&P MidCap 400 Index 12.37 13.99 14.34 25,477
– – – – Mid-Cap Core Funds Average 12.02 12.27 12.50 22,759________ Dow Jones U.S. Total Stock Market
Float Adjusted Index 16.05 14.19 14.71 26,064
Mid-Cap Core Funds Average: Derived from data provided by Lipper, a Thomson Reuters Company."Since Inception" performance is calculated from the ETF Shares’ inception date for both the fund and its comparative standards.
OneYear
FiveYears
SinceInception
(3/28/2011)
Final Valueof a $5,000,000
Investment
S&P Mid-Cap 400 Index Fund InstitutionalShares 12.31% 13.93% 11.11% $9,842,820
S&P MidCap 400 Index 12.37 13.99 11.18 9,881,858
Dow Jones U.S. Total Stock Market FloatAdjusted Index 16.05 14.19 12.40 10,597,716
"Since Inception" performance is calculated from the Institutional Shares’ inception date for both the fund and its comparative standards. Institutional Shares were first issued on December 15, 2010, and the sole shareholder redeemed shortly thereafter. Institutional Shares were next issued on March 28, 2011. The total returns shown are based on the period beginning March 28, 2011.

S&P Mid-Cap 400 Index Fund
11
Cumulative Returns of ETF Shares: September 7, 2010, Through August 31, 2017
OneYear
FiveYears
SinceInception
(9/7/2010)
S&P Mid-Cap 400 Index Fund ETF Shares MarketPrice 12.20% 91.19% 152.36%
S&P Mid-Cap 400 Index Fund ETF Shares Net AssetValue 12.22 91.23 152.38
S&P MidCap 400 Index 12.37 92.46 154.77
"Since Inception" performance is calculated from the ETF Shares’ inception date for both the fund and its comparative standards.
Fiscal-Year Total Returns (%): September 7, 2010, Through August 31, 2017
17.21 17.41
2011
12.60 12.75
2012
23.57 23.71
2013
23.06 23.25
2014
–0.120.01
2015
12.19 12.33
2016
12.22 12.37
2017
S&P Mid-Cap 400 Index Fund ETF Shares Net Asset Value
S&P MidCap 400 Index
Average Annual Total Returns: Periods Ended June 30, 2017This table presents returns through the latest calendar quarter—rather than through the end of the fiscal period.Securities and Exchange Commission rules require that we provide this information.
InceptionDate
OneYear
FiveYears
SinceInception
ETF Shares 9/7/2010
Market Price 18.34% 14.76% 14.67%
Net Asset Value 18.40 14.77 14.67
Institutional Shares 3/28/20111 18.48 14.85 11.55
1 Institutional Shares were first issued on December 15, 2010, and the sole shareholder redeemed shortly thereafter. Institutional Shareswere next issued on March 28, 2011. The total returns shown are based on the period beginning March 28, 2011.

Market
Value•
Shares ($000)
Market
Value•
Shares ($000)
Common Stocks (99.5%)1
Consumer Discretionary (11.2%) * NVR Inc. 3,950 10,747
Domino’s Pizza Inc. 54,494 9,932
Service Corp. International 213,007 7,528
Toll Brothers Inc. 167,930 6,543^ Polaris Industries Inc. 66,483 6,198* Live Nation Entertainment
Inc. 151,574 6,057
Gentex Corp. 326,003 5,956
Thor Industries Inc. 54,304 5,900
Dunkin’ Brands Group Inc. 104,583 5,392
Brunswick Corp. 101,348 5,319
Carter’s Inc. 54,909 4,761
Pool Corp. 46,924 4,678
Bed Bath & Beyond Inc. 164,710 4,544^ Williams-Sonoma Inc. 90,441 4,160
Cracker Barrel Old
Country Store Inc. 27,236 4,049
Cable One Inc. 5,328 4,043* Skechers U.S.A. Inc.
Class A 151,809 4,012
Cinemark Holdings Inc. 120,220 4,002
Dana Inc. 163,756 3,942* AMC Networks Inc.
Class A 59,129 3,594
Texas Roadhouse Inc.
Class A 73,108 3,469*,^ AutoNation Inc. 74,602 3,385
Tupperware Brands Corp. 57,457 3,325* Tempur Sealy
International Inc. 53,112 3,288
Wendy’s Co. 216,866 3,236
Aaron’s Inc. 71,231 3,153* Cabela’s Inc. 58,542 3,144
Jack in the Box Inc. 33,321 3,119
Graham Holdings Co.
Class B 5,269 3,094
TEGNA Inc. 243,204 3,069
CalAtlantic Group Inc. 87,192 3,030* Sally Beauty Holdings Inc. 155,659 2,894
Churchill Downs Inc. 14,691 2,871* Helen of Troy Ltd. 30,643 2,767
John Wiley & Sons Inc.
Class A 50,722 2,736* Michaels Cos. Inc. 119,794 2,689
Dick’s Sporting Goods
Inc. 99,405 2,620
New York Times Co.
Class A 138,352 2,580* Murphy USA Inc. 39,151 2,524
Office Depot Inc. 585,075 2,510
Big Lots Inc. 50,722 2,414* Sotheby’s 51,895 2,329* Deckers Outdoor Corp. 36,226 2,315* TRI Pointe Group Inc. 180,126 2,295
Meredith Corp. 41,535 2,257
American Eagle Outfitters
Inc. 188,390 2,251
Papa John’s International
Inc. 29,979 2,242* Adtalem Global Education
Inc. 64,536 2,207
GameStop Corp. Class A 114,683 2,122^ Cheesecake Factory Inc. 50,511 2,093* Urban Outfitters Inc. 100,072 2,045
Cooper Tire & Rubber Co. 59,937 2,014^ KB Home 94,094 2,014* Buffalo Wild Wings Inc. 18,274 1,878
Brinker International Inc. 55,736 1,740^ Dillard’s Inc. Class A 24,678 1,500
HSN Inc. 36,442 1,337
International Speedway
Corp. Class A 28,560 1,018
Chico’s FAS Inc. 232 2
206,933
Financial Statements
Statement of Net AssetsAs of August 31, 2017
The fund reports a complete list of its holdings in regulatory filings four times in each fiscal year, at
the quarter-ends. For the second and fourth fiscal quarters, the lists appear in the fund’s semiannual
and annual reports to shareholders. For the first and third fiscal quarters, the fund files the lists with
the Securities and Exchange Commission on Form N-Q. Shareholders can look up the fund’s Forms
N-Q on the SEC’s website at sec.gov. Forms N-Q may also be reviewed and copied at the SEC’s
Public Reference Room (see the back cover of this report for further information).
S&P Mid-Cap 400 Index Fund
12
S&P Mid-Cap 400 Index Fund
Market
Value•
Shares ($000)
Market
Value•
Shares ($000)
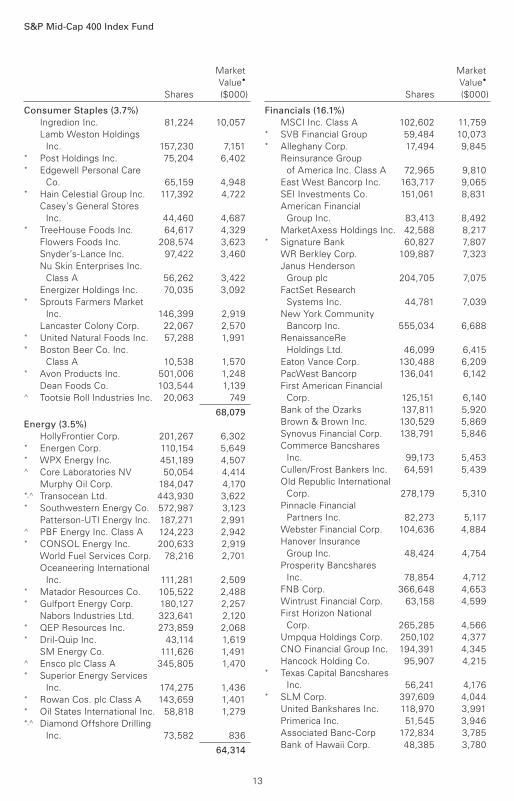
Consumer Staples (3.7%) Ingredion Inc. 81,224 10,057
Lamb Weston Holdings
Inc. 157,230 7,151* Post Holdings Inc. 75,204 6,402* Edgewell Personal Care
Co. 65,159 4,948* Hain Celestial Group Inc. 117,392 4,722
Casey’s General Stores
Inc. 44,460 4,687* TreeHouse Foods Inc. 64,617 4,329
Flowers Foods Inc. 208,574 3,623
Snyder’s-Lance Inc. 97,422 3,460
Nu Skin Enterprises Inc.
Class A 56,262 3,422
Energizer Holdings Inc. 70,035 3,092* Sprouts Farmers Market
Inc. 146,399 2,919
Lancaster Colony Corp. 22,067 2,570* United Natural Foods Inc. 57,288 1,991* Boston Beer Co. Inc.
Class A 10,538 1,570* Avon Products Inc. 501,006 1,248
Dean Foods Co. 103,544 1,139^ Tootsie Roll Industries Inc. 20,063 749
68,079Energy (3.5%) HollyFrontier Corp. 201,267 6,302* Energen Corp. 110,154 5,649* WPX Energy Inc. 451,189 4,507^ Core Laboratories NV 50,054 4,414
Murphy Oil Corp. 184,047 4,170*,^ Transocean Ltd. 443,930 3,622* Southwestern Energy Co. 572,987 3,123
Patterson-UTI Energy Inc. 187,271 2,991^ PBF Energy Inc. Class A 124,223 2,942* CONSOL Energy Inc. 200,633 2,919
World Fuel Services Corp. 78,216 2,701
Oceaneering International
Inc. 111,281 2,509* Matador Resources Co. 105,522 2,488* Gulfport Energy Corp. 180,127 2,257
Nabors Industries Ltd. 323,641 2,120* QEP Resources Inc. 273,859 2,068* Dril-Quip Inc. 43,114 1,619
SM Energy Co. 111,626 1,491^ Ensco plc Class A 345,805 1,470* Superior Energy Services
Inc. 174,275 1,436* Rowan Cos. plc Class A 143,659 1,401* Oil States International Inc. 58,818 1,279*,^ Diamond Offshore Drilling
Inc. 73,582 836
64,314
Financials (16.1%) MSCI Inc. Class A 102,602 11,759* SVB Financial Group 59,484 10,073* Alleghany Corp. 17,494 9,845
Reinsurance Group
of America Inc. Class A 72,965 9,810
East West Bancorp Inc. 163,717 9,065
SEI Investments Co. 151,061 8,831
American Financial
Group Inc. 83,413 8,492
MarketAxess Holdings Inc. 42,588 8,217* Signature Bank 60,827 7,807
WR Berkley Corp. 109,887 7,323
Janus Henderson
Group plc 204,705 7,075
FactSet Research
Systems Inc. 44,781 7,039
New York Community
Bancorp Inc. 555,034 6,688
RenaissanceRe
Holdings Ltd. 46,099 6,415
Eaton Vance Corp. 130,488 6,209
PacWest Bancorp 136,041 6,142
First American Financial
Corp. 125,151 6,140
Bank of the Ozarks 137,811 5,920
Brown & Brown Inc. 130,529 5,869
Synovus Financial Corp. 138,791 5,846
Commerce Bancshares
Inc. 99,173 5,453
Cullen/Frost Bankers Inc. 64,591 5,439
Old Republic International
Corp. 278,179 5,310
Pinnacle Financial
Partners Inc. 82,273 5,117
Webster Financial Corp. 104,636 4,884
Hanover Insurance
Group Inc. 48,424 4,754
Prosperity Bancshares
Inc. 78,854 4,712
FNB Corp. 366,648 4,653
Wintrust Financial Corp. 63,158 4,599
First Horizon National
Corp. 265,285 4,566
Umpqua Holdings Corp. 250,102 4,377
CNO Financial Group Inc. 194,391 4,345
Hancock Holding Co. 95,907 4,215* Texas Capital Bancshares
Inc. 56,241 4,176* SLM Corp. 397,609 4,044
United Bankshares Inc. 118,970 3,991
Primerica Inc. 51,545 3,946
Associated Banc-Corp 172,834 3,785
Bank of Hawaii Corp. 48,385 3,780
13
S&P Mid-Cap 400 Index Fund
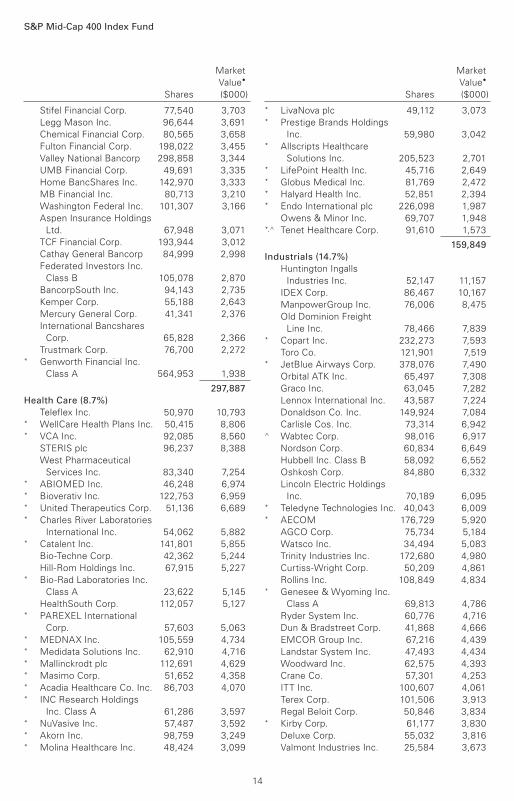
Stifel Financial Corp. 77,540 3,703
Legg Mason Inc. 96,644 3,691
Chemical Financial Corp. 80,565 3,658
Fulton Financial Corp. 198,022 3,455
Valley National Bancorp 298,858 3,344
UMB Financial Corp. 49,691 3,335
Home BancShares Inc. 142,970 3,333
MB Financial Inc. 80,713 3,210
Washington Federal Inc. 101,307 3,166
Aspen Insurance Holdings
Ltd. 67,948 3,071
TCF Financial Corp. 193,944 3,012
Cathay General Bancorp 84,999 2,998
Federated Investors Inc.
Class B 105,078 2,870
BancorpSouth Inc. 94,143 2,735
Kemper Corp. 55,188 2,643
Mercury General Corp. 41,341 2,376
International Bancshares
Corp. 65,828 2,366
Trustmark Corp. 76,700 2,272* Genworth Financial Inc.
Class A 564,953 1,938
297,887Health Care (8.7%) Teleflex Inc. 50,970 10,793* WellCare Health Plans Inc. 50,415 8,806* VCA Inc. 92,085 8,560
STERIS plc 96,237 8,388
West Pharmaceutical
Services Inc. 83,340 7,254* ABIOMED Inc. 46,248 6,974* Bioverativ Inc. 122,753 6,959* United Therapeutics Corp. 51,136 6,689* Charles River Laboratories
International Inc. 54,062 5,882* Catalent Inc. 141,801 5,855
Bio-Techne Corp. 42,362 5,244
Hill-Rom Holdings Inc. 67,915 5,227* Bio-Rad Laboratories Inc.
Class A 23,622 5,145
HealthSouth Corp. 112,057 5,127* PAREXEL International
Corp. 57,603 5,063* MEDNAX Inc. 105,559 4,734* Medidata Solutions Inc. 62,910 4,716* Mallinckrodt plc 112,691 4,629* Masimo Corp. 51,652 4,358* Acadia Healthcare Co. Inc. 86,703 4,070* INC Research Holdings
Inc. Class A 61,286 3,597* NuVasive Inc. 57,487 3,592* Akorn Inc. 98,759 3,249* Molina Healthcare Inc. 48,424 3,099
* LivaNova plc 49,112 3,073* Prestige Brands Holdings
Inc. 59,980 3,042* Allscripts Healthcare
Solutions Inc. 205,523 2,701* LifePoint Health Inc. 45,716 2,649* Globus Medical Inc. 81,769 2,472* Halyard Health Inc. 52,851 2,394* Endo International plc 226,098 1,987
Owens & Minor Inc. 69,707 1,948*,^ Tenet Healthcare Corp. 91,610 1,573
159,849Industrials (14.7%) Huntington Ingalls
Industries Inc. 52,147 11,157
IDEX Corp. 86,467 10,167
ManpowerGroup Inc. 76,006 8,475
Old Dominion Freight
Line Inc. 78,466 7,839* Copart Inc. 232,273 7,593
Toro Co. 121,901 7,519* JetBlue Airways Corp. 378,076 7,490
Orbital ATK Inc. 65,497 7,308
Graco Inc. 63,045 7,282
Lennox International Inc. 43,587 7,224
Donaldson Co. Inc. 149,924 7,084
Carlisle Cos. Inc. 73,314 6,942^ Wabtec Corp. 98,016 6,917
Nordson Corp. 60,834 6,649
Hubbell Inc. Class B 58,092 6,552
Oshkosh Corp. 84,880 6,332
Lincoln Electric Holdings
Inc. 70,189 6,095* Teledyne Technologies Inc. 40,043 6,009* AECOM 176,729 5,920
AGCO Corp. 75,734 5,184
Watsco Inc. 34,494 5,083
Trinity Industries Inc. 172,680 4,980
Curtiss-Wright Corp. 50,209 4,861
Rollins Inc. 108,849 4,834* Genesee & Wyoming Inc.
Class A 69,813 4,786
Ryder System Inc. 60,776 4,716
Dun & Bradstreet Corp. 41,868 4,666
EMCOR Group Inc. 67,216 4,439
Landstar System Inc. 47,493 4,434
Woodward Inc. 62,575 4,393
Crane Co. 57,301 4,253
ITT Inc. 100,607 4,061
Terex Corp. 101,506 3,913
Regal Beloit Corp. 50,846 3,834* Kirby Corp. 61,177 3,830
Deluxe Corp. 55,032 3,816
Valmont Industries Inc. 25,584 3,673
Market
Value•
Shares ($000)
Market
Value•
Shares ($000)
14
S&P Mid-Cap 400 Index Fund
Market
Value•
Shares ($000)
Market
Value•
Shares ($000)
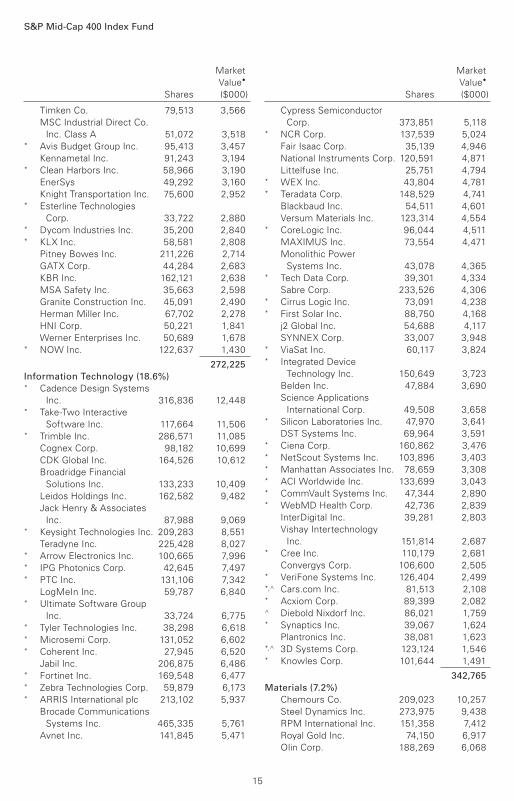
Timken Co. 79,513 3,566
MSC Industrial Direct Co.
Inc. Class A 51,072 3,518* Avis Budget Group Inc. 95,413 3,457
Kennametal Inc. 91,243 3,194* Clean Harbors Inc. 58,966 3,190
EnerSys 49,292 3,160
Knight Transportation Inc. 75,600 2,952* Esterline Technologies
Corp. 33,722 2,880* Dycom Industries Inc. 35,200 2,840* KLX Inc. 58,581 2,808
Pitney Bowes Inc. 211,226 2,714
GATX Corp. 44,284 2,683
KBR Inc. 162,121 2,638
MSA Safety Inc. 35,663 2,598
Granite Construction Inc. 45,091 2,490
Herman Miller Inc. 67,702 2,278
HNI Corp. 50,221 1,841
Werner Enterprises Inc. 50,689 1,678* NOW Inc. 122,637 1,430
272,225Information Technology (18.6%) * Cadence Design Systems
Inc. 316,836 12,448* Take-Two Interactive
Software Inc. 117,664 11,506* Trimble Inc. 286,571 11,085
Cognex Corp. 98,182 10,699
CDK Global Inc. 164,526 10,612
Broadridge Financial
Solutions Inc. 133,233 10,409
Leidos Holdings Inc. 162,582 9,482
Jack Henry & Associates
Inc. 87,988 9,069* Keysight Technologies Inc. 209,283 8,551
Teradyne Inc. 225,428 8,027* Arrow Electronics Inc. 100,665 7,996* IPG Photonics Corp. 42,645 7,497* PTC Inc. 131,106 7,342
LogMeIn Inc. 59,787 6,840* Ultimate Software Group
Inc. 33,724 6,775* Tyler Technologies Inc. 38,298 6,618* Microsemi Corp. 131,052 6,602* Coherent Inc. 27,945 6,520
Jabil Inc. 206,875 6,486* Fortinet Inc. 169,548 6,477* Zebra Technologies Corp. 59,879 6,173* ARRIS International plc 213,102 5,937
Brocade Communications
Systems Inc. 465,335 5,761
Avnet Inc. 141,845 5,471
Cypress Semiconductor
Corp. 373,851 5,118* NCR Corp. 137,539 5,024
Fair Isaac Corp. 35,139 4,946
National Instruments Corp. 120,591 4,871
Littelfuse Inc. 25,751 4,794* WEX Inc. 43,804 4,781* Teradata Corp. 148,529 4,741
Blackbaud Inc. 54,511 4,601
Versum Materials Inc. 123,314 4,554* CoreLogic Inc. 96,044 4,511
MAXIMUS Inc. 73,554 4,471
Monolithic Power
Systems Inc. 43,078 4,365* Tech Data Corp. 39,301 4,334
Sabre Corp. 233,526 4,306* Cirrus Logic Inc. 73,091 4,238* First Solar Inc. 88,750 4,168
j2 Global Inc. 54,688 4,117
SYNNEX Corp. 33,007 3,948* ViaSat Inc. 60,117 3,824* Integrated Device
Technology Inc. 150,649 3,723
Belden Inc. 47,884 3,690
Science Applications
International Corp. 49,508 3,658* Silicon Laboratories Inc. 47,970 3,641
DST Systems Inc. 69,964 3,591* Ciena Corp. 160,862 3,476* NetScout Systems Inc. 103,896 3,403* Manhattan Associates Inc. 78,659 3,308* ACI Worldwide Inc. 133,699 3,043* CommVault Systems Inc. 47,344 2,890* WebMD Health Corp. 42,736 2,839
InterDigital Inc. 39,281 2,803
Vishay Intertechnology
Inc. 151,814 2,687* Cree Inc. 110,179 2,681
Convergys Corp. 106,600 2,505* VeriFone Systems Inc. 126,404 2,499*,^ Cars.com Inc. 81,513 2,108* Acxiom Corp. 89,399 2,082^ Diebold Nixdorf Inc. 86,021 1,759* Synaptics Inc. 39,067 1,624
Plantronics Inc. 38,081 1,623*,^ 3D Systems Corp. 123,124 1,546* Knowles Corp. 101,644 1,491
342,765Materials (7.2%) Chemours Co. 209,023 10,257
Steel Dynamics Inc. 273,975 9,438
RPM International Inc. 151,358 7,412
Royal Gold Inc. 74,150 6,917
Olin Corp. 188,269 6,068
15

S&P Mid-Cap 400 Index Fund
Market
Value•
Shares ($000)
Market
Value•
Shares ($000)
Reliance Steel &
Aluminum Co. 82,711 5,990
AptarGroup Inc. 70,849 5,924
Sonoco Products Co. 112,783 5,443
Eagle Materials Inc. 55,080 5,356
United States Steel Corp. 198,199 5,274
Valvoline Inc. 232,067 4,941
Scotts Miracle-Gro Co. 50,022 4,781* Owens-Illinois Inc. 184,619 4,549
Bemis Co. Inc. 104,340 4,446
NewMarket Corp. 10,489 4,390
Ashland Global Holdings
Inc. 70,614 4,381* Louisiana-Pacific Corp. 163,971 4,178
Cabot Corp. 70,771 3,728
Sensient Technologies
Corp. 50,135 3,617
PolyOne Corp. 92,608 3,347
Domtar Corp. 70,888 2,867* Allegheny Technologies
Inc. 123,244 2,567
Compass Minerals
International Inc. 38,305 2,559
Silgan Holdings Inc. 84,932 2,556
Minerals Technologies Inc. 39,736 2,543
Worthington Industries
Inc. 49,762 2,486
Commercial Metals Co. 131,115 2,477
Carpenter Technology
Corp. 52,928 2,145
Greif Inc. Class A 29,226 1,767
132,404Real Estate (9.8%) Camden Property Trust 99,308 8,886
Kilroy Realty Corp. 111,362 7,710
American Campus
Communities Inc. 151,914 7,230^ Omega Healthcare
Investors Inc. 223,360 7,119
Liberty Property Trust 167,072 7,117
National Retail Properties
Inc. 169,256 7,080
Douglas Emmett Inc. 175,346 6,831
Lamar Advertising Co.
Class A 94,756 6,307
Jones Lang LaSalle Inc. 51,395 6,266
DCT Industrial Trust Inc. 104,319 6,087
Highwoods Properties Inc. 115,776 6,047
CyrusOne Inc. 88,600 5,584
Medical Properties Trust
Inc. 413,065 5,436
Senior Housing Properties
Trust 269,563 5,316
Hospitality Properties
Trust 186,412 5,100
EPR Properties 72,702 5,064
Healthcare Realty Trust
Inc. 140,393 4,672
CoreSite Realty Corp. 38,728 4,599
Cousins Properties Inc. 475,322 4,444
Weingarten Realty
Investors 134,030 4,294
Rayonier Inc. 146,181 4,241
First Industrial Realty
Trust Inc. 132,851 4,116
Sabra Health Care
REIT Inc. 181,109 3,957
GEO Group Inc. 141,192 3,903
Life Storage Inc. 52,671 3,876
Corporate Office
Properties Trust 112,637 3,758
LaSalle Hotel Properties 128,250 3,640
Taubman Centers Inc. 68,868 3,598
CoreCivic Inc. 133,832 3,587
Uniti Group Inc. 179,184 3,451* JBG SMITH Properties 97,899 3,204
Education Realty Trust
Inc. 82,893 3,203
Urban Edge Properties 118,857 2,989
Tanger Factory Outlet
Centers Inc. 109,243 2,556
Mack-Cali Realty Corp. 101,748 2,329
Alexander & Baldwin Inc. 52,317 2,271
Potlatch Corp. 45,983 2,198
Washington Prime Group
Inc. 209,840 1,752* Quality Care Properties
Inc. 106,726 1,464
181,282Telecommunication Services (0.2%) Telephone & Data
Systems Inc. 106,245 3,114*,^ Frontier Communications
Corp. 88,658 1,194
4,308Utilities (5.8%) Atmos Energy Corp. 119,307 10,504
UGI Corp. 196,171 9,693
Westar Energy Inc.
Class A 160,951 8,258
OGE Energy Corp. 226,283 8,083
Great Plains Energy Inc. 244,297 7,498
Aqua America Inc. 201,560 6,732
Vectren Corp. 94,142 6,177
MDU Resources
Group Inc. 221,641 5,993
National Fuel Gas Co. 95,759 5,552
16
S&P Mid-Cap 400 Index Fund
Market
Value•
Shares ($000)
Amount
($000)
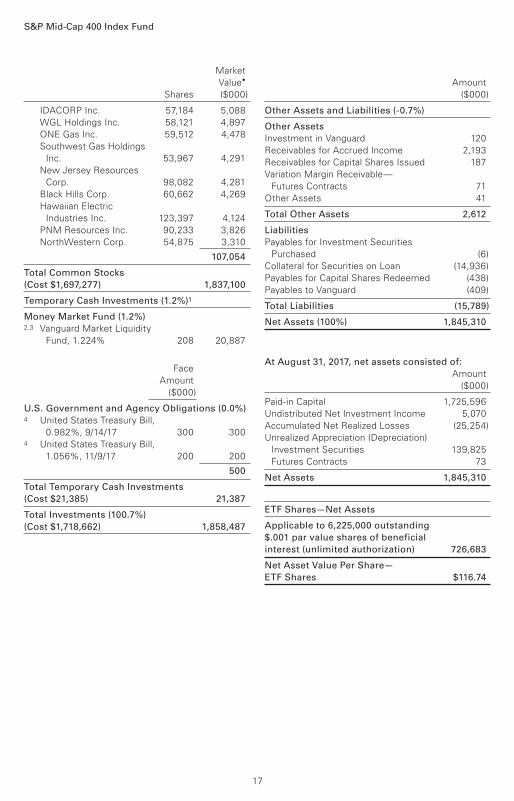
IDACORP Inc. 57,184 5,088
WGL Holdings Inc. 58,121 4,897
ONE Gas Inc. 59,512 4,478
Southwest Gas Holdings
Inc. 53,967 4,291
New Jersey Resources
Corp. 98,082 4,281
Black Hills Corp. 60,662 4,269
Hawaiian Electric
Industries Inc. 123,397 4,124
PNM Resources Inc. 90,233 3,826
NorthWestern Corp. 54,875 3,310
107,054
Total Common Stocks (Cost $1,697,277) 1,837,100
Temporary Cash Investments (1.2%)1
Money Market Fund (1.2%)2,3 Vanguard Market Liquidity
Fund, 1.224% 208 20,887
Face
Amount
($000)
U.S. Government and Agency Obligations (0.0%) 4 United States Treasury Bill,
0.982%, 9/14/17 300 3004 United States Treasury Bill,
1.056%, 11/9/17 200 200
500
Total Temporary Cash Investments (Cost $21,385) 21,387
Total Investments (100.7%) (Cost $1,718,662) 1,858,487
Other Assets and Liabilities (-0.7%)
Other Assets Investment in Vanguard 120
Receivables for Accrued Income 2,193
Receivables for Capital Shares Issued 187
Variation Margin Receivable—
Futures Contracts 71
Other Assets 41
Total Other Assets 2,612
Liabilities Payables for Investment Securities
Purchased (6)
Collateral for Securities on Loan (14,936)
Payables for Capital Shares Redeemed (438)
Payables to Vanguard (409)
Total Liabilities (15,789)
Net Assets (100%) 1,845,310
At August 31, 2017, net assets consisted of: Amount
($000)
Paid-in Capital 1,725,596
Undistributed Net Investment Income 5,070
Accumulated Net Realized Losses (25,254)
Unrealized Appreciation (Depreciation)
Investment Securities 139,825
Futures Contracts 73
Net Assets 1,845,310
ETF Shares—Net Assets
Applicable to 6,225,000 outstanding $.001 par value shares of beneficial interest (unlimited authorization) 726,683
Net Asset Value Per Share— ETF Shares $116.74
17

S&P Mid-Cap 400 Index Fund
Amount
($000)
Institutional Shares—Net Assets
Applicable to 4,804,695 outstanding $.001 par value shares of beneficial interest (unlimited authorization) 1,118,627
Net Asset Value Per Share— Institutional Shares $232.82
• See Note A in Notes to Financial Statements.
* Non-income-producing security.
^ Includes partial security positions on loan to broker-dealers. The total value of securities on loan is $14,466,000.
1 The fund invests a portion of its cash reserves in equity markets through the use of index futures contracts. After giving effect to futures investments, the fund’s effective common stock and temporary cash investment positions represent 100.0% and 0.7%, respectively, of net assets.
2 Affiliated money market fund available only to Vanguard funds and certain trusts and accounts managed by Vanguard. Rate shown is the 7-day yield.
3 Includes $14,936,000 of collateral received for securities on loan.
4 Securities with a value of $500,000 have been segregated as initial margin for open futures contracts.
See accompanying Notes, which are an integral part of the Financial Statements.
Derivative Financial Instruments Outstanding as of Period End
Futures Contracts
($000)
Value and
Number of Unrealized
Long (Short) Notional Appreciation
Expiration Contracts Amount (Depreciation)
Long Futures Contracts
E-mini S&P Mid-Cap 400 Index September 2017 48 8,306 73
Unrealized appreciation (depreciation) on open futures contracts is required to be treated as realized
gain (loss) for tax purposes.
18
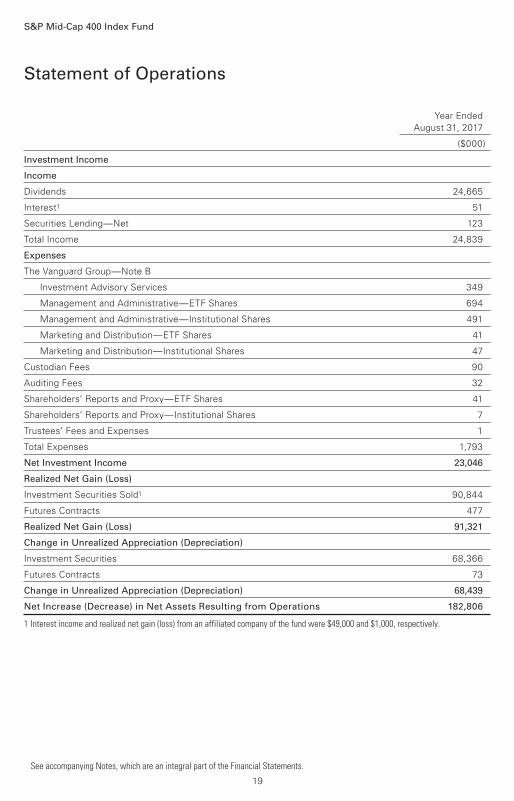
Year Ended
August 31, 2017
($000)
Investment Income
Income
Dividends 24,665
Interest1 51
Securities Lending—Net 123
Total Income 24,839
Expenses
The Vanguard Group—Note B
Investment Advisory Services 349
Management and Administrative—ETF Shares 694
Management and Administrative—Institutional Shares 491
Marketing and Distribution—ETF Shares 41
Marketing and Distribution—Institutional Shares 47
Custodian Fees 90
Auditing Fees 32
Shareholders’ Reports and Proxy—ETF Shares 41
Shareholders’ Reports and Proxy—Institutional Shares 7
Trustees’ Fees and Expenses 1
Total Expenses 1,793
Net Investment Income 23,046
Realized Net Gain (Loss)
Investment Securities Sold1 90,844
Futures Contracts 477
Realized Net Gain (Loss) 91,321
Change in Unrealized Appreciation (Depreciation)
Investment Securities 68,366
Futures Contracts 73
Change in Unrealized Appreciation (Depreciation) 68,439
Net Increase (Decrease) in Net Assets Resulting from Operations 182,806
1 Interest income and realized net gain (loss) from an affiliated company of the fund were $49,000 and $1,000, respectively.
Statement of Operations
S&P Mid-Cap 400 Index Fund
See accompanying Notes, which are an integral part of the Financial Statements.
19
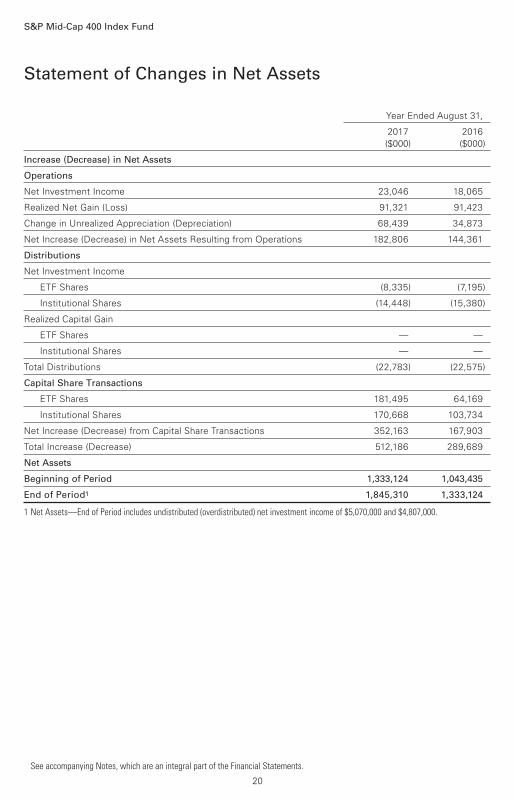
Statement of Changes in Net Assets
S&P Mid-Cap 400 Index Fund
See accompanying Notes, which are an integral part of the Financial Statements.
Year Ended August 31,
2017 2016
($000) ($000)
Increase (Decrease) in Net Assets
Operations
Net Investment Income 23,046 18,065
Realized Net Gain (Loss) 91,321 91,423
Change in Unrealized Appreciation (Depreciation) 68,439 34,873
Net Increase (Decrease) in Net Assets Resulting from Operations 182,806 144,361
Distributions
Net Investment Income
ETF Shares (8,335) (7,195)
Institutional Shares (14,448) (15,380)
Realized Capital Gain
ETF Shares — —
Institutional Shares — —
Total Distributions (22,783) (22,575)
Capital Share Transactions
ETF Shares 181,495 64,169
Institutional Shares 170,668 103,734
Net Increase (Decrease) from Capital Share Transactions 352,163 167,903
Total Increase (Decrease) 512,186 289,689
Net Assets
Beginning of Period 1,333,124 1,043,435
End of Period1 1,845,310 1,333,124
1 Net Assets—End of Period includes undistributed (overdistributed) net investment income of $5,070,000 and $4,807,000.
20
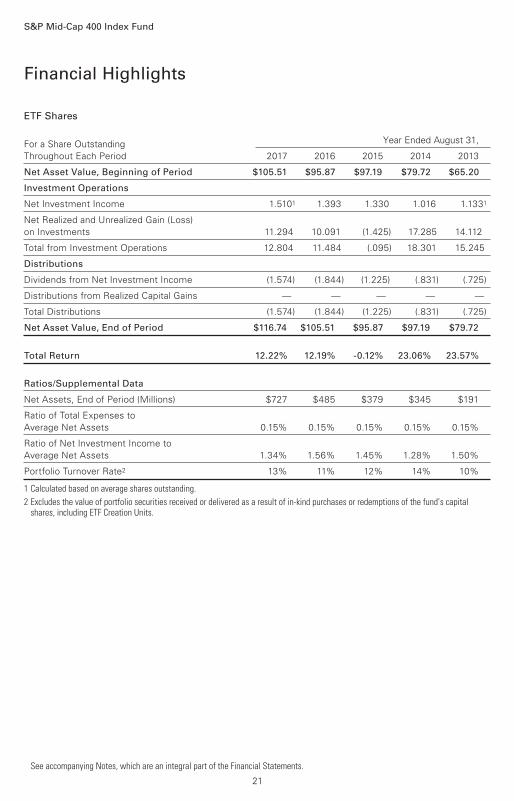
ETF Shares
For a Share Outstanding Year Ended August 31,
Throughout Each Period 2017 2016 2015 2014 2013
Net Asset Value, Beginning of Period $105.51 $95.87 $97.19 $79.72 $65.20
Investment Operations
Net Investment Income 1.5101 1.393 1.330 1.016 1.1331
Net Realized and Unrealized Gain (Loss)
on Investments 11.294 10.091 (1.425) 17.285 14.112
Total from Investment Operations 12.804 11.484 (.095) 18.301 15.245
Distributions
Dividends from Net Investment Income (1.574) (1.844) (1.225) (.831) (.725)
Distributions from Realized Capital Gains — — — — —
Total Distributions (1.574) (1.844) (1.225) (.831) (.725)
Net Asset Value, End of Period $116.74 $105.51 $95.87 $97.19 $79.72
Total Return 12.22% 12.19% -0.12% 23.06% 23.57%
Ratios/Supplemental Data
Net Assets, End of Period (Millions) $727 $485 $379 $345 $191
Ratio of Total Expenses to
Average Net Assets 0.15% 0.15% 0.15% 0.15% 0.15%
Ratio of Net Investment Income to
Average Net Assets 1.34% 1.56% 1.45% 1.28% 1.50%
Portfolio Turnover Rate2 13% 11% 12% 14% 10%
1 Calculated based on average shares outstanding.
2 Excludes the value of portfolio securities received or delivered as a result of in-kind purchases or redemptions of the fund’s capital shares, including ETF Creation Units.
Financial Highlights
See accompanying Notes, which are an integral part of the Financial Statements.
S&P Mid-Cap 400 Index Fund
21
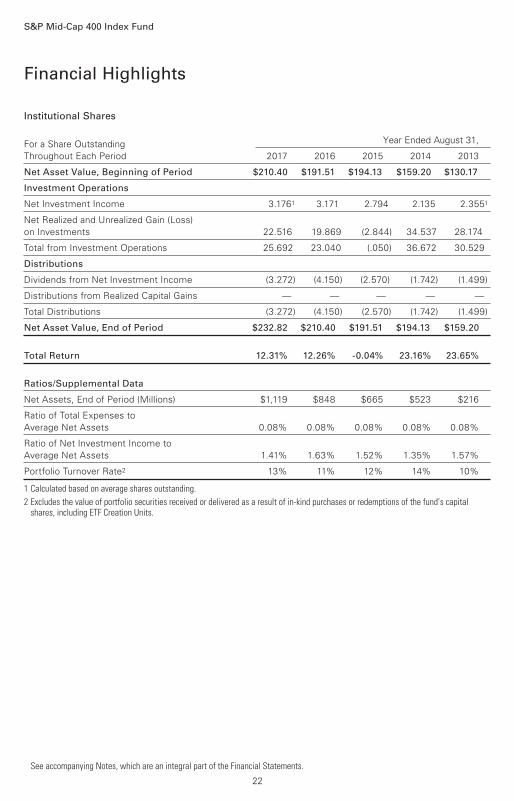
Institutional Shares
For a Share Outstanding Year Ended August 31,
Throughout Each Period 2017 2016 2015 2014 2013
Net Asset Value, Beginning of Period $210.40 $191.51 $194.13 $159.20 $130.17
Investment Operations
Net Investment Income 3.1761 3.171 2.794 2.135 2.3551
Net Realized and Unrealized Gain (Loss)
on Investments 22.516 19.869 (2.844) 34.537 28.174
Total from Investment Operations 25.692 23.040 (.050) 36.672 30.529
Distributions
Dividends from Net Investment Income (3.272) (4.150) (2.570) (1.742) (1.499)
Distributions from Realized Capital Gains — — — — —
Total Distributions (3.272) (4.150) (2.570) (1.742) (1.499)
Net Asset Value, End of Period $232.82 $210.40 $191.51 $194.13 $159.20
Total Return 12.31% 12.26% -0.04% 23.16% 23.65%
Ratios/Supplemental Data
Net Assets, End of Period (Millions) $1,119 $848 $665 $523 $216
Ratio of Total Expenses to
Average Net Assets 0.08% 0.08% 0.08% 0.08% 0.08%
Ratio of Net Investment Income to
Average Net Assets 1.41% 1.63% 1.52% 1.35% 1.57%
Portfolio Turnover Rate2 13% 11% 12% 14% 10%
1 Calculated based on average shares outstanding.
2 Excludes the value of portfolio securities received or delivered as a result of in-kind purchases or redemptions of the fund’s capital shares, including ETF Creation Units.
Financial Highlights
See accompanying Notes, which are an integral part of the Financial Statements.
S&P Mid-Cap 400 Index Fund
22
Notes to Financial Statements
S&P Mid-Cap 400 Index Fund
Vanguard S&P Mid-Cap 400 Index Fund is registered under the Investment Company Act of
1940 as an open-end investment company, or mutual fund. The fund offers two classes of shares:
ETF Shares and Institutional Shares. ETF Shares are listed for trading on NYSE Arca; they can be
purchased and sold through a broker. Institutional Shares are designed for investors who meet
certain administrative, service, and account-size criteria.
A. The following significant accounting policies conform to generally accepted accounting
principles for U.S. investment companies. The fund consistently follows such policies in preparing
its financial statements.
1. Security Valuation: Securities are valued as of the close of trading on the New York Stock
Exchange (generally 4 p.m., Eastern time) on the valuation date. Equity securities are valued
at the latest quoted sales prices or official closing prices taken from the primary market in which
each security trades; such securities not traded on the valuation date are valued at the mean of the
latest quoted bid and asked prices. Securities for which market quotations are not readily available,
or whose values have been materially affected by events occurring before the fund’s pricing time
but after the close of the securities’ primary markets, are valued by methods deemed by the board
of trustees to represent fair value. Investments in Vanguard Market Liquidity Fund are valued at that
fund’s net asset value. Temporary cash investments are valued using the latest bid prices or using
valuations based on a matrix system (which considers such factors as security prices, yields,
maturities, and ratings), both as furnished by independent pricing services.
2. Futures Contracts: The fund uses index futures contracts to a limited extent, with the objectives
of maintaining full exposure to the stock market, enhancing returns, maintaining liquidity, and
minimizing transaction costs. The fund may purchase futures contracts to immediately invest
incoming cash in the market, or sell futures in response to cash outflows, thereby simulating a fully
invested position in the underlying index while maintaining a cash balance for liquidity. The fund
may seek to enhance returns by using futures contracts instead of the underlying securities when
futures are believed to be priced more attractively than the underlying securities. The primary risks
associated with the use of futures contracts are imperfect correlation between changes in market
values of stocks held by the fund and the prices of futures contracts, and the possibility of an illiquid
market. Counterparty risk involving futures is mitigated because a regulated clearinghouse is the
counterparty instead of the clearing broker. To further mitigate counterparty risk, the fund trades
futures contracts on an exchange, monitors the financial strength of its clearing brokers and
clearinghouse, and has entered into clearing agreements with its clearing brokers. The
clearinghouse imposes initial margin requirements to secure the fund’s performance and requires
daily settlement of variation margin representing changes in the market value of each contract.
Futures contracts are valued at their quoted daily settlement prices. The notional amounts
of the contracts are not recorded in the Statement of Net Assets. Fluctuations in the value
of the contracts are recorded in the Statement of Net Assets as an asset (liability) and in
the Statement of Operations as unrealized appreciation (depreciation) until the contracts are
closed, when they are recorded as realized futures gains (losses).
During the year ended August 31, 2017, the fund’s average investments in long and short futures
contracts represented less than 1% and 0% of net assets, respectively, based on the average of
the notional amounts at each quarter-end during the period.
23

S&P Mid-Cap 400 Index Fund
3. Federal Income Taxes: The fund intends to continue to qualify as a regulated investment
company and distribute all of its taxable income. Management has analyzed the fund’s tax
positions taken for all open federal income tax years (August 31, 2014–2017), and has concluded
that no provision for federal income tax is required in the fund’s financial statements.
4. Distributions: Distributions to shareholders are recorded on the ex-dividend date.
5. Securities Lending: To earn additional income, the fund lends its securities to qualified
institutional borrowers. Security loans are subject to termination by the fund at any time, and
are required to be secured at all times by collateral in an amount at least equal to the market value
of securities loaned. Daily market fluctuations could cause the value of loaned securities to be
more or less than the value of the collateral received. When this occurs, the collateral is adjusted
and settled on the next business day. The fund further mitigates its counterparty risk by entering
into securities lending transactions only with a diverse group of prequalified counterparties,
monitoring their financial strength, and entering into master securities lending agreements with
its counterparties. The master securities lending agreements provide that, in the event of a
counterparty’s default (including bankruptcy), the fund may terminate any loans with that borrower,
determine the net amount owed, and sell or retain the collateral up to the net amount owed to the
fund; however, such actions may be subject to legal proceedings. While collateral mitigates
counterparty risk, in the event of a default, the fund may experience delays and costs in recovering
the securities loaned. The fund invests cash collateral received in Vanguard Market Liquidity Fund,
and records a liability in the Statement of Net Assets for the return of the collateral, during the
period the securities are on loan. Securities lending income represents fees charged to borrowers
plus income earned on invested cash collateral, less expenses associated with the loan. During
the term of the loan, the fund is entitled to all distributions made on or in respect of the
loaned securities.
6. Credit Facility: The fund and certain other funds managed by The Vanguard Group (“Vanguard”)
participate in a $3.1 billion committed credit facility provided by a syndicate of lenders pursuant to
a credit agreement that may be renewed annually; each fund is individually liable for its borrowings,
if any, under the credit facility. Borrowings may be utilized for temporary and emergency purposes,
and are subject to the fund’s regulatory and contractual borrowing restrictions. The participating
funds are charged administrative fees and an annual commitment fee of 0.10% of the undrawn
amount of the facility; these fees are allocated to the funds based on a method approved by the
fund’s board of trustees and included in Management and Administrative expenses on the fund’s
Statement of Operations. Any borrowings under this facility bear interest at a rate based upon the
higher of the one-month London Interbank Offered Rate, federal funds effective rate, or overnight
bank funding rate plus an agreed-upon spread.
The fund had no borrowings outstanding at August 31, 2017, or at any time during the period
then ended.
7. Other: Dividend income is recorded on the ex-dividend date. Interest income includes income
distributions received from Vanguard Market Liquidity Fund and is accrued daily. Premiums and
discounts on debt securities purchased are amortized and accreted, respectively, to interest income
over the lives of the respective securities. Security transactions are accounted for on the date
securities are bought or sold. Costs used to determine realized gains (losses) on the sale of
investment securities are those of the specific securities sold.
24

S&P Mid-Cap 400 Index Fund
Each class of shares has equal rights as to assets and earnings, except that each class separately
bears certain class-specific expenses related to maintenance of shareholder accounts (included in
Management and Administrative expenses), shareholder reporting, and the proxy. Marketing and
distribution expenses are allocated to each class of shares based on a method approved by the
board of trustees. Income, other non-class-specific expenses, and gains and losses on
investments are allocated to each class of shares based on its relative net assets.
B. In accordance with the terms of a Funds’ Service Agreement (the “FSA”) between Vanguard
and the fund, Vanguard furnishes to the fund investment advisory, corporate management,
administrative, marketing, and distribution services at Vanguard’s cost of operations (as defined
by the FSA). These costs of operations are allocated to the fund based on methods and guidelines
approved by the board of trustees. Vanguard does not require reimbursement in the current period
for certain costs of operations (such as deferred compensation/benefits and risk/insurance costs);
the fund’s liability for these costs of operations is included in Payables to Vanguard on the
Statement of Net Assets.
Upon the request of Vanguard, the fund may invest up to 0.40% of its net assets as capital in
Vanguard. At August 31, 2017, the fund had contributed to Vanguard capital in the amount of
$120,000, representing 0.01% of the fund’s net assets and 0.05% of Vanguard’s capitalization.
The fund’s trustees and officers are also directors and employees, respectively, of Vanguard.
C. Various inputs may be used to determine the value of the fund’s investments. These inputs
are summarized in three broad levels for financial statement purposes. The inputs or methodologies
used to value securities are not necessarily an indication of the risk associated with investing in
those securities.
Level 1—Quoted prices in active markets for identical securities.
Level 2—Other significant observable inputs (including quoted prices for similar securities, interest
rates, prepayment speeds, credit risk, etc.).
Level 3—Significant unobservable inputs (including the fund’s own assumptions used to determine
the fair value of investments). Any investments valued with significant unobservable inputs are
noted on the Statement of Net Assets.
The following table summarizes the market value of the fund’s investments as of August 31, 2017,
based on the inputs used to value them:
Level 1 Level 2 Level 3
Investments ($000) ($000) ($000)
Common Stocks 1,837,100 — —
Temporary Cash Investments 20,887 500 —
Futures Contracts—Assets1 71 — —
Total 1,858,058 500 —
1 Represents variation margin on the last day of the reporting period.
25
S&P Mid-Cap 400 Index Fund
D. Distributions are determined on a tax basis and may differ from net investment income and
realized capital gains for financial reporting purposes. Differences may be permanent or temporary.
Permanent differences are reclassified among capital accounts in the financial statements to reflect
their tax character. Temporary differences arise when certain items of income, expense, gain, or
loss are recognized in different periods for financial statement and tax purposes. These differences
will reverse at some time in the future. Differences in classification may also result from the
treatment of short-term gains as ordinary income for tax purposes.
During the year ended August 31, 2017, the fund realized $99,274,000 of net capital gains resulting
from in-kind redemptions—in which shareholders exchanged fund shares for securities held by the
fund rather than for cash. Because such gains are not taxable to the fund, and are not distributed
to shareholders, they have been reclassified from accumulated net realized losses to paid-in capital.
For tax purposes, at August 31, 2017, the fund had $5,387,000 of ordinary income available for
distribution. The fund had available capital losses totaling $25,181,000 that may be carried forward
indefinitely to offset future net capital gains.
At August 31, 2017, the cost of investment securities for tax purposes was $1,718,662,000. Net
unrealized appreciation of investment securities for tax purposes was $139,825,000, consisting
of unrealized gains of $255,175,000 on securities that had risen in value since their purchase and
$115,350,000 in unrealized losses on securities that had fallen in value since their purchase.
E. During the year ended August 31, 2017, the fund purchased $885,593,000 of investment
securities and sold $537,751,000 of investment securities, other than temporary cash investments.
Purchases and sales include $419,189,000 and $328,773,000, respectively, in connection with
in-kind purchases and redemptions of the fund’s capital shares.
The fund purchased securities from and sold securities to other Vanguard funds or accounts
managed by Vanguard or its affiliates, in accordance with procedures adopted by the board of
trustees in compliance with Rule 17a-7 of the Investment Company Act of 1940. For the year
ended August 31, 2017, such purchases and sales were $85,969,000 and $59,321,000,
respectively; these amounts are included in the purchases and sales of investment securities
noted above.
26

S&P Mid-Cap 400 Index Fund
F. Capital share transactions for each class of shares were:
Year Ended August 31,
2017 2016
Amount Shares Amount Shares
($000) (000) ($000) (000)
ETF Shares
Issued 530,214 4,625 427,039 4,300
Issued in Lieu of Cash Distributions — — — —
Redeemed (348,719) (3,000) (362,870) (3,650)
Net Increase (Decrease)—ETF Shares 181,495 1,625 64,169 650
Institutional Shares
Issued 301,445 1,345 306,256 1,555
Issued in Lieu of Cash Distributions 14,259 64 12,604 66
Redeemed (145,036) (634) (215,126) (1,063)
Net Increase (Decrease)—Institutional Shares 170,668 775 103,734 558
G. Management has determined that no material events or transactions occurred subsequent
to August 31, 2017, that would require recognition or disclosure in these financial statements.
27
S&P Mid-Cap 400 Value Index Fund
Fund ProfileAs of August 31, 2017
1 The expense ratios shown are from the prospectus dated December 23, 2016, and represent estimated costs for the current fiscal year. For the fiscal year ended August 31, 2017, the expense ratios were 0.20% for ETF Shares and 0.08% for Institutional Shares.
28
Volatility Measures
S&P MidCap
400 Value
Index
DJ
U.S. Total
Market
FA Index
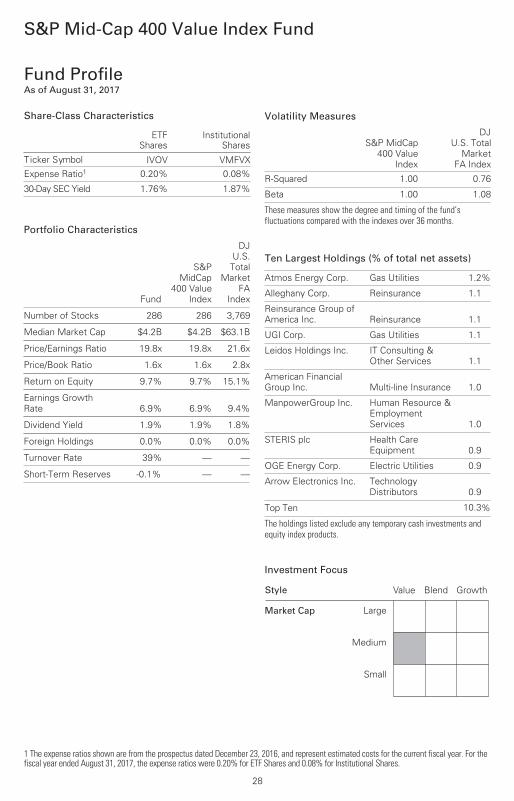
R-Squared 1.00 0.76
Beta 1.00 1.08
These measures show the degree and timing of the fund’s fluctuations compared with the indexes over 36 months.
Portfolio Characteristics
Fund
S&P
MidCap
400 Value
Index
DJ
U.S.
Total
Market
FA
Index
Number of Stocks 286 286 3,769
Median Market Cap $4.2B $4.2B $63.1B
Price/Earnings Ratio 19.8x 19.8x 21.6x
Price/Book Ratio 1.6x 1.6x 2.8x
Return on Equity 9.7% 9.7% 15.1%
Earnings Growth
Rate 6.9% 6.9% 9.4%
Dividend Yield 1.9% 1.9% 1.8%
Foreign Holdings 0.0% 0.0% 0.0%
Turnover Rate 39% — —
Short-Term Reserves -0.1% — —
Share-Class Characteristics
ETFShares
InstitutionalShares
Ticker Symbol IVOV VMFVXExpense Ratio1 0.20% 0.08%
30-Day SEC Yield 1.76% 1.87%
Ten Largest Holdings (% of total net assets)
Atmos Energy Corp. Gas Utilities 1.2%
Alleghany Corp. Reinsurance 1.1
Reinsurance Group of
America Inc. Reinsurance 1.1
UGI Corp. Gas Utilities 1.1
Leidos Holdings Inc. IT Consulting &
Other Services 1.1
American Financial
Group Inc. Multi-line Insurance 1.0
ManpowerGroup Inc. Human Resource &
Employment
Services 1.0
STERIS plc Health Care
Equipment 0.9
OGE Energy Corp. Electric Utilities 0.9
Arrow Electronics Inc. Technology
Distributors 0.9
Top Ten 10.3%
The holdings listed exclude any temporary cash investments andequity index products.
Investment Focus
Market Cap
Value
Large
Medium
Small
Blend Growth Style

S&P Mid-Cap 400 Value Index Fund
Sector Diversification (% of equity exposure)
Fund
S&PMidCap
400 ValueIndex
DJU.S. Total
MarketFA Index
Consumer Discretionary 10.6% 10.6% 12.4%
Consumer Staples 4.9 4.9 7.6
Energy 5.1 5.1 5.3
Financials 19.7 19.7 14.7
Health Care 6.7 6.7 14.1
Industrials 12.5 12.5 10.7
Information Technology 12.8 12.8 22.6
Materials 8.8 8.8 3.3
Real Estate 9.3 9.3 4.1
TelecommunicationServices 0.5 0.5 1.9
Utilities 9.1 9.1 3.3
Sector categories are based on the Global Industry ClassificationStandard (“GICS”), except for the “Other” category (if applicable),which includes securities that have not been provided a GICSclassification as of the effective reporting period.
29

All of the returns in this report represent past performance, which is not a guarantee of future results that may be achieved by the fund. (Current performance may be lower or higher thanthe performance data cited. For performance data current to the most recent month-end, visitour website at vanguard.com/performance.) Note, too, that both investment returns and principal value can fluctuate widely, so an investor’s shares, when sold, could be worth more or less than their original cost. The returns shown do not reflect taxes that a shareholder would pay
on fund distributions or on the sale of fund shares.
Performance Summary
S&P Mid-Cap 400 Value Index Fund
See Financial Highlights for dividend and capital gains information.
30
Cumulative Performance: September 7, 2010, Through August 31, 2017Initial Investment of $10,000
2017201620152014201320122011
$30,000
7,000
24,587
Average Annual Total Returns
Periods Ended August 31, 2017
OneYear
FiveYears
SinceInception
(9/7/2010)
Final Valueof a $10,000Investment
S&P Mid-Cap 400 Value IndexFund*ETF Shares Net Asset Value 11.91% 13.93% 13.75% $24,587
S&P Mid-Cap 400 Value IndexFund*ETF Shares Market Price 11.85 13.92 13.75 24,574
• • • • • • • • S&P MidCap 400 Value Index 12.09 14.14 13.97 24,915
– – – – Mid-Cap Value Funds Average 10.95 12.93 12.62 22,928________ Dow Jones U.S. Total Stock Market
Float Adjusted Index 16.05 14.19 14.71 26,064
Mid-Cap Value Funds Average: Derived from data provided by Lipper, a Thomson Reuters Company."Since Inception" performance is calculated from the ETF Shares’ inception date for both the fund and its comparative standards.
OneYear
FiveYears
SinceInception
(11/2/2010)
Final Valueof a $5,000,000
Investment
S&P Mid-Cap 400 Value Index FundInstitutional Shares 12.05% 14.07% 12.65% $11,276,665
S&P MidCap 400 Value Index 12.09 14.14 12.73 11,329,617
Dow Jones U.S. Total Stock Market FloatAdjusted Index 16.05 14.19 13.44 11,826,845
"Since Inception" performance is calculated from the Institutional Shares’ inception date for both the fund and its comparative standards.
S&P Mid-Cap 400 Value Index Fund
31
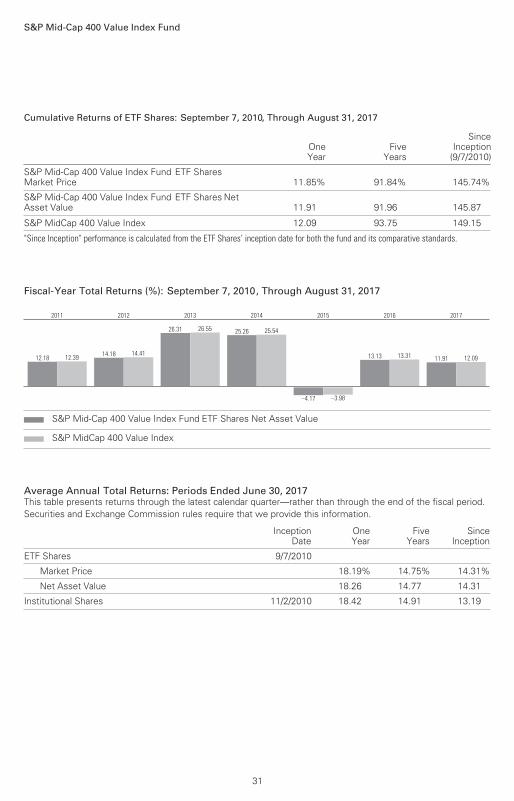
Cumulative Returns of ETF Shares: September 7, 2010, Through August 31, 2017
OneYear
FiveYears
SinceInception
(9/7/2010)
S&P Mid-Cap 400 Value Index Fund ETF SharesMarket Price 11.85% 91.84% 145.74%
S&P Mid-Cap 400 Value Index Fund ETF Shares NetAsset Value 11.91 91.96 145.87
S&P MidCap 400 Value Index 12.09 93.75 149.15
"Since Inception" performance is calculated from the ETF Shares’ inception date for both the fund and its comparative standards.
Fiscal-Year Total Returns (%): September 7, 2010, Through August 31, 2017
12.18 12.39
2011
14.18 14.41
2012
26.31 26.55
2013
25.26 25.54
2014
–4.17 –3.98
2015
13.13 13.31
2016
11.91 12.09
2017
S&P Mid-Cap 400 Value Index Fund ETF Shares Net Asset Value
S&P MidCap 400 Value Index
Average Annual Total Returns: Periods Ended June 30, 2017This table presents returns through the latest calendar quarter—rather than through the end of the fiscal period.Securities and Exchange Commission rules require that we provide this information.
InceptionDate
OneYear
FiveYears
SinceInception
ETF Shares 9/7/2010
Market Price 18.19% 14.75% 14.31%
Net Asset Value 18.26 14.77 14.31
Institutional Shares 11/2/2010 18.42 14.91 13.19

Market
Value•
Shares ($000)
Market
Value•
Shares ($000)
Common Stocks (99.6%)1
Consumer Discretionary (10.6%) Toll Brothers Inc. 149,802 5,836
Brunswick Corp. 90,414 4,745
Bed Bath & Beyond Inc. 146,953 4,054^ Williams-Sonoma Inc. 80,694 3,712
Dana Inc. 146,351 3,523* AutoNation Inc. 66,636 3,023^ Polaris Industries Inc. 30,841 2,875
Aaron’s Inc. 63,667 2,819
Graham Holdings Co.
Class B 4,710 2,766
TEGNA Inc. 217,379 2,743
CalAtlantic Group Inc. 77,936 2,708* Live Nation
Entertainment Inc. 64,908 2,594
Service Corp.
International 72,323 2,556* Helen of Troy Ltd. 27,390 2,473
New York Times Co.
Class A 123,677 2,307* Murphy USA Inc. 34,998 2,256
Office Depot Inc. 523,050 2,244^ Big Lots Inc. 45,342 2,158* TRI Pointe Group Inc. 161,031 2,052
American Eagle
Outfitters Inc. 168,422 2,013* Adtalem Global
Education Inc. 57,698 1,973
GameStop Corp.
Class A 102,521 1,897
Cooper Tire & Rubber
Co. 53,591 1,801^ KB Home 84,128 1,800
Tupperware Brands Corp. 29,787 1,724
Cinemark Holdings Inc. 46,122 1,535^ Dillard’s Inc. Class A 21,924 1,333
John Wiley & Sons Inc.
Class A 24,032 1,296* Cabela’s Inc. 23,503 1,262* Tempur Sealy
International Inc. 19,465 1,205* Michaels Cos. Inc. 53,548 1,202
HSN Inc. 32,285 1,185* Sally Beauty Holdings Inc. 61,107 1,136* AMC Networks Inc.
Class A 18,455 1,122* Deckers Outdoor Corp. 15,834 1,012
Cracker Barrel Old Country
Store Inc. 6,800 1,011
International Speedway
Corp. Class A 25,561 911
Meredith Corp. 16,340 888
83,750Consumer Staples (4.8%) Ingredion Inc. 38,462 4,762* Edgewell Personal Care
Co. 58,133 4,415* Hain Celestial Group Inc. 104,730 4,212^ Casey’s General Stores
Inc. 39,666 4,181* TreeHouse Foods Inc. 57,646 3,862
Flowers Foods Inc. 186,406 3,238
Snyder’s-Lance Inc. 87,070 3,093
Lamb Weston Holdings
Inc. 53,385 2,428* United Natural Foods Inc. 51,222 1,780* Sprouts Farmers Market
Inc. 66,734 1,331* Avon Products Inc. 444,466 1,107
Energizer Holdings Inc. 23,790 1,050
Dean Foods Co. 92,014 1,012
Nu Skin Enterprises Inc.
Class A 15,590 948
Financial Statements
Statement of Net AssetsAs of August 31, 2017
The fund reports a complete list of its holdings in regulatory filings four times in each fiscal year, at
the quarter-ends. For the second and fourth fiscal quarters, the lists appear in the fund’s semiannual
and annual reports to shareholders. For the first and third fiscal quarters, the fund files the lists with
the Securities and Exchange Commission on Form N-Q. Shareholders can look up the fund’s Forms
N-Q on the SEC’s website at sec.gov. Forms N-Q may also be reviewed and copied at the SEC’s
Public Reference Room (see the back cover of this report for further information).
S&P Mid-Cap 400 Value Index Fund
32
S&P Mid-Cap 400 Value Index Fund
Market
Value•
Shares ($000)
Market
Value•
Shares ($000)
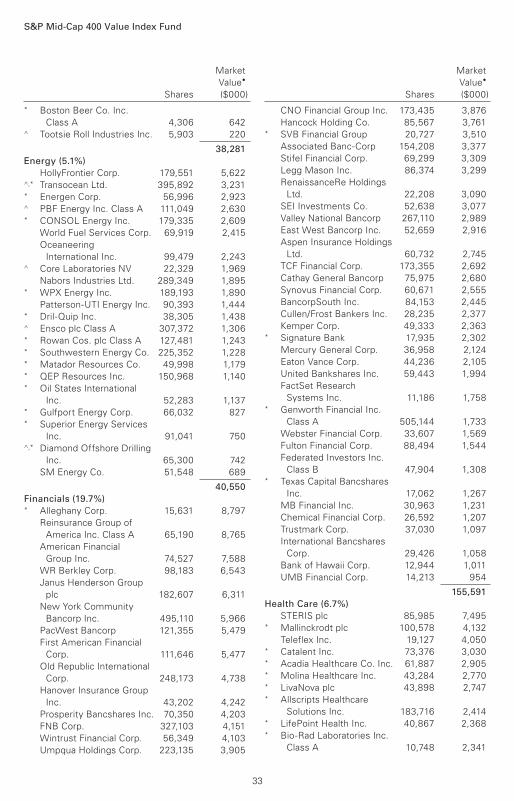
* Boston Beer Co. Inc.
Class A 4,306 642^ Tootsie Roll Industries Inc. 5,903 220
38,281Energy (5.1%) HollyFrontier Corp. 179,551 5,622^,* Transocean Ltd. 395,892 3,231* Energen Corp. 56,996 2,923^ PBF Energy Inc. Class A 111,049 2,630* CONSOL Energy Inc. 179,335 2,609
World Fuel Services Corp. 69,919 2,415
Oceaneering
International Inc. 99,479 2,243^ Core Laboratories NV 22,329 1,969
Nabors Industries Ltd. 289,349 1,895* WPX Energy Inc. 189,193 1,890
Patterson-UTI Energy Inc. 90,393 1,444* Dril-Quip Inc. 38,305 1,438^ Ensco plc Class A 307,372 1,306* Rowan Cos. plc Class A 127,481 1,243* Southwestern Energy Co. 225,352 1,228* Matador Resources Co. 49,998 1,179* QEP Resources Inc. 150,968 1,140* Oil States International
Inc. 52,283 1,137* Gulfport Energy Corp. 66,032 827* Superior Energy Services
Inc. 91,041 750^,* Diamond Offshore Drilling
Inc. 65,300 742
SM Energy Co. 51,548 689
40,550Financials (19.7%) * Alleghany Corp. 15,631 8,797
Reinsurance Group of
America Inc. Class A 65,190 8,765
American Financial
Group Inc. 74,527 7,588
WR Berkley Corp. 98,183 6,543
Janus Henderson Group
plc 182,607 6,311
New York Community
Bancorp Inc. 495,110 5,966
PacWest Bancorp 121,355 5,479
First American Financial
Corp. 111,646 5,477
Old Republic International
Corp. 248,173 4,738
Hanover Insurance Group
Inc. 43,202 4,242
Prosperity Bancshares Inc. 70,350 4,203
FNB Corp. 327,103 4,151
Wintrust Financial Corp. 56,349 4,103
Umpqua Holdings Corp. 223,135 3,905
CNO Financial Group Inc. 173,435 3,876
Hancock Holding Co. 85,567 3,761* SVB Financial Group 20,727 3,510
Associated Banc-Corp 154,208 3,377
Stifel Financial Corp. 69,299 3,309
Legg Mason Inc. 86,374 3,299
RenaissanceRe Holdings
Ltd. 22,208 3,090
SEI Investments Co. 52,638 3,077
Valley National Bancorp 267,110 2,989
East West Bancorp Inc. 52,659 2,916
Aspen Insurance Holdings
Ltd. 60,732 2,745
TCF Financial Corp. 173,355 2,692
Cathay General Bancorp 75,975 2,680
Synovus Financial Corp. 60,671 2,555
BancorpSouth Inc. 84,153 2,445
Cullen/Frost Bankers Inc. 28,235 2,377
Kemper Corp. 49,333 2,363* Signature Bank 17,935 2,302
Mercury General Corp. 36,958 2,124
Eaton Vance Corp. 44,236 2,105
United Bankshares Inc. 59,443 1,994
FactSet Research
Systems Inc. 11,186 1,758* Genworth Financial Inc.
Class A 505,144 1,733
Webster Financial Corp. 33,607 1,569
Fulton Financial Corp. 88,494 1,544
Federated Investors Inc.
Class B 47,904 1,308* Texas Capital Bancshares
Inc. 17,062 1,267
MB Financial Inc. 30,963 1,231
Chemical Financial Corp. 26,592 1,207
Trustmark Corp. 37,030 1,097
International Bancshares
Corp. 29,426 1,058
Bank of Hawaii Corp. 12,944 1,011
UMB Financial Corp. 14,213 954
155,591Health Care (6.7%) STERIS plc 85,985 7,495* Mallinckrodt plc 100,578 4,132
Teleflex Inc. 19,127 4,050* Catalent Inc. 73,376 3,030* Acadia Healthcare Co. Inc. 61,887 2,905* Molina Healthcare Inc. 43,284 2,770* LivaNova plc 43,898 2,747* Allscripts Healthcare
Solutions Inc. 183,716 2,414* LifePoint Health Inc. 40,867 2,368* Bio-Rad Laboratories Inc.
Class A 10,748 2,341
33
S&P Mid-Cap 400 Value Index Fund
Market
Value•
Shares ($000)
Market
Value•
Shares ($000)
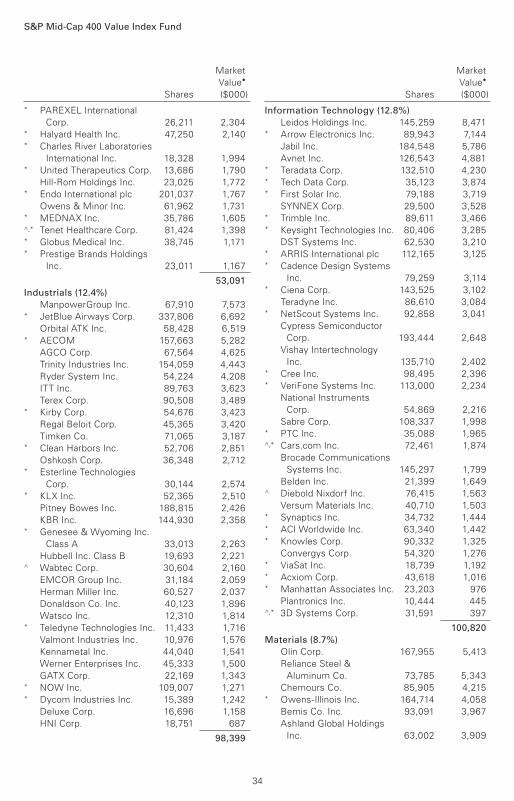
* PAREXEL International
Corp. 26,211 2,304* Halyard Health Inc. 47,250 2,140* Charles River Laboratories
International Inc. 18,328 1,994* United Therapeutics Corp. 13,686 1,790
Hill-Rom Holdings Inc. 23,025 1,772* Endo International plc 201,037 1,767
Owens & Minor Inc. 61,962 1,731* MEDNAX Inc. 35,786 1,605^,* Tenet Healthcare Corp. 81,424 1,398* Globus Medical Inc. 38,745 1,171* Prestige Brands Holdings
Inc. 23,011 1,167
53,091Industrials (12.4%) ManpowerGroup Inc. 67,910 7,573* JetBlue Airways Corp. 337,806 6,692
Orbital ATK Inc. 58,428 6,519* AECOM 157,663 5,282
AGCO Corp. 67,564 4,625
Trinity Industries Inc. 154,059 4,443
Ryder System Inc. 54,224 4,208
ITT Inc. 89,763 3,623
Terex Corp. 90,508 3,489* Kirby Corp. 54,676 3,423
Regal Beloit Corp. 45,365 3,420
Timken Co. 71,065 3,187* Clean Harbors Inc. 52,706 2,851
Oshkosh Corp. 36,348 2,712* Esterline Technologies
Corp. 30,144 2,574* KLX Inc. 52,365 2,510
Pitney Bowes Inc. 188,815 2,426
KBR Inc. 144,930 2,358* Genesee & Wyoming Inc.
Class A 33,013 2,263
Hubbell Inc. Class B 19,693 2,221^ Wabtec Corp. 30,604 2,160
EMCOR Group Inc. 31,184 2,059
Herman Miller Inc. 60,527 2,037
Donaldson Co. Inc. 40,123 1,896
Watsco Inc. 12,310 1,814* Teledyne Technologies Inc. 11,433 1,716
Valmont Industries Inc. 10,976 1,576
Kennametal Inc. 44,040 1,541
Werner Enterprises Inc. 45,333 1,500
GATX Corp. 22,169 1,343* NOW Inc. 109,007 1,271* Dycom Industries Inc. 15,389 1,242
Deluxe Corp. 16,696 1,158
HNI Corp. 18,751 687
98,399
Information Technology (12.8%) Leidos Holdings Inc. 145,259 8,471* Arrow Electronics Inc. 89,943 7,144
Jabil Inc. 184,548 5,786
Avnet Inc. 126,543 4,881* Teradata Corp. 132,510 4,230* Tech Data Corp. 35,123 3,874* First Solar Inc. 79,188 3,719
SYNNEX Corp. 29,500 3,528* Trimble Inc. 89,611 3,466* Keysight Technologies Inc. 80,406 3,285
DST Systems Inc. 62,530 3,210* ARRIS International plc 112,165 3,125* Cadence Design Systems
Inc. 79,259 3,114* Ciena Corp. 143,525 3,102
Teradyne Inc. 86,610 3,084* NetScout Systems Inc. 92,858 3,041
Cypress Semiconductor
Corp. 193,444 2,648
Vishay Intertechnology
Inc. 135,710 2,402* Cree Inc. 98,495 2,396* VeriFone Systems Inc. 113,000 2,234
National Instruments
Corp. 54,869 2,216
Sabre Corp. 108,337 1,998* PTC Inc. 35,088 1,965^,* Cars.com Inc. 72,461 1,874
Brocade Communications
Systems Inc. 145,297 1,799
Belden Inc. 21,399 1,649^ Diebold Nixdorf Inc. 76,415 1,563
Versum Materials Inc. 40,710 1,503* Synaptics Inc. 34,732 1,444* ACI Worldwide Inc. 63,340 1,442* Knowles Corp. 90,332 1,325
Convergys Corp. 54,320 1,276* ViaSat Inc. 18,739 1,192* Acxiom Corp. 43,618 1,016* Manhattan Associates Inc. 23,203 976
Plantronics Inc. 10,444 445^,* 3D Systems Corp. 31,591 397
100,820Materials (8.7%) Olin Corp. 167,955 5,413
Reliance Steel &
Aluminum Co. 73,785 5,343
Chemours Co. 85,905 4,215* Owens-Illinois Inc. 164,714 4,058
Bemis Co. Inc. 93,091 3,967
Ashland Global Holdings
Inc. 63,002 3,909
34

S&P Mid-Cap 400 Value Index Fund
Market
Value•
Shares ($000)
Market
Value•
Shares ($000)
* Louisiana-Pacific Corp. 146,541 3,734
Cabot Corp. 63,250 3,332
PolyOne Corp. 82,770 2,991
AptarGroup Inc. 34,130 2,854
Steel Dynamics Inc. 80,780 2,783
Domtar Corp. 63,366 2,562
RPM International Inc. 51,392 2,517
United States Steel Corp. 88,414 2,353
Sonoco Products Co. 48,296 2,331* Allegheny Technologies
Inc. 110,172 2,295
Silgan Holdings Inc. 75,924 2,285
Commercial Metals Co. 117,216 2,214
Valvoline Inc. 99,378 2,116
Carpenter Technology
Corp. 47,322 1,918
NewMarket Corp. 4,212 1,763
Greif Inc. Class A 26,137 1,580
Compass Minerals
International Inc. 18,799 1,256
Sensient Technologies
Corp. 16,995 1,226
69,015Real Estate (9.2%) ^ Omega Healthcare
Investors Inc. 199,246 6,350
Jones Lang LaSalle Inc. 45,848 5,589
Medical Properties Trust
Inc. 368,503 4,850
Senior Housing Properties
Trust 240,487 4,742
Hospitality Properties
Trust 166,303 4,550
Cousins Properties Inc. 424,088 3,965
Camden Property Trust 41,703 3,732
Life Storage Inc. 47,073 3,464
LaSalle Hotel Properties 114,623 3,253
CoreCivic Inc. 119,615 3,206
National Retail Properties
Inc. 63,415 2,653
American Campus
Communities Inc. 55,652 2,648
CyrusOne Inc. 37,942 2,392
Highwoods Properties Inc. 43,380 2,266
Rayonier Inc. 71,735 2,081
EPR Properties 25,297 1,762
Sabra Health Care REIT Inc. 79,213 1,731
GEO Group Inc. 60,469 1,671
Washington Prime Group
Inc. 187,641 1,567
Taubman Centers Inc. 27,652 1,445* JBG SMITH Properties 43,600 1,427
* Quality Care Properties Inc. 94,762 1,300
Healthcare Realty Trust Inc. 37,497 1,248
Corporate Office
Properties Trust 31,208 1,041
Urban Edge Properties 37,105 933
Alexander & Baldwin Inc. 21,009 912
Mack-Cali Realty Corp. 35,477 812
Tanger Factory Outlet
Centers Inc. 30,275 708
Potlatch Corp. 13,980 668
72,966Telecommunication Services (0.5%) Telephone & Data
Systems Inc. 94,962 2,783^,* Frontier Communications
Corp. 79,179 1,067
3,850Utilities (9.1%) Atmos Energy Corp. 106,592 9,384
UGI Corp. 175,267 8,660
OGE Energy Corp. 202,177 7,222
Great Plains Energy Inc. 218,275 6,699
Vectren Corp. 83,982 5,510
IDACORP Inc. 51,016 4,539
ONE Gas Inc. 53,097 3,995
New Jersey Resources
Corp. 87,511 3,820
Hawaiian Electric
Industries Inc. 110,098 3,679
PNM Resources Inc. 80,642 3,419
NorthWestern Corp. 49,046 2,958
Westar Energy Inc.
Class A 57,523 2,952
Aqua America Inc. 86,306 2,883
National Fuel Gas Co. 39,221 2,274
WGL Holdings Inc. 26,965 2,272
Black Hills Corp. 21,651 1,524
71,790
Total Common Stocks (Cost $751,523) 788,103
35

S&P Mid-Cap 400 Value Index Fund
Temporary Cash Investments (1.3%)1
Money Market Fund (1.3%)2,3 Vanguard Market
Liquidity Fund, 1.224% 100 10,012
Face
Amount
($000)
U.S. Government and Agency Obligations (0.0%) 4 United States
Treasury Bill,
0.990%, 9/21/17 200 200
Total Temporary Cash Investments (Cost $10,212) 10,212
Total Investments (100.9%) (Cost $761,735) 798,315
Amount
($000)
Other Assets and Liabilities (-0.9%)
Other Assets Investment in Vanguard 52
Receivables for Accrued Income 1,195
Receivables for Capital Shares Issued 1,421
Variation Margin Receivable—
Futures Contracts 27
Total Other Assets 2,695
Liabilities Payables for Investment Securities
Purchased (1,511)
Collateral for Securities on Loan (8,067)
Payables for Capital Shares Redeemed (56)
Payables to Vanguard (181)
Other Liabilities (7)
Total Liabilities (9,822)
Net Assets (100%) 791,188
Paid-in Capital 776,314
Undistributed Net Investment Income 7,329
Accumulated Net Realized Losses (29,059)
Unrealized Appreciation (Depreciation)
Investment Securities 36,580
Futures Contracts 24
Net Assets 791,188
ETF Shares—Net Assets
Applicable to 5,625,000 outstanding $.001 par value shares of beneficial interest (unlimited authorization) 631,753
Net Asset Value Per Share— ETF Shares $112.31
Institutional Shares—Net Assets
Applicable to 708,448 outstanding $.001 par value shares of beneficial interest (unlimited authorization) 159,435
Net Asset Value Per Share— Institutional Shares $225.05
• See Note A in Notes to Financial Statements.
^ Includes partial security positions on loan to broker-dealers. The total value of securities on loan is $7,758,000.
* Non-income-producing security.
1 The fund invests a portion of its cash reserves in equity markets through the use of index futures contracts. After giving effect to futures investments, the fund’s effective common stock and temporary cash investment positions represent 100.0% and 0.9%, respectively, of net assets.
2 Affiliated money market fund available only to Vanguard funds and certain trusts and accounts managed by Vanguard. Rate shown is the 7-day yield.
3 Includes $8,067,000 of collateral received for securities on loan.
4 Securities with a value of $150,000 have been segregated as initial margin for open futures contracts.
Market
Value•
Shares ($000)
At August 31, 2017, net assets consisted of: Amount
($000)
36
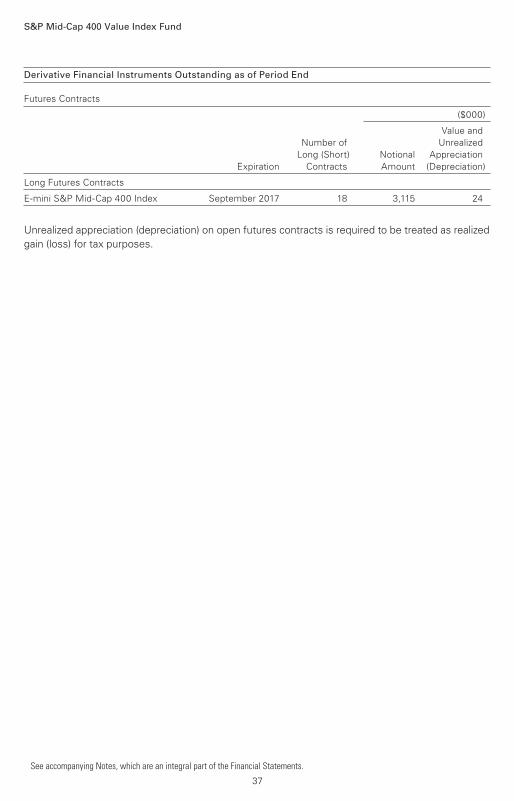
S&P Mid-Cap 400 Value Index Fund
See accompanying Notes, which are an integral part of the Financial Statements.
Derivative Financial Instruments Outstanding as of Period End
Futures Contracts
($000)
Value and
Number of Unrealized
Long (Short) Notional Appreciation
Expiration Contracts Amount (Depreciation)
Long Futures Contracts
E-mini S&P Mid-Cap 400 Index September 2017 18 3,115 24
Unrealized appreciation (depreciation) on open futures contracts is required to be treated as realized
gain (loss) for tax purposes.
37
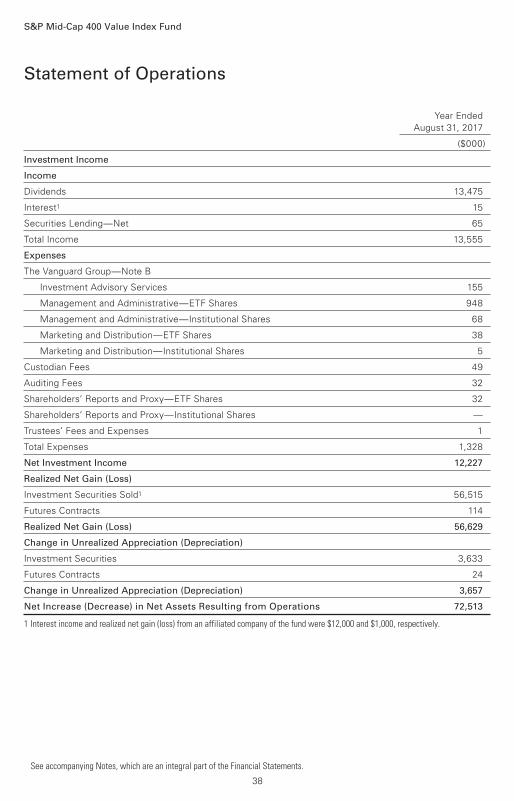
Year Ended
August 31, 2017
($000)
Investment Income
Income
Dividends 13,475
Interest1 15
Securities Lending—Net 65
Total Income 13,555
Expenses
The Vanguard Group—Note B
Investment Advisory Services 155
Management and Administrative—ETF Shares 948
Management and Administrative—Institutional Shares 68
Marketing and Distribution—ETF Shares 38
Marketing and Distribution—Institutional Shares 5
Custodian Fees 49
Auditing Fees 32
Shareholders’ Reports and Proxy—ETF Shares 32
Shareholders’ Reports and Proxy—Institutional Shares —
Trustees’ Fees and Expenses 1
Total Expenses 1,328
Net Investment Income 12,227
Realized Net Gain (Loss)
Investment Securities Sold1 56,515
Futures Contracts 114
Realized Net Gain (Loss) 56,629
Change in Unrealized Appreciation (Depreciation)
Investment Securities 3,633
Futures Contracts 24
Change in Unrealized Appreciation (Depreciation) 3,657
Net Increase (Decrease) in Net Assets Resulting from Operations 72,513
1 Interest income and realized net gain (loss) from an affiliated company of the fund were $12,000 and $1,000, respectively.
Statement of Operations
S&P Mid-Cap 400 Value Index Fund
See accompanying Notes, which are an integral part of the Financial Statements.
38
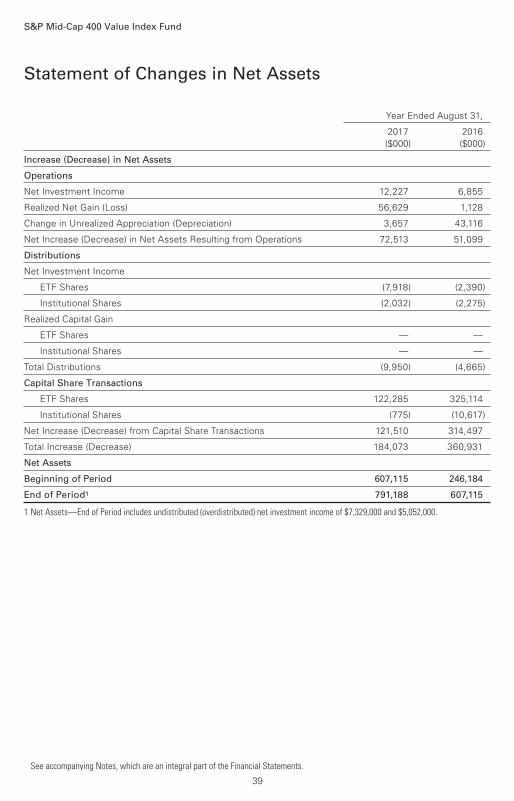
Statement of Changes in Net Assets
S&P Mid-Cap 400 Value Index Fund
See accompanying Notes, which are an integral part of the Financial Statements.
Year Ended August 31,
2017 2016
($000) ($000)
Increase (Decrease) in Net Assets
Operations
Net Investment Income 12,227 6,855
Realized Net Gain (Loss) 56,629 1,128
Change in Unrealized Appreciation (Depreciation) 3,657 43,116
Net Increase (Decrease) in Net Assets Resulting from Operations 72,513 51,099
Distributions
Net Investment Income
ETF Shares (7,918) (2,390)
Institutional Shares (2,032) (2,275)
Realized Capital Gain
ETF Shares — —
Institutional Shares — —
Total Distributions (9,950) (4,665)
Capital Share Transactions
ETF Shares 122,285 325,114
Institutional Shares (775) (10,617)
Net Increase (Decrease) from Capital Share Transactions 121,510 314,497
Total Increase (Decrease) 184,073 360,931
Net Assets
Beginning of Period 607,115 246,184
End of Period1 791,188 607,115
1 Net Assets—End of Period includes undistributed (overdistributed) net investment income of $7,329,000 and $5,052,000.
39
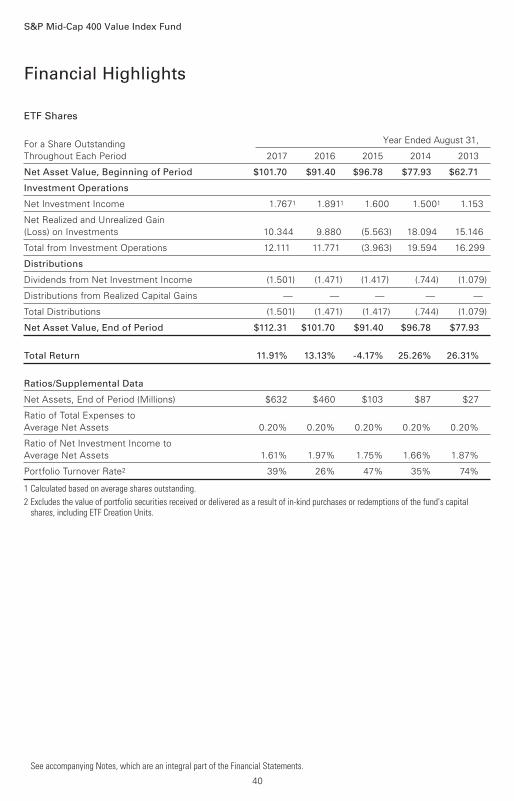
ETF Shares
For a Share Outstanding Year Ended August 31,
Throughout Each Period 2017 2016 2015 2014 2013
Net Asset Value, Beginning of Period $101.70 $91.40 $96.78 $77.93 $62.71
Investment Operations
Net Investment Income 1.7671 1.8911 1.600 1.5001 1.153
Net Realized and Unrealized Gain
(Loss) on Investments 10.344 9.880 (5.563) 18.094 15.146
Total from Investment Operations 12.111 11.771 (3.963) 19.594 16.299
Distributions
Dividends from Net Investment Income (1.501) (1.471) (1.417) (.744) (1.079)
Distributions from Realized Capital Gains — — — — —
Total Distributions (1.501) (1.471) (1.417) (.744) (1.079)
Net Asset Value, End of Period $112.31 $101.70 $91.40 $96.78 $77.93
Total Return 11.91% 13.13% -4.17% 25.26% 26.31%
Ratios/Supplemental Data
Net Assets, End of Period (Millions) $632 $460 $103 $87 $27
Ratio of Total Expenses to
Average Net Assets 0.20% 0.20% 0.20% 0.20% 0.20%
Ratio of Net Investment Income to
Average Net Assets 1.61% 1.97% 1.75% 1.66% 1.87%
Portfolio Turnover Rate2 39% 26% 47% 35% 74%
1 Calculated based on average shares outstanding.
2 Excludes the value of portfolio securities received or delivered as a result of in-kind purchases or redemptions of the fund’s capital shares, including ETF Creation Units.
Financial Highlights
See accompanying Notes, which are an integral part of the Financial Statements.
S&P Mid-Cap 400 Value Index Fund
40
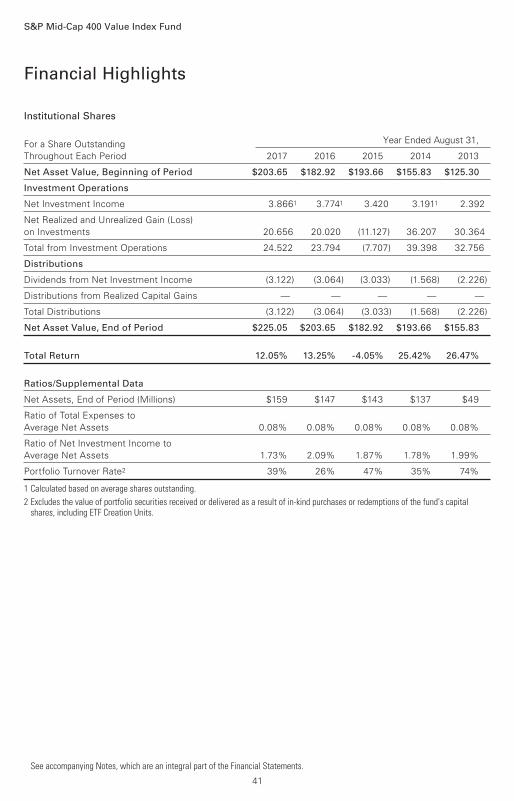
Institutional Shares
For a Share Outstanding Year Ended August 31,
Throughout Each Period 2017 2016 2015 2014 2013
Net Asset Value, Beginning of Period $203.65 $182.92 $193.66 $155.83 $125.30
Investment Operations
Net Investment Income 3.8661 3.7741 3.420 3.1911 2.392
Net Realized and Unrealized Gain (Loss)
on Investments 20.656 20.020 (11.127) 36.207 30.364
Total from Investment Operations 24.522 23.794 (7.707) 39.398 32.756
Distributions
Dividends from Net Investment Income (3.122) (3.064) (3.033) (1.568) (2.226)
Distributions from Realized Capital Gains — — — — —
Total Distributions (3.122) (3.064) (3.033) (1.568) (2.226)
Net Asset Value, End of Period $225.05 $203.65 $182.92 $193.66 $155.83
Total Return 12.05% 13.25% -4.05% 25.42% 26.47%
Ratios/Supplemental Data
Net Assets, End of Period (Millions) $159 $147 $143 $137 $49
Ratio of Total Expenses to
Average Net Assets 0.08% 0.08% 0.08% 0.08% 0.08%
Ratio of Net Investment Income to
Average Net Assets 1.73% 2.09% 1.87% 1.78% 1.99%
Portfolio Turnover Rate2 39% 26% 47% 35% 74%
1 Calculated based on average shares outstanding.
2 Excludes the value of portfolio securities received or delivered as a result of in-kind purchases or redemptions of the fund’s capital shares, including ETF Creation Units.
Financial Highlights
See accompanying Notes, which are an integral part of the Financial Statements.
S&P Mid-Cap 400 Value Index Fund
41
Notes to Financial Statements
S&P Mid-Cap 400 Value Index Fund
Vanguard S&P Mid-Cap 400 Value Index Fund is registered under the Investment Company Act of
1940 as an open-end investment company, or mutual fund. The fund offers two classes of shares:
ETF Shares Shares and Institutional Shares. ETF Shares are listed for trading on NYSE Arca; they
can be purchased and sold through a broker. Institutional Shares are designed for investors who
meet certain administrative, service, and account-size criteria.
A. The following significant accounting policies conform to generally accepted accounting
principles for U.S. investment companies. The fund consistently follows such policies in preparing
its financial statements.
1. Security Valuation: Securities are valued as of the close of trading on the New York Stock
Exchange (generally 4 p.m., Eastern time) on the valuation date. Equity securities are valued at
the latest quoted sales prices or official closing prices taken from the primary market in which
each security trades; such securities not traded on the valuation date are valued at the mean of
the latest quoted bid and asked prices. Securities for which market quotations are not readily
available, or whose values have been materially affected by events occurring before the fund’s
pricing time but after the close of the securities’ primary markets, are valued by methods deemed
by the board of trustees to represent fair value. Investments in Vanguard Market Liquidity Fund are
valued at that fund’s net asset value. Temporary cash investments are valued using the latest bid
prices or using valuations based on a matrix system (which considers such factors as security
prices, yields, maturities, and ratings), both as furnished by independent pricing services.
2. Futures Contracts: The fund uses index futures contracts to a limited extent, with the objectives
of maintaining full exposure to the stock market, enhancing returns, maintaining liquidity, and
minimizing transaction costs. The fund may purchase futures contracts to immediately invest
incoming cash in the market, or sell futures in response to cash outflows, thereby simulating a fully
invested position in the underlying index while maintaining a cash balance for liquidity. The fund
may seek to enhance returns by using futures contracts instead of the underlying securities when
futures are believed to be priced more attractively than the underlying securities. The primary risks
associated with the use of futures contracts are imperfect correlation between changes in market
values of stocks held by the fund and the prices of futures contracts, and the possibility of an illiquid
market. Counterparty risk involving futures is mitigated because a regulated clearinghouse is the
counterparty instead of the clearing broker. To further mitigate counterparty risk, the fund trades
futures contracts on an exchange, monitors the financial strength of its clearing brokers and
clearinghouse, and has entered into clearing agreements with its clearing brokers. The
clearinghouse imposes initial margin requirements to secure the fund’s performance and requires
daily settlement of variation margin representing changes in the market value of each contract.
Futures contracts are valued at their quoted daily settlement prices. The notional amounts of the
contracts are not recorded in the Statement of Net Assets. Fluctuations in the value of the contracts
are recorded in the Statement of Net Assets as an asset (liability) and in the Statement of
Operations as unrealized appreciation (depreciation) until the contracts are closed, when
they are recorded as realized futures gains (losses).
During the year ended August 31, 2017, the fund’s average investments in long and short futures
contracts represented less than 1% and 0% of net assets, respectively, based on the average of
the notional amounts at each quarter-end during the period.
42

S&P Mid-Cap 400 Value Index Fund
3. Federal Income Taxes: The fund intends to continue to qualify as a regulated investment
company and distribute all of its taxable income. Management has analyzed the fund’s tax
positions taken for all open federal income tax years (August 31, 2014–2017), and has concluded
that no provision for federal income tax is required in the fund’s financial statements.
4. Distributions: Distributions to shareholders are recorded on the ex-dividend date.
5. Securities Lending: To earn additional income, the fund lends its securities to qualified
institutional borrowers. Security loans are subject to termination by the fund at any time, and
are required to be secured at all times by collateral in an amount at least equal to the market value
of securities loaned. Daily market fluctuations could cause the value of loaned securities to be more
or less than the value of the collateral received. When this occurs, the collateral is adjusted and
settled on the next business day. The fund further mitigates its counterparty risk by entering into
securities lending transactions only with a diverse group of prequalified counterparties, monitoring
their financial strength, and entering into master securities lending agreements with its
counterparties. The master securities lending agreements provide that, in the event of a
counterparty’s default (including bankruptcy), the fund may terminate any loans with that borrower,
determine the net amount owed, and sell or retain the collateral up to the net amount owed to the
fund; however, such actions may be subject to legal proceedings. While collateral mitigates
counterparty risk, in the event of a default, the fund may experience delays and costs in recovering
the securities loaned. The fund invests cash collateral received in Vanguard Market Liquidity Fund,
and records a liability in the Statement of Net Assets for the return of the collateral, during the
period the securities are on loan. Securities lending income represents fees charged to borrowers
plus income earned on invested cash collateral, less expenses associated with the loan. During
the term of the loan, the fund is entitled to all distributions made on or in respect of the
loaned securities.
6. Credit Facility: The fund and certain other funds managed by The Vanguard Group (“Vanguard”)
participate in a $3.1 billion committed credit facility provided by a syndicate of lenders pursuant to
a credit agreement that may be renewed annually; each fund is individually liable for its borrowings,
if any, under the credit facility. Borrowings may be utilized for temporary and emergency purposes,
and are subject to the fund’s regulatory and contractual borrowing restrictions. The participating
funds are charged administrative fees and an annual commitment fee of 0.10% of the undrawn
amount of the facility; these fees are allocated to the funds based on a method approved by the
fund’s board of trustees and included in Management and Administrative expenses on the fund’s
Statement of Operations. Any borrowings under this facility bear interest at a rate based upon the
higher of the one-month London Interbank Offered Rate, federal funds effective rate, or overnight
bank funding rate plus an agreed-upon spread.
The fund had no borrowings outstanding at August 31,2017, or at any time during the period
then ended.
7. Other: Dividend income is recorded on the ex-dividend date. Interest income includes income
distributions received from Vanguard Market Liquidity Fund and is accrued daily. Premiums and
discounts on debt securities purchased are amortized and accreted, respectively, to interest income
over the lives of the respective securities. Security transactions are accounted for on the date
securities are bought or sold. Costs used to determine realized gains (losses) on the sale of
investment securities are those of the specific securities sold.
43
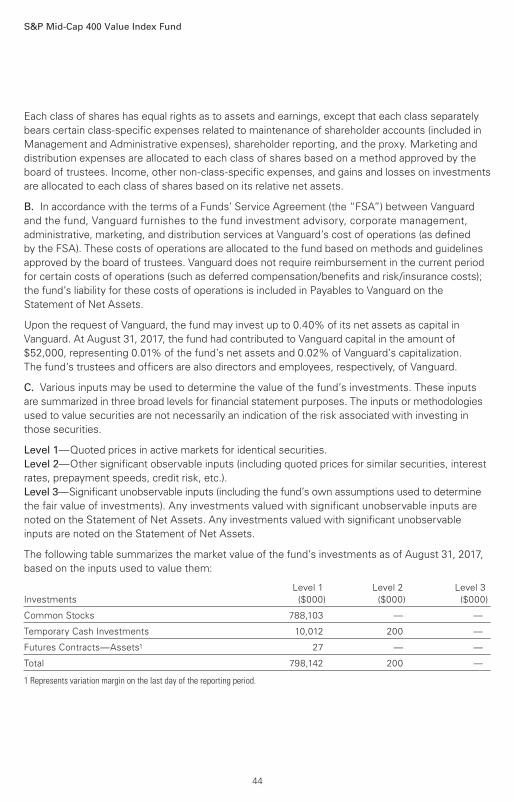
S&P Mid-Cap 400 Value Index Fund
Each class of shares has equal rights as to assets and earnings, except that each class separately
bears certain class-specific expenses related to maintenance of shareholder accounts (included in
Management and Administrative expenses), shareholder reporting, and the proxy. Marketing and
distribution expenses are allocated to each class of shares based on a method approved by the
board of trustees. Income, other non-class-specific expenses, and gains and losses on investments
are allocated to each class of shares based on its relative net assets.
B. In accordance with the terms of a Funds’ Service Agreement (the “FSA”) between Vanguard
and the fund, Vanguard furnishes to the fund investment advisory, corporate management,
administrative, marketing, and distribution services at Vanguard’s cost of operations (as defined
by the FSA). These costs of operations are allocated to the fund based on methods and guidelines
approved by the board of trustees. Vanguard does not require reimbursement in the current period
for certain costs of operations (such as deferred compensation/benefits and risk/insurance costs);
the fund’s liability for these costs of operations is included in Payables to Vanguard on the
Statement of Net Assets.
Upon the request of Vanguard, the fund may invest up to 0.40% of its net assets as capital in
Vanguard. At August 31, 2017, the fund had contributed to Vanguard capital in the amount of
$52,000, representing 0.01% of the fund’s net assets and 0.02% of Vanguard’s capitalization.
The fund’s trustees and officers are also directors and employees, respectively, of Vanguard.
C. Various inputs may be used to determine the value of the fund’s investments. These inputs
are summarized in three broad levels for financial statement purposes. The inputs or methodologies
used to value securities are not necessarily an indication of the risk associated with investing in
those securities.
Level 1—Quoted prices in active markets for identical securities.
Level 2—Other significant observable inputs (including quoted prices for similar securities, interest
rates, prepayment speeds, credit risk, etc.).
Level 3—Significant unobservable inputs (including the fund’s own assumptions used to determine
the fair value of investments). Any investments valued with significant unobservable inputs are
noted on the Statement of Net Assets. Any investments valued with significant unobservable
inputs are noted on the Statement of Net Assets.
The following table summarizes the market value of the fund’s investments as of August 31, 2017,
based on the inputs used to value them:
Level 1 Level 2 Level 3
Investments ($000) ($000) ($000)
Common Stocks 788,103 — —
Temporary Cash Investments 10,012 200 —
Futures Contracts—Assets1 27 — —
Total 798,142 200 —
1 Represents variation margin on the last day of the reporting period.
44

S&P Mid-Cap 400 Value Index Fund
D. Distributions are determined on a tax basis and may differ from net investment income and
realized capital gains for financial reporting purposes. Differences may be permanent or temporary.
Permanent differences are reclassified among capital accounts in the financial statements to reflect
their tax character. Temporary differences arise when certain items of income, expense, gain, or
loss are recognized in different periods for financial statement and tax purposes. These differences
will reverse at some time in the future. Differences in classification may also result from the
treatment of short-term gains as ordinary income for tax purposes.
During the year ended August 31, 2017, the fund realized $64,703,000 of net capital gains resulting
from in-kind redemptions—in which shareholders exchanged fund shares for securities held by the
fund rather than for cash. Because such gains are not taxable to the fund, and are not distributed
to shareholders, they have been reclassified from accumulated net realized losses to paid-in capital.
For tax purposes, at August 31, 2017, the fund had $7,446,000 of ordinary income available for
distribution. The fund had available capital losses totaling $29,036,000 that may be carried forward
indefinitely to offset future net capital gains.
At August 31, 2017, the cost of investment securities for tax purposes was $761,735,000. Net
unrealized appreciation of investment securities for tax purposes was $36,580,000, consisting
of unrealized gains of $82,664,000 on securities that had risen in value since their purchase and
$46,084,000 in unrealized losses on securities that had fallen in value since their purchase.
E. During the year ended August 31, 2017, the fund purchased $676,721,000 of investment
securities and sold $554,434,000 of investment securities, other than temporary cash investments.
Purchases and sales include $346,297,000 and $267,712,000, respectively, in connection with
in-kind purchases and redemptions of the fund’s capital shares.
The fund purchased securities from and sold securities to other Vanguard funds or accounts
managed by Vanguard or its affiliates, in accordance with procedures adopted by the board of
trustees in compliance with Rule 17a-7 of the Investment Company Act of 1940. For the year
ended August 31, 2017, such purchases and sales were $79,960,000 and $65,738,000,
respectively; these amounts are included in the purchases and sales of investment securities
noted above.
45
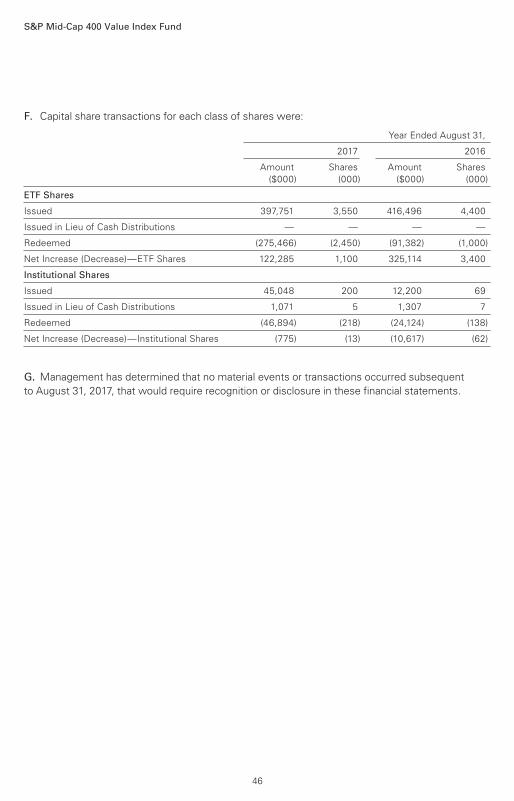
S&P Mid-Cap 400 Value Index Fund
F. Capital share transactions for each class of shares were:
Year Ended August 31,
2017 2016
Amount Shares Amount Shares
($000) (000) ($000) (000)
ETF Shares
Issued 397,751 3,550 416,496 4,400
Issued in Lieu of Cash Distributions — — — —
Redeemed (275,466) (2,450) (91,382) (1,000)
Net Increase (Decrease)—ETF Shares 122,285 1,100 325,114 3,400
Institutional Shares
Issued 45,048 200 12,200 69
Issued in Lieu of Cash Distributions 1,071 5 1,307 7
Redeemed (46,894) (218) (24,124) (138)
Net Increase (Decrease)—Institutional Shares (775) (13) (10,617) (62)
G. Management has determined that no material events or transactions occurred subsequent
to August 31, 2017, that would require recognition or disclosure in these financial statements.
46

S&P Mid-Cap 400 Growth Index Fund
Fund ProfileAs of August 31, 2017
1 The expense ratios shown are from the prospectus dated December 23, 2016, and represent estimated costs for the current fiscal year. For the fiscal year ended August 31, 2017, the expense ratios were 0.20% for ETF Shares and 0.08% for Institutional Shares.
47
Volatility Measures
S&P
MidCap
400 Growth
Index
DJ
U.S. Total
Market
FA Index
R-Squared 1.00 0.82
Beta 1.00 0.93
These measures show the degree and timing of the fund’s fluctuations compared with the indexes over 36 months.
Portfolio Characteristics
Fund
S&P
MidCap
400
Growth
Index
DJ
U.S.
Total
Market
FA
Index
Number of Stocks 247 242 3,769
Median Market Cap $5.6B $5.6B $63.1B
Price/Earnings Ratio 26.3x 26.3x 21.6x
Price/Book Ratio 3.4x 3.4x 2.8x
Return on Equity 14.3% 14.3% 15.1%
Earnings Growth
Rate 10.8% 10.7% 9.4%
Dividend Yield 1.3% 1.3% 1.8%
Foreign Holdings 0.0% 0.0% 0.0%
Turnover Rate 40% — —
Short-Term Reserves -0.2% — —
Share-Class Characteristics
ETFShares
InstitutionalShares
Ticker Symbol IVOG VMFGXExpense Ratio1 0.20% 0.08%
30-Day SEC Yield 1.11% 1.22%
Ten Largest Holdings (% of total net assets)
MSCI Inc. Financial Exchanges
& Data 1.2%
Take-Two Interactive
Software Inc.
Home Entertainment
Software 1.2
Huntington Ingalls
Industries Inc.
Aerospace &
Defense 1.2
NVR Inc. Homebuilding 1.1
Cognex Corp. Electronic Equipment
& Instruments 1.1
CDK Global Inc. Application Software 1.1
Broadridge Financial
Solutions Inc.
Data Processing &
Outsourced Services 1.1
IDEX Corp. Industrial Machinery 1.1
Domino's Pizza Inc. Restaurants 1.0
Jack Henry & Associates
Inc.
Data Processing &
Outsourced Services 0.9
Top Ten 11.0%
The holdings listed exclude any temporary cash investments andequity index products.
Investment Focus
Market Cap
Value
Large
Medium
Small
Blend Growth Style
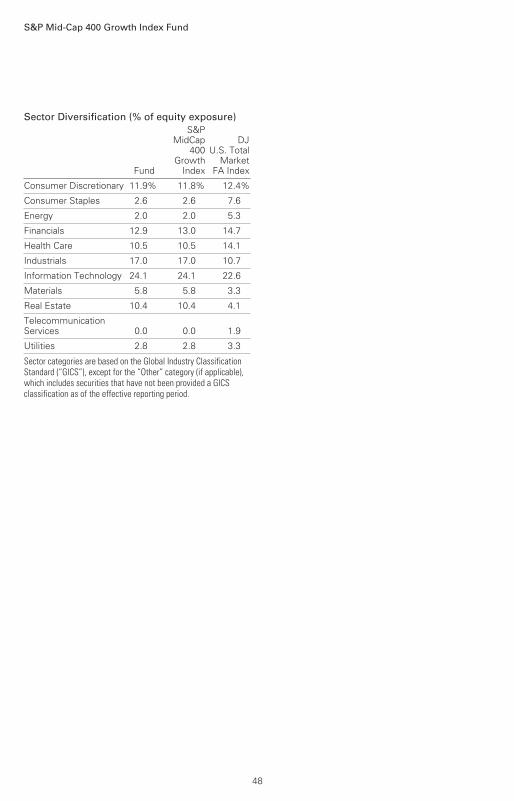
S&P Mid-Cap 400 Growth Index Fund
Sector Diversification (% of equity exposure)
Fund
S&PMidCap
400Growth
Index
DJU.S. Total
MarketFA Index
Consumer Discretionary 11.9% 11.8% 12.4%
Consumer Staples 2.6 2.6 7.6
Energy 2.0 2.0 5.3
Financials 12.9 13.0 14.7
Health Care 10.5 10.5 14.1
Industrials 17.0 17.0 10.7
Information Technology 24.1 24.1 22.6
Materials 5.8 5.8 3.3
Real Estate 10.4 10.4 4.1
TelecommunicationServices 0.0 0.0 1.9
Utilities 2.8 2.8 3.3
Sector categories are based on the Global Industry ClassificationStandard (“GICS”), except for the “Other” category (if applicable),which includes securities that have not been provided a GICSclassification as of the effective reporting period.
48

All of the returns in this report represent past performance, which is not a guarantee of future results that may be achieved by the fund. (Current performance may be lower or higher thanthe performance data cited. For performance data current to the most recent month-end, visitour website at vanguard.com/performance.) Note, too, that both investment returns and principal value can fluctuate widely, so an investor’s shares, when sold, could be worth more or less than their original cost. The returns shown do not reflect taxes that a shareholder would pay
on fund distributions or on the sale of fund shares.
Performance Summary
S&P Mid-Cap 400 Growth Index Fund
See Financial Highlights for dividend and capital gains information.
49
Cumulative Performance: September 7, 2010, Through August 31, 2017Initial Investment of $10,000
2017201620152014201320122011
$30,000
7,000
25,472
Average Annual Total Returns
Periods Ended August 31, 2017
OneYear
FiveYears
SinceInception
(9/7/2010)
Final Valueof a $10,000Investment
S&P Mid-Cap 400 Growth IndexFund*ETF Shares Net Asset Value 11.67% 13.41% 14.33% $25,472
S&P Mid-Cap 400 Growth IndexFund*ETF Shares Market Price 11.59 13.39 14.33 25,466
• • • • • • • • S&P MidCap 400 Growth Index 11.86 13.61 14.53 25,785
– – – – Mid-Cap Growth Funds Average 15.51 12.14 12.61 22,916________ Dow Jones U.S. Total Stock Market
Float Adjusted Index 16.05 14.19 14.71 26,064
Mid-Cap Growth Funds Average: Derived from data provided by Lipper, a Thomson Reuters Company."Since Inception" performance is calculated from the ETF Shares’ inception date for both the fund and its comparative standards.
OneYear
FiveYears
SinceInception
(3/28/2011)
Final Valueof a $5,000,000
Investment
S&P Mid-Cap 400 Growth Index FundInstitutional Shares 11.80% 13.54% 11.03% $9,795,946
S&P MidCap 400 Growth Index 11.86 13.61 11.09 9,830,756
Dow Jones U.S. Total Stock Market FloatAdjusted Index 16.05 14.19 12.40 10,597,716
"Since Inception" performance is calculated from the Institutional Shares’ inception date for both the fund and its comparative standards. Institutional Shares were first issued on December 15, 2010, and the sole shareholder redeemed shortly thereafter. Institutional Shares were next issued on March 28, 2011. The total returns shown are based on the period beginning March 28, 2011.
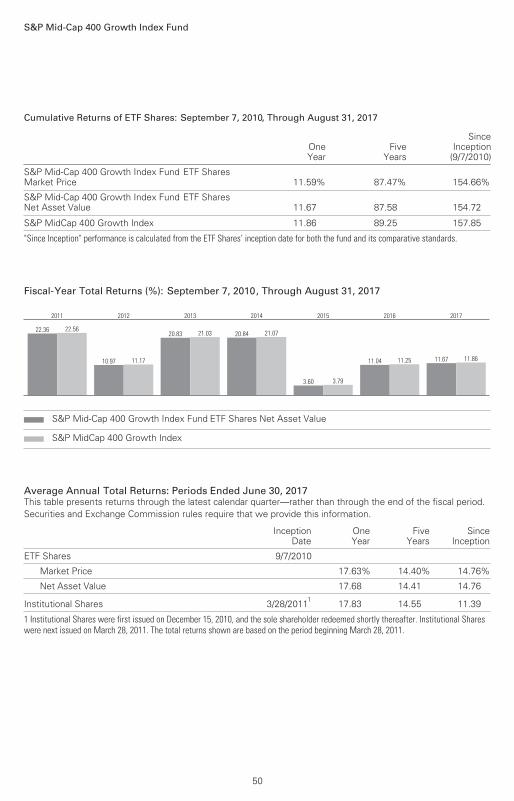
S&P Mid-Cap 400 Growth Index Fund
50
Cumulative Returns of ETF Shares: September 7, 2010, Through August 31, 2017
OneYear
FiveYears
SinceInception
(9/7/2010)
S&P Mid-Cap 400 Growth Index Fund ETF SharesMarket Price 11.59% 87.47% 154.66%
S&P Mid-Cap 400 Growth Index Fund ETF SharesNet Asset Value 11.67 87.58 154.72
S&P MidCap 400 Growth Index 11.86 89.25 157.85
"Since Inception" performance is calculated from the ETF Shares’ inception date for both the fund and its comparative standards.
Fiscal-Year Total Returns (%): September 7, 2010, Through August 31, 2017
22.36 22.56
2011
10.97 11.17
2012
20.83 21.03
2013
20.84 21.07
2014
3.60 3.79
2015
11.04 11.25
2016
11.67 11.86
2017
S&P Mid-Cap 400 Growth Index Fund ETF Shares Net Asset Value
S&P MidCap 400 Growth Index
Average Annual Total Returns: Periods Ended June 30, 2017This table presents returns through the latest calendar quarter—rather than through the end of the fiscal period.Securities and Exchange Commission rules require that we provide this information.
InceptionDate
OneYear
FiveYears
SinceInception
ETF Shares 9/7/2010
Market Price 17.63% 14.40% 14.76%
Net Asset Value 17.68 14.41 14.76
Institutional Shares 3/28/20111 17.83 14.55 11.39
1 Institutional Shares were first issued on December 15, 2010, and the sole shareholder redeemed shortly thereafter. Institutional Shareswere next issued on March 28, 2011. The total returns shown are based on the period beginning March 28, 2011.
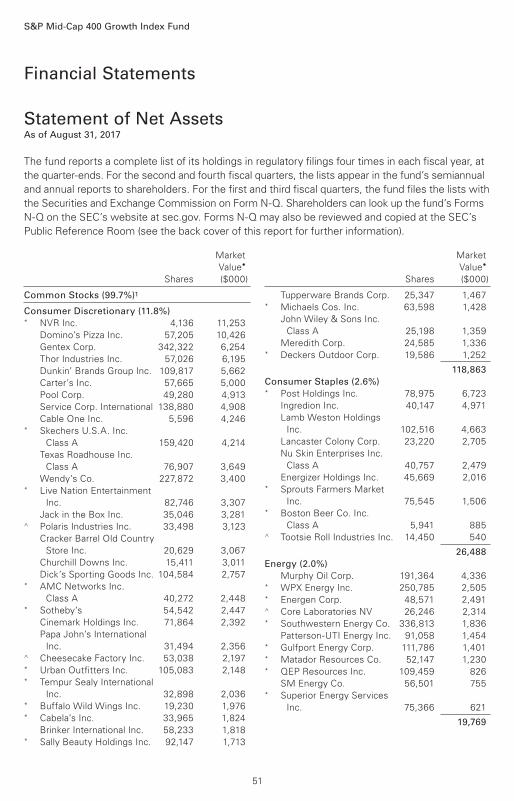
Market
Value•
Shares ($000)
Market
Value•
Shares ($000)
Common Stocks (99.7%)1
Consumer Discretionary (11.8%) * NVR Inc. 4,136 11,253
Domino’s Pizza Inc. 57,205 10,426
Gentex Corp. 342,322 6,254
Thor Industries Inc. 57,026 6,195
Dunkin’ Brands Group Inc. 109,817 5,662
Carter’s Inc. 57,665 5,000
Pool Corp. 49,280 4,913
Service Corp. International 138,880 4,908
Cable One Inc. 5,596 4,246* Skechers U.S.A. Inc.
Class A 159,420 4,214
Texas Roadhouse Inc.
Class A 76,907 3,649
Wendy’s Co. 227,872 3,400* Live Nation Entertainment
Inc. 82,746 3,307
Jack in the Box Inc. 35,046 3,281^ Polaris Industries Inc. 33,498 3,123
Cracker Barrel Old Country
Store Inc. 20,629 3,067
Churchill Downs Inc. 15,411 3,011
Dick’s Sporting Goods Inc. 104,584 2,757* AMC Networks Inc.
Class A 40,272 2,448* Sotheby’s 54,542 2,447
Cinemark Holdings Inc. 71,864 2,392
Papa John’s International
Inc. 31,494 2,356^ Cheesecake Factory Inc. 53,038 2,197* Urban Outfitters Inc. 105,083 2,148* Tempur Sealy International
Inc. 32,898 2,036* Buffalo Wild Wings Inc. 19,230 1,976* Cabela’s Inc. 33,965 1,824
Brinker International Inc. 58,233 1,818* Sally Beauty Holdings Inc. 92,147 1,713
Tupperware Brands Corp. 25,347 1,467* Michaels Cos. Inc. 63,598 1,428
John Wiley & Sons Inc.
Class A 25,198 1,359
Meredith Corp. 24,585 1,336* Deckers Outdoor Corp. 19,586 1,252
118,863Consumer Staples (2.6%) * Post Holdings Inc. 78,975 6,723
Ingredion Inc. 40,147 4,971
Lamb Weston Holdings
Inc. 102,516 4,663
Lancaster Colony Corp. 23,220 2,705
Nu Skin Enterprises Inc.
Class A 40,757 2,479
Energizer Holdings Inc. 45,669 2,016* Sprouts Farmers Market
Inc. 75,545 1,506* Boston Beer Co. Inc.
Class A 5,941 885^ Tootsie Roll Industries Inc. 14,450 540
26,488Energy (2.0%) Murphy Oil Corp. 191,364 4,336* WPX Energy Inc. 250,785 2,505* Energen Corp. 48,571 2,491^ Core Laboratories NV 26,246 2,314* Southwestern Energy Co. 336,813 1,836
Patterson-UTI Energy Inc. 91,058 1,454* Gulfport Energy Corp. 111,786 1,401* Matador Resources Co. 52,147 1,230* QEP Resources Inc. 109,459 826
SM Energy Co. 56,501 755* Superior Energy Services
Inc. 75,366 621
19,769
Financial Statements
Statement of Net AssetsAs of August 31, 2017
The fund reports a complete list of its holdings in regulatory filings four times in each fiscal year, at
the quarter-ends. For the second and fourth fiscal quarters, the lists appear in the fund’s semiannual
and annual reports to shareholders. For the first and third fiscal quarters, the fund files the lists with
the Securities and Exchange Commission on Form N-Q. Shareholders can look up the fund’s Forms
N-Q on the SEC’s website at sec.gov. Forms N-Q may also be reviewed and copied at the SEC’s
Public Reference Room (see the back cover of this report for further information).
S&P Mid-Cap 400 Growth Index Fund
51
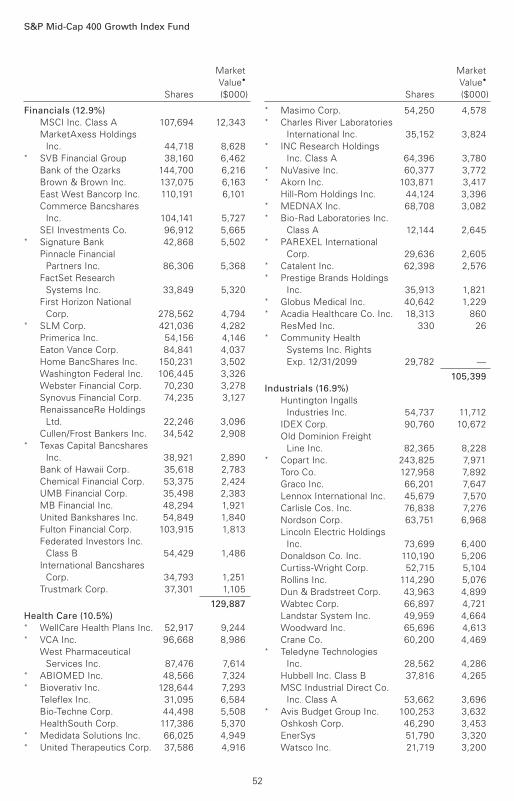
S&P Mid-Cap 400 Growth Index Fund
Market
Value•
Shares ($000)
Market
Value•
Shares ($000)
Financials (12.9%) MSCI Inc. Class A 107,694 12,343
MarketAxess Holdings
Inc. 44,718 8,628* SVB Financial Group 38,160 6,462
Bank of the Ozarks 144,700 6,216
Brown & Brown Inc. 137,075 6,163
East West Bancorp Inc. 110,191 6,101
Commerce Bancshares
Inc. 104,141 5,727
SEI Investments Co. 96,912 5,665* Signature Bank 42,868 5,502
Pinnacle Financial
Partners Inc. 86,306 5,368
FactSet Research
Systems Inc. 33,849 5,320
First Horizon National
Corp. 278,562 4,794* SLM Corp. 421,036 4,282
Primerica Inc. 54,156 4,146
Eaton Vance Corp. 84,841 4,037
Home BancShares Inc. 150,231 3,502
Washington Federal Inc. 106,445 3,326
Webster Financial Corp. 70,230 3,278
Synovus Financial Corp. 74,235 3,127
RenaissanceRe Holdings
Ltd. 22,246 3,096
Cullen/Frost Bankers Inc. 34,542 2,908* Texas Capital Bancshares
Inc. 38,921 2,890
Bank of Hawaii Corp. 35,618 2,783
Chemical Financial Corp. 53,375 2,424
UMB Financial Corp. 35,498 2,383
MB Financial Inc. 48,294 1,921
United Bankshares Inc. 54,849 1,840
Fulton Financial Corp. 103,915 1,813
Federated Investors Inc.
Class B 54,429 1,486
International Bancshares
Corp. 34,793 1,251
Trustmark Corp. 37,301 1,105
129,887Health Care (10.5%) * WellCare Health Plans Inc. 52,917 9,244* VCA Inc. 96,668 8,986
West Pharmaceutical
Services Inc. 87,476 7,614* ABIOMED Inc. 48,566 7,324* Bioverativ Inc. 128,644 7,293
Teleflex Inc. 31,095 6,584
Bio-Techne Corp. 44,498 5,508
HealthSouth Corp. 117,386 5,370* Medidata Solutions Inc. 66,025 4,949* United Therapeutics Corp. 37,586 4,916
* Masimo Corp. 54,250 4,578* Charles River Laboratories
International Inc. 35,152 3,824* INC Research Holdings
Inc. Class A 64,396 3,780* NuVasive Inc. 60,377 3,772* Akorn Inc. 103,871 3,417
Hill-Rom Holdings Inc. 44,124 3,396* MEDNAX Inc. 68,708 3,082* Bio-Rad Laboratories Inc.
Class A 12,144 2,645* PAREXEL International
Corp. 29,636 2,605* Catalent Inc. 62,398 2,576* Prestige Brands Holdings
Inc. 35,913 1,821* Globus Medical Inc. 40,642 1,229* Acadia Healthcare Co. Inc. 18,313 860
ResMed Inc. 330 26* Community Health
Systems Inc. Rights
Exp. 12/31/2099 29,782 —
105,399Industrials (16.9%) Huntington Ingalls
Industries Inc. 54,737 11,712
IDEX Corp. 90,760 10,672
Old Dominion Freight
Line Inc. 82,365 8,228* Copart Inc. 243,825 7,971
Toro Co. 127,958 7,892
Graco Inc. 66,201 7,647
Lennox International Inc. 45,679 7,570
Carlisle Cos. Inc. 76,838 7,276
Nordson Corp. 63,751 6,968
Lincoln Electric Holdings
Inc. 73,699 6,400
Donaldson Co. Inc. 110,190 5,206
Curtiss-Wright Corp. 52,715 5,104
Rollins Inc. 114,290 5,076
Dun & Bradstreet Corp. 43,963 4,899
Wabtec Corp. 66,897 4,721
Landstar System Inc. 49,959 4,664
Woodward Inc. 65,696 4,613
Crane Co. 60,200 4,469* Teledyne Technologies
Inc. 28,562 4,286
Hubbell Inc. Class B 37,816 4,265
MSC Industrial Direct Co.
Inc. Class A 53,662 3,696* Avis Budget Group Inc. 100,253 3,632
Oshkosh Corp. 46,290 3,453
EnerSys 51,790 3,320
Watsco Inc. 21,719 3,200
52

S&P Mid-Cap 400 Growth Index Fund
Market
Value•
Shares ($000)
Market
Value•
Shares ($000)
Knight Transportation Inc. 79,433 3,102
MSA Safety Inc. 37,445 2,728
Deluxe Corp. 38,137 2,645
Granite Construction Inc. 47,330 2,614* Genesee & Wyoming Inc.
Class A 34,378 2,357
EMCOR Group Inc. 33,800 2,232
Valmont Industries Inc. 13,966 2,005
Kennametal Inc. 44,377 1,553* Dycom Industries Inc. 18,978 1,531
GATX Corp. 20,598 1,248
HNI Corp. 30,675 1,124
AO Smith Corp. 519 29
170,108Information Technology (24.0%) * Take-Two Interactive
Software Inc. 123,498 12,077
Cognex Corp. 103,060 11,230
CDK Global Inc. 172,696 11,139
Broadridge Financial
Solutions Inc. 139,854 10,927
Jack Henry & Associates
Inc. 92,363 9,520* Cadence Design Systems
Inc. 239,443 9,408* IPG Photonics Corp. 44,789 7,873* Trimble Inc. 195,518 7,563
LogMeIn Inc. 62,774 7,181* Ultimate Software Group
Inc. 35,342 7,100* Tyler Technologies Inc. 40,141 6,936* Microsemi Corp. 137,606 6,933* Coherent Inc. 29,291 6,834* Fortinet Inc. 177,957 6,798* Zebra Technologies Corp. 62,870 6,481* PTC Inc. 96,351 5,396* NCR Corp. 144,418 5,276
Fair Isaac Corp. 36,897 5,194* Keysight Technologies Inc. 125,310 5,120
Littelfuse Inc. 27,038 5,033* WEX Inc. 45,998 5,020
Blackbaud Inc. 57,202 4,828
Teradyne Inc. 135,121 4,812* CoreLogic Inc. 100,851 4,737
MAXIMUS Inc. 77,247 4,695
Monolithic Power Systems
Inc. 45,233 4,583* Cirrus Logic Inc. 76,756 4,450
j2 Global Inc. 57,428 4,323
Brocade Communications
Systems Inc. 316,973 3,924* Integrated Device
Technology Inc. 158,298 3,912
Science Applications
International Corp. 52,014 3,843* Silicon Laboratories Inc. 50,394 3,825* CommVault Systems Inc. 49,793 3,040
Versum Materials Inc. 81,562 3,012* WebMD Health Corp. 44,953 2,987
InterDigital Inc. 41,269 2,945* ViaSat Inc. 41,020 2,609* ARRIS International plc 91,638 2,553
National Instruments Corp. 62,047 2,506* Manhattan Associates Inc. 55,372 2,328
Cypress Semiconductor
Corp. 164,516 2,252
Sabre Corp. 117,551 2,168
Belden Inc. 25,315 1,951* ACI Worldwide Inc. 66,258 1,508
Plantronics Inc. 27,624 1,178^,* 3D Systems Corp. 91,727 1,152
Convergys Corp. 48,148 1,132* Acxiom Corp. 42,306 985
241,277Materials (5.8%) Royal Gold Inc. 77,849 7,262
Steel Dynamics Inc. 193,040 6,650
Chemours Co. 118,467 5,813
Eagle Materials Inc. 57,838 5,625
Scotts Miracle-Gro Co. 52,524 5,021
RPM International Inc. 98,685 4,833
Sonoco Products Co. 61,569 2,971
AptarGroup Inc. 34,210 2,860
United States Steel Corp. 103,931 2,766
Valvoline Inc. 126,693 2,697
Minerals Technologies Inc. 41,766 2,673
Worthington Industries Inc. 52,288 2,612
NewMarket Corp. 6,054 2,534
Sensient Technologies
Corp. 32,699 2,359
Compass Minerals
International Inc. 18,283 1,221
Packaging Corp. of
America 332 38
57,935Real Estate (10.4%) Kilroy Realty Corp. 116,908 8,094
Liberty Property Trust 175,092 7,459
Douglas Emmett Inc. 183,996 7,168
Lamar Advertising Co.
Class A 99,487 6,622
DCT Industrial Trust Inc. 109,538 6,392
Camden Property Trust 55,348 4,953
CoreSite Realty Corp. 40,494 4,809
Weingarten Realty
Investors 140,745 4,509
53
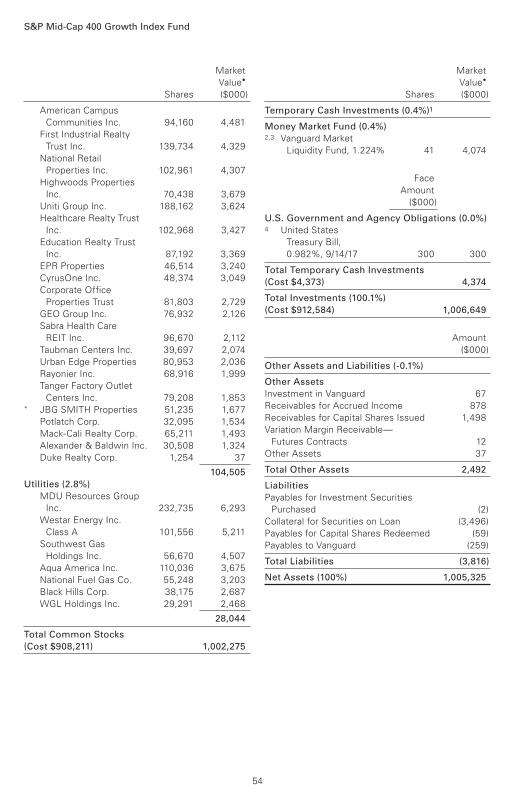
S&P Mid-Cap 400 Growth Index Fund
Market
Value•
Shares ($000)
Market
Value•
Shares ($000)
American Campus
Communities Inc. 94,160 4,481
First Industrial Realty
Trust Inc. 139,734 4,329
National Retail
Properties Inc. 102,961 4,307
Highwoods Properties
Inc. 70,438 3,679
Uniti Group Inc. 188,162 3,624
Healthcare Realty Trust
Inc. 102,968 3,427
Education Realty Trust
Inc. 87,192 3,369
EPR Properties 46,514 3,240
CyrusOne Inc. 48,374 3,049
Corporate Office
Properties Trust 81,803 2,729
GEO Group Inc. 76,932 2,126
Sabra Health Care
REIT Inc. 96,670 2,112
Taubman Centers Inc. 39,697 2,074
Urban Edge Properties 80,953 2,036
Rayonier Inc. 68,916 1,999
Tanger Factory Outlet
Centers Inc. 79,208 1,853* JBG SMITH Properties 51,235 1,677
Potlatch Corp. 32,095 1,534
Mack-Cali Realty Corp. 65,211 1,493
Alexander & Baldwin Inc. 30,508 1,324
Duke Realty Corp. 1,254 37
104,505Utilities (2.8%) MDU Resources Group
Inc. 232,735 6,293
Westar Energy Inc.
Class A 101,556 5,211
Southwest Gas
Holdings Inc. 56,670 4,507
Aqua America Inc. 110,036 3,675
National Fuel Gas Co. 55,248 3,203
Black Hills Corp. 38,175 2,687
WGL Holdings Inc. 29,291 2,468
28,044
Total Common Stocks (Cost $908,211) 1,002,275
Temporary Cash Investments (0.4%)1
Money Market Fund (0.4%)2,3 Vanguard Market
Liquidity Fund, 1.224% 41 4,074
Face
Amount
($000)
U.S. Government and Agency Obligations (0.0%) 4 United States
Treasury Bill,
0.982%, 9/14/17 300 300
Total Temporary Cash Investments (Cost $4,373) 4,374
Total Investments (100.1%) (Cost $912,584) 1,006,649
Amount
($000)
Other Assets and Liabilities (-0.1%)
Other Assets Investment in Vanguard 67
Receivables for Accrued Income 878
Receivables for Capital Shares Issued 1,498
Variation Margin Receivable—
Futures Contracts 12
Other Assets 37
Total Other Assets 2,492
Liabilities Payables for Investment Securities
Purchased (2)
Collateral for Securities on Loan (3,496)
Payables for Capital Shares Redeemed (59)
Payables to Vanguard (259)
Total Liabilities (3,816)
Net Assets (100%) 1,005,325
54
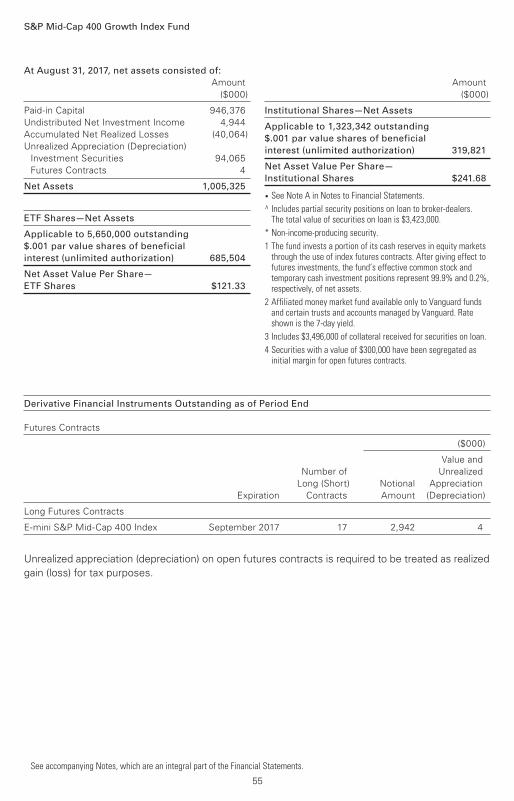
S&P Mid-Cap 400 Growth Index Fund
See accompanying Notes, which are an integral part of the Financial Statements.
At August 31, 2017, net assets consisted of: Amount
($000)
Amount
($000)
Paid-in Capital 946,376
Undistributed Net Investment Income 4,944
Accumulated Net Realized Losses (40,064)
Unrealized Appreciation (Depreciation)
Investment Securities 94,065
Futures Contracts 4
Net Assets 1,005,325
ETF Shares—Net Assets
Applicable to 5,650,000 outstanding $.001 par value shares of beneficial interest (unlimited authorization) 685,504
Net Asset Value Per Share— ETF Shares $121.33
Institutional Shares—Net Assets
Applicable to 1,323,342 outstanding $.001 par value shares of beneficial interest (unlimited authorization) 319,821
Net Asset Value Per Share— Institutional Shares $241.68
• See Note A in Notes to Financial Statements.
^ Includes partial security positions on loan to broker-dealers. The total value of securities on loan is $3,423,000.
* Non-income-producing security.
1 The fund invests a portion of its cash reserves in equity markets through the use of index futures contracts. After giving effect to futures investments, the fund’s effective common stock and temporary cash investment positions represent 99.9% and 0.2%, respectively, of net assets.
2 Affiliated money market fund available only to Vanguard funds and certain trusts and accounts managed by Vanguard. Rate shown is the 7-day yield.
3 Includes $3,496,000 of collateral received for securities on loan.
4 Securities with a value of $300,000 have been segregated as initial margin for open futures contracts.
Derivative Financial Instruments Outstanding as of Period End
Futures Contracts
($000)
Value and
Number of Unrealized
Long (Short) Notional Appreciation
Expiration Contracts Amount (Depreciation)
Long Futures Contracts
E-mini S&P Mid-Cap 400 Index September 2017 17 2,942 4
Unrealized appreciation (depreciation) on open futures contracts is required to be treated as realized
gain (loss) for tax purposes.
55

Year Ended
August 31, 2017
($000)
Investment Income
Income
Dividends 10,159
Interest1 31
Securities Lending—Net 53
Total Income 10,243
Expenses
The Vanguard Group—Note B
Investment Advisory Services 183
Management and Administrative—ETF Shares 981
Management and Administrative—Institutional Shares 105
Marketing and Distribution—ETF Shares 36
Marketing and Distribution—Institutional Shares 13
Custodian Fees 39
Auditing Fees 32
Shareholders’ Reports and Proxy—ETF Shares 43
Shareholders’ Reports and Proxy—Institutional Shares —
Trustees’ Fees and Expenses 1
Total Expenses 1,433
Net Investment Income 8,810
Realized Net Gain (Loss)
Investment Securities Sold1 71,260
Futures Contracts 110
Realized Net Gain (Loss) 71,370
Change in Unrealized Appreciation (Depreciation)
Investment Securities 11,963
Futures Contracts 4
Change in Unrealized Appreciation (Depreciation) 11,967
Net Increase (Decrease) in Net Assets Resulting from Operations 92,147
1 Interest income and realized net gain (loss) from an affiliated company of the fund were $28,000 and $0, respectively.
Statement of Operations
S&P Mid-Cap 400 Growth Index Fund
See accompanying Notes, which are an integral part of the Financial Statements.
56

Statement of Changes in Net Assets
S&P Mid-Cap 400 Growth Index Fund
See accompanying Notes, which are an integral part of the Financial Statements.
Year Ended August 31,
2017 2016
($000) ($000)
Increase (Decrease) in Net Assets
Operations
Net Investment Income 8,810 6,123
Realized Net Gain (Loss) 71,370 5,353
Change in Unrealized Appreciation (Depreciation) 11,967 51,455
Net Increase (Decrease) in Net Assets Resulting from Operations 92,147 62,931
Distributions
Net Investment Income
ETF Shares (5,674) (4,524)
Institutional Shares (2,068) (1,029)
Realized Capital Gain
ETF Shares — —
Institutional Shares — —
Total Distributions (7,742) (5,553)
Capital Share Transactions
ETF Shares 109,562 93,098
Institutional Shares 128,195 59,674
Net Increase (Decrease) from Capital Share Transactions 237,757 152,772
Total Increase (Decrease) 322,162 210,150
Net Assets
Beginning of Period 683,163 473,013
End of Period1 1,005,325 683,163
1 Net Assets—End of Period includes undistributed (overdistributed) net investment income of $4,944,000 and $3,875,000.
57

ETF Shares
For a Share Outstanding Year Ended August 31,
Throughout Each Period 2017 2016 2015 2014 2013
Net Asset Value, Beginning of Period $109.76 $99.88 $97.18 $80.96 $67.47
Investment Operations
Net Investment Income 1.1521 .954 1.036 .571 .721
Net Realized and Unrealized Gain (Loss)
on Investments 11.576 9.960 2.456 16.256 13.257
Total from Investment Operations 12.728 10.914 3.492 16.827 13.978
Distributions
Dividends from Net Investment Income (1.158) (1.034) (.792) (.607) (.488)
Distributions from Realized Capital Gains — — — — —
Total Distributions (1.158) (1.034) (.792) (.607) (.488)
Net Asset Value, End of Period $121.33 $109.76 $99.88 $97.18 $80.96
Total Return 11.67% 11.04% 3.60% 20.84% 20.83%
Ratios/Supplemental Data
Net Assets, End of Period (Millions) $686 $513 $377 $292 $182
Ratio of Total Expenses to
Average Net Assets 0.20% 0.20% 0.20% 0.20% 0.20%
Ratio of Net Investment Income to
Average Net Assets 0.99% 1.08% 1.08% 0.81% 1.08%
Portfolio Turnover Rate2 40% 38% 47% 38% 35%
1 Calculated based on average shares outstanding.
2 Excludes the value of portfolio securities received or delivered as a result of in-kind purchases or redemptions of the fund’s capital shares, including ETF Creation Units.
Financial Highlights
See accompanying Notes, which are an integral part of the Financial Statements.
S&P Mid-Cap 400 Growth Index Fund
58

Institutional Shares
For a Share Outstanding Year Ended August 31,
Throughout Each Period 2017 2016 2015 2014 2013
Net Asset Value, Beginning of Period $218.61 $198.85 $193.45 $161.12 $134.20
Investment Operations
Net Investment Income 2.6041 2.094 2.271 1.316 1.584
Net Realized and Unrealized Gain (Loss)
on Investments 23.011 19.906 4.900 32.386 26.392
Total from Investment Operations 25.615 22.000 7.171 33.702 27.976
Distributions
Dividends from Net Investment Income (2.545) (2.240) (1.771) (1.372) (1.056)
Distributions from Realized Capital Gains — — — — —
Total Distributions (2.545) (2.240) (1.771) (1.372) (1.056)
Net Asset Value, End of Period $241.68 $218.61 $198.85 $193.45 $161.12
Total Return 11.80% 11.18% 3.72% 20.99% 20.97%
Ratios/Supplemental Data
Net Assets, End of Period (Millions) $320 $170 $96 $90 $42
Ratio of Total Expenses to
Average Net Assets 0.08% 0.08% 0.08% 0.08% 0.08%
Ratio of Net Investment Income to
Average Net Assets 1.11% 1.20% 1.20% 0.93% 1.20%
Portfolio Turnover Rate2 40% 38% 47% 38% 35%
1 Calculated based on average shares outstanding.
2 Excludes the value of portfolio securities received or delivered as a result of in-kind purchases or redemptions of the fund’s capital shares, including ETF Creation Units.
Financial Highlights
See accompanying Notes, which are an integral part of the Financial Statements.
S&P Mid-Cap 400 Growth Index Fund
59

Notes to Financial Statements
S&P Mid-Cap 400 Growth Index Fund
Vanguard S&P Mid-Cap 400 Growth Index Fund is registered under the Investment Company
Act of 1940 as an open-end investment company, or mutual fund. The fund offers two classes
of shares: ETF Shares and Institutional Shares. ETF Shares are listed for trading on NYSE Arca;
they can be purchased and sold through a broker. Institutional Shares are designed for investors
who meet certain administrative, service, and account-size criteria.
A. The following significant accounting policies conform to generally accepted accounting
principles for U.S. investment companies. The fund consistently follows such policies in preparing
its financial statements.
1. Security Valuation: Securities are valued as of the close of trading on the New York Stock
Exchange (generally 4 p.m., Eastern time) on the valuation date. Equity securities are valued at
the latest quoted sales prices or official closing prices taken from the primary market in which
each security trades; such securities not traded on the valuation date are valued at the mean of
the latest quoted bid and asked prices. Securities for which market quotations are not readily
available, or whose values have been materially affected by events occurring before the fund’s
pricing time but after the close of the securities’ primary markets, are valued by methods deemed
by the board of trustees to represent fair value. Investments in Vanguard Market Liquidity Fund
are valued at that fund’s net asset value. Temporary cash investments are valued using the latest
bid prices or using valuations based on a matrix system (which considers such factors as security
prices, yields, maturities, and ratings), both as furnished by independent pricing services.
2. Futures Contracts: The fund uses index futures contracts to a limited extent, with the objectives
of maintaining full exposure to the stock market, enhancing returns, maintaining liquidity, and
minimizing transaction costs. The fund may purchase futures contracts to immediately invest
incoming cash in the market, or sell futures in response to cash outflows, thereby simulating a fully
invested position in the underlying index while maintaining a cash balance for liquidity. The fund
may seek to enhance returns by using futures contracts instead of the underlying securities when
futures are believed to be priced more attractively than the underlying securities. The primary risks
associated with the use of futures contracts are imperfect correlation between changes in market
values of stocks held by the fund and the prices of futures contracts, and the possibility of an illiquid
market. Counterparty risk involving futures is mitigated because a regulated clearinghouse is the
counterparty instead of the clearing broker. To further mitigate counterparty risk, the fund trades
futures contracts on an exchange, monitors the financial strength of its clearing brokers and
clearinghouse, and has entered into clearing agreements with its clearing brokers. The
clearinghouse imposes initial margin requirements to secure the fund’s performance and requires
daily settlement of variation margin representing changes in the market value of each contract.
Futures contracts are valued at their quoted daily settlement prices. The notional amounts of
the contracts are not recorded in the Statement of Net Assets. Fluctuations in the value of the
contracts are recorded in the Statement of Net Assets as an asset (liability) and in the Statement
of Operations as unrealized appreciation (depreciation) until the contracts are closed, when they
are recorded as realized futures gains (losses).
During the year ended August 31, 2017, the fund’s average investments in long and short futures
contracts represented less than 1% and 0% of net assets, respectively, based on the average of
the notional amounts at each quarter-end during the period.
60
S&P Mid-Cap 400 Growth Index Fund
3. Federal Income Taxes: The fund intends to continue to qualify as a regulated investment
company and distribute all of its taxable income. Management has analyzed the fund’s tax
positions taken for all open federal income tax years (August 31, 2014–2017), and has concluded
that no provision for federal income tax is required in the fund’s financial statements.
4. Distributions: Distributions to shareholders are recorded on the ex-dividend date.
5. Securities Lending: To earn additional income, the fund lends its securities to qualified
institutional borrowers. Security loans are subject to termination by the fund at any time, and
are required to be secured at all times by collateral in an amount at least equal to the market
value of securities loaned. Daily market fluctuations could cause the value of loaned securities
to be more or less than the value of the collateral received. When this occurs, the collateral is
adjusted and settled on the next business day. The fund further mitigates its counterparty risk
by entering into securities lending transactions only with a diverse group of prequalified
counterparties, monitoring their financial strength, and entering into master securities lending
agreements with its counterparties. The master securities lending agreements provide that,
in the event of a counterparty’s default (including bankruptcy), the fund may terminate any
loans with that borrower, determine the net amount owed, and sell or retain the collateral up
to the net amount owed to the fund; however, such actions may be subject to legal proceedings.
While collateral mitigates counterparty risk, in the event of a default, the fund may experience
delays and costs in recovering the securities loaned. The fund invests cash collateral received in
Vanguard Market Liquidity Fund, and records a liability in the Statement of Net Assets for the return
of the collateral, during the period the securities are on loan. Securities lending income represents
fees charged to borrowers plus income earned on invested cash collateral, less expenses
associated with the loan. During the term of the loan, the fund is entitled to all distributions
made on or in respect of the loaned securities.
6. Credit Facility: The fund and certain other funds managed by The Vanguard Group (“Vanguard”)
participate in a $3.1 billion committed credit facility provided by a syndicate of lenders pursuant to
a credit agreement that may be renewed annually; each fund is individually liable for its borrowings,
if any, under the credit facility. Borrowings may be utilized for temporary and emergency purposes,
and are subject to the fund’s regulatory and contractual borrowing restrictions. The participating
funds are charged administrative fees and an annual commitment fee of 0.10% of the undrawn
amount of the facility; these fees are allocated to the funds based on a method approved by the
fund’s board of trustees and included in Management and Administrative expenses on the fund’s
Statement of Operations. Any borrowings under this facility bear interest at a rate based upon the
higher of the one-month London Interbank Offered Rate, federal funds effective rate, or overnight
bank funding rate plus an agreed-upon spread.
The fund had no borrowings outstanding at August 31, 2017, or at any time during the period
then ended.
7. Other: Dividend income is recorded on the ex-dividend date. Interest income includes income
distributions received from Vanguard Market Liquidity Fund and is accrued daily. Premiums and
discounts on debt securities purchased are amortized and accreted, respectively, to interest income
over the lives of the respective securities. Security transactions are accounted for on the date
securities are bought or sold. Costs used to determine realized gains (losses) on the sale of
investment securities are those of the specific securities sold.
61
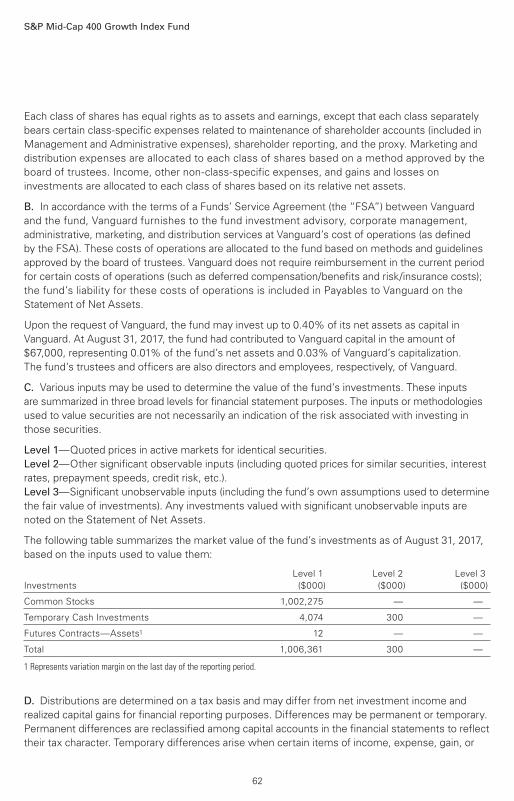
S&P Mid-Cap 400 Growth Index Fund
Each class of shares has equal rights as to assets and earnings, except that each class separately
bears certain class-specific expenses related to maintenance of shareholder accounts (included in
Management and Administrative expenses), shareholder reporting, and the proxy. Marketing and
distribution expenses are allocated to each class of shares based on a method approved by the
board of trustees. Income, other non-class-specific expenses, and gains and losses on
investments are allocated to each class of shares based on its relative net assets.
B. In accordance with the terms of a Funds’ Service Agreement (the “FSA”) between Vanguard
and the fund, Vanguard furnishes to the fund investment advisory, corporate management,
administrative, marketing, and distribution services at Vanguard’s cost of operations (as defined
by the FSA). These costs of operations are allocated to the fund based on methods and guidelines
approved by the board of trustees. Vanguard does not require reimbursement in the current period
for certain costs of operations (such as deferred compensation/benefits and risk/insurance costs);
the fund’s liability for these costs of operations is included in Payables to Vanguard on the
Statement of Net Assets.
Upon the request of Vanguard, the fund may invest up to 0.40% of its net assets as capital in
Vanguard. At August 31, 2017, the fund had contributed to Vanguard capital in the amount of
$67,000, representing 0.01% of the fund’s net assets and 0.03% of Vanguard’s capitalization.
The fund’s trustees and officers are also directors and employees, respectively, of Vanguard.
C. Various inputs may be used to determine the value of the fund’s investments. These inputs
are summarized in three broad levels for financial statement purposes. The inputs or methodologies
used to value securities are not necessarily an indication of the risk associated with investing in
those securities.
Level 1—Quoted prices in active markets for identical securities.
Level 2—Other significant observable inputs (including quoted prices for similar securities, interest
rates, prepayment speeds, credit risk, etc.).
Level 3—Significant unobservable inputs (including the fund’s own assumptions used to determine
the fair value of investments). Any investments valued with significant unobservable inputs are
noted on the Statement of Net Assets.
The following table summarizes the market value of the fund’s investments as of August 31, 2017,
based on the inputs used to value them:
Level 1 Level 2 Level 3
Investments ($000) ($000) ($000)
Common Stocks 1,002,275 — —
Temporary Cash Investments 4,074 300 —
Futures Contracts—Assets1 12 — —
Total 1,006,361 300 —
1 Represents variation margin on the last day of the reporting period.
D. Distributions are determined on a tax basis and may differ from net investment income and
realized capital gains for financial reporting purposes. Differences may be permanent or temporary.
Permanent differences are reclassified among capital accounts in the financial statements to reflect
their tax character. Temporary differences arise when certain items of income, expense, gain, or
62
S&P Mid-Cap 400 Growth Index Fund
loss are recognized in different periods for financial statement and tax purposes. These differences
will reverse at some time in the future. Differences in classification may also result from the
treatment of short-term gains as ordinary income for tax purposes.
During the year ended August 31, 2017, the fund realized $69,762,000 of net capital gains resulting
from in-kind redemptions—in which shareholders exchanged fund shares for securities held by the
fund rather than for cash. Because such gains are not taxable to the fund, and are not distributed to
shareholders, they have been reclassified from accumulated net realized losses to paid-in capital.
For tax purposes, at August 31, 2017, the fund had $5,126,000 of ordinary income available for
distribution. The fund used capital losses of $1,612,000 to offset taxable capital gains realized
during the year ended August 31, 2017. At August 31, 2017, the fund had available capital losses
totaling $40,060,000 that may be carried forward indefinitely to offset future net capital gains.
At August 31, 2017, the cost of investment securities for tax purposes was $912,584,000. Net
unrealized appreciation of investment securities for tax purposes was $94,065,000, consisting
of unrealized gains of $133,626,000 on securities that had risen in value since their purchase and
$39,561,000 in unrealized losses on securities that had fallen in value since their purchase.
E. During the year ended August 31, 2017, the fund purchased $814,258,000 of investment
securities and sold $576,580,000 of investment securities, other than temporary cash investments.
Purchases and sales include $298,942,000 and $237,026,000, respectively, in connection with
in-kind purchases and redemptions of the fund’s capital shares.
The fund purchased securities from and sold securities to other Vanguard funds or accounts
managed by Vanguard or its affiliates, in accordance with procedures adopted by the board of
trustees in compliance with Rule 17a-7 of the Investment Company Act of 1940. For the year
ended August 31, 2017, such purchases and sales were $121,492,000 and $68,005,000,
respectively; these amounts are included in the purchases and sales of investment securities
noted above.
63
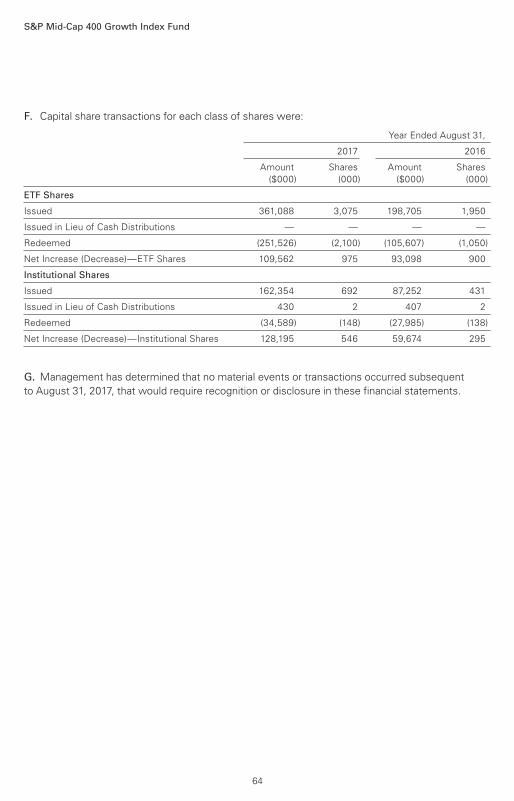
S&P Mid-Cap 400 Growth Index Fund
F. Capital share transactions for each class of shares were:
Year Ended August 31,
2017 2016
Amount Shares Amount Shares
($000) (000) ($000) (000)
ETF Shares
Issued 361,088 3,075 198,705 1,950
Issued in Lieu of Cash Distributions — — — —
Redeemed (251,526) (2,100) (105,607) (1,050)
Net Increase (Decrease)—ETF Shares 109,562 975 93,098 900
Institutional Shares
Issued 162,354 692 87,252 431
Issued in Lieu of Cash Distributions 430 2 407 2
Redeemed (34,589) (148) (27,985) (138)
Net Increase (Decrease)—Institutional Shares 128,195 546 59,674 295
G. Management has determined that no material events or transactions occurred subsequent
to August 31, 2017, that would require recognition or disclosure in these financial statements.
64
To the Board of Trustees of Vanguard Admiral Funds and the Shareholders of Vanguard S&P
Mid-Cap 400 Index Fund, Vanguard S&P Mid-Cap 400 Value Index Fund and Vanguard S&P
Mid-Cap 400 Growth Index Fund:
In our opinion, the accompanying statements of net assets and the related statements of
operations and of changes in net assets and the financial highlights present fairly, in all material
respects, the financial position of Vanguard S&P Mid-Cap 400 Index Fund, Vanguard S&P Mid-Cap
400 Value Index Fund and Vanguard S&P Mid-Cap 400 Growth Index Fund (constituting separate
portfolios of Vanguard Admiral Funds, hereafter referred to as the “Funds”) as of August 31, 2017,
the results of each of their operations for the year then ended, the changes in each of their net
assets for each of the two years in the period then ended and the financial highlights for each of
the five years in the period then ended, in conformity with accounting principles generally accepted
in the United States of America. These financial statements and financial highlights (hereafter
referred to as “financial statements”) are the responsibility of the Funds’ management.
Our responsibility is to express an opinion on these financial statements based on our audits.
We conducted our audits of these financial statements in accordance with the standards of the
Public Company Accounting Oversight Board (United States). Those standards require that we
plan and perform the audit to obtain reasonable assurance about whether the financial statements
are free of material misstatement. An audit includes examining, on a test basis, evidence supporting
the amounts and disclosures in the financial statements, assessing the accounting principles used
and significant estimates made by management, and evaluating the overall financial statement
presentation. We believe that our audits, which included confirmation of securities as of
August 31, 2017 by correspondence with the custodian and brokers and by agreement
to the underlying ownership records of the transfer agent, provide a reasonable basis
for our opinion.
/s/PricewaterhouseCoopers LLP
Philadelphia, Pennsylvania
October 17, 2017
Report of Independent Registered Public Accounting Firm
65

Special 2017 tax information (unaudited) for Vanguard S&P Mid-Cap 400 Index Funds
This information for the fiscal year ended August 31, 2017, is included pursuant to provisions
of the Internal Revenue Code.
The funds distributed qualified dividend income to shareholders during the fiscal year as follows:
Fund ($000)
S&P Mid-Cap 400 Index Fund 18,563
S&P Mid-Cap 400 Value Index Fund 8,304
S&P Mid-Cap 400 Growth Index Fund 5,285
For corporate shareholders, the percentage of investment income (dividend income plus short-term
gains, if any) that qualifies for the dividends-received deduction is as follows:
Fund Percentage
S&P Mid-Cap 400 Index Fund 79.9%
S&P Mid-Cap 400 Value Index Fund 81.4
S&P Mid-Cap 400 Growth Index Fund 84.3
66

Your Fund’s After-Tax Returns
67
This table presents returns for your fund both before and after taxes. The after-tax returns are
shown in two ways: (1) assuming that an investor owned the fund during the entire period and
paid taxes on the fund’s distributions, and (2) assuming that an investor paid taxes on the fund’s
distributions and sold all shares at the end of each period.
Calculations are based on the highest individual federal income tax and capital gains tax rates in
effect at the times of the distributions and the hypothetical sales. State and local taxes were not
considered. After-tax returns reflect any qualified dividend income, using actual prior-year figures
and estimates for 2017. (In the example, returns after the sale of fund shares may be higher than
those assuming no sale. This occurs when the sale would have produced a capital loss. The
calculation assumes that the investor received a tax deduction for the loss.)
The table shows returns for ETF Shares only; returns for other share classes will differ. Please
note that your actual after-tax returns will depend on your tax situation and may differ from those
shown. Also note that if you own the fund in a tax-deferred account, such as an individual
retirement account or a 401(k) plan, this information does not apply to you. Such accounts are not
subject to current taxes.
Finally, keep in mind that a fund’s performance—whether before or after taxes—does not
guarantee future results.
Average Annual Total Returns: S&P Mid-Cap 400 Index FundsPeriods Ended August 31, 2017
One
Year
Five
Years
Since
Inception
(9/7/2010)
S&P Mid-Cap 400 Index Fund ETF Shares
Returns Before Taxes 12.22% 13.84% 14.18%
Returns After Taxes on Distributions 11.78 13.46 13.87
Returns After Taxes on Distributions and Sale of
Fund Shares 7.14 11.03 11.59
One
Year
Five
Years
Since
Inception
(9/7/2010)
S&P Mid-Cap 400 Value Index Fund ETF Shares
Returns Before Taxes 11.91% 13.93% 13.75%
Returns After Taxes on Distributions 11.51 13.55 13.42
Returns After Taxes on Distributions and Sale of
Fund Shares 6.98 11.12 11.22
One
Year
Five
Years
Since
Inception
(9/7/2010)
S&P Mid-Cap 400 Growth Index Fund ETF Shares
Returns Before Taxes 11.67% 13.41% 14.33%
Returns After Taxes on Distributions 11.33 13.15 14.12
Returns After Taxes on Distributions and Sale of
Fund Shares 6.73 10.69 11.74
About Your Fund’s Expenses
68
As a shareholder of the fund, you incur ongoing costs, which include costs for portfolio management,
administrative services, and shareholder reports (like this one), among others. Operating expenses,
which are deducted from a fund’s gross income, directly reduce the investment return of the fund.
A fund’s expenses are expressed as a percentage of its average net assets. This figure is known as
the expense ratio. The following examples are intended to help you understand the ongoing costs (in
dollars) of investing in your fund and to compare these costs with those of other mutual funds. The
examples are based on an investment of $1,000 made at the beginning of the period shown and held
for the entire period.
The accompanying table illustrates your fund’s costs in two ways:
• Based on actual fund return. This section helps you to estimate the actual expenses that you
paid over the period. The ”Ending Account Value“ shown is derived from the fund‘s actual return,
and the third column shows the dollar amount that would have been paid by an investor who started
with $1,000 in the fund. You may use the information here, together with the amount you invested,
to estimate the expenses that you paid over the period.
To do so, simply divide your account value by $1,000 (for example, an $8,600 account value divided
by $1,000 = 8.6), then multiply the result by the number given for your fund under the heading
”Expenses Paid During Period.“
• Based on hypothetical 5% yearly return. This section is intended to help you compare your
fund‘s costs with those of other mutual funds. It assumes that the fund had a yearly return of 5%
before expenses, but that the expense ratio is unchanged. In this case—because the return used is
not the fund’s actual return—the results do not apply to your investment. The example is useful in
making comparisons because the Securities and Exchange Commission requires all mutual funds to
calculate expenses based on a 5% return. You can assess your fund’s costs by comparing this
hypothetical example with the hypothetical examples that appear in shareholder reports of other
funds.
Note that the expenses shown in the table are meant to highlight and help you compare ongoingcosts only and do not reflect transaction costs incurred by the fund for buying and sellingsecurities. Further, the expenses do not include any purchase, redemption, or account servicefees described in the fund prospectus. If such fees were applied to your account, your costswould be higher. Your fund does not carry a “sales load.”
The calculations assume no shares were bought or sold during the period. Your actual costs may
have been higher or lower, depending on the amount of your investment and the timing of any
purchases or redemptions.
You can find more information about the fund’s expenses, including annual expense ratios, in the
Financial Statements section of this report. For additional information on operating expenses and
other shareholder costs, please refer to your fund’s current prospectus.
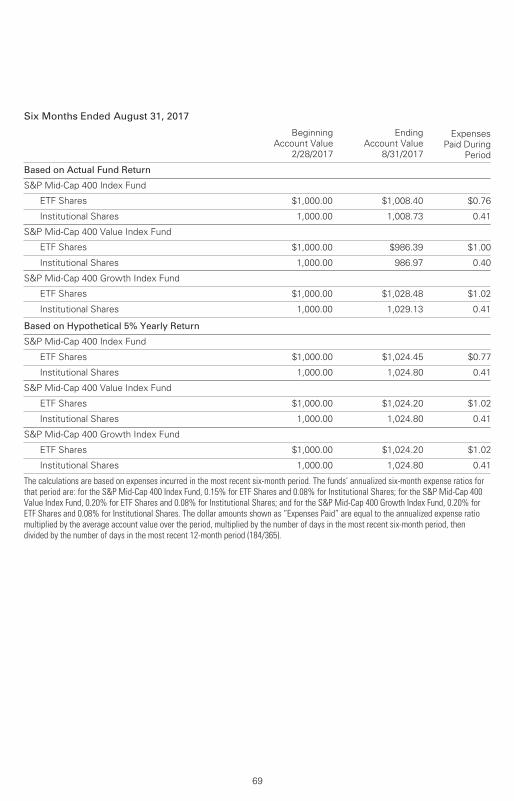
69
Six Months Ended August 31, 2017
Beginning
Account Value
2/28/2017
Ending
Account Value
8/31/2017
Expenses
Paid During
Period
Based on Actual Fund Return
S&P Mid-Cap 400 Index Fund
ETF Shares $1,000.00 $1,008.40 $0.76
Institutional Shares 1,000.00 1,008.73 0.41
S&P Mid-Cap 400 Value Index Fund
ETF Shares $1,000.00 $986.39 $1.00
Institutional Shares 1,000.00 986.97 0.40
S&P Mid-Cap 400 Growth Index Fund
ETF Shares $1,000.00 $1,028.48 $1.02
Institutional Shares 1,000.00 1,029.13 0.41
Based on Hypothetical 5% Yearly Return
S&P Mid-Cap 400 Index Fund
ETF Shares $1,000.00 $1,024.45 $0.77
Institutional Shares 1,000.00 1,024.80 0.41
S&P Mid-Cap 400 Value Index Fund
ETF Shares $1,000.00 $1,024.20 $1.02
Institutional Shares 1,000.00 1,024.80 0.41
S&P Mid-Cap 400 Growth Index Fund
ETF Shares $1,000.00 $1,024.20 $1.02
Institutional Shares 1,000.00 1,024.80 0.41
The calculations are based on expenses incurred in the most recent six-month period. The funds’ annualized six-month expense ratios forthat period are: for the S&P Mid-Cap 400 Index Fund, 0.15% for ETF Shares and 0.08% for Institutional Shares; for the S&P Mid-Cap 400Value Index Fund, 0.20% for ETF Shares and 0.08% for Institutional Shares; and for the S&P Mid-Cap 400 Growth Index Fund, 0.20% forETF Shares and 0.08% for Institutional Shares. The dollar amounts shown as “Expenses Paid” are equal to the annualized expense ratiomultiplied by the average account value over the period, multiplied by the number of days in the most recent six-month period, thendivided by the number of days in the most recent 12-month period (184/365).
The board of trustees of Vanguard S&P Mid-Cap 400 Index Fund, Vanguard S&P Mid-Cap
400 Value Index Fund, and Vanguard S&P Mid-Cap 400 Growth Index Fund has renewed each
fund’s investment advisory arrangement with The Vanguard Group, Inc. (Vanguard), through
its Equity Index Group. The board determined that continuing each fund’s internalized management
structure was in the best interests of the fund and its shareholders.
The board based its decision upon an evaluation of the advisor’s investment staff, portfolio
management process, and performance. This evaluation included information provided to the
board by Vanguard’s Portfolio Review Department, which is responsible for fund and advisor
oversight and product management. The Portfolio Review Department met regularly with the
advisor and made monthly presentations to the board during the fiscal year that directed the
board’s focus to relevant information and topics.
The board, or an investment committee made up of board members, also received information
throughout the year through advisor presentations. For each advisor presentation, the board was
provided with letters and reports that included information about, among other things, the advisory
firm and the advisor’s assessment of the investment environment, portfolio performance, and
portfolio characteristics.
In addition, the board received monthly reports, which included a Market and Economic Report,
a Fund Dashboard Monthly Summary, and a Fund Performance Report.
Prior to their meeting, the trustees were provided with a memo and materials that summarized
the information they had received over the course of the year. They also considered the factors
discussed below, among others. However, no single factor determined whether the board
approved the arrangements. Rather, it was the totality of the circumstances that drove the
board’s decision.
Nature, extent, and quality of servicesThe board reviewed the quality of the investment management services provided to the funds
since their inception in 2010 and took into account the organizational depth and stability of the
advisor. The board considered that Vanguard has been managing investments for more than
three decades. The Equity Index Group adheres to a sound, disciplined investment management
process; the team has considerable experience, stability, and depth.
The board concluded that Vanguard’s experience, stability, depth, and performance, among
other factors, warranted continuation of each advisory arrangement.
Investment performanceThe board considered each fund’s performance since its inception, including any periods of
outperformance or underperformance compared with its target index and peer group. The
board concluded that the performance was such that each advisory arrangement should
continue. Information about each fund’s most recent performance can be found in the
Performance Summary pages of this report.
Trustees Approve Advisory Arrangements
70

CostThe board concluded that each fund’s expense ratio was well below the average expense ratio
charged by funds in its peer group and that each fund’s advisory expenses were also well below
the peer group average. Information about the funds’ expenses appears in the About Your Fund’s
Expenses section of this report as well as in the Financial Statements sections.
The board does not conduct a profitability analysis of Vanguard because of Vanguard’s unique
“at-cost” structure. Unlike most other mutual fund management companies, Vanguard is owned
by the funds it oversees and produces “profits” only in the form of reduced expenses for fund
shareholders.
The benefit of economies of scaleThe board concluded that each fund’s at-cost arrangement with Vanguard ensures that the
funds will realize economies of scale as they grow, with the cost to shareholders declining as
fund assets increase.
The board will consider whether to renew the advisory arrangements again after a one-year period.
71

Glossary
72
30-Day SEC Yield. A fund’s 30-day SEC yield is derived using a formula specified by the U.S.
Securities and Exchange Commission. Under the formula, data related to the fund’s security
holdings in the previous 30 days are used to calculate the fund’s hypothetical net income for that
period, which is then annualized and divided by the fund’s estimated average net assets over the
calculation period. For the purposes of this calculation, a security’s income is based on its current
market yield to maturity (for bonds), its actual income (for asset-backed securities), or its
projected dividend yield (for stocks). Because the SEC yield represents hypothetical annualized
income, it will differ—at times significantly—from the fund’s actual experience. As a result, the
fund’s income distributions may be higher or lower than implied by the SEC yield.
Beta. A measure of the magnitude of a fund’s past share-price fluctuations in relation to the ups
and downs of a given market index. The index is assigned a beta of 1.00. Compared with a given
index, a fund with a beta of 1.20 typically would have seen its share price rise or fall by 12%
when the index rose or fell by 10%. For this report, beta is based on returns over the past 36
months for both the fund and the index. Note that a fund’s beta should be reviewed in conjunction
with its R-squared (see definition). The lower the R-squared, the less correlation there is between
the fund and the index, and the less reliable beta is as an indicator of volatility.
Dividend Yield. Dividend income earned by stocks, expressed as a percentage of the aggregate
market value (or of net asset value, for a fund). The yield is determined by dividing the amount of
the annual dividends by the aggregate value (or net asset value) at the end of the period. For a
fund, the dividend yield is based solely on stock holdings and does not include any income
produced by other investments.
Earnings Growth Rate. The average annual rate of growth in earnings over the past five years for
the stocks now in a fund.
Equity Exposure. A measure that reflects a fund’s investments in stocks and stock futures. Any
holdings in short-term reserves are excluded.
Expense Ratio. A fund’s total annual operating expenses expressed as a percentage of the fund’s
average net assets. The expense ratio includes management and administrative expenses, but
does not include the transaction costs of buying and selling portfolio securities.
Foreign Holdings. The percentage of a fund represented by securities or depositary receipts of
companies based outside the United States.
Inception Date. The date on which the assets of a fund (or one of its share classes) are first
invested in accordance with the fund’s investment objective. For funds with a subscription period,
the inception date is the day after that period ends. Investment performance is measured from
the inception date.
Median Market Cap. An indicator of the size of companies in which a fund invests; the midpoint
of market capitalization (market price x shares outstanding) of a fund’s stocks, weighted by the
proportion of the fund’s assets invested in each stock. Stocks representing half of the fund’s
assets have market capitalizations above the median, and the rest are below it.
Price/Book Ratio. The share price of a stock divided by its net worth, or book value, per share.
For a fund, the weighted average price/book ratio of the stocks it holds.
73
Price/Earnings Ratio. The ratio of a stock’s current price to its per-share earnings over the past
year. For a fund, the weighted average P/E of the stocks it holds. P/E is an indicator of market
expectations about corporate prospects; the higher the P/E, the greater the expectations for a
company’s future growth.
R-Squared. A measure of how much of a fund’s past returns can be explained by the returns
from the market in general, as measured by a given index. If a fund’s total returns were precisely
synchronized with an index’s returns, its R-squared would be 1.00. If the fund’s returns bore no
relationship to the index’s returns, its R-squared would be 0. For this report, R-squared is based
on returns over the past 36 months for both the fund and the index.
Return on Equity. The annual average rate of return generated by a company during the past five
years for each dollar of shareholder’s equity (net income divided by shareholder’s equity). For a
fund, the weighted average return on equity for the companies whose stocks it holds.
Short-Term Reserves. The percentage of a fund invested in highly liquid, short-term securities
that can be readily converted to cash.
Turnover Rate. An indication of the fund’s trading activity. Funds with high turnover rates incur
higher transaction costs and may be more likely to distribute capital gains (which may be taxable
to investors). The turnover rate excludes in-kind transactions, which have minimal impact on
costs.

The Global Industry Classification Standard (“GICS”) was developed by and is the exclusive property and a service mark
of MSCI Inc. (“MSCI”) and Standard and Poor’s, a division of McGraw-Hill Companies, Inc. (“S&P”), and is licensed for use
by Vanguard. Neither MSCI, S&P nor any third party involved in making or compiling the GICS or any GICS classification
makes any express or implied warranties or representations with respect to such standard or classification (or the results
to be obtained by the use thereof), and all such parties hereby expressly disclaim all warranties of originality, accuracy,
completeness, merchantability or fitness for a particular purpose with respect to any such standard or classification.
Without limiting any of the foregoing, in no event shall MSCI, S&P, any of its affiliates or any third party involved in
making or compiling the GICS or any GICS classification have any liability for any direct, indirect, special, punitive,
consequential or any other damages (including lost profits) even if notified of the possibility of such damages.
74

The People Who Govern Your Fund
The trustees of your mutual fund are there to see that the fund is operated and managed in your
best interests since, as a shareholder, you are a part owner of the fund. Your fund’s trustees also
serve on the board of directors of The Vanguard Group, Inc., which is owned by the Vanguard
funds and provides services to them on an at-cost basis.
A majority of Vanguard’s board members are independent, meaning that they have no affiliation
with Vanguard or the funds they oversee, apart from the sizable personal investments they have
made as private individuals. The independent board members have distinguished backgrounds
in business, academia, and public service. Each of the trustees and executive officers oversees
195 Vanguard funds.
Information for each trustee and executive officer of the fund appears below. The mailing address
of the trustees and officers is P.O. Box 876, Valley Forge, PA 19482. More information about the
trustees is in the Statement of Additional Information, which can be obtained, without charge,
by contacting Vanguard at 800-662-7447, or online at vanguard.com.
Interested Trustee1
F. William McNabb IIIBorn 1957. Trustee Since July 2009. Chairman
of the Board. Principal Occupation(s) During the
Past Five Years and Other Experience: Chairman
of the Board of The Vanguard Group, Inc., and
of each of the investment companies served by
The Vanguard Group, since January 2010; Chief
Executive Officer and Director of The Vanguard
Group and President and Chief Executive Officer
of each of the investment companies served by
The Vanguard Group, since 2008; Director of
Vanguard Marketing Corporation; President of
The Vanguard Group (2008–2017); Managing
Director of The Vanguard Group (1995–2008).
Independent Trustees
Emerson U. Fullwood Born 1948. Trustee Since January 2008. Principal
Occupation(s) During the Past Five Years and Other
Experience: Executive Chief Staff and Marketing
Officer for North America and Corporate Vice
President (retired 2008) of Xerox Corporation
(document manage ment products and services);
Executive in Residence and 2009–2010
Distinguished Minett Professor at the Rochester
Institute of Technology; Lead Director of SPX
FLOW, Inc. (multi-industry manufacturing);
Director of the United Way of Rochester, the
University of Rochester Medical Center, Monroe
Community College Foundation, North Carolina
A&T University, and Roberts Wesleyan College;
Trustee of the University of Rochester.
Rajiv L. Gupta Born 1945. Trustee Since December 2001.2
Principal Occupation(s) During the Past Five
Years and Other Experience: Chairman and
Chief Executive Officer (retired 2009) and
President (2006–2008) of Rohm and Haas Co.
(chemicals); Director of Arconic Inc. (diversified
manufacturer), HP Inc. (printer and personal
computer manufacturing), and Delphi Automotive
plc (automotive components); Senior Advisor at
New Mountain Capital.
Amy GutmannBorn 1949. Trustee Since June 2006. Principal
Occupation(s) During the Past Five Years and
Other Experience: President of the University
of Pennsylvania; Christopher H. Browne
1 Mr. McNabb is considered an “interested person,” as defined in the Investment Company Act of 1940, because he is an officer of the Vanguard funds.
2 December 2002 for Vanguard Equity Income Fund, the Vanguard Municipal Bond Funds, and the Vanguard State Tax-Exempt Funds.
Distinguished Professor of Political Science,
School of Arts and Sciences, and Professor
of Communication, Annenberg School for
Communication, with secondary faculty appoint-
ments in the Department of Philosophy, School
of Arts and Sciences, and at the Graduate School
of Education, University of Pennsylvania; Trustee
of the National Constitution Center.
JoAnn Heffernan HeisenBorn 1950. Trustee Since July 1998. Principal
Occupation(s) During the Past Five Years and
Other Experience: Corporate Vice President
and Member of the Executive Committee
(1997–2008), Chief Global Diversity Officer
(retired 2008), Vice President and Chief
Information Officer (1997–2006), Controller
(1995–1997), Treasurer (1991–1995), and
Assistant Treasurer (1989–1991) of Johnson
& Johnson (pharmaceuticals/medical devices/
consumer products); Director of Skytop Lodge
Corporation (hotels) and the Robert Wood
Johnson Foundation; Member of the Advisory
Board of the Institute for Women’s Leadership
at Rutgers University.
F. Joseph LoughreyBorn 1949. Trustee Since October 2009.
Principal Occupation(s) During the Past Five
Years and Other Experience: President and Chief
Operating Officer (retired 2009) of Cummins Inc.
(industrial machinery); Chairman of the Board of
Hillenbrand, Inc. (specialized consumer services),
Oxfam America, and the Lumina Foundation for
Education; Director of the V Foundation for
Cancer Research; Member of the Advisory
Council for the College of Arts and Letters
and Chair of the Advisory Board to the Kellogg
Institute for International Studies, both at the
University of Notre Dame.
Mark LoughridgeBorn 1953. Trustee Since March 2012. Principal
Occupation(s) During the Past Five Years and
Other Experience: Senior Vice President and
Chief Financial Officer (retired 2013) at IBM
(information technology services); Fiduciary
Member of IBM’s Retirement Plan Committee
(2004–2013); Director of the Dow Chemical
Company; Member of the Council on
Chicago Booth.
Scott C. MalpassBorn 1962. Trustee Since March 2012. Principal
Occupation(s) During the Past Five Years and
Other Experience: Chief Investment Officer and
Vice President at the University of Notre Dame;
Assistant Professor of Finance at the Mendoza
College of Business at Notre Dame; Member of
the Notre Dame 403(b) Investment Committee,
the Board of Advisors for Spruceview Capital
Partners, the Board of Catholic Investment
Services, Inc. (investment advisor), and the
Board of Superintendence of the Institute for
the Works of Religion; Chairman of the Board of
TIFF Advisory Services, Inc. (investment advisor).
André F. PeroldBorn 1952. Trustee Since December 2004.
Principal Occupation(s) During the Past Five Years
and Other Experience: George Gund Professor of
Finance and Banking, Emeritus at the Harvard
Business School (retired 2011); Chief Investment
Officer and Co-Managing Partner of HighVista
Strategies LLC (private investment firm);
Overseer of the Museum of Fine Arts Boston.
Peter F. VolanakisBorn 1955. Trustee Since July 2009. Principal
Occupation(s) During the Past Five Years and
Other Experience: President and Chief Operating
Officer (retired 2010) of Corning Incorporated
(communications equipment); Chairman of the
Board of Trustees of Colby-Sawyer College;
Member of the Board of Hypertherm, Inc.
(industrial cutting systems, software, and
consumables).
Executive Officers
Glenn BooraemBorn 1967. Investment Stewardship Officer Since
February 2017. Principal Occupation(s) During the
Past Five Years and Other Experience: Principal of
The Vanguard Group, Inc.; Treasurer (2015–2017),
Controller (2010–2015), and Assistant Controller
(2001–2010) of each of the investment companies
served by The Vanguard Group.
Thomas J. HigginsBorn 1957. Chief Financial Officer Since
September 2008. Principal Occupation(s) During
the Past Five Years and Other Experience: Principal
of The Vanguard Group, Inc.; Chief Financial Officer
of each of the investment companies served by
The Vanguard Group; Treasurer of each of the
investment companies served by The Vanguard
Group (1998–2008).
Peter MahoneyBorn 1974. Controller Since May 2015. Principal
Occupation(s) During the Past Five Years and
Other Experience: Principal of The Vanguard
Group, Inc.; Controller of each of the investment
companies served by The Vanguard Group; Head
of International Fund Services at The Vanguard
Group (2008–2014).
Anne E. RobinsonBorn 1970. Secretary Since September 2016.
Principal Occupation(s) During the Past Five Years
and Other Experience: Managing Director of The
Vanguard Group, Inc.; General Counsel of The
Vanguard Group; Secretary of The Vanguard Group
and of each of the investment companies served
by The Vanguard Group; Director and Senior Vice
President of Vanguard Marketing Corporation;
Managing Director and General Counsel of Global
Cards and Consumer Services at Citigroup
(2014–2016); Counsel at American Express
(2003–2014).
Michael RollingsBorn 1963. Treasurer Since February 2017.
Principal Occupation(s) During the Past Five
Years and Other Experience: Managing Director
of The Vanguard Group, Inc.; Treasurer of each
of the investment companies served by The
Vanguard Group; Director of Vanguard Marketing
Corporation; Executive Vice President and Chief
Financial Officer of MassMutual Financial Group
(2006–2016).
Vanguard Senior Management Team
Mortimer J. Buckley Chris D. McIsaac Gregory Davis James M. Norris John James Thomas M. Rampulla Martha G. King Karin A. Risi John T. Marcante
Chairman Emeritus and Senior Advisor
John J. BrennanChairman, 1996–2009
Chief Executive Officer and President, 1996–2008
Founder
John C. BogleChairman and Chief Executive Officer, 1974–1996
P.O. Box 2600
Valley Forge, PA 19482-2600
Connect with Vanguard® > vanguard.com
Fund Information > 800-662-7447
Direct Investor Account Services > 800-662-2739
Institutional Investor Services > 800-523-1036
Text Telephone for PeopleWho Are Deaf or Hard of Hearing > 800-749-7273
This material may be used in conjunctionwith the offering of shares of any Vanguardfund only if preceded or accompanied bythe fund’s current prospectus.
All comparative mutual fund data are from Lipper, aThomson Reuters Company, or Morningstar, Inc., unlessotherwise noted.
You can obtain a free copy of Vanguard’s proxy votingguidelines by visiting vanguard.com/proxyreporting or bycalling Vanguard at 800-662-2739. The guidelines arealso available from the SEC’s website, sec.gov. Inaddition, you may obtain a free report on how your fundvoted the proxies for securities it owned during the 12months ended June 30. To get the report, visit eithervanguard.com/proxyreporting or sec.gov.
You can review and copy information about your fund atthe SEC’s Public Reference Room in Washington, D.C. Tofind out more about this public service, call the SEC at202-551-8090. Information about your fund is alsoavailable on the SEC’s website, and you can receivecopies of this information, for a fee, by sending arequest in either of two ways: via email addressed [email protected] or via regular mail addressed to thePublic Reference Section, Securities and ExchangeCommission, Washington, DC 20549-1520.
The index is a product of S&P Dow Jones Indices LLC(“SPDJI”), and has been licensed for use by Vanguard. Standard & Poor’s® and S&P® are registeredtrademarks of Standard & Poor’s Financial Services LLC(“S&P”); Dow Jones® is a registered trademark of DowJones Trademark Holdings LLC (“Dow Jones”); S&P®and S&P 500® are trademarks of S&P; and thesetrademarks have been licensed for use by SPDJI andsublicensed for certain purposes by Vanguard. Vanguard product(s) are not sponsored, endorsed, soldor promoted by SPDJI, Dow Jones, S&P, or theirrespective affiliates and none of such parties make anyrepresentation regarding the advisability of investing insuch product(s) nor do they have any liability for anyerrors, omissions, or interruptions of the index.
© 2017 The Vanguard Group, Inc.All rights reserved.Vanguard Marketing Corporation, Distributor.
Q18420 102017


