
Vanguard S&P Small-Cap 600 Index Funds
Vanguard S&P Small-Cap 600 Index Fund
Vanguard S&P Small-Cap 600 Value Index Fund
Vanguard S&P Small-Cap 600 Growth Index Fund
Annual Report | August 31, 2017
Contents
Please note: The opinions expressed in this report are just that—informed opinions. They should not be considered promisesor advice. Also, please keep in mind that the information and opinions cover the period through the date on the front of thisreport. Of course, the risks of investing in your fund are spelled out in the prospectus.
See the Glossary for definitions of investment terms used in this report.About the cover: Nautical images have been part of Vanguard’s rich heritage since its start in 1975. For anincoming ship, a lighthouse offers a beacon and safe path to shore. You can similarly depend on Vanguard to putyou first––and light the way––as you strive to meet your financial goals. Our client focus and low costs,stemming from our unique ownership structure, assure that your interests are paramount.
Vanguard’s Principles for Investing Success
We want to give you the best chance of investment success. Theseprinciples, grounded in Vanguard’s research and experience, can put you onthe right path.
Goals. Create clear, appropriate investment goals.
Balance. Develop a suitable asset allocation using broadly diversified funds.
Cost. Minimize cost.
Discipline. Maintain perspective and long-term discipline.
A single theme unites these principles: Focus on the things you can control.We believe there is no wiser course for any investor.
Your Fund’s Performance at a Glance. . . . . . . . . . . . . . . . . . 1
Chairman’s Perspective. . . . . . . . . . . . . . . . . . . . . . . . . . . . . 4
S&P Small-Cap 600 Index Fund. . . . . . . . . . . . . . . . . . . . . . . 8
S&P Small-Cap 600 Value Index Fund. . . . . . . . . . . . . . . . . 31
S&P Small-Cap 600 Growth Index Fund. . . . . . . . . . . . . . . .51
Your Fund’s After-Tax Returns. . . . . . . . . . . . . . . . . . . . . . . 69
About Your Fund’s Expenses. . . . . . . . . . . . . . . . . . . . . . . . 70
Trustees Approve Advisory Arrangements. . . . . . . . . . . . . .72
Glossary. . . . . . . . . . . . . . . . . . . . . . . . . . . . . . . . . . . . . . . . 74
Your Fund’s Performance at a Glance
1
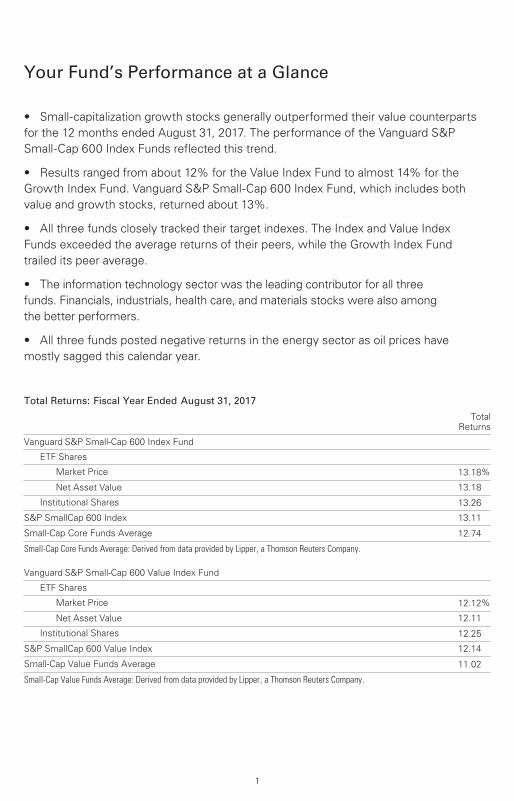
Total Returns: Fiscal Year Ended August 31, 2017
TotalReturns
Vanguard S&P Small-Cap 600 Index Fund
ETF Shares
Market Price 13.18%
Net Asset Value 13.18
Institutional Shares 13.26
S&P SmallCap 600 Index 13.11
Small-Cap Core Funds Average 12.74
Small-Cap Core Funds Average: Derived from data provided by Lipper, a Thomson Reuters Company.
Vanguard S&P Small-Cap 600 Value Index Fund
ETF Shares
Market Price 12.12%
Net Asset Value 12.11
Institutional Shares 12.25
S&P SmallCap 600 Value Index 12.14
Small-Cap Value Funds Average 11.02
Small-Cap Value Funds Average: Derived from data provided by Lipper, a Thomson Reuters Company.
• Small-capitalization growth stocks generally outperformed their value counterparts
for the 12 months ended August 31, 2017. The performance of the Vanguard S&P
Small-Cap 600 Index Funds reflected this trend.
• Results ranged from about 12% for the Value Index Fund to almost 14% for the
Growth Index Fund. Vanguard S&P Small-Cap 600 Index Fund, which includes both
value and growth stocks, returned about 13%.
• All three funds closely tracked their target indexes. The Index and Value Index
Funds exceeded the average returns of their peers, while the Growth Index Fund
trailed its peer average.
• The information technology sector was the leading contributor for all three
funds. Financials, industrials, health care, and materials stocks were also among
the better performers.
• All three funds posted negative returns in the energy sector as oil prices have
mostly sagged this calendar year.
2
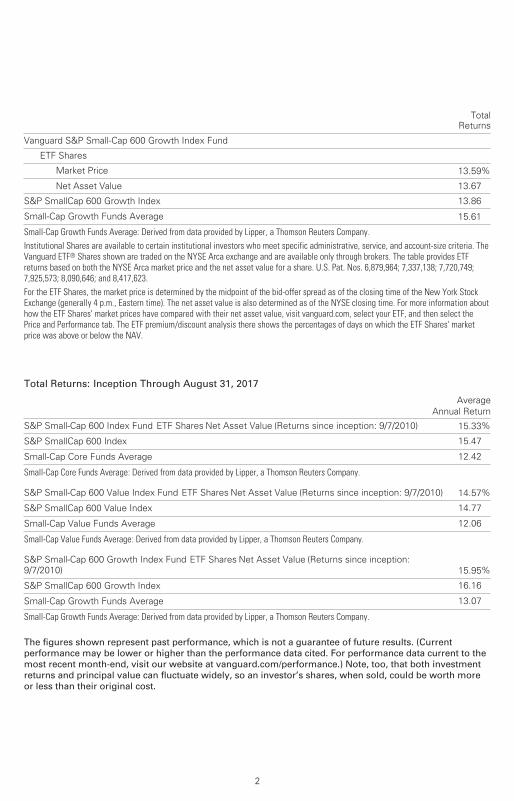
TotalReturns
Vanguard S&P Small-Cap 600 Growth Index Fund
ETF Shares
Market Price 13.59%
Net Asset Value 13.67
S&P SmallCap 600 Growth Index 13.86
Small-Cap Growth Funds Average 15.61
Small-Cap Growth Funds Average: Derived from data provided by Lipper, a Thomson Reuters Company. Institutional Shares are available to certain institutional investors who meet specific administrative, service, and account-size criteria. TheVanguard ETF® Shares shown are traded on the NYSE Arca exchange and are available only through brokers. The table provides ETFreturns based on both the NYSE Arca market price and the net asset value for a share. U.S. Pat. Nos. 6,879,964; 7,337,138; 7,720,749;7,925,573; 8,090,646; and 8,417,623.For the ETF Shares, the market price is determined by the midpoint of the bid-offer spread as of the closing time of the New York Stock Exchange (generally 4 p.m., Eastern time). The net asset value is also determined as of the NYSE closing time. For more information about how the ETF Shares' market prices have compared with their net asset value, visit vanguard.com, select your ETF, and then select the Price and Performance tab. The ETF premium/discount analysis there shows the percentages of days on which the ETF Shares' market price was above or below the NAV.
Total Returns: Inception Through August 31, 2017
Average
Annual Return
S&P Small-Cap 600 Index Fund ETF Shares Net Asset Value (Returns since inception: 9/7/2010) 15.33%
S&P SmallCap 600 Index 15.47
Small-Cap Core Funds Average 12.42
Small-Cap Core Funds Average: Derived from data provided by Lipper, a Thomson Reuters Company.
S&P Small-Cap 600 Value Index Fund ETF Shares Net Asset Value (Returns since inception: 9/7/2010) 14.57%
S&P SmallCap 600 Value Index 14.77
Small-Cap Value Funds Average 12.06
Small-Cap Value Funds Average: Derived from data provided by Lipper, a Thomson Reuters Company.
S&P Small-Cap 600 Growth Index Fund ETF Shares Net Asset Value (Returns since inception:
9/7/2010) 15.95%
S&P SmallCap 600 Growth Index 16.16
Small-Cap Growth Funds Average 13.07
Small-Cap Growth Funds Average: Derived from data provided by Lipper, a Thomson Reuters Company.
The figures shown represent past performance, which is not a guarantee of future results. (Current performance may be lower or higher than the performance data cited. For performance data current to the most recent month-end, visit our website at vanguard.com/performance.) Note, too, that both investment returns and principal value can fluctuate widely, so an investor’s shares, when sold, could be worth more or less than their original cost.
3
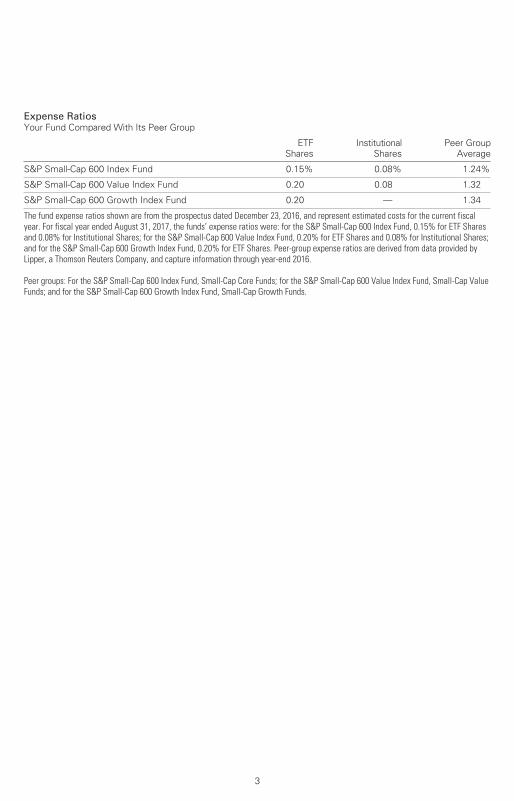
Expense RatiosYour Fund Compared With Its Peer Group
ETF
Shares
Institutional
Shares
Peer Group
Average
S&P Small-Cap 600 Index Fund 0.15% 0.08% 1.24%
S&P Small-Cap 600 Value Index Fund 0.20 0.08 1.32
S&P Small-Cap 600 Growth Index Fund 0.20 — 1.34
The fund expense ratios shown are from the prospectus dated December 23, 2016, and represent estimated costs for the current fiscalyear. For fiscal year ended August 31, 2017, the funds’ expense ratios were: for the S&P Small-Cap 600 Index Fund, 0.15% for ETF Sharesand 0.08% for Institutional Shares; for the S&P Small-Cap 600 Value Index Fund, 0.20% for ETF Shares and 0.08% for Institutional Shares;and for the S&P Small-Cap 600 Growth Index Fund, 0.20% for ETF Shares. Peer-group expense ratios are derived from data provided byLipper, a Thomson Reuters Company, and capture information through year-end 2016.
Peer groups: For the S&P Small-Cap 600 Index Fund, Small-Cap Core Funds; for the S&P Small-Cap 600 Value Index Fund, Small-Cap ValueFunds; and for the S&P Small-Cap 600 Growth Index Fund, Small-Cap Growth Funds.
Dear Shareholder,
Since mid-August we’ve been reaching
out to you about the proposals put forth
by the Vanguard funds that, if approved,
will enable us to manage the funds more
efficiently and effectively. As the November
deadline for voting approaches, I’d like to
offer some perspective on a few of the
proposals that I believe are important to
the way Vanguard operates and manages
your investments. I hope you consider this
information and promptly cast your ballot.
Your biggest advocateThe main driver for this proxy solicitation
is to ask all our fund shareholders to elect
a full slate of trustees who oversee each
U.S.-based Vanguard mutual fund. These
trustees serve an important role, making
sure your funds are managed in your
best interests. This includes monitoring
fund performance, approving advisory
agreements, and ensuring that we’re
keeping your investment costs as low
as possible. Simply put, they are your
biggest advocate.
Each trustee brings a variety of skills and
professional experiences that contribute
to the board’s strength and diversity.
Of the 12 nominees, nine currently
serve on the board, and three are new.
If elected, the new board would include
ten independent members, meaning they
have no affiliation with Vanguard or the
funds apart from any investments they
may choose to make as private individuals.
Chairman’s Perspective
Bill McNabbChairman and Chief Executive Officer
4
These are the proposed new trustees:
• Sarah Bloom Raskin is a former
member of the Federal Reserve Board
of Governors and former deputy secretary
of the U.S. Treasury Department. She is
an expert in cybersecurity—a critically
important issue at Vanguard, as we place
a premium on protecting clients’ assets
and sensitive data.
• Deanna Mulligan is chief executive
officer of The Guardian Life Insurance
Company of America. It’s rare to find
a CEO such as Deanna who leads a
company with a mutual ownership
structure similar to Vanguard’s.
• Tim Buckley is president and a director
of Vanguard and will succeed me in
January as CEO. (I’ll remain chairman for
a period to be determined by the board.)
I interviewed Tim when he applied for his
first job here in 1991 and again when he
was graduating from Harvard Business
School. I was thrilled he picked Vanguard
as a place to build his career, and I’ve
been delighted to see him take on several
leadership positions, including as head of
our Retail Investor Group, chief information
officer, and chief investment officer. I can
think of no one better prepared to
succeed me.
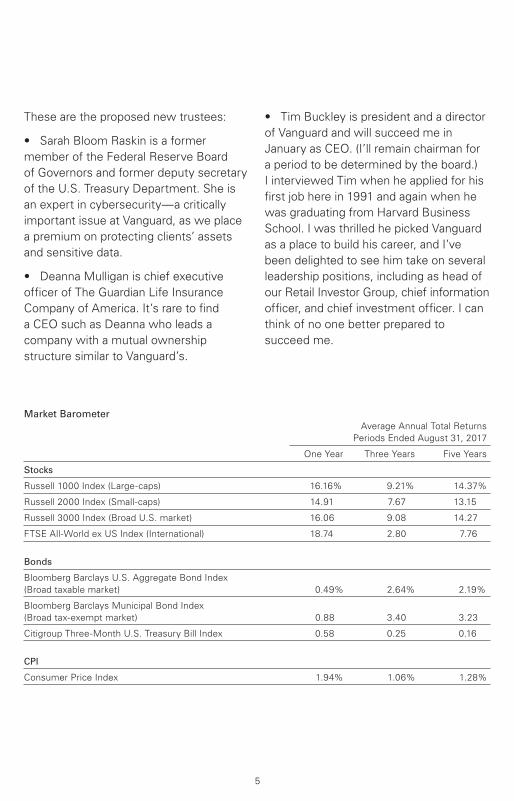
Market Barometer Average Annual Total Returns
Periods Ended August 31, 2017
One Year Three Years Five Years
Stocks
Russell 1000 Index (Large-caps) 16.16% 9.21% 14.37%
Russell 2000 Index (Small-caps) 14.91 7.67 13.15
Russell 3000 Index (Broad U.S. market) 16.06 9.08 14.27
FTSE All-World ex US Index (International) 18.74 2.80 7.76
Bonds
Bloomberg Barclays U.S. Aggregate Bond Index
(Broad taxable market) 0.49% 2.64% 2.19%
Bloomberg Barclays Municipal Bond Index
(Broad tax-exempt market) 0.88 3.40 3.23
Citigroup Three-Month U.S. Treasury Bill Index 0.58 0.25 0.16
CPI
Consumer Price Index 1.94% 1.06% 1.28%
5
Vanguard believes that diversity of
thought, background, and experience, as
well as diversity of personal characteristics,
meaningfully contributes to the board’s
ability to effectively serve shareholders.
If Sarah and Deanna are elected, women
will account for 40% of the board’s
independent trustees.
I should note that even as Vanguard is
nominating three new board members,
we’re saying goodbye to trustee Rajiv
Gupta. Rajiv was a legendary CEO of
Rohm and Haas Co., and Vanguard
and our clients have benefited greatly
from his expertise. I wish him a happy
retirement.
Summarizing the proposalsAmong the trustees’ leading responsibilities
is overseeing the funds’ internal and
external investment advisory agreements.
The trustees, in consultation with our
Global Investment Committee and our
Portfolio Review Department, choose the
investment advisors that manage client
assets. Over decades, we have built a
strong track record of picking advisors
whose portfolio management strategies
have served clients well.
Two proposals in the proxy focus on this
oversight responsibility. Shareholders of
48 Vanguard funds have already voted to
allow the board to make external advisor
changes without obtaining prior shareholder
approval. The new proposals would extend
that policy across our entire U.S.-based
fund lineup and expand it to include
internal advisory agreements with
Vanguard subsidiaries. Eliminating the
need for shareholder approval removes
a step that is costly and time-consuming
if done frequently or on an individual fund
basis. Although there are no current plans
to employ the policy on any Vanguard-
managed funds, standardizing it enables
the trustees to retain an advisory firm
to diversify a fund’s management team
or ensure management continuity should
a contingency arise.
I also encourage shareholders of several
specific Vanguard index funds to read the
proxy proposals that affect those funds.
One proposal would change the investment
objective of Vanguard REIT Index Fund
and Vanguard Variable Insurance Fund
REIT Index Portfolio to include real estate-
related securities, aligning the funds with
updated industry-sector classification
methodology. Another proposal seeks
to change the diversification status of
the REIT Index Fund to enable it to better
track its benchmark. Finally, we seek your
approval of the Funds’ Service Agreement
for Vanguard Institutional Index Fund and
Vanguard Institutional Total Stock Market
Index Fund. If approved, this arrangement
would then be standardized across
Vanguard’s entire publicly available U.S.
mutual fund lineup. It should also reduce
costs and minimum initial investment
requirements in select share classes.
6
At the ballot boxWe hope you’ll make it a priority to
cast your ballot. We want to avoid
the added time and cost of soliciting
sufficient votes should we not obtain
a quorum by the shareholder meeting
on November 15, when voting concludes.
Ultimately, we believe the proposals I’ve
discussed are in your best interest as
Vanguard fund shareholders, and the
trustees recommend that you vote in
favor of them. For more information,
visit vanguard.com and enter the
search term “proxy.”
As always, thank you for investing
with Vanguard.
Sincerely,
F. William McNabb III
Chairman and Chief Executive Officer
September 14, 2017
7
S&P Small-Cap 600 Index Fund
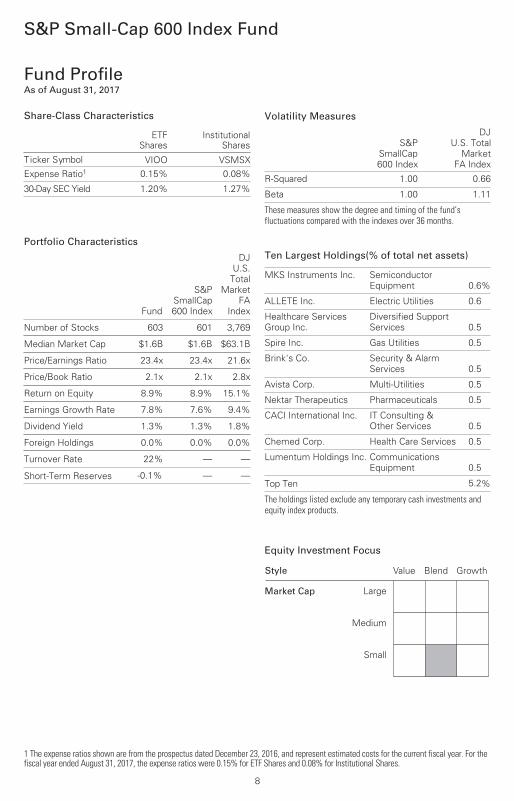
Fund ProfileAs of August 31, 2017
1 The expense ratios shown are from the prospectus dated December 23, 2016, and represent estimated costs for the current fiscal year. For the fiscal year ended August 31, 2017, the expense ratios were 0.15% for ETF Shares and 0.08% for Institutional Shares.
8
Volatility Measures
S&P
SmallCap
600 Index
DJ
U.S. Total
Market
FA Index
R-Squared 1.00 0.66
Beta 1.00 1.11
These measures show the degree and timing of the fund’s fluctuations compared with the indexes over 36 months.
Portfolio Characteristics
Fund
S&P
SmallCap
600 Index
DJ
U.S.
Total
Market
FA
Index
Number of Stocks 603 601 3,769
Median Market Cap $1.6B $1.6B $63.1B
Price/Earnings Ratio 23.4x 23.4x 21.6x
Price/Book Ratio 2.1x 2.1x 2.8x
Return on Equity 8.9% 8.9% 15.1%
Earnings Growth Rate 7.8% 7.6% 9.4%
Dividend Yield 1.3% 1.3% 1.8%
Foreign Holdings 0.0% 0.0% 0.0%
Turnover Rate 22% — —
Short-Term Reserves -0.1% — —
Share-Class Characteristics
ETFShares
InstitutionalShares
Ticker Symbol VIOO VSMSXExpense Ratio1 0.15% 0.08%
30-Day SEC Yield 1.20% 1.27%
Ten Largest Holdings(% of total net assets)
MKS Instruments Inc. Semiconductor
Equipment 0.6%
ALLETE Inc. Electric Utilities 0.6
Healthcare Services
Group Inc.
Diversified Support
Services 0.5
Spire Inc. Gas Utilities 0.5
Brink's Co. Security & Alarm
Services 0.5
Avista Corp. Multi-Utilities 0.5
Nektar Therapeutics Pharmaceuticals 0.5
CACI International Inc. IT Consulting &
Other Services 0.5
Chemed Corp. Health Care Services 0.5
Lumentum Holdings Inc. Communications
Equipment 0.5
Top Ten 5.2%
The holdings listed exclude any temporary cash investments andequity index products.
Equity Investment Focus
Market Cap
Value
Large
Medium
Small
Blend Growth Style
S&P Small-Cap 600 Index Fund
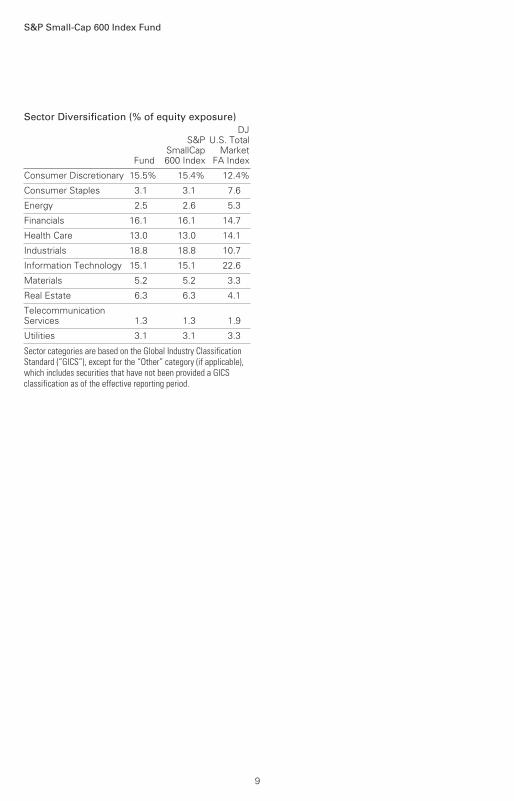
Sector Diversification (% of equity exposure)
Fund
S&PSmallCap600 Index
DJU.S. Total
MarketFA Index
Consumer Discretionary 15.5% 15.4% 12.4%
Consumer Staples 3.1 3.1 7.6
Energy 2.5 2.6 5.3
Financials 16.1 16.1 14.7
Health Care 13.0 13.0 14.1
Industrials 18.8 18.8 10.7
Information Technology 15.1 15.1 22.6
Materials 5.2 5.2 3.3
Real Estate 6.3 6.3 4.1
TelecommunicationServices 1.3 1.3 1.9
Utilities 3.1 3.1 3.3
Sector categories are based on the Global Industry ClassificationStandard (“GICS”), except for the “Other” category (if applicable),which includes securities that have not been provided a GICSclassification as of the effective reporting period.
9
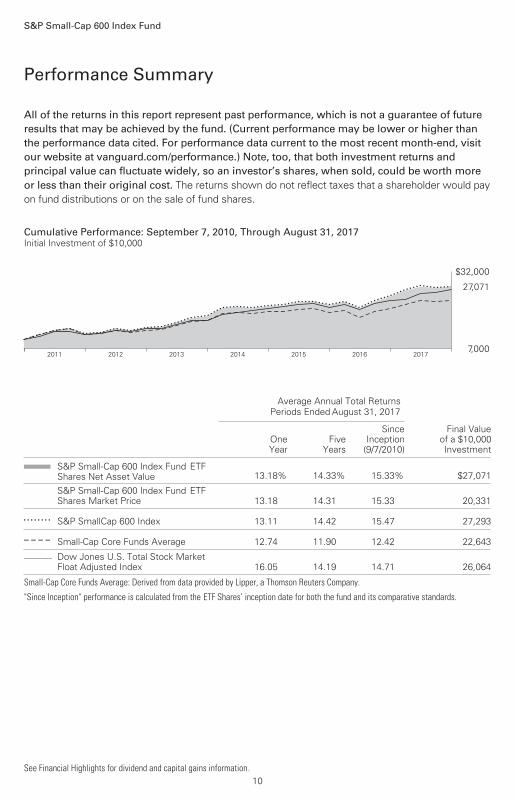
All of the returns in this report represent past performance, which is not a guarantee of future results that may be achieved by the fund. (Current performance may be lower or higher thanthe performance data cited. For performance data current to the most recent month-end, visitour website at vanguard.com/performance.) Note, too, that both investment returns and principal value can fluctuate widely, so an investor’s shares, when sold, could be worth more or less than their original cost. The returns shown do not reflect taxes that a shareholder would pay
on fund distributions or on the sale of fund shares.
Performance Summary
S&P Small-Cap 600 Index Fund
See Financial Highlights for dividend and capital gains information.10
Cumulative Performance: September 7, 2010, Through August 31, 2017Initial Investment of $10,000
2017201620152014201320122011
$32,000
7,000
27,071
Average Annual Total Returns
Periods Ended August 31, 2017
OneYear
FiveYears
SinceInception
(9/7/2010)
Final Valueof a $10,000Investment
S&P Small-Cap 600 Index Fund*ETFShares Net Asset Value 13.18% 14.33% 15.33% $27,071
S&P Small-Cap 600 Index Fund*ETFShares Market Price 13.18 14.31 15.33 20,331
• • • • • • • • S&P SmallCap 600 Index 13.11 14.42 15.47 27,293
– – – – Small-Cap Core Funds Average 12.74 11.90 12.42 22,643________ Dow Jones U.S. Total Stock Market
Float Adjusted Index 16.05 14.19 14.71 26,064
Small-Cap Core Funds Average: Derived from data provided by Lipper, a Thomson Reuters Company.
"Since Inception" performance is calculated from the ETF Shares’ inception date for both the fund and its comparative standards.
S&P Small-Cap 600 Index Fund
11
Average Annual Total Returns
Periods Ended August 31, 2017
OneYear
FiveYears
SinceInception
(4/1/2011)
Final Valueof a $5,000,000
Investment
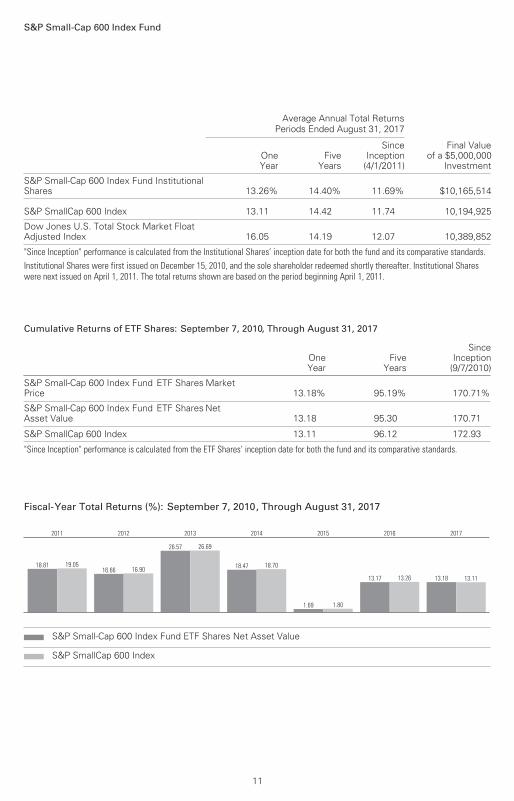
S&P Small-Cap 600 Index Fund InstitutionalShares 13.26% 14.40% 11.69% $10,165,514
S&P SmallCap 600 Index 13.11 14.42 11.74 10,194,925
Dow Jones U.S. Total Stock Market FloatAdjusted Index 16.05 14.19 12.07 10,389,852
"Since Inception" performance is calculated from the Institutional Shares’ inception date for both the fund and its comparative standards.Institutional Shares were first issued on December 15, 2010, and the sole shareholder redeemed shortly thereafter. Institutional Shareswere next issued on April 1, 2011. The total returns shown are based on the period beginning April 1, 2011.
Cumulative Returns of ETF Shares: September 7, 2010, Through August 31, 2017
OneYear
FiveYears
SinceInception
(9/7/2010)
S&P Small-Cap 600 Index Fund ETF Shares MarketPrice 13.18% 95.19% 170.71%
S&P Small-Cap 600 Index Fund ETF Shares NetAsset Value 13.18 95.30 170.71
S&P SmallCap 600 Index 13.11 96.12 172.93
"Since Inception" performance is calculated from the ETF Shares’ inception date for both the fund and its comparative standards.
Fiscal-Year Total Returns (%): September 7, 2010, Through August 31, 2017
18.81 19.05
2011
16.66 16.90
2012
26.57 26.69
2013
18.47 18.70
2014
1.69 1.80
2015
13.17 13.26
2016
13.18 13.11
2017
S&P Small-Cap 600 Index Fund ETF Shares Net Asset Value
S&P SmallCap 600 Index
S&P Small-Cap 600 Index Fund
12
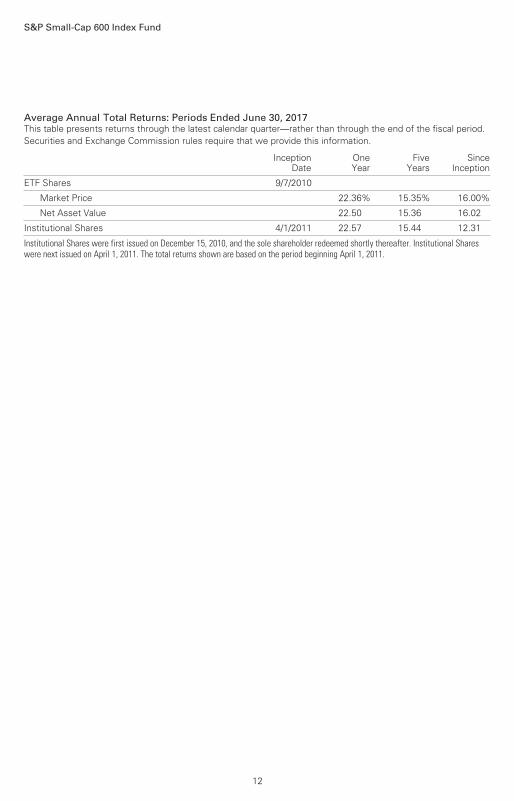
Average Annual Total Returns: Periods Ended June 30, 2017This table presents returns through the latest calendar quarter—rather than through the end of the fiscal period.Securities and Exchange Commission rules require that we provide this information.
InceptionDate
OneYear
FiveYears
SinceInception
ETF Shares 9/7/2010
Market Price 22.36% 15.35% 16.00%
Net Asset Value 22.50 15.36 16.02
Institutional Shares 4/1/2011 22.57 15.44 12.31
Institutional Shares were first issued on December 15, 2010, and the sole shareholder redeemed shortly thereafter. Institutional Shareswere next issued on April 1, 2011. The total returns shown are based on the period beginning April 1, 2011.
Market
Value•
Shares ($000)
Market
Value•
Shares ($000)
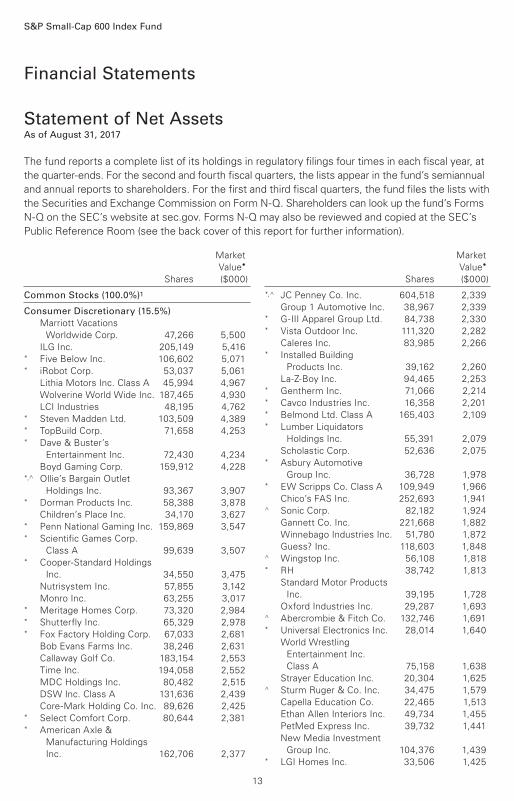
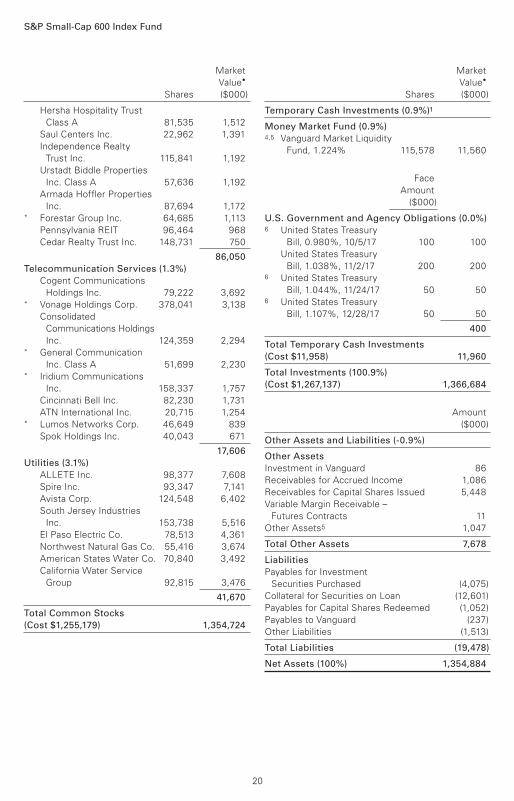
Common Stocks (100.0%)1
Consumer Discretionary (15.5%)
Marriott Vacations
Worldwide Corp. 47,266 5,500
ILG Inc. 205,149 5,416* Five Below Inc. 106,602 5,071* iRobot Corp. 53,037 5,061
Lithia Motors Inc. Class A 45,994 4,967
Wolverine World Wide Inc. 187,465 4,930
LCI Industries 48,195 4,762* Steven Madden Ltd. 103,509 4,389* TopBuild Corp. 71,658 4,253* Dave & Buster’s
Entertainment Inc. 72,430 4,234
Boyd Gaming Corp. 159,912 4,228*,^ Ollie’s Bargain Outlet
Holdings Inc. 93,367 3,907* Dorman Products Inc. 58,388 3,878
Children’s Place Inc. 34,170 3,627* Penn National Gaming Inc. 159,869 3,547* Scientific Games Corp.
Class A 99,639 3,507* Cooper-Standard Holdings
Inc. 34,550 3,475
Nutrisystem Inc. 57,855 3,142
Monro Inc. 63,255 3,017* Meritage Homes Corp. 73,320 2,984* Shutterfly Inc. 65,329 2,978* Fox Factory Holding Corp. 67,033 2,681
Bob Evans Farms Inc. 38,246 2,631
Callaway Golf Co. 183,154 2,553
Time Inc. 194,058 2,552
MDC Holdings Inc. 80,482 2,515
DSW Inc. Class A 131,636 2,439
Core-Mark Holding Co. Inc. 89,626 2,425* Select Comfort Corp. 80,644 2,381* American Axle &
Manufacturing Holdings
Inc. 162,706 2,377
*,^ JC Penney Co. Inc. 604,518 2,339
Group 1 Automotive Inc. 38,967 2,339* G-III Apparel Group Ltd. 84,738 2,330* Vista Outdoor Inc. 111,320 2,282
Caleres Inc. 83,985 2,266* Installed Building
Products Inc. 39,162 2,260
La-Z-Boy Inc. 94,465 2,253* Gentherm Inc. 71,066 2,214* Cavco Industries Inc. 16,358 2,201* Belmond Ltd. Class A 165,403 2,109* Lumber Liquidators
Holdings Inc. 55,391 2,079
Scholastic Corp. 52,636 2,075* Asbury Automotive
Group Inc. 36,728 1,978* EW Scripps Co. Class A 109,949 1,966
Chico’s FAS Inc. 252,693 1,941^ Sonic Corp. 82,182 1,924
Gannett Co. Inc. 221,668 1,882
Winnebago Industries Inc. 51,780 1,872
Guess? Inc. 118,603 1,848^ Wingstop Inc. 56,108 1,818* RH 38,742 1,813
Standard Motor Products
Inc. 39,195 1,728
Oxford Industries Inc. 29,287 1,693^ Abercrombie & Fitch Co. 132,746 1,691* Universal Electronics Inc. 28,014 1,640
World Wrestling
Entertainment Inc.
Class A 75,158 1,638
Strayer Education Inc. 20,304 1,625^ Sturm Ruger & Co. Inc. 34,475 1,579
Capella Education Co. 22,465 1,513
Ethan Allen Interiors Inc. 49,734 1,455
PetMed Express Inc. 39,732 1,441
New Media Investment
Group Inc. 104,376 1,439* LGI Homes Inc. 33,506 1,425
Financial Statements
Statement of Net AssetsAs of August 31, 2017
The fund reports a complete list of its holdings in regulatory filings four times in each fiscal year, at
the quarter-ends. For the second and fourth fiscal quarters, the lists appear in the fund’s semiannual
and annual reports to shareholders. For the first and third fiscal quarters, the fund files the lists with
the Securities and Exchange Commission on Form N-Q. Shareholders can look up the fund’s Forms
N-Q on the SEC’s website at sec.gov. Forms N-Q may also be reviewed and copied at the SEC’s
Public Reference Room (see the back cover of this report for further information).
S&P Small-Cap 600 Index Fund
13
S&P Small-Cap 600 Index Fund
Market
Value•
Shares ($000)
Market
Value•
Shares ($000)
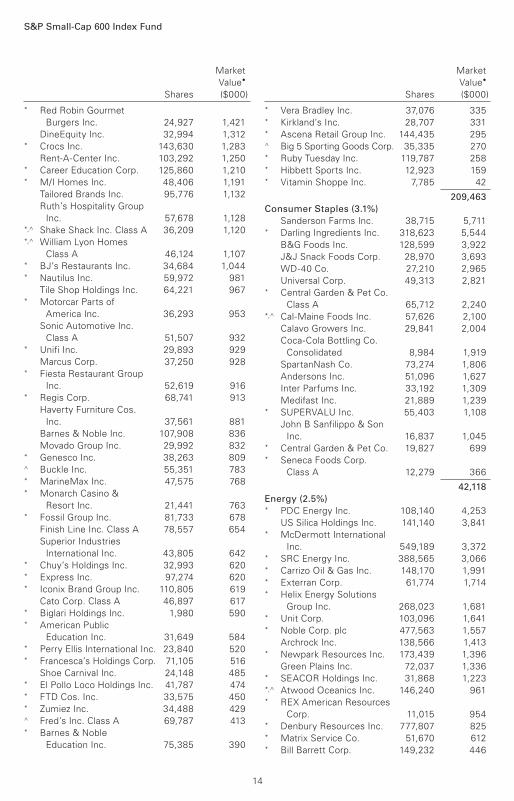
* Red Robin Gourmet
Burgers Inc. 24,927 1,421
DineEquity Inc. 32,994 1,312* Crocs Inc. 143,630 1,283
Rent-A-Center Inc. 103,292 1,250* Career Education Corp. 125,860 1,210* M/I Homes Inc. 48,406 1,191
Tailored Brands Inc. 95,776 1,132
Ruth’s Hospitality Group
Inc. 57,678 1,128*,^ Shake Shack Inc. Class A 36,209 1,120*,^ William Lyon Homes
Class A 46,124 1,107* BJ’s Restaurants Inc. 34,684 1,044* Nautilus Inc. 59,972 981
Tile Shop Holdings Inc. 64,221 967* Motorcar Parts of
America Inc. 36,293 953
Sonic Automotive Inc.
Class A 51,507 932* Unifi Inc. 29,893 929
Marcus Corp. 37,250 928* Fiesta Restaurant Group
Inc. 52,619 916* Regis Corp. 68,741 913
Haverty Furniture Cos.
Inc. 37,561 881
Barnes & Noble Inc. 107,908 836
Movado Group Inc. 29,992 832* Genesco Inc. 38,263 809^ Buckle Inc. 55,351 783* MarineMax Inc. 47,575 768* Monarch Casino &
Resort Inc. 21,441 763* Fossil Group Inc. 81,733 678
Finish Line Inc. Class A 78,557 654
Superior Industries
International Inc. 43,805 642* Chuy’s Holdings Inc. 32,993 620* Express Inc. 97,274 620* Iconix Brand Group Inc. 110,805 619
Cato Corp. Class A 46,897 617* Biglari Holdings Inc. 1,980 590* American Public
Education Inc. 31,649 584* Perry Ellis International Inc. 23,840 520* Francesca’s Holdings Corp. 71,105 516
Shoe Carnival Inc. 24,148 485* El Pollo Loco Holdings Inc. 41,787 474* FTD Cos. Inc. 33,575 450* Zumiez Inc. 34,488 429^ Fred’s Inc. Class A 69,787 413* Barnes & Noble
Education Inc. 75,385 390
* Vera Bradley Inc. 37,076 335* Kirkland’s Inc. 28,707 331* Ascena Retail Group Inc. 144,435 295^ Big 5 Sporting Goods Corp. 35,335 270* Ruby Tuesday Inc. 119,787 258* Hibbett Sports Inc. 12,923 159* Vitamin Shoppe Inc. 7,785 42
209,463
Consumer Staples (3.1%)
Sanderson Farms Inc. 38,715 5,711* Darling Ingredients Inc. 318,623 5,544
B&G Foods Inc. 128,599 3,922
J&J Snack Foods Corp. 28,970 3,693
WD-40 Co. 27,210 2,965
Universal Corp. 49,313 2,821* Central Garden & Pet Co.
Class A 65,712 2,240*,^ Cal-Maine Foods Inc. 57,626 2,100
Calavo Growers Inc. 29,841 2,004
Coca-Cola Bottling Co.
Consolidated 8,984 1,919
SpartanNash Co. 73,274 1,806
Andersons Inc. 51,096 1,627
Inter Parfums Inc. 33,192 1,309
Medifast Inc. 21,889 1,239* SUPERVALU Inc. 55,403 1,108
John B Sanfilippo & Son
Inc. 16,837 1,045* Central Garden & Pet Co. 19,827 699* Seneca Foods Corp.
Class A 12,279 366
42,118
Energy (2.5%) * PDC Energy Inc. 108,140 4,253
US Silica Holdings Inc. 141,140 3,841* McDermott International
Inc. 549,189 3,372* SRC Energy Inc. 388,565 3,066* Carrizo Oil & Gas Inc. 148,170 1,991* Exterran Corp. 61,774 1,714* Helix Energy Solutions
Group Inc. 268,023 1,681* Unit Corp. 103,096 1,641* Noble Corp. plc 477,563 1,557
Archrock Inc. 138,566 1,413* Newpark Resources Inc. 173,439 1,396
Green Plains Inc. 72,037 1,336* SEACOR Holdings Inc. 31,868 1,223*,^ Atwood Oceanics Inc. 146,240 961* REX American Resources
Corp. 11,015 954* Denbury Resources Inc. 777,807 825* Matrix Service Co. 51,670 612* Bill Barrett Corp. 149,232 446
14
S&P Small-Cap 600 Index Fund
Market
Value•
Shares ($000)
Market
Value•
Shares ($000)
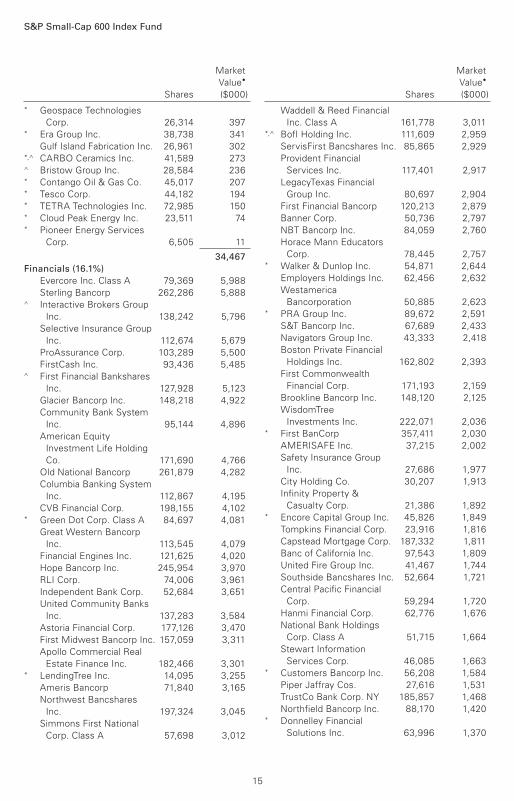
* Geospace Technologies
Corp. 26,314 397* Era Group Inc. 38,738 341
Gulf Island Fabrication Inc. 26,961 302*,^ CARBO Ceramics Inc. 41,589 273^ Bristow Group Inc. 28,584 236* Contango Oil & Gas Co. 45,017 207* Tesco Corp. 44,182 194* TETRA Technologies Inc. 72,985 150* Cloud Peak Energy Inc. 23,511 74* Pioneer Energy Services
Corp. 6,505 11
34,467
Financials (16.1%)
Evercore Inc. Class A 79,369 5,988
Sterling Bancorp 262,286 5,888^ Interactive Brokers Group
Inc. 138,242 5,796
Selective Insurance Group
Inc. 112,674 5,679
ProAssurance Corp. 103,289 5,500
FirstCash Inc. 93,436 5,485^ First Financial Bankshares
Inc. 127,928 5,123
Glacier Bancorp Inc. 148,218 4,922
Community Bank System
Inc. 95,144 4,896
American Equity
Investment Life Holding
Co. 171,690 4,766
Old National Bancorp 261,879 4,282
Columbia Banking System
Inc. 112,867 4,195
CVB Financial Corp. 198,155 4,102* Green Dot Corp. Class A 84,697 4,081
Great Western Bancorp
Inc. 113,545 4,079
Financial Engines Inc. 121,625 4,020
Hope Bancorp Inc. 245,954 3,970
RLI Corp. 74,006 3,961
Independent Bank Corp. 52,684 3,651
United Community Banks
Inc. 137,283 3,584
Astoria Financial Corp. 177,126 3,470
First Midwest Bancorp Inc. 157,059 3,311
Apollo Commercial Real
Estate Finance Inc. 182,466 3,301* LendingTree Inc. 14,095 3,255
Ameris Bancorp 71,840 3,165
Northwest Bancshares
Inc. 197,324 3,045
Simmons First National
Corp. Class A 57,698 3,012
Waddell & Reed Financial
Inc. Class A 161,778 3,011*,^ BofI Holding Inc. 111,609 2,959
ServisFirst Bancshares Inc. 85,865 2,929
Provident Financial
Services Inc. 117,401 2,917
LegacyTexas Financial
Group Inc. 80,697 2,904
First Financial Bancorp 120,213 2,879
Banner Corp. 50,736 2,797
NBT Bancorp Inc. 84,059 2,760
Horace Mann Educators
Corp. 78,445 2,757* Walker & Dunlop Inc. 54,871 2,644
Employers Holdings Inc. 62,456 2,632
Westamerica
Bancorporation 50,885 2,623* PRA Group Inc. 89,672 2,591
S&T Bancorp Inc. 67,689 2,433
Navigators Group Inc. 43,333 2,418
Boston Private Financial
Holdings Inc. 162,802 2,393
First Commonwealth
Financial Corp. 171,193 2,159
Brookline Bancorp Inc. 148,120 2,125
WisdomTree
Investments Inc. 222,071 2,036* First BanCorp 357,411 2,030
AMERISAFE Inc. 37,215 2,002
Safety Insurance Group
Inc. 27,686 1,977
City Holding Co. 30,207 1,913
Infinity Property &
Casualty Corp. 21,386 1,892* Encore Capital Group Inc. 45,826 1,849
Tompkins Financial Corp. 23,916 1,816
Capstead Mortgage Corp. 187,332 1,811
Banc of California Inc. 97,543 1,809
United Fire Group Inc. 41,467 1,744
Southside Bancshares Inc. 52,664 1,721
Central Pacific Financial
Corp. 59,294 1,720
Hanmi Financial Corp. 62,776 1,676
National Bank Holdings
Corp. Class A 51,715 1,664
Stewart Information
Services Corp. 46,085 1,663* Customers Bancorp Inc. 56,208 1,584
Piper Jaffray Cos. 27,616 1,531
TrustCo Bank Corp. NY 185,857 1,468
Northfield Bancorp Inc. 88,170 1,420* Donnelley Financial
Solutions Inc. 63,996 1,370
15
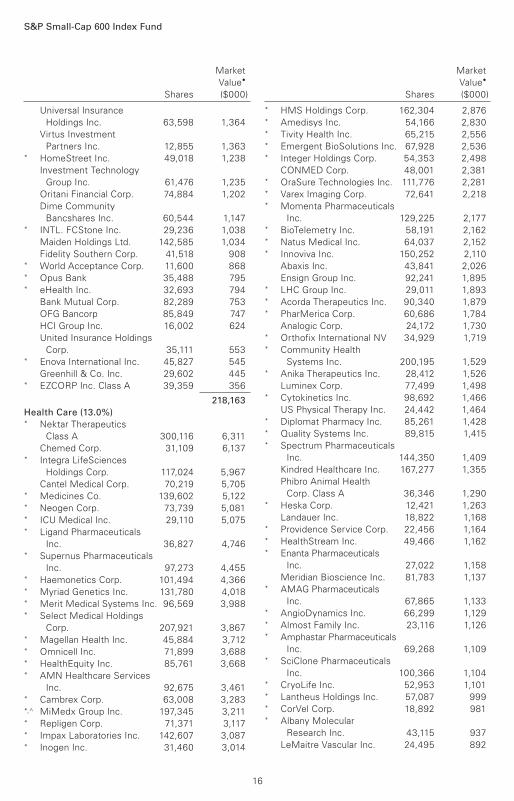
S&P Small-Cap 600 Index Fund
Market
Value•
Shares ($000)
Market
Value•
Shares ($000)
Universal Insurance
Holdings Inc. 63,598 1,364
Virtus Investment
Partners Inc. 12,855 1,363* HomeStreet Inc. 49,018 1,238
Investment Technology
Group Inc. 61,476 1,235
Oritani Financial Corp. 74,884 1,202
Dime Community
Bancshares Inc. 60,544 1,147* INTL. FCStone Inc. 29,236 1,038
Maiden Holdings Ltd. 142,585 1,034
Fidelity Southern Corp. 41,518 908* World Acceptance Corp. 11,600 868* Opus Bank 35,488 795* eHealth Inc. 32,693 794
Bank Mutual Corp. 82,289 753
OFG Bancorp 85,849 747
HCI Group Inc. 16,002 624
United Insurance Holdings
Corp. 35,111 553* Enova International Inc. 45,827 545
Greenhill & Co. Inc. 29,602 445* EZCORP Inc. Class A 39,359 356
218,163
Health Care (13.0%) * Nektar Therapeutics
Class A 300,116 6,311
Chemed Corp. 31,109 6,137* Integra LifeSciences
Holdings Corp. 117,024 5,967
Cantel Medical Corp. 70,219 5,705* Medicines Co. 139,602 5,122* Neogen Corp. 73,739 5,081* ICU Medical Inc. 29,110 5,075* Ligand Pharmaceuticals
Inc. 36,827 4,746* Supernus Pharmaceuticals
Inc. 97,273 4,455* Haemonetics Corp. 101,494 4,366* Myriad Genetics Inc. 131,780 4,018* Merit Medical Systems Inc. 96,569 3,988* Select Medical Holdings
Corp. 207,921 3,867* Magellan Health Inc. 45,884 3,712* Omnicell Inc. 71,899 3,688* HealthEquity Inc. 85,761 3,668* AMN Healthcare Services
Inc. 92,675 3,461* Cambrex Corp. 63,008 3,283*,^ MiMedx Group Inc. 197,345 3,211* Repligen Corp. 71,371 3,117* Impax Laboratories Inc. 142,607 3,087* Inogen Inc. 31,460 3,014
* HMS Holdings Corp. 162,304 2,876* Amedisys Inc. 54,166 2,830* Tivity Health Inc. 65,215 2,556* Emergent BioSolutions Inc. 67,928 2,536* Integer Holdings Corp. 54,353 2,498
CONMED Corp. 48,001 2,381* OraSure Technologies Inc. 111,776 2,281* Varex Imaging Corp. 72,641 2,218* Momenta Pharmaceuticals
Inc. 129,225 2,177* BioTelemetry Inc. 58,191 2,162* Natus Medical Inc. 64,037 2,152* Innoviva Inc. 150,252 2,110
Abaxis Inc. 43,841 2,026
Ensign Group Inc. 92,241 1,895* LHC Group Inc. 29,011 1,893* Acorda Therapeutics Inc. 90,340 1,879* PharMerica Corp. 60,686 1,784
Analogic Corp. 24,172 1,730* Orthofix International NV 34,929 1,719* Community Health
Systems Inc. 200,195 1,529* Anika Therapeutics Inc. 28,412 1,526
Luminex Corp. 77,499 1,498* Cytokinetics Inc. 98,692 1,466
US Physical Therapy Inc. 24,442 1,464* Diplomat Pharmacy Inc. 85,261 1,428* Quality Systems Inc. 89,815 1,415* Spectrum Pharmaceuticals
Inc. 144,350 1,409
Kindred Healthcare Inc. 167,277 1,355
Phibro Animal Health
Corp. Class A 36,346 1,290* Heska Corp. 12,421 1,263
Landauer Inc. 18,822 1,168* Providence Service Corp. 22,456 1,164* HealthStream Inc. 49,466 1,162* Enanta Pharmaceuticals
Inc. 27,022 1,158
Meridian Bioscience Inc. 81,783 1,137* AMAG Pharmaceuticals
Inc. 67,865 1,133* AngioDynamics Inc. 66,299 1,129* Almost Family Inc. 23,116 1,126* Amphastar Pharmaceuticals
Inc. 69,268 1,109* SciClone Pharmaceuticals
Inc. 100,366 1,104* CryoLife Inc. 52,953 1,101* Lantheus Holdings Inc. 57,087 999* CorVel Corp. 18,892 981* Albany Molecular
Research Inc. 43,115 937
LeMaitre Vascular Inc. 24,495 892
16
S&P Small-Cap 600 Index Fund
Market
Value•
Shares ($000)
Market
Value•
Shares ($000)
Invacare Corp. 62,623 845* Eagle Pharmaceuticals Inc. 15,148 826* Cross Country Healthcare
Inc. 61,687 764* ANI Pharmaceuticals Inc. 15,617 750* Surmodics Inc. 25,891 673
Computer Programs &
Systems Inc. 20,819 627
Aceto Corp. 58,624 622*,^ Lannett Co. Inc. 35,152 617*,^ Sucampo Pharmaceuticals
Inc. Class A 48,841 574* Depomed Inc. 77,309 470* Progenics Pharmaceuticals
Inc. 64,303 433* Quorum Health Corp. 400 2
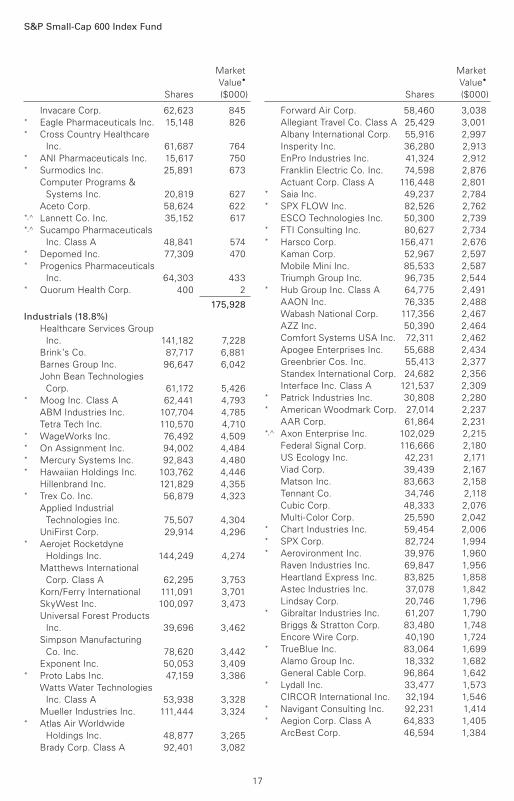
175,928
Industrials (18.8%)
Healthcare Services Group
Inc. 141,182 7,228
Brink’s Co. 87,717 6,881
Barnes Group Inc. 96,647 6,042
John Bean Technologies
Corp. 61,172 5,426* Moog Inc. Class A 62,441 4,793
ABM Industries Inc. 107,704 4,785
Tetra Tech Inc. 110,570 4,710* WageWorks Inc. 76,492 4,509* On Assignment Inc. 94,002 4,484* Mercury Systems Inc. 92,843 4,480* Hawaiian Holdings Inc. 103,762 4,446
Hillenbrand Inc. 121,829 4,355* Trex Co. Inc. 56,879 4,323
Applied Industrial
Technologies Inc. 75,507 4,304
UniFirst Corp. 29,914 4,296* Aerojet Rocketdyne
Holdings Inc. 144,249 4,274
Matthews International
Corp. Class A 62,295 3,753
Korn/Ferry International 111,091 3,701
SkyWest Inc. 100,097 3,473
Universal Forest Products
Inc. 39,696 3,462
Simpson Manufacturing
Co. Inc. 78,620 3,442
Exponent Inc. 50,053 3,409* Proto Labs Inc. 47,159 3,386
Watts Water Technologies
Inc. Class A 53,938 3,328
Mueller Industries Inc. 111,444 3,324* Atlas Air Worldwide
Holdings Inc. 48,877 3,265
Brady Corp. Class A 92,401 3,082
Forward Air Corp. 58,460 3,038
Allegiant Travel Co. Class A 25,429 3,001
Albany International Corp. 55,916 2,997
Insperity Inc. 36,280 2,913
EnPro Industries Inc. 41,324 2,912
Franklin Electric Co. Inc. 74,598 2,876
Actuant Corp. Class A 116,448 2,801* Saia Inc. 49,237 2,784* SPX FLOW Inc. 82,526 2,762
ESCO Technologies Inc. 50,300 2,739* FTI Consulting Inc. 80,627 2,734* Harsco Corp. 156,471 2,676
Kaman Corp. 52,967 2,597
Mobile Mini Inc. 85,533 2,587
Triumph Group Inc. 96,735 2,544* Hub Group Inc. Class A 64,775 2,491
AAON Inc. 76,335 2,488
Wabash National Corp. 117,356 2,467
AZZ Inc. 50,390 2,464
Comfort Systems USA Inc. 72,311 2,462
Apogee Enterprises Inc. 55,688 2,434
Greenbrier Cos. Inc. 55,413 2,377
Standex International Corp. 24,682 2,356
Interface Inc. Class A 121,537 2,309* Patrick Industries Inc. 30,808 2,280* American Woodmark Corp. 27,014 2,237
AAR Corp. 61,864 2,231*,^ Axon Enterprise Inc. 102,029 2,215
Federal Signal Corp. 116,666 2,180
US Ecology Inc. 42,231 2,171
Viad Corp. 39,439 2,167
Matson Inc. 83,663 2,158
Tennant Co. 34,746 2,118
Cubic Corp. 48,333 2,076
Multi-Color Corp. 25,590 2,042* Chart Industries Inc. 59,454 2,006* SPX Corp. 82,724 1,994* Aerovironment Inc. 39,976 1,960
Raven Industries Inc. 69,847 1,956
Heartland Express Inc. 83,825 1,858
Astec Industries Inc. 37,078 1,842
Lindsay Corp. 20,746 1,796* Gibraltar Industries Inc. 61,207 1,790
Briggs & Stratton Corp. 83,480 1,748
Encore Wire Corp. 40,190 1,724* TrueBlue Inc. 83,064 1,699
Alamo Group Inc. 18,332 1,682
General Cable Corp. 96,864 1,642* Lydall Inc. 33,477 1,573
CIRCOR International Inc. 32,194 1,546* Navigant Consulting Inc. 92,231 1,414* Aegion Corp. Class A 64,833 1,405
ArcBest Corp. 46,594 1,384
17
S&P Small-Cap 600 Index Fund
Market
Value•
Shares ($000)
Market
Value•
Shares ($000)
Quanex Building Products
Corp. 66,727 1,308
Marten Transport Ltd. 74,885 1,284
Shares Market* PGT Innovations Inc. 95,861 1,265
RR Donnelley & Sons Co. 136,676 1,261
Kelly Services Inc. Class A 56,677 1,226
Griffon Corp. 60,569 1,124* Engility Holdings Inc. 34,467 1,071
LSC Communications Inc. 66,275 1,068
National Presto Industries
Inc. 9,655 962
Insteel Industries Inc. 33,989 852* MYR Group Inc. 32,043 827
Titan International Inc. 94,384 810
Resources Connection Inc. 57,732 736
Heidrick & Struggles
International Inc. 36,489 666* Veritiv Corp. 22,075 618* Vicor Corp. 31,511 613* DXP Enterprises Inc. 18,814 510
Powell Industries Inc. 16,635 474
Essendant Inc. 37,748 448* Roadrunner Transportation
Systems Inc. 59,247 443* Team Inc. 27,594 341* Orion Group Holdings Inc. 54,441 329* Echo Global Logistics Inc. 21,624 329* CDI Corp. 27,432 225
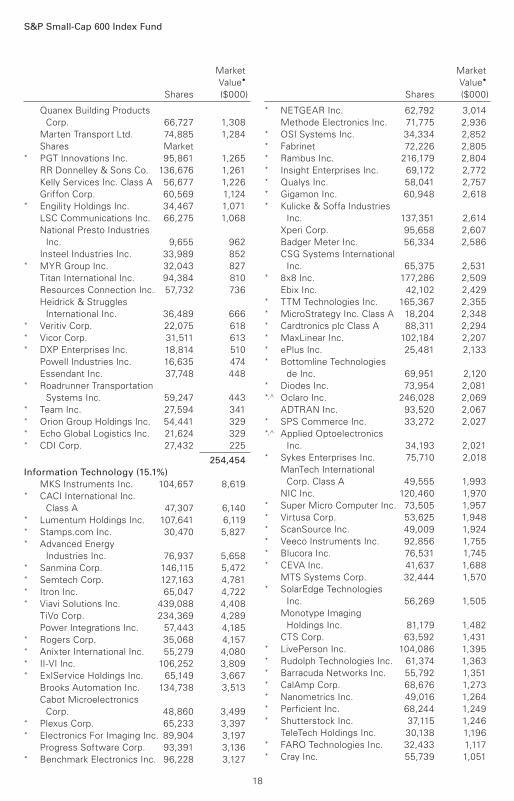
254,454
Information Technology (15.1%)
MKS Instruments Inc. 104,657 8,619* CACI International Inc.
Class A 47,307 6,140* Lumentum Holdings Inc. 107,641 6,119* Stamps.com Inc. 30,470 5,827* Advanced Energy
Industries Inc. 76,937 5,658* Sanmina Corp. 146,115 5,472* Semtech Corp. 127,163 4,781* Itron Inc. 65,047 4,722* Viavi Solutions Inc. 439,088 4,408
TiVo Corp. 234,369 4,289
Power Integrations Inc. 57,443 4,185* Rogers Corp. 35,068 4,157* Anixter International Inc. 55,279 4,080* II-VI Inc. 106,252 3,809* ExlService Holdings Inc. 65,149 3,667
Brooks Automation Inc. 134,738 3,513
Cabot Microelectronics
Corp. 48,860 3,499* Plexus Corp. 65,233 3,397* Electronics For Imaging Inc. 89,904 3,197
Progress Software Corp. 93,391 3,136* Benchmark Electronics Inc. 96,228 3,127
* NETGEAR Inc. 62,792 3,014
Methode Electronics Inc. 71,775 2,936* OSI Systems Inc. 34,334 2,852* Fabrinet 72,226 2,805* Rambus Inc. 216,179 2,804* Insight Enterprises Inc. 69,172 2,772* Qualys Inc. 58,041 2,757* Gigamon Inc. 60,948 2,618* Kulicke & Soffa Industries
Inc. 137,351 2,614
Xperi Corp. 95,658 2,607
Badger Meter Inc. 56,334 2,586
CSG Systems International
Inc. 65,375 2,531* 8x8 Inc. 177,286 2,509
Ebix Inc. 42,102 2,429* TTM Technologies Inc. 165,367 2,355* MicroStrategy Inc. Class A 18,204 2,348* Cardtronics plc Class A 88,311 2,294* MaxLinear Inc. 102,184 2,207* ePlus Inc. 25,481 2,133* Bottomline Technologies
de Inc. 69,951 2,120* Diodes Inc. 73,954 2,081*,^ Oclaro Inc. 246,028 2,069
ADTRAN Inc. 93,520 2,067* SPS Commerce Inc. 33,272 2,027*,^ Applied Optoelectronics
Inc. 34,193 2,021* Sykes Enterprises Inc. 75,710 2,018
ManTech International
Corp. Class A 49,555 1,993
NIC Inc. 120,460 1,970* Super Micro Computer Inc. 73,505 1,957* Virtusa Corp. 53,625 1,948* ScanSource Inc. 49,009 1,924* Veeco Instruments Inc. 92,856 1,755* Blucora Inc. 76,531 1,745* CEVA Inc. 41,637 1,688
MTS Systems Corp. 32,444 1,570* SolarEdge Technologies
Inc. 56,269 1,505
Monotype Imaging
Holdings Inc. 81,179 1,482
CTS Corp. 63,592 1,431* LivePerson Inc. 104,086 1,395* Rudolph Technologies Inc. 61,374 1,363* Barracuda Networks Inc. 55,792 1,351* CalAmp Corp. 68,676 1,273* Nanometrics Inc. 49,016 1,264* Perficient Inc. 68,244 1,249* Shutterstock Inc. 37,115 1,246
TeleTech Holdings Inc. 30,138 1,196* FARO Technologies Inc. 32,433 1,117* Cray Inc. 55,739 1,051
18
S&P Small-Cap 600 Index Fund
Market
Value•
Shares ($000)
Market
Value•
Shares ($000)
* Synchronoss Technologies
Inc. 56,724 952
Cohu Inc. 49,397 927
Comtech
Telecommunications Corp. 45,779 896* XO Group Inc. 47,377 882* Control4 Corp. 35,313 874
Forrester Research Inc. 19,014 775
Daktronics Inc. 78,139 752* VASCO Data Security
International Inc. 58,653 736
Park Electrochemical Corp. 36,875 670* Electro Scientific
Industries Inc. 49,052 604* DSP Group Inc. 43,169 514* Harmonic Inc. 156,574 509* Kopin Corp. 118,853 478* Digi International Inc. 51,745 476
Bel Fuse Inc. Class B 17,125 437* QuinStreet Inc. 70,223 376* Agilysys Inc. 29,747 306* Liquidity Services Inc. 48,470 276
Black Box Corp. 30,570 92* DHI Group Inc. 450 1
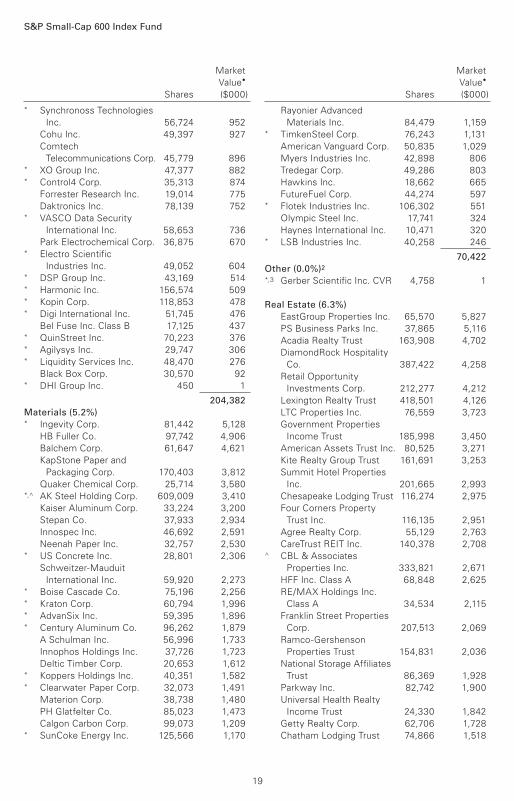
204,382
Materials (5.2%) * Ingevity Corp. 81,442 5,128
HB Fuller Co. 97,742 4,906
Balchem Corp. 61,647 4,621
KapStone Paper and
Packaging Corp. 170,403 3,812
Quaker Chemical Corp. 25,714 3,580*,^ AK Steel Holding Corp. 609,009 3,410
Kaiser Aluminum Corp. 33,224 3,200
Stepan Co. 37,933 2,934
Innospec Inc. 46,692 2,591
Neenah Paper Inc. 32,757 2,530* US Concrete Inc. 28,801 2,306
Schweitzer-Mauduit
International Inc. 59,920 2,273* Boise Cascade Co. 75,196 2,256* Kraton Corp. 60,794 1,996* AdvanSix Inc. 59,395 1,896* Century Aluminum Co. 96,262 1,879
A Schulman Inc. 56,996 1,733
Innophos Holdings Inc. 37,726 1,723
Deltic Timber Corp. 20,653 1,612* Koppers Holdings Inc. 40,351 1,582* Clearwater Paper Corp. 32,073 1,491
Materion Corp. 38,738 1,480
PH Glatfelter Co. 85,023 1,473
Calgon Carbon Corp. 99,073 1,209* SunCoke Energy Inc. 125,566 1,170
Rayonier Advanced
Materials Inc. 84,479 1,159* TimkenSteel Corp. 76,243 1,131
American Vanguard Corp. 50,835 1,029
Myers Industries Inc. 42,898 806
Tredegar Corp. 49,286 803
Hawkins Inc. 18,662 665
FutureFuel Corp. 44,274 597* Flotek Industries Inc. 106,302 551
Olympic Steel Inc. 17,741 324
Haynes International Inc. 10,471 320* LSB Industries Inc. 40,258 246
70,422
Other (0.0%)2 *,3 Gerber Scientific Inc. CVR 4,758 1
Real Estate (6.3%)
EastGroup Properties Inc. 65,570 5,827
PS Business Parks Inc. 37,865 5,116
Acadia Realty Trust 163,908 4,702
DiamondRock Hospitality
Co. 387,422 4,258
Retail Opportunity
Investments Corp. 212,277 4,212
Lexington Realty Trust 418,501 4,126
LTC Properties Inc. 76,559 3,723
Government Properties
Income Trust 185,998 3,450
American Assets Trust Inc. 80,525 3,271
Kite Realty Group Trust 161,691 3,253
Summit Hotel Properties
Inc. 201,665 2,993
Chesapeake Lodging Trust 116,274 2,975
Four Corners Property
Trust Inc. 116,135 2,951
Agree Realty Corp. 55,129 2,763
CareTrust REIT Inc. 140,378 2,708^ CBL & Associates
Properties Inc. 333,821 2,671
HFF Inc. Class A 68,848 2,625
RE/MAX Holdings Inc.
Class A 34,534 2,115
Franklin Street Properties
Corp. 207,513 2,069
Ramco-Gershenson
Properties Trust 154,831 2,036
National Storage Affiliates
Trust 86,369 1,928
Parkway Inc. 82,742 1,900
Universal Health Realty
Income Trust 24,330 1,842
Getty Realty Corp. 62,706 1,728
Chatham Lodging Trust 74,866 1,518
19
S&P Small-Cap 600 Index Fund
Market
Value•
Shares ($000)
Market
Value•
Shares ($000)
Hersha Hospitality Trust
Class A 81,535 1,512
Saul Centers Inc. 22,962 1,391
Independence Realty
Trust Inc. 115,841 1,192
Urstadt Biddle Properties
Inc. Class A 57,636 1,192
Armada Hoffler Properties
Inc. 87,694 1,172* Forestar Group Inc. 64,685 1,113
Pennsylvania REIT 96,464 968
Cedar Realty Trust Inc. 148,731 750
86,050
Telecommunication Services (1.3%)
Cogent Communications
Holdings Inc. 79,222 3,692* Vonage Holdings Corp. 378,041 3,138
Consolidated
Communications Holdings
Inc. 124,359 2,294* General Communication
Inc. Class A 51,699 2,230* Iridium Communications
Inc. 158,337 1,757
Cincinnati Bell Inc. 82,230 1,731
ATN International Inc. 20,715 1,254* Lumos Networks Corp. 46,649 839
Spok Holdings Inc. 40,043 671
17,606
Utilities (3.1%)
ALLETE Inc. 98,377 7,608
Spire Inc. 93,347 7,141
Avista Corp. 124,548 6,402
South Jersey Industries
Inc. 153,738 5,516
El Paso Electric Co. 78,513 4,361
Northwest Natural Gas Co. 55,416 3,674
American States Water Co. 70,840 3,492
California Water Service
Group 92,815 3,476
41,670
Total Common Stocks
(Cost $1,255,179) 1,354,724
Temporary Cash Investments (0.9%)1
Money Market Fund (0.9%)4,5 Vanguard Market Liquidity
Fund, 1.224% 115,578 11,560
Face
Amount
($000)
U.S. Government and Agency Obligations (0.0%) 6 United States Treasury
Bill, 0.980%, 10/5/17 100 100
United States Treasury
Bill, 1.038%, 11/2/17 200 2006 United States Treasury
Bill, 1.044%, 11/24/17 50 506 United States Treasury
Bill, 1.107%, 12/28/17 50 50
400
Total Temporary Cash Investments
(Cost $11,958) 11,960
Total Investments (100.9%)
(Cost $1,267,137) 1,366,684
Amount
($000)
Other Assets and Liabilities (-0.9%)
Other Assets
Investment in Vanguard 86
Receivables for Accrued Income 1,086
Receivables for Capital Shares Issued 5,448
Variable Margin Receivable –
Futures Contracts 11
Other Assets5 1,047
Total Other Assets 7,678
Liabilities
Payables for Investment
Securities Purchased (4,075)
Collateral for Securities on Loan (12,601)
Payables for Capital Shares Redeemed (1,052)
Payables to Vanguard (237)
Other Liabilities (1,513)
Total Liabilities (19,478)
Net Assets (100%) 1,354,884
20
21
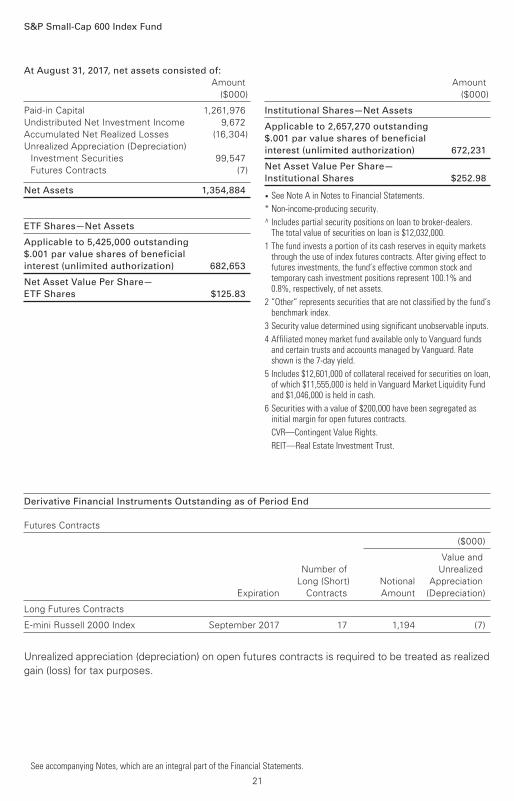
Derivative Financial Instruments Outstanding as of Period End
Futures Contracts
($000)
Value and
Number of Unrealized
Long (Short) Notional Appreciation
Expiration Contracts Amount (Depreciation)
Long Futures Contracts
E-mini Russell 2000 Index September 2017 17 1,194 (7)
Unrealized appreciation (depreciation) on open futures contracts is required to be treated as realized
gain (loss) for tax purposes.
S&P Small-Cap 600 Index Fund
At August 31, 2017, net assets consisted of:
Amount
($000)
Amount
($000)
Paid-in Capital 1,261,976
Undistributed Net Investment Income 9,672
Accumulated Net Realized Losses (16,304)
Unrealized Appreciation (Depreciation)
Investment Securities 99,547
Futures Contracts (7)
Net Assets 1,354,884
ETF Shares—Net Assets
Applicable to 5,425,000 outstanding
$.001 par value shares of beneficial
interest (unlimited authorization) 682,653
Net Asset Value Per Share—
ETF Shares $125.83
Institutional Shares—Net Assets
Applicable to 2,657,270 outstanding
$.001 par value shares of beneficial
interest (unlimited authorization) 672,231
Net Asset Value Per Share—
Institutional Shares $252.98
• See Note A in Notes to Financial Statements.
* Non-income-producing security.
^ Includes partial security positions on loan to broker-dealers. The total value of securities on loan is $12,032,000.
1 The fund invests a portion of its cash reserves in equity markets through the use of index futures contracts. After giving effect to futures investments, the fund’s effective common stock and temporary cash investment positions represent 100.1% and 0.8%, respectively, of net assets.
2 “Other” represents securities that are not classified by the fund’s benchmark index.
3 Security value determined using significant unobservable inputs.
4 Affiliated money market fund available only to Vanguard funds and certain trusts and accounts managed by Vanguard. Rate shown is the 7-day yield.
5 Includes $12,601,000 of collateral received for securities on loan, of which $11,555,000 is held in Vanguard Market Liquidity Fund and $1,046,000 is held in cash.
6 Securities with a value of $200,000 have been segregated as initial margin for open futures contracts.
CVR—Contingent Value Rights.
REIT—Real Estate Investment Trust.
See accompanying Notes, which are an integral part of the Financial Statements.
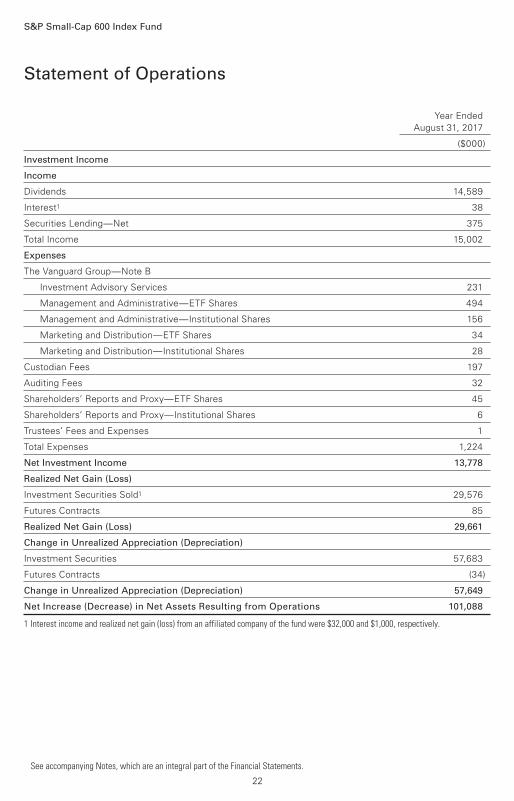
Year Ended
August 31, 2017
($000)
Investment Income
Income
Dividends 14,589
Interest1 38
Securities Lending—Net 375
Total Income 15,002
Expenses
The Vanguard Group—Note B
Investment Advisory Services 231
Management and Administrative—ETF Shares 494
Management and Administrative—Institutional Shares 156
Marketing and Distribution—ETF Shares 34
Marketing and Distribution—Institutional Shares 28
Custodian Fees 197
Auditing Fees 32
Shareholders’ Reports and Proxy—ETF Shares 45
Shareholders’ Reports and Proxy—Institutional Shares 6
Trustees’ Fees and Expenses 1
Total Expenses 1,224
Net Investment Income 13,778
Realized Net Gain (Loss)
Investment Securities Sold1 29,576
Futures Contracts 85
Realized Net Gain (Loss) 29,661
Change in Unrealized Appreciation (Depreciation)
Investment Securities 57,683
Futures Contracts (34)
Change in Unrealized Appreciation (Depreciation) 57,649
Net Increase (Decrease) in Net Assets Resulting from Operations 101,088
1 Interest income and realized net gain (loss) from an affiliated company of the fund were $32,000 and $1,000, respectively.
Statement of Operations
S&P Small-Cap 600 Index Fund
See accompanying Notes, which are an integral part of the Financial Statements.
22
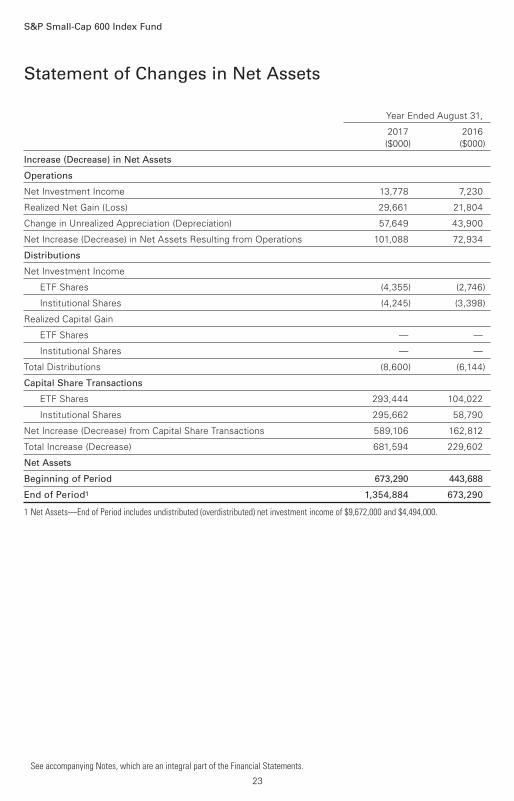
Statement of Changes in Net Assets
S&P Small-Cap 600 Index Fund
See accompanying Notes, which are an integral part of the Financial Statements.
Year Ended August 31,
2017 2016
($000) ($000)
Increase (Decrease) in Net Assets
Operations
Net Investment Income 13,778 7,230
Realized Net Gain (Loss) 29,661 21,804
Change in Unrealized Appreciation (Depreciation) 57,649 43,900
Net Increase (Decrease) in Net Assets Resulting from Operations 101,088 72,934
Distributions
Net Investment Income
ETF Shares (4,355) (2,746)
Institutional Shares (4,245) (3,398)
Realized Capital Gain
ETF Shares — —
Institutional Shares — —
Total Distributions (8,600) (6,144)
Capital Share Transactions
ETF Shares 293,444 104,022
Institutional Shares 295,662 58,790
Net Increase (Decrease) from Capital Share Transactions 589,106 162,812
Total Increase (Decrease) 681,594 229,602
Net Assets
Beginning of Period 673,290 443,688
End of Period1 1,354,884 673,290
1 Net Assets—End of Period includes undistributed (overdistributed) net investment income of $9,672,000 and $4,494,000.
23
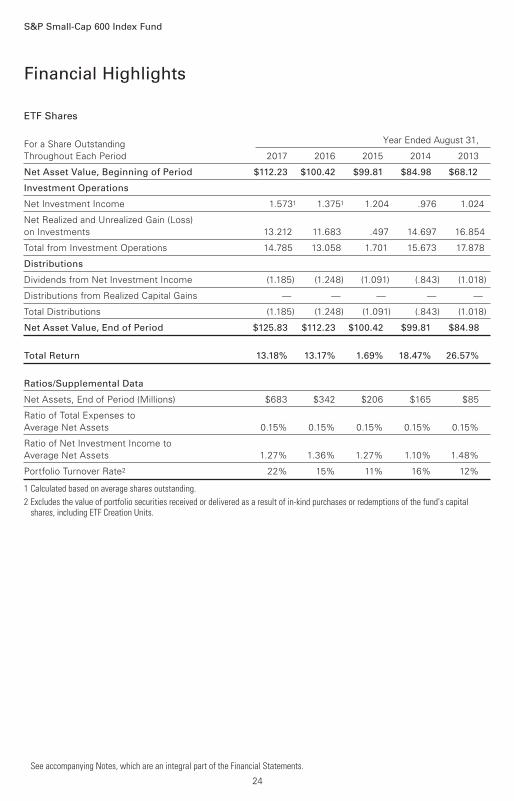
ETF Shares
For a Share Outstanding Year Ended August 31,
Throughout Each Period 2017 2016 2015 2014 2013
Net Asset Value, Beginning of Period $112.23 $100.42 $99.81 $84.98 $68.12
Investment Operations
Net Investment Income 1.5731 1.3751 1.204 .976 1.024
Net Realized and Unrealized Gain (Loss)
on Investments 13.212 11.683 .497 14.697 16.854
Total from Investment Operations 14.785 13.058 1.701 15.673 17.878
Distributions
Dividends from Net Investment Income (1.185) (1.248) (1.091) (.843) (1.018)
Distributions from Realized Capital Gains — — — — —
Total Distributions (1.185) (1.248) (1.091) (.843) (1.018)
Net Asset Value, End of Period $125.83 $112.23 $100.42 $99.81 $84.98
Total Return 13.18% 13.17% 1.69% 18.47% 26.57%
Ratios/Supplemental Data
Net Assets, End of Period (Millions) $683 $342 $206 $165 $85
Ratio of Total Expenses to
Average Net Assets 0.15% 0.15% 0.15% 0.15% 0.15%
Ratio of Net Investment Income to
Average Net Assets 1.27% 1.36% 1.27% 1.10% 1.48%
Portfolio Turnover Rate2 22% 15% 11% 16% 12%
1 Calculated based on average shares outstanding.
2 Excludes the value of portfolio securities received or delivered as a result of in-kind purchases or redemptions of the fund’s capital shares, including ETF Creation Units.
Financial Highlights
See accompanying Notes, which are an integral part of the Financial Statements.
S&P Small-Cap 600 Index Fund
24
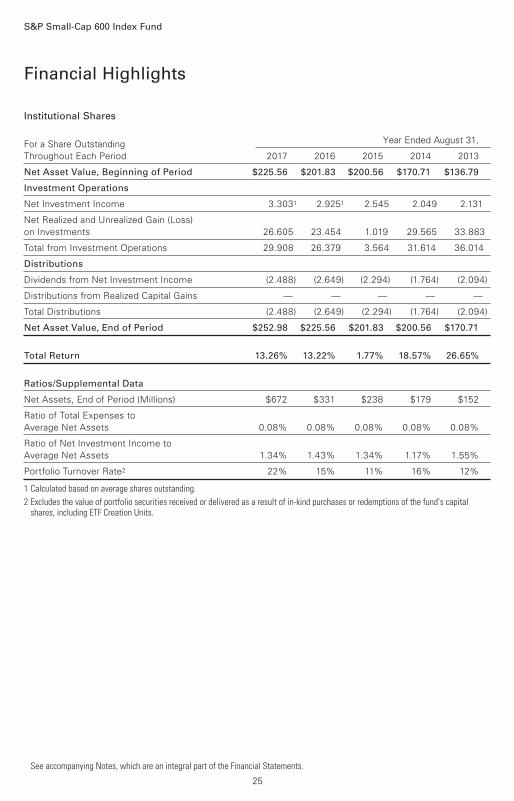
Institutional Shares
For a Share Outstanding Year Ended August 31,
Throughout Each Period 2017 2016 2015 2014 2013
Net Asset Value, Beginning of Period $225.56 $201.83 $200.56 $170.71 $136.79
Investment Operations
Net Investment Income 3.3031 2.9251 2.545 2.049 2.131
Net Realized and Unrealized Gain (Loss)
on Investments 26.605 23.454 1.019 29.565 33.883
Total from Investment Operations 29.908 26.379 3.564 31.614 36.014
Distributions
Dividends from Net Investment Income (2.488) (2.649) (2.294) (1.764) (2.094)
Distributions from Realized Capital Gains — — — — —
Total Distributions (2.488) (2.649) (2.294) (1.764) (2.094)
Net Asset Value, End of Period $252.98 $225.56 $201.83 $200.56 $170.71
Total Return 13.26% 13.22% 1.77% 18.57% 26.65%
Ratios/Supplemental Data
Net Assets, End of Period (Millions) $672 $331 $238 $179 $152
Ratio of Total Expenses to
Average Net Assets 0.08% 0.08% 0.08% 0.08% 0.08%
Ratio of Net Investment Income to
Average Net Assets 1.34% 1.43% 1.34% 1.17% 1.55%
Portfolio Turnover Rate2 22% 15% 11% 16% 12%
1 Calculated based on average shares outstanding.
2 Excludes the value of portfolio securities received or delivered as a result of in-kind purchases or redemptions of the fund’s capital shares, including ETF Creation Units.
Financial Highlights
See accompanying Notes, which are an integral part of the Financial Statements.
S&P Small-Cap 600 Index Fund
25
Notes to Financial Statements
S&P Small-Cap 600 Index Fund
Vanguard S&P Small-Cap 600 Index Fund is registered under the Investment Company Act of 1940
as an open-end investment company, or mutual fund. The fund offers two classes of shares: ETF
Shares and Institutional Shares. ETF Shares are listed for trading on NYSE Arca; they can be
purchased and sold through a broker. Institutional Shares are designed for investors who meet
certain administrative, service, and account-size criteria.
A. The following significant accounting policies conform to generally accepted accounting
principles for U.S. investment companies. The fund consistently follows such policies in
preparing its financial statements.
1. Security Valuation: Securities are valued as of the close of trading on the New York Stock
Exchange (generally 4 p.m., Eastern time) on the valuation date. Equity securities are valued at the
latest quoted sales prices or official closing prices taken from the primary market in which each
security trades; such securities not traded on the valuation date are valued at the mean of the latest
quoted bid and asked prices. Securities for which market quotations are not readily available, or
whose values have been materially affected by events occurring before the fund’s pricing time but
after the close of the securities’ primary markets, are valued by methods deemed by the board of
trustees to represent fair value. Investments in Vanguard Market Liquidity Fund are valued at that
fund’s net asset value. Temporary cash investments are valued using the latest bid prices or using
valuations based on a matrix system (which considers such factors as security prices, yields,
maturities, and ratings), both as furnished by independent pricing services.
2. Futures Contracts: The fund uses index futures contracts to a limited extent, with the objectives
of maintaining full exposure to the stock market, enhancing returns, maintaining liquidity, and
minimizing transaction costs. The fund may purchase futures contracts to immediately invest
incoming cash in the market, or sell futures in response to cash outflows, thereby simulating a fully
invested position in the underlying index while maintaining a cash balance for liquidity. The fund may
seek to enhance returns by using futures contracts instead of the underlying securities when futures
are believed to be priced more attractively than the underlying securities. The primary risks
associated with the use of futures contracts are imperfect correlation between changes in market
values of stocks held by the fund and the prices of futures contracts, and the possibility of an illiquid
market. Counterparty risk involving futures is mitigated because a regulated clearinghouse is the
counterparty instead of the clearing broker. To further mitigate counterparty risk, the fund trades
futures contracts on an exchange, monitors the financial strength of its clearing brokers and
clearinghouse, and has entered into clearing agreements with its clearing brokers. The clearing-
house imposes initial margin requirements to secure the fund’s performance and requires daily
settlement of variation margin representing changes in the market value of each contract.
Futures contracts are valued at their quoted daily settlement prices. The notional amounts of the
contracts are not recorded in the Statement of Net Assets. Fluctuations in the value of the contracts
are recorded in the Statement of Net Assets as an asset (liability) and in the Statement of Operations
as unrealized appreciation (depreciation) until the contracts are closed, when they are recorded as
realized futures gains (losses).
During the year ended August 31, 2017, the fund’s average investments in long and short futures
contracts represented less than 1% and 0% of net assets, respectively, based on the average of
the notional amounts at each quarter-end during the period.
26
S&P Small-Cap 600 Index Fund
3. Federal Income Taxes: The fund intends to continue to qualify as a regulated investment company
and distribute all of its taxable income. Management has analyzed the fund’s tax positions taken for
all open federal income tax years (August 31, 2014–2017), and has concluded that no provision for
federal income tax is required in the fund’s financial statements.
4. Distributions: Distributions to shareholders are recorded on the ex-dividend date.
5. Securities Lending: To earn additional income, the fund lends its securities to qualified institutional
borrowers. Security loans are subject to termination by the fund at any time, and are required to be
secured at all times by collateral in an amount at least equal to the market value of securities loaned.
Daily market fluctuations could cause the value of loaned securities to be more or less than the
value of the collateral received. When this occurs, the collateral is adjusted and settled on the next
business day. The fund further mitigates its counterparty risk by entering into securities lending
transactions only with a diverse group of prequalified counterparties, monitoring their financial
strength, and entering into master securities lending agreements with its counterparties. The master
securities lending agreements provide that, in the event of a counterparty’s default (including
bankruptcy), the fund may terminate any loans with that borrower, determine the net amount owed,
and sell or retain the collateral up to the net amount owed to the fund; however, such actions may
be subject to legal proceedings. While collateral mitigates counterparty risk, in the event of a default,
the fund may experience delays and costs in recovering the securities loaned. The fund invests cash
collateral received in Vanguard Market Liquidity Fund, and records a liability in the Statement of Net
Assets for the return of the collateral, during the period the securities are on loan. Securities lending
income represents fees charged to borrowers plus income earned on invested cash collateral, less
expenses associated with the loan. During the term of the loan, the fund is entitled to all
distributions made on or in respect of the loaned securities.
6. Credit Facility: The fund and certain other funds managed by The Vanguard Group (“Vanguard”)
participate in a $3.1 billion committed credit facility provided by a syndicate of lenders pursuant to
a credit agreement that may be renewed annually; each fund is individually liable for its borrowings,
if any, under the credit facility. Borrowings may be utilized for temporary and emergency purposes,
and are subject to the fund’s regulatory and contractual borrowing restrictions. The participating
funds are charged administrative fees and an annual commitment fee of 0.10% of the undrawn
amount of the facility; these fees are allocated to the funds based on a method approved by the
fund’s board of trustees and included in Management and Administrative expenses on the fund’s
Statement of Operations. Any borrowings under this facility bear interest at a rate based upon the
higher of the one-month London Interbank Offered Rate, federal funds effective rate, or overnight
bank funding rate plus an agreed-upon spread.
The fund had no borrowings outstanding at August 31, 2017, or at any time during the period
then ended.
7. Other: Dividend income is recorded on the ex-dividend date. Interest income includes income
distributions received from Vanguard Market Liquidity Fund and is accrued daily. Premiums and
discounts on debt securities purchased are amortized and accreted, respectively, to interest
income over the lives of the respective securities. Security transactions are accounted for on the
date securities are bought or sold. Costs used to determine realized gains (losses) on the sale of
investment securities are those of the specific securities sold.
27
28
S&P Small-Cap 600 Index Fund
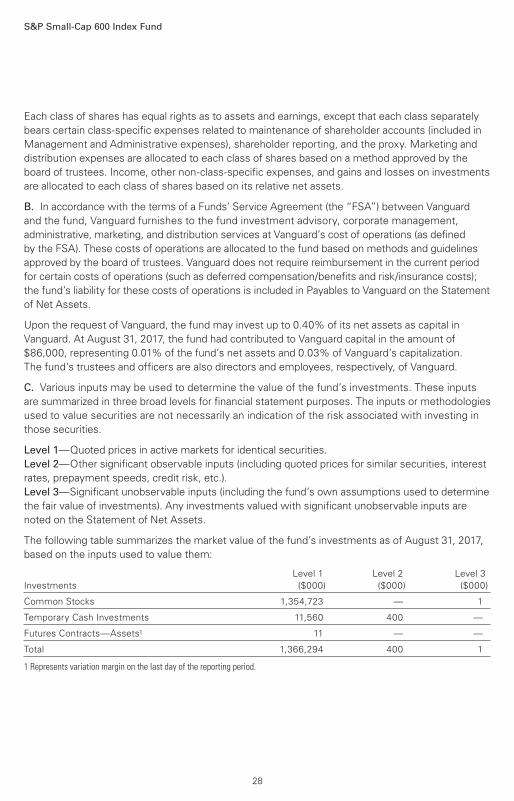
Each class of shares has equal rights as to assets and earnings, except that each class separately
bears certain class-specific expenses related to maintenance of shareholder accounts (included in
Management and Administrative expenses), shareholder reporting, and the proxy. Marketing and
distribution expenses are allocated to each class of shares based on a method approved by the
board of trustees. Income, other non-class-specific expenses, and gains and losses on investments
are allocated to each class of shares based on its relative net assets.
B. In accordance with the terms of a Funds’ Service Agreement (the “FSA”) between Vanguard
and the fund, Vanguard furnishes to the fund investment advisory, corporate management,
administrative, marketing, and distribution services at Vanguard’s cost of operations (as defined
by the FSA). These costs of operations are allocated to the fund based on methods and guidelines
approved by the board of trustees. Vanguard does not require reimbursement in the current period
for certain costs of operations (such as deferred compensation/benefits and risk/insurance costs);
the fund’s liability for these costs of operations is included in Payables to Vanguard on the Statement
of Net Assets.
Upon the request of Vanguard, the fund may invest up to 0.40% of its net assets as capital in
Vanguard. At August 31, 2017, the fund had contributed to Vanguard capital in the amount of
$86,000, representing 0.01% of the fund’s net assets and 0.03% of Vanguard’s capitalization.
The fund’s trustees and officers are also directors and employees, respectively, of Vanguard.
C. Various inputs may be used to determine the value of the fund’s investments. These inputs
are summarized in three broad levels for financial statement purposes. The inputs or methodologies
used to value securities are not necessarily an indication of the risk associated with investing in
those securities.
Level 1—Quoted prices in active markets for identical securities.
Level 2—Other significant observable inputs (including quoted prices for similar securities, interest
rates, prepayment speeds, credit risk, etc.).
Level 3—Significant unobservable inputs (including the fund’s own assumptions used to determine
the fair value of investments). Any investments valued with significant unobservable inputs are
noted on the Statement of Net Assets.
The following table summarizes the market value of the fund’s investments as of August 31, 2017,
based on the inputs used to value them:
Level 1 Level 2 Level 3
Investments ($000) ($000) ($000)
Common Stocks 1,354,723 — 1
Temporary Cash Investments 11,560 400 —
Futures Contracts—Assets1 11 — —
Total 1,366,294 400 1
1 Represents variation margin on the last day of the reporting period.
S&P Small-Cap 600 Index Fund
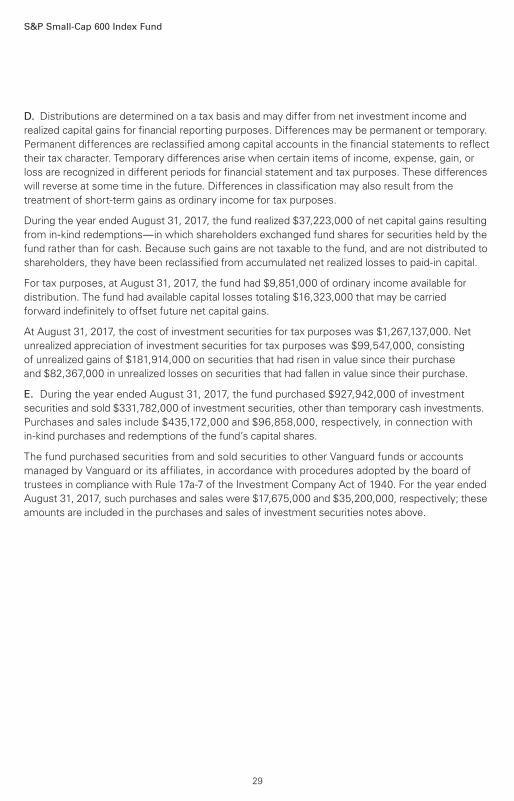
D. Distributions are determined on a tax basis and may differ from net investment income and
realized capital gains for financial reporting purposes. Differences may be permanent or temporary.
Permanent differences are reclassified among capital accounts in the financial statements to reflect
their tax character. Temporary differences arise when certain items of income, expense, gain, or
loss are recognized in different periods for financial statement and tax purposes. These differences
will reverse at some time in the future. Differences in classification may also result from the
treatment of short-term gains as ordinary income for tax purposes.
During the year ended August 31, 2017, the fund realized $37,223,000 of net capital gains resulting
from in-kind redemptions—in which shareholders exchanged fund shares for securities held by the
fund rather than for cash. Because such gains are not taxable to the fund, and are not distributed to
shareholders, they have been reclassified from accumulated net realized losses to paid-in capital.
For tax purposes, at August 31, 2017, the fund had $9,851,000 of ordinary income available for
distribution. The fund had available capital losses totaling $16,323,000 that may be carried
forward indefinitely to offset future net capital gains.
At August 31, 2017, the cost of investment securities for tax purposes was $1,267,137,000. Net
unrealized appreciation of investment securities for tax purposes was $99,547,000, consisting
of unrealized gains of $181,914,000 on securities that had risen in value since their purchase
and $82,367,000 in unrealized losses on securities that had fallen in value since their purchase.
E. During the year ended August 31, 2017, the fund purchased $927,942,000 of investment
securities and sold $331,782,000 of investment securities, other than temporary cash investments.
Purchases and sales include $435,172,000 and $96,858,000, respectively, in connection with
in-kind purchases and redemptions of the fund’s capital shares.
The fund purchased securities from and sold securities to other Vanguard funds or accounts
managed by Vanguard or its affiliates, in accordance with procedures adopted by the board of
trustees in compliance with Rule 17a-7 of the Investment Company Act of 1940. For the year ended
August 31, 2017, such purchases and sales were $17,675,000 and $35,200,000, respectively; these
amounts are included in the purchases and sales of investment securities notes above.
29
S&P Small-Cap 600 Index Fund
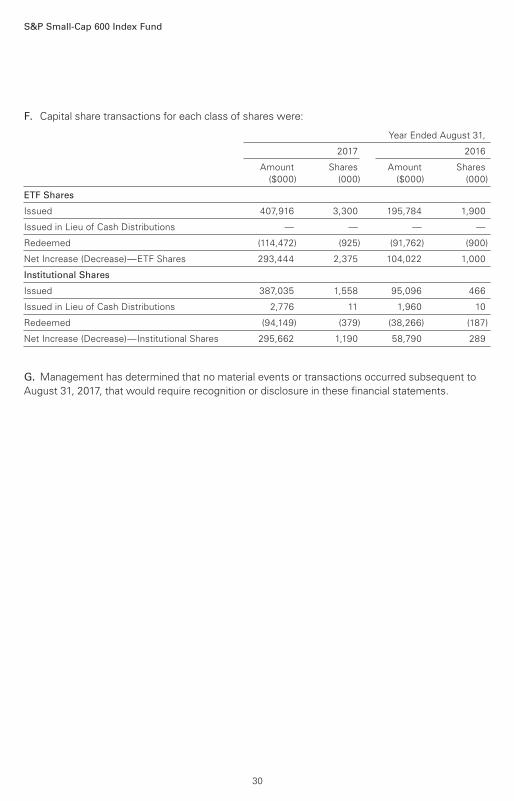
F. Capital share transactions for each class of shares were:
Year Ended August 31,
2017 2016
Amount Shares Amount Shares
($000) (000) ($000) (000)
ETF Shares
Issued 407,916 3,300 195,784 1,900
Issued in Lieu of Cash Distributions — — — —
Redeemed (114,472) (925) (91,762) (900)
Net Increase (Decrease)—ETF Shares 293,444 2,375 104,022 1,000
Institutional Shares
Issued 387,035 1,558 95,096 466
Issued in Lieu of Cash Distributions 2,776 11 1,960 10
Redeemed (94,149) (379) (38,266) (187)
Net Increase (Decrease)—Institutional Shares 295,662 1,190 58,790 289
G. Management has determined that no material events or transactions occurred subsequent to
August 31, 2017, that would require recognition or disclosure in these financial statements.
30
S&P Small-Cap 600 Value Index Fund
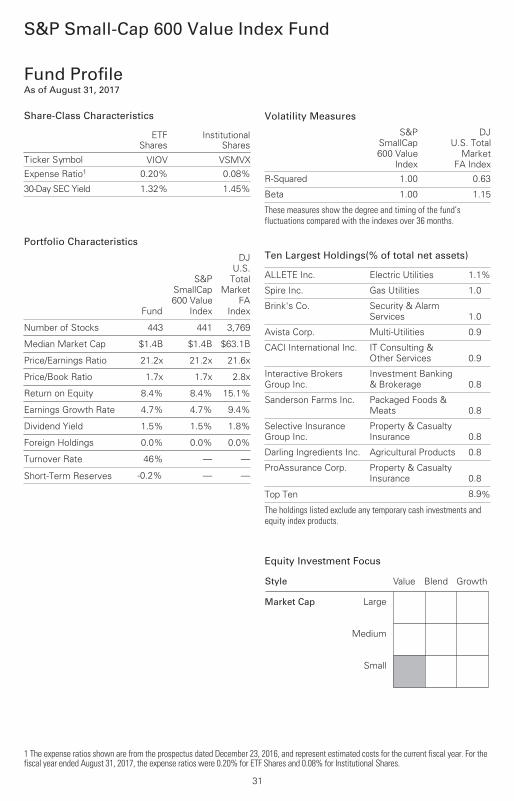
Fund ProfileAs of August 31, 2017
1 The expense ratios shown are from the prospectus dated December 23, 2016, and represent estimated costs for the current fiscal year. For the fiscal year ended August 31, 2017, the expense ratios were 0.20% for ETF Shares and 0.08% for Institutional Shares.
31
Volatility Measures
S&P
SmallCap
600 Value
Index
DJ
U.S. Total
Market
FA Index
R-Squared 1.00 0.63
Beta 1.00 1.15
These measures show the degree and timing of the fund’s fluctuations compared with the indexes over 36 months.
Portfolio Characteristics
Fund
S&P
SmallCap
600 Value
Index
DJ
U.S.
Total
Market
FA
Index
Number of Stocks 443 441 3,769
Median Market Cap $1.4B $1.4B $63.1B
Price/Earnings Ratio 21.2x 21.2x 21.6x
Price/Book Ratio 1.7x 1.7x 2.8x
Return on Equity 8.4% 8.4% 15.1%
Earnings Growth Rate 4.7% 4.7% 9.4%
Dividend Yield 1.5% 1.5% 1.8%
Foreign Holdings 0.0% 0.0% 0.0%
Turnover Rate 46% — —
Short-Term Reserves -0.2% — —
Share-Class Characteristics
ETFShares
InstitutionalShares
Ticker Symbol VIOV VSMVXExpense Ratio1 0.20% 0.08%
30-Day SEC Yield 1.32% 1.45%
Ten Largest Holdings(% of total net assets)
ALLETE Inc. Electric Utilities 1.1%
Spire Inc. Gas Utilities 1.0
Brink's Co. Security & Alarm
Services 1.0
Avista Corp. Multi-Utilities 0.9
CACI International Inc. IT Consulting &
Other Services 0.9
Interactive Brokers
Group Inc.
Investment Banking
& Brokerage 0.8
Sanderson Farms Inc. Packaged Foods &
Meats 0.8
Selective Insurance
Group Inc.
Property & Casualty
Insurance 0.8
Darling Ingredients Inc. Agricultural Products 0.8
ProAssurance Corp. Property & Casualty
Insurance 0.8
Top Ten 8.9%
The holdings listed exclude any temporary cash investments andequity index products.
Equity Investment Focus
Market Cap
Value
Large
Medium
Small
Blend Growth Style
S&P Small-Cap 600 Value Index Fund
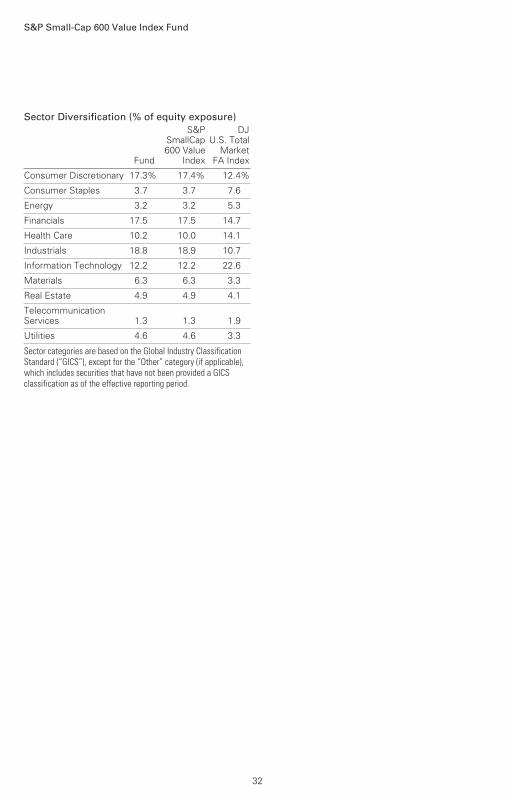
Sector Diversification (% of equity exposure)
Fund
S&PSmallCap600 Value
Index
DJU.S. Total
MarketFA Index
Consumer Discretionary 17.3% 17.4% 12.4%
Consumer Staples 3.7 3.7 7.6
Energy 3.2 3.2 5.3
Financials 17.5 17.5 14.7
Health Care 10.2 10.0 14.1
Industrials 18.8 18.9 10.7
Information Technology 12.2 12.2 22.6
Materials 6.3 6.3 3.3
Real Estate 4.9 4.9 4.1
TelecommunicationServices 1.3 1.3 1.9
Utilities 4.6 4.6 3.3
Sector categories are based on the Global Industry ClassificationStandard (“GICS”), except for the “Other” category (if applicable),which includes securities that have not been provided a GICSclassification as of the effective reporting period.
32

All of the returns in this report represent past performance, which is not a guarantee of future results that may be achieved by the fund. (Current performance may be lower or higher thanthe performance data cited. For performance data current to the most recent month-end, visitour website at vanguard.com/performance.) Note, too, that both investment returns and principal value can fluctuate widely, so an investor’s shares, when sold, could be worth more or less than their original cost. The returns shown do not reflect taxes that a shareholder would pay
on fund distributions or on the sale of fund shares.
Performance Summary
S&P Small-Cap 600 Value Index Fund
See Financial Highlights for dividend and capital gains information.
33
Cumulative Performance: September 7, 2010, Through August 31, 2017Initial Investment of $10,000
2017201620152014201320122011
$31,000
7,000
25,847
Average Annual Total Returns
Periods Ended August 31, 2017
OneYear
FiveYears
SinceInception
(9/7/2010)
Final Valueof a $10,000Investment
S&P Small-Cap 600 Value IndexFund*ETF Shares Net Asset Value 12.11% 13.98% 14.57% $25,847
S&P Small-Cap 600 Value IndexFund*ETF Shares Market Price 12.12 14.05 14.57 25,847
• • • • • • • • S&P SmallCap 600 Value Index 12.14 14.17 14.77 26,156
– – – – Small-Cap Value Funds Average 11.02 11.80 12.06 22,135________ Dow Jones U.S. Total Stock Market
Float Adjusted Index 16.05 14.19 14.71 26,064
Small-Cap Value Funds Average: Derived from data provided by Lipper, a Thomson Reuters Company."Since Inception" performance is calculated from the ETF Shares’ inception date for both the fund and its comparative standards.
S&P Small-Cap 600 Value Index Fund
34
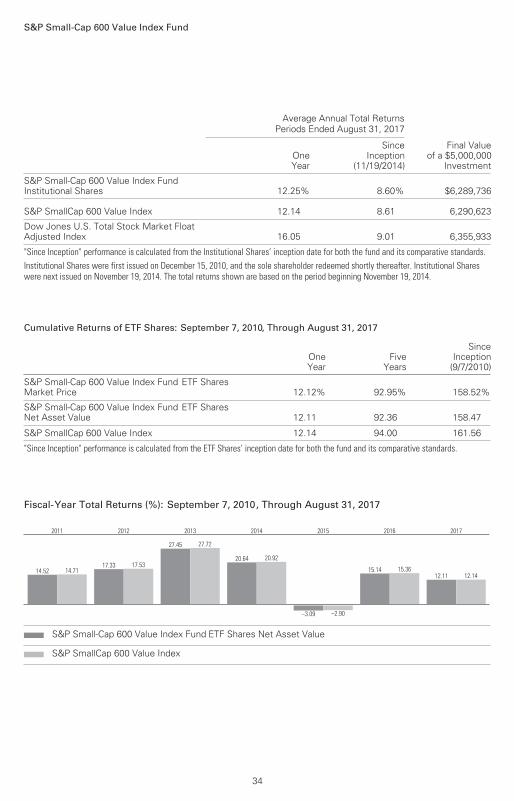
Average Annual Total Returns
Periods Ended August 31, 2017
OneYear
SinceInception
(11/19/2014)
Final Valueof a $5,000,000
Investment
S&P Small-Cap 600 Value Index FundInstitutional Shares 12.25% 8.60% $6,289,736
S&P SmallCap 600 Value Index 12.14 8.61 6,290,623
Dow Jones U.S. Total Stock Market FloatAdjusted Index 16.05 9.01 6,355,933
"Since Inception" performance is calculated from the Institutional Shares’ inception date for both the fund and its comparative standards.Institutional Shares were first issued on December 15, 2010, and the sole shareholder redeemed shortly thereafter. Institutional Shares were next issued on November 19, 2014. The total returns shown are based on the period beginning November 19, 2014.
Cumulative Returns of ETF Shares: September 7, 2010, Through August 31, 2017
OneYear
FiveYears
SinceInception
(9/7/2010)
S&P Small-Cap 600 Value Index Fund ETF SharesMarket Price 12.12% 92.95% 158.52%
S&P Small-Cap 600 Value Index Fund ETF SharesNet Asset Value 12.11 92.36 158.47
S&P SmallCap 600 Value Index 12.14 94.00 161.56
"Since Inception" performance is calculated from the ETF Shares’ inception date for both the fund and its comparative standards.
Fiscal-Year Total Returns (%): September 7, 2010, Through August 31, 2017
14.52 14.71
2011
17.33 17.53
2012
27.45 27.72
2013
20.64 20.92
2014
–3.09 –2.90
2015
15.14 15.36
2016
12.11 12.14
2017
S&P Small-Cap 600 Value Index Fund ETF Shares Net Asset Value
S&P SmallCap 600 Value Index
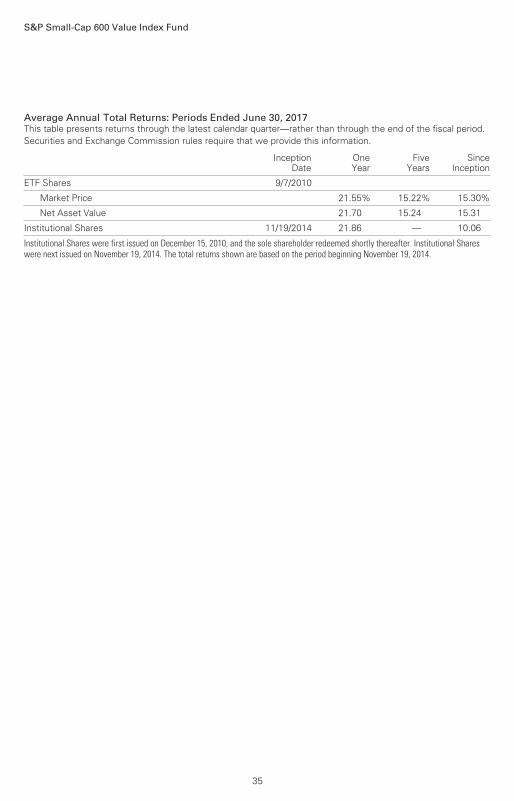
S&P Small-Cap 600 Value Index Fund
35
Average Annual Total Returns: Periods Ended June 30, 2017This table presents returns through the latest calendar quarter—rather than through the end of the fiscal period.Securities and Exchange Commission rules require that we provide this information.
InceptionDate
OneYear
FiveYears
SinceInception
ETF Shares 9/7/2010
Market Price 21.55% 15.22% 15.30%
Net Asset Value 21.70 15.24 15.31
Institutional Shares 11/19/2014 21.86 — 10.06
Institutional Shares were first issued on December 15, 2010, and the sole shareholder redeemed shortly thereafter. Institutional Shares were next issued on November 19, 2014. The total returns shown are based on the period beginning November 19, 2014.
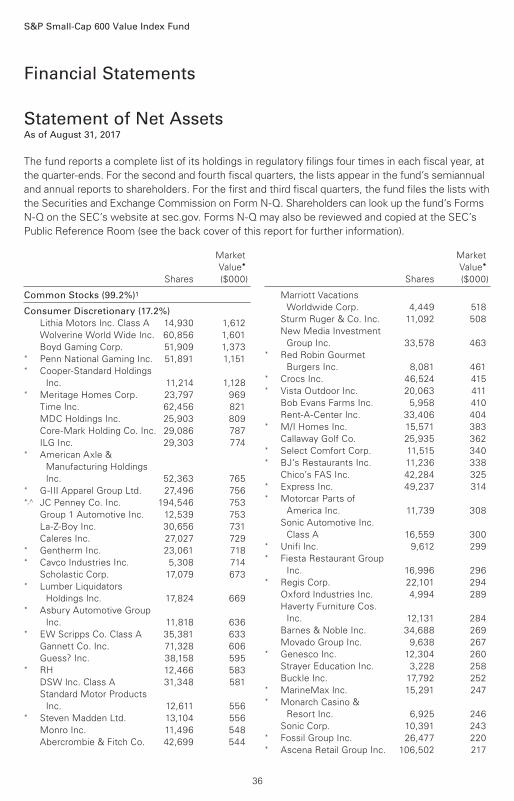
Market
Value•
Shares ($000)
Market
Value•
Shares ($000)
Common Stocks (99.2%)1
Consumer Discretionary (17.2%)
Lithia Motors Inc. Class A 14,930 1,612
Wolverine World Wide Inc. 60,856 1,601
Boyd Gaming Corp. 51,909 1,373* Penn National Gaming Inc. 51,891 1,151* Cooper-Standard Holdings
Inc. 11,214 1,128* Meritage Homes Corp. 23,797 969
Time Inc. 62,456 821
MDC Holdings Inc. 25,903 809
Core-Mark Holding Co. Inc. 29,086 787
ILG Inc. 29,303 774* American Axle &
Manufacturing Holdings
Inc. 52,363 765* G-III Apparel Group Ltd. 27,496 756*,^ JC Penney Co. Inc. 194,546 753
Group 1 Automotive Inc. 12,539 753
La-Z-Boy Inc. 30,656 731
Caleres Inc. 27,027 729* Gentherm Inc. 23,061 718* Cavco Industries Inc. 5,308 714
Scholastic Corp. 17,079 673* Lumber Liquidators
Holdings Inc. 17,824 669* Asbury Automotive Group
Inc. 11,818 636* EW Scripps Co. Class A 35,381 633
Gannett Co. Inc. 71,328 606
Guess? Inc. 38,158 595* RH 12,466 583
DSW Inc. Class A 31,348 581
Standard Motor Products
Inc. 12,611 556* Steven Madden Ltd. 13,104 556
Monro Inc. 11,496 548
Abercrombie & Fitch Co. 42,699 544
Marriott Vacations
Worldwide Corp. 4,449 518
Sturm Ruger & Co. Inc. 11,092 508
New Media Investment
Group Inc. 33,578 463* Red Robin Gourmet
Burgers Inc. 8,081 461* Crocs Inc. 46,524 415* Vista Outdoor Inc. 20,063 411
Bob Evans Farms Inc. 5,958 410
Rent-A-Center Inc. 33,406 404* M/I Homes Inc. 15,571 383
Callaway Golf Co. 25,935 362* Select Comfort Corp. 11,515 340* BJ’s Restaurants Inc. 11,236 338
Chico’s FAS Inc. 42,284 325* Express Inc. 49,237 314* Motorcar Parts of
America Inc. 11,739 308
Sonic Automotive Inc.
Class A 16,559 300* Unifi Inc. 9,612 299* Fiesta Restaurant Group
Inc. 16,996 296* Regis Corp. 22,101 294
Oxford Industries Inc. 4,994 289
Haverty Furniture Cos.
Inc. 12,131 284
Barnes & Noble Inc. 34,688 269
Movado Group Inc. 9,638 267* Genesco Inc. 12,304 260
Strayer Education Inc. 3,228 258
Buckle Inc. 17,792 252* MarineMax Inc. 15,291 247* Monarch Casino &
Resort Inc. 6,925 246
Sonic Corp. 10,391 243* Fossil Group Inc. 26,477 220* Ascena Retail Group Inc. 106,502 217
Financial Statements
Statement of Net AssetsAs of August 31, 2017
The fund reports a complete list of its holdings in regulatory filings four times in each fiscal year, at
the quarter-ends. For the second and fourth fiscal quarters, the lists appear in the fund’s semiannual
and annual reports to shareholders. For the first and third fiscal quarters, the fund files the lists with
the Securities and Exchange Commission on Form N-Q. Shareholders can look up the fund’s Forms
N-Q on the SEC’s website at sec.gov. Forms N-Q may also be reviewed and copied at the SEC’s
Public Reference Room (see the back cover of this report for further information).
S&P Small-Cap 600 Value Index Fund
36
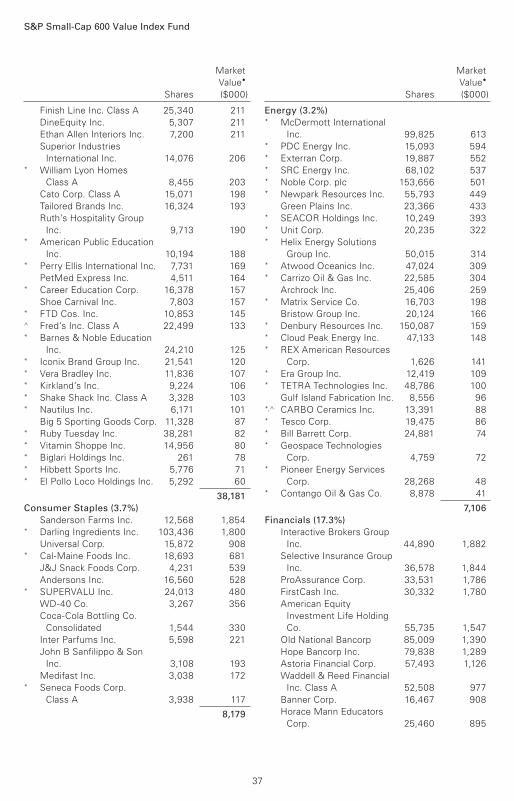
S&P Small-Cap 600 Value Index Fund
Market
Value•
Shares ($000)
Market
Value•
Shares ($000)
Finish Line Inc. Class A 25,340 211
DineEquity Inc. 5,307 211
Ethan Allen Interiors Inc. 7,200 211
Superior Industries
International Inc. 14,076 206* William Lyon Homes
Class A 8,455 203
Cato Corp. Class A 15,071 198
Tailored Brands Inc. 16,324 193
Ruth’s Hospitality Group
Inc. 9,713 190* American Public Education
Inc. 10,194 188* Perry Ellis International Inc. 7,731 169
PetMed Express Inc. 4,511 164* Career Education Corp. 16,378 157
Shoe Carnival Inc. 7,803 157* FTD Cos. Inc. 10,853 145^ Fred’s Inc. Class A 22,499 133* Barnes & Noble Education
Inc. 24,210 125* Iconix Brand Group Inc. 21,541 120* Vera Bradley Inc. 11,836 107* Kirkland’s Inc. 9,224 106* Shake Shack Inc. Class A 3,328 103* Nautilus Inc. 6,171 101
Big 5 Sporting Goods Corp. 11,328 87* Ruby Tuesday Inc. 38,281 82* Vitamin Shoppe Inc. 14,956 80* Biglari Holdings Inc. 261 78* Hibbett Sports Inc. 5,776 71* El Pollo Loco Holdings Inc. 5,292 60
38,181
Consumer Staples (3.7%)
Sanderson Farms Inc. 12,568 1,854* Darling Ingredients Inc. 103,436 1,800
Universal Corp. 15,872 908* Cal-Maine Foods Inc. 18,693 681
J&J Snack Foods Corp. 4,231 539
Andersons Inc. 16,560 528* SUPERVALU Inc. 24,013 480
WD-40 Co. 3,267 356
Coca-Cola Bottling Co.
Consolidated 1,544 330
Inter Parfums Inc. 5,598 221
John B Sanfilippo & Son
Inc. 3,108 193
Medifast Inc. 3,038 172* Seneca Foods Corp.
Class A 3,938 117
8,179
Energy (3.2%) * McDermott International
Inc. 99,825 613* PDC Energy Inc. 15,093 594* Exterran Corp. 19,887 552* SRC Energy Inc. 68,102 537* Noble Corp. plc 153,656 501* Newpark Resources Inc. 55,793 449
Green Plains Inc. 23,366 433* SEACOR Holdings Inc. 10,249 393* Unit Corp. 20,235 322* Helix Energy Solutions
Group Inc. 50,015 314* Atwood Oceanics Inc. 47,024 309* Carrizo Oil & Gas Inc. 22,585 304
Archrock Inc. 25,406 259* Matrix Service Co. 16,703 198
Bristow Group Inc. 20,124 166* Denbury Resources Inc. 150,087 159* Cloud Peak Energy Inc. 47,133 148* REX American Resources
Corp. 1,626 141* Era Group Inc. 12,419 109* TETRA Technologies Inc. 48,786 100
Gulf Island Fabrication Inc. 8,556 96*,^ CARBO Ceramics Inc. 13,391 88* Tesco Corp. 19,475 86* Bill Barrett Corp. 24,881 74* Geospace Technologies
Corp. 4,759 72* Pioneer Energy Services
Corp. 28,268 48* Contango Oil & Gas Co. 8,878 41
7,106
Financials (17.3%)
Interactive Brokers Group
Inc. 44,890 1,882
Selective Insurance Group
Inc. 36,578 1,844
ProAssurance Corp. 33,531 1,786
FirstCash Inc. 30,332 1,780
American Equity
Investment Life Holding
Co. 55,735 1,547
Old National Bancorp 85,009 1,390
Hope Bancorp Inc. 79,838 1,289
Astoria Financial Corp. 57,493 1,126
Waddell & Reed Financial
Inc. Class A 52,508 977
Banner Corp. 16,467 908
Horace Mann Educators
Corp. 25,460 895
37
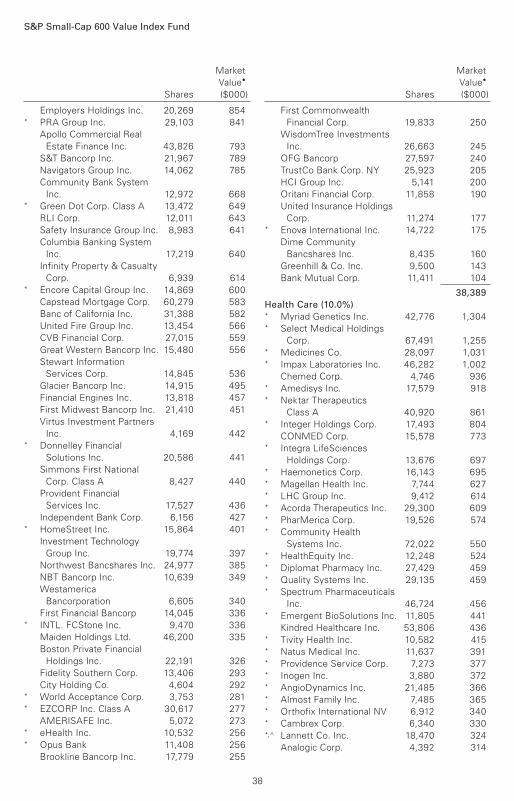
S&P Small-Cap 600 Value Index Fund
Market
Value•
Shares ($000)
Market
Value•
Shares ($000)
Employers Holdings Inc. 20,269 854* PRA Group Inc. 29,103 841
Apollo Commercial Real
Estate Finance Inc. 43,826 793
S&T Bancorp Inc. 21,967 789
Navigators Group Inc. 14,062 785
Community Bank System
Inc. 12,972 668* Green Dot Corp. Class A 13,472 649
RLI Corp. 12,011 643
Safety Insurance Group Inc. 8,983 641
Columbia Banking System
Inc. 17,219 640
Infinity Property & Casualty
Corp. 6,939 614* Encore Capital Group Inc. 14,869 600
Capstead Mortgage Corp. 60,279 583
Banc of California Inc. 31,388 582
United Fire Group Inc. 13,454 566
CVB Financial Corp. 27,015 559
Great Western Bancorp Inc. 15,480 556
Stewart Information
Services Corp. 14,845 536
Glacier Bancorp Inc. 14,915 495
Financial Engines Inc. 13,818 457
First Midwest Bancorp Inc. 21,410 451
Virtus Investment Partners
Inc. 4,169 442* Donnelley Financial
Solutions Inc. 20,586 441
Simmons First National
Corp. Class A 8,427 440
Provident Financial
Services Inc. 17,527 436
Independent Bank Corp. 6,156 427* HomeStreet Inc. 15,864 401
Investment Technology
Group Inc. 19,774 397
Northwest Bancshares Inc. 24,977 385
NBT Bancorp Inc. 10,639 349
Westamerica
Bancorporation 6,605 340
First Financial Bancorp 14,045 336* INTL. FCStone Inc. 9,470 336
Maiden Holdings Ltd. 46,200 335
Boston Private Financial
Holdings Inc. 22,191 326
Fidelity Southern Corp. 13,406 293
City Holding Co. 4,604 292* World Acceptance Corp. 3,753 281* EZCORP Inc. Class A 30,617 277
AMERISAFE Inc. 5,072 273* eHealth Inc. 10,532 256* Opus Bank 11,408 256
Brookline Bancorp Inc. 17,779 255
First Commonwealth
Financial Corp. 19,833 250
WisdomTree Investments
Inc. 26,663 245
OFG Bancorp 27,597 240
TrustCo Bank Corp. NY 25,923 205
HCI Group Inc. 5,141 200
Oritani Financial Corp. 11,858 190
United Insurance Holdings
Corp. 11,274 177* Enova International Inc. 14,722 175
Dime Community
Bancshares Inc. 8,435 160
Greenhill & Co. Inc. 9,500 143
Bank Mutual Corp. 11,411 104
38,389
Health Care (10.0%) * Myriad Genetics Inc. 42,776 1,304* Select Medical Holdings
Corp. 67,491 1,255* Medicines Co. 28,097 1,031* Impax Laboratories Inc. 46,282 1,002
Chemed Corp. 4,746 936* Amedisys Inc. 17,579 918* Nektar Therapeutics
Class A 40,920 861* Integer Holdings Corp. 17,493 804
CONMED Corp. 15,578 773* Integra LifeSciences
Holdings Corp. 13,676 697* Haemonetics Corp. 16,143 695* Magellan Health Inc. 7,744 627* LHC Group Inc. 9,412 614* Acorda Therapeutics Inc. 29,300 609* PharMerica Corp. 19,526 574* Community Health
Systems Inc. 72,022 550* HealthEquity Inc. 12,248 524* Diplomat Pharmacy Inc. 27,429 459* Quality Systems Inc. 29,135 459* Spectrum Pharmaceuticals
Inc. 46,724 456* Emergent BioSolutions Inc. 11,805 441
Kindred Healthcare Inc. 53,806 436* Tivity Health Inc. 10,582 415* Natus Medical Inc. 11,637 391* Providence Service Corp. 7,273 377* Inogen Inc. 3,880 372* AngioDynamics Inc. 21,485 366* Almost Family Inc. 7,485 365* Orthofix International NV 6,912 340* Cambrex Corp. 6,340 330*,^ Lannett Co. Inc. 18,470 324
Analogic Corp. 4,392 314
38
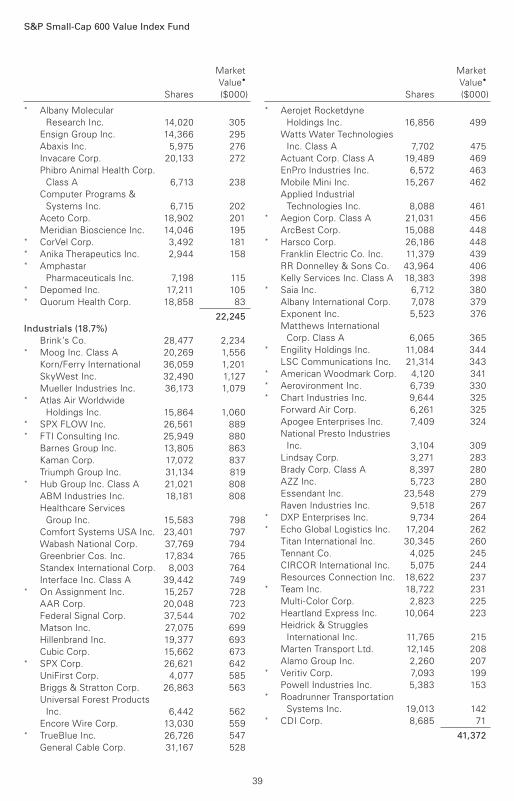
S&P Small-Cap 600 Value Index Fund
Market
Value•
Shares ($000)
Market
Value•
Shares ($000)
* Albany Molecular
Research Inc. 14,020 305
Ensign Group Inc. 14,366 295
Abaxis Inc. 5,975 276
Invacare Corp. 20,133 272
Phibro Animal Health Corp.
Class A 6,713 238
Computer Programs &
Systems Inc. 6,715 202
Aceto Corp. 18,902 201
Meridian Bioscience Inc. 14,046 195* CorVel Corp. 3,492 181* Anika Therapeutics Inc. 2,944 158* Amphastar
Pharmaceuticals Inc. 7,198 115* Depomed Inc. 17,211 105* Quorum Health Corp. 18,858 83
22,245
Industrials (18.7%)
Brink’s Co. 28,477 2,234* Moog Inc. Class A 20,269 1,556
Korn/Ferry International 36,059 1,201
SkyWest Inc. 32,490 1,127
Mueller Industries Inc. 36,173 1,079* Atlas Air Worldwide
Holdings Inc. 15,864 1,060* SPX FLOW Inc. 26,561 889* FTI Consulting Inc. 25,949 880
Barnes Group Inc. 13,805 863
Kaman Corp. 17,072 837
Triumph Group Inc. 31,134 819* Hub Group Inc. Class A 21,021 808
ABM Industries Inc. 18,181 808
Healthcare Services
Group Inc. 15,583 798
Comfort Systems USA Inc. 23,401 797
Wabash National Corp. 37,769 794
Greenbrier Cos. Inc. 17,834 765
Standex International Corp. 8,003 764
Interface Inc. Class A 39,442 749* On Assignment Inc. 15,257 728
AAR Corp. 20,048 723
Federal Signal Corp. 37,544 702
Matson Inc. 27,075 699
Hillenbrand Inc. 19,377 693
Cubic Corp. 15,662 673* SPX Corp. 26,621 642
UniFirst Corp. 4,077 585
Briggs & Stratton Corp. 26,863 563
Universal Forest Products
Inc. 6,442 562
Encore Wire Corp. 13,030 559* TrueBlue Inc. 26,726 547
General Cable Corp. 31,167 528
* Aerojet Rocketdyne
Holdings Inc. 16,856 499
Watts Water Technologies
Inc. Class A 7,702 475
Actuant Corp. Class A 19,489 469
EnPro Industries Inc. 6,572 463
Mobile Mini Inc. 15,267 462
Applied Industrial
Technologies Inc. 8,088 461* Aegion Corp. Class A 21,031 456
ArcBest Corp. 15,088 448* Harsco Corp. 26,186 448
Franklin Electric Co. Inc. 11,379 439
RR Donnelley & Sons Co. 43,964 406
Kelly Services Inc. Class A 18,383 398* Saia Inc. 6,712 380
Albany International Corp. 7,078 379
Exponent Inc. 5,523 376
Matthews International
Corp. Class A 6,065 365* Engility Holdings Inc. 11,084 344
LSC Communications Inc. 21,314 343* American Woodmark Corp. 4,120 341* Aerovironment Inc. 6,739 330* Chart Industries Inc. 9,644 325
Forward Air Corp. 6,261 325
Apogee Enterprises Inc. 7,409 324
National Presto Industries
Inc. 3,104 309
Lindsay Corp. 3,271 283
Brady Corp. Class A 8,397 280
AZZ Inc. 5,723 280
Essendant Inc. 23,548 279
Raven Industries Inc. 9,518 267* DXP Enterprises Inc. 9,734 264* Echo Global Logistics Inc. 17,204 262
Titan International Inc. 30,345 260
Tennant Co. 4,025 245
CIRCOR International Inc. 5,075 244
Resources Connection Inc. 18,622 237* Team Inc. 18,722 231
Multi-Color Corp. 2,823 225
Heartland Express Inc. 10,064 223
Heidrick & Struggles
International Inc. 11,765 215
Marten Transport Ltd. 12,145 208
Alamo Group Inc. 2,260 207* Veritiv Corp. 7,093 199
Powell Industries Inc. 5,383 153* Roadrunner Transportation
Systems Inc. 19,013 142* CDI Corp. 8,685 71
41,372
39
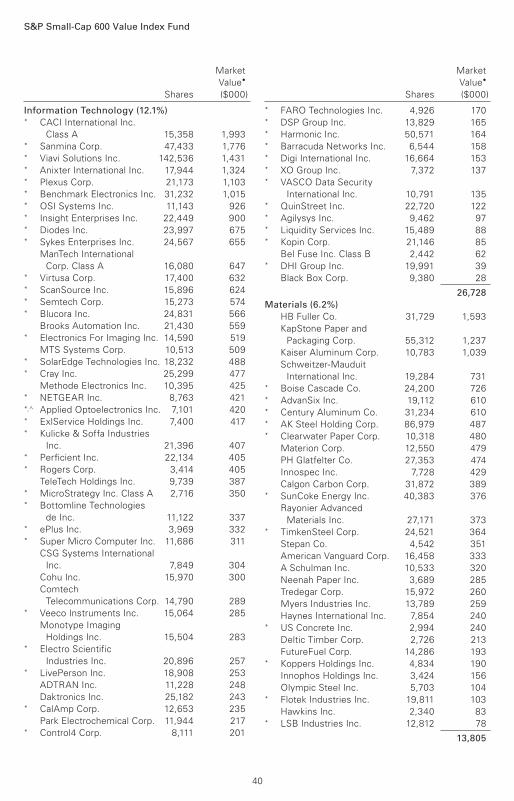
S&P Small-Cap 600 Value Index Fund
Market
Value•
Shares ($000)
Market
Value•
Shares ($000)
Information Technology (12.1%) * CACI International Inc.
Class A 15,358 1,993* Sanmina Corp. 47,433 1,776* Viavi Solutions Inc. 142,536 1,431* Anixter International Inc. 17,944 1,324* Plexus Corp. 21,173 1,103* Benchmark Electronics Inc. 31,232 1,015* OSI Systems Inc. 11,143 926* Insight Enterprises Inc. 22,449 900* Diodes Inc. 23,997 675* Sykes Enterprises Inc. 24,567 655
ManTech International
Corp. Class A 16,080 647* Virtusa Corp. 17,400 632* ScanSource Inc. 15,896 624* Semtech Corp. 15,273 574* Blucora Inc. 24,831 566
Brooks Automation Inc. 21,430 559* Electronics For Imaging Inc. 14,590 519
MTS Systems Corp. 10,513 509* SolarEdge Technologies Inc. 18,232 488* Cray Inc. 25,299 477
Methode Electronics Inc. 10,395 425* NETGEAR Inc. 8,763 421*,^ Applied Optoelectronics Inc. 7,101 420* ExlService Holdings Inc. 7,400 417* Kulicke & Soffa Industries
Inc. 21,396 407* Perficient Inc. 22,134 405* Rogers Corp. 3,414 405
TeleTech Holdings Inc. 9,739 387* MicroStrategy Inc. Class A 2,716 350* Bottomline Technologies
de Inc. 11,122 337* ePlus Inc. 3,969 332* Super Micro Computer Inc. 11,686 311
CSG Systems International
Inc. 7,849 304
Cohu Inc. 15,970 300
Comtech
Telecommunications Corp. 14,790 289* Veeco Instruments Inc. 15,064 285
Monotype Imaging
Holdings Inc. 15,504 283* Electro Scientific
Industries Inc. 20,896 257* LivePerson Inc. 18,908 253
ADTRAN Inc. 11,228 248
Daktronics Inc. 25,182 243* CalAmp Corp. 12,653 235
Park Electrochemical Corp. 11,944 217* Control4 Corp. 8,111 201
* FARO Technologies Inc. 4,926 170* DSP Group Inc. 13,829 165* Harmonic Inc. 50,571 164* Barracuda Networks Inc. 6,544 158* Digi International Inc. 16,664 153* XO Group Inc. 7,372 137* VASCO Data Security
International Inc. 10,791 135* QuinStreet Inc. 22,720 122* Agilysys Inc. 9,462 97* Liquidity Services Inc. 15,489 88* Kopin Corp. 21,146 85
Bel Fuse Inc. Class B 2,442 62* DHI Group Inc. 19,991 39
Black Box Corp. 9,380 28
26,728
Materials (6.2%)
HB Fuller Co. 31,729 1,593
KapStone Paper and
Packaging Corp. 55,312 1,237
Kaiser Aluminum Corp. 10,783 1,039
Schweitzer-Mauduit
International Inc. 19,284 731* Boise Cascade Co. 24,200 726* AdvanSix Inc. 19,112 610* Century Aluminum Co. 31,234 610* AK Steel Holding Corp. 86,979 487* Clearwater Paper Corp. 10,318 480
Materion Corp. 12,550 479
PH Glatfelter Co. 27,353 474
Innospec Inc. 7,728 429
Calgon Carbon Corp. 31,872 389* SunCoke Energy Inc. 40,383 376
Rayonier Advanced
Materials Inc. 27,171 373* TimkenSteel Corp. 24,521 364
Stepan Co. 4,542 351
American Vanguard Corp. 16,458 333
A Schulman Inc. 10,533 320
Neenah Paper Inc. 3,689 285
Tredegar Corp. 15,972 260
Myers Industries Inc. 13,789 259
Haynes International Inc. 7,854 240* US Concrete Inc. 2,994 240
Deltic Timber Corp. 2,726 213
FutureFuel Corp. 14,286 193* Koppers Holdings Inc. 4,834 190
Innophos Holdings Inc. 3,424 156
Olympic Steel Inc. 5,703 104* Flotek Industries Inc. 19,811 103
Hawkins Inc. 2,340 83* LSB Industries Inc. 12,812 78
13,805
40
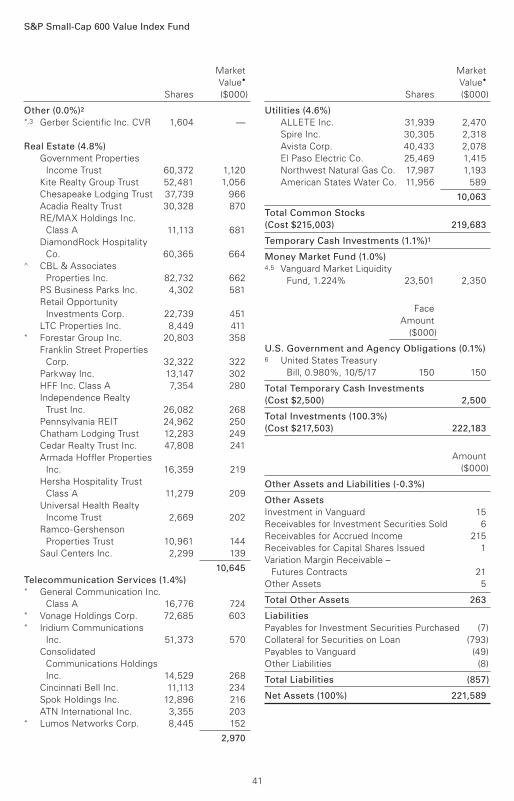
S&P Small-Cap 600 Value Index Fund
Market
Value•
Shares ($000)
Market
Value•
Shares ($000)
Other (0.0%)2 *,3 Gerber Scientific Inc. CVR 1,604 —
Real Estate (4.8%)
Government Properties
Income Trust 60,372 1,120
Kite Realty Group Trust 52,481 1,056
Chesapeake Lodging Trust 37,739 966
Acadia Realty Trust 30,328 870
RE/MAX Holdings Inc.
Class A 11,113 681
DiamondRock Hospitality
Co. 60,365 664^ CBL & Associates
Properties Inc. 82,732 662
PS Business Parks Inc. 4,302 581
Retail Opportunity
Investments Corp. 22,739 451
LTC Properties Inc. 8,449 411* Forestar Group Inc. 20,803 358
Franklin Street Properties
Corp. 32,322 322
Parkway Inc. 13,147 302
HFF Inc. Class A 7,354 280
Independence Realty
Trust Inc. 26,082 268
Pennsylvania REIT 24,962 250
Chatham Lodging Trust 12,283 249
Cedar Realty Trust Inc. 47,808 241
Armada Hoffler Properties
Inc. 16,359 219
Hersha Hospitality Trust
Class A 11,279 209
Universal Health Realty
Income Trust 2,669 202
Ramco-Gershenson
Properties Trust 10,961 144
Saul Centers Inc. 2,299 139
10,645
Telecommunication Services (1.4%) * General Communication Inc.
Class A 16,776 724* Vonage Holdings Corp. 72,685 603* Iridium Communications
Inc. 51,373 570
Consolidated
Communications Holdings
Inc. 14,529 268
Cincinnati Bell Inc. 11,113 234
Spok Holdings Inc. 12,896 216
ATN International Inc. 3,355 203* Lumos Networks Corp. 8,445 152
2,970
Utilities (4.6%)
ALLETE Inc. 31,939 2,470
Spire Inc. 30,305 2,318
Avista Corp. 40,433 2,078
El Paso Electric Co. 25,469 1,415
Northwest Natural Gas Co. 17,987 1,193
American States Water Co. 11,956 589
10,063
Total Common Stocks
(Cost $215,003) 219,683
Temporary Cash Investments (1.1%)1
Money Market Fund (1.0%)4,5 Vanguard Market Liquidity
Fund, 1.224% 23,501 2,350
Face
Amount
($000)
U.S. Government and Agency Obligations (0.1%) 6 United States Treasury
Bill, 0.980%, 10/5/17 150 150
Total Temporary Cash Investments
(Cost $2,500) 2,500
Total Investments (100.3%)
(Cost $217,503) 222,183
Amount
($000)
Other Assets and Liabilities (-0.3%)
Other Assets
Investment in Vanguard 15
Receivables for Investment Securities Sold 6
Receivables for Accrued Income 215
Receivables for Capital Shares Issued 1
Variation Margin Receivable –
Futures Contracts 21
Other Assets 5
Total Other Assets 263
Liabilities
Payables for Investment Securities Purchased (7)
Collateral for Securities on Loan (793)
Payables to Vanguard (49)
Other Liabilities (8)
Total Liabilities (857)
Net Assets (100%) 221,589
41
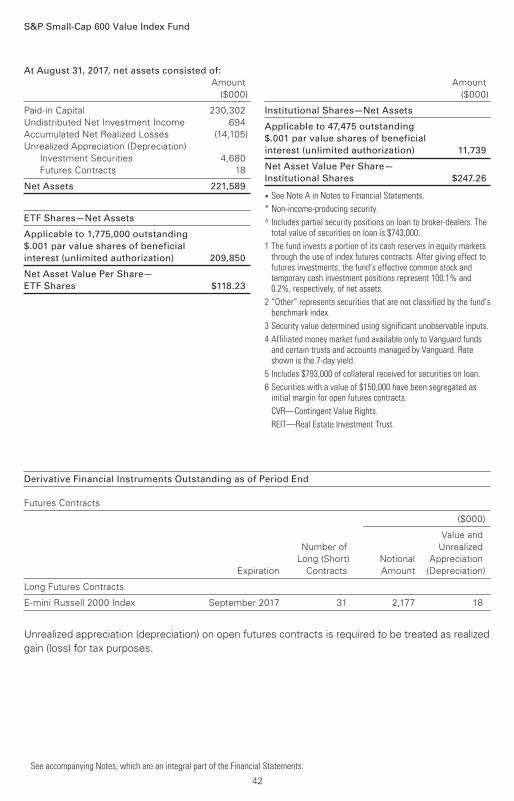
S&P Small-Cap 600 Value Index Fund
At August 31, 2017, net assets consisted of:
Amount
($000)
Amount
($000)
Paid-in Capital 230,302
Undistributed Net Investment Income 694
Accumulated Net Realized Losses (14,105)
Unrealized Appreciation (Depreciation)
Investment Securities 4,680
Futures Contracts 18
Net Assets 221,589
ETF Shares—Net Assets
Applicable to 1,775,000 outstanding
$.001 par value shares of beneficial
interest (unlimited authorization) 209,850
Net Asset Value Per Share—
ETF Shares $118.23
Institutional Shares—Net Assets
Applicable to 47,475 outstanding
$.001 par value shares of beneficial
interest (unlimited authorization) 11,739
Net Asset Value Per Share—
Institutional Shares $247.26
• See Note A in Notes to Financial Statements.
* Non-income-producing security.
^ Includes partial security positions on loan to broker-dealers. The total value of securities on loan is $743,000.
1 The fund invests a portion of its cash reserves in equity markets through the use of index futures contracts. After giving effect to futures investments, the fund’s effective common stock and temporary cash investment positions represent 100.1% and 0.2%, respectively, of net assets.
2 “Other” represents securities that are not classified by the fund’s benchmark index.
3 Security value determined using significant unobservable inputs.
4 Affiliated money market fund available only to Vanguard funds and certain trusts and accounts managed by Vanguard. Rate shown is the 7-day yield.
5 Includes $793,000 of collateral received for securities on loan.
6 Securities with a value of $150,000 have been segregated as initial margin for open futures contracts.
CVR—Contingent Value Rights.
REIT—Real Estate Investment Trust.
See accompanying Notes, which are an integral part of the Financial Statements.
Derivative Financial Instruments Outstanding as of Period End
Futures Contracts
($000)
Value and
Number of Unrealized
Long (Short) Notional Appreciation
Expiration Contracts Amount (Depreciation)
Long Futures Contracts
E-mini Russell 2000 Index September 2017 31 2,177 18
Unrealized appreciation (depreciation) on open futures contracts is required to be treated as realized
gain (loss) for tax purposes.
42
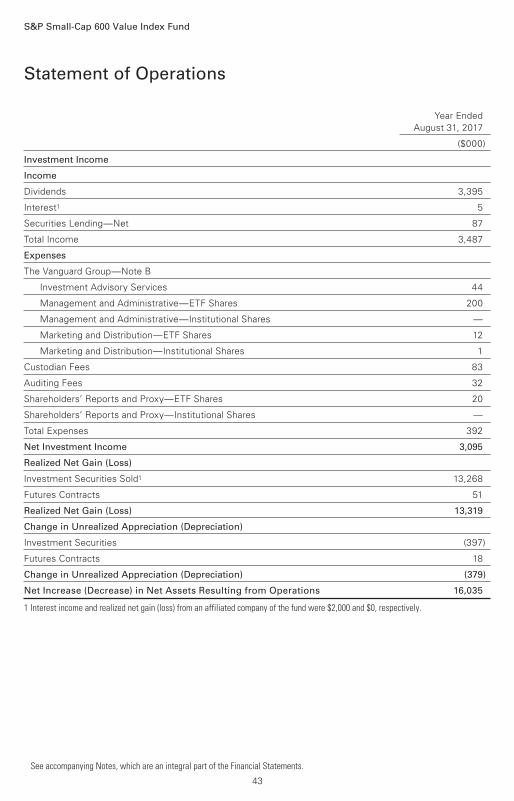
Year Ended
August 31, 2017
($000)
Investment Income
Income
Dividends 3,395
Interest1 5
Securities Lending—Net 87
Total Income 3,487
Expenses
The Vanguard Group—Note B
Investment Advisory Services 44
Management and Administrative—ETF Shares 200
Management and Administrative—Institutional Shares —
Marketing and Distribution—ETF Shares 12
Marketing and Distribution—Institutional Shares 1
Custodian Fees 83
Auditing Fees 32
Shareholders’ Reports and Proxy—ETF Shares 20
Shareholders’ Reports and Proxy—Institutional Shares —
Total Expenses 392
Net Investment Income 3,095
Realized Net Gain (Loss)
Investment Securities Sold1 13,268
Futures Contracts 51
Realized Net Gain (Loss) 13,319
Change in Unrealized Appreciation (Depreciation)
Investment Securities (397)
Futures Contracts 18
Change in Unrealized Appreciation (Depreciation) (379)
Net Increase (Decrease) in Net Assets Resulting from Operations 16,035
1 Interest income and realized net gain (loss) from an affiliated company of the fund were $2,000 and $0, respectively.
Statement of Operations
S&P Small-Cap 600 Value Index Fund
See accompanying Notes, which are an integral part of the Financial Statements.
43
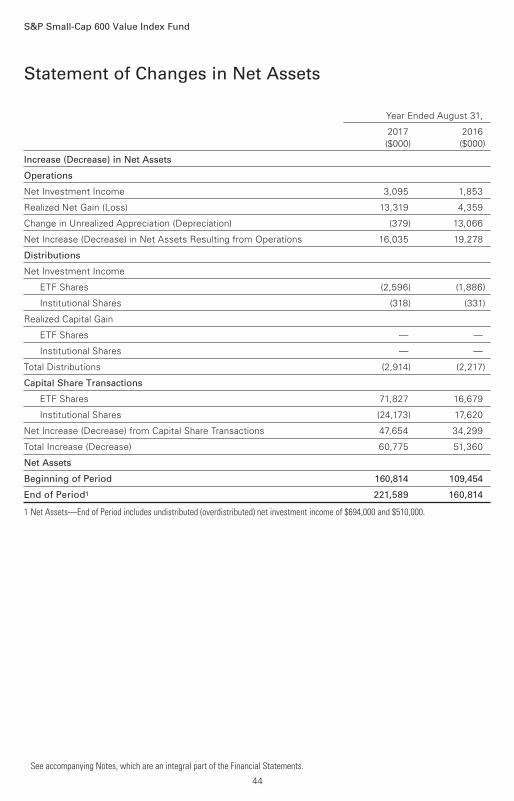
Statement of Changes in Net Assets
S&P Small-Cap 600 Value Index Fund
See accompanying Notes, which are an integral part of the Financial Statements.
Year Ended August 31,
2017 2016
($000) ($000)
Increase (Decrease) in Net Assets
Operations
Net Investment Income 3,095 1,853
Realized Net Gain (Loss) 13,319 4,359
Change in Unrealized Appreciation (Depreciation) (379) 13,066
Net Increase (Decrease) in Net Assets Resulting from Operations 16,035 19,278
Distributions
Net Investment Income
ETF Shares (2,596) (1,886)
Institutional Shares (318) (331)
Realized Capital Gain
ETF Shares — —
Institutional Shares — —
Total Distributions (2,914) (2,217)
Capital Share Transactions
ETF Shares 71,827 16,679
Institutional Shares (24,173) 17,620
Net Increase (Decrease) from Capital Share Transactions 47,654 34,299
Total Increase (Decrease) 60,775 51,360
Net Assets
Beginning of Period 160,814 109,454
End of Period1 221,589 160,814
1 Net Assets—End of Period includes undistributed (overdistributed) net investment income of $694,000 and $510,000.
44
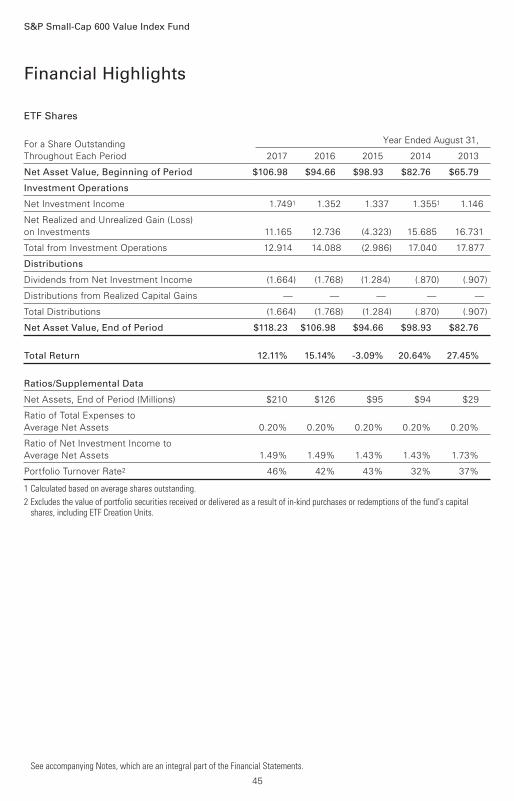
ETF Shares
For a Share Outstanding Year Ended August 31,
Throughout Each Period 2017 2016 2015 2014 2013
Net Asset Value, Beginning of Period $106.98 $94.66 $98.93 $82.76 $65.79
Investment Operations
Net Investment Income 1.7491 1.352 1.337 1.3551 1.146
Net Realized and Unrealized Gain (Loss)
on Investments 11.165 12.736 (4.323) 15.685 16.731
Total from Investment Operations 12.914 14.088 (2.986) 17.040 17.877
Distributions
Dividends from Net Investment Income (1.664) (1.768) (1.284) (.870) (.907)
Distributions from Realized Capital Gains — — — — —
Total Distributions (1.664) (1.768) (1.284) (.870) (.907)
Net Asset Value, End of Period $118.23 $106.98 $94.66 $98.93 $82.76
Total Return 12.11% 15.14% -3.09% 20.64% 27.45%
Ratios/Supplemental Data
Net Assets, End of Period (Millions) $210 $126 $95 $94 $29
Ratio of Total Expenses to
Average Net Assets 0.20% 0.20% 0.20% 0.20% 0.20%
Ratio of Net Investment Income to
Average Net Assets 1.49% 1.49% 1.43% 1.43% 1.73%
Portfolio Turnover Rate2 46% 42% 43% 32% 37%
1 Calculated based on average shares outstanding.
2 Excludes the value of portfolio securities received or delivered as a result of in-kind purchases or redemptions of the fund’s capital shares, including ETF Creation Units.
Financial Highlights
See accompanying Notes, which are an integral part of the Financial Statements.
S&P Small-Cap 600 Value Index Fund
45
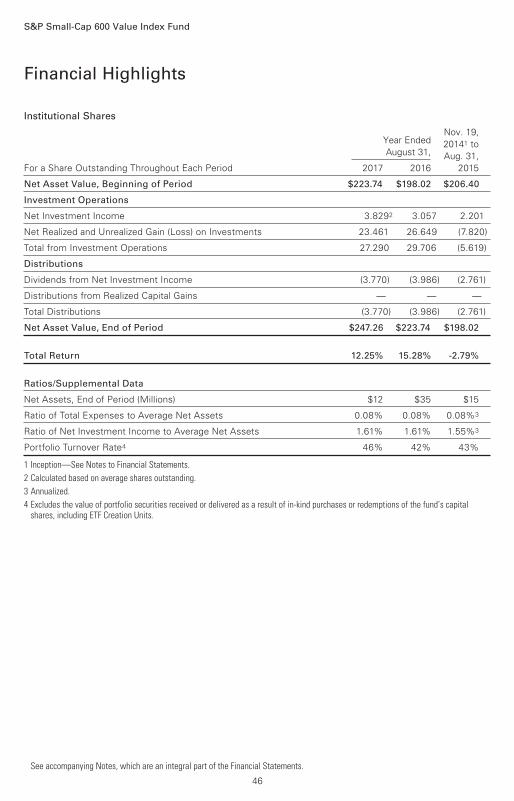
Institutional Shares
Nov. 19,
Year Ended 20141 to
August 31, Aug. 31,
For a Share Outstanding Throughout Each Period 2017 2016 2015
Net Asset Value, Beginning of Period $223.74 $198.02 $206.40
Investment Operations
Net Investment Income 3.8292 3.057 2.201
Net Realized and Unrealized Gain (Loss) on Investments 23.461 26.649 (7.820)
Total from Investment Operations 27.290 29.706 (5.619)
Distributions
Dividends from Net Investment Income (3.770) (3.986) (2.761)
Distributions from Realized Capital Gains — — —
Total Distributions (3.770) (3.986) (2.761)
Net Asset Value, End of Period $247.26 $223.74 $198.02
Total Return 12.25% 15.28% -2.79%
Ratios/Supplemental Data
Net Assets, End of Period (Millions) $12 $35 $15
Ratio of Total Expenses to Average Net Assets 0.08% 0.08% 0.08%3
Ratio of Net Investment Income to Average Net Assets 1.61% 1.61% 1.55%3
Portfolio Turnover Rate4 46% 42% 43%
1 Inception—See Notes to Financial Statements.
2 Calculated based on average shares outstanding.
3 Annualized.
4 Excludes the value of portfolio securities received or delivered as a result of in-kind purchases or redemptions of the fund’s capital shares, including ETF Creation Units.
Financial Highlights
See accompanying Notes, which are an integral part of the Financial Statements.
S&P Small-Cap 600 Value Index Fund
46
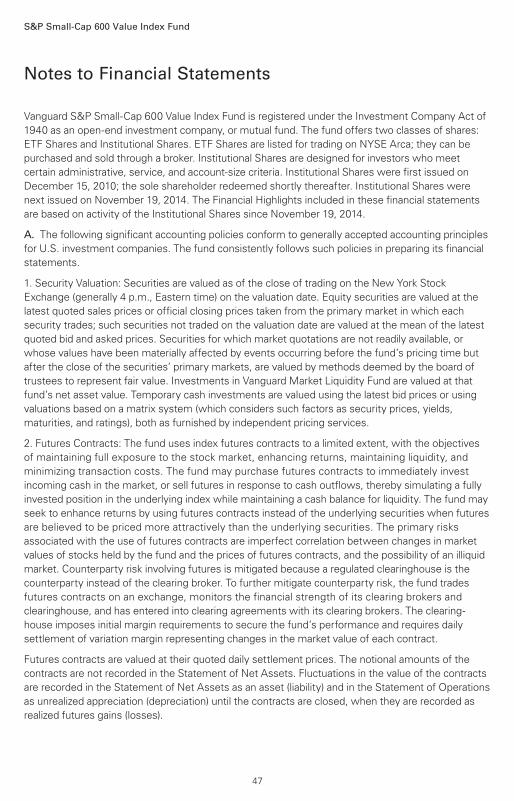
Notes to Financial Statements
S&P Small-Cap 600 Value Index Fund
Vanguard S&P Small-Cap 600 Value Index Fund is registered under the Investment Company Act of
1940 as an open-end investment company, or mutual fund. The fund offers two classes of shares:
ETF Shares and Institutional Shares. ETF Shares are listed for trading on NYSE Arca; they can be
purchased and sold through a broker. Institutional Shares are designed for investors who meet
certain administrative, service, and account-size criteria. Institutional Shares were first issued on
December 15, 2010; the sole shareholder redeemed shortly thereafter. Institutional Shares were
next issued on November 19, 2014. The Financial Highlights included in these financial statements
are based on activity of the Institutional Shares since November 19, 2014.
A. The following significant accounting policies conform to generally accepted accounting principles
for U.S. investment companies. The fund consistently follows such policies in preparing its financial
statements.
1. Security Valuation: Securities are valued as of the close of trading on the New York Stock
Exchange (generally 4 p.m., Eastern time) on the valuation date. Equity securities are valued at the
latest quoted sales prices or official closing prices taken from the primary market in which each
security trades; such securities not traded on the valuation date are valued at the mean of the latest
quoted bid and asked prices. Securities for which market quotations are not readily available, or
whose values have been materially affected by events occurring before the fund’s pricing time but
after the close of the securities’ primary markets, are valued by methods deemed by the board of
trustees to represent fair value. Investments in Vanguard Market Liquidity Fund are valued at that
fund’s net asset value. Temporary cash investments are valued using the latest bid prices or using
valuations based on a matrix system (which considers such factors as security prices, yields,
maturities, and ratings), both as furnished by independent pricing services.
2. Futures Contracts: The fund uses index futures contracts to a limited extent, with the objectives
of maintaining full exposure to the stock market, enhancing returns, maintaining liquidity, and
minimizing transaction costs. The fund may purchase futures contracts to immediately invest
incoming cash in the market, or sell futures in response to cash outflows, thereby simulating a fully
invested position in the underlying index while maintaining a cash balance for liquidity. The fund may
seek to enhance returns by using futures contracts instead of the underlying securities when futures
are believed to be priced more attractively than the underlying securities. The primary risks
associated with the use of futures contracts are imperfect correlation between changes in market
values of stocks held by the fund and the prices of futures contracts, and the possibility of an illiquid
market. Counterparty risk involving futures is mitigated because a regulated clearinghouse is the
counterparty instead of the clearing broker. To further mitigate counterparty risk, the fund trades
futures contracts on an exchange, monitors the financial strength of its clearing brokers and
clearinghouse, and has entered into clearing agreements with its clearing brokers. The clearing-
house imposes initial margin requirements to secure the fund’s performance and requires daily
settlement of variation margin representing changes in the market value of each contract.
Futures contracts are valued at their quoted daily settlement prices. The notional amounts of the
contracts are not recorded in the Statement of Net Assets. Fluctuations in the value of the contracts
are recorded in the Statement of Net Assets as an asset (liability) and in the Statement of Operations
as unrealized appreciation (depreciation) until the contracts are closed, when they are recorded as
realized futures gains (losses).
47
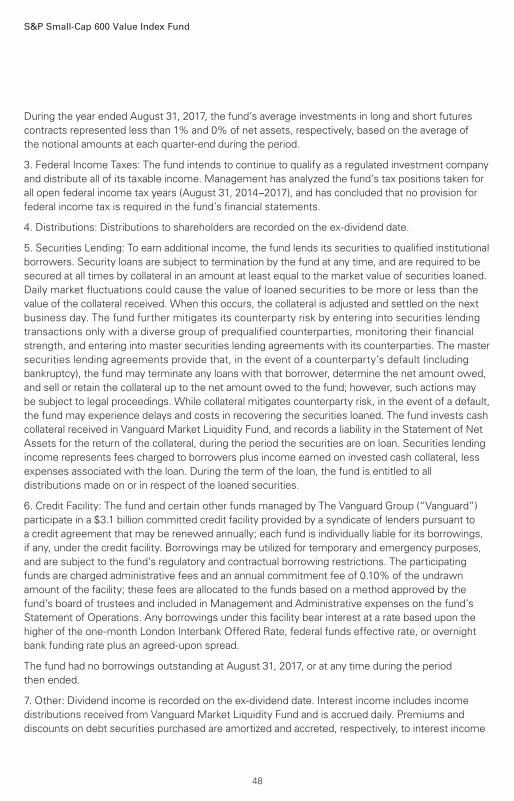
S&P Small-Cap 600 Value Index Fund
During the year ended August 31, 2017, the fund’s average investments in long and short futures
contracts represented less than 1% and 0% of net assets, respectively, based on the average of
the notional amounts at each quarter-end during the period.
3. Federal Income Taxes: The fund intends to continue to qualify as a regulated investment company
and distribute all of its taxable income. Management has analyzed the fund’s tax positions taken for
all open federal income tax years (August 31, 2014–2017), and has concluded that no provision for
federal income tax is required in the fund’s financial statements.
4. Distributions: Distributions to shareholders are recorded on the ex-dividend date.
5. Securities Lending: To earn additional income, the fund lends its securities to qualified institutional
borrowers. Security loans are subject to termination by the fund at any time, and are required to be
secured at all times by collateral in an amount at least equal to the market value of securities loaned.
Daily market fluctuations could cause the value of loaned securities to be more or less than the
value of the collateral received. When this occurs, the collateral is adjusted and settled on the next
business day. The fund further mitigates its counterparty risk by entering into securities lending
transactions only with a diverse group of prequalified counterparties, monitoring their financial
strength, and entering into master securities lending agreements with its counterparties. The master
securities lending agreements provide that, in the event of a counterparty’s default (including
bankruptcy), the fund may terminate any loans with that borrower, determine the net amount owed,
and sell or retain the collateral up to the net amount owed to the fund; however, such actions may
be subject to legal proceedings. While collateral mitigates counterparty risk, in the event of a default,
the fund may experience delays and costs in recovering the securities loaned. The fund invests cash
collateral received in Vanguard Market Liquidity Fund, and records a liability in the Statement of Net
Assets for the return of the collateral, during the period the securities are on loan. Securities lending
income represents fees charged to borrowers plus income earned on invested cash collateral, less
expenses associated with the loan. During the term of the loan, the fund is entitled to all
distributions made on or in respect of the loaned securities.
6. Credit Facility: The fund and certain other funds managed by The Vanguard Group (“Vanguard”)
participate in a $3.1 billion committed credit facility provided by a syndicate of lenders pursuant to
a credit agreement that may be renewed annually; each fund is individually liable for its borrowings,
if any, under the credit facility. Borrowings may be utilized for temporary and emergency purposes,
and are subject to the fund’s regulatory and contractual borrowing restrictions. The participating
funds are charged administrative fees and an annual commitment fee of 0.10% of the undrawn
amount of the facility; these fees are allocated to the funds based on a method approved by the
fund’s board of trustees and included in Management and Administrative expenses on the fund’s
Statement of Operations. Any borrowings under this facility bear interest at a rate based upon the
higher of the one-month London Interbank Offered Rate, federal funds effective rate, or overnight
bank funding rate plus an agreed-upon spread.
The fund had no borrowings outstanding at August 31, 2017, or at any time during the period
then ended.
7. Other: Dividend income is recorded on the ex-dividend date. Interest income includes income
distributions received from Vanguard Market Liquidity Fund and is accrued daily. Premiums and
discounts on debt securities purchased are amortized and accreted, respectively, to interest income
48
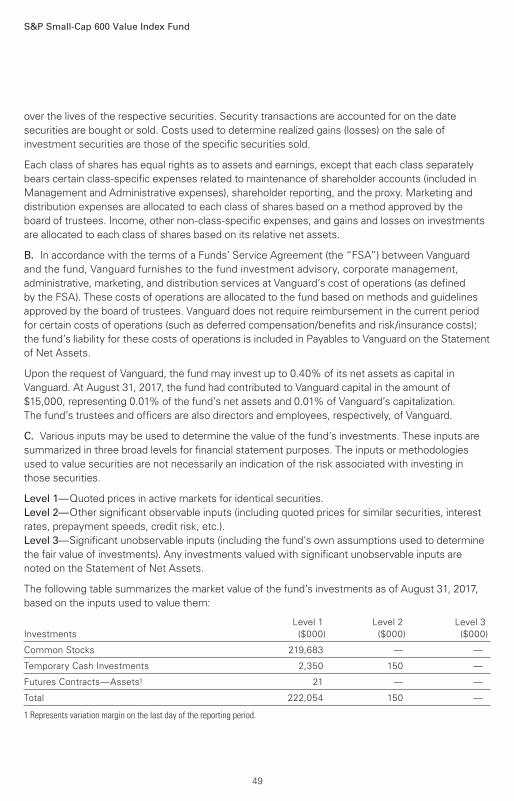
S&P Small-Cap 600 Value Index Fund
over the lives of the respective securities. Security transactions are accounted for on the date
securities are bought or sold. Costs used to determine realized gains (losses) on the sale of
investment securities are those of the specific securities sold.
Each class of shares has equal rights as to assets and earnings, except that each class separately
bears certain class-specific expenses related to maintenance of shareholder accounts (included in
Management and Administrative expenses), shareholder reporting, and the proxy. Marketing and
distribution expenses are allocated to each class of shares based on a method approved by the
board of trustees. Income, other non-class-specific expenses, and gains and losses on investments
are allocated to each class of shares based on its relative net assets.
B. In accordance with the terms of a Funds’ Service Agreement (the “FSA”) between Vanguard
and the fund, Vanguard furnishes to the fund investment advisory, corporate management,
administrative, marketing, and distribution services at Vanguard’s cost of operations (as defined
by the FSA). These costs of operations are allocated to the fund based on methods and guidelines
approved by the board of trustees. Vanguard does not require reimbursement in the current period
for certain costs of operations (such as deferred compensation/benefits and risk/insurance costs);
the fund’s liability for these costs of operations is included in Payables to Vanguard on the Statement
of Net Assets.
Upon the request of Vanguard, the fund may invest up to 0.40% of its net assets as capital in
Vanguard. At August 31, 2017, the fund had contributed to Vanguard capital in the amount of
$15,000, representing 0.01% of the fund’s net assets and 0.01% of Vanguard’s capitalization.
The fund’s trustees and officers are also directors and employees, respectively, of Vanguard.
C. Various inputs may be used to determine the value of the fund’s investments. These inputs are
summarized in three broad levels for financial statement purposes. The inputs or methodologies
used to value securities are not necessarily an indication of the risk associated with investing in
those securities.
Level 1—Quoted prices in active markets for identical securities.
Level 2—Other significant observable inputs (including quoted prices for similar securities, interest
rates, prepayment speeds, credit risk, etc.).
Level 3—Significant unobservable inputs (including the fund’s own assumptions used to determine
the fair value of investments). Any investments valued with significant unobservable inputs are
noted on the Statement of Net Assets.
The following table summarizes the market value of the fund’s investments as of August 31, 2017,
based on the inputs used to value them:
Level 1 Level 2 Level 3
Investments ($000) ($000) ($000)
Common Stocks 219,683 — —
Temporary Cash Investments 2,350 150 —
Futures Contracts—Assets1 21 — —
Total 222,054 150 —
1 Represents variation margin on the last day of the reporting period.
49
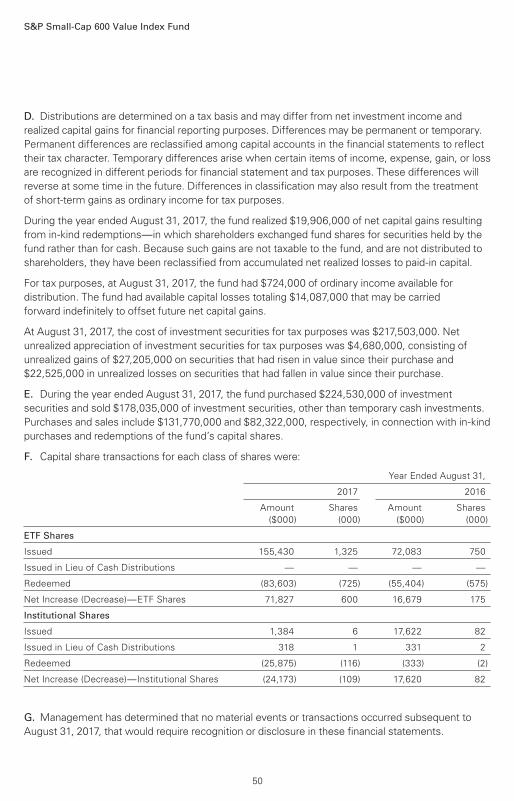
S&P Small-Cap 600 Value Index Fund
D. Distributions are determined on a tax basis and may differ from net investment income and
realized capital gains for financial reporting purposes. Differences may be permanent or temporary.
Permanent differences are reclassified among capital accounts in the financial statements to reflect
their tax character. Temporary differences arise when certain items of income, expense, gain, or loss
are recognized in different periods for financial statement and tax purposes. These differences will
reverse at some time in the future. Differences in classification may also result from the treatment
of short-term gains as ordinary income for tax purposes.
During the year ended August 31, 2017, the fund realized $19,906,000 of net capital gains resulting
from in-kind redemptions—in which shareholders exchanged fund shares for securities held by the
fund rather than for cash. Because such gains are not taxable to the fund, and are not distributed to
shareholders, they have been reclassified from accumulated net realized losses to paid-in capital.
For tax purposes, at August 31, 2017, the fund had $724,000 of ordinary income available for
distribution. The fund had available capital losses totaling $14,087,000 that may be carried
forward indefinitely to offset future net capital gains.
At August 31, 2017, the cost of investment securities for tax purposes was $217,503,000. Net
unrealized appreciation of investment securities for tax purposes was $4,680,000, consisting of
unrealized gains of $27,205,000 on securities that had risen in value since their purchase and
$22,525,000 in unrealized losses on securities that had fallen in value since their purchase.
E. During the year ended August 31, 2017, the fund purchased $224,530,000 of investment
securities and sold $178,035,000 of investment securities, other than temporary cash investments.
Purchases and sales include $131,770,000 and $82,322,000, respectively, in connection with in-kind
purchases and redemptions of the fund’s capital shares.
F. Capital share transactions for each class of shares were:
Year Ended August 31,
2017 2016
Amount Shares Amount Shares
($000) (000) ($000) (000)
ETF Shares
Issued 155,430 1,325 72,083 750
Issued in Lieu of Cash Distributions — — — —
Redeemed (83,603) (725) (55,404) (575)
Net Increase (Decrease)—ETF Shares 71,827 600 16,679 175
Institutional Shares
Issued 1,384 6 17,622 82
Issued in Lieu of Cash Distributions 318 1 331 2
Redeemed (25,875) (116) (333) (2)
Net Increase (Decrease)—Institutional Shares (24,173) (109) 17,620 82
G. Management has determined that no material events or transactions occurred subsequent to
August 31, 2017, that would require recognition or disclosure in these financial statements.
50
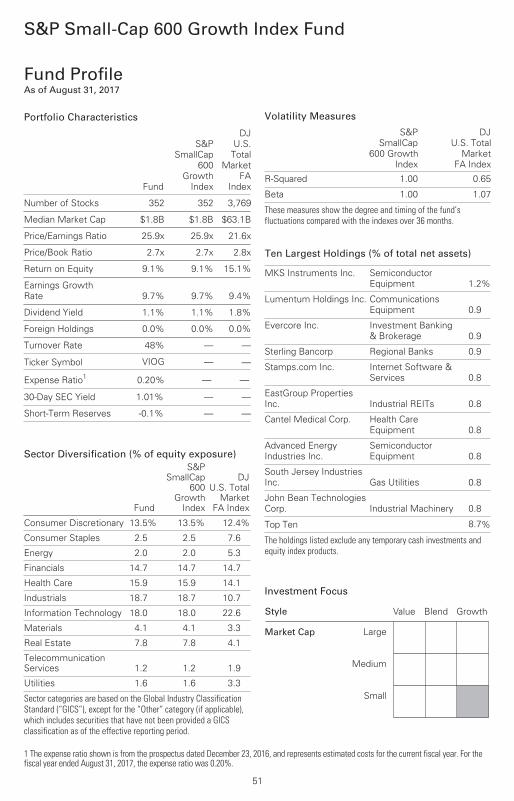
S&P Small-Cap 600 Growth Index Fund
Fund ProfileAs of August 31, 2017
1 The expense ratio shown is from the prospectus dated December 23, 2016, and represents estimated costs for the current fiscal year. For the fiscal year ended August 31, 2017, the expense ratio was 0.20%.
51
Volatility Measures
S&P
SmallCap
600 Growth
Index
DJ
U.S. Total
Market
FA Index
R-Squared 1.00 0.65
Beta 1.00 1.07
These measures show the degree and timing of the fund’s fluctuations compared with the indexes over 36 months.
Portfolio Characteristics
Fund
S&P
SmallCap
600
Growth
Index
DJ
U.S.
Total
Market
FA
Index
Number of Stocks 352 352 3,769
Median Market Cap $1.8B $1.8B $63.1B
Price/Earnings Ratio 25.9x 25.9x 21.6x
Price/Book Ratio 2.7x 2.7x 2.8x
Return on Equity 9.1% 9.1% 15.1%
Earnings Growth
Rate 9.7% 9.7% 9.4%
Dividend Yield 1.1% 1.1% 1.8%
Foreign Holdings 0.0% 0.0% 0.0%
Turnover Rate 48% — —
Ticker Symbol VIOG — —
Expense Ratio1
0.20% — —
30-Day SEC Yield 1.01% — —
Short-Term Reserves -0.1% — —
Sector Diversification (% of equity exposure)
Fund
S&PSmallCap
600Growth
Index
DJU.S. Total
MarketFA Index
Consumer Discretionary 13.5% 13.5% 12.4%
Consumer Staples 2.5 2.5 7.6
Energy 2.0 2.0 5.3
Financials 14.7 14.7 14.7
Health Care 15.9 15.9 14.1
Industrials 18.7 18.7 10.7
Information Technology 18.0 18.0 22.6
Materials 4.1 4.1 3.3
Real Estate 7.8 7.8 4.1
TelecommunicationServices 1.2 1.2 1.9
Utilities 1.6 1.6 3.3
Sector categories are based on the Global Industry ClassificationStandard (“GICS”), except for the “Other” category (if applicable),which includes securities that have not been provided a GICSclassification as of the effective reporting period.
Ten Largest Holdings (% of total net assets)
MKS Instruments Inc. Semiconductor
Equipment 1.2%
Lumentum Holdings Inc. Communications
Equipment 0.9
Evercore Inc. Investment Banking
& Brokerage 0.9
Sterling Bancorp Regional Banks 0.9
Stamps.com Inc. Internet Software &
Services 0.8
EastGroup Properties
Inc. Industrial REITs 0.8
Cantel Medical Corp. Health Care
Equipment 0.8
Advanced Energy
Industries Inc.
Semiconductor
Equipment 0.8
South Jersey Industries
Inc. Gas Utilities 0.8
John Bean Technologies
Corp. Industrial Machinery 0.8
Top Ten 8.7%
The holdings listed exclude any temporary cash investments andequity index products.
Investment Focus
Market Cap
Value
Large
Medium
Small
Blend Growth Style
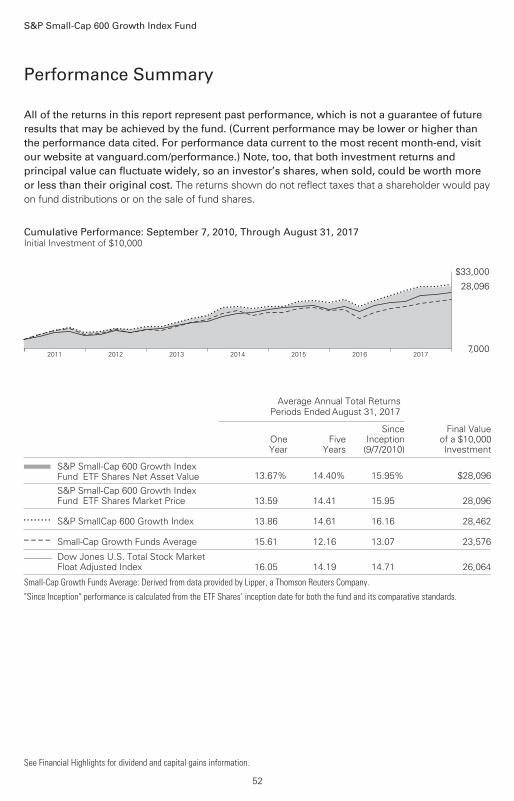
All of the returns in this report represent past performance, which is not a guarantee of future results that may be achieved by the fund. (Current performance may be lower or higher thanthe performance data cited. For performance data current to the most recent month-end, visitour website at vanguard.com/performance.) Note, too, that both investment returns and principal value can fluctuate widely, so an investor’s shares, when sold, could be worth more or less than their original cost. The returns shown do not reflect taxes that a shareholder would pay
on fund distributions or on the sale of fund shares.
Performance Summary
S&P Small-Cap 600 Growth Index Fund
See Financial Highlights for dividend and capital gains information.
52
Cumulative Performance: September 7, 2010, Through August 31, 2017Initial Investment of $10,000
2017201620152014201320122011
$33,000
7,000
28,096
Average Annual Total Returns
Periods Ended August 31, 2017
OneYear
FiveYears
SinceInception
(9/7/2010)
Final Valueof a $10,000Investment
S&P Small-Cap 600 Growth IndexFund*ETF Shares Net Asset Value 13.67% 14.40% 15.95% $28,096
S&P Small-Cap 600 Growth IndexFund*ETF Shares Market Price 13.59 14.41 15.95 28,096
• • • • • • • • S&P SmallCap 600 Growth Index 13.86 14.61 16.16 28,462
– – – – Small-Cap Growth Funds Average 15.61 12.16 13.07 23,576________ Dow Jones U.S. Total Stock Market
Float Adjusted Index 16.05 14.19 14.71 26,064
Small-Cap Growth Funds Average: Derived from data provided by Lipper, a Thomson Reuters Company."Since Inception" performance is calculated from the ETF Shares’ inception date for both the fund and its comparative standards.
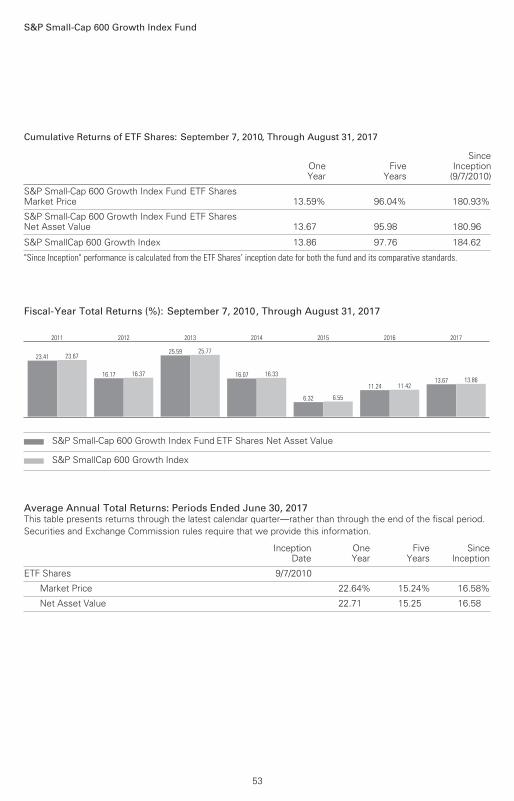
S&P Small-Cap 600 Growth Index Fund
53
Cumulative Returns of ETF Shares: September 7, 2010, Through August 31, 2017
OneYear
FiveYears
SinceInception
(9/7/2010)
S&P Small-Cap 600 Growth Index Fund ETF SharesMarket Price 13.59% 96.04% 180.93%
S&P Small-Cap 600 Growth Index Fund ETF SharesNet Asset Value 13.67 95.98 180.96
S&P SmallCap 600 Growth Index 13.86 97.76 184.62
"Since Inception" performance is calculated from the ETF Shares’ inception date for both the fund and its comparative standards.
Fiscal-Year Total Returns (%): September 7, 2010, Through August 31, 2017
23.41 23.67
2011
16.17 16.37
2012
25.59 25.77
2013
16.07 16.33
2014
6.32 6.55
2015
11.24 11.42
2016
13.67 13.86
2017
S&P Small-Cap 600 Growth Index Fund ETF Shares Net Asset Value
S&P SmallCap 600 Growth Index
Average Annual Total Returns: Periods Ended June 30, 2017This table presents returns through the latest calendar quarter—rather than through the end of the fiscal period.Securities and Exchange Commission rules require that we provide this information.
InceptionDate
OneYear
FiveYears
SinceInception
ETF Shares 9/7/2010
Market Price 22.64% 15.24% 16.58%
Net Asset Value 22.71 15.25 16.58
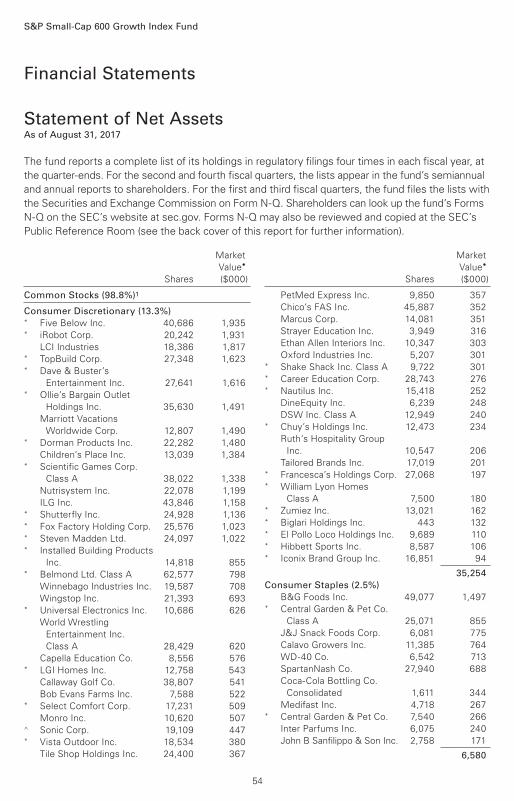
Market
Value•
Shares ($000)
Market
Value•
Shares ($000)
Common Stocks (98.8%)1
Consumer Discretionary (13.3%) * Five Below Inc. 40,686 1,935* iRobot Corp. 20,242 1,931
LCI Industries 18,386 1,817* TopBuild Corp. 27,348 1,623* Dave & Buster’s
Entertainment Inc. 27,641 1,616* Ollie’s Bargain Outlet
Holdings Inc. 35,630 1,491
Marriott Vacations
Worldwide Corp. 12,807 1,490* Dorman Products Inc. 22,282 1,480
Children’s Place Inc. 13,039 1,384* Scientific Games Corp.
Class A 38,022 1,338
Nutrisystem Inc. 22,078 1,199
ILG Inc. 43,846 1,158* Shutterfly Inc. 24,928 1,136* Fox Factory Holding Corp. 25,576 1,023* Steven Madden Ltd. 24,097 1,022* Installed Building Products
Inc. 14,818 855* Belmond Ltd. Class A 62,577 798
Winnebago Industries Inc. 19,587 708
Wingstop Inc. 21,393 693* Universal Electronics Inc. 10,686 626
World Wrestling
Entertainment Inc.
Class A 28,429 620
Capella Education Co. 8,556 576* LGI Homes Inc. 12,758 543
Callaway Golf Co. 38,807 541
Bob Evans Farms Inc. 7,588 522* Select Comfort Corp. 17,231 509
Monro Inc. 10,620 507^ Sonic Corp. 19,109 447* Vista Outdoor Inc. 18,534 380
Tile Shop Holdings Inc. 24,400 367
PetMed Express Inc. 9,850 357
Chico’s FAS Inc. 45,887 352
Marcus Corp. 14,081 351
Strayer Education Inc. 3,949 316
Ethan Allen Interiors Inc. 10,347 303
Oxford Industries Inc. 5,207 301* Shake Shack Inc. Class A 9,722 301* Career Education Corp. 28,743 276* Nautilus Inc. 15,418 252
DineEquity Inc. 6,239 248
DSW Inc. Class A 12,949 240* Chuy’s Holdings Inc. 12,473 234
Ruth’s Hospitality Group
Inc. 10,547 206
Tailored Brands Inc. 17,019 201* Francesca’s Holdings Corp. 27,068 197* William Lyon Homes
Class A 7,500 180* Zumiez Inc. 13,021 162* Biglari Holdings Inc. 443 132* El Pollo Loco Holdings Inc. 9,689 110* Hibbett Sports Inc. 8,587 106* Iconix Brand Group Inc. 16,851 94
35,254
Consumer Staples (2.5%)
B&G Foods Inc. 49,077 1,497* Central Garden & Pet Co.
Class A 25,071 855
J&J Snack Foods Corp. 6,081 775
Calavo Growers Inc. 11,385 764
WD-40 Co. 6,542 713
SpartanNash Co. 27,940 688
Coca-Cola Bottling Co.
Consolidated 1,611 344
Medifast Inc. 4,718 267* Central Garden & Pet Co. 7,540 266
Inter Parfums Inc. 6,075 240
John B Sanfilippo & Son Inc. 2,758 171
6,580
Financial Statements
Statement of Net AssetsAs of August 31, 2017
The fund reports a complete list of its holdings in regulatory filings four times in each fiscal year, at
the quarter-ends. For the second and fourth fiscal quarters, the lists appear in the fund’s semiannual
and annual reports to shareholders. For the first and third fiscal quarters, the fund files the lists with
the Securities and Exchange Commission on Form N-Q. Shareholders can look up the fund’s Forms
N-Q on the SEC’s website at sec.gov. Forms N-Q may also be reviewed and copied at the SEC’s
Public Reference Room (see the back cover of this report for further information).
S&P Small-Cap 600 Growth Index Fund
54
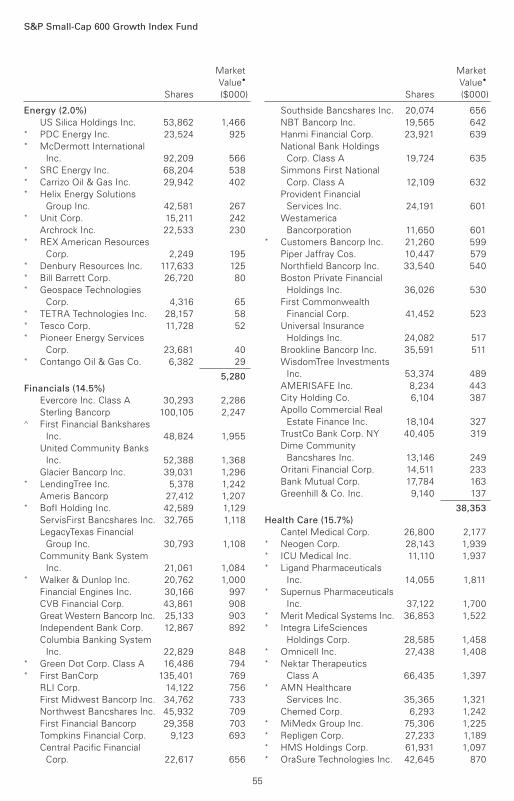
S&P Small-Cap 600 Growth Index Fund
Market
Value•
Shares ($000)
Market
Value•
Shares ($000)
Energy (2.0%)
US Silica Holdings Inc. 53,862 1,466* PDC Energy Inc. 23,524 925* McDermott International
Inc. 92,209 566* SRC Energy Inc. 68,204 538* Carrizo Oil & Gas Inc. 29,942 402* Helix Energy Solutions
Group Inc. 42,581 267* Unit Corp. 15,211 242
Archrock Inc. 22,533 230* REX American Resources
Corp. 2,249 195* Denbury Resources Inc. 117,633 125* Bill Barrett Corp. 26,720 80* Geospace Technologies
Corp. 4,316 65* TETRA Technologies Inc. 28,157 58* Tesco Corp. 11,728 52* Pioneer Energy Services
Corp. 23,681 40* Contango Oil & Gas Co. 6,382 29
5,280
Financials (14.5%)
Evercore Inc. Class A 30,293 2,286
Sterling Bancorp 100,105 2,247^ First Financial Bankshares
Inc. 48,824 1,955
United Community Banks
Inc. 52,388 1,368
Glacier Bancorp Inc. 39,031 1,296* LendingTree Inc. 5,378 1,242
Ameris Bancorp 27,412 1,207* BofI Holding Inc. 42,589 1,129
ServisFirst Bancshares Inc. 32,765 1,118
LegacyTexas Financial
Group Inc. 30,793 1,108
Community Bank System
Inc. 21,061 1,084* Walker & Dunlop Inc. 20,762 1,000
Financial Engines Inc. 30,166 997
CVB Financial Corp. 43,861 908
Great Western Bancorp Inc. 25,133 903
Independent Bank Corp. 12,867 892
Columbia Banking System
Inc. 22,829 848* Green Dot Corp. Class A 16,486 794* First BanCorp 135,401 769
RLI Corp. 14,122 756
First Midwest Bancorp Inc. 34,762 733
Northwest Bancshares Inc. 45,932 709
First Financial Bancorp 29,358 703
Tompkins Financial Corp. 9,123 693
Central Pacific Financial
Corp. 22,617 656
Southside Bancshares Inc. 20,074 656
NBT Bancorp Inc. 19,565 642
Hanmi Financial Corp. 23,921 639
National Bank Holdings
Corp. Class A 19,724 635
Simmons First National
Corp. Class A 12,109 632
Provident Financial
Services Inc. 24,191 601
Westamerica
Bancorporation 11,650 601* Customers Bancorp Inc. 21,260 599
Piper Jaffray Cos. 10,447 579
Northfield Bancorp Inc. 33,540 540
Boston Private Financial
Holdings Inc. 36,026 530
First Commonwealth
Financial Corp. 41,452 523
Universal Insurance
Holdings Inc. 24,082 517
Brookline Bancorp Inc. 35,591 511
WisdomTree Investments
Inc. 53,374 489
AMERISAFE Inc. 8,234 443
City Holding Co. 6,104 387
Apollo Commercial Real
Estate Finance Inc. 18,104 327
TrustCo Bank Corp. NY 40,405 319
Dime Community
Bancshares Inc. 13,146 249
Oritani Financial Corp. 14,511 233
Bank Mutual Corp. 17,784 163
Greenhill & Co. Inc. 9,140 137
38,353
Health Care (15.7%)
Cantel Medical Corp. 26,800 2,177* Neogen Corp. 28,143 1,939* ICU Medical Inc. 11,110 1,937* Ligand Pharmaceuticals
Inc. 14,055 1,811* Supernus Pharmaceuticals
Inc. 37,122 1,700* Merit Medical Systems Inc. 36,853 1,522* Integra LifeSciences
Holdings Corp. 28,585 1,458* Omnicell Inc. 27,438 1,408* Nektar Therapeutics
Class A 66,435 1,397* AMN Healthcare
Services Inc. 35,365 1,321
Chemed Corp. 6,293 1,242* MiMedx Group Inc. 75,306 1,225* Repligen Corp. 27,233 1,189* HMS Holdings Corp. 61,931 1,097* OraSure Technologies Inc. 42,645 870
55
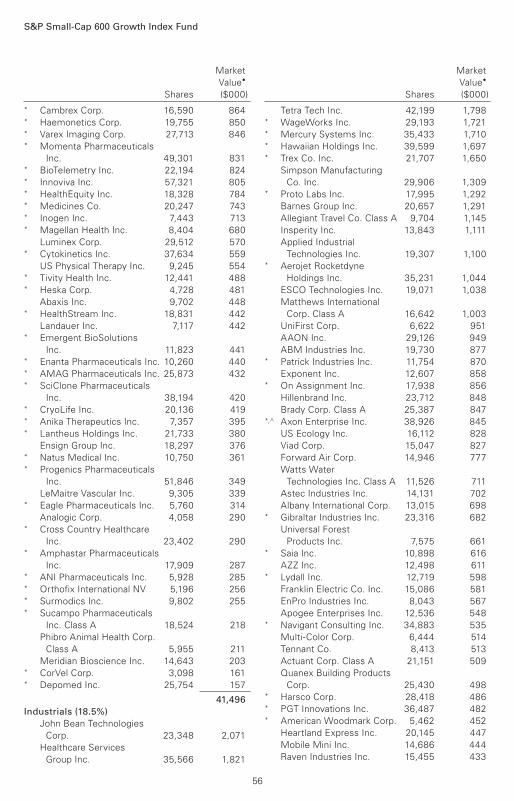
S&P Small-Cap 600 Growth Index Fund
Market
Value•
Shares ($000)
Market
Value•
Shares ($000)
* Cambrex Corp. 16,590 864* Haemonetics Corp. 19,755 850* Varex Imaging Corp. 27,713 846* Momenta Pharmaceuticals
Inc. 49,301 831* BioTelemetry Inc. 22,194 824* Innoviva Inc. 57,321 805* HealthEquity Inc. 18,328 784* Medicines Co. 20,247 743* Inogen Inc. 7,443 713* Magellan Health Inc. 8,404 680
Luminex Corp. 29,512 570* Cytokinetics Inc. 37,634 559
US Physical Therapy Inc. 9,245 554* Tivity Health Inc. 12,441 488* Heska Corp. 4,728 481
Abaxis Inc. 9,702 448* HealthStream Inc. 18,831 442
Landauer Inc. 7,117 442* Emergent BioSolutions
Inc. 11,823 441* Enanta Pharmaceuticals Inc. 10,260 440* AMAG Pharmaceuticals Inc. 25,873 432* SciClone Pharmaceuticals
Inc. 38,194 420* CryoLife Inc. 20,136 419* Anika Therapeutics Inc. 7,357 395* Lantheus Holdings Inc. 21,733 380
Ensign Group Inc. 18,297 376* Natus Medical Inc. 10,750 361* Progenics Pharmaceuticals
Inc. 51,846 349
LeMaitre Vascular Inc. 9,305 339* Eagle Pharmaceuticals Inc. 5,760 314
Analogic Corp. 4,058 290* Cross Country Healthcare
Inc. 23,402 290* Amphastar Pharmaceuticals
Inc. 17,909 287* ANI Pharmaceuticals Inc. 5,928 285* Orthofix International NV 5,196 256* Surmodics Inc. 9,802 255* Sucampo Pharmaceuticals
Inc. Class A 18,524 218
Phibro Animal Health Corp.
Class A 5,955 211
Meridian Bioscience Inc. 14,643 203* CorVel Corp. 3,098 161* Depomed Inc. 25,754 157
41,496
Industrials (18.5%)
John Bean Technologies
Corp. 23,348 2,071
Healthcare Services
Group Inc. 35,566 1,821
Tetra Tech Inc. 42,199 1,798* WageWorks Inc. 29,193 1,721* Mercury Systems Inc. 35,433 1,710* Hawaiian Holdings Inc. 39,599 1,697* Trex Co. Inc. 21,707 1,650
Simpson Manufacturing
Co. Inc. 29,906 1,309* Proto Labs Inc. 17,995 1,292
Barnes Group Inc. 20,657 1,291
Allegiant Travel Co. Class A 9,704 1,145
Insperity Inc. 13,843 1,111
Applied Industrial
Technologies Inc. 19,307 1,100* Aerojet Rocketdyne
Holdings Inc. 35,231 1,044
ESCO Technologies Inc. 19,071 1,038
Matthews International
Corp. Class A 16,642 1,003
UniFirst Corp. 6,622 951
AAON Inc. 29,126 949
ABM Industries Inc. 19,730 877* Patrick Industries Inc. 11,754 870
Exponent Inc. 12,607 858* On Assignment Inc. 17,938 856
Hillenbrand Inc. 23,712 848
Brady Corp. Class A 25,387 847*,^ Axon Enterprise Inc. 38,926 845
US Ecology Inc. 16,112 828
Viad Corp. 15,047 827
Forward Air Corp. 14,946 777
Watts Water
Technologies Inc. Class A 11,526 711
Astec Industries Inc. 14,131 702
Albany International Corp. 13,015 698* Gibraltar Industries Inc. 23,316 682
Universal Forest
Products Inc. 7,575 661* Saia Inc. 10,898 616
AZZ Inc. 12,498 611* Lydall Inc. 12,719 598
Franklin Electric Co. Inc. 15,086 581
EnPro Industries Inc. 8,043 567
Apogee Enterprises Inc. 12,536 548* Navigant Consulting Inc. 34,883 535
Multi-Color Corp. 6,444 514
Tennant Co. 8,413 513
Actuant Corp. Class A 21,151 509
Quanex Building Products
Corp. 25,430 498* Harsco Corp. 28,418 486* PGT Innovations Inc. 36,487 482* American Woodmark Corp. 5,462 452
Heartland Express Inc. 20,145 447
Mobile Mini Inc. 14,686 444
Raven Industries Inc. 15,455 433
56
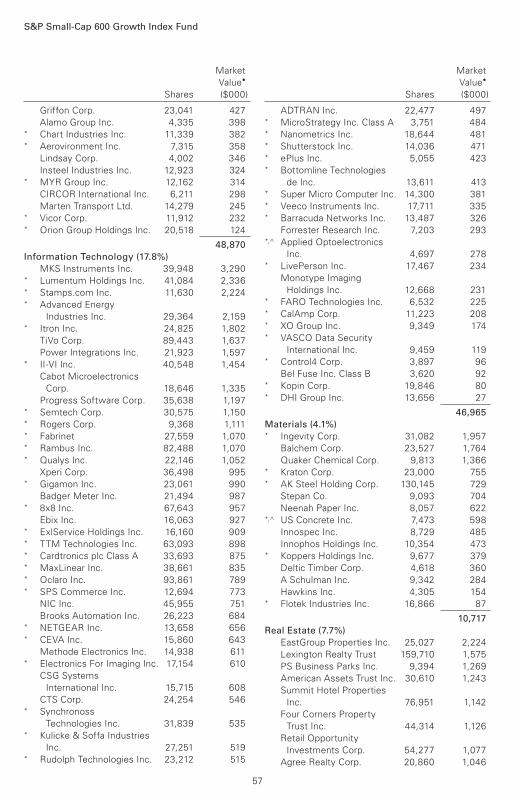
S&P Small-Cap 600 Growth Index Fund
Market
Value•
Shares ($000)
Market
Value•
Shares ($000)
Griffon Corp. 23,041 427
Alamo Group Inc. 4,335 398* Chart Industries Inc. 11,339 382* Aerovironment Inc. 7,315 358
Lindsay Corp. 4,002 346
Insteel Industries Inc. 12,923 324* MYR Group Inc. 12,162 314
CIRCOR International Inc. 6,211 298
Marten Transport Ltd. 14,279 245* Vicor Corp. 11,912 232* Orion Group Holdings Inc. 20,518 124
48,870
Information Technology (17.8%)
MKS Instruments Inc. 39,948 3,290* Lumentum Holdings Inc. 41,084 2,336* Stamps.com Inc. 11,630 2,224* Advanced Energy
Industries Inc. 29,364 2,159* Itron Inc. 24,825 1,802
TiVo Corp. 89,443 1,637
Power Integrations Inc. 21,923 1,597* II-VI Inc. 40,548 1,454
Cabot Microelectronics
Corp. 18,646 1,335
Progress Software Corp. 35,638 1,197* Semtech Corp. 30,575 1,150* Rogers Corp. 9,368 1,111* Fabrinet 27,559 1,070* Rambus Inc. 82,488 1,070* Qualys Inc. 22,146 1,052
Xperi Corp. 36,498 995* Gigamon Inc. 23,061 990
Badger Meter Inc. 21,494 987* 8x8 Inc. 67,643 957
Ebix Inc. 16,063 927* ExlService Holdings Inc. 16,160 909* TTM Technologies Inc. 63,093 898* Cardtronics plc Class A 33,693 875* MaxLinear Inc. 38,661 835* Oclaro Inc. 93,861 789* SPS Commerce Inc. 12,694 773
NIC Inc. 45,955 751
Brooks Automation Inc. 26,223 684* NETGEAR Inc. 13,658 656* CEVA Inc. 15,860 643
Methode Electronics Inc. 14,938 611* Electronics For Imaging Inc. 17,154 610
CSG Systems
International Inc. 15,715 608
CTS Corp. 24,254 546* Synchronoss
Technologies Inc. 31,839 535* Kulicke & Soffa Industries
Inc. 27,251 519* Rudolph Technologies Inc. 23,212 515
ADTRAN Inc. 22,477 497* MicroStrategy Inc. Class A 3,751 484* Nanometrics Inc. 18,644 481* Shutterstock Inc. 14,036 471* ePlus Inc. 5,055 423* Bottomline Technologies
de Inc. 13,611 413* Super Micro Computer Inc. 14,300 381* Veeco Instruments Inc. 17,711 335* Barracuda Networks Inc. 13,487 326
Forrester Research Inc. 7,203 293*,^ Applied Optoelectronics
Inc. 4,697 278* LivePerson Inc. 17,467 234
Monotype Imaging
Holdings Inc. 12,668 231* FARO Technologies Inc. 6,532 225* CalAmp Corp. 11,223 208* XO Group Inc. 9,349 174* VASCO Data Security
International Inc. 9,459 119* Control4 Corp. 3,897 96
Bel Fuse Inc. Class B 3,620 92* Kopin Corp. 19,846 80* DHI Group Inc. 13,656 27
46,965
Materials (4.1%) * Ingevity Corp. 31,082 1,957
Balchem Corp. 23,527 1,764
Quaker Chemical Corp. 9,813 1,366* Kraton Corp. 23,000 755* AK Steel Holding Corp. 130,145 729
Stepan Co. 9,093 704
Neenah Paper Inc. 8,057 622*,^ US Concrete Inc. 7,473 598
Innospec Inc. 8,729 485
Innophos Holdings Inc. 10,354 473* Koppers Holdings Inc. 9,677 379
Deltic Timber Corp. 4,618 360
A Schulman Inc. 9,342 284
Hawkins Inc. 4,305 154* Flotek Industries Inc. 16,866 87
10,717
Real Estate (7.7%)
EastGroup Properties Inc. 25,027 2,224
Lexington Realty Trust 159,710 1,575
PS Business Parks Inc. 9,394 1,269
American Assets Trust Inc. 30,610 1,243
Summit Hotel Properties
Inc. 76,951 1,142
Four Corners Property
Trust Inc. 44,314 1,126
Retail Opportunity
Investments Corp. 54,277 1,077
Agree Realty Corp. 20,860 1,046
57
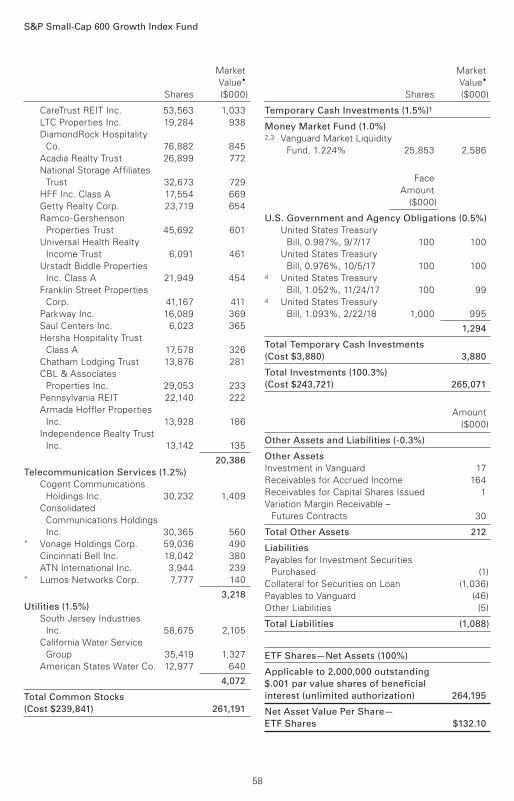
S&P Small-Cap 600 Growth Index Fund
Market
Value•
Shares ($000)
Market
Value•
Shares ($000)
CareTrust REIT Inc. 53,563 1,033
LTC Properties Inc. 19,284 938
DiamondRock Hospitality
Co. 76,882 845
Acadia Realty Trust 26,899 772
National Storage Affiliates
Trust 32,673 729
HFF Inc. Class A 17,554 669
Getty Realty Corp. 23,719 654
Ramco-Gershenson
Properties Trust 45,692 601
Universal Health Realty
Income Trust 6,091 461
Urstadt Biddle Properties
Inc. Class A 21,949 454
Franklin Street Properties
Corp. 41,167 411
Parkway Inc. 16,089 369
Saul Centers Inc. 6,023 365
Hersha Hospitality Trust
Class A 17,578 326
Chatham Lodging Trust 13,876 281
CBL & Associates
Properties Inc. 29,053 233
Pennsylvania REIT 22,140 222
Armada Hoffler Properties
Inc. 13,928 186
Independence Realty Trust
Inc. 13,142 135
20,386
Telecommunication Services (1.2%)
Cogent Communications
Holdings Inc. 30,232 1,409
Consolidated
Communications Holdings
Inc. 30,365 560* Vonage Holdings Corp. 59,036 490
Cincinnati Bell Inc. 18,042 380
ATN International Inc. 3,944 239* Lumos Networks Corp. 7,777 140
3,218
Utilities (1.5%)
South Jersey Industries
Inc. 58,675 2,105
California Water Service
Group 35,419 1,327
American States Water Co. 12,977 640
4,072
Total Common Stocks
(Cost $239,841) 261,191
Temporary Cash Investments (1.5%)1
Money Market Fund (1.0%)2,3 Vanguard Market Liquidity
Fund, 1.224% 25,853 2,586
Face
Amount
($000)
U.S. Government and Agency Obligations (0.5%)
United States Treasury
Bill, 0.987%, 9/7/17 100 100
United States Treasury
Bill, 0.976%, 10/5/17 100 1004 United States Treasury
Bill, 1.052%, 11/24/17 100 994 United States Treasury
Bill, 1.093%, 2/22/18 1,000 995
1,294
Total Temporary Cash Investments
(Cost $3,880) 3,880
Total Investments (100.3%)
(Cost $243,721) 265,071
Amount
($000)
Other Assets and Liabilities (-0.3%)
Other Assets
Investment in Vanguard 17
Receivables for Accrued Income 164
Receivables for Capital Shares Issued 1
Variation Margin Receivable –
Futures Contracts 30
Total Other Assets 212
Liabilities
Payables for Investment Securities
Purchased (1)
Collateral for Securities on Loan (1,036)
Payables to Vanguard (46)
Other Liabilities (5)
Total Liabilities (1,088)
ETF Shares—Net Assets (100%)
Applicable to 2,000,000 outstanding
$.001 par value shares of beneficial
interest (unlimited authorization) 264,195
Net Asset Value Per Share—
ETF Shares $132.10
58
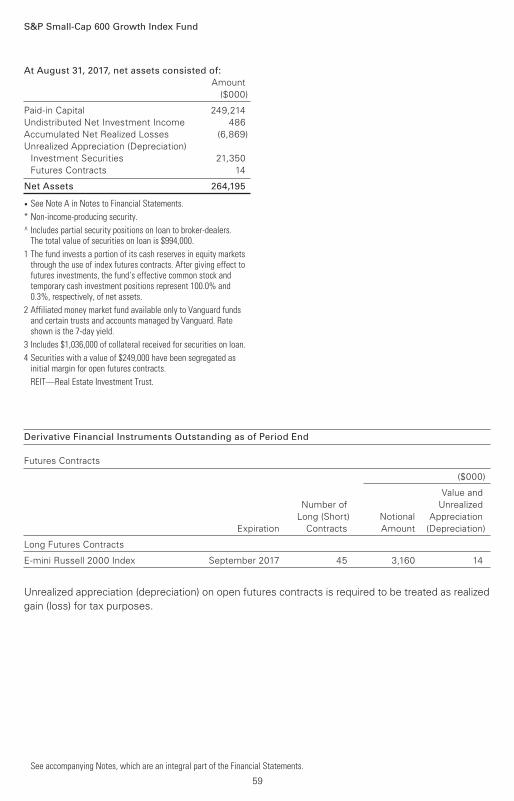
S&P Small-Cap 600 Growth Index Fund
At August 31, 2017, net assets consisted of:
Amount
($000)
Paid-in Capital 249,214
Undistributed Net Investment Income 486
Accumulated Net Realized Losses (6,869)
Unrealized Appreciation (Depreciation)
Investment Securities 21,350
Futures Contracts 14
Net Assets 264,195
• See Note A in Notes to Financial Statements.
* Non-income-producing security.
^ Includes partial security positions on loan to broker-dealers. The total value of securities on loan is $994,000.
1 The fund invests a portion of its cash reserves in equity markets through the use of index futures contracts. After giving effect to futures investments, the fund’s effective common stock and temporary cash investment positions represent 100.0% and 0.3%, respectively, of net assets.
2 Affiliated money market fund available only to Vanguard funds and certain trusts and accounts managed by Vanguard. Rate shown is the 7-day yield.
3 Includes $1,036,000 of collateral received for securities on loan.
4 Securities with a value of $249,000 have been segregated as initial margin for open futures contracts.
REIT—Real Estate Investment Trust.
Derivative Financial Instruments Outstanding as of Period End
Futures Contracts
($000)
Value and
Number of Unrealized
Long (Short) Notional Appreciation
Expiration Contracts Amount (Depreciation)
Long Futures Contracts
E-mini Russell 2000 Index September 2017 45 3,160 14
Unrealized appreciation (depreciation) on open futures contracts is required to be treated as realized
gain (loss) for tax purposes.
See accompanying Notes, which are an integral part of the Financial Statements.
59

Year Ended
August 31, 2017
($000)
Investment Income
Income
Dividends 2,385
Interest1 10
Securities Lending—Net 34
Total Income 2,429
Expenses
The Vanguard Group—Note B
Investment Advisory Services 46
Management and Administrative 221
Marketing and Distribution 14
Custodian Fees 84
Auditing Fees 32
Shareholders’ Reports and Proxy 25
Total Expenses 422
Net Investment Income 2,007
Realized Net Gain (Loss)
Investment Securities Sold1 9,929
Futures Contracts 76
Realized Net Gain (Loss) 10,005
Change in Unrealized Appreciation (Depreciation)
Investment Securities 10,935
Futures Contracts 14
Change in Unrealized Appreciation (Depreciation) 10,949
Net Increase (Decrease) in Net Assets Resulting from Operations 22,961
1 Interest income and realized net gain (loss) from an affiliated company of the fund were $8,000 and $0, respectively.
Statement of Operations
S&P Small-Cap 600 Growth Index Fund
See accompanying Notes, which are an integral part of the Financial Statements.
60
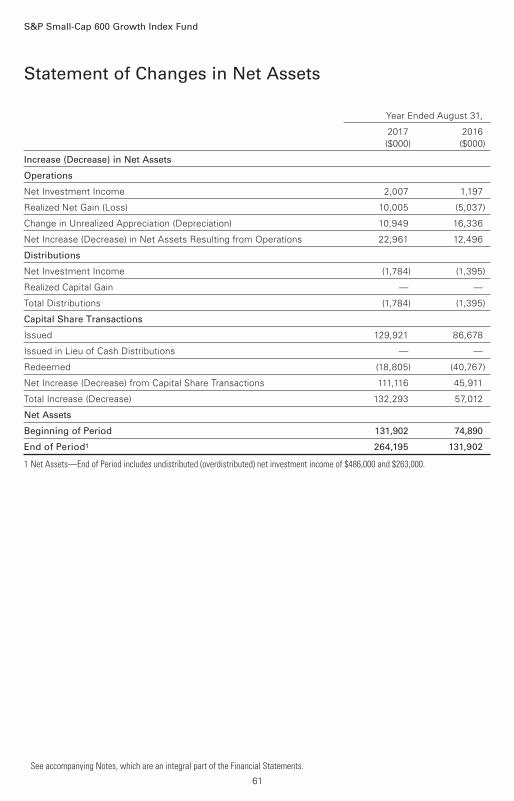
Statement of Changes in Net Assets
S&P Small-Cap 600 Growth Index Fund
See accompanying Notes, which are an integral part of the Financial Statements.
Year Ended August 31,
2017 2016
($000) ($000)
Increase (Decrease) in Net Assets
Operations
Net Investment Income 2,007 1,197
Realized Net Gain (Loss) 10,005 (5,037)
Change in Unrealized Appreciation (Depreciation) 10,949 16,336
Net Increase (Decrease) in Net Assets Resulting from Operations 22,961 12,496
Distributions
Net Investment Income (1,784) (1,395)
Realized Capital Gain — —
Total Distributions (1,784) (1,395)
Capital Share Transactions
Issued 129,921 86,678
Issued in Lieu of Cash Distributions — —
Redeemed (18,805) (40,767)
Net Increase (Decrease) from Capital Share Transactions 111,116 45,911
Total Increase (Decrease) 132,293 57,012
Net Assets
Beginning of Period 131,902 74,890
End of Period1 264,195 131,902
1 Net Assets—End of Period includes undistributed (overdistributed) net investment income of $486,000 and $263,000.
61

ETF Shares
For a Share Outstanding Year Ended August 31,
Throughout Each Period 2017 2016 2015 2014 2013
Net Asset Value, Beginning of Period $117.25 $106.99 $101.36 $87.79 $70.70
Investment Operations
Net Investment Income 1.2221 1.180 1.043 .6681 .822
Net Realized and Unrealized Gain (Loss)
on Investments 14.762 10.685 5.345 13.432 17.083
Total from Investment Operations 15.984 11.865 6.388 14.100 17.905
Distributions
Dividends from Net Investment Income (1.134) (1.605) (.758) (.530) (.815)
Distributions from Realized Capital Gains — — — — —
Total Distributions (1.134) (1.605) (.758) (.530) (.815)
Net Asset Value, End of Period $132.10 $117.25 $106.99 $101.36 $87.79
Total Return 13.67% 11.24% 6.32% 16.07% 25.59%
Ratios/Supplemental Data
Net Assets, End of Period (Millions) $264 $132 $75 $61 $22
Ratio of Total Expenses to
Average Net Assets 0.20% 0.20% 0.20% 0.20% 0.20%
Ratio of Net Investment Income to
Average Net Assets 0.95% 1.15% 0.98% 0.66% 1.03%
Portfolio Turnover Rate2 48% 48% 63% 44% 39%
1 Calculated based on average shares outstanding.
2 Excludes the value of portfolio securities received or delivered as a result of in-kind purchases or redemptions of the fund’s capital shares, including ETF Creation Units.
Financial Highlights
See accompanying Notes, which are an integral part of the Financial Statements.
S&P Small-Cap 600 Growth Index Fund
62
Notes to Financial Statements
S&P Small-Cap 600 Growth Index Fund
Vanguard S&P Small-Cap 600 Growth Index Fund is registered under the Investment Company
Act of 1940 as an open-end investment company, or mutual fund. The fund offers two classes of
shares: ETF Shares and Institutional Shares. ETF Shares are listed for trading on NYSE Arca; they
can be purchased and sold through a broker. Institutional Shares are designed for investors who
meet certain administrative, service, and account-size criteria. During the year ended August 31,
2017, there were no investors in the Institutional share class.
A. The following significant accounting policies conform to generally accepted accounting
principles for U.S. investment companies. The fund consistently follows such policies in
preparing its financial statements.
1. Security Valuation: Securities are valued as of the close of trading on the New York Stock
Exchange (generally 4 p.m., Eastern time) on the valuation date. Equity securities are valued at the
latest quoted sales prices or official closing prices taken from the primary market in which each
security trades; such securities not traded on the valuation date are valued at the mean of the latest
quoted bid and asked prices. Securities for which market quotations are not readily available, or
whose values have been materially affected by events occurring before the fund’s pricing time but
after the close of the securities’ primary markets, are valued by methods deemed by the board of
trustees to represent fair value. Investments in Vanguard Market Liquidity Fund are valued at that
fund’s net asset value. Temporary cash investments are valued using the latest bid prices or using
valuations based on a matrix system (which considers such factors as security prices, yields,
maturities, and ratings), both as furnished by independent pricing services.
2. Futures Contracts: The fund uses index futures contracts to a limited extent, with the objectives
of maintaining full exposure to the stock market, enhancing returns, maintaining liquidity, and
minimizing transaction costs. The fund may purchase futures contracts to immediately invest
incoming cash in the market, or sell futures in response to cash outflows, thereby simulating a fully
invested position in the underlying index while maintaining a cash balance for liquidity. The fund may
seek to enhance returns by using futures contracts instead of the underlying securities when futures
are believed to be priced more attractively than the underlying securities. The primary risks
associated with the use of futures contracts are imperfect correlation between changes in market
values of stocks held by the fund and the prices of futures contracts, and the possibility of an illiquid
market. Counterparty risk involving futures is mitigated because a regulated clearinghouse is the
counterparty instead of the clearing broker. To further mitigate counterparty risk, the fund trades
futures contracts on an exchange, monitors the financial strength of its clearing brokers and
clearinghouse, and has entered into clearing agreements with its clearing brokers. The clearing-
house imposes initial margin requirements to secure the fund’s performance and requires daily
settlement of variation margin representing changes in the market value of each contract.
Futures contracts are valued at their quoted daily settlement prices. The notional amounts of
the contracts are not recorded in the Statement of Net Assets. Fluctuations in the value of the
contracts are recorded in the Statement of Net Assets as an asset (liability) and in the Statement
of Operations as unrealized appreciation (depreciation) until the contracts are closed, when they
are recorded as realized futures gains (losses).
During the year ended August 31, 2017, the fund’s average investments in long and short futures
contracts represented less than 1% and 0% of net assets, respectively, based on the average of
the notional amounts at each quarter-end during the period.
63
S&P Small-Cap 600 Growth Index Fund
3. Federal Income Taxes: The fund intends to continue to qualify as a regulated investment company
and distribute all of its taxable income. Management has analyzed the fund’s tax positions taken for
all open federal income tax years (August 31, 2014–2017), and has concluded that no provision for
federal income tax is required in the fund’s financial statements.
4. Distributions: Distributions to shareholders are recorded on the ex-dividend date.
5. Securities Lending: To earn additional income, the fund lends its securities to qualified institutional
borrowers. Security loans are subject to termination by the fund at any time, and are required to be
secured at all times by collateral in an amount at least equal to the market value of securities loaned.
Daily market fluctuations could cause the value of loaned securities to be more or less than the value
of the collateral received. When this occurs, the collateral is adjusted and settled on the next
business day. The fund further mitigates its counterparty risk by entering into securities lending
transactions only with a diverse group of prequalified counterparties, monitoring their financial
strength, and entering into master securities lending agreements with its counterparties. The master
securities lending agreements provide that, in the event of a counterparty’s default (including
bankruptcy), the fund may terminate any loans with that borrower, determine the net amount owed,
and sell or retain the collateral up to the net amount owed to the fund; however, such actions may
be subject to legal proceedings. While collateral mitigates counterparty risk, in the event of a default,
the fund may experience delays and costs in recovering the securities loaned. The fund invests cash
collateral received in Vanguard Market Liquidity Fund, and records a liability in the Statement of Net
Assets for the return of the collateral, during the period the securities are on loan. Securities lending
income represents fees charged to borrowers plus income earned on invested cash collateral, less
expenses associated with the loan. During the term of the loan, the fund is entitled to all
distributions made on or in respect of the loaned securities.
6. Credit Facility: The fund and certain other funds managed by The Vanguard Group (“Vanguard”)
participate in a $3.1 billion committed credit facility provided by a syndicate of lenders pursuant to
a credit agreement that may be renewed annually; each fund is individually liable for its borrowings,
if any, under the credit facility. Borrowings may be utilized for temporary and emergency purposes,
and are subject to the fund’s regulatory and contractual borrowing restrictions. The participating
funds are charged administrative fees and an annual commitment fee of 0.10% of the undrawn
amount of the facility; these fees are allocated to the funds based on a method approved by the
fund’s board of trustees and included in Management and Administrative expenses on the fund’s
Statement of Operations. Any borrowings under this facility bear interest at a rate based upon the
higher of the one-month London Interbank Offered Rate, federal funds effective rate, or overnight
bank funding rate plus an agreed-upon spread.
The fund had no borrowings outstanding at August 31, 2017, or at any time during the period
then ended.
7. Other: Dividend income is recorded on the ex-dividend date. Interest income includes income
distributions received from Vanguard Market Liquidity Fund and is accrued daily. Premiums and
discounts on debt securities purchased are amortized and accreted, respectively, to interest
income over the lives of the respective securities. Security transactions are accounted for on
the date securities are bought or sold. Costs used to determine realized gains (losses) on the
sale of investment securities are those of the specific securities sold.
64
S&P Small-Cap 600 Growth Index Fund
B. In accordance with the terms of a Funds’ Service Agreement (the “FSA”) between Vanguard
and the fund, Vanguard furnishes to the fund investment advisory, corporate management,
administrative, marketing, and distribution services at Vanguard’s cost of operations (as defined
by the FSA). These costs of operations are allocated to the fund based on methods and guidelines
approved by the board of trustees. Vanguard does not require reimbursement in the current period
for certain costs of operations (such as deferred compensation/benefits and risk/insurance costs);
the fund’s liability for these costs of operations is included in Payables to Vanguard on the Statement
of Net Assets.
Upon the request of Vanguard, the fund may invest up to 0.40% of its net assets as capital in
Vanguard. At August 31, 2017, the fund had contributed to Vanguard capital in the amount of
$17,000, representing 0.01% of the fund’s net assets and 0.01% of Vanguard’s capitalization.
The fund’s trustees and officers are also directors and employees, respectively, of Vanguard.
C. Various inputs may be used to determine the value of the fund’s investments. These inputs are
summarized in three broad levels for financial statement purposes. The inputs or methodologies
used to value securities are not necessarily an indication of the risk associated with investing in
those securities.
Level 1—Quoted prices in active markets for identical securities.
Level 2—Other significant observable inputs (including quoted prices for similar securities, interest
rates, prepayment speeds, credit risk, etc.).
Level 3—Significant unobservable inputs (including the fund’s own assumptions used to determine
the fair value of investments). Any investments valued with significant unobservable inputs are
noted on the Statement of Net Assets.
The following table summarizes the market value of the fund’s investments as of August 31, 2017,
based on the inputs used to value them:
Level 1 Level 2 Level 3
Investments ($000) ($000) ($000)
Common Stocks 261,191 — —
Temporary Cash Investments 2,586 1,294 —
Futures Contracts—Assets1 30 — —
Total 263,807 1,294 —
1 Represents variation margin on the last day of the reporting period.
D. Distributions are determined on a tax basis and may differ from net investment income and
realized capital gains for financial reporting purposes. Differences may be permanent or temporary.
Permanent differences are reclassified among capital accounts in the financial statements to reflect
their tax character. Temporary differences arise when certain items of income, expense, gain, or
loss are recognized in different periods for financial statement and tax purposes. These differences
will reverse at some time in the future. Differences in classification may also result from the
treatment of short-term gains as ordinary income for tax purposes.
65
S&P Small-Cap 600 Growth Index Fund
During the year ended August 31, 2017, the fund realized $4,524,000 of net capital gains resulting
from in-kind redemptions—in which shareholders exchanged fund shares for securities held by the
fund rather than for cash. Because such gains are not taxable to the fund, and are not distributed to
shareholders, they have been reclassified from accumulated net realized losses to paid-in capital.
For tax purposes, at August 31, 2017, the fund had $520,000 of ordinary income available for
distribution. The fund used capital loss carryforwards of $5,495,000 to offset taxable capital gains
realized during the year ended August 31, 2017. At August 31, 2017, the fund had available capital
losses totaling $6,866,000 that may be carried forward indefinitely to offset future net capital gains.
At August 31, 2017, the cost of investment securities for tax purposes was $243,721,000. Net
unrealized appreciation of investment securities for tax purposes was $21,350,000, consisting
of unrealized gains of $36,234,000 on securities that had risen in value since their purchase and
$14,884,000 in unrealized losses on securities that had fallen in value since their purchase.
E. During the year ended August 31, 2017, the fund purchased $230,461,000 of investment
securities and sold $121,837,000 of investment securities, other than temporary cash investments.
Purchases and sales include $129,844,000 and $12,124,000, respectively, in connection with in-kind
purchases and redemptions of the fund’s capital shares.
The fund purchased securities from and sold securities to other Vanguard funds or accounts
managed by Vanguard or its affiliates, in accordance with procedures adopted by the board of
trustees in compliance with Rule 17a-7 of the Investment Company Act of 1940. For the year
ended August 31, 2017, such purchases and sales were $12,181,000 and $19,435,000,
respectively; these amounts are included in the purchases and sales of investment securities
noted above.
F. Capital shares issued and redeemed were:
Year Ended August 31,
2017 2016
Shares Shares
(000) (000)
Issued 1,025 800
Issued in Lieu of Cash Distributions — —
Redeemed (150) (375)
Net Increase (Decrease) in Shares Outstanding 875 425
G. Management has determined that no material events or transactions occurred subsequent to
August 31, 2017, that would require recognition or disclosure in these financial statements.
66
67
To the Board of Trustees of Vanguard Admiral Funds and the Shareholders of Vanguard S&P
Small-Cap 600 Index Fund, Vanguard S&P Small-Cap 600 Value Index Fund and Vanguard S&P
Small-Cap 600 Growth Index Fund:
In our opinion, the accompanying statements of net assets and the related statements of operations
and of changes in net assets and the financial highlights present fairly, in all material respects, the
financial position of Vanguard S&P Small-Cap 600 Index Fund, Vanguard S&P Small-Cap 600 Value
Index Fund and Vanguard S&P Small-Cap 600 Growth Index Fund (constituting separate portfolios
of Vanguard Admiral Funds, hereafter referred to as the “Funds”) as of August 31, 2017, the results
of each of their operations for the year then ended, the changes in each of their net assets for
each of the two years in the period then ended and the financial highlights for each of the periods
indicated, in conformity with accounting principles generally accepted in the United States of
America. These financial statements and financial highlights (hereafter referred to as “financial
statements”) are the responsibility of the Funds’ management. Our responsibility is to express
an opinion on these financial statements based on our audits. We conducted our audits of these
financial statements in accordance with the standards of the Public Company Accounting Oversight
Board (United States). Those standards require that we plan and perform the audit to obtain
reasonable assurance about whether the financial statements are free of material misstatement.
An audit includes examining, on a test basis, evidence supporting the amounts and disclosures in
the financial statements, assessing the accounting principles used and significant estimates made
by management, and evaluating the overall financial statement presentation. We believe that our
audits, which included confirmation of securities as of August 31, 2017 by correspondence with the
custodian and brokers and by agreement to the underlying ownership records of the transfer agent,
provide a reasonable basis for our opinion.
/s/PricewaterhouseCoopers LLP
Philadelphia, Pennsylvania
October 17, 2017
Report of Independent Registered Public Accounting Firm
Special 2017 tax information (unaudited) for Vanguard S&P Small-Cap 600 Index Funds
This information for the fiscal year ended August 31, 2017, is included pursuant to provisions of the
Internal Revenue Code.
The funds distributed qualified dividend income to shareholders during the fiscal year as follows:
Fund ($000)
S&P Small-Cap 600 Index Fund 7,078
S&P Small-Cap 600 Value Index Fund 2,634
S&P Small-Cap 600 Growth Index Fund 1,541
For corporate shareholders, the percentage of investment income (dividend income plus short-term
gains, if any) that qualifies for the dividends-received deduction is as follows:
Fund Percentage
S&P Small-Cap 600 Index Fund 85.1%
S&P Small-Cap 600 Value Index Fund 92.8
S&P Small-Cap 600 Growth Index Fund 88.5
68
Your Fund’s After-Tax Returns
69
This table presents returns for your fund both before and after taxes. The after-tax returns are
shown in two ways: (1) assuming that an investor owned the fund during the entire period and
paid taxes on the fund’s distributions, and (2) assuming that an investor paid taxes on the fund’s
distributions and sold all shares at the end of each period.
Calculations are based on the highest individual federal income tax and capital gains tax rates in
effect at the times of the distributions and the hypothetical sales. State and local taxes were not
considered. After-tax returns reflect any qualified dividend income, using actual prior-year figures
and estimates for 2017. (In the example, returns after the sale of fund shares may be higher than
those assuming no sale. This occurs when the sale would have produced a capital loss. The
calculation assumes that the investor received a tax deduction for the loss.)
The table shows returns for ETF Shares only; returns for other share classes will differ. Please
note that your actual after-tax returns will depend on your tax situation and may differ from those
shown. Also note that if you own the fund in a tax-deferred account, such as an individual
retirement account or a 401(k) plan, this information does not apply to you. Such accounts are not
subject to current taxes.
Finally, keep in mind that a fund’s performance—whether before or after taxes—does not
guarantee future results.
Average Annual Total Returns: S&P Small Cap 600 Index FundsPeriods Ended August 31, 2017
One
Year
Five
Years
Since
Inception
(9/7/2010)
S&P Small-Cap 600 Index Fund ETF Shares
Returns Before Taxes 13.18% 14.33% 15.33%
Returns After Taxes on Distributions 12.89 14.01 15.06
Returns After Taxes on Distributions and Sale of
Fund Shares 7.63 11.46 12.60
One
Year
Five
Years
Since
Inception
(9/7/2010)
S&P Small-Cap 600 Value Index Fund ETF Shares
Returns Before Taxes 12.11% 13.98% 14.57%
Returns After Taxes on Distributions 11.70 13.61 14.25
Returns After Taxes on Distributions and Sale of
Fund Shares 7.13 11.17 11.94
One
Year
Five
Years
Since
Inception
(9/7/2010)
S&P Small-Cap 600 Growth Index Fund ETF Shares
Returns Before Taxes 13.67% 14.40% 15.95%
Returns After Taxes on Distributions 13.40 14.14 15.73
Returns After Taxes on Distributions and Sale of
Fund Shares 7.90 11.54 13.16
About Your Fund’s Expenses
70
As a shareholder of the fund, you incur ongoing costs, which include costs for portfolio management,
administrative services, and shareholder reports (like this one), among others. Operating expenses,
which are deducted from a fund’s gross income, directly reduce the investment return of the fund.
A fund’s expenses are expressed as a percentage of its average net assets. This figure is known as
the expense ratio. The following examples are intended to help you understand the ongoing costs (in
dollars) of investing in your fund and to compare these costs with those of other mutual funds. The
examples are based on an investment of $1,000 made at the beginning of the period shown and held
for the entire period.
The accompanying table illustrates your fund’s costs in two ways:
• Based on actual fund return. This section helps you to estimate the actual expenses that you
paid over the period. The ”Ending Account Value“ shown is derived from the fund‘s actual return,
and the third column shows the dollar amount that would have been paid by an investor who started
with $1,000 in the fund. You may use the information here, together with the amount you invested,
to estimate the expenses that you paid over the period.
To do so, simply divide your account value by $1,000 (for example, an $8,600 account value divided
by $1,000 = 8.6), then multiply the result by the number given for your fund under the heading
”Expenses Paid During Period.“
• Based on hypothetical 5% yearly return. This section is intended to help you compare your
fund‘s costs with those of other mutual funds. It assumes that the fund had a yearly return of 5%
before expenses, but that the expense ratio is unchanged. In this case—because the return used is
not the fund’s actual return—the results do not apply to your investment. The example is useful in
making comparisons because the Securities and Exchange Commission requires all mutual funds to
calculate expenses based on a 5% return. You can assess your fund’s costs by comparing this
hypothetical example with the hypothetical examples that appear in shareholder reports of other
funds.
Note that the expenses shown in the table are meant to highlight and help you compare ongoingcosts only and do not reflect transaction costs incurred by the fund for buying and sellingsecurities. Further, the expenses do not include any purchase, redemption, or account servicefees described in the fund prospectus. If such fees were applied to your account, your costswould be higher. Your fund does not carry a “sales load.”
The calculations assume no shares were bought or sold during the period. Your actual costs may
have been higher or lower, depending on the amount of your investment and the timing of any
purchases or redemptions.
You can find more information about the fund’s expenses, including annual expense ratios, in the
Financial Statements section of this report. For additional information on operating expenses and
other shareholder costs, please refer to your fund’s current prospectus.
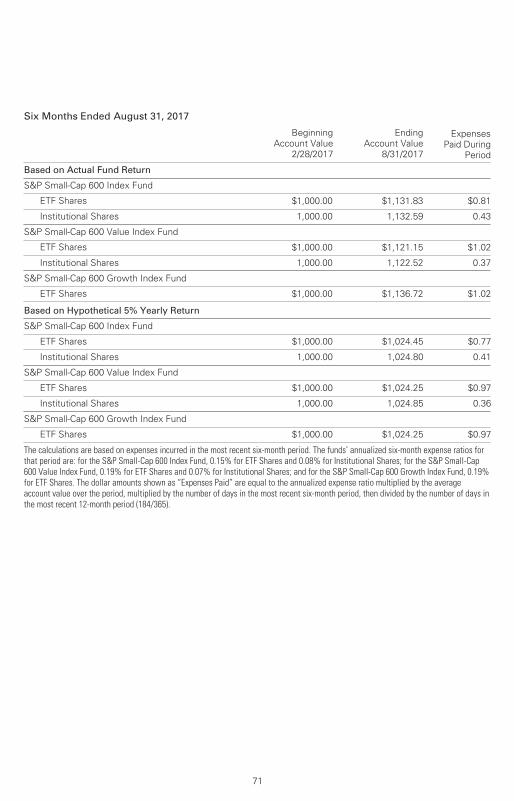
71
Six Months Ended August 31, 2017
Beginning
Account Value
2/28/2017
Ending
Account Value
8/31/2017
Expenses
Paid During
Period
Based on Actual Fund Return
S&P Small-Cap 600 Index Fund
ETF Shares $1,000.00 $1,131.83 $0.81
Institutional Shares 1,000.00 1,132.59 0.43
S&P Small-Cap 600 Value Index Fund
ETF Shares $1,000.00 $1,121.15 $1.02
Institutional Shares 1,000.00 1,122.52 0.37
S&P Small-Cap 600 Growth Index Fund
ETF Shares $1,000.00 $1,136.72 $1.02
Based on Hypothetical 5% Yearly Return
S&P Small-Cap 600 Index Fund
ETF Shares $1,000.00 $1,024.45 $0.77
Institutional Shares 1,000.00 1,024.80 0.41
S&P Small-Cap 600 Value Index Fund
ETF Shares $1,000.00 $1,024.25 $0.97
Institutional Shares 1,000.00 1,024.85 0.36
S&P Small-Cap 600 Growth Index Fund
ETF Shares $1,000.00 $1,024.25 $0.97
The calculations are based on expenses incurred in the most recent six-month period. The funds’ annualized six-month expense ratios forthat period are: for the S&P Small-Cap 600 Index Fund, 0.15% for ETF Shares and 0.08% for Institutional Shares; for the S&P Small-Cap600 Value Index Fund, 0.19% for ETF Shares and 0.07% for Institutional Shares; and for the S&P Small-Cap 600 Growth Index Fund, 0.19%for ETF Shares. The dollar amounts shown as “Expenses Paid” are equal to the annualized expense ratio multiplied by the averageaccount value over the period, multiplied by the number of days in the most recent six-month period, then divided by the number of days inthe most recent 12-month period (184/365).
The board of trustees of Vanguard S&P Small-Cap 600 Index Fund, Vanguard S&P Small-Cap 600
Value Index Fund, and Vanguard S&P Small-Cap 600 Growth Index Fund has renewed each fund’s
investment advisory arrangement with The Vanguard Group, Inc. (Vanguard), through its Equity
Index Group. The board determined that continuing each fund’s internalized management structure
was in the best interest of the fund and its shareholders.
The board based its decision upon an evaluation of the advisor’s investment staff, portfolio
management process, and performance. This evaluation included information provided to the board
by Vanguard’s Portfolio Review Department, which is responsible for fund and advisor oversight
and product management. The Portfolio Review Department met regularly with the advisor and
made monthly presentations to the board during the fiscal year that directed the board’s focus to
relevant information and topics.
The board, or an investment committee made up of board members, also received information
throughout the year through advisor presentations. For each advisor presentation, the board was
provided with letters and reports that included information about, among other things, the advisory
firm and the advisor’s assessment of the investment environment, portfolio performance, and
portfolio characteristics.
In addition, the board received monthly reports, which included a Market and Economic Report,
a Fund Dashboard Monthly Summary, and a Fund Performance Report.
Prior to their meeting, the trustees were provided with a memo and materials that summarized
the information they had received over the course of the year. They also considered the factors
discussed below, among others. However, no single factor determined whether the board approved
the arrangements. Rather, it was the totality of the circumstances that drove the board’s decision.
Nature, extent, and quality of services
The board reviewed the quality of the investment management services provided to the funds
since their inception in 2010, and took into account the organizational depth and stability of the
advisor. The board considered that Vanguard has been managing investments for more than three
decades. The Equity Index Group adheres to a sound, disciplined investment management process;
the team has considerable experience, stability, and depth.
The board concluded that Vanguard’s experience, stability, depth, and performance, among other
factors, warranted continuation of each advisory arrangement.
Investment performance
The board considered each fund’s performance since its inception in 2010, including any periods
of outperformance or underperformance compared with its target index and peer group. The
board concluded that the performance was such that each advisory arrangement should continue.
Information about each fund’s most recent performance can be found in the Performance
Summary pages of this report.
Trustees Approve Advisory Arrangements
72
Cost
The board concluded that each fund’s expense ratio was well below the average expense ratio
charged by funds in its peer group and that each fund’s advisory expenses were also well below
the peer group average. Information about the funds’ expenses appears in the About Your Fund’s
Expenses section of this report as well as in the Financial Statements sections.
The board does not conduct a profitability analysis of Vanguard because of Vanguard’s unique
“at-cost” structure. Unlike most other mutual fund management companies, Vanguard is
owned by the funds it oversees and produces “profits” only in the form of reduced expenses
for fund shareholders.
The benefit of economies of scale
The board concluded that each fund’s at-cost arrangement with Vanguard ensures that the
funds will realize economies of scale as they grow, with the cost to shareholders declining
as fund assets increase.
The board will consider whether to renew the advisory arrangements again after a one-year period.
73
Glossary
74
30-Day SEC Yield. A fund’s 30-day SEC yield is derived using a formula specified by the U.S.
Securities and Exchange Commission. Under the formula, data related to the fund’s security
holdings in the previous 30 days are used to calculate the fund’s hypothetical net income for that
period, which is then annualized and divided by the fund’s estimated average net assets over the
calculation period. For the purposes of this calculation, a security’s income is based on its current
market yield to maturity (for bonds), its actual income (for asset-backed securities), or its
projected dividend yield (for stocks). Because the SEC yield represents hypothetical annualized
income, it will differ—at times significantly—from the fund’s actual experience. As a result, the
fund’s income distributions may be higher or lower than implied by the SEC yield.
Beta. A measure of the magnitude of a fund’s past share-price fluctuations in relation to the ups
and downs of a given market index. The index is assigned a beta of 1.00. Compared with a given
index, a fund with a beta of 1.20 typically would have seen its share price rise or fall by 12%
when the index rose or fell by 10%. For this report, beta is based on returns over the past 36
months for both the fund and the index. Note that a fund’s beta should be reviewed in conjunction
with its R-squared (see definition). The lower the R-squared, the less correlation there is between
the fund and the index, and the less reliable beta is as an indicator of volatility.
Dividend Yield. Dividend income earned by stocks, expressed as a percentage of the aggregate
market value (or of net asset value, for a fund). The yield is determined by dividing the amount of
the annual dividends by the aggregate value (or net asset value) at the end of the period. For a
fund, the dividend yield is based solely on stock holdings and does not include any income
produced by other investments.
Earnings Growth Rate. The average annual rate of growth in earnings over the past five years for
the stocks now in a fund.
Equity Exposure. A measure that reflects a fund’s investments in stocks and stock futures. Any
holdings in short-term reserves are excluded.
Expense Ratio. A fund’s total annual operating expenses expressed as a percentage of the fund’s
average net assets. The expense ratio includes management and administrative expenses, but
does not include the transaction costs of buying and selling portfolio securities.
Foreign Holdings. The percentage of a fund represented by securities or depositary receipts of
companies based outside the United States.
Inception Date. The date on which the assets of a fund (or one of its share classes) are first
invested in accordance with the fund’s investment objective. For funds with a subscription period,
the inception date is the day after that period ends. Investment performance is measured from
the inception date.
Median Market Cap. An indicator of the size of companies in which a fund invests; the midpoint
of market capitalization (market price x shares outstanding) of a fund’s stocks, weighted by the
proportion of the fund’s assets invested in each stock. Stocks representing half of the fund’s
assets have market capitalizations above the median, and the rest are below it.
Price/Book Ratio. The share price of a stock divided by its net worth, or book value, per share.
For a fund, the weighted average price/book ratio of the stocks it holds.
75
Price/Earnings Ratio. The ratio of a stock’s current price to its per-share earnings over the past
year. For a fund, the weighted average P/E of the stocks it holds. P/E is an indicator of market
expectations about corporate prospects; the higher the P/E, the greater the expectations for a
company’s future growth.
R-Squared. A measure of how much of a fund’s past returns can be explained by the returns
from the market in general, as measured by a given index. If a fund’s total returns were precisely
synchronized with an index’s returns, its R-squared would be 1.00. If the fund’s returns bore no
relationship to the index’s returns, its R-squared would be 0. For this report, R-squared is based
on returns over the past 36 months for both the fund and the index.
Return on Equity. The annual average rate of return generated by a company during the past five
years for each dollar of shareholder’s equity (net income divided by shareholder’s equity). For a
fund, the weighted average return on equity for the companies whose stocks it holds.
Short-Term Reserves. The percentage of a fund invested in highly liquid, short-term securities
that can be readily converted to cash.
Turnover Rate. An indication of the fund’s trading activity. Funds with high turnover rates incur
higher transaction costs and may be more likely to distribute capital gains (which may be taxable
to investors). The turnover rate excludes in-kind transactions, which have minimal impact on
costs.

The Global Industry Classification Standard (“GICS”) was developed by and is the exclusive property and a service mark
of MSCI Inc. (“MSCI”) and Standard and Poor’s, a division of McGraw-Hill Companies, Inc. (“S&P”), and is licensed for use
by Vanguard. Neither MSCI, S&P nor any third party involved in making or compiling the GICS or any GICS classification
makes any express or implied warranties or representations with respect to such standard or classification (or the results
to be obtained by the use thereof), and all such parties hereby expressly disclaim all warranties of originality, accuracy,
completeness, merchantability or fitness for a particular purpose with respect to any such standard or classification.
Without limiting any of the foregoing, in no event shall MSCI, S&P, any of its affiliates or any third party involved in
making or compiling the GICS or any GICS classification have any liability for any direct, indirect, special, punitive,
consequential or any other damages (including lost profits) even if notified of the possibility of such damages.
76
The People Who Govern Your Fund
The trustees of your mutual fund are there to see that the fund is operated and managed in your
best interests since, as a shareholder, you are a part owner of the fund. Your fund’s trustees also
serve on the board of directors of The Vanguard Group, Inc., which is owned by the Vanguard
funds and provides services to them on an at-cost basis.
A majority of Vanguard’s board members are independent, meaning that they have no affiliation
with Vanguard or the funds they oversee, apart from the sizable personal investments they have
made as private individuals. The independent board members have distinguished backgrounds
in business, academia, and public service. Each of the trustees and executive officers oversees
195 Vanguard funds.
Information for each trustee and executive officer of the fund appears below. The mailing address
of the trustees and officers is P.O. Box 876, Valley Forge, PA 19482. More information about the
trustees is in the Statement of Additional Information, which can be obtained, without charge,
by contacting Vanguard at 800-662-7447, or online at vanguard.com.
Interested Trustee1
F. William McNabb III
Born 1957. Trustee Since July 2009. Chairman
of the Board. Principal Occupation(s) During the
Past Five Years and Other Experience: Chairman
of the Board of The Vanguard Group, Inc., and
of each of the investment companies served by
The Vanguard Group, since January 2010; Chief
Executive Officer and Director of The Vanguard
Group and President and Chief Executive Officer
of each of the investment companies served by
The Vanguard Group, since 2008; Director of
Vanguard Marketing Corporation; President of
The Vanguard Group (2008–2017); Managing
Director of The Vanguard Group (1995–2008).
Independent Trustees
Emerson U. Fullwood
Born 1948. Trustee Since January 2008. Principal
Occupation(s) During the Past Five Years and Other
Experience: Executive Chief Staff and Marketing
Officer for North America and Corporate Vice
President (retired 2008) of Xerox Corporation
(document manage ment products and services);
Executive in Residence and 2009–2010
Distinguished Minett Professor at the Rochester
Institute of Technology; Lead Director of SPX
FLOW, Inc. (multi-industry manufacturing);
Director of the United Way of Rochester, the
University of Rochester Medical Center, Monroe
Community College Foundation, North Carolina
A&T University, and Roberts Wesleyan College;
Trustee of the University of Rochester.
Rajiv L. Gupta
Born 1945. Trustee Since December 2001.2
Principal Occupation(s) During the Past Five
Years and Other Experience: Chairman and
Chief Executive Officer (retired 2009) and
President (2006–2008) of Rohm and Haas Co.
(chemicals); Director of Arconic Inc. (diversified
manufacturer), HP Inc. (printer and personal
computer manufacturing), and Delphi Automotive
plc (automotive components); Senior Advisor at
New Mountain Capital.
Amy Gutmann
Born 1949. Trustee Since June 2006. Principal
Occupation(s) During the Past Five Years and
Other Experience: President of the University
of Pennsylvania; Christopher H. Browne
1 Mr. McNabb is considered an “interested person,” as defined in the Investment Company Act of 1940, because he is an officer of the Vanguard funds.
2 December 2002 for Vanguard Equity Income Fund, the Vanguard Municipal Bond Funds, and the Vanguard State Tax-Exempt Funds.
Distinguished Professor of Political Science,
School of Arts and Sciences, and Professor
of Communication, Annenberg School for
Communication, with secondary faculty appoint-
ments in the Department of Philosophy, School
of Arts and Sciences, and at the Graduate School
of Education, University of Pennsylvania; Trustee
of the National Constitution Center.
JoAnn Heffernan Heisen
Born 1950. Trustee Since July 1998. Principal
Occupation(s) During the Past Five Years and
Other Experience: Corporate Vice President
and Member of the Executive Committee
(1997–2008), Chief Global Diversity Officer
(retired 2008), Vice President and Chief
Information Officer (1997–2006), Controller
(1995–1997), Treasurer (1991–1995), and
Assistant Treasurer (1989–1991) of Johnson
& Johnson (pharmaceuticals/medical devices/
consumer products); Director of Skytop Lodge
Corporation (hotels) and the Robert Wood
Johnson Foundation; Member of the Advisory
Board of the Institute for Women’s Leadership
at Rutgers University.
F. Joseph Loughrey
Born 1949. Trustee Since October 2009.
Principal Occupation(s) During the Past Five
Years and Other Experience: President and Chief
Operating Officer (retired 2009) of Cummins Inc.
(industrial machinery); Chairman of the Board of
Hillenbrand, Inc. (specialized consumer services),
Oxfam America, and the Lumina Foundation for
Education; Director of the V Foundation for
Cancer Research; Member of the Advisory
Council for the College of Arts and Letters
and Chair of the Advisory Board to the Kellogg
Institute for International Studies, both at the
University of Notre Dame.
Mark Loughridge
Born 1953. Trustee Since March 2012. Principal
Occupation(s) During the Past Five Years and
Other Experience: Senior Vice President and
Chief Financial Officer (retired 2013) at IBM
(information technology services); Fiduciary
Member of IBM’s Retirement Plan Committee
(2004–2013); Director of the Dow Chemical
Company; Member of the Council on
Chicago Booth.
Scott C. Malpass
Born 1962. Trustee Since March 2012. Principal
Occupation(s) During the Past Five Years and
Other Experience: Chief Investment Officer and
Vice President at the University of Notre Dame;
Assistant Professor of Finance at the Mendoza
College of Business at Notre Dame; Member of
the Notre Dame 403(b) Investment Committee,
the Board of Advisors for Spruceview Capital
Partners, the Board of Catholic Investment
Services, Inc. (investment advisor), and the
Board of Superintendence of the Institute for
the Works of Religion; Chairman of the Board of
TIFF Advisory Services, Inc. (investment advisor).
André F. Perold
Born 1952. Trustee Since December 2004.
Principal Occupation(s) During the Past Five Years
and Other Experience: George Gund Professor of
Finance and Banking, Emeritus at the Harvard
Business School (retired 2011); Chief Investment
Officer and Co-Managing Partner of HighVista
Strategies LLC (private investment firm);
Overseer of the Museum of Fine Arts Boston.
Peter F. Volanakis
Born 1955. Trustee Since July 2009. Principal
Occupation(s) During the Past Five Years and
Other Experience: President and Chief Operating
Officer (retired 2010) of Corning Incorporated
(communications equipment); Chairman of the
Board of Trustees of Colby-Sawyer College;
Member of the Board of Hypertherm, Inc.
(industrial cutting systems, software, and
consumables).
Executive Officers
Glenn Booraem
Born 1967. Investment Stewardship Officer Since
February 2017. Principal Occupation(s) During the
Past Five Years and Other Experience: Principal of
The Vanguard Group, Inc.; Treasurer (2015–2017),
Controller (2010–2015), and Assistant Controller
(2001–2010) of each of the investment companies
served by The Vanguard Group.
Thomas J. Higgins
Born 1957. Chief Financial Officer Since
September 2008. Principal Occupation(s) During
the Past Five Years and Other Experience: Principal
of The Vanguard Group, Inc.; Chief Financial Officer
of each of the investment companies served by
The Vanguard Group; Treasurer of each of the
investment companies served by The Vanguard
Group (1998–2008).
Peter Mahoney
Born 1974. Controller Since May 2015. Principal
Occupation(s) During the Past Five Years and
Other Experience: Principal of The Vanguard
Group, Inc.; Controller of each of the investment
companies served by The Vanguard Group; Head
of International Fund Services at The Vanguard
Group (2008–2014).
Anne E. Robinson
Born 1970. Secretary Since September 2016.
Principal Occupation(s) During the Past Five Years
and Other Experience: Managing Director of The
Vanguard Group, Inc.; General Counsel of The
Vanguard Group; Secretary of The Vanguard Group
and of each of the investment companies served
by The Vanguard Group; Director and Senior Vice
President of Vanguard Marketing Corporation;
Managing Director and General Counsel of Global
Cards and Consumer Services at Citigroup
(2014–2016); Counsel at American Express
(2003–2014).
Michael Rollings
Born 1963. Treasurer Since February 2017.
Principal Occupation(s) During the Past Five
Years and Other Experience: Managing Director
of The Vanguard Group, Inc.; Treasurer of each
of the investment companies served by The
Vanguard Group; Director of Vanguard Marketing
Corporation; Executive Vice President and Chief
Financial Officer of MassMutual Financial Group
(2006–2016).
Vanguard Senior Management Team
Mortimer J. Buckley Chris D. McIsaac
Gregory Davis James M. Norris
John James Thomas M. Rampulla
Martha G. King Karin A. Risi
John T. Marcante
Chairman Emeritus and Senior Advisor
John J. Brennan
Chairman, 1996–2009
Chief Executive Officer and President, 1996–2008
Founder
John C. Bogle
Chairman and Chief Executive Officer, 1974–1996
P.O. Box 2600
Valley Forge, PA 19482-2600
Connect with Vanguard® > vanguard.com
Fund Information > 800-662-7447
Direct Investor Account Services > 800-662-2739
Institutional Investor Services > 800-523-1036
Text Telephone for PeopleWho Are Deaf or Hard of Hearing > 800-749-7273
This material may be used in conjunctionwith the offering of shares of any Vanguardfund only if preceded or accompanied bythe fund’s current prospectus.
All comparative mutual fund data are from Lipper, aThomson Reuters Company, or Morningstar, Inc., unlessotherwise noted.
You can obtain a free copy of Vanguard’s proxy votingguidelines by visiting vanguard.com/proxyreporting or bycalling Vanguard at 800-662-2739. The guidelines arealso available from the SEC’s website, sec.gov. Inaddition, you may obtain a free report on how your fundvoted the proxies for securities it owned during the 12months ended June 30. To get the report, visit eithervanguard.com/proxyreporting or sec.gov.
You can review and copy information about your fund atthe SEC’s Public Reference Room in Washington, D.C. Tofind out more about this public service, call the SEC at202-551-8090. Information about your fund is alsoavailable on the SEC’s website, and you can receivecopies of this information, for a fee, by sending arequest in either of two ways: via email addressed [email protected] or via regular mail addressed to thePublic Reference Section, Securities and ExchangeCommission, Washington, DC 20549-1520.
The index is a product of S&P Dow Jones Indices LLC(“SPDJI”), and has been licensed for use by Vanguard. Standard & Poor’s® and S&P® are registeredtrademarks of Standard & Poor’s Financial Services LLC(“S&P”); Dow Jones® is a registered trademark of DowJones Trademark Holdings LLC (“Dow Jones”); S&P®and S&P 500® are trademarks of S&P; and thesetrademarks have been licensed for use by SPDJI andsublicensed for certain purposes by Vanguard. Vanguard product(s) are not sponsored, endorsed, soldor promoted by SPDJI, Dow Jones, S&P, or theirrespective affiliates and none of such parties make anyrepresentation regarding the advisability of investing insuch product(s) nor do they have any liability for anyerrors, omissions, or interruptions of the index.
© 2017 The Vanguard Group, Inc.All rights reserved.Vanguard Marketing Corporation, Distributor.
Q18450 102017


