
VG217 Development of techniques to manipulate fibre development in ginger
Garth Sanewski Queensland Department of Primary Industries

VG217
This report is published by the Horticultural Research and Development Corporation to pass on information concerning horticultural research and development undertaken for the vegetable industry.
The research contained in this report was funded by the Horticultural Research and Development Corporation with the financial support of the Australian Ginger Association and Buderim Ginger Pty Limited.
All expressions of opinion are not to be regarded as expressing the opinion of the Horticultural Research and Development Corporation or any authority of the Australian Government.
The Corporation and the Australian Government accept no responsibility for any of the opinions or the accuracy of the information contained in this Report and readers should rely upon their own inquiries in making decisions concerning their own interests.
Cover Price $20.00
HRDC ISBN 1 86423 425 3
Published and Distributed by:
Horticultural Research and Development Corporation Level 6 7 Merriwa Street Gordon NSW 2072
Telephone: (02) 9418 2200 Fax: (02)9418 1352
© Copyright 1996

CONTENTS
1. Industry summary
2. Technical summary
3. Shoot emergence of ginger as affected by dormancy, size and type of rhizome pieces.
4. The effect of time of planting and germination on early harvest ginger.
5. The effect of temperature on growth and fibre development in potted ginger plants.
6. Effect of mild water deficit on assimilate partitioning, fibre development and water relations of potted ginger plants.
7. Effect of water deficit on dry matter production, percentage choice grade rhizome and leaf water relations of potted ginger plants.

SECTION 1
Industry summary

FIBRE DEVELOPMENT IN EARLY HARVEST GINGER
HRDC PROJECT VG 217
G. M. Sanewski
Maroochy Horticultural Research Station, P O Box 5083, SCMC, Nambour Qld. 4560.
INDUSTRY SUMMARY
1. Germination Studies
The main contributor to poor and uneven germination particularly in the period up to mid-August, is rhizome dormancy. This dormancy was shown to be substantially diminished by mild pre-plant drying of planting material for 7 days. However, although this treatment improves germination it does not increase yield but rather has the potential to decrease knob size, shoot growth and possibly yield. Severe dessication as might be caused by leaving bins of planting material unprotected for long periods could in itself be a major cause of poor germination or uneven shoot growth.
Ethrel treatment also improves germination but decreases knob size without increasing yield making it an unsuitable practice.
Recommendations are;
• Attempt to plant even-sized planting material, preferably of a larger size (70+g),
• Avoid severe dessication of planting material, particularly in the September period.
2. Time of Planting Studies
The decline in % choice grade rhizome is strongly influenced by daylength. Earlier planting dates than the traditional mid September should increase yield due to a lengthening of the growing season.
Recommendations are;
• Mid to late August planting is best. It is recommended that growers who usually plant in mid September should trial planting a percentage of their crop in mid to late August (15 th - 31 st August). It is best that only a percentage of the crop be initially planted at this time. This will ensure problems do not arise from the change in routine. The date of 45% choice rhizome may occur 2-3 days earlier than with a mid September planting.

• Do not plant too early. Planting in early August will result in very poor germination and reduced yield. Early August planting will however produce the largest knobs.
3. Effect of Temperature
While temperature was shown to affect yield of choice grade rhizome substantially, it does not have a major affect on the decline of % choice grade rhizome.
A mean day/night temperature regime of 25°/15°C is the most for growth of choice grade rhizome. This temperature regime is close to that experienced towards the end of February.
Temperature should not normally have a substantial effect on the rate of decline of percentage choice grade rhizome assuming early harvest occurrs in the February to mid March period.
4. Effect of Water Stress.
Ginger is very sensitive to water stress. Ginger cannot tolerate water stress so it ceases growth to conserve water, even under mild water deficient conditions. Even mild water stress will reduce yield substantially. Water stress does not however appear to have a major affect on the rate of decline of % choice grade rhizome.
Severe water stress actually results in an increase in the percentage choice grade rhizome although the actual yield of choice grade rhizome decreases. This occurs because the weight of fibred rhizome is reduced more by water stress than that of choice rhizome.
Conclusion
The rate of decline of % choice grade rhizome tends to be more dependant on the rate of starch deposition in the fibred rhizome relative to the production of new knobs, rather than the rate of fibre development. Rhizome fibre content tends to follow a similar trend as total plant dry weight.
The trials conducted have suggested that growing conditions can have a large effect on the decline in % choice grade rhizome. It is possible therefore that there are some growers who could extend their growing season and/or increase yields by improvements to growing practices such as irrigation and fertilisation. It is also likely that there are some growers who, because of very good cultural practices, are at the limit of these influences and because of daylength and low temperature, will not be able to delay the decline of % choice grade rhizome. It is strongly recommended therefore that growers keep plants as vigorous as possible in the period close to early harvest. This can be done by ensuring adequate irrigation and fertilisation.

Investigation of techniques to slow the deposition of assimilate into the fibred portions of the rhizome prior to early harvest time may offer some potential for temporarily slowing the decline in % choice grade rhizome. Partial topping of plants at early harvest may be one such technique. This could be expected to reduce rhizome growth but, because of the high price paid for choice grade rhizome may still be a proposition worthy of investigation. Studies into cultural practices such as fertilisation in the period prior to early harvest are also worthwhile.

SECTION 2
Technical summary

FIBRE DEVELOPMENT IN EARLY HARVEST GINGER
HRDC PROJECT VG 217
G. M. Sanewski
Maroochy Horticultural Research Station, P 0 Box 5083, SCMC, Nambour Qld. 4560.
TECHNICAL SUMMARY
Rhizome fibres in ginger are vascular bundles with a surrounding sheath of essentially non-lignified sclerenchyma fibre cells. These fibres are initiated at the apical meristem of each rhizome segment. Fibre development, in a commercial context, is the thickening of the fibre cell walls through the addition of cellulose. Rhizome fibre content closely follows total plant dry weight.
The rate of decline of % choice grade rhizome tends to be more dependant on the rate of assimilate deposition in the fibred relative to the production of new knobs, rather than actual fibre development.
In addition the trials conducted have shown;
• Plant maturity and fibre development are strongly influenced by daylength. An earlier planting date than the traditional mid September will increase yields and is recommended.
• Water deficit does not increase fibre development. • Low temperature does not have a major effect on fibre development. • The relative growth rate of the plant has a large effect on the decline in % choice
grade rhizome. A high growth rate will maintain a higher % of choice grade rhizome.
• Rhizome dormancy is the main cause of uneven shoot emergence. While shoot emergence can be easily improved by pre-plant treatment with Ethrel, knob size and possibly yield are reduced.
It is possible that there are some growers who could extend their growing season and hence increase yields by improvements to growing practices such as fertilisation immediately prior to early harvest. It is also likely that there are some growers who, because they achieve good growth rates, are at the limit of these influences and, because of daylength and temperature, will not be able to delay the decline of % choice grade rhizome.
Investigation of techniques to slow the deposition of assimilate into the fibred portions of the rhizome prior to early harvest time may offer some potential for temporarily slowing the decline in % choice grade rhizome. As an example, partial topping of plants immediately prior to early harvest may be one such technique. This could be expected to reduce rhizome growth but, because of the high price paid for

choice grade rhizome may still be a proposition worthy of investigation. Studies into cultural practices such as fertilisation in the period prior to early harvest are also worthwhile.
PUBLICATION SCHEDULE
1. A paper titled "Shoot emergenceof ginger as affected by dormancy, size and type of rhizome pieces" will be submitted to Australian Journal of Experimental Agriculture by October, 1995. See draft attached.
2. A paper titled "Effect of water deficit on potted ginger plants"will be submitted to Australian Journal Agricultural Research by December, 1995. See 2 attached draft papers on water deficit on ginger.
3. Work is continuing on this project with the intention of submission as a PhD thesis in 1997.

SECTION 3
Shoot emergence of ginger as affected by dormancy, size and type of rhizome pieces

1
SHOOT EMERGENCE OF GINGER AS AFFECTED BY DORMANCY, SIZE
AND TYPE OF RHIZOME PIECES
A fi
G. M. Sanewski and S. Fukai
^Queensland Department of Primary Industries, Box 5083, SCMC, Nambour, Qld 4560,
Australia.
sThe University of Queensland, Department of Agriculture, Brisbane, Qld 4072, Australia.
Summary. Endodormancy was shown to exist in ginger rhizome pieces dug in mid
August but to be substantially diminished by early September in Southern Queensland.
Endodormancy was broken earlier by 7-14 days storage on open trays. 7 days storage
resulted in greater shoot number and shoot dry weight. Storage for periods of 14 days or
longer was detrimental to the development of leaf area. Endodormancy lasted longer in
younger rhizome pieces such as fourth order pieces, and the number of shoots produced
was less in fourth and third order pieces than in second order pieces. Planting piece
weight on the other hand had no effect on endodormancy but 20-30 g planting pieces
produced fewer shoots than 40-50 g and 60-70 g pieces.
Introduction
The Australian ginger industry is centred in Yandina near Nambour in South East
Queensland, latitude 26'36°S.

2 The most common time of planting is in the period from early to late September when
temperatures are considered warm enough. The mean maximum and minimum
temperatures for Nambour (< 15 km south of Yandina) for the years 1983 to 1994
inclusive are shown. Frosts can occur in low-lying areas in the winter months from June
to August. Early plantings are sometimes made in mid-August.
Month Max temp (°C) Min temp (°C)
June ~~2lT ~ ~9A July 21.0 8.5 August 22.2 8.0 September 24.9 10.5 October 26.5 14.0 November 27.7 16.3
Shoot emergence in ginger fields in South East Queensland is usually slow and erratic
often taking 4 weeks for the first shoots to appear with the majority emerging in the period
6-8 weeks from planting (Evenson et al., 1978). This slow emergence may be due to the
status of the planting material or unfavourable environmental conditions or both. Failure
to germinate due to unfavourable internal conditions is the traditional meaning of dormancy
as it pertains to seed and underground organs. It is now more appropriately referred to as
endodormancy (Dennis, 1994). Failure to germinate due to unfavourable external
conditions is often referred to as quiescence or rest (Salisbury and Ross, 1985; Dennis,
1994).
Poor shoot emergence in ginger has been studied previously by other researchers.
Evenson et al., (1978) found the optimum soil temperature to be 25-26°C and low soil

3 temperatures at planting slowed the production of new shoots. They also found a large
variation in germination among rhizome pieces but did not indicate possible causal factors.
It appears that an endodormancy is present in ginger as exposure to 35°C for 24 hr or 250
ppm ethylene for 15 minutes increases the number of shoots and the number of roots
(Islam etal., 1978).
The nature of rhizome endodormancy and its relationship to the lack of uniformity seen in
germinating fields of ginger has not previously been studied. Good establishment in ginger
is however important as rhizome yield is strongly correlated to shoot number (Furutani et
al., 1985). This study was therefore initiated to examine shoot emergence in ginger. It
examined the nature of rhizome endodormancy during winter and spring, and the effects of
storage conditions, planting piece mass and planting piece type.
Materials and Methods
There were 4 trials to investigate endodormancy, storage of rhizome pieces, planting
piece mass and planting piece type.
Dormancy
The experiment was a completely randomised design consisting of 5 replicates of 5
treatments on time of planting.
Mature rhizomes of the cultivar 'Queensland' were dug from a field at Nambour at 5
times, 1 July, 5 August, 3 September, 21 September, and 6 October, 1993 to examine
dormancy status of the rhizomes at different times of planting. They were immediately

4 washed, cut into pieces weighing 50-70 g and dipped for 1 minute in a fungicide solution
of 1 g/L Benlate (0.5 g/L benomyl a.i.). The treated pieces were air-dried for 1 day then
planted in seedling trays in a temperature controlled glasshouse maintained at a maximum
day and minimum night temperature regime of approximately 30°/18°C. The trays
contained a potting mix consisting of sand, peat and sawdust in the ratio 2:1:1 and a dry
fertiliser mix. A layer of pine sawdust was placed on top of the rhizome pieces after
planting. The trays were kept moist with regular watering. Each tray contained 10
rhizome pieces of the same treatment, and this constituted a replicate. The trays were
repositioned in the glasshouse periodically. Shoot number was recorded every 2-3 days for
up to 80 days after planting.
Storage of rhizome pieces
Mature rhizomes of the cultivar 'Queensland' were dug on 12 August 1992. The
rhizomes were prepared in the same manner as previously described. Treated pieces were
air-dried for 1 day in a shaded location before the imposition of treatments. The treatments
were designed to examine the breakdown of endodormancy.
The treatments consisted of storage for 1, 7, 14, 21 or 28 days, either in high density
polyethylene bags to prevent desiccation or on open trays to allow desiccation. Including
the control, which was the 1 day storage, there were 9 treatments. In addition there were
2 treatments for rhizomes dug on the 22 September, 1992; 1 day storage and 7 days
storage on open trays.

5 The experiment was a completely randomised design with 5 replicates each replicate
consisting of 10 rhizome pieces.
Storage was conducted in a shed at ambient temperatures. Ambient temperatures in the
storage location were within a maximum of 31°C and a minimum of 12°C.
The temperature in the plastic bags and on the open trays was monitored during storage
using maximum/minimum thermometers. The temperature in the bags reached a maximum
5°C higher than that on the trays on the day rhizomes were enclosed, but after that day it
was never more than 1°C higher.
After storage the rhizome pieces were planted in moist sawdust in plastic seedling trays in
a naturally-lit, temperature-controlled glasshouse under conditions similar to those
described in the previous trial.
The number of shoots was counted every 2-3 days and the shoots were harvested 40 days
after planting for determination of dry weight and leaf area. The total fresh weight of the
rhizome pieces in each replication was recorded at the beginning and after storage.
For dry matter determinations an additional 50 rhizomes of 50-70 g were prepared as
previously described. They were divided into 5 lots of 10 rhizomes and each set of 10 was
then stored for 0, 7, 14, 21, or 28 days on open trays. Fresh weights were recorded
before and after storage. After storage the rhizomes were cut into thin slices, dried in a
fan forced oven at 60°C and dry weights recorded.
Planting piece mass

6 Mature rhizomes were dug on 26 August 1992 and treated as for the previous
experiments. The experiment was a randomised block design composed of 3 replications
of 3 treatments. The treatments included 3 weight ranges, viz, 20-30 g (26 g), 40-50 g (45
g) and 60-70 g (65 g). Each replicate was comprised of 50 rhizome pieces. The trial was
planted in raised beds in the field as for commercial ginger production. Fertiliser and
irrigation were applied as is normal for commercial ginger production.
Before planting, buds were counted on 100 rhizome pieces of each treatment. Large
pieces (8.7 buds) had more buds than medium pieces (6.9 buds), and both had more than
small rhizome pieces (4.9 buds).
The number of shoots was recorded every 2-3 days up to 13 weeks after planting.
Planting piece type
The experiment was a randomised block design consisting of 5 replications of 3
treatments. The treatments were second, third and fourth order rhizome pieces. First
order pieces are produced on the first shoots to germinate from the original planting piece.
Second order pieces arise from first order pieces and so on. Fourth order pieces will
therefore be younger than third, second and first order pieces. First order pieces were not
included in this trial because they constitute only a small proportion of rhizome pieces
planted by growers and because they are generally of a smaller mass than other rhizome
pieces.

7 Mature rhizomes were dug and treated as for the rhizome piece mass trial. Rhizome
pieces of 50-70 g were used. Each replication consisted of 20 rhizome pieces.
Before planting, rhizome buds were counted on 100 planting pieces of each treatment.
Second order pieces (5.4 buds) and third order pieces (6.0 buds) had significantly more
buds/rhizome piece than fourth order pieces (6.5 buds).
The trial was field planted adjacent to the planting piece mass trial and was treated
identically.
Shoot counts were conducted every 2-3 days and the shoots were harvested 11 weeks
after planting for dry weight and leaf area measurements.
Results
Dormancy
Figure 1 shows that the rhizomes collected in spring emerged much faster than those
collected in winter. Rhizomes collected on 1 July did not emerge for the first 40 days and
also did not exhibit a definite plateau in shoot number. They had the slowest mean
germination rate at 0.01 shoots/day over the 80 day period. Mean germination rate
increased with delay in rhizome collection to 0.03 shoots/day for the 5 August collection to
0.05 shoots/day for the September plantings. The maximum number of first order shoots
achieved was similar for all plantings from August onwards at 1.6-2.0 shoots/planting
piece, but it took longer to achieve this in the August planting than in the September and
October plantings.

8 Storage of rhizome pieces
Rhizome pieces stored on open trays lost more fresh weight during storage than those in
plastic bags (Fig 2). Rhizome pieces stored in plastic bags lost a small amount of weight
(1%) over the first week of storage but maintained weight from then to week 4.
Rhizome pieces stored on open trays declined in weight substantially in the first 2 weeks
but only slightly over weeks 3 and 4. Weight loss on a dry weight basis shows that it
was small in the first 7 days, but was much greater when the storage period was
increased to 14 days (Table 1). Rhizome pieces stored on open trays for 28 days
incurred a 4% decline in moisture content and an 8% decline in dry weight.
Table 1
Figure 2
The trends in shoot appearance for storage treatments are shown in figure 3. Data for
open trays for rhizomes dug in August are shown in figure 3A and that for plastic bags are
shown in figure 3B. Data for rhizomes dug in September are shown in figure 3C.
Figure 3
Storage on open trays for 7 and 14 days in mid-August resulted in rapid shoot emergence
and increased the total number of shoots at day 40 whereas storage for 21 and 28 days
reduced early emergence. Storage on open trays for 7 days produced the largest number of
shoots/planting piece (2.5).
Storage in plastic bags for 7 or 14 days did not affect shoot production compared to the
control whereas storage for 21 and 28 days reduced shoot production.
Figure 4 shows the effect of storage time on harvest data 40 days after planting using
rhizomes dug in August. Rhizome pieces stored for 7 days on open trays produced the

9 greatest number of shoots, the greatest total shoot dry weight and the largest total shoot
leaf area but dry weight or leaf area/shoot was less than that of freshly planted rhizome
pieces (control). Rhizome pieces stored for 14 days on open trays produced more shoots
than the control but total shoot dry weight and total leaf area were similar for the two.
Rhizomes stored on open trays for 21 and 28 days appeared shrivelled in comparison
with those in bags. The buds on rhizome pieces stored in plastic bags for 28 days were
showing white tips. The smallest shoots were produced if storage was 21 days or longer
irrespective of whether they were bagged or not.
Figure 4
Rhizomes planted in late September with 7 days storage produced the greatest overall
dry weight and leaf area and the largest shoots. Storage of rhizomes for 7 days in late
September produced substantially fewer shoots than the same treatment in mid-August
but dry weight production per shoot was similar.
Planting piece mass
The trend of shoot emergence for planting pieces of different mass is shown in figure
5A. Significant differences in shoot number between treatments were seen on days 34,
86 and 88. On day 34, small pieces had more shoots than medium and large pieces. On
days 86 and 88, medium and large pieces had more shoots than small pieces. The shape
of the curves in figure 5 A indicate that the maximum number of first order shoots were
produced by about day 65 (the plateau) followed by a rapid increase in second order
shoots.
Planting piece type

10 The general trend was for second order pieces to produce shoots earlier than third
and or fourth order pieces (Fig 5B). Significant difference between treatments was seen
on days 32-53 inclusive and on days 74 and 75. The figure indicates that second order
pieces produced a maximum of approximately 1 first order shoot per rhizome piece in 53
days. Fourth order pieces produced a similar maximum but required 60 days to reach
this maximum. The straighter emergence slope for third and fourth order pieces also
indicates an overlap of first and second order shoots. That is, some rhizome pieces were
producing their second order shoots while others were still producing their first. The
more definite plateau of the emergence slope for second order pieces indicates that most
of these rhizome pieces germinated and produced their first order shoot together.
Uniformity of development between plants could therefore be expected to be better in
plants produced from second order rhizome pieces in comparison with those from third
or fourth order pieces.
Table 2 shows harvest data for shoots from rhizome pieces of different type.
Table 2
While only stem number showed a significant difference the data suggests a trend with
the second order pieces producing more vigorous shoots in a given time.
Discussion
Rhizome endodormancy was shown to exist in rhizome pieces dug from early July to
mid-August. Despite favourable external conditions, rhizome pieces dug and planted at
these times produced fewer shoots in the first 70 days after planting than rhizome pieces
dug and planted in early September.

11
This endodormancy was related to type of rhizome with the younger fourth order
rhizome pieces having a longer period of dormancy than the older second order pieces.
It was not however related to rhizome mass.
Endodormancy was shown to be reduced by 7 days desiccation before planting.
Longer periods of storage did not further reduce the dormancy period but reduced shoot
growth. While 7 days storage on open trays increased the number of shoots, dry
weight/shoot was lower for this treatment than rhizome pieces planted with no storage.
This suggests the high shoot number was responsible for the smaller shoot size.
The positive effect of pre-plant desiccation of the planting material on shoot emergence
in other species not new. Hall (1992) reports that shoot emergence in some varieties of
sweet potato is accelerated by increased duration of curing. In potato, storage at warm
temperatures results in an accelerated conversion of high molecular weight
polysaccharides such as starch to labile carbohydrates such as fructose, glucose and
sucrose (Burton, 1948; Charles-Edwards et al, 1986). These sugars are the immediate
substrate for the developing shoots. Pre-plant storage which triggers this conversion
could therefore be expected to result in a higher concentration of sugars for immediate
use following planting. This could be expected to increase the rate of shoot emergence
rather than increase the ultimate number of shoots. It is conceivable that storage for
periods longer than 7 days may result in substantially lower starch and sugar levels due
to excessive respiration.

12 Desiccation of rhizomes in mid-August for periods of 14-28 days does not appear to be
detrimental to shoot emergence but reduces subsequent shoot growth substantially.
Storage in plastic bags for 28 days was however detrimental to shoot emergence.
Perhaps increased C02 inhibited growth as shown in the work by Emilsson and Lindlom
in Ivins and Milthorpe (1963).
Desiccation of rhizome pieces by pre-plant storage for 7 days appears to be beneficial.
This agrees with work by Hasanah et al (1989). They found that storage for 4 weeks
gave twice as many shoots as storage for 1 week. Both gave more shoots than no
storage.
Rhizome pieces of 20-30 g produced fewer shoots than larger pieces probably because
they had fewer viable buds and less assimilate. While the difference in the number of
first order shoots was small, the difference in shoot number was increasing with time.
Rhizome yield has been shown to be strongly correlated to shoot number (Furutani et al,
1985) and so differences in planting piece mass could be expected to affect rhizome
yield.
However, while planting piece mass may affect important early harvest yield
components, it most likely contributes little if at all to uneven germination in the first 10
weeks after planting in commercial ginger production. Growers generally use planting
pieces within the 40-70 g size range. Pieces within this range were shown to produce
similar shoot numbers but there may be minor differences in actual shoot size.

13 If growers planted by tonnage rather than by rhizome spacing and were consistent with
their size grading, then rhizome pieces of 20-30 g size should actually produce more
shoots per hectare than either of the larger sizes. At a planting tonnage of 6 t/ha, 20-30
g pieces should produce around 62,300 shoots/ha at 10 weeks compared with 44,400
shoots/ha for 40-50 g pieces and 32,600 shoots/ha for 60-70 g pieces.
Conclusion
Poor and uneven germination and emergence in ginger has shown to be caused by
several factors. Uneven size grading in planting material, the inherent differences
between planting pieces from different parts of the rhizome and time of planting all
contribute to a protracted shoot emergence. Endodormancy appears the main contributor
particularly in the period to mid-August. This endodormancy is substantially diminished
by dessication for 7 days.
Mild pre-plant dessication may be a means of improving the uniformity and speed of
shoot emergence and hence yield and quality of early harvest ginger. Further field trials
are being conducted to test this hypothesis.
Severe dessication as might be caused by a long period of storage or hot, drying
conditions could be expected to reduce shoot growth. This in itself could be a
contributor to poor shoot emergence or uneven shoot growth.
References

14 Burton, W.G. (1948). The potato. A survey of its history and of factors influencing its
yield, nutritive value and storage. Chapman & Hall Ltd. London.
Dennis, F.G. (1994). Dormancy - What we know (and don't know). Hortscience.
29(11): 1249-1255.
Charles-Edwards, D.A., Doley, D. and Rimmington, G.M (1986). Modelling plant
growth and development. Academic Press. Sydney. 235 pp.
Evenson, J.P., Bryant, P.J., and Asher, C.J. (1978). Germination and early growth of
ginger (Zingiber officinale. Roscoe). I - Effects of constant and fluctuating soil
temperature. Trop Agric (Trinidad). 55( 1): 1 -7.
Furutani,S.C, Villanueva, J. and Tanabe, M.J. (1985). Effect of ethephon and heat on
the growth and yield of edible ginger. Hortscience. 20(3):392-393.
Hall, M.R. (1992). Brief extension of curing and presprouting increased plant
production from bedded sweet potato. Hortscience. 27(10): 1080-1082.
Hasanah, M., Satyastuti, R., and Panggabean, G. (1989). Effect of some inhibitors on
the growth of ginger shoot. Industrial Crops Research Journal. l(2):37-45.
Islam,A.K.M.S., Asher,C.J., Edwards, D.G., and Evenson, J.P. (1978). Germination
and early growth of ginger (Zingiber officinale Roscoe). II - Effects of 2-
chloroethyl phosphonic acid or elevated temperature pretreatments. Trop Agric
(Trinidad). 55(2): 127-134.
15 Salisbury, F.B., and Ross, C.R. (1985). Plant Physiology. Wadsworth Publishing
Company. 540 pp.
Wareing, P.F., and Philips, I.D.J. (1981). Growth and differentiation in plants. 3rd
edition. Pergamon Press. 343 pp.

16 Table 1. Break-down of weight loss data for rhizome pieces stored on open trays.
Data represents the mean of 10 rhizomes per treatment.
Treatment Moisture content Water loss Dry weight loss
after storage (g/100 g dry wt) (g/100 g dry wt)
(%)
Nil storage 86 nil nil
7 days 84 132 1
14 days 82 112 9
21 days 82 119 6
28 days 82 127 8

17 Table 2. Harvest data for shoots per 20 rhizome pieces 11 weeks after planting.2
Treatment Leaf area
(cm2)
Second 2,028"
Third l,560a
Fourth 1,334"
SD 662.5
LSD (P=0.05)
Leaf fresh wt Stem fresh
(g) (g)
55.4" 80.4"
43.4" 70.0"
37.0" 63.8"
18.2 24.9
Total dry wt No stems
(g)
14.7" 32.8"
11.6" 27.4b
10.0" 27.4b
4.5 2.6
3.7
z Means followed by a common letter are not significantly different (P=0.05).

18 Figure captions
Figure 1. Trend in shoot production for rhizome planting pieces dug at different times of the year and germinated in a temperature controlled glasshouse. Each data point represents the mean of 5 replicates of 10 rhizome planting pieces. Vertical bars represent the LSD (P=0.05).
Figure 2. Weight loss in ginger rhizomes stored on open trays or in plastic bags. Datum points are means for 10 rhizome planting pieces of 50-70 g each.
Figure 3. Trends in shoot production for rhizomes dug on 12 August and stored on open trays (graph A), in plastic bags (graph B), and on open trays but dug on 22 September (graph C). Datum points are means for 10 rhizome pieces. Each plot represents a trend for a different storage period. Vertical bars represent the LSD (P=0.05). LSD bars shown apply to graph A, B and C.
Figure 4. Effect of storage time on trends in shoot number (A), total shoot dry weight (B), total leaf area (C), dry weight per shoot (D), and leaf area per shoot (E) for rhizome pieces dug on 12 August and stored on open trays or in plastic bags before planting. All data are for 40 days after planting. Each datum point represents the mean for 10 rhizome planting pieces. LSD bars are shown (P=0.05).
Figure 5. Graph A shows the effect of planting piece size on germination. Graph B shows the effect of rhizome order on shoot emergence. Vertical bars represent the LSD (P=0.05).

Figure 1
o u '5. 00
2.5 -
2.0
1.5 L
c re
!£• 1.0 o o
.5 \-
0.0
1 st July 5 th August 3 rd Sept 21 st Sept 6 th Oct
10 20 30 40 50 60 70 80 90
Days after planting

Figure 2
open trays • plastic bags
10 15 20
Days of storage
25 30

Figure 3
o
'a. bo
c
o o
JS
2.5
2.0
1.5
1.0
.5
0.0
2.5
2.0
1.5
1.0
.5
0.0
- x I I I
J_ _L _L
nil - 12 th Aug 7 days 14 days 21 days 28 days nil - 22 nd Sept 7 days - 22 nd Sept
_L _L I . I
15 20 25 30 35 40 45 15 20 25 30 35 40 45
Days from planting

Figure 4
1200
1000
800
600
400
200
0
60
50
40
30
20
10
0
J 1 I 1 I I L _ _ l ' I l 1 I 1
J I I I I I I I I I 1 _
i I i I I I l I . I
1 . 1 , 1 , 1 ' ' ' 1 •
° open trays • plastic bags
14
12
10
8
6
4
2
.8
.7
.6
.5
.4
.3
.2
.1
i i i i i i i i i
0 5 10 15 20 25 30 0 5 10 15 20 25 30
Days of storage

Figure 5
- ° 20-30 g A B p _
i D 40-50 g A 60-70 g
I mr*ar
- 1J/U 2nd order -- ' V 3rd order '_ _ = c wn*r • 4th order -
- I *l I i—i
,I
,I
i . 1 . 1 . 1 . 1 , 1 , I , I I . I i 1 . 1 , I , I
20 30 40 50 60 70 80 90 30 40 50 60 70 80
Days from planting

SECTION 4
The effect of time of planting and germination on early harvest ginger

1
THE EFFECT OF TIME OF PLANTING AND GERMINATION ON
EARLY HARVEST GINGER
G. M. Sanewski
Queensland Department of Primary Industries, Box 5083, SCMC, Nambour, Qld 4560.
Summary. Despite up to 8 weeks difference in planting date, all treatments matured
within 7 days of each other. This suggests a strong effect of photoperiod on plant
ontogeny. It should therefore be feasible to lengthen the growing season and increase
yields by planting earlier than is usual. The earliest time of planting in this study (17
August) produced the greatest yield.
Germination achieved in mid August to mid October plantings should be satisfactory in
most situations even though it may appear sporadic. Treatment of planting pieces with
Ethrel® can improve germination but reduces knob size without increasing yield.
Desiccation of planting pieces for only 1 week can also improve germination but will
reduce yield.

2 Introduction
The Australian ginger industry is based predominantly on the production of early harvest
ginger. This ginger, due to its immaturity, is relatively low in fibre and consequently
suitable for processing into confectionary products.
Early harvest usually commences around late February when the rhizome has declined to
45% choice grade as determined by the blunt knife technique (Whiley, 1980). The date of
commencement of early harvest varies from year to year and has been associated with
time of planting, mulching, soil conditions and weather patterns (Leverington, 1969) but
there have been no in-depth studies.
Because ginger is a quantitative short day plant (Adaniya et al., 1988), it is reasonable to
expect that early plantings will produce higher rhizome yield due to the longer growing
season. A major objective of this study was to compare different planting dates.
Previous studies by the author (unpublished data) indicated that planting material lifted
early in the season exhibited poor germination even at favourable temperatures.
However, desiccation of planting pieces for seven days improved germination. Work by
others (Islam, 1978; and Furutani et al., 1985) demonstrated the beneficial effects of a pre-
plant treatment with Ethrel (R) on germination. Consequently, treatments to improve
germination were included at each time of planting.

3 This study examines the effect of time of planting and germination on yield and fibre
development of early harvest ginger in South East Queensland.
Material and method
Different time of plantings were combined with treatments to improve germination. The
experiment was a randomised complete block design with 5 repetitions of 8 treatments.
Treatments are shown in table 1.
Table 1
Mature rhizomes of the cultivar 'Queensland' were used. The rhizomes were washed,
cut into pieces weighing 50-70 g and dipped for one minute in a solution of 1 g/L Benlate
R (0.5 g/L benomyl). Nil pre-plant treatment and Ethrel dip pieces were air-dried for 1
day in open styrofoam trays in a shaded location. 8 days desiccation pieces were air-dried
for 8 days. Ethrel treatment pieces were dipped in a solution of 1 ml/L Ethrel (480 g/L
ethephon) and 0.1 ml/L Agral (a non-ionic wetter) for 1 minute and allowed to air-dry for
about 1-2 hours before planting.
Pieces were planted in 3 rows on raised beds with 1.8m between bed centres and 0.15m
between pieces along the row. Each plot was 3m long and 2 beds wide.
The experimental planting was in a field of commercially grown ginger and was treated
identically. The block was fertilised and irrigated as required. Nemacur 10 G (100 g/kg
fenaminophos) was applied at 110 kg/Ha on 25 November.

4 Climatic data was recorded using an Environdata ® automatic weather station.
Harvesting
At each harvest, 0.45m of the centre row and 0.45m of an inside row was harvested at
approximately 2 weekly intervals. 1 plant was left along the row between consecutive
harvests.
The harvesting sequence is shown in figure 1.
Figure 1
The rhizomes were washed of soil and the roots removed. The plants were then divided
into shoots and rhizomes.
Shoot number was recorded before a sub-sample was taken, weighed and placed in a
fan-forced dehydrator at 60°C. The rhizomes were weighed and knob number recorded
before separating into choice and fibred portions using the blunt knife technique (Whiley,
1980).
The data was analysed using the statistical software program 'Statistix'. Two way
analysis of variance was used to determine the significance of treatment effects.
Germination treatments were analysed separately from time of planting treatments.

5 Results
Germination
Germination data is shown in figure 2. Data for each planting date is graphed separately
for ease of interpretation. Both Ethrel and desiccation treatments improved germination
on all planting dates. The earlier the planting date, the straighter the germination
response. The first asymptote on each curve represents the number of first order shoots
(and hence first order knobs). The second asymptote represents the number of second
order shoots. The maximum number of first order shoots for each treatment as taken from
figure 2 are shown in table 2.
Figure 2
Table 2
Similar planting material lifted at various times and germinated in a heated glasshouse at
30/20°C achieved a maximum of 2 first order shoots per planting piece. This is
equivalent to 22.2 shoots/m .
Harvest data
Harvest data for untreated planting pieces planted on different planting dates is shown in
figures 3 and 4. Figures 5, 6, 7 and 8 contain harvest data for germination treatments.
Figure 3
Figure 4
Figure 5
Percentage choice
From figure 3, if we use 45% choice as the commencement of early harvest, then the
mid August and mid September plantings matured on day 67, whereas the mid October
planting matured on day 74, 7 days later.

6
Because of the difficulty of obtaining data for each treatment on the exact day of 45%>
choice, day 74 will be used as the early harvest date for all treatments.
Progressively later planting resulted in a higher percentage choice up to day 60. At day
60, all treatments declined quickly and there were no significant differences at day 74
although the general trend was for the mid October planting to be slightly higher at most
times.
Shoot growth
There were no significant differences in shoot number or shoot dry weight up to or on
day 74. In the 22 days after day 74, the mid August planting continued to produce shoots
whereas the other treatments ceased.
Flower shoots
On day 74 , the mid August planting had 11.8 flower shoots/M , the mid September
planting had 14.1/M2 and the mid October planting had 10/M2. These values were
equivalent to 5.6%>, 7.1%> and 4.7%> respectively of total shoot number. There were no
significant differences.
Rhizome growth
The earlier the planting date, the greater the rhizome fresh weight over the period to day
74 although the differences were not significant on day 74.
7
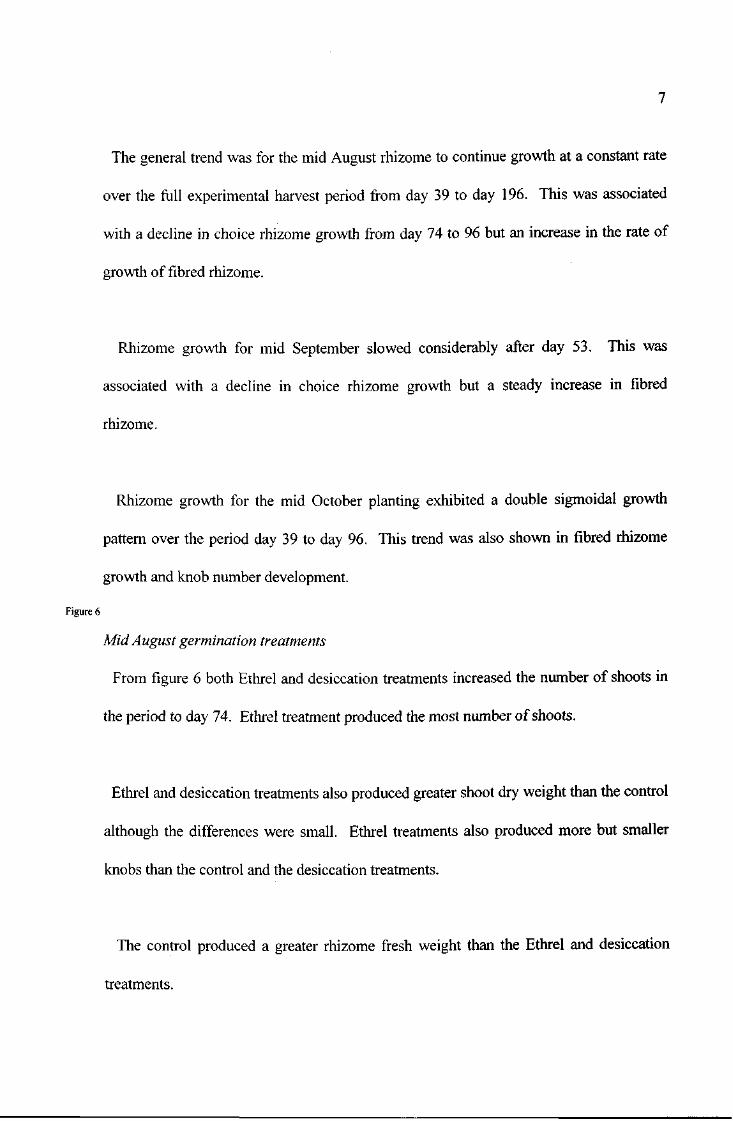
The general trend was for the mid August rhizome to continue growth at a constant rate
over the full experimental harvest period from day 39 to day 196. This was associated
with a decline in choice rhizome growth from day 74 to 96 but an increase in the rate of
growth of fibred rhizome.
Rhizome growth for mid September slowed considerably after day 53. This was
associated with a decline in choice rhizome growth but a steady increase in fibred
rhizome.
Rhizome growth for the mid October planting exhibited a double sigmoidal growth
pattern over the period day 39 to day 96. This trend was also shown in fibred rhizome
growth and knob number development.
Figure 6
Mid August germination treatments
From figure 6 both Ethrel and desiccation treatments increased the number of shoots in
the period to day 74. Ethrel treatment produced the most number of shoots.
Ethrel and desiccation treatments also produced greater shoot dry weight than the control
although the differences were small. Ethrel treatments also produced more but smaller
knobs than the control and the desiccation treatments.
The control produced a greater rhizome fresh weight than the Ethrel and desiccation
treatments.

8 Figure 5
Mid September germination treatments
From figure 7 the Ethrel treatment produced more shoots than the control and
desiccation treatments although there were no differences in shoot dry weight.
Figure 8
Mid October germination treatments
From figure 6, the trend was for Ethrel treatment to produce more shoots but a similar
shoot dry weight.
There were no differences in most rhizome parameters except the ethrel treatment
produced slightly smaller knobs.
The growth curve for fresh rhizome, knob number and fibred rhizome all exhibited a
definite double sigmoidal pattern over the harvest period. Both treatments were well
synchronised.
Climatic data
Climatic data for the entire harvest period is shown in figure 9.
Figure 9
Discussion
Despite up to 8 weeks difference in planting date, all treatments matured within 7 days
of each other. This suggests a strong effect of photoperiod on plant ontogeny. This has 2
ramifications. Firstly, it may be feasible to slow down fibre development by artificially
extending daylength in the February to March period. Secondly it should be feasible to
lengthen the growing season and hence increase yields by earlier planting dates. The

9 earliest date used here (17 August) produced the greatest yield. It is evident however that
as the planting date is progressively earlier, germination is progressively less. Very early
planting dates may therefore suffer reduced yields unless Ethrel treatment is applied to the
planting material. This has not however been demonstrated.
Germination achieved in mid August to mid October plantings should be satisfactory in
most situations even though it often appears sporadic. Germination can easily be
improved by a pre-plant dip in Ethrel but there is not likely to be any benefit in yield.
Instead, knob size will most likely be reduced.
Desiccation of planting pieces for at least 1 week can reduce yield even though the
planting pieces will germinate better. It is thought the starch reserves are depleted during
storage resulting in a lower growth potential for the ensuing crop.
According to Leverington (1969), early harvest can vary by +/- 2 weeks from year to
year. The variation in commencement of early harvest for the 18 year period from 1973
to 1990 indicates +/- 3 weeks is possible and is probably attributable to differences in
temperature and cultural operations such as fertilisation and irrigation (unpublished data).
The differences seen in the growth curves for rhizome and shoots are characteristically
different for early and late planting dates. Early plantings (mid August) generally have
straight lines whereas plantings later than about late August exhibit a definite sigmoidal
pattern which is repeated with each new flush of knobs and shoots. This latter

10 developmental pattern appears characteristic of plantings with rapid, synchronised
germination. It is evident that where all planting pieces germinate simultaneously and
quickly, all first order shoots and hence first order knobs develop together. As they
mature and slow in growth a plateau in the growth rate is seen. The second order shoots
are then produced. This pattern is repeated for every series of shoots and/or knobs
produced. In early plantings this pattern is not seen because the development of different
orders of shoots and/or knobs is overlapped.
What is unclear from the data is how plantings on different dates become synchronised
in their growth patterns as is seen in the mid September and mid October curves for knob
number. While it is expected that the production of knobs and shoots are influenced by
photoperiod and temperature, these factors were not responsible for the trends seen here
as the mid August planting remained unsynchronised.
Marked changes in the ontogeny of the ginger plant were seen around day 60 (March 1).
Production of new rhizome (new knobs, choice rhizome) slowed at this time. Shoot
growth also slowed at this point. The growth of fibred rhizome remained unchanged or
actually increased. It is known from previous studies (Whiley, 1980) that the rhizome is
only about 60% grown at this time. Continued growth must therefore occur as a bulking
of already established rhizome. It is hypothesised that this bulking occurs as a deposition
of starch in the already established rhizome and is stimulated by short days. This is the
point where the percentage of choice grade rhizome declines sharply.

11 Acknowledgments
Thanks to John Templeton for allowing the conduct of this trial on his farm and general
care and maintenance of the trial block.
Financial assistance for this work was provided by the Australian Ginger Growers
Association, Buderim Ginger Ltd and the Horticultural Research and Development
Corporation. The assistance provided by these organisations is greatly appreciated.
Bibliography
Adaniya, E., Shoda, M., and Fujida, K. (1989). Effects of daylength on flowering and
rhizome swelling in ginger. J Japan Soc Hort Sci. 58(3):649-656.
Furutani, S.C., Villanueva, J and Tanabe, M.J. (1985). Effect of ethephon and heat on
the growth and yield of edible ginger. Hortscience. 20(3):392-393.
Islam, A.K.M.S., Asher, C.J., Edwards, D.G and Evenson, J.P. (1978). Germination and
early growth of ginger (Zingiber officinale Rose). II. Effects of 2-chloroethyl phosphoic
acid or elevated temperature pretreatments. Trop Agric (Trinidad). 55(2): 127-134.
Leverington, R.E. (1969). Ginger processing investigations. 3. Improving the quality of
processed ginger. Qld J Agric Anim Sciences. 26:263-270.

12 Whiley, A.W. (1980). Growth and fibre development of ginger {Zingiber officinale
Rose.) in South East Queensland. AustJ Exp Agric Anim Husb. 20:608-612.

Table 1. Treatment schedule 13
Time of Planting Pre-plant treatment
17-8-93 Nil
17-8-93 1000 ppm Ethrel dip
17-8-93 8 days desiccation
15-9-93 nil
15-9-93 1000 ppm Ethrel dip
15-9-93 8 days desiccation
14-10-93 Nil
14-10-93 1000 ppm Ethrel dip
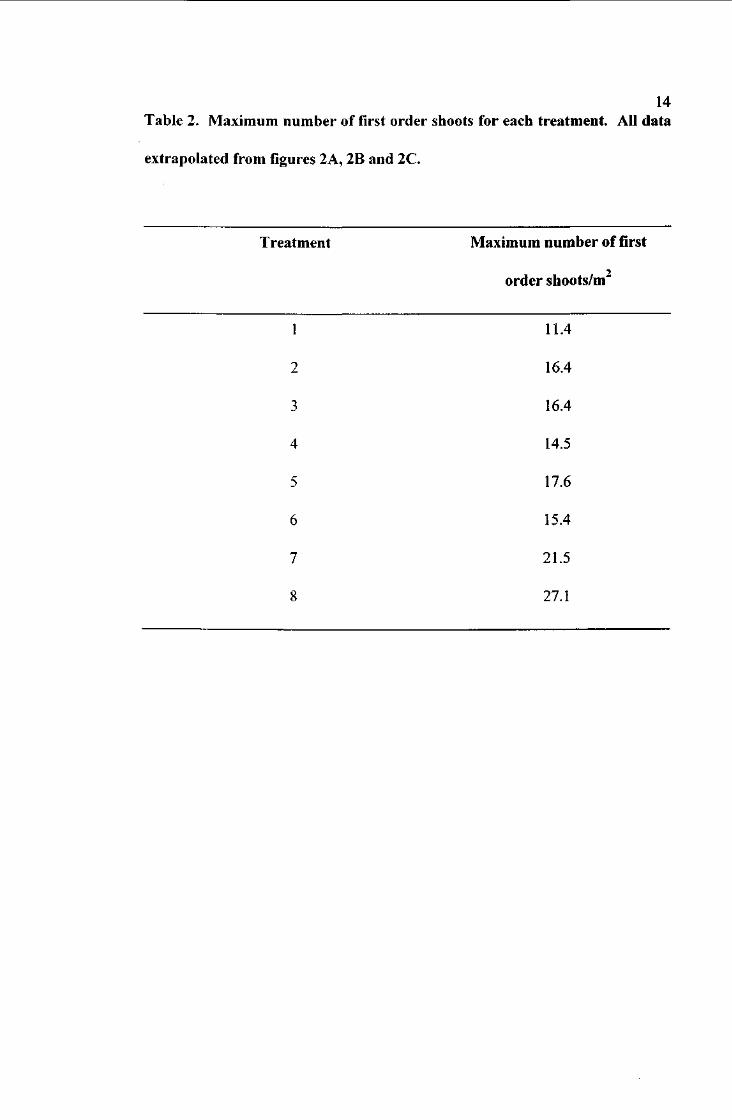
14 Table 2. Maximum number of first order shoots for each treatment. All data
extrapolated from figures 2A, 2B and 2C.
Treatment Maximum number of first
2
order shoots/m
1
2
3
4
5
6
7
8
11.4
16.4
16.4
14.5
17.6
15.4
21.5
27.1

15 Figure captions
Figure 1. An example of a harvesting sequence fo a single plot. Each plot contains
2, 3-row beds.
Figure 2. Trends in shoots/M for plantings made in mid August (graph A), mid
September (graph B) and mid October (graph C). LSD bars are shown for days
299, 323, 337 and 348 (PO.05). Graph D shows 5 day mean temperatures for air
and soil (10 cm depth).
Figure 3. Trends in percent choice rhizome (A), total fresh rhizome wt (B), knob
number (C), shoot number (D), fibred rhizome fresh wt (E) and choice rhizome
fresh wt (F) for the period from 8 February to 5 April, 1994 for 3 planting dates.
The 3 plantings were 17 Aug (mid Aug), 15 Sept (mid Sept) and 14 October (mid
Oct). Each data point represents the mean of 5 repetitions of 0.9 m of row which
was then converted into values per Mz. LSD bars are shown (P<0.05).
Figure 4. Trends in average knob weight (A) and shoot dry weight (B) for
plantings made on 17 August (mid Aug), 15 September (mid Sept) and 14 October
(mid Oct). Each data point represents the mean of 5 repetitions of 0.9 m of row
which was then converted into values per NT. LSD bars are shown (P<0.05).
Figure 5. Trends in percent choice rhizome (A), total fresh rhizome (B), knob
number (C), shoot number (D), fibred rhizome fresh wt (E) and choice rhizome

16 fresh wt (F) for a mid August planting with nil preplant treatment of planting
pieces, Ethrel dip or desiccation for 7 days. Each data point represents the mean of
5 repetitions of 0.9 m of row which was then converted into values per M . LSD
bars are shown (P<0.05).
Figure 6. Trends in percent choice rhizome (A), total fresh rhizome (B), knob
number (C), shoot number (D), fibred rhizome fresh wt (E) and choice rhizome
fresh wt (F) for mid September planting with either nil preplant treatment of
planting pieces, Ethrel dip or desiccation for 7 days. Each data point represents the
mean of 5 repetitions of 0.9 m of row which was then converted into values per M .
LSD bars are shown (PO.05).
Figure 7. Trends in percent choice rhizome (A), total fresh rhizome (B), knob
number (C), shoot number (D), fibred rhizome fresh wt (E) and choice rhizome
fresh wt (F) for a mid October planting with either nil preplant treatment of planting
pieces or Ethrel dip. Each data point represents 5 repetitions of 0.9 m of row which
was then converted into values per M". LSDbas are shown (P<0.05).
Figure 8. Trends in average knob weight (A) and shoot dry weight (B) for a mid
August planting with nil preplant treatment, Ethrel dip or 7 days desiccation; a mid
September planting (C and D) with nil preplant treatment, Ethrel dip or 7 days
desiccation; and a mid October planting (E and F) with nil preplant treatment or

17 Ethrel dip. Each data point represents the mean of 5 repetitions of 0.9 m of row
which was then converted into values per M2. LSD bars are shown (PO.05).
Figure 9. Trends in ambient temperature, soil temperature, irradience and rainfall
for the trial planting harvest period. All data was collected within the trial planting.
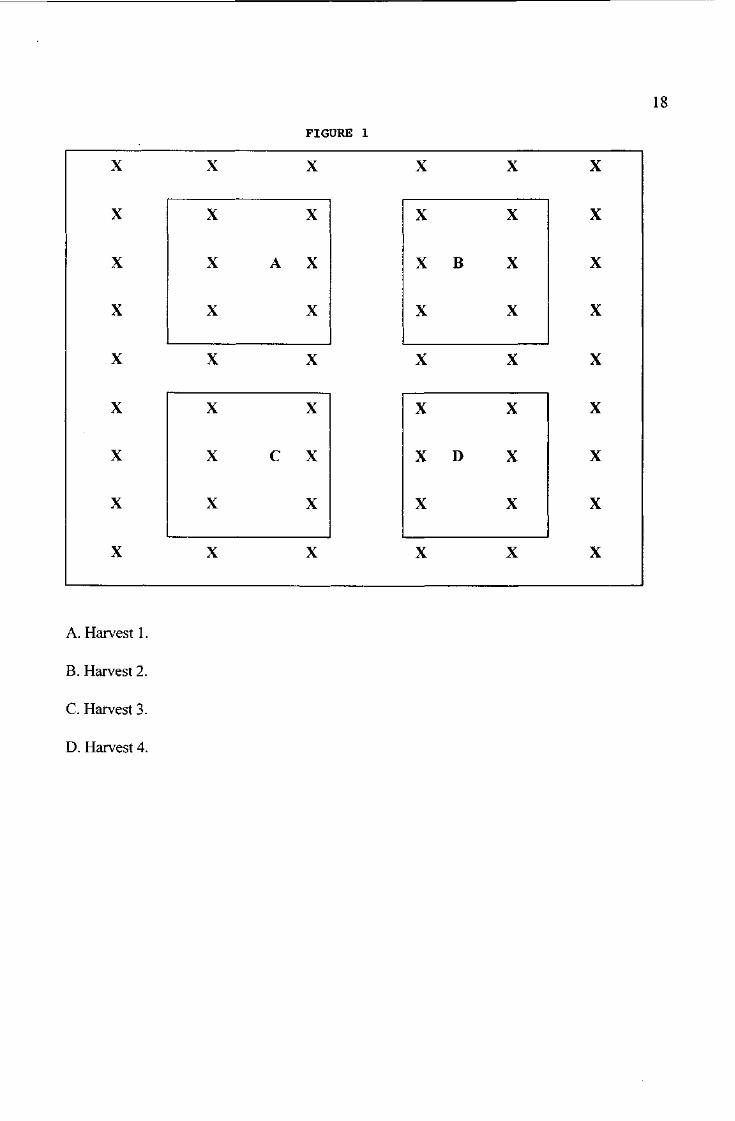
FIGURE 1
X
X
X X X X X
X
X
X X X X X
X
X
X X A X X B X X
X
X
X
X X X X
XX
X
X
X
X
X X X X
XX
X
X
X
X X X X X XX
X
X X C X X D X X
X
X
X X X X X
X
X
X X X X X
X
X
A. Harvest 1.
B. Harvest 2.
C. Harvest 3.
D. Harvest 4.

FIGURE 2
Mid August Mid Aug + E Mid Aug + ~
Mid Sept Mid Sept + E Mid Sept + D
Mid Oct Mid Oct + E
° Ambient • Soil (10 cm}
_L _L _L 260 280 300 320 340 360 260 280 300 320 340 360
Julian day

20
FIGURE 3 70
1) fi 60 o N x; 50 t-<U o 40 o x: o 30 c di
20 u a.
10 700
"s 600 ; _ •
X 500 E 3 C 400
Xl o c 300
200
10000 '—-*> "oh 8000 1-—' +_.
•$• 6000 JZ
<S1
<U <£ 4000 N
X
-n 2000 tD v-
X f7 0
. 1 . 1 . 1
I . I . I . I
D
i . i i . i '
i . i . i . i . i . r - , i . i
11000
10000
9000
8000
7000
6000
5000
4000
3000
260
240
220
200
180
160 140 3600
3200
2800
2400
2000
1600
1200
800 30 40 50 60 70 80 90 100 30 40 50 60 70 80 90 100
Julian day
Mid Aug Mid Sept Mid Oct

21
F I G U R E 4
.29
? -O o c
30 40 50 60 70 80 90 100 30 40 50 60 70 80 90 100
Julian day

22
FIGURE 5 60
50
40
30
20
10 700
600
500
400
300
200
8000
6000
4000
2000
• 1 , 1 , 1 , 1 , 1 , 1 , 1 , 1
if. i , i
i . i . i . i . i . i . i . i
i , i . i , i , i , i , i I i i i i i , i . i i i i i i r
11000
10000
9000
8000
7000
6000
5000
4000
260
240
220
200
180
160
140 3600
3200
2800
2400
2000
1600
1200
30 40 50 60 70 80 90 100 30 40 50 60 70 80 90 100
Julian day
* Mid Aug
° Mid Aug + Ethrel
" Mid Aug + Desic

Fibred rhiz fresh wt (g/M ) 2
Knob number/M P
O O O O O O O O O t O W U U * ^ U i U l U \ O O O O O O O O O O ( ^ O t - A O l y i O ^ O >— O O O O O O O O O O O O O O O O O O O
< •* a
?. 2 2 Ei &! 5J
C/3
+ + a a
3
o 4^ o
o ON
o ~J
o 00
o VO
o o o o 4^
o
o ON
o o 00
o • o o o o
T~ ~r
tn
i
T
i-- — tO K) O <~f\ O <*Si o o o o o o o o
U) U) o ui o o o o
o to o o o
H- *- *- tO tO 4 - ON 00 O tO O O O O O O
t o to O J 4s. ON O
O O O
Choice rhiz fresh wt (g/M ) Shoot number/M

FIGURE 7
o N
70
60
-£ 50
o o
40
r 30
a.
X)
£ 3 C X) o e
I
20
10
500
400
300
200
6000
4000
2000
-a 4)
LL.
c
- E
oh _L _L
Mid October Mid Oct + Ethrel
i . i . i . i . i . i . i
i . i . i . i . i . i . i . i
8000
7000
6000
5000
4000
3000
240
220
200
180
160
140
3500
3000
2500
2000
1500
1000
s o N
U X>
s 3 C o o CO
N
a> u 'o
u 30 40 50 60 70 80 90 100 30 40 50 60 70 80 90 100
Julian day

25
FIGURE 8
30 40 50 60 70 80 90 100 30 40 50 60 70 80 90 100
Julian day
• mid Aug
° mid Aug + Ethrel • mid Aug + Desic D mid Sept T mid Sept + Ethrel ' mid Sept + Desic
A mid Oct A mid Oct + Ethrel

26
FIGURE 9
0 20 40 60 80 100 0 20 40 60 80 100
Julian day

SECTION 5
The effect of temperature on growth and fibre development in potted ginger plants

1
THE EFFECT OF TEMPERATURE ON GROWTH AND FIBRE DEVELOPMENT IN
POTTED GINGER PLANTS {Zingiber officinale. Rose)
G. M. Sanewski
Queensland Department of Primary Industries, Box 5083, SCMC, Nambour, Qld 4560.
Australia.
Summary. 25715°C was the most favourable temperature regime for growth of ginger
plants. Both shoot and rhizome growth were greatest at these temperatures.
Ginger plants appear very sensitive to changes in temperature. Temperature regimes of
20710°C and 30720°C decreased growth substantially despite being only 5°C lower and
higher respectively.
25715°C was the best temperature for the production of choice grade rhizome although
temperature appeared to have only a minor effect. Very high temperature (35725°C)
appeared the most detrimental through a relatively greater depression in the growth rate of
fresh weight choice rhizome compared to fibred rhizome.
Rhizome fibre content followed a similar trend as total plant dry weight.

2 Temperature did not have a substantial effect on the rate of decline of percentage choice
grade rhizome.
Introduction
The Australian ginger industry produces over 5,500 tonnes of ginger annually. Over 60%
of this is used in processing with the highest demand being for ginger with a low fibre
content. Ginger of this quality is called choice grade ginger. To be suitable, 45% to 35% of
the fresh rhizome should be free of fibre as indicated by the blunt knife technique (Whiley,
1980).
The ginger rhizome is approximately 60% grown when it reaches 45% choice grade. This
is when harvesting commences. Fibred rhizome usually increases faster than new rhizome in
this period so the percentage of choice grade rhizome declines. It declines from 45% to 35%
choice grade over approximately 10-14 days. To achieve maximum yield of choice grade
rhizome, growers must therefore harvest their entire crop within this 10-14 day period.
A greater understanding of the development of fibred rhizome with a view to its prediction
or control would be of great advantage to the industry.
Temperature has been shown to have a strong effect on ginger plant growth. Anderson et
al., (1990) demonstrated a cumulative yield increase of 25% over two seasons where
maximum leaf temperature was reduced from 35° to 28°C.

3 Haque (1974) found 25°/20°C as the optimum temperature regime for ginger growth. In
Haque's study, higher temperatures (30°/25°C) favoured shoot growth over rhizome growth.
An even higher temperature (35°C) was shown to cause permanent leaf damage which lasted
over an extended period. Similarly, exposure to low temperature (10°C for 10 hours) caused
a temporary, but extended, reduction in photosynthesis. Temperatures higher than the
optimum are more likely to occur around early harvest time than lower temperatures. It is
more likely therefore that high temperatures around early harvest could limit yield
development. However, Whiley (1980) in his study of growth of ginger suggested that low
temperature reduced choice grade recovery. Also, there is no mention in any of these
previous studies on the effect of temperature on fibre development.
This study was designed to examine the response of rhizome fibre development in particular
in potted ginger plants subjected to either of four different ambient temperature regimes.
Materials and Methods
Mature rhizomes of the ginger cultivar 'Queensland' were harvested in early July 1993.
The rhizomes were washed, cut into pieces weighing 50-70g and dipped for 1 minute in a
solution of 1 g/L Bavistin R (0.5 g/L benomyl). Treated pieces were air-dried for 7-10 days
before planting in styrofoam trays in a temperature controlled, naturally-lit glasshouse. The
maximum day and minimum night temperatures were maintained at 30°/20°C. Relative
humidity fluctuated between 60% and 100%. At the onset of germination the most uniform
plants were selected and planted, 1 each, into 5 L plastic pots containing a sand, sawdust and
peat potting mix in the ratio 2:1:1 and a mixture of solid fertiliser.

4
At 110 days after planting (DAP) 9 plants were harvested and 24 plants were placed in each
of 4 temperature control rooms set at 30°/20°C. Over a period of 10 days these temperatures
were gradually changed to the treatment temperatures (acclimatisation period). The treatment
temperatures of 35°/25°C, 30°/20°C, 25°/15°C and 20°/10°C were then maintained for 33
days (treatment period). 6 plants were harvested from each room after 12 days (122 DAP),
22 days (132 DAP) and 33 days (143 DAP).
At each harvest plants were divided into leaf, stem, rhizome, seed-piece and roots. Fresh
weights for each plant component (except roots), leaf area, flower stalk number, rhizome
knob number and percentage choice grade rhizome were determined before samples were
dried in a forced draft oven at 60°C.
Percentage choice grade rhizome was determined using the method described by Whiley
(1980).
The dried fibred and choice grade rhizome samples were bulked, ground to a particle size of
< 1 mm and the fibre content determined according to the neutral detergent fibre (NDF)
method of Nahm (1993).
The experiment was a completely randomised design with 6 replicates of 4 treatments. All
data was analysed in the statistical software program 'Statistix'. One way analysis of
variance was used to determine the significance of treatment effects.

5
Results
The trends in dry weight for each plant component are shown in figure 1. Figure 2 shows
the trend in total dry matter (TDM) and various indicators of rhizome development.
Figure 1
Figure 2
All treatments increased in TDM over the 33 day experimental period. 25°/15°C produced
significantly more TDM than all other treatments. While there were no additional significant
differences between treatments with respect to TDM, there was a general trend with 207lO°C
producing the least TDM.
Shoot growth
At day 143, 25°/15°C had produced more total shoot dry weight than all other treatments.
This was comprised of a greater stem dry weight and a greater leaf dry weight. There were
no differences between treatments in the percentage of shoot dry weight apportioned between
leaf and stem.
35°/25°C produced leaves with a slightly higher specific leaf area (253 g/cm2) than those at
25°/15°C (224 g/cm2)).
Rhizome growth
25°/15°C produced a greater rhizome dry weight than all other treatments. There was also a
significant difference between treatments in the way rhizome dry weight was apportioned to
choice and fibred portions.

6
25°/15°C produced greater choice rhizome dry weight than all other treatments. All other
treatments made only small gains in choice rhizome dry weight over the experimental period.
25°/15°C produced a greater fibred rhizome dry weight than 30°/20°C only. 30°/20°C had
produced the least fibred rhizome dry weight increase of all the treatments. All treatments
produced more fibred rhizome than choice rhizome.
The trend in percentage choice rhizome was slightly different for different treatments.
There was an increase in percentage choice rhizome for all treatments over the first 12 days
in which plants acclimatised. It then declined sharply for all treatments. 35°/25°C exhibited
the greatest decline and 25°/15°C exhibited the least decline at day 132.
At day 132, 25°/15°C had produced more knobs than 207lO°C. By day 143, there were no
significant differences between treatments.
The moisture contents for fibred and choice grade rhizome are shown in figures 3A and 3B.
Figure 3
Rhizome fibre content
Neutral detergent fibre analysis for whole rhizomes are shown in figure 4A in g/plant and in
4B as a % of rhizome dry weight.
Figure 4
Root growth
25°/15°C produced a greater root dry weight at day 143 than 20°/10°C.

7
The root:shoot ratio was similar for all treatments at day 113. There was a general trend
over the 33 day experimental period for the ratio of roots:shoots to increase.
Discussion
Acclimatisation period
Some different trends are evident in the acclimatisation period as that in the period after the
final treatment temperatures were reached. The optimum temperature (25°/15°C) produced a
steady increase in all plant components throughout the acclimatisation period and treatment
period. Other treatments grew better in the acclimatisation period than during the treatment
period. The 2 warmest temperature regimes tended to produce the fastest fibre development
(and rhizome dry weight) in the acclimatisation period.
Treatment period
Rhizome fibre development responded to temperature as did total plant dry weight. Fibre
development is therefore a function of total plant assimilate production. 25°/15°C was the
most favourable temperature regime for fibre development but also favoured choice rhizome
production. In general these results agreed with that of Haque (1974) although he used
slightly different maximum and minimum temperature combinations.
Percentage fibre exhibited a decrease over the period to day 132, even though fibre growth
continued. While not measured this can only be because accumulation of other rhizome dry
matter components was greater than fibre. The likely predominant component is starch.

8 Starch usually comprises 20-30% of the rhizome dry weight around early harvest and is
increasing (Ratnambal et al, 1987).
Plants in the 2 warmer treatments increased in % fibre over the final 11 days. This is
probably also due to a decrease in starch and not because of a sudden increase in fibre
growth. Supporting evidence is seen in the trend for moisture content of fibred rhizome.
The % moisture content of fibred rhizome of 35°/25°C plants increased over the last 11 days.
This can also be due to a decrease in starch content rather than a real increase in moisture.
For the same reason 30°/20°C plants tended to have a higher fibred rhizome moisture content
over the majority of the experimental period.
Temperatures cooler than the optimum resulted in a lower percentage of choice grade
rhizome (on a dry weight basis) because new rhizome growth was more sensitive to
temperature than growth of the fibred portion. Fibred rhizome growth at low temperature is
thought to be mainly the result of assimilate deposition possibly by translocation from other
areas and not enhanced fibre development.
Rhizome dry weight was less affected by low temperature than shoot dry weight. This is to
be expected. In field grown ginger, rhizome bulking continues well into the winter period
long after shoot production has ceased and senescence has commenced (Whiley, 1980; Diara,
1957). This rhizome bulking is not growth of new rhizome but rather assimilate deposition
probably translocated from the senescing shoots. The switch from growth of new rhizome to
9 bulking of old rhizome is most likely influenced by several environmental factors particularly
day length.
Conclusion
While temperature was shown to affect yield of choice grade rhizome substantially, it does
not appear to have a major affect on the decline of percentage choice grade rhizome. The
rate of decline in % choice grade rhizome tends to be more dependant on the rate of starch
deposition in the fibred rhizome relative to the production of new knobs rather than the rate
of fibre development.
The average maximum and minimum temperatures for Nambour in February and March for
the 40 years from 1955 to 1995 were 29°/21°C and 28°/18°C respectively. More specifically,
the maximum and minimum temperatures at early harvest towards the end of February are
generally around 27°/19°C. These temperatures are very close to the optimum for ginger. It
is more likely to encounter temperatures higher than the optimum rather than lower than the
optimum at this time of the year. Low temperature around early harvest is not therefore
thought to influence the rate of decline of % choice grade rhizome. It could however reduce
the yield of choice grade rhizome as could high temperature. Also, even at temperatures
favourable for new rhizome growth, a decline in % choice grade rhizome still occurs,
probably through the influence of day length.

10 References
Anderson, T., du Plessis, S.F., and Scholtz, A. (1990). Evaporative cooling of ginger
(Zingiber officinale). Acta Horticulturae. 275:173-179.
Haque, A. (1974). Leaf physiology adaption of ginger (Zingiber officinale) to climate in
Queensland. Ph.D. Thesis. University of Queensland.
Menzel, CM. (1985). The control of storage organ formation in potato and other spices: A
review. Part 1. Field Crop Abtracts. 38(9):527-537. Part 2. Field Crop Abstracts
38(10):581-606.
Nahm, K.H. (1992). Practical guide to feed, forage and water analysis. Yoo Han Publishing
Inc. 269 pages.
Ratnambal, M.J., Gopalam, A., and Nair, M.K. (1987). Quality evaluation in ginger
(Zingiber officinale Rose.) in relation to maturity. J. of Plantation Crops. 15(2): 108-117.
Whiley, A.W. (1980). Growth and fibre development of ginger (Zingiber officinale Rose.) in
South Eastern Queensland. Aust. J. Exp. Agric. Husb. 20:608-612.

11 Figure captions
Figure 1. Trends in leaf dry weight (A), stem dry weight (B), total rhizome dry weight (C),
root dry weight (D), fibred rhizome dry weight (E), and choice rhizome dry weight (F) over
the period from 110 to 143 days after planting. Each data point represents the mean of 6
plants. LSD bars are shown (P<0.05).
Figure 2. Trends in knob number (A), % choice rhizome on a fresh weight basis (B), fibred
rhizome fresh weight (C), choice rhizome fresh weight (D), and total plant dry weight (E)
over the period from 110 to 143 days after planting for plants grown at 4 different
temperature regimes. Each data point represents the mean of 6 plants. LSD bars are shown
(P<0.05).
Figure 3. Trends in fibred rhizome moisture content (A) and choice rhizome moisture
content (B) over the period from 110 to 143 days after planting for plants grown at 4 different
temperature regimes. Each data point represents the mean of 6 plants. LSD bars are shown
(P<0.05).
Figure 4. Trends in total rhizome fibre in grams (A) and as a % of total rhizome dry weight
(B) over the period from 110 to 143 days after planting for plants grown at 4 different
temperature regimes.

Fibred rhiz dry vvt (g) Rhizome dry we
O K > * - 0 \ 0 C O t O * . O
o
«< —
o
O — N> OJ .fc. <^i <3\ © N> j . _ .
Choice rhiz dry wt (g) Root dry wt
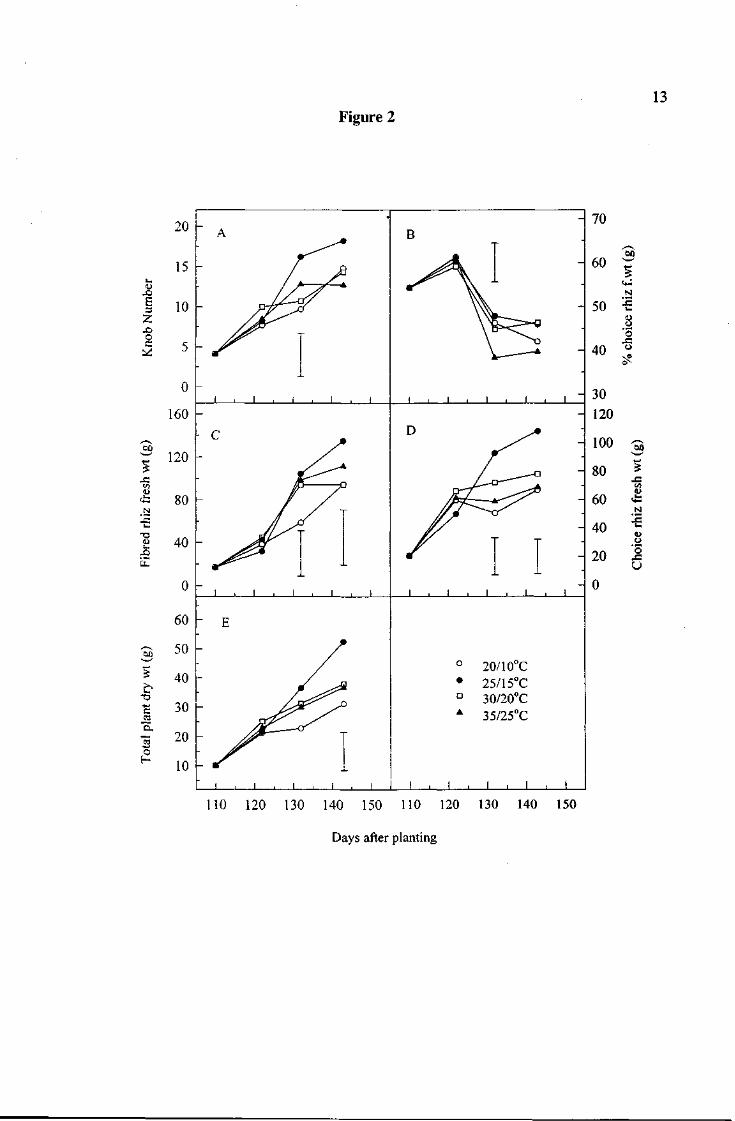
Figure 2 13
20
15
10
5 -
160 -
120
80
40
0 -
60
50
40
30
•a 20
10
° 20/10°C • 25/15°C D 30/20°C A 35/25°C
J_ _L J_
70
60
50
40
30
120
100
80
60
40
20
0
110 120 130 140 150 110 120 130 140 150
Days after planting

Figure 3 14
95 A T T B -
94 -Ns= X -1- -
93
_ o 207lO°C^ • ^ ^ ^ ^ ^ -
92 _ o 207lO°C^ ^ ^ -
91 • 25715°C T D 30720°C
90 1 -
35725°C ! , i 1 , 1 , 1 , 1 i 1
98
97 E ^ • ^
96 izo C
J3 c o 95 ice
94 Cho
istu
r
- 93
110 120 130 140 150 110 120 130 140 150
Days after planting

Figure 4. 15
6r
4
2 1-
1
° 20°/10°C
• 25°/15°C D 30°/20°C 4 35°/25°C
110 120 130 140 150
Days after planting

SECTION 6
Effect of mild water deficit on assimilate partitioning, fibre development and water relations of potted ginger plants
1
EFFECT OF MILD WATER DEFICIT ON ASSIMILATE PARTITIONING,
FIBRE DEVELOPMENT AND WATER RELATIONS OF POTTED GINGER
(Zingiber officinale Roscoe) PLANTS
G. M. Sanewski
Queensland Department of Primary Industries, Box 5083, SCMC, Nambour, Qld 4560,
Australia.
Summary. Mild water stress for a short duration did not affect fibre development relative to
choice rhizome growth.
Despite a declining leaf water potential, water stressed plants developed osmotic adjustment
in the roots. This was critical for continued water uptake by these plants. The experimental
period was of insufficient duration to measure changes in dry matter partitioning as a
consequence of the root osmotic adjustment.
It is proposed that root osmotic adjustment is a mechanism to help maintain rhizome
moisture content. It is believed this is to protect the viability of the below-ground dormant
meristems.

2 Introduction
The Australian ginger industry supplies the majority of the small but high value
international markets for high quality confectionary products based on ginger. Quality of the
ginger in terms of fibre content is important as is yield for profitability. It is desirable
therefore to understand fibre development and how it responds to the environment and
cultural operations. This paper examines the response of fibre development and plant water
relations to mild water deficit.
Ginger is known to be very sensitive to water deficit (Haque, 1974). It is commonly
considered within the ginger industry that water deficit leads to an increase in fibre
development. The affect of severe water deficit on assimilate partitioning, fibre content and
plant water relations was investigated by the author in a previous study. That study indicated
that fibre development was impeded by severe water deficit. It was also demonstrated that
assimilate partitioning to fibred and non-fibred portions of the rhizome had more effect on the
percentage of choice grade rhizome than the development of fibre relative to rhizome growth.
In addition to the above important findings, it also indicated the possible existence of osmotic
adjustment in the roots.
Osmotic adjustment in plant roots is not a recent realisation but has been rarely investigated.
Studies of plant water relations are more often concerned with the response of the leaf rather
than the roots. It is usually assumed that leaf water relations are of more significance to plant
survival or productivity or that if osmotic adjustment exists in the leaf, it exists in the roots as

3 well. There are of course fundamental differences between the physiological effect of
osmotic adjustment in the root and in the leaf.
Osmotic adjustment in the leaf maintains leaf turgor and allows shoot growth to continue
(Wilson et al, 1980; Santamaria et al, 1990; Hsiao et al, 1976). Leaf osmotic adjustment in
sorghum cultivars has been shown to increase grain number and grain yield where water
deficit occurred before anthesis. This resulted from a higher distribution index (DI). More
specifically the osmotic adjustment increased root length density and allowed panicle
exsertion which in turn reduced spikelet abortion (Santamaria et al, 1990). Where water
deficit occurred after anthesis, leaf osmotic adjustment increased grain size through a higher
DI (Ludlow et al, 1990). Tangpremsri et al (1990) indicated that leaf osmotic adjustment in
sorghum is also related to a higher root length density and a high dehydration tolerance to
give a longer sustained green leaf area. Sustained green leaf area allowed the plant to
translocate assimilates which were fixed before the water deficit.
In some tropical grass forage species, leaf osmotic adjustment enables stomata to stay open
and photosynthetic activity to continue. This increases productivity in the early stages of
water deficit but gives rise to greater water deficits. It does not therefore necessarily improve
leaf survival (Wilson et al, 1980). Osmotic adjustment in roots usually leads to a shift in the
ratio of roots to shoots (Hsiao et al, 1976).
Root osmotic adjustment has been shown to exist in Artemisia tridenta (Bassiri Rad and
Caldwell, 1992), Cotton (Oosterhuis and Wullschleger, 1987), Maize (Voetberg and

4 Sharp, 1991; Sharp and Davies, 1979: Spollen and Sharp, 1991), Pea (Hsiao et al, 1976) and
Lupins (Turner et al, 1987).
This study was initiated to determine if osmotic adjustment existed in the leaf and roots of
ginger plants and to establish the plants response, in particular fibre development, to mild
water deficit.
Materials and Methods
Mature rhizomes of the ginger cultivar 'Queensland' were harvested in early July 1992.
The rhizomes were stored in a coolroom at approximately 4°C for 1 week to remove
dormancy (Whiley, personal communication). The rhizomes were then cut into pieces
weighing between 50 g and 70 g and dipped for 1 minute in a fungicide solution of 1 g/L
'Benlate' R (0.5 g/L benomyl). Treated pieces were air-dried for 1 day before planting in
moist sawdust in a naturally-lit glasshouse.
The glasshouse day/night temperatures were maintained at 30°/18°C by thermostatically
controlled evaporative coolers. Relative humidity fluctuated between 60% and 100%.
After 2 weeks, germinating rhizome pieces were planted 1 each into 8 L plastic pots
containing 12 kg of air-dry potting mix in the ratio 1 sand:l soil and a mixture of solid
fertiliser. At field capacity each pot contained about 1800 ml of water. This was equivalent
to 14.3% moisture content on an oven-dried basis and 10.2% on an air-dried basis.

5 The experiment was a completely randomised design with 8 replicates of 2 treatments. The
treatment regime is shown in table 1.
Control plants were watered about every 2 days with sufficient water to bring the potting
mix to field capacity.
All pots were contained in plastic bags which were loosely closed around the plant stems to
reduce evaporative losses.
Measurements
Osmotic potential along root length
Preliminary investigations were conducted into the variation of osmotic potential along the
root length. This was necessary to establish a site for subsequent sampling. 13 week old
ginger plants grown in polystyrene trays in a heated glasshouse were used. Measurements
were made at the root tip, mid-way along the root and at the base of the root. 16 samples
were taken from each site. This study was completed before the commencement of the main
trial.
Harvests
Harvests were conducted on day 1, 9 and 15. At each harvest, plants were divided into
leaf, stem, rhizome, seed-piece and roots. Fresh weights for each plant component (except
roots), leaf area, and percentage choice rhizome were determined before samples were dried
in a forced draft oven at 60°C.

6
Leaf area was measured on a leaf sub-sample using a Li-Cor planimeter.
The moisture contents (%) of the choice and fibred rhizome and seed-piece were calculated
from fresh weight and dry weight data.
Soil moisture was determined by weighing a sub-sample of potting mix before drying in an
oven at 60°C for greater than 48 hours and re-weighing.
A soil moisture/pressure curve for the same potting mix was determined using pressure
plate apparatus (figure 1).
Figure 1
The percentage of choice grade rhizome was obtained using the 'blunt knife' technique
described by Whiley (1980). Dry weights for fibred and fibre-free portions were also
determined.
Relative growth rate was calculated from the following equation (Milthorpe and
Moorby, 1988).
RGR (d/day) = QnW2 - InW^
(t2 - t,)
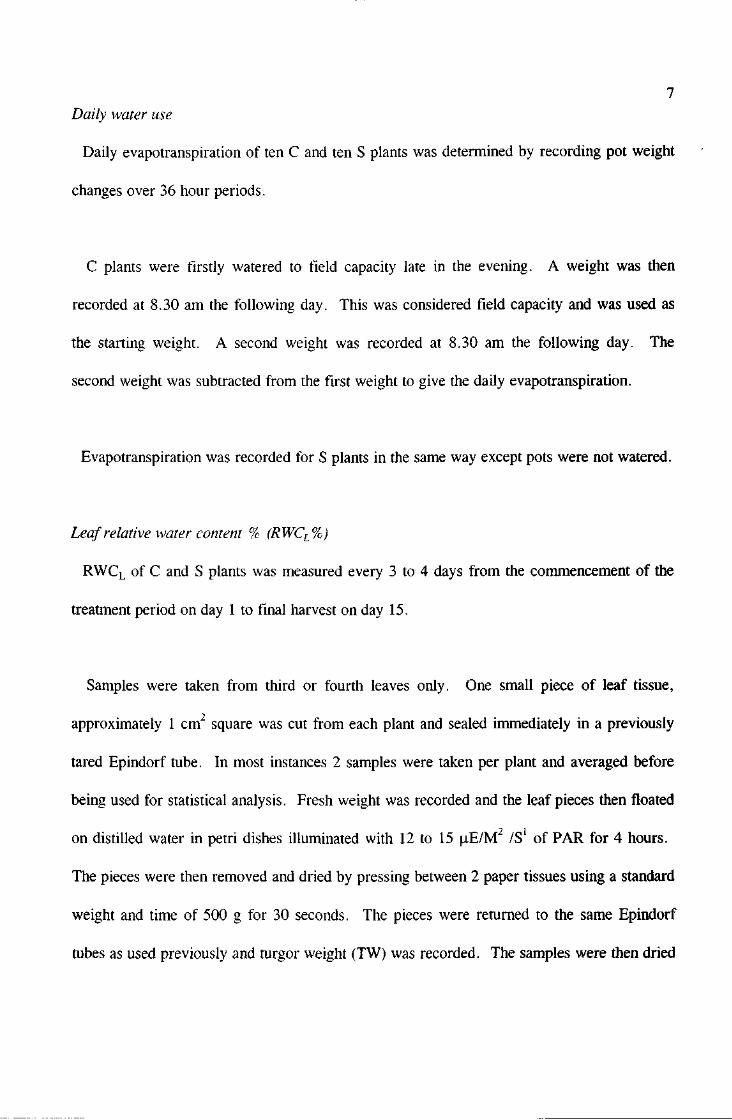
7 Daily water use
Daily evapotranspiration of ten C and ten S plants was determined by recording pot weight
changes over 36 hour periods.
C plants were firstly watered to field capacity late in the evening. A weight was then
recorded at 8.30 am the following day. This was considered field capacity and was used as
the starting weight. A second weight was recorded at 8.30 am the following day. The
second weight was subtracted from the first weight to give the daily evapotranspiration.
Evapotranspiration was recorded for S plants in the same way except pots were not watered.
Leaf relative water content % (RWCL%)
RWCL of C and S plants was measured every 3 to 4 days from the commencement of the
treatment period on day 1 to final harvest on day 15.
Samples were taken from third or fourth leaves only. One small piece of leaf tissue,
approximately 1 cm2 square was cut from each plant and sealed immediately in a previously
tared Epindorf tube. In most instances 2 samples were taken per plant and averaged before
being used for statistical analysis. Fresh weight was recorded and the leaf pieces then floated
on distilled water in petri dishes illuminated with 12 to 15 uE/M /S of PAR for 4 hours.
The pieces were then removed and dried by pressing between 2 paper tissues using a standard
weight and time of 500 g for 30 seconds. The pieces were returned to the same Epindorf
tubes as used previously and turgor weight (TW) was recorded. The samples were then dried

8 in the same Epindorf tubes for dry weight (DW) determination. Percent leaf relative water
content (RWCL%) was calculated using the equation,
RWCL % = FW-DW x 100
TW - DW
Water potential
Leaf water potential (i|/L) was calculated from measurements made using 15 Wescor C-52
sample chambers connected to a 15 channel automatic scanning Wescor HP-115 Hygrometer
in the dew-point mode. Calibration curves were prepared for each chamber using standard
osmolality solutions of 100, 300 and 1000 mmol/kg sodium chloride. Regressions on
calibration data points all had an R2 of 0.99 or 1.0.
All readings were taken in a controlled temperature room set at 24°C. 6 to 10 readings with
an interval of 30 minutes were taken for each sample and the means calculated.
For the measurement of i|/L , whole leaves were removed from the plant between 12.00pm
and 1.00pm and immediately wrapped in plastic cling film and aluminium foil. In the
laboratory 2 discs of 0.95 cm were punched from each leaf and each placed in a sample
chamber. Two hours were allowed for thermal and vapour equilibration before readings
were commenced. These 2 readings per plant were then used to calculate a mean for each

9 plant sampled before statistical analysis was performed. Each treatment mean was therefore
the result of 2 samples from each of 4 plants per treatment.
Osmotic potential
Samples for the measurement of nL were taken at the same time as for RWCL%. Whole
leaves were collected and wrapped as for \\iL but were frozen immediately in liquid nitrogen.
In the laboratory the samples were thawed and allowed to equilibrate to room temperature
over about 30 minutes. Two 0.95 cm2 discs of lamina were punched from each leaf just
adjacent to the midrib. Each was sealed in a separate chamber. The practice of measuring n
on thawed tissue rather than extracted sap follows the procedure of Morgan (1992). The
sample chambers were allowed to equilibrate over approximately 2 hours before readings
were commenced. Two measurements were taken on each of 4 to 7 plants per treatment.
The means were calculated for each plant before the data was used for statistical analysis.
7iL of S plants was adjusted for RWCL% using the following equation cited by Morgan
(1984);
Adjusted n L = RWCL% (C plants') X nL
RWCL% (S plants)
The osmotic potential of roots (7iR) was also obtained at each harvest. The same basic
technique was used as for leaves. Samples about 1 cm long were taken at each harvest from
the tip of fleshy roots about 2 mm to five mm thick at their base. To avoid contamination

10 with solutes from the potting mix, the epidermis was scraped from the root with a scalpel
before the sample was wrapped and frozen in liquid nitrogen. In some cases the samples
were stored in a freezer for measurement at a later time. Two samples were taken from each
of 7 plants per treatment. The 2 samples for each plant were averaged. Only means for each
of the 7 plants per treatment were used for statistical analysis.
Rhizome samples for the measurement of osmotic potential (TCRHIZ) w e r e taken at the same
time as root samples. A small cube of tissue was excised from within the choice and fibred
rhizome of each plant. The samples were wrapped and frozen as for roots.
Samples for the determination of root water volume were taken at the same time as those for
7iR. Two samples from each plant were collected as for % and each placed in a separate and
previously tared Epindorf tube. These samples were dried in an oven at 60 C for 24 hrs.
Root osmotic adjustment
Root osmotic adjustment was calculated using the procedure of Bassiri Rad and Caldwell
(1992). This approach used Van't Hoff's equation (Salisbury and Ross, 1985) and
measurements of root tip water content to calculate root tip osmolality on a dry weight basis.
The value for C plants was subtracted from that of S plants to give the osmotic adjustment in
osmolality/Kg root dry mass.

11
Example
Root tip water volume
From a root tip sample fresh weight (FW) of 0.1275 g and a dry weight of 0.0068 g (DW).
Root tip water volume (cm3H20/Kg DW) = VDW (FW-DW)
= Vo.0068 (0.1275-0.0068)
= 17.75 cm3H20/Kg DW
Root tip solute concentration (Van't Hoffs equation)
• i r r ,
- m i — /RxTxlOO
-mi = root tip solute cone (moles of solutes/ lOOOg H20)
icr = osmotic potential of root tip (MPa)
R = gas constant (0.0083 lL/MPa/mol/K)
T = absolute temperature in K (degrees C + 273)
If 7tr was measured at 1.2 MPa in an hygrometer sample chamber at a temperature of 24° C,

12
-mi = 1.2/0.00831 x 297
= 0.4862 osmol. 1000 cm"3
Osmolality/Kg root dry mass = 17.75 cm3H20/Kg DW x -0.4862 osmol/1000 cm3
= -8.63 osmol/Kg root dry mass
Osmotic adjustment (osmol/Kg) = osmol/Kg for S plants - osmol/Kg for C plants
Statistical analysis
All data was analysed using the statistical software program Statistix. One way analysis of
variance was used to determine the significance of treatment effects.
13 RESULTS
Dry weights
Dry weights for all plant components are shown in table 2. From table 2, leaf and choice
rhizome dry weight of C plants decreased slightly over the 15 day experimental period but
dry weight of all other plant components increased except seed dry weight. The greatest
increases were in rhizome and roots. Roots and fibred rhizome also had the highest relative
growth rates. Choice rhizome, leaf and seed-piece had the lowest relative growth rates. S
plants had a similar growth pattern except shoot growth in particular was substantially greater
although not statistically different. Roots and fibred rhizome had the highest relative growth
rates in S plants.
The percentage choice fresh weight was similar for both treatments. Percentage choice
declined at about 1.2% per day over the 15 day period. Despite the lack of significant
difference in fresh weight percentage choice, there was a difference between treatments in
percentage choice on a dry weight basis at day nine. S plants had a higher percentage of dry
weight choice grade rhizome at this time because they produced less fibred rhizome.
Plant water relations
Leaf and root water relations measurements are shown in table 3.
Leaf
After 15 days v|/L rose in C and S plants but there were no significant differences between
treatments. This rise in \\iL was accompanied by a decline in RWCL%. In S plants it was

14 also accompanied by an increase in nL at day 15. Adjusted nL was lower in C plants
compared to S plants at day 15.
Surprisingly, TL and RWC%L were marginally but significantly higher in S plants at day 4.
As expected, TL declined considerably in S plants at day 15.
TCR declined in both treatments over the experimental period with a trend to S plants having a
slightly lower value (not significant),
Rhizome and root
^RHIZ f° r b ° m C and S plants was generally lower in fibred rhizome compared to choice
rhizome. nmiz in S plants increased in choice rhizome but did not change in fibred rhizome.
Measurements of osmotic potential along the root length showed a decreasing gradient from
the base of the root to its tip. The results are shown in table 4. The root tip was used for
subsequent sampling.
Osmotic adjustment values for roots and rhizome are shown in table 5. From table 5 a root
osmotic adjustment of -1.8 osmol/Kg root dry weight occurred after 15 days. There was no
significant difference in osmolality values for choice or fibred rhizome although there was a
trend for choice rhizome values in S plants to decline.

15 The moisture content (% on oven dry basis) for seed-piece, choice rhizome and fibred
rhizome is shown in table 6.
There were no differences in moisture content between treatments in seed-piece, choice or
fibred rhizome. The general trend was for the seed-piece moisture content to remain
unchanged while choice rhizome moisture declined and fibred rhizome moisture increased
slightly.
Soil moisture
The trend in soil moisture at several times over the 15 day treatment period is shown in
table 7.
From table 7, the potting mix moisture content of S plants had decreased to 9 % after 8
days and 3 % after 15 days.
Pot evapotranspiration is shown in table 8.
Water use had declined slightly in C plants probably due to the decline in leaf growth.
Evapotranspiration in S plants had declined significantly by day 4.
DISCUSSION
The trend in growth of each plant component has been documented previously (Whiley,
1980). The general trend in the period preceding early harvest is for the rhizome growth rate

16 to increase and shoot growth to cease and even decline. This general trend was observed
over the experimental period in this study. However, while leaf growth ceased, stem dry
weight increased slightly indicating it is less sensitive to mild water deficit than leaf growth.
Fibred rhizome and roots had the highest relative growth rate.
Previous work (Sanewski, unpublished) demonstrated a decrease in dry weights of all plant
components with severe water stress over the same phenological period. There were no
significant differences in dry weight components between C and S plants at day 15 in this
study. This indicated the level of stress imposed was relatively mild.
The percentage choice grade rhizome declined at a similar rate in C and S plants. Mild
water stress does not therefore increase fibre development relative to choice rhizome growth
as commonly thought by growers.
Water relations
Leaf
The higher TL and RWCL% values for S plants at day 4 suggests these plants had reduced
their water loss and hence water deficit even at this early stage of stress. This agrees with
earlier work (Sanewski, unpublished) which demonstrated an increase in stomatal resistance
after only 2 days of withholding water. The difference in TL gradually disappeared until day
15 when TL in S plants was lower (not significant) than C plants. TL was in fact probably
lower in S plants at this time even though a significant difference was not shown. RWCL at
day 14 was similar for C and S plants. The decline in TL that occurred was therefore a result

17
of the increase in nL. This most likely occurred because leaf assimilate in S plants was used
for respiration or translocated for use elsewhere in the plant. It was shown by the author in
previous work that ginger maintains a high RWCL by a high leaf resistance. Photosynthesis
is therefore reduced and leaf assimilates depleted. In addition there is a natural decline in leaf
assimilates in this period (around early harvest time). This appears to be regulated by
endogenous factors and is accompanied by rapid rhizome growth.
Root
From table 7 and figure 1, field capacity occurred at a soil water content of about 12%. On
day 15, S plants would have required a 7iR of -1.0 to -1.5 MPa to extract soil moisture
(figure one). 7rR of S plants was measured at -1.14 MPa at this time. C plants had a 7tR of
only -0.94 MPa and would not have been able to extract water at that soil water content. The
root osmotic adjustment observed (-1.8 osmol/Kg root dry weight) was therefore critical for
continued water uptake by S plants.
Rhizome
There was no osmotic adjustment observed in choice rhizome but there was a small decline
in 7TRHJZ (-0.17 MPa) for choice rhizome in S plants after 15 days of stress. Choice rhizome
represents the growing meristems of the rhizome and it is reasonable to expect osmotic
adjustment to occur. It is possible that the water stress was insufficient after 14 days to result
in osmotic adjustment in choice rhizome. Previous studies (Sanewski, unpublished) indicated
up to 4 weeks stress in similar conditions may be necessary to induce this response. It is also

18 possible that these tissues would not have developed their suberised layer and so would be
more prone to moisture loss than the other fibred portions.
CONCLUSION
No association was seen between root osmotic adjustment and the root:shoot ratio. It is
expected that the short duration of the study did not allow sufficient time for changes to
develop in dry weight components according to treatment. A cyclical stress over say 6 weeks
may have been more effective to observe a change in assimilate partitioning. However, one
of the primary objectives of this study was to investigate the existence of root osmotic
adjustment and to that end was successful.
Percentage choice grade rhizome was also shown to be unaffected by a short duration of
mild water stress (3% ADMC equals a soil water potential of about -1.5 MPa). It is expected
however that even a mild water deficit will decrease the yield of choice grade rhizome if over
a long period. Because ginger has very responsive stomata, even mild water deficits which
could develop quickly in the field and persist over long periods, could easily reduce yields of
choice grade rhizome.
It is likely that root osmotic adjustment in ginger is a mechanism to help maintain rhizome
moisture content. Long term shoot survival is not necessary in ginger for survival of the
plant from season to season. The below ground meristems are probably the most important
organs for survival of the plant. Growth of the dormant meristems can resume when soil

19 moisture is favourable. This was demonstrated in a previous study (Sanewski, unpublished)
where potted plants were stressed for 4 weeks then rewatered for a further 2 weeks.
It is hypothesised that when a prolonged plant water deficit develops the rhizome becomes
the predominant sink for moisture. In this way the dormant meristems, which are all below
the soil surface, are protected from desiccation. This behaviour would be fundamental to a
plant which senesces during the winter only to persist as a dormant rhizome. Mature
rhizomes of ginger which have undergone the winter in the field in South East Queensland
with no irrigation have been shown to have a moisture content of about 86%. The mature
rhizome has a suberised layer just below the epidermis (Paull et al, 1988) which functions to
restrict moisture loss. The mature rhizome is 40-60% starch on a dry weight basis (Van
Beek et al, 1987). It is also proposed that low osmotic potentials could quickly be developed
in the mature rhizome by conversion of the large store of starch to sugars.

20 BIBLIOGRAPHY
Bassiri Rad, H. and Caldwell, M.M. (1992). Root growth, osmotic adjustment and N03
uptake during and after a period of drought in Artemisia tridentata. Aust. J. Plant.
Physiol. 19: 493-500.
Haque, A. (1974). Leaf physiological adaption of ginger {Zingiber officinale Rose) to
climate in Queensland. Ph. D. Thesis. University of Queensland.
Hsiao, T.C., Acevedo, E., Fereres, E. and Henderson, D.W. (1976). Stress Metabolism.
Water stress, growth and osmotic adjustment. Phil. Trans. R. Doc. Land. 273: 479-
500
Ludlow, M.M., Santamaria, J.M. and Fukai, S. (1990). Contribution of osmotic adjustment
to grain yield in sorghum bicolor (L). Moench. Under water-limited conditions II.
Water Stress after anthesis. Aust. J. Agric. Res. 41: 67-78.
Morgan, J.M. (1992). Osmotic components and properties associated with genotypic
differences in osmoregulation in wheat. Aust. J. Plant. Physiol. 19: 67-76.
Milthorpe, F.C. and Moorby, J. (1988). An introduction to crop physiology: University of
Cambridge, p 222.

21
Oosterhuis, D.M. and Wullschleger, S.D. (1987). Osmotic adjustment in cotton (Gossypium
hirsutum L) leaves and roots in response to water stress. Plant Physiol. 84: 1154-
1157.
Paull, R.E., Chen, N. J. and Goo, T.T.C. (1988). Control of weight loss and sprouting of
ginger rhizome in storage. Hortscience. 23(4): 734-736.
Salisbury, F.B. and Ross, C.W. (1985). Plant Physiology. Wadsworth Publishing
Company. California. Pages 37-38.
Santamaria, J.M., Ludlow, M.M. and Fukai, S. (1990). Contribution of osmotic adjustment
to grain yield in sorghum bicolor (L) Moench under water-limited conditions. I.
Water stress before anthesis. Aust. J. Agric. Res. 41: 51-65.
Sharp, R.E and Davies, W.J. (1979). Solute regulation and growth by roots and shoots of
water-stressed maize plants. Planta. 147: 43-49.
Spollen, W.G. and Sharp, R.E. (1991). Spatial distribution of turgor and root growth at low
water potentials. Plant Physiol. 96: 438-443.
Tangpremsri, T., Fukai, S. Fischer, K.S. and Henzell, R.G. (1991). Genotypic variation in
osmotic adjustment in grain sorghum II. Relation with some growth attributes. Aust.
J. Agric. Res. 42: 759-67.
22
Turner, N.C., Stern, W.R. and Evans, P. (1987). Water relations and osmotic adjustment
of leaves and roots of lupins in response to water deficits. Crop Science.
27(5): 977-983.
Van Beek, T.A., Posthumus, M.A., Lelyveld, G.P.. Phiet, H.V and Yen, B.T. (1987).
Investigation of the essential oils of Vietnamese ginger. Phytochemistry. 26(11):
3005-3010.
Voetberg, G.S. and Sharp, R.E. (1991). Growth of the maize primary root at low water
potentials III. Role of increased proline deposition in osmotic adjustment. Plant
Physiol. 46: 1125-1130.
Whiley, A.W. (1980). Growth and fibre development of ginger (Zingiber officinale Rose.)
in south-eastern Queensland. Aust. J. Agric. Anim. Husb. 20: 608-612.
Wilson, J.R., Ludlow, M.M., Fisher, M.S., and Schulze, E.D. (1980). Adaption to water
stress of the leaf water relations of four tropical forage species. Aust. J. Plant.
Physiol. 7: 207-20.

23 Figure captions
Figure 1. The relationship between potting mix air-dried moisture content (%) and pressure
(Mpa) as determined using pressure plate apparatus. The curve was fitted to the data points
using the software program 'Tablecurve'.

Air-dried water content (%)

Table 1. Treatment regimes 25
Treatment Watering regime
Control (C) fully watered
Stress (S) no water from 122 DAP (day 1) to 137 DAP (day 15)

Table 2. Dry weights of plant components at each harvest and growth parameters for 15 day
Day Treatment Shoot Rhizome
Leaf Stem Total Choice Fibred Total % choice
(DW)
1 C 6.1 6.7 12.8 4.4 11.0 15,4 28
9 C 5.6NS 7.6** 13.2NS 2.6NS 15.8NS 18.4NS 14*
s 5.2 5.8 11.1 2.9 13.4 16.4 19
15 c 5.5NS 7 7 N S 13.2NS 2.8NS 15.5NS 18.3NS 15 N S
s 6.0 8.4 15.1 2.3 16.8 19.1 13
RGR (g.day') c -0.007 0.009 0.002 -0.03 0.023 0.012 -
s -0.001 0.015 0.015 -0.04 0.028 0.014 -
Wt change (g) c -0.6 1.0 0.4 -1.6 4.5 2.9 -
s -0.1 1.7 2.3 -2.1 5.8 3.7 _

Table 3. Leaf and root water relations measurements. All potential values are in MPa.
Day Trt't Leaf
12
15
Vi. nL Adj JIL T, Ratio RWQ.%
TW/DW
C - - - 4.6 96
c 0.78NS -1.86NS 1.12** 4.97 Qg**
s -0.71 -2.06 -2.1NS 1.45 4.83 97
c ~0.91NS -1.88NS - ().96NS 4.74 -
s -0.76 -1.82 -1,8NS 1.15 5.12
c -0.86NS -1.82NS - 0.99NS 4.59 95
s -0.62 -1.60 -1.6NS 1.15 4.67 95
c -0.41NS -1.72** . 1.22NS 7,01 59
s -0.58 -1.33 .. 1 }** 0.75 6.90 59

28 Table 4. Osmotic potentials (MPa) for rhizome and roots of 13 week old plants
Rhizome Root
Proximal Mid Distal
-0.88a -0.59c -0.68bc -0.78ab
Table 5. Osmotic adjustment in roots and rhizome. All values are in osmol Kg " root
dry weight.
Day Trt't Root Rhizome
Osmolality osm adj CH FB CH FB
osm adj osm adj
9 C -6.36 - -7.74 -4.14
S -6.56 -0.2NS -7.37 -3.71 0.37NS 0.43NS
15 C -6.64 - -7.35 -3.95
S -8.41 -1.8* -7.67 -3.82 -0.32NS 0.13NS

29 Table 6. Moisture content (%) of seed-piece, choice rhizome and fibred rhizome.
Day Treatment Seed-piece Choice rhiz Fibred rhiz
1 C 86 94 88
C 87NS 96 90NS
88 96 89
15 C 86 80NS 93
S 86 78 93
Table 7. Soil moisture (oven dry weight basis) over the experimental period
Treatment Day 1 Day 9 Day 15
C 14% 11%** 12%**
S 9% 3%

Table 8. Pot evapotranspiration over the fifteen day experimental period.
Day Evapotranspiration
(mis / pot)
C S
2 204 204
4 158* 107
6 196* 147
8 166* 69
12 179* 67
15 - 58

SECTION 7
Effect of water deficit on dry matter production, percentage choice grade rhizome and leaf water relations
of potted ginger plants

1
EFFECT OF WATER DEFICIT ON DRY MATTER PRODUCTION,
PERCENTAGE CHOICE GRADE RHIZOME AND LEAF WATER RELATIONS OF
POTTED GINGER (Zingiber officinale Roscoe) PLANTS.
G. M. Sanewski
Queensland Department of Primary Industries. PO Box 5083, SCMC, Nambour. Qld 4560.
Summary. Ginger plants were grown in a glasshouse for 21 weeks before being subjected to
either of four regimes of water stress. Treatments were four weeks stress (SS), two weeks
early stress (SC), two weeks late stress (CS). and fully watered (CC).
Yield was severely reduced in all treatments where water was withheld. There were however
significant differences between treatments in the magnitude of the response and the changes in
assimilate partitioning that occurred.
Percentage choice rhizome declined at the rate of 0.6% per day in CC plants. The decline in
percentage choice rhizome either ceased or reversed when water was withheld. This
occurred because fibred rhizome was adversely affected by water stress more than choice
rhizome.

2 n
Root and seed-piece dry weight continued to increase in CS plants while all other plant
components declined. It is likely assimilate was translocated from the fibred rhizome to the
seed-piece and roots. Also, the leaf osmotic potential (TTL) increased in of CS plants. This
was attributed to a decline in leaf assimilate levels.
SS plants were able to maintain leaf relative water content at the same value as CC plants for
three weeks but a strong stomatal response was recorded two to six days after water was
withheld. In addition, the osmotic potential of roots (nR) decreased in all stressed plants. It
is not clear whether this decline was due to osmotic adjustment or a direct result of moisture
loss from the roots. This decline in TTR would enhance water uptake where soil water was
limited.
The moisture content of the rhizome and seed-piece of all stressed plants was equal to or
greater than that of CC plants. Rewatered stress plants (CS and SS) developed a greater
moisture content in the rhizome and seed-piece than CC plants.

3
INTRODUCTION
Australia produces about 6.000 tonnes of ginger annually with about 3,600 tonnes used for
processing. The processing industry has a strong demand for highly pungent, low fibre
ginger. About 80% of the product processed is of this type. It is mainly used in the
manufacture of high quality confectionary (J.Ruscoe, personal communication).
To produce choice grade ginger the rhizome is harvested when it is between 42% and 35%
fibre-free by weight (fresh weight). The rhizome is 25 to 28 weeks old and about 60% fully
grown (on a fresh weight basis) at this time (Whiley, 1980). Because rhizome yield is still
increasing rapidly at this time, significant yields could be obtained if fibre development could
be delayed. Even a short delay of one week would lead to a yield increase of up to 4.5 t.ha" .
Despite the effect of fibre development on profitability, it has not been investigated in ginger
to any extent.
Ginger rhizome fibres are actually vascular bundles with a surrounding sheath of fibre cells.
Each fibrovascular bundle contains one or more tracheal elements and a single phloem strand
(Tomlinson. 1969). The fibre sheaths that enclose the vascular bundles in herbaceous
monocotyledons are usually made of sclerenchyma cells (Fahn, 1990). Paull et al. (1988)
found no evidence of lignification in ginger rhizomes.
While no studies have been reported on the physiology of fibre development in ginger,
several studies have been published on the response of fibre content of various pasture species
to environmental variables. Wilson (1982) indicated that water stress in most pasture species
4
reduces fibre development. Water stressed plants, he explains, generally have less
carbohydrate available for cell wall growth and lignin development. Crafts (1968) agrees that
stressed cells have limited cellulose synthesis. Vaadia et al. (1961) adds that cellulose
synthesis seems to be dependant on turgor pressure. Maturation of plant tissues, including
fibre cells, is not therefore necessarily hastened by water deficit. However, Wilson (1982)
reports that an increase in temperature usually leads to an increase in cell wall content and
lignification. It could be that mild water deficit, and the associated reduced transpiration,
may lead to an increase in plant temperature and hence an increase in fibre development
whereas severe water deficit, because of the effect on assimilate production, might reduce
fibre development. The effect on yield of fibre free ginger is however a more complex issue
as production of assimilate and its relative partitioning to the fibred and non-fibred portions is
also involved.
Hahn (1977) described the development of hard or fibrous tubers in sweet potato. Tubers
became hard or fibrous when the primary cambium was less active but lignification of stele
cells was increased. Factors which increased the percentage of hard or fibrous tubers
included low potassium supply, high temperature, dry compact soil and waterlogged soil
which is low in oxygen. Crafts (1968) reports that brassica crops may develop a higher fibre
content if subject to water deficit during early growth and that fibre crops such as cotton
benefit from water deficit during early growth.
It is commonly believed by people within the ginger industry that stress of any nature,
particular!) that associated with water deficit, will increase the rate of fibre development

5
relative to the growth of new rhizome thus reducing the percentage of choice grade rhizome.
A major objective of this study was to test this hypothesis.
This study also aimed to make some preliminary observations on the physiological
responses of the ginger plant to water deficit. Turner (1979) gives a good overview of the
range of plant responses to water deficit. Each strategy is classified into either of three
categories, drought avoidance, drought tolerance with low water potential or drought
tolerance with high water potential. Avoidance mechanisms include developmental plasticity
and rapid phenological development. Mechanisms of tolerance with low water potential have
the effect of either maintaining cell turgor or enduring desiccation. The most well known of
these mechanisms is leaf osmotic adjustment Drought tolerance strategies that maintain high
water potential either reduce water loss or maintain water uptake. Mechanisms in this
category include increased stomatal and cuticular resistance, reduced radiation absorption and
increased root density. This last strategy could also be considered as a stress avoidance
strategy.
Root crops in general are characterised by shallow tuberous roots but in sweet potato and
cassava at least, the roots responsible for water and ion uptake are usually deep thus
conferring some tolerance to drought (Wilson. 1977).
Ginger is generally considered to be an under storey or shade loving plant and it is known
to be sensitive to water deficit (Haque. 1974). There is little known however about the extent
and nature of the drought response mechanisms inherit in the ginger plant. This study will

6
also attempt to identify the major drought adaption strategies inherit to the ginger plant.
Mechanisms to be investigated are stomatal response, leaf folding, assimilate partitioning and
osmotic adjustment.
MATERIALS AND METHODS
Mature ginger rhizomes of the cultivar v Queensland', were harvested in late June, 1991.
These rhizomes were immediately washed, cut into pieces weighing 50 g to 70 g and dipped
for one minute in a fungicide solution of 1 g.l"1 Spin' (0.5 l"1 benomyl ). Treated pieces
were air-dried for one day before planting in moist sawdust in a naturally lit glasshouse in the
first week of July.
The glasshouse day/night temperatures were maintained at 307l8°C by thermostatically
controlled evaporative coolers. Relative humidin fluctuated between 60% and 100%.
As rhizome pieces germinated they were planted, one each, into seven litre plastic pots
containing 4.5 kg of sand and peat potting mix in the ratio 2:1 and a mixture of solid
fertiliser. At field capacity each pot contained about 880 ml of water. Early and late to
germinate pieces were allocated evenly across treatments.
The experiment was a randomised block design with six replicates of four treatments.
Treatments are shown in Table 1. Where a day number is mentioned this refers to the
number of days after planting. The abbreviations in brackets will be used throughout this

7
report to refer to the treatments. Plants not subject to water deficit were watered about every
two days. Sufficient water was applied to bring the potting mix to field capacity.
Harvests
Harvests were made of six plants from all treatments at days 148. 163, and 179. Only SS
and CC plants were allowed to grow after day 179. SS plants were rewatered on day 180.
An additional harvest of CC and rewatered SS plants was taken at day 193.
Harvests were structured over this period because it was judged to coincide with the period
of rapid fibre development just prior to early harvest in commercial fields of ginger.
At each harvest, plants were divided into leaf, stem, rhizome and seed-piece. Fresh
weights, knob number, leaf area and % choice rhizome were determined before each plant
part was dried in a forced draft oven at 60°C. Dry weights were recorded for each plant part.
Roots were also washed and dried and dry weight recorded. The moisture content (%) for
each sample was calculated from fresh weight and dry weight data.
Leaf area was measured using a Li-cor planimeter. Folded leaves were placed in a plastic
bag with a small quantity of water to induce leaves to unfold so leaf area could be measured
more easily.
The percentage of choice grade rhizome was obtained using the "blunt knife' technique
described by Whiley (1980). The fresh rhizome was first cut into knobs and. using the back
8
of a knife, each knob was then cross-sectioned into 2 mm to 3 mm slices from the tip. As the
older, more fibrous rhizome is encountered the rhizome knobs become more difficult to cut
and the fibre is easily seen protruding from the cut surface. The fibred and fibre-free
portions of each rhizome were weighed sepaiaielv and the percentage fibre-free rhizome on a
fresh weight basis (choice grade) calculated. Dry weights for fibred and fibre-free portions
were also determined. The percentage fibre on a dry weight basis was not determined due to
resource limitations.
Water Relations
Leaf relative water content % (RWCL%)
RWCL of CC and SS plants was initially measured about every four days from the
commencement of the treatment period on day 148 then at about eight day intervals to final
harvest on day 179. Measurements were also taken on SC and CS plants at day 179 and CC
and SS plants at day 193.
Samples were taken from third or fourth leaves only on each of three plants per treatment.
In some instances two samples were taken per plant and averaged before being used for
statistical analysis.
One small piece of leaf tissue, approximately 1 cm" was cut from each plant and sealed
immediately in a previously tared Epindorf tube. Fresh weight (FW) was recorded and the
-2 1
leaf pieces then floated on distilled water in petn dishes illuminated with 12 to 15 pE m s"
of PAR for four hours. The pieces were then removed and dried by pressing between two
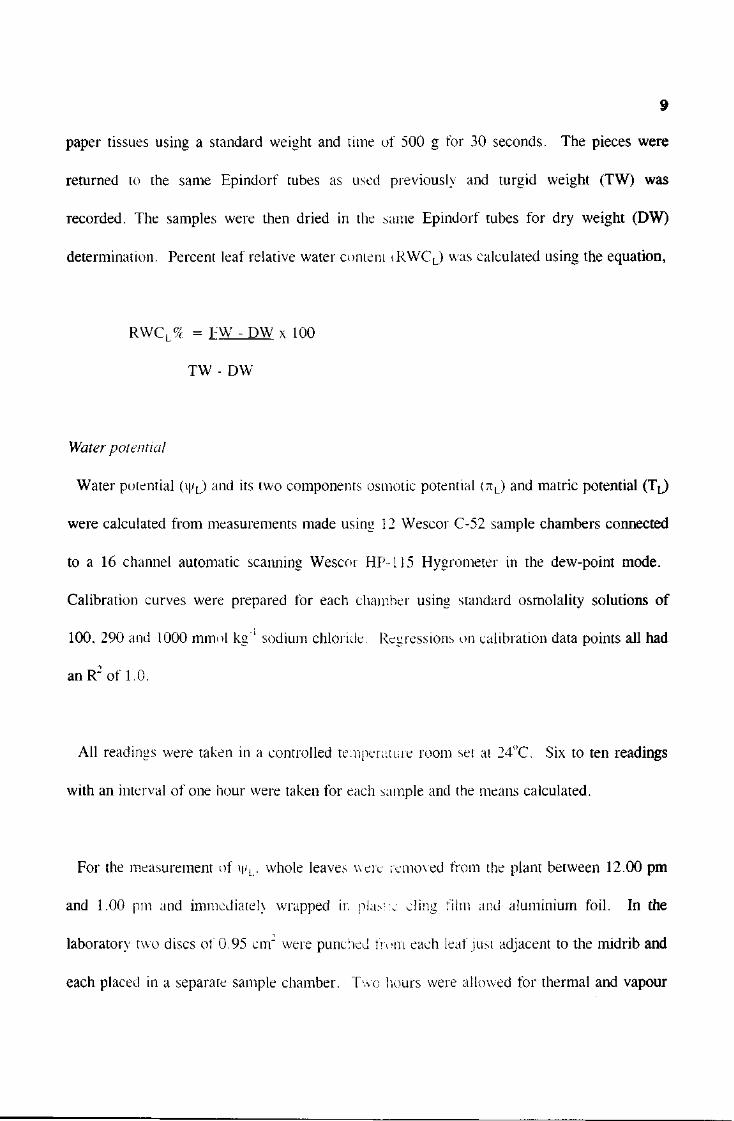
9
paper tissues using a standard weight and time of 500 g for 30 seconds. The pieces were
returned to the same Epindorf tubes as used previously and turgid weight (TW) was
recorded. The samples were then dried in the same Epindorf tubes for dry weight (DW)
determination. Percent leaf relative water content i RWCL) was calculated using the equation,
RWCL% = FW - DW x 100
TW - DW
Water potential
Water potential (i|/L) and its two components osmotic potential (7tL) and matric potential (TL)
were calculated from measurements made using 12 Wescor C-52 sample chambers connected
to a 16 channel automatic scanning Wescor HP - i J 5 Hygrometer in the dew-point mode.
Calibration curves were prepared for each chamber using standard osmolality solutions of
100, 290 and 1000 mmol kg"' sodium chloride. Regressions on calibration data points all had
an R2 of 1.0.
All readings were taken in a controlled temperature room set at 24('C. Six to ten readings
with an interval of one hour were taken for each sample and the means calculated.
For the measurement of \\)L. whole leaves were removed from the plant between 12.00 pm
and 1.00 pm and immediately wrapped ir, plaMie cling film and aluminium foil. In the
laboratory two discs of 0.95 cm" were punched from each leaf just adjacent to the midrib and
each placed in a separate sample chamber. Two hours were allowed for thermal and vapour

10
equilibration before readings were commenced. These two readings were then used to
calculate a mean for each plant sampled before statistical analysis was performed. Each
treatment mean was therefore the result of two samples from each of three plants per
treatment.
An attempt was made to measure xylem water potential using the pressure chamber
technique but accurate, reliable measurements were not possible. The petiole of ginger
leaves is v-shaped and does not seal well in a rubber grommet with a round hole. An
alternative approach was tried using a grommet w ith a slotted aperture and a strip of leaf
lamina. It was found however that even after enclosing the strip of leaf lamina in a plastic
sheath it was difficult to obtain a reading fast enough particularly with leaves from fully
watered plants. Readings from fully watered plants often had a lower value than for stressed
plants using this technique.
Samples for the measurement of TTL and T, and the calculation of turgor potential (P,) were
taken at the same time as for RWCL. Whole leases were collected and wrapped in plastic
cling film as for M/L but were frozen immediate!} m dry-ice In the laboratory the samples
were thawed and allowed to equilibrate to room temperature over about 30 minutes. For the
determination of osmotic potential, a small portion of lamina was cut to include tissue from
the leaf margin to next to the midrib. Sap was expressed from each sample using a 0.5 ml
syringe. A drop of sap from each sample was placed on a 0.95 cm2 filter paper disc in each
of two sample chambers. The sample chambers were allowed to equilibrate over
approximately two minutes before readings were commenced. Two measurements were

M
taken on each of six plants per treatment. The means were calculated for each plant before
the data was used for statistical analysis.
7tL was adjusted for RWC using the following equation cited by Morgan (1984);
Adjusted nL = RWCL (CC plants) x TTL
RWCL (stress plants)
The osmotic potential of roots (TTR) was also obtained at each harvest. The same basic
technique was used as for leaves. Samples were taken at each harvest from fleshy roots about
2 mm to 5 mm thick at a point on the root near its origin on the first order rhizome. To
avoid contamination with solutes from the pottinL :v,i\. the epidermis was scraped from the
root with a scalpel before the sample was wrapped and frozen. In some cases the samples
were stored in a freezer for measurement at a later time. Two samples were taken from each
of six plants per treatment. The two samples for each plant were averaged. Only means for
each of the six plants per treatment were used for statistical analysis.
For the calculation of TL. samples were collected as for TC1 . However, intact discs from
thawed leaves were placed directly in the sample chambers. The readings obtained were a
combination of TTL and TL. 1L was calculated tv. uhtracung me ;:, value (not adjusted) for
that same leaf sample from this value. T,_ itseli was not considered a useful measurement
other than it was a necessary step in order to derh e P, .

12
Turgor potential (PL) was calculated using the equation:
P L = V|i, - (7IL + TL)
Leaf resistance and transpiration
Data was recorded using a Li-cor 1600 stead) >tate porometer. All measurements were
taken between 12.00 pm and 1.00 pm on third and fourth leaves on each of three plants per
treatment. Diurnal patterns were recorded after eight days (day 156) and fourteen days (day
162) into the stress period for SS and CC plants and )n day 173 for CC plants.
VPD was calculated on each occasion from wet and dry bulb measurements made using a
sling psychrometer. Measurements were taken whenever leaf water relations or porometry
measurements were taken. This was usually around midday or slightly later.
Leaf folding
The diurnal trend in leaf folding in CC plants on day 173 wa> quantified by measuring the
distance from one edge of the lamina to the oppo.Mts.- edge at a point midway along the leaf.
This distance was expressed as a percentage of ;he full width of the leaf at that point.
Measurements were taken from third and fourth lc;-\es on each of .nree plants per treatment.

S3
Statistical analysis
All data was analysed using the statistical software program Sraiistix. Two way or one way
analysis of variance (P<0.05) was used to determine the significance of treatment effects.
Where means were significantly different, least significant differences were calculated by
pair-wise comparisons of the means. Multiple Smear regression was used to determine the
relationship between leaf folding and environmental or other physiological parameters.
RESULTS
Dry matter production
Trends in dry weight for plant components are shown in figure 1 and for rhizome
components in figure 2.
From figure 1 total dry weight of CC plants .mreased almost linearly but leaf and stem
growth slowed after day 179. There was also a moderate slowing in the growth rates of roots
and to a lesser extent, the seed-piece. Rhizome growth rate increased with time. At day 179
the plants had lost vigour and. the first order shoots in particular, were pale in appearance
with necrotic leaf margins. By day 193 many > : the previous!} dormant buds on the seed-
piece had germinated with most up to 2 cm long r... some up to 5 cm long with new roots.
Total dry weight of SS plants remained virtual!} unchanged ,-••.er the four week treatment
period (day 149 to 179). However, individ...,! plant components changed in mass as
assimilate was lost or redistributed. Plant components that suffered a decline in dry weight
were the seed-piece followed by the leaf. In coi.manson with CC plants, SS plants produced

14
105% less total dry weight over the four week trc.ament period. In absolute terms CC plants
produced 28 g in this period whereas SS plants ;ost approx 1 g. In comparison with CC
plants SS plants produced 138% less seed-piece 113% less leaf. 97% less root, 95% less
rhizome and 92% less stem over the four week pe/iod. Water deficit for 31 days (day 179)
resulted in a slightly higher rootashoot ratio (sec :;:ble 2). At (his time the seed-piece was
quite wrinkled in appearance. At day 195 when rewaiered SS plants were finally harvested,
the first order shoots were pale in appearance with necrotic leaf margins. Many of the lower
leaves were dead and some shoots, particularly die first orde: shoots, had lodged. The
terminal leaves of some plants had failed to unfolc
SC plants virtually ceased growth during the two weeks water was withheld. After
rewatering total dry weight increased at about the ame rate as in CC plants. Leaf dry weight
did not however respond weli Rhizome and ste. resumed gi\ vth at a rate approximate to
that of CC plants two weeks previously. Growth o\ the seed-piece and roots was however,
more closely aligned with that of CC plants for the same period. These plant components
appeared to enter a phase of increased sink strength from about day 164. This occurred in
CC, CS and SC plants. In comparison with CC plants. SC plants produced 56% less total
dry weight over the four week treatment period, fins was comprised of 60% less leaf, 60%
less root. 58% less rhizome. 55% less stem and 4;v< less seed-piece.
CS plants were the most severely affected in, arms of dry ..alter production within the
period water was withheld. Plants actually suffe. .-J a 11% dec;me in total dry weight in the
two weeks water was withheld The rhizome _.. jancd the im a followed bv the leaf and

15
stem. Late stress for two weeks was just as dein.nental to rhizome dry weight as four weeks
of stress initiated earlier. However, seed-piece and root dry weight continued to increase in
CS plants over the two week stress period. ;r, comparison with CC plants, CS plants
produced 76% less total dry weight over the tour week treatment period. This was
comprised of 92% less leaf, 90% less rhizome, 64% less seed-piece. 63% less stem and 62%
less root.
Leaf area data over the period da\ 149 to 195 h >hown in table 2. Leaf area increased only
marginally in CC plants after day 179. All stress treatments up to day 179 gave a similar
decline in leaf area. The leai' area of rewatered SS plants was still significantly less than for
CC plants
The ratio of plant parts to thai of roots is shows, in table 3. The sink strength of the shoots
and rhizome had decreased relative to the roots in SS plants a; Jay 164. Water stress for
longer periods or at different times resulted in decreased sink strength in the roots relative to
the shoot
Knob number and weight
The trend in knob number and weight is sh \\ r, in figures 2K and 2F. Knob number
increased almost linear!} in CC plants but the growth rate of individual knobs, as indicated
by mean knob weight, progressively slowed and cud reached its maximum by about day 179.
Knob number continued to increase over tu ; rst two weevs in SS plants despite a
substantial decline in mean knob weight. While .vs . lants and CS plants ended with rhizome

16
knobs of a similar mean weight, rhizome knobs of CS plants, because they initially increased,
suffered the greatest actual decline in weight.
Rhizome knob weight exhibited a marked resp n>e to change- in water availability across
all treatments.
Choice grade rhizome
Changes in choice rhizome and fibred rhizome c: \ weights are -aown in figures 2A and 2B.
In CC plants growth oi' choice rhizome was slow nig during the . reservation period while that
of fibred rhizome was increasing rapidly. Stress affected each rhizome portion differently.
For instance. SS plants produced 44% less ch« ice rhizome and 71% less fibred rhizome
compared with CC plants. The changes in parti.ioning of assimilate to fibred or non-fibred
portions o\ the rhizome can be seen more clearly in table 4. Here the increase or decrease in
fibred and non-fibred rhizome dry weight is expressed as a percentage of the increase or
decrease m total rhizome dr> weight. This procedure of couiv. ignores any change in the
rate of fibre development that may occur. It assumes fibre development continues at the same
rate and it is only changes in assimilate partitioning to the fibrec. or non-fibred portions that
occurs. So while it is a simplistic way of examin.ng the data it i:- nevertheless relevant in that
it is changes in relatixe weight of fibred and non-fibred poitions that are commercially
important. As will be explained in the discussion, the relative partitioning of assimilate is
probably the major determinant of percentage chi -ce grade ginge
From taoie 4. the fibred rhizome increased m .re in dry weignt relative to the non-fibred
portion in CC plants ir, the -Ccoiid two week p.-nod. Water .'elicit in the first two week
period (da\ 149 to 16-> in :->b ,md SC plants; .suited in a •:.rger percentage of rhizome
assimilate going to the fibred portion. In SS pk .10 this was iv.ersed slightly in the second
two week period with slight!) more of the rhizoi .e assimilate g<. .;g to the non-fibred portion
although '.he difference was c.uiic small. Over ;;:. .. ourse of th .our week period, both SC
and SS treatments resulted in u proportionally greater percentage of rhizome assimilate going
to the non-fibred portion relative to the fibred portion. The ...lues for CS plants for the
period da\ !64 to 179 represent:- a decline.

17
Changes in the percentage civice grade rhizome m a fresh and dry weight basis are shown
in figures 2C and 2D. The percentage of choi..•.: rhizome (fresh weight) declined in CC
plants from 405v at day 179 to 31 % at day 195. These respective percentages are roughly
equivalent to the commencement and cessation el early harvest in commercial fields. The
decline in percentage choice rhizome occurred nu.eh slower in SS plants. This was attributed
to a genera! lack o1 growth in tne rhizomes.
In SC plants the percentage o! choice rhizome remained virtual!. unchanged after water was
applied indicating growth ot limed and choice rhizome portions resumed at about the same
rate.
The percentage of choice rhizome actually incre.^e,: in CS plan.-. when water was withheld.
As with SS plants, fresh weight of fibred rhizome declined more than that of choice rhizome
when water became deiicient. i his response was .nore severe in _.S plants than in SS plants.
There was no indication that fibre development w.. -timulated in SS. CS or SC plants.
Water Relations
Water potentials
Leaf water potential !\;\ • and :ts components, e: .:e. -tic (TTL). n... ic (TL) and turgor potential
(PL) recorded at abou> midda; u :ne end of if. .: annent pi... >d are shown in table 5a.
Similar measurements, taken from CC and rewai. _\: SS plants a. day 193 are shown in table
5b.

1 8
From tabic 5a. two weeks of .ate stress CCS ph.: vas suffk;. it to reduce v|/L to as low as
did four weeks of stress initiated earlier (SS plants/. CS plants c.iso had a higher nL than SS
plants. SC plants recovered after two weeks of rewatering in all except P, . nL of stressed
plants was similar to CC plants or. as in the case of CS plants, significantly higher. The
adjusted nL values diffeied little from that of CC plants and consequently there is no evidence
of osmotic adjustment. Pl declined in all stre- -ed plants but was lowest in CS plants.
Despite being rcwatered for two weeks, PL of SC plants was stii: significantly lower than that
of CC plants.
Table 5b shows that despite being rewatered fo two weeks. SS plants still had a lower PL
compared to CC plants. SS plants were also ^served to ha..- many permanently folded
leaves particularly on the first order shoots.
Root osmotic potential
Data for root osmotic potential (~Ki is shown in table 6.
From table 6. rtR deereasec substantially wit: water deficit In SS and CS plants 7iR
decreased within 14 daws o\ water being with::. :c (days 16? and 179 respectively). 7TR
increased w- normal in SS p^r, s and SC plants ...... rewatering >r two weeks tdays 193 and
179 respecti - el\ ).

19
Moisture Cement of plant components
Significant differences between treatments in the moisture content of leaf, rhizome and seed-
piece were not seen until day [19. At that time .inferences vu re seen in the leaf, rhizome
and seed-piece. At da\ 179. SC plants had a seeo piece moistuie content 4% higher than CC
plants. The moisture content ;•: the rhizome and JJ piece of ;o .vatered SS plants at day 195
was also higher (8%) than CC plants.
Leaf resistance and leaf retain < water content
Figures 3A and 3B shows trie midday stomal-: response to u'ater deficit over the period
from 145 to 173 days after planting. Within • Jays of w u.iholding water, midday leaf
resistance n, ) of SS plants had begun to increase and leaf transpiration (EL) had begun to
decline. Figure 3C shows the midday RWCL u..•>.. over the period from day 148 to 193.
Significant differences v. ere no. seen until day 1" \fter two ueeks of rewatering RWCL of
SS pants was still lower than for CC plants. KWCL of leaves of CC plants at midday
declined from 96*% on day I4S to 93% on da\ v The lowest RWCL recorded over the
treatment period was 8dt;v for SS plants. Lea\es of CS plants (not shown in figure 3C)
declined to a. similar RWQ in i.vvo weeks as leau for SS plants did in four weeks.
The diurnal trends in tonia: d behaviour for ( ;nd SS phrais at day 156 and 162, eight
and 16 da; - alter water •.a> .; di;x o are shown - gyres 4 a so. 5. Tne trend in RWCL for
SS and CC plants for the pei>\. from 6.00 am or ..a\ 162 to 6.JO pm on day 163 is shown in
figure 5C.

From figure 4. rL of SS plains decreased for a -
increased but declined again I'mm about 3.00 pm
plants throughout the da*. Fn m figure 5. rL o;
8.30 am. Siomata remained fu;t\ closed in SS pi..:
RWCL of SS plants was lower than CC plants at "
while that of CC plant- declined. RWCL of :-.
declined substantially o.ernigh:.
Additional plants, not part of the main experinie:
senesced and the plants were near collapse and the
Leaf Fold in i>
Leaf folding is a common re: ponse in irrigate.:
plants displayed this behaviour in the hotter perioi.
in water stressed plau'e- and ntensified as sttv--
rewatered on day 180 but. afte: a further ten da\.-
leaf foldine in some shoots despite a rise in RWC
20
oil period from 6.00 am to 8.00 am then
Ei remained at a constant low level in SS
>o plants increased from about 4.30 am to
ts for the remainder of the diurnal period.
,)0 am but remained constant over the day
oth treatments but particularly SS plants
.. were stressed until the lower leaves had
.owest RWC, recorded was 80%.
e'd-grown ginger. In this study even CC
- of the day It was however more severe
became more severe. SS plants were
4 daily watering, still displa\ed permanent
close to that of CC plants.

21 21
The diurnal trend n -J folding, rL, EL and leaf temper::mre in CC plants and various
other environmental r uneters was recorded on e y 173 irJ is shown in figure 6. The
degree of leaf folding r •; ed quickly up to abou. idday "c'ore declining.
There was a high :iei \ e orrelation (R; < 0.88; l< 0.01 between leaf width a.id EL. The
fitted equation was.
Leaf width = 100>* - o-i +/- 0.534) x l.L
Leaf folding also '.oil \d ; close relationship will light k . s and leaf tempera . : c It was
explained by the regre M
Leaf width = 156.9 '" (+/- 0.722) x leaf temperature - ).026 (+/- 0.09) x ight
(R2<0.88; P<0.0.)
It is also worth nc tin >\<n figure 6 that rL momeirarily ceased rising while lea\ folded to
their maximum.

22
DISCUSSION
Dry matter productic
Generally speaking teatments were probabi> too se .re to induce subtle changes in
assimilate partitioning A; o, insufficient plants ere available to observe the ong-term
effects of water deficit Nevertheless, some important observations were made.
At the time treat irk
changing from the ah
general trend was sho
seed-piece gained eon-
This was the period r
it was excess assimilai
to increase in dry \\ ei
indicating competition
excess assimilate but ;
also found that assimi
v ere imposed (weeks 21 to 25) he centre of sink strength was
ground components to the below-ground components. This same
b Whiley (1980 in wee is s 29 to 32 in field grown ginger. The
rai-te dry weight particular:\ in the xriod from day 164 :c day 179.
r mum increase in total >. weig: md it be reasonable to assume
ati was stored in the seed-; iece. ¥, vever the seed-piece continued
liter day 179 when most iher pla r. components slowec in growth
assimilate. The seed-piece was tlt.-r,-fore not just a storage site for
a ink in its own right. Dewen e al. (1987), using labelled C02,
v as moved both in and *.a.;t of thi eed-piece. In this s.udy. root
growth followed the s; ticnd as seed-piece grow!
Because CS plant- e .ie . the greatest actual de^ ine in u 1 dry weight durkk he period
water was withheld it ;c be considered the most severe t catment followed b> SS and SC
treatments. SS plants a mailer leaf area and re systei: tan CS plants whe water was
withheld and as a c-ie e: cc. SS plant- could be . tpected ; have depleted thei soil water
slower than CS plants : h. water deficit imposed n SS plai.ts was therefore m-re gradual

23 23
than the sudden and n c severe deficit experience^. by CS plants. Stress earlier (SC) was
less detrimental than ; >s ater (CS) due :o the s; tiler lea: area. This response was also
seen in cassava by bak et ..1.(1989).
Under conditions oi' iJi; il water deficit, as in S-i plants, assimilate was withdrawn from
the seed-piece yet the uange in dr\ weight of ther pi .r: components was negligible.
When soil water was : ;ed quickly as in CS ints, tf • rhizome suffered ,.ic greatest
decline in dry weight the seed-piece and roots vvntinued to increase in dry weight. This
increase in seed-piece
response to water defi-.
CS plants had a subs
moisture content, i h
osmotic adjustment n;
growth.
! ot dry weight was also en in ( C plants so may not have been a
: e fact that it occurred , :spite se.ere water deficit is of interest.
at: v lower TIR compared vith CC plants but a similar seed-piece
self is not conclusive r ; it suggests there may have oeen some
e oots and seed-oiece u naintai: their water content and hence
Another interesting H: se was seen in SS plar s during their first two weeks of water
deficit. Durinii tn.- :i>J of relatively mild w .er delhit. knob number caainued to
increase despite mean
over this period, as sin-
new knobs. Banc:-, u
decreased average :..-.
production of new ,\;i.
b veight decreasing. Bec( ase rhii7. me weight remained unchanged
.- must have been taken fr n exist; r a knobs to continue nitiation of
7) reports that proton.. J water vress at tuber settn
grit but increased the : mber ( ubers per plant si:
:inger would initially as ear a v ; teful strategy. Ho.
new knob is a new gi as. point which is potent; ..ly a ncn shoot. An increa
in potato
:y. The
er, each
in knobs

24
therefore represent ;•
compared with osm
completion of grain
nc-ease in growth potential. At tin esoteric level ir could be
ii tment in gram sorghuir vhich i ---eases grain number • : enables
/tent.
Also, gradual wau
root:shoot ratio.
as seen in :>S plants u to da\ 164, results in a slicmt greater
Choice grade rhizonn
The rate of decline :t rentage choice grade rhia me wa:- determined more b) the relative
rate of deposition o: • Ji \-.\-al of assimilate into from tried or choice rhizoa., portions
rather than the rate at' e development. When w er was withheld assimilate dep a sition in
the fibred rhizome wa ed or reversed more th ; that fo choice rhizome, he; _.. the rate
of decline in percent;i
stopped in the perkv
rhizome also stoppee
growth. Beyond th^
of fibre cells was n.
, ce rhizome a;sc slowed In the case of SS plants rhiz a.e growth
an day 164 to day 179 an. the decline in percentage choice grade
. t ing fibre development id not proceed independent rhizome
er ation. the direct effect f water - tress on the actual ce. clopment
.' ar quantifiec n his stiK
It appears that thei
rate of decline inpe
majority of assimii
close relationship betw n increase in mean knob we.-a a and the
choice rhiz a.ie during :e pheno gical period invest..-, ed. The
ited into rhi/.ome knorv must therefore have been r ae fibred
portions thus increa-ir. e veight of this portion tea stive to the non-fibred portio.

25 25
Water relations
The lowest v|/L of at> 1 1 MPa was recorded a: rr four weeks of water deficit This is a
comparatively high a
to water deficit. Fi.k;
water deficit, recore.n
maize. Tengprem.M i
sorghum subject to w;
to -4.4 MPa in four -,,
here in fully watered
operating in the ginge
droucht tolerance nice
A nen compared w .ih wha. las bee a recorded in other pi.ur.s subject
id inthapan (1988''. in a s\idy of the response of various plants to
. lues of -4.0 MPa in n, -2.0 ." r.'a in sorghum and - MPa in
.i. '1991) recorded a/L va ics of -1.9 to -2.7 MPa in cedtivars of
deficit. Wilson ei al. (19 ).) recorded minimum v|/L va.uc- of -1.3
e> of tropical pasture gra.v The highest midday i|/L vak.c recorded
ge; plants was about -O.t MPa. This suggests median:-ms were
.a;:: to prevent large chanr.:s in \\i-. . This is another example of a
sr through maintenance >. a high water potential.
As mentioned earner
values actually increas
response and yet it pr
weight and in parti.a:
been removed iron, t!
relationship was sru v
was negatively corral;
demand for assimik
iv was no e\ ideine of osr. .vie adjustment in leaves. In .am, the nL
\ he CS treatment was probably the most severe in term- of plant
.ci, the highest n . CS \ '.tnts suffered the greatest define in dry
k r dry weight. Substar. .1 quantities of assimilate ha*:. :herefore
ua es of CS plants thus r.. ulting m an increase in %L. A similar
* kangpremsr; et ak (199 in sorghum where osmotic ..Jjustment
ith tirain number. Tk is. when there were man a rain, the
eater sere v>. ..-, tk lore k o available for main nice of a
lOW 7t, .

The PL value to; :
prolonged water dene
higher nL and TL n;; ;
Begg and Turner • ; •
26
u ed SS plants >uggest ..at ginger may not recove: ell from
T lis low PL. despite two weeks of watering, arose from slightly
} leant). A low P, sug. ..-ts a low potential for leaf voansion.
i .iicate that growth in s .1 flower and maize was s h e : to cease
when PL declined to u o 0.8 MPa. It is consisted that those plants made only o. all gains
in leaf area and lea.1 c
their RWCL was sin :!.
error from adding
A. ght after rewatermg. • ' piano also had a low PL .. because
C plants. 1; is more lik . their Lwer PL was an acci *.. nation of
- and subtracting it from
Leaf relative water r.o/
The lowest midd;,
between 97 and 92 ,
water loss. RWC .
(figure 5) RWCL deed
found RWCL of gim>
at 8.00 am to 95% .; .
recorded in to if. wa.. ed plans was 92%. Gene... y it was
. are reasonably high : .ues and indicates a good ^.>, rol over
: throughout the day b not u any great extent, o Jay 162
om 99% at dawn to ah : 95% by 3.00 pm. Haque '74) also
:ated little throughout ti . Jay. He recorded a decline >m 98%
n which is cons'sieiit w this i ita.
The closelv relate*,
(1983) recorded a
experiment.
dso has a high degree • ontro 'over RWCL. Turne: J Lahav
94 to 96 A in bnoantt .Town u a similar VPD as . t in this
The decline in RN
water was withhek
S plants was surprising dow ; nd it was not until 3 ...lys after
Jay RWC da ::oJ u :ow i ;;o of CC plants. H . e (1974)

27
also studied the rm-jA : if RWCL in ginger to ater clicit and in contra^
presented here. foimd A'f: declined quickl dm g onl} II days of water d.
main difference be. A. h • study and thb one w that :e measured RWCL
whereas in this stum.
5) helps explain this d
CC and SS plants >T
plants had dec li nee ..
'X pm was used. Diurnal AVCL data gathered on day
rcice. At 6.00 am mere as a large difference in RW
t. that seen by Plaque. ! wever. by 12.00 pm the R1-
a lar value as tha; m' SS 'ants. :dy measuring RWC
no difference was -m. ; :u; day 178 but it appears differences were present at
sooner after water \ : dmeld.
27
A results
cit. The
S.00 am
2 (figure
between
of CC
. midday,
\ n much
The diurnal item
control water loss r.
RWCL overnight.
that these plants w.
Irrespective oi this
by the plant over v
deficit. It also foil
; n figure 5 alst v.gge fiat iter deficient ginge: 'ants can
bh well throughota me da nut in mis instance suffered ., .ecline in
m at was not investigated ut it a uld be a consequent the fact
A i in a glasshouse A her 'heated dry air was blown ... ; night.
a; ay. the data presented I licates a considerable degre. f control
A and is another e.\amp' of thi plants ability to to..- le water
A Aiiddax RWC, is n.a a a d measure of water stress i; aiger.
Moisture comciu m
It is tempting to -.
during times o\ sod
or succulent iruit ;.*.
1988). This was n
'•ipUllL'i'lLS
m rhizome or scec- piec may b a source of water i . me plant
:ficit. This stramL ex in m iv plants where eiti he tuber
artial buffer to .\amr U mi to AC leaf (Milthorpe a.,. mioorby,
er the case m idimer. fact. CS and SS plants h; . slightly

28
higher rhizome moi-t e ntent. and in SS plant a higher seed-piece mois,.... content
compared to CC ph.
increased ability t'oi
both re watered SC ai
than CC plants. Ti
rewatering was low
not recorded lor the
substantially lower h
rhizome and seed-pi.
suggests stressed phi:
plant components. 'v
adjustment may be
extraction anu reteiih
unknown. Turner
rhizome is composed
150 days old. starch
43% at 11:11 maturir
(1961). water defi - l i c i t
to be a major OMTIOI;
their production woe
compositional .nai
:. 16 and 30 day- < wa: Jefici respectively. This .:< .icates an
NC. plants to store water he ri, zomc and seed-piece Also, in
N plants the rhizome and jJ-piee:- had a higher mois . content
g. ests - of the rhizome id see-piece of stressed p.... s before
cell water volume .n a
or seed-piece a as 1
CC plants. Also, th
arisi with CC plants. \ . e n was
he !. Nhy roots. 7tR of Sh .mis was
fact L:.at the moisture cor
rcssed plants d> es not i Aine ixlow that of fully w:
have a re»uiator\ mecl itism t maintain water con,
.onclusive data is not ] esentec here it is likely sc;
;,g in the roots. : lizoi . or -. ed-piece to enhance
••motic adjustment m n
cporis respons - .n b
as ,. response to water e
pea .id maize plants.
it of the
d plants
in these
osmotic
il water
it is not
. ginger
•ally of starch (lYmlim i. 196 '). In field grown ;. : er about
only about 24T e: rhi; ~:e dr weisiht. This incre; . to about
nbai et ah 1.9: " Pn i 19s )• According to ^
.ecelerate the cnr.ersio f sta: :h to sugars. Sugar
meat of cell sap ii mes hy.ic iiant- (Morgan, 199.:
nsisterr with a he eas. ;TR. I'aul! et al. (1988), i
cer rhizome-. content doubled
ia et al.
: known
;d hence
>tudy on
a seven
month period ; et n men; staved co -h nt.

29 29
TTR of CS and SS pi
EL in SS plants wil
low 7i in the roots. ;
i lay 179 was lower ihan eir \u, especially in CS plants. Diurnal
- lil at :his lime o ; do . ard lovement of water, driven by a
>s blv the rhizonx a,:d se . oiea. may have been initiated around
this time. The reten o water in the rhizune ; .. seec.-piece in preference to the shoot
would constitute a . a Mimvai nsec .ar.ism :idam maliy different to ihe tolerance
mechanisms discussed :.c his point.
So. while the rhizom d -eed-piece do no' a_i as • .aer sw^ph organs to buffer against and
avoid stress, thev ma1. c n as v. ate.r stor a_>, ore. in; o I ant survival sense, when stress
becomes very sever...
close to death. When
rhizome or seed-pieie
of the main expeni
Comprehensive data w
principally from the c
that water deficit mav
normally not commeik
a i. to say water m.wbe mteo ;o tiiese organs when plants are
ater availability iio.pro1. .-• new shoots can then sprout from the
":• •• response was >r jrve :, six . .iditional ginger plants, not part
. subject to. wa;e< sta o\e six weeks then rewatered.
K • collected on these plan - hut n.:w shoots were observed to arise
•ir seasons rhizom.; ,;rter .water; i;;. This response also suggests
t 'ncreased the o: to.:eny ; dies new seasons buds which would
••• if u;u. the :o! -. .;a • n.
It is possible that h
water in the liiieaJ.i
leaves with a water-so
seen in banana, and
aiso a sti\ no tv>: nres
.es : in. ;ea!
r.)p :> attribute
;te
clearance suust .'..• :nis
lov
wl !i enables temporary storage of
.: .. R\VCL (>100c/c recorded on
be re case. This phenomena is also
1 :• ...1 a lower TIR compared to \\i of
the surrounding si. :iv;\ tins a-a. . in e root pressure and temporary

30
storage of water in t ;:.:erccllidar spaces . D.T ner. r rsonal communication). Root
pressure is a well-km r
(Slatyer. 1967). Salis
the soil to the apoplas ;ti
solutes in the root apo:
the intercellular spac is
nenomena in plants a-, frequently reaches -0.1 to -0.2 MPa
•id Rt xs (1978) .tti.;but. out pressure to active ion uptake from
r the root stele si.di t: 'hei. is a buildup in concentration of
i gre.uei -level "... : in sun .-.Hiding soil. Storage of water in
iikeh to be effective and significant in humid, low light
environments. Haqui 9"4) round thai ginger i mn under shade maintained a higher
RWC
Leaf resistance
A stomatal response
Also. rL in SS plans r
in RWCL was rec, ak
Firstly, the ginger plar
tolerance mechanisms
deficient plant other
association. Haque (1
am. declined ti below
5C. This response :.o
dav when RWC w ;iu.
ecorded as earl ;.s tw o si.\ lays after water was withheld.
u Hiiher than tha \\ : CC
-.ere ..:e two m ant
^out 25 days before a difference
sine from these observations.
is \ery guod stomatal com: . and :n doubt this is one of its drought
ei ndh. uomata ur ear he r. bonding to signals in the water
i ist RWC aitr. )brh i. . expected there would be a strong
i '-'• und . increa.-ec -har • onee RWCL, both measured at 8.00
Thi is .lot inconsisu wiii" . ata presemed in figure 5A and
woes :.-.)t :.owe\ er e,\pl itinued rise in I\ throughout the
In this study, change
detected and it in, - ;
verc aieasuret :i SS
ere aiv.
-il before changes in RWCL were
i ast initially am .vay, to signals

31 3 1
originating in the i. >ois A . • ' i ise :•- ivot si.. \\:.':> is acted in banana but has not been
demonstrated bcvond c n 3run. 1965)
Leaf folding
Leaf folding is a con
related banana. In ba
il wrought tolerance mech;
e if foidine is c/nr die
side of the midrib Mi n a ai. N89o. Ta.ar.a' a
banana with RW'C
despite high RWC
;nae ...-vein LI JC e(
sin in nany crops including the closely
• a b nd of pulvinar cells along either
aha 1983) associated leaf folding in
aid . >ns (17°C) where leaves folded
t. s-< lour.d toldinc was n .- pro; unced on sunny days.
Leaf folding in <ei
possible to say fn
other associated facte
other Also, data a >ii
close relationship .-IK
c \vsd associa eJ 'it!
:cted eiala whc'.ik th
ter.ipcratur. Vll
as n^; collected 'Hit n
e' can leaf width m,: E,
: iti i and leaf temperature. It is not
•.!' w a responding directly to light or
. f; ors are interdependent on each
ibt ' lere is a close relationship. The
„att this may be the ease, being that
it is reasonable to exo; u RV.C w. a- de : a.a as aclases.
It is important to aa
must therefore eitl.c:
stimuli.
it a i; !"0;. iila c a n
a: an. ie\ a:s o s ;sia
nc atly of stomatal response so they
a influenced by a different set of
A similar beiwi\ a .a ail li nee w t la been associated with i|/L (Fukai
and Inthapan. 198: Ul! the:r study, lea rolling did not

commence until the \;< .b at least -2.0 MPa. LA
more sensitive than ir,
occurs. The minimu;
should not the re lb :e t>,
it appears to 'a: e 7
;v v|- i\ coixk..! ..1 v
• a i'i rm .'•:' w n;..: o
but rather a sensitive ci unism to moid excess
32
Id ,;: in ginger appears to be much
we. before any major water deficit
J ::iger plants was -0.9 MPa. It
0. turgor, which is a sign of stress,
ate; loss, and possibly to a lesser
extent, to allow photos it. 1 to p/oaed u:: ie: an:. at :. circumstances.
CONCLUSION
Water deficit cons i!\\ redi.cec rhiz -nv.- v:
The decrease in perc
This occurred in sere
case of more mile del
a. choice gr.Je r,.;zmne
- r-'ssed plants b manse i
•t iimlae v as w •themaw
is was the result of the plant
developing a high :L a: u ;t Hkeh a .ow rate 1'pi •nnmsis.
io •. :d or reversed by water deficit.
\i/ me stopped growing, but in the
R mom the fibred rather than non-
fibred portion, thus inc m .: the percentage choice .;• me imzome.
The various response >
stress by maintain, ng m
folding and possibm se
deficit, assimilate is it !
a'.er d-Ticm identit.ed
> era emie1 'e do l
.' to ivot ;.tna
, . . dy indicate ginger avoids water
e: me very responsive stomata. leaf
: djustment in root-. During water
mthd.au a. iron me k -tern. and rhizome but the seed-piece
and roots continue a:

33 33
Ginger does not pes-, n e.haniMns to c< mnue : growth under soil water deficit but
rather it ceases growth ;e a nst. rves a-;jr
While osmotic aujus it i the oo: •< \va ni>t pr
existence. Firstlv the
same plants exhibited
rhizome weight deJin
-! wate; deficier,: p:ants
\' hi,ihe roo sh ),.n
dclit )ii. -lie
s cral factors point to its possibly
.: a .:msiderably lower 7iR. Also, the
am: knob number increased despite
jn ; f the rhizome of water deficient
plants was similar to v : :ea plants during s re.vs bt ,-ihe: after rewatering. It may be that
adjustment occurs by o;\ersio.; c•••'' stai h to s ... - 1 Sag that starch is the principal
component of the rhiz. .
In\cstigation of tec a. • to s; n\ the .. jp, •>iti- : a milate into the fibred portions
relative to the rion-ff miniom oi the :m onit .: -a? ;• harvest time may offer some
potential for temporal i v. me ,.ae .lee!; at choice grade rhizome. Partial
topping of plants at e. ! irvest .na> be :ic sue! eehn.jue. This could be expected to
reduce the rhizome gr . ;ue but because if '.he i Ti"i.;. paid for choice grade rhizome,
it ma\ still be an ecor . r..>nos• io: wor \ ;' ii \ii, a.
ACKNOWLEDG.Y1E
I w^uld like to ackn
throughout thi
intellectually ivw-
the
Wldi .till
:njo\..bi- exp ;c me
hy my supervisor Dr Shu Fukai
• hie patience made it both an
also like to thank A.W.Whiley

34
for sharing his wealth \periencc in iingt •- and E: . A ' Furner for advice during his brief
stav a; M.H.R.S.

35
BIBLIOGRAPHY
35
Bartoszuk. W. (1987 xreases in pour ) yield :t :•; from water deficit during the
growing seasoi fetyn Instyu.tit Z: •iniuakc -52
Bega, J.H. and Turnei .(197/: (. ror iter dc Agron 28:161-210.
Brun. W.A. (1965). d changes in tr .nspirat , v. nana leaves. Plant Physiology.
40:797-802.
Crafts. A.S. (1968).
growth Voi II.
' deficits and ph siologi
'.T.Ko/low .ski. A jademk
sses in Water deficits and plant
ondon. 333 pages.
Dewcn. A.. Sulan. L. Lipin. J. :98" A sti . . / characteristics of translocation
and distributioi distribution of Cu labc v a:--iniilates in Lai-Wu ginger. Acta
Horticullunu 14(2): 119 124.
Fukai. S. and Inthap; . . (1988). Growth and
irrigation in >o
compare
ustern Ouec.isi
aize .!• d ..rain soruhu;
-\:J.riculthi\ 1; 252.
- rice cultivars under sprinkler
:tion and plan; water relations -
lian Journal of Experimental
Hahn. S.K. (1977 n S potato in Lnon1; -iolog}
Knzlowsku "\ :ademn Pus.v ' ;\\ Yor
d crops. Ed. Alvim, P.T.. and
:37-248.
36
Haque. A. (1974). Le;:! Physiological ada; :ion of .. :.. T
Queensland. Ph. ; fhesis. 1 nrer.-;i of Que. ;i
Zingiber officinale) to climate in
Milburn. J.A.. KallaracL.i. J. and Baker. A.A.
Predicting the w Ler relanorN of ,'ield-ar
Australian Juitrna a<:Plan: Phsio!'• • v. 17:5"
Morgan. J.M. (1984). •' >smore uulation aid watt
Physiol. 35:299-
Vater relations of the banana. I.
-inna using the exuding latex.
n higher plants. Ann.Rev.Plant
Morgan. J.M. 11992) Osmotk compor^nts anc
differences in osni resiulaiu n i:i \vh. t. Ausl.
ties associated with genotypic
Physiol. 19 :67-76.
Paull. R.E.. Chen. N.J . nd Go. . ' IT . < -)88). C
linger rhizomes ir. Morage Ho-rsiic* -e. 23:
f weight loss and sprouting of
Pruthi. J.S. (1980.. Spict - ind o ..Jii:ieiu> .Tiemisi; .. ; biology. technology. Acadeinic
Press. S\u::-v. Pa-, e 153
Ratnambal. M.J.. Gonah •:. A., ui N.f M.K.
[Zingiber : ';cinol Rose, in relav i to man
Quality evaluation in ginger
Plantation Cmps. 15 (2): 108-

37
Salsibury. F.B.. and Ro-s. CAY. C978
Publishing Compa:.\. Cali! >rma. P;
Slatyer. R.O. (196/). Plant water relations!
Tangpremsri, 1 . Kikai. S.. Fisher. K.S..
osmotic adjustment in grain sore
adjustment under water-limited con.;
Tomhnson. P.B . 69). \iuitoir; of .he
Turner. D.W.. and Lahtv. E. (19S3).
temperat;;r.' Aiisr./.Plam Phxs ol.
Turner. N.C. (19<s6). Adaption to w ate
Phxsiol. 13 ;75-190.
Vaadia. Y.. Rare- F.C. and FLgan. R./
processes inn. Re>\ Plan: Plr-sioi
While) . A.W. i r-- i). G; ,)wth a;.J ft; re c
south-eas;er. Queensland. \iis. J.t.
37
Plant ' :\ ioiogy. 3rd edition. Wadsworth
: 84.
is. Acad.: re -ress. London. 366 pages.
j Henze! ,. (1991). Genotypic variation in
jin. I. V . .c pnient of variation in osmotic
:ons. Am i 1 ncRes. 42:747-757.
:iou)tyle.. diversity Pres.v Oxford.
The grc • banana plants in relation to
43-53.
deficits: J : iging perspective. Aust.J.Plant
ilv6l). ater deficits i:id physiological
2: 265-2c
•lepment .. . or {Zingiber c-rricinale Rose.) in
.AvricAi : / a 20:608-612.

38
Wilson. 1..A. 11ST""). Tuber civps. _n b. di\siolos: 1" • • pical crops, Ld. Alvim, P.T.,
and and Kv.zlowski. T.T. Acadeniu ''ress. Ne .'c ;. Pages 187 - 236.
Wilson. J.R.. Ludlow. MM.. Rsher. M.J and Sen ,:. H.D. (1980). Adaption to water
>uess of ; :j leaf w iter elat ,)n> four tr< ;: rage species Aust. J. Plant
Physiol. 7:207-220.
Wilson. JR. tl9>2i. Environnunta anc airitiona! , .; s affecting herbage quality. Ed
J.B.Hacke; ;n Nuiritionai limits to :iimal pro. :ti ;i from pastures. Proceedings of
an international symposium. Sl.Luci. Pages 1! 1 > .

39 39
Table 1. ScheduK of treatment watering gimes
Treatment
No stress* TC)
Water relations
i watered
week si:vss(SS) ..'er from day 14-) to 179
.. ered from da\ 179 to 193)
Liarly 2 week stress! SC) ;:'cr from day 149 to 164
Late 2 \WCK stress(CS) :;er from day 164 to 179
Table 2. Mear leaf area per plant (cm2) n days 14 1 - 179 and 195 after planting.
I)a> Leat •ei: ton LSD
(after (P=0.05)
planting)
CC SS C SC
149 1487
!()4 2359 i 74_- 571
i"?9 2930 158; 19 2053 717
195 3001 1917 978

40
Table 3. Dry weight ratios for each plant compor at n days 149, 164, 179 and 195
after planting. All plant components ; re expm,:c\ In relation to roots which is
expressed as 1.0.
Treatment lniv Root:Shoot hiztnne:S ce Ratio
CC Us)
I(»4
U9
2.5
2.1
! 7
; 6
SS U 4 2.2
:.7
2 3
CS
SC

41 4 1
Table 4. Perceiuage of dry weight cha e in totii •: ome partitioned to fibred and
choice portions. \ alues for fibred and ch ice ihizon e f each treatment in each period
should add to 100%. The arrows in. ate if tl e represents an increase or
decrease.
Treatment
CC
Rhizome
portion
Fibree
49 164
riod (days)
64 - 17v
79
149 -179
76
SS
cs
sc
Choice
Total rhizome
change (g)
Fibree
Choice
Total rhiz ne
channe :.
Fibree:
ChoiCv
Total rhiz ne
change i:_ >
Fibree
Choic:
Total rhiz ne
chanue
e o
0.5
21 24
4.7 8.3
0 62
0 38
0.0 0.5
79 50
21 50
2.8 0.8
70 71
30 29
3 3.5

42
Table 5a. Midda\ leaf potentiah (IS!Pa) a da 179
had been stresses for four weeks. CS j nts had
plants had been s ressed for t\u we ks t\ ivwatei
treatment period). SS plants
essed for tv > weeks and SC
wo weeks.
Treatment
Full) watered (C 3) 4 week stress (Ss ) Ear!\ 2 week str. ss(SC) Late 2 week stre--s(CS)
LSD <P<0.05)
Water potential
Gsnv poten
-O.i
Mat ric potential
NS (-0.2.-
Turgor potential
•o.u1, -1.2 - 0 . 3 ' 0.98" -i.\y - . .26V -0..9'1 0.35b
•or 5' - . . 33V. -0. 9" 0.64b
• l . : 4 ; i -0.89V: • -0.34" 0.08c
0.27
Table 5b. Leaf w.iter potentials Ml a) a; weeks.
>v B. s had 1 en i A atered for two
Treatment \\ ater
-( -0
tei.tial ic al
;4)
Matri'• patent: •:
-a.44 -0.28
Turgor potential
Full, watered (C 3) 4 week stress-res atered (SS>
\\ ater
-( -0
tei.tial ic al
;4)
Matri'• patent: •:
-a.44 -0.28
1.05!
0.641
LSD (P<0.05) \
(-( V xs
! 0.24 0.38
Values with a different lette. aia sm; ea slv 6. (P<0. ".'alues for each
treatiae .. ma\ n» fit exactb i ee all - 71-
samples were use, to generate ts va.ues ; ~ :. TL a
for SS plants (adji sted for RWC s ssow n brackets
+ PL. A . -ater number of
am v|/L. The ..djusted nL \alue

43 43
Table 6. Osmotit potential of foots (MP Day 16 'v sorted t o v eks of stress for
SS plants. Day !79 representee four we s of stro -S plant. tw weeks of stress
for SC plants and two weeks o cwaterii In SC pi day 193, SS plants had been
rewatered for tw< weeks.
reatmeat Dav 16? 79 Day 193
Fulh . itered(CC ) -• . 8 - : -0.86a
4 WC-K .-tress(SS i ;> -0.84a
Earh 2 week stivss(SC) . „ [ - >
Late 2 week stre>s(CS)
1 '
- . J
LSD ;P<0.05) 1 ' NS
(-0.31)
Valuer \\ !th a difh rent letter are en; :can: dilferent 5).

44
Plant Days f i nting Part Treatment
14<< 164 79 195
Stem CC 93; : [a 91"
ss cs sc
92" > a
. ~>a
!a
87"
Leaf cc 84;1 , ,ab 81"
ss cs i a
79"
sc > "'b
Rhizome cc 95 95" . . - ,b 93''
ss cs sc
95" 94':
Seed piece cc 9: 90" 4b •84'
ss cs
89" ab
s -ub
92"
sc
Dai. :;. table 7 . as derived fr Mr, sh :fn -.nd d it data. ig;.ificantly different
value.-, > P < 0.05) a re represented . ith .1 d. ent letter

80
70 oo
60
Dry
50
Tot
al
40
30
20 20
^ 16 ttt
12
Dry
8
Roo
t
4
0 20
3 16
£ 12
Dry
8
Lea
f
4
I
I I
D
_L J_ _L
140 160 180 200140 160
Days from Planting
180 200
20
16
16
12
8
- 0
00
12 u a
8 o
o N 4 2 «
0 ?0
/—* QO •***'
16 *> * t>»
12 Q V a
8 1
4 1
0 V to
0 20
M
Q
* > CO
Figure 1. Trends in total (A), rhizome (B), root (C), seed-piece (D), leaf (E) and stem (F) dry weights over the period from 148 to 193 days after planting. Data is shown for CC plants ( • ), SS plants ( • ), CS plants ( • ) and SC plants ( o ). SS plants were rewatered late on day 179. LSD bars are shown (P<0.05).
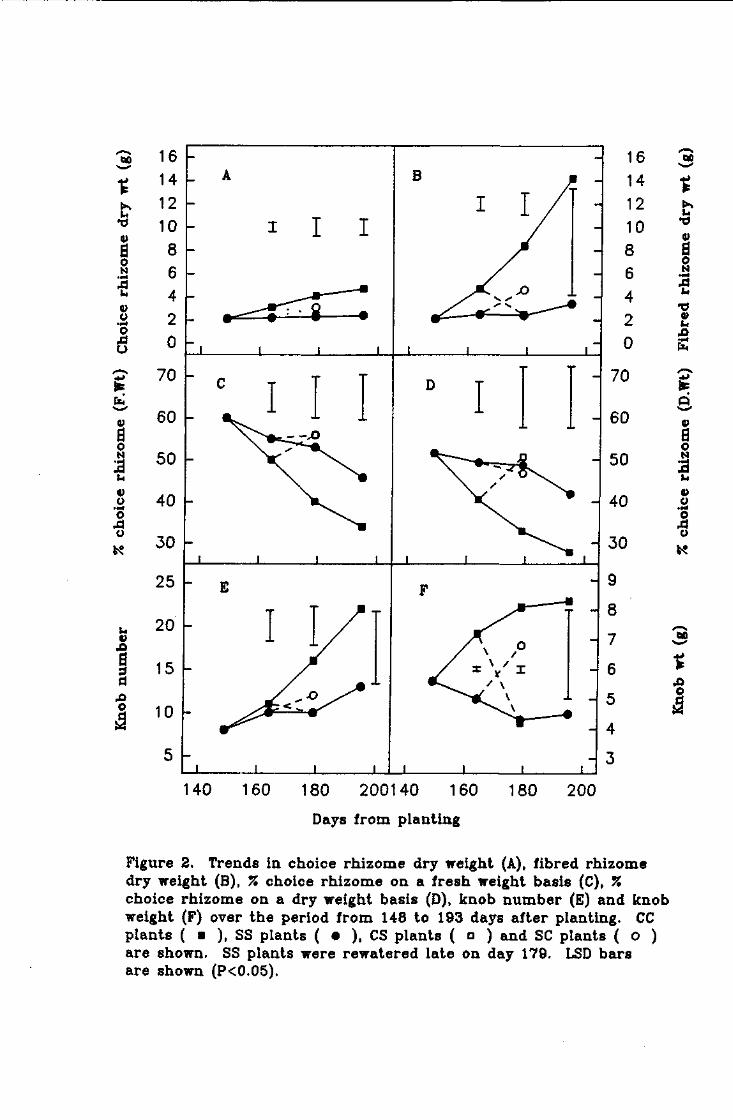
tt)
u •d v
a o N
u
o •*4
o jd o
a o N
0>
o ••4
o .d o
u V
x> a => d
16 -
14 - A
12 -10 -
8 -
6 -4 -
2 0
^ 70
fa 60
50
40
30
25
20 \-
15
10
x
X
I I
B
E
I
J_l
X;
16
14
12 10
8 6
4
2 0
70
60
50
40
30
g
8
7
6
5
4
3
140 160 180 200140 160 180
Days from planting
200
ao
u •o v a o N
»*4 XI u •d v u
Q
V
a o N 0) o o o
BO
t O
a
Figure 2. Trends in choice rhizome dry weight (A), fibred rhizome dry weight (B), % choice rhizome on a fresh weight basis (C), % choice rhizome on a dry weight basis (D), knob number (E) and knob weight (F) over the period from 148 to 193 days after planting. CC plants ( • ), SS plants ( • ), CS plants ( D ) and SC plants ( o ) are shown. SS plants were rewatered late on day 179. LSD bars are shown (P<0.05).

120
100
n 80 -
§ 60 -n
w 40
K
u
20 h i 0 - ocxPoo—co
1 I I I I I I I I I I I I I I I I I I I
- 8 N
I i i i i I i i i i i i i i i I
14
12
10 {
14of 160 180 200 1 4 0 | 160 180 200
Days from Planting
6
4
2
0
•2
100
95
-J 90
160 180 200
Days from Planting
a o
J w
Figure 3. Trends in leaf resistamce (r.) are shown in graph A, leaf transpiration (EL) in graph B and leaf relative water content % (RWCL) in graph C for the period from 142 to 193 days after planting for CC plants ( o ) and SS plants ( • ). Standard error bars are shown (P<0.05). Different let ters indicate significant differences for selected data points. Upward arrows indicate day of last watering in SS plants. Downward arrows indicate day of rewatering in SS plants.

120
a u
4 6 8 1 0 1 2 1 4 1 6 1 8 4 6 8 1 0 1 2 1 4 1 6 1 8
Time of day (hr)
Figure 4. Trends in leaf resistance (r.) are shown in graph A, and leaf t ranspirat ion (EL)in graph B for CC plants ( o ) and SS plants ( • ) 156 days after planting. Standard error bars are shown (P<0.05).
VI
N i a o
J • J
w
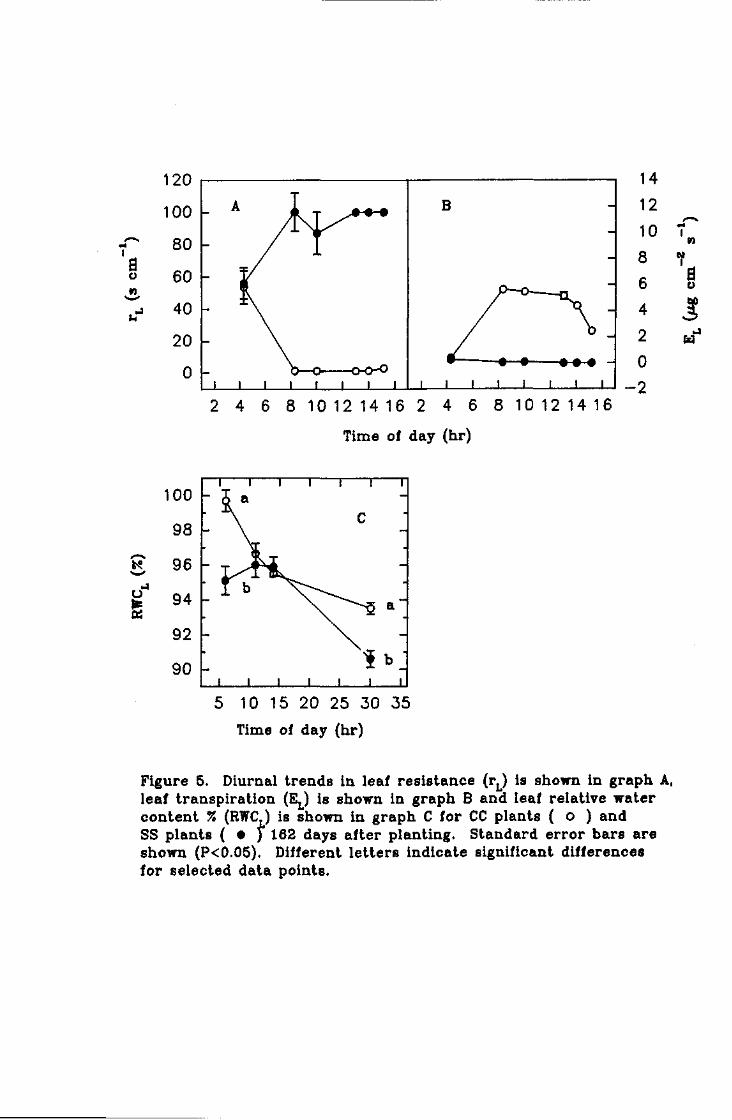
120
100 —N 80 a 60 V)
s 40
20
0
*?
2 4 6 8 1 0 1 2 1 4 1 6 2 4 6 8 1 0 1 2 1 4 1 6
Time of day (hr)
100 i_ i
) a I l l I l
98 -C
96 JJ
94
. i
.
\ b \. "13 a~
92 N.
90 i i i i i i i
5 10 15 20 25 30 35
Time of day (hr)
I a o
w
Figure 5. Diurnal t rends in leaf resistance (rL) is shown in graph A, leaf transpiration (EL) is shown in graph B and leaf relative water content % (RWC.) is shown in graph C for CC plants ( o ) and SS plants ( • ) 182 days after planting. Standard error bars are shown (P<0.05). Different le t ters indicate significant differences for selected data points.

K a)
a
-a •a
a> •J
N I
B o
u
a
120
100
80
60
40 k 5 -
J L J L J L
-^A
\
V. J I L
J L
J I
J L
35
30
25
8
6
4 6 8 1 0 1 2 1 4 1 6 1 8 4 6 8 1 0 1 2 1 4 1 6 1 8
Time of day (hrs)
N i
800
600 g
400 3
200
0
a
9
o
a
0)
CM
I
a o
J W
Figure 6. Trends in leaf width (folding) are shown in graph A, quantum levels in graph B, leaf resistance (r.) in graph C, leaf temperature in graph D, VPD in graph E and leaf t ranspirat ion (EL) in graph F in CC plants on day 173.


