
1
Wallingford Public Schools
SRBI Intervention Programs for
Reading and Mathematics

Individuals with Disabilities
Education Act
Originated in 1976 Multiple “categories” of identification
SRBI relates to Specific Learning Disabilities (SLD)
1976 – 2007: Discrepancy Model used to
identify SLD Discrepancy between “potential” (cognitive testing) and
“performance” (achievement testing)
If a large enough discrepancy found, the student must have
a learning disability
2007 Reauthorization Dual Discrepancy
Rule out Educational Factors
2

Dual Discrepancy
Discrepancy 1: Student is performing academically at a level significantly below that of his or her typical peers (discrepancy in initial skills or performance).
Discrepancy 2: Despite the implementation of one or more well-designed, well-implemented interventions tailored specifically for the student, he or she fails to ‘close the gap’ with classmates (discrepancy in rate of learning relative to peers).
Source: Patricia Anderson & Perri Murdica, CSDE,
Bureau of Special Education, Oct 08

4
We must rule out:
Lack of appropriate instruction in reading, including the essential components of reading instruction as defined in §1208(3) of the ESEA;
Lack of appropriate instruction in math
Limited English proficiency.
IDEA 34 CFR §300.309
Determining the Existence of a SLD
Source: Patricia Anderson & Perri Murdica,
CSDE, Bureau of Special Education, Oct 08

5
The Intervention Triangle
Tier 1 - All Students These interventions work for approx
85% of students.
Tier 1 - All Students These interventions work for approx
85% of students.
Special Education Services & Accommodations
Tier 3 – Intensive Groups or Individuals (1-3 students) Approx. 5% of students need these interventions in addition to Tier 1 and Tier 2.
Tier 2 -Targeted Groups (Small group, 8-10 students)
Approx. 10% at-risk students need these interventions in addition to Tier 1.
Tier 1 – Universal Instruction & Support These interventions are sufficient for approx. 85% of students.
ACADEMIC BEHAVIORAL
TIER 1
TIER 2
TIER 3

6
SRBI
Wallingford Public Schools
1. Universal Screening
1. Three Tiers of increasingly intense
interventions
2. Scientifically research-based instruction to
the extent possible
3. Frequent Progress Monitoring of student
performance using measures of risk
4. Fidelity of Implementation

Converging Evidence on Reading
Screening
There are Valid & Reliable Predictors of risk for reading difficulty are:
• Print concepts and letter names (pre-K)
• Phonological awareness and letter sounds (K)
• Rapid naming of letters (end of K to early Gr.1)
• Word recognition (Gr.1 and beyond)
• Vocabulary and phonological memory
(Fletcher et al., 2002; Scarsborough, 1998; Schatschneider et al.,
2002; Torgesen, 2002)
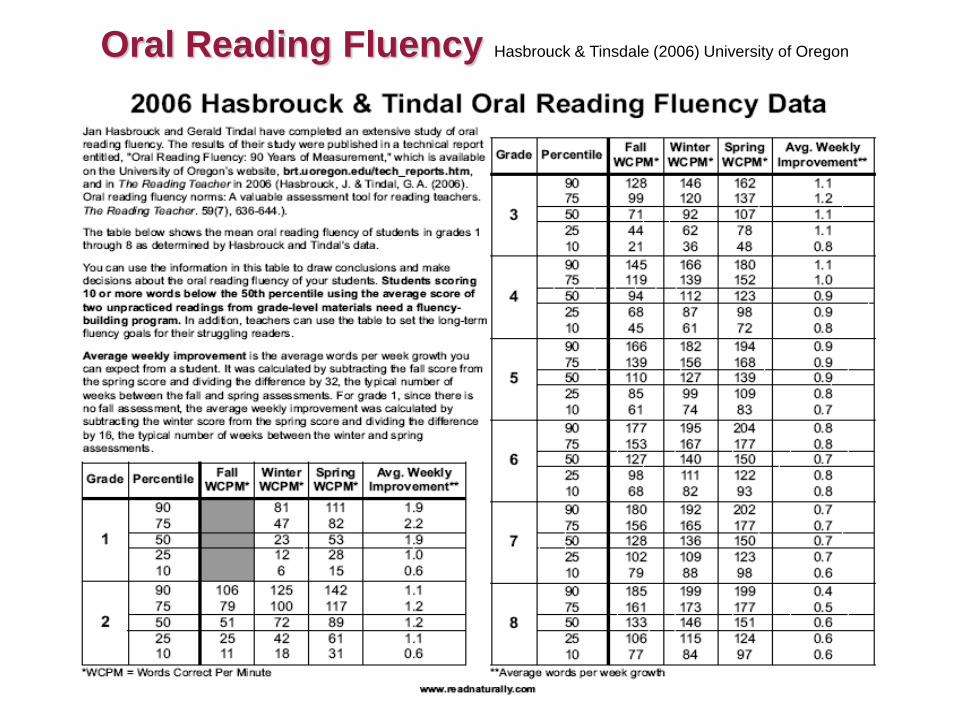
Oral Reading Fluency Hasbrouck & Tinsdale (2006) University of Oregon

Converging Evidence on Math Screening
What do we know about characteristics of students
with math problems?
Problems with Number Sense
Number magnitude comparison confusion
Poor number naming and writing
Understanding relative size of parts such as thirds,
tenths, 25% and their relationship to a whole unit
Fails to see "unreasonable" answers
Disregards decimals
Fails to read accurately the correct value of multi-digit
numbers because of their order and spacing
Source: Effective Instructional Practices for Students with Difficulties in Mathematics:
Findings from a Research Synthesis Gersten, Baker, Chard, Presented at the Center on
Instruction Mathematics (2006)
9

4 out of 3 people have
trouble with fractions

11
Interventions are NOT…
Preferential seating
Shortened assignments
Lowered expectations
Parent contacts
Classroom observations
Suspension
Retention
Extra Worksheets
Peer tutoring unless scientifically based Source: McCook, 2005

SRBI Resources for Parents
CSDE Website
www.sde.ct.gov/sde/cwp/view.asp?a=2618&q=322020
Intervention Central
www.interventioncentral.com
RTI Action Network
www.rtinetwork.org
National Ctr. For RTI
www.rti4success.org
Florida Center for Reading Research
www.fcrr.org
Intervention Central
www.interventioncentral.org


