
WASHINGTON’S TOP TRANSPORTATION CHALLENGES:
Meeting the State’s Need for Safe, Efficient Mobility and Economic Vitality
APRIL 2015
202-466-6706
tripnet.org
Founded in 1971, TRIP ® of Washington, DC, is a nonprofit organization that researches, evaluates and distributes economic and technical data on surface transportation issues. TRIP is sponsored by insurance companies, equipment manufacturers, distributors and suppliers; businesses involved in highway and transit engineering and construction; labor unions; and organizations concerned with efficient and safe surface transportation.

1
Executive Summary
Washington’s extensive transportation system provides the state’s residents, visitors and businesses with a high level of mobility, while acting as the backbone that supports the state’s economy. Washington’s transportation system enables the state’s residents and visitors to travel to work and school, visit family and friends, and frequent tourist and recreation attractions while providing businesses with reliable access to customers, materials, suppliers and employees. However, the state faces numerous challenges in providing a transportation system that is safe, well-maintained, efficient and adequately funded. As Washington works to retain its quality of life, maintain its level of economic competitiveness and achieve further economic growth, the state will need to preserve, maintain and modernize its roads, highways, bridges, transit, bike and pedestrian facilities by improving the physical condition of its transportation network and enhancing the system’s ability to provide efficient and reliable mobility for its residents, visitors and businesses. Making needed improvements to Washington’s transportation network could also provide a significant boost to the state’s economy by creating jobs in the short term and stimulating long term economic growth as a result of enhanced mobility and access.
Washington must maintain and improve its transportation system to foster economic growth and to support businesses in the state. In addition to economic growth, transportation improvements are needed to ensure safe, reliable mobility and a high quality of life for all residents. Meeting Washington’s need to modernize and maintain its system of roads, highways, bridges and transit will require significant local, state and federal funding.
The federal government is a critical source of funding for Washington’s surface transportation system. In July 2014, Congress approved an eight-month extension of the federal surface transportation program, MAP-21 (Moving Ahead for Progress in the 21st Century Act), which provides states with road, highway, bridge and transit funding through May 31, 2015.
TRANSPORTATION CHALLENGE: Deteriorated Pavement Conditions Approximately one third of Washington’s locally and state-maintained urban pavements and more than one-fifth of locally and state-maintained rural pavements are in poor condition. Pavement conditions are projected to deteriorate further in the future, as the state anticipates a $1.8 billion backlog over the next 10 years in funds needed for pavement preservation. Deteriorated pavement conditions provide a rough ride and cost motorists in the form of additional vehicle operating costs.
• Thirty-four percent of Washington’s major urban locally and state-maintained roads are in poor condition, while an additional 42 percent of the state’s major urban roads are in mediocre or fair condition. The remaining 24 percent are in good condition.
• Twenty-two percent of the state’s major rural locally and state-maintained roads are in
poor condition. An additional 52 percent of rural roads are in mediocre or fair condition and the remaining 26 percent are in good condition.
• Over the next decade, the Washington State Department of Transportation (WSDOT)
estimates a need of $2.8 billion for pavement preservation. However, only $1 billion will be available, leaving a backlog of $1.8 billion over the next decade.

2
• According to WSDOT, 10 percent of state-maintained roads are currently in need of resurfacing or reconstruction. Because of a lack of funding, that number is anticipated to more than quadruple by 2025, to 41 percent of state-maintained roads in need of resurfacing or reconstruction, if available state pavement preservation funding is evenly distributed by lane miles and vehicle miles traveled.
• Driving on rough roads costs Washington motorists a total of $2.9 billion annually in
extra vehicle operating costs (VOC) –$551 annually per driver. Costs include accelerated vehicle depreciation, additional repair costs, and increased fuel consumption and tire wear.
TRANSPORTATION CHALLENGE: Share of Deficient Bridges to Increase Approximately one-quarter of locally and state-maintained bridges (20 feet or longer) in Washington show significant deterioration or do not meet current design standards often because of narrow lanes, inadequate clearances or poor alignment.
• Five percent of Washington’s locally and state-maintained bridges are structurally deficient. A bridge is structurally deficient if there is significant deterioration of the bridge deck, supports or other major components. Structurally deficient bridges are often posted for lower weight or closed to traffic, restricting or redirecting large vehicles, including commercial trucks and emergency services vehicles.
• Twenty-one percent of Washington’s locally and state-maintained bridges are
functionally obsolete. Bridges that are functionally obsolete no longer meet current highway design standards, often because of narrow lanes, inadequate clearances or poor alignment.
• According to WSDOT, 110 state-maintained bridges that are currently rated in poor
condition are expected to remain in poor condition through 2020, due to a lack of funding. WSDOT also projects that 41 state-maintained bridges currently rated in fair or good condition, are expected to deteriorate to poor condition by 2020 due to a lack of funding.
• The overall number or state-maintained bridges rated poor in Washington is expected to increase from 137 currently to 176 in 2020, according to WSDOT.
• The list below details state-maintained bridges in the Puget Sound and Spokane areas that
are currently rated in poor condition. A full list of state-maintained bridges rated in poor condition throughout Washington can be found in Appendix A.

3
• By 2020, WSDOT reports that 41 state-maintained bridges, which are currently in fair or
good condition, will deteriorate to poor condition, based on current funding. The list below details state-maintained bridges in the Puget Sound area that currently are in good or fair condition, but are projected to decline to poor condition in 2020 due to a lack of sufficient funding. A list of all 41 state-maintained bridges throughout Washington that are currently in good or fair condition but are projected to decline to poor condition by 2020 can be found in Appendix B.

4
TRANSPORTATION CHALLENGE: Increasingly Congested Roadways Increasing levels of traffic congestion cause significant delays in Washington, particularly in the state’s larger urban areas, choking commuting and commerce. Traffic congestion robs commuters of time and money and imposes increased costs on businesses, shippers and manufacturers, which are often passed along to the consumer.
• Congestion on the state’s roadways and ridership on the state’s public transit systems is increasing, particularly in the Puget Sound area, where nearly 98 percent of delay hours occur.
• Congestion-related delays on state highways cost drivers and businesses $858 million in 2013, approximately $125 per Washingtonian.
• Several major commuting corridors in the Puget Sound area have experienced significant
increases in delay hours between 2011 and 2013, including I-5, I-90, SR 167 and I-405.
• The chart below details TRIP’s analysis and ranking of the 15 most congested commuting routes in the state, based on WSDOT’s 2014 Corridor Capacity Report. This analysis includes a morning trip during peak hours originating from the initial location and a reverse trip in the evening on the same route. It is weighted to include average time for trips on Single Occupancy Vehicle (SOV) lanes, High Occupancy Vehicle (HOV) and High Occupancy Toll (HOT) lanes and is ranked by the level of delay on each route, as measured by the additional time it takes to complete the trip during peak hours. The
5
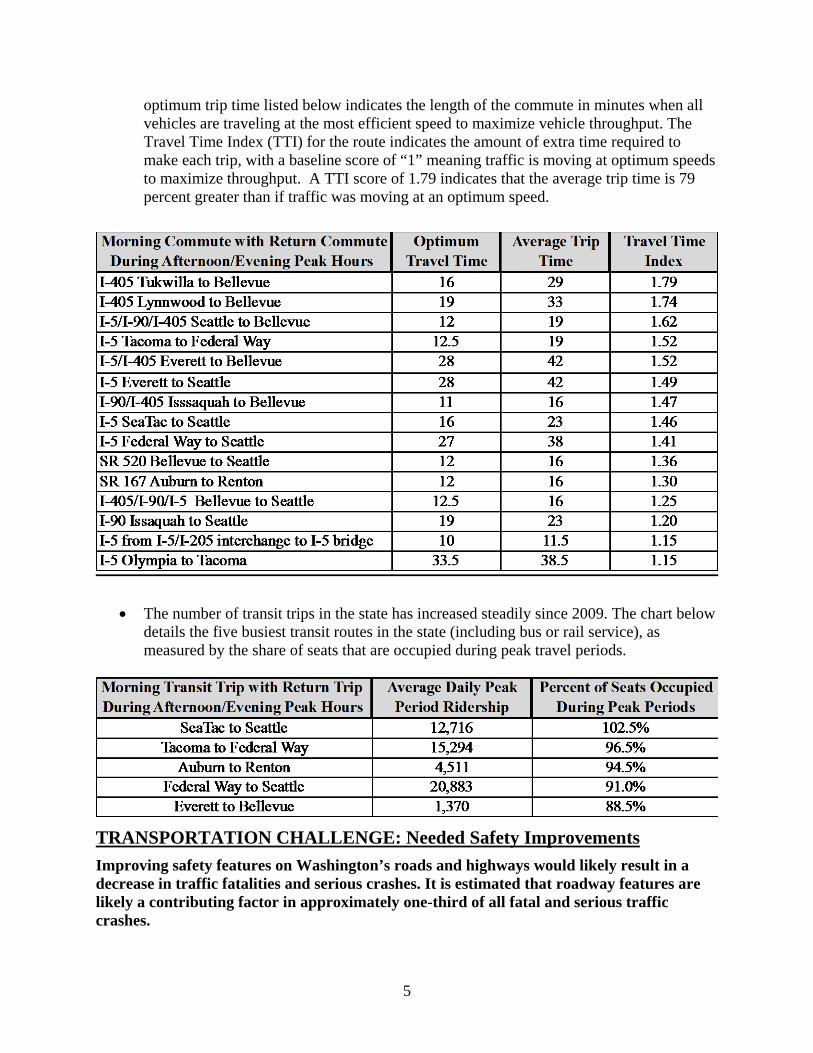
optimum trip time listed below indicates the length of the commute in minutes when all vehicles are traveling at the most efficient speed to maximize vehicle throughput. The Travel Time Index (TTI) for the route indicates the amount of extra time required to make each trip, with a baseline score of “1” meaning traffic is moving at optimum speeds to maximize throughput. A TTI score of 1.79 indicates that the average trip time is 79 percent greater than if traffic was moving at an optimum speed.
• The number of transit trips in the state has increased steadily since 2009. The chart below details the five busiest transit routes in the state (including bus or rail service), as measured by the share of seats that are occupied during peak travel periods.
TRANSPORTATION CHALLENGE: Needed Safety Improvements Improving safety features on Washington’s roads and highways would likely result in a decrease in traffic fatalities and serious crashes. It is estimated that roadway features are likely a contributing factor in approximately one-third of all fatal and serious traffic crashes.

6
• Between 2009 and 2013 a total of 2,280 people were killed in traffic crashes in Washington, an average of 456 fatalities per year.
• Washington’s overall traffic fatality rate of 0.76 fatalities per 100 million vehicle miles of
travel in 2013 is lower than the national traffic fatality rate of 1.09. • The fatality rate on Washington’s rural non-Interstate roads was 1.76 fatalities per 100
million vehicle miles of travel in 2013, nearly three and a half times higher than the 0.52 fatality rate on all other roads and highways in the state.
• Roadway features that impact safety include the number of lanes, lane widths, lighting
and adaptive lighting systems, lane markings, rumble strips, shoulders, guard rails, break away and other protective devices, median barriers, roundabouts, and other intersection designs. The cost of serious crashes includes lost productivity, lost earnings, medical costs, lawsuits, insurance cost and emergency services.
• Several factors are associated with vehicle crashes that result in fatalities, including
human factors, driver behavior, vehicle characteristics and roadway features. TRIP estimates that roadway features are likely a contributing factor in approximately one-third of fatal traffic crashes.
• Where appropriate, highway improvements can reduce traffic fatalities, serious injuries
and crash occurrence while improving traffic flow to help relieve congestion. Such improvements include removing, relocating or shielding obstacles; adding or improving medians; improved and adaptive lighting systems; variable speed limits and dynamic warning devices; adding rumble strips, wider lanes, wider and paved shoulders; upgrading roads from two lanes to four lanes; better road markings, roundabout and traffic signals; and facilities that provide for the integration of the various transportation modes.
TRANSPORTATION CHALLENGE: State’s Economic Growth Threatened by Deteriorated Roads, Lack of Adequate Highways The efficiency of Washington’s transportation system, particularly its highways, is critical to the health of the state’s economy. Increased deterioration of Washington’s roads and bridges and the lack of needed transportation improvements to serve economic development threaten the state’s economic vitality. New research from Oregon indicates that the cost of making needed road, highway, and bridge improvements is far less than the potential loss in state economic activity caused by a lack of adequate road, highway and bridge preservation.
• Washington’s key economic sectors -- manufacturing, tourism, agriculture, and technology -- are highly reliant on an efficient and well-maintained transportation system.
• Washington’s population reached approximately 7.1 million in 2013, a 45 percent increase since 1990. Washington had 5,301,630 licensed drivers in 2013.

7
• Vehicle miles traveled (VMT) in Washington increased by 28 percent from 1990 to 2013
– from 44.7 billion VMT in 1990 to 57.2 billion VMT in 2013. • From 1990 to 2013, Washington’s gross domestic product, a measure of the state’s
economic output, increased by 98 percent, when adjusted for inflation, above the national average of 65 percent.
• In 2012, $181 billion in goods was shipped from sites in Washington to sites outside the state, $169 billion worth of goods was shipped into the state and $253 billion of freight was shipped within the state, mostly by truck. Fifty-eight percent of the goods shipped annually in Washington are carried by trucks and another 20 percent are carried by courier services or multiple mode deliveries, which include trucking.
• Increasingly, companies are looking at the quality of a region’s transportation system when deciding where to re-locate or expand. Regions with congested or poorly maintained roads may see businesses relocate to areas with a smoother, more efficient and more modern transportation system.
• Highway accessibility was ranked the number two site selection factor behind only the
availability of skilled labor in a 2013 survey of corporate executives by Area Development Magazine.
• A 2014 report by the Oregon Department of Transportation (ODOT) concluded that
allowing its state’s major roads, highways and bridges to deteriorate would result in significant reduction in job growth and reduced state gross domestic product (GDP) as a result of reduced economic efficiency.
• The report found that allowing roads and bridges to deteriorate reduces business
productivity by increasing vehicle operating costs as a result of driving on rough roads, reducing travel speeds and increasing travel times because of route detours necessitated by weight-restricted bridges.
• As road and bridge conditions deteriorate, transportation agencies are likely to shift
resources from preservation projects, which extend the service life of roads and bridges, to more reactive maintenance projects, which results in higher lifecycle costs, the report found. Transportation agencies are also likely to respond to increased road and bridge deterioration by shifting funds from modernization projects, which relieve congestion and increase business productivity, to maintenance projects.
• The ODOT report estimated that the road, highway and bridge deterioration anticipated over the next 20 years will result in Oregon creating 100,000 fewer jobs and generating $9.4 billion less in state GDP.
• Oregon could avoid losing 100,000 jobs and $9.4 billion in GDP through 2035 by spending an additional $810 million more on road, highway and bridge repairs – nearly a 12-to-1 return on investment, according to the ODOT report.

8
TRANSPORTATION CHALLENGE: Inadequate Transportation Funding Without a significant boost in transportation funding at the local, state and federal level, the condition and efficiency of Washington’s surface transportation system will decline. Many needed transportation improvements may not be completed without additional funds. A recent national report found that improved access as a result of capacity expansions provides numerous regional economic benefits.
• Numerous needed transportation projects, listed below by geographic area, are unable to move forward due to inadequate transportation funding at the local, state and federal levels. The list of projects is based on WSDOT’s list of priority projects that are currently unfunded.
SEATTLE: SR 520 Corridor Improvements: This $1.4-1.57 billion project would complete corridor improvements between I-5 and the West High Rise to address the congestion and safety needs of the corridor. Widening I-405 from Renton to Lynnwood: This $1.1-1.3 billion project would continue the widening of the I-405 corridor between Renton and Bellevue, including the implementation of Express Toll Lanes and rebuilding interchanges. This project would also build the first segment of the I-405/SR 167 Interchange by constructing a direct connector on northbound and southbound lanes between SR 167 HOT and I-405 express toll lanes. This project would complete a 40 mile corridor-wide express toll facility. Mobility Improvements on I-5 from Tacoma to Everett: This $500 million - $1 billion project includes construction of an additional northbound I-5 lane past Seneca Street, integration of traffic management & modal systems, part-time transit bus shoulder lanes and other similar treatments throughout the corridor. Long range improvements could include new express toll lanes to improve HOV lane performance, lower-cost extensions of HOV or express toll lanes between Tacoma and Lakewood, an always-southbound lane in the I-5 reversible roadway, and the full range of operational, demand management, freight and transit enhancements needed to gain full utilization of the existing roadway. SR 520 Bellevue-Redmond Corridor Improvements: This $350-460 million project would construct improvements at the 148th Avenue NE Interchange and reconstruct the 124th Avenue NE Interchange to a full diamond interchange, reducing congestion and improving access to Bellevue and Redmond off the SR 520 corridor. I-90 Seattle to Issaquah Congestion Relief: This $193-250 project would implement tolling on the I-90 floating bridge, convert the HOV lane to an Express Toll Lane east of I-405, and restripe the roadway to allow for EB and WB shoulder use during peak periods between Eastgate and West Lake Sammamish Parkway and Sunset Way. SR 522 Widening from Kenmore to Monroe: This $170-225 million project would complete the widening of SR 522 between Woodinville and Monroe by adding a lane in each direction

9
between Paradise Lake Road and the Snohomish River. It would also construct a new interchange at Paradise Lake Rd. TACOMA/PIERCE COUNTY: I-5 JBLM Corridor Congestion Mitigation: This corridor experiences delays and heavy congestion during peak hours. This $250-450 million project would increase capacity on I-5 in the Joint Base Lewis-McChord corridor by adding one lane in each direction between Thorne Lane Interchange and the Steilacoom-DuPont Interchange, replacing the Thorne Lane, Berkeley Street and Steilacoom-DuPont Interchanges. The project also includes construction of the Gravelly Lake Drive to Thorne Connector to improve local access, along with bicycle and pedestrian facilities. Construct New SR 167 Freeway: The existing SR 167 route is insufficient to carry existing levels of traffic, leading to unreliable travel times in the Pierce County area and limiting freight movement from the Port to the Green River Valley. This $790-955 million project would construct a new alignment between SR 509 in Tacoma and SR 512 in Puyallup, including a new interchange at I-5, two lanes in each direction between I-5 and Valley Avenue, and one lane in each direction between Valley Avenue and SR 512. Construction of new SR 509 Freeway: This $758-960 million project would connect SR 509 south from SeaTac to I-5; including one lane in each direction between S 188th and S 24th/28th Avenue, two lanes in each direction between S24th/28th Avenue and I-5, interchanges at S 188th and S 24th, and improvements on I-5 in the vicinity of SR 516 to accommodate the SR 509 with connections to I-5 and local routes. These improvements would allow for improved freight movement south from SeaTac while providing an additional north-south corridor to alleviate heavy demands on I-5. SPOKANE: US 395 North Spokane Corridor Completion: This $750-980 project would complete the US 395 North corridor from Francis Avenue to I-90. It would also complete the connection with I-90 to further alleviate congestion in the area. SR 902/Geiger Boulevard Improvements: This $18-23 million project would construct roundabouts at ramp terminals and the SR 902/Geiger Boulevard intersection to improve traffic flow on the interchange. It would also modernize all ramps and widen the existing bridge over I-90 from two to four lanes. TRI-CITIES: I-82 West Richland/Red Mountain Interchange Improvements: This $3-4 million project would construct a roundabout at the SR 224/SR 225 and I-82 ramp terminals.
VANCOUVER:

10
I 5 Mill Plain Boulevard Interchange: This $80-104 million project provides interchange upgrades for vehicle and truck freight access through this heavily urban area. SR 14 Vancouver Corridor Expansion: This $60-79 million project would construct auxiliary lanes between I-205 and 164th Avenue, including improvements at the I-205NB/SR 14 Interchange. It would also construct the West Camas Slough Bridge. These improvements would make this congested route operate more efficiently.
STATEWIDE: I-90 Snoqualmie Pass Widening and Reconstruction: This $130-170 million project would widen an additional two-mile section of the roadway, including reconstruction of the Stampede Pass and Cabin Creek Interchanges to eliminate the existing low clearance. This major freight and recreational corridor experiences frequent congestion during peak travel times and the existing concrete is in need of replacement. US 2 Safety Enhancements: This $15-20 million project provides safety enhancements on US 2 between Snohomish and Skykomish. I-5 and 179th Street Interchange Reconstruction: This $60-79 million project reconstructs the existing interchange and adjacent roadways to allow for improved movements between I-5 and 179th Street in Vancouver. I-5 Slater Road Interchange in Ferndale: This $10-13 million project would improve this congested interchange, which is being strained by heavy commercial development nearby.
• The Federal Highway Administration estimates that each dollar spent on road, highway and bridge improvements results in an average benefit of $5.20 in the form of reduced vehicle maintenance costs, reduced delays, reduced fuel consumption, improved safety, reduced road and bridge maintenance costs and reduced emissions as a result of improved traffic flow.
• Signed into law in July 2012, MAP-21 (Moving Ahead for Progress in the 21st Century
Act), has improved several procedures that in the past had delayed projects, MAP-21 does not address long-term funding challenges facing the federal surface transportation program.
• In July 2014, Congress approved the Highway and Transportation Funding Act of 2014,
an eight-month extension of the federal surface transportation program, on which states rely for road, highway, bridge and transit funding. The program, initially set to expire on September 30, 2014, will now run through May 31, 2015. In addition to extending the current authorization of the highway and public transportation programs, the legislation will transfer nearly $11 billion into the Highway Trust Fund (HTF) to preserve existing levels of highway and public transportation investment through the end of May 2015.

11
• If Congress decides to provide additional revenues into the federal Highway Trust Fund in tandem with authorizing a new federal surface transportation program, a number of technically feasible revenue options have been identified by the American Association of State Highway and Transportation Officials (AASHTO).
• A significant boost in investment on the nation’s roads, highways, bridges and public
transit systems is needed to improve their condition and to meet the nation’s transportation needs, concluded a new report from AASHTO. The 2015 AASHTO Transportation Bottom Line Report found that annual investment in the nation’s roads, highways and bridges needs to increase from $88 billion to $120 billion and from $17 billion to $43 billion in the nation’s public transit systems, to improve conditions and meet the nation’s mobility needs.
• The 2015 AASHTO Transportation Bottom Line Report also found that the current
backlog in needed road, highway and bridge improvements is $740 billion.
• A recent national report found that improved access as a result of capacity expansions provides numerous regional economic benefits. Those benefits include higher employment rates, higher land value, additional tax revenue, increased intensity of economic activity and additional construction as a result of the intensified use.
• The 2012 report, “Interactions Between Transportation Capacity, Economic Systems and
Land Use,” prepared by the Strategic Highway Research Program for the Transportation Research Board, reviewed 100 projects, costing a minimum of $10 million, which expanded transportation capacity either to relieve congestion or enhance access.
• The projects analyzed in the report were completed no later than 2005 and included a
wide variety of urban and rural projects, including the expansion or addition of major highways, beltways, connectors, bypasses, bridges, interchanges, industrial access roads, intermodal freight terminals and intermodal passenger terminals.
• The expanded capacity provided by the projects resulted in improved access, which
resulted in reduced travel-related costs, faster and more reliable travel, greater travel speeds, improved reliability and increased travel volume.
• The report found that improved transportation access benefits a region by: enhancing the
desirability of an area for living, working or recreating, thus increasing its land value; increasing building construction in a region due to increased desirability for homes and businesses; increasing employment as a result of increased private and commercial land use; and increasing tax revenue as a result of increased property taxes, increased employment and increased consumption, which increases sales tax collection.
• The report found that benefits of a transportation capacity expansion unfolded over
several years and that the extent of the benefits were impacted by other factors including: the presence of complimentary infrastructure such as water, sewer and telecommunications; local land use policy; the local economic and business climate; and

12
whether the expanded capacity was integrated with other public investment and development efforts.
• For every $1 million spent on urban highway or intermodal expansion, the report estimated that an average of 7.2 local, long-term jobs were created at nearby locations as a result of improved access. An additional 4.4 jobs were created outside the local area, including businesses that supplied local businesses or otherwise benefited from the increased regional economic activity.
• For every $1 million spent on rural highway or intermodal expansion, the report
estimated that an average of 2.9 local, long-term jobs were created at nearby locations as a result of improved access. An additional 1.6 jobs were created outside the local area, including businesses that supplied local businesses or otherwise benefited from the increased regional economic activity.
• The report found that highway and intermodal capacity projects in urban areas created a
greater number of long-term jobs than in rural areas, largely due to the more robust economic environment and greater density in urban communities.
Sources of information for this report include the Washington State Department of Transportation (WSDOT), Federal Highway Administration (FHWA), the Bureau of Transportation Statistics (BTS), the U.S. Census Bureau, the American Association of State Highway and Transportation Officials (AASHTO), the Texas Transportation Institute (TTI) and the National Highway Traffic Safety Administration (NHTSA). All data used in the report is the latest available.

13
Introduction
Washington’s transportation system provides vital links for the state’s residents, visitors
and businesses, providing daily access to homes, jobs, shopping, natural resources and
recreation. Today, with the Evergreen State striving to support a high quality of life and
economic competitiveness, the modernization of Washington’s transportation system is crucial,
particularly to critical areas of the state’s economy including manufacturing, tourism, agriculture,
and technology.
As the U.S. and Washington work to sustain long-term economic growth, the
preservation and modernization of the state’s transportation system could play an important role
in retaining Washington’s economic competitiveness and improving its economic well-being by
providing needed jobs in the short term and by improving the productivity and competitiveness
of the state’s businesses in the long term.
However, Washington faces numerous challenges in providing a transportation system
that is safe, well-maintained, efficient and adequately funded. As Washington faces the challenge
of preserving and modernizing its transportation system, the future level of federal, state and
local transportation funding will be a critical factor in whether the state’s residents and visitors
continue to enjoy access to a safe and efficient transportation network. Meeting Washington’s
need to modernize and maintain its system of roads, highways and bridges will require
significant local, state and federal funding.
In July 2014, Congress approved an eight-month extension of the federal surface
transportation program, MAP-21 (Moving Ahead for Progress in the 21st Century Act), on which
states rely for road, highway, bridge and transit funding, through May 31, 2015.

14
This report examines the condition, use and safety of Washington’s roads, highways and
bridges, federal, state and local funding needs, and the future mobility needs of the state.
Population, Travel and Economic Trends in Washington
Washington’s residents and businesses require a high level of personal and commercial
mobility. Population increases and economic growth in the state have resulted in an increase in
the demand for mobility as well as an increase in vehicle miles of travel (VMT). To foster
quality of life and spur economic growth in Washington, it will be critical that the state provide a
safe and modern transportation system that can accommodate future growth in population,
tourism, recreation and vehicle travel.
Washington’s population grew to approximately 7.1 million residents in 2013, a 45
percent increase since 1990.1 Washington had 5,301,630 licensed drivers in 2013.2 From 1990
to 2013, Washington’s gross domestic product (GDP), a measure of the state’s economic output,
increased by 98 percent, when adjusted for inflation, surpassing the national average of 65
percent.3
From 1990 to 2013, annual VMT in Washington increased by 28 percent, from
approximately 44.7 billion miles to 57.2 billion miles.4

15
Condition of Washington’s Roads
The life cycle of Washington’s roads is greatly affected by the state and local
government’s ability to perform timely maintenance and upgrades to ensure that road and
highway surfaces last as long as possible. State maintained roads and highways in Washington
are in much better condition than roads maintained by local governments. But the condition of
state-maintained roads and highways is expected to deteriorate significantly over the next
decade, based on the current level of anticipated funding.
Thirty-four percent of Washington’s major locally and state-maintained urban roads are
in poor condition, while an additional 42 percent of the state’s major roads are in mediocre or
fair condition.5 The remaining 24 percent are in good condition.6 Twenty-two percent of the
state’s major rural locally and state-maintained roads are in poor condition.7 An additional 52
percent of rural roads are in mediocre or fair condition and the remaining 26 percent are in good
condition.8
Over the next decade, WSDOT estimates a need of $2.8 billion for pavement
preservation.9 However, only $1 billion will be available during this time, leaving a backlog of
$1.8 billion over the next decade.10 Due to this funding gap, the share of state-maintained
pavements in good condition will decline in the future, while the share of deficient pavements on
state-maintained roads and highways is set to increase. According to WSDOT, 10 percent of
state-maintained roads are currently in need of resurfacing or reconstruction.11 Because of a lack
of funding, that share is expected to more than quadruple by 2025, to 41 percent of state-
maintained roads in need of resurfacing or reconstruction, if available state pavement
preservation funding is evenly distributed by lane miles and vehicle miles traveled.12

16
Roads rated in poor condition may show signs of deterioration, including rutting, cracks
and potholes. In some cases, poor roads can be resurfaced, but often are too deteriorated and
must be reconstructed.
Pavement failure is caused by a combination of traffic, moisture, climate, and other
factors. Moisture often works its way into road surfaces and the materials that form the road’s
foundation. Road surfaces at intersections are even more prone to deterioration because the slow-
moving or standing loads occurring at these sites subject the pavement to higher levels of stress.
It is critical that roads are fixed before they require major repairs because reconstructing roads
costs approximately four to five times more than resurfacing them.13 As roads and highways
continue to age, they will reach a point of deterioration where routine paving and maintenance
will not be adequate to keep pavement surfaces in good condition and costly reconstruction of
the roadway and its underlying surfaces will become necessary.
The Costs to Motorists of Roads in Inadequate Condition
TRIP has calculated the additional cost to motorists of driving on roads in poor or
unacceptable condition. When roads are in poor condition – which may include potholes, rutting
or rough surfaces – the cost to operate and maintain a vehicle increases. These additional vehicle
operating costs (VOC) include accelerated vehicle depreciation, additional vehicle repair costs,
increased fuel consumption and increased tire wear. TRIP estimates that additional vehicle
operating costs borne by Washington motorists as a result of poor road conditions is $2.9 billion
annually - $551 annually per motorist.14

17
Additional vehicle operating costs have been calculated in the Highway Development
and Management Model (HDM), which is recognized by the U.S. Department of Transportation
and more than 100 other countries as the definitive analysis of the impact of road conditions on
vehicle operating costs. The HDM report is based on numerous studies that have measured the
impact of various factors, including road conditions, on vehicle operating costs.15
The HDM study found that road deterioration increases ownership, repair, fuel and tire
costs. The report found that deteriorated roads accelerate the pace of depreciation of vehicles and
the need for repairs because the stress on the vehicle increases in proportion to the level of
roughness of the pavement surface. Similarly, tire wear and fuel consumption increase as roads
deteriorate since there is less efficient transfer of power to the drive train and additional friction
between the road and the tires.
TRIP’s additional vehicle operating cost estimate is based on taking the average number
of miles driven annually by a motorist, calculating current vehicle operating costs based on
AAA’s 2014 vehicle operating costs and then using the HDM model to estimate the additional
vehicle operating costs paid by drivers as a result of substandard roads.16 Additional research on
the impact of road conditions on fuel consumption by the Texas Transportation Institute (TTI) is
also factored into TRIP’s vehicle operating cost methodology.
Bridge Conditions in Washington
Washington’s bridges form key links in the state’s highway system, providing
communities and individuals access to employment, schools, shopping and medical facilities,
18
and facilitating commerce and access for emergency vehicles. Due to a lack of sufficient
funding, bridge conditions are projected to deteriorate over the next five years.
Approximately one-fourth of Washington’s locally and state- maintained bridges (20 feet
or longer) are currently rated as structurally deficient or functionally obsolete. While these
bridges are inspected regularly and are safe for travel, they may need maintenance or
improvements to correct obsolete features.
Five percent of Washington’s locally and state maintained bridges are rated as
structurally deficient.17 A bridge is structurally deficient if there is significant deterioration of
the bridge deck, supports or other major components. Bridges that are structurally deficient may
be posted for lower weight limits or closed if their condition warrants such action. Deteriorated
bridges can have a significant impact on daily life. Restrictions on vehicle weight may cause
many vehicles – especially emergency vehicles, commercial trucks, school buses and farm
equipment – to use alternate routes to avoid posted bridges. Redirected trips also lengthen travel
time, waste fuel and reduce the efficiency of the local economy.
Twenty-one percent of Washington’s locally and state-maintained bridges are rated
functionally obsolete.18 Bridges that are functionally obsolete no longer meet current highway
design standards, often because of narrow lanes, inadequate clearances or poor alignment with
the approaching roadway.
The service life of bridges can be extended by performing routine maintenance such as
resurfacing decks, painting surfaces, insuring that a facility has good drainage and replacing
deteriorating components. But most bridges will eventually require more costly reconstruction
or major rehabilitation to remain operable.

19
According to WSDOT, 110 state-maintained bridges that are currently rated in poor
condition are expected to remain in poor condition through 2020, due to a lack of funding.
WSDOT also projects that 41 state-maintained bridges currently rated in fair or good condition,
are expected to deteriorate to poor condition by 2020 due to a lack of funding.19 • The overall
number or state-maintained bridges rated poor in Washington is expected to increase from 137
currently to 176 in 2020, according to WSDOT.
The list below details state-maintained bridges in the Puget Sound and Spokane areas that
are currently structurally deficient.20 A full list of structurally deficient state-maintained bridges
throughout Washington can be found in Appendix A.

20
Chart 1. State-maintained bridges rated poor in the Puget Sound and Spokane areas.
Source: WSDOT response to TRIP survey.
The list below details state-maintained bridges in the Puget Sound area that currently are
in good or fair condition, but are projected to decline to poor condition in 2020 due to a lack of
sufficient funding.21 A list of state-maintained bridges throughout Washington that are currently

21
in good or fair condition but are projected to decline to poor condition by 2020 can be found in
Appendix B.
Chart 2. State-maintained bridges in the Puget Sound area that are currently in good or fair condition but are projected to decline to poor condition by 2025.
Source: WSDOT response to TRIP survey.
Traffic Congestion in Washington
Increasing levels of traffic congestion cause significant delays in Washington,
particularly in the state’s larger urban areas, choking commuting and commerce. Traffic
congestion robs commuters of time and money and imposes increased costs on businesses,
shippers and manufacturers, which are often passed along to the consumer.
Congestion is increasing on the state’s roadways and ridership is increasing on the state’s
transit systems, particularly in the Puget Sound area, where nearly 98 percent of delay hours
occur.22 In addition to reducing quality of life, these delays also have a significant financial
impact on the state’s residents and businesses. Congestion-related delays on state highways cost
drivers and businesses $858 million in 2013, approximately $125 per Washingtonian.23 Several

22
major commuting corridors in the Puget Sound area have experienced significant increases in
delay hours between 2011 and 2013, including I-5, I-90, SR 167 and I-405.24
Chart 3: Increase in delay hours on major Puget Sound commuting corridors from 2011 to 2013.
Source: WSDOT 2014 Corridor Capacity Report.
The chart below details TRIP’s analysis and ranking of the most congested commuting
routes in the state, based on WSDOT’s 2014 Corridor Capacity Report. This analysis includes a
morning trip during peak hours originating in the first city and a reverse trip in the evening
during peak hours on the same route. It is weighted to include both High Occupancy Vehicle
(HOV) lanes and Single Occupancy Vehicle (SOV) lanes and is ranked by the level of delay on
each route, as measured by the additional time it takes to complete the trip during peak hours.
Target Times listed below indicate the length of the commute in minutes when all vehicles are
traveling at the most efficient speed to maximize vehicle throughput. The Travel Time Index
(TTI) for the route indicates the amount of extra time required to make each trip, with a baseline
score of “1”, meaning traffic is moving at optimum speeds to maximize throughput. A score of
1.79 indicates that average commutes on this corridor take 79 percent longer than if traffic was
moving at an optimum speed to allow the maximum vehicle throughput, while maintaining a
speed limit close to the posted speed limit.

23
Chart 4. Most congested commuting routes in Washington.
Source: TRIP analysis based on WSDOT 2014 Corridor Capacity Report.
Transit use in Washington has increased steadily since 2009. The chart below details the
five busiest transit routes in the state (including bus or rail service), as measured by the share of
seats that are occupied during peak travel periods.
Chart 5. Busiest transit routes in Washington, based on share of seats occupied during peak times.
Source: WSDOT 2014 Corridor Capacity Report.

24
Traffic Safety in Washington
A total of 2,280 people were killed in motor vehicle crashes in Washington from 2009
through 2013, an average of 456 fatalities per year.25
Chart 6. Traffic fatalities in Washington from 2009 – 2013.
Year Fatalities 2009 492 2010 460 2011 454 2012 438 2013 436 Total 2,280
Source: WA State Traffic Safety Commission – FARS data.
Four major factors are associated with fatal vehicle crashes: human factors, driver
behavior, vehicle characteristics and roadway features. It is estimated that roadway features are
likely a contributing factor in approximately one-third of fatal traffic crashes. Roadway features
that impact safety include the number of lanes, lane widths, lighting and adaptive lighting
systems, lane markings, rumble strips, shoulders, guard rails, breakaway, protective and other
shielding devices, median barriers, roundabouts and other intersection designs.
Washington’s overall traffic fatality rate of 0.76 fatalities per 100 million vehicle miles of
travel in 2013 is lower than the national average of 1.09.26 The fatality rate on Washington’s
non-Interstate rural roads was 1.76 fatalities per 100 million vehicle miles of travel in 2013,
nearly three and a half times higher than the fatality rate of 0.52 on all other roads and highways
in the state.27
Improving safety on Washington’s roadways can be achieved through further
improvements in vehicle safety; improvements in driver, pedestrian, and bicyclist behavior;
25
understanding human factor challenges and a variety of improvements in roadway safety
features.
The severity of serious traffic crashes could be reduced through roadway improvements,
where appropriate, such as adding turn lanes, removing, relocating or shielding obstacles,
installing breakaway features, adding or improving medians, widening lanes, widening and
paving shoulders, improving intersection layout, and providing better road markings, installing
roundabouts, installing facilities that address modal needs and integration of the modes across
the system, and upgrading or installing traffic signals.
Transportation Funding
Without a significant boost in transportation funding at the local, state and federal level,
the condition, efficiency and safety of Washington’s transportation system will decline.
Washington currently faces a backlog in needed transportation funding.
The most needed transportation projects in the state, listed below by geographic area , are
unable to move forward due to inadequate transportation funding at the local, state and federal
levels. The list of projects is based on WSDOT’s list of priority projects that are currently
unfunded.
SEATTLE/PUGET SOUND: SR 520 Corridor Improvements: This $1.4-1.57 billion project would complete corridor improvements between I-5 and the West High Rise to address the congestion and safety needs of the corridor. Widening I-405 from Renton to Lynnwood: This $1.1-1.3 billion project would continue the widening of the I-405 corridor between Renton and Bellevue, including the implementation of

26
Express Toll Lanes and rebuilding interchanges. This project would also build the first segment of the I-405/SR 167 Interchange by constructing a direct connector on northbound and southbound lanes between SR 167 HOT and I-405 express toll lanes. This project would complete a 40 mile corridor-wide express toll facility. Mobility Improvements on I-5 from Tacoma to Everett: This $500 million - $1 billion project includes construction of an additional northbound I-5 lane past Seneca Street, integration of traffic management & modal systems, part-time transit bus shoulder lanes and other similar treatments throughout the corridor. Long range improvements could include new express toll lanes to improve HOV lane performance, lower-cost extensions of HOV or express toll lanes between Tacoma and Lakewood, an always-southbound lane in the I-5 reversible roadway, and the full range of operational, demand management, freight and transit enhancements needed to gain full utilization of the existing roadway. SR 520 Bellevue-Redmond Corridor Improvements: This $350-460 million project would construct improvements at the 148th Avenue NE Interchange and reconstruct the 124th Avenue NE Interchange to a full diamond interchange, reducing congestion and improving access to Bellevue and Redmond off the SR 520 corridor. I-90 Seattle to Issaquah Congestion Relief: This $193-250 project would implement tolling on the I-90 floating bridge, convert the HOV lane to an Express Toll Lane east of I-405, and restripe the roadway to allow for EB and WB shoulder use during peak periods between Eastgate and West Lake Sammamish Parkway and Sunset Way. SR 522 Widening from Kenmore to Monroe: This $170-225 million project would complete the widening of SR 522 between Woodinville and Monroe by adding a lane in each direction between Paradise Lake Road and the Snohomish River. It would also construct a new interchange at Paradise Lake Rd. TACOMA/PIERCE COUNTY: I-5 JBLM Corridor Congestion Mitigation: This corridor experiences delays and heavy congestion during peak hours. This $250-450 million project would increase capacity on I-5 in the Joint Base Lewis-McChord corridor by adding one lane in each direction between Thorne Lane Interchange and the Steilacoom-DuPont Interchange, replacing the Thorne Lane, Berkeley Street and Steilacoom-DuPont Interchanges. The project also includes construction of the Gravelly Lake Drive to Thorne Connector to improve local access, along with bicycle and pedestrian facilities. Construct New SR 167 Freeway: The existing SR 167 route is insufficient to carry existing levels of traffic, leading to unreliable travel times in the Pierce County area and limiting freight movement from the Port to the Green River Valley. This $790-955 million project would construct a new alignment between SR 509 in Tacoma and SR 512 in Puyallup, including a new interchange at I-5, two lanes in each direction between I-5 and Valley Avenue, and one lane in each direction between Valley Avenue and SR 512.

27
Construction of new SR 509 Freeway: This $758-960 million project would connect SR 509 south from SeaTac to I-5; including one lane in each direction between S 188th and S 24th/28th Avenue, two lanes in each direction between S24th/28th Avenue and I-5, interchanges at S 188th and S 24th, and improvements on I-5 in the vicinity of SR 516 to accommodate the SR 509 with connections to I-5 and local routes. These improvements would allow for improved freight movement south from SeaTac while providing an additional north-south corridor to alleviate heavy demands on I-5. SPOKANE: US 395 North Spokane Corridor Completion: This $750-980 project would complete the US 395 North corridor from Francis Avenue to I-90. It would also complete the connection with I-90 to further alleviate congestion in the area. SR 902/Geiger Boulevard Improvements: This $18-23 million project would construct roundabouts at ramp terminals and the SR 902/Geiger Boulevard intersection to improve traffic flow on the interchange. It would also modernize all ramps and widen the existing bridge over I-90 from two to four lanes. TRI-CITIES: I-82 West Richland/Red Mountain Interchange Improvements: This $3-4 million project would construct a roundabout at the SR 224/SR 225 and I-82 ramp terminals.
VANCOUVER: I 5 Mill Plain Boulevard Interchange: This $80-104 million project provides interchange upgrades for vehicle and truck freight access through this heavily urban area. SR 14 Vancouver Corridor Expansion: This $60-79 million project would construct auxiliary lanes between I-205 and 164th Avenue, including improvements at the I-205NB/SR 14 Interchange. It would also construct the West Camas Slough Bridge. These improvements would make this congested route operate more efficiently.
STATEWIDE: I-90 Snoqualmie Pass Widening and Reconstruction: This $130-170 million project would widen an additional two-mile section of the roadway, including reconstruction of the Stampede Pass and Cabin Creek Interchanges to eliminate the existing low clearance. This major freight and recreational corridor experiences frequent congestion during peak travel times and the existing concrete is in need of replacement. US 2 Safety Enhancements: This $15-20 million project provides safety enhancements on US 2 between Snohomish and Skykomish.

28
I-5 and 179th Street Interchange Reconstruction: This $60-79 million project reconstructs the existing interchange and adjacent roadways to allow for improved movements between I-5 and 179th Street in Vancouver. I-5 Slater Road Interchange in Ferndale: This $10-13 million project would improve this congested interchange, which is being strained by heavy commercial development nearby.
The federal government provides some funding for the state and local transportation
system largely as part MAP-21 (Moving Ahead for Progress in the 21st Century Act), the current
two-year federal surface transportation program, which expires on May 31, 2015.
The federal government is a critical source of funding for Washington’s roads, highways,
bridges and transit systems and provides a significant return to Washington in road and bridge
funding based on the revenue generated in the state by the federal motor fuel tax.
Federal funds for highway and transit improvements in Washington are provided through
the federal Highway Trust Fund, which raises revenue through federal user fees, largely an 18.4
cents-per-gallon tax on gasoline and a 24.4 cents-per-gallon tax on diesel fuel. Since 2008
revenue into the federal Highway Trust Fund has been inadequate to support legislatively set
funding levels so Congress has transferred approximately $53 billion in general funds and an
additional $2 billion from a related trust fund into the federal Highway Trust Fund.28
Signed into law in July 2012, MAP-21 has improved several procedures that in the past
had delayed projects. MAP-21 does not address long-term funding challenges facing the federal
surface transportation program. In July 2014, Congress approved the Highway and
Transportation Funding Act of 2014, an eight-month extension of the federal surface
transportation program on which states rely for road, highway, bridge and transit funding. The
program, initially set to expire on September 30, 2014, will now run through May 31, 2015. In
addition to extending the current authorization of the highway and public transportation

29
programs, the legislation transferred nearly $11 billion into the Highway Trust Fund (HTF) to
preserve existing levels of highway and public transportation investment through the end of May
2015.
If Congress decides to provide additional revenues into the federal Highway Trust Fund
in tandem with authorizing a new federal surface transportation program, a number of technically
feasible revenue options have been identified by the American Association of State Highway and
Transportation Officials (AASHTO).
A significant boost in investment on the nation’s roads, highways, bridges and public
transit systems is needed to improve their condition and to meet the nation’s transportation
needs, concluded a new report from the American Association of State Highway and
Transportation Officials.
The 2015 AASHTO Transportation Bottom Line Report found that annual investment in
the nation’s roads, highways and bridges needs to increase from $88 billion to $120 billion and
from $17 billion to $43 billion in the nation’s public transit systems, to improve conditions and
meet the nation’s mobility needs.29
The 2015 AASHTO Transportation Bottom Line Report also found that the current
backlog in needed road, highway and bridge improvements is $740 billion.30 The backlog
includes a $392 billion backlog for road and highway rehabilitation, a $112 billion backlog in
needed bridge rehabilitation and a $237 billion backlog in needed highway capacity additions.31

30
Importance of Transportation to Economic Growth
Today’s culture of business demands that an area have well-maintained and efficient
roads, highways and bridges if it is to remain economically competitive. Global communications
and the impact of free trade in North America and elsewhere have resulted in a significant
increase in freight movement, making the quality of a region’s transportation system a key
component in a business’s ability to compete locally, nationally and internationally.
A lack of adequate access, roadway safety features or road and bridge repairs can impede
the development of economic growth in the state by reducing productivity. Limited road and
highway access, safety or preservation can reduce the efficiency of businesses, shippers and
manufacturers, by increasing transportation costs.
Reduced access and mobility can reduce the attractiveness of a location to a company to
consider expansion or even to locate a new facility. And, the costs associated with delays as well
as increased vehicle operating costs due to a deficient transportation system can increase overall
costs for trucking and shipping companies, leading to revenue losses, lower pay for employees,
and higher consumer costs.
Businesses have responded to improved communications and the need to cut costs with a
variety of innovations including just-in-time delivery, increased small package delivery, demand-
side inventory management and e-commerce. The result of these changes has been a significant
improvement in logistics efficiency as firms move from a push-style distribution system, which
relies on large-scale warehousing of materials, to a pull-style distribution system, which relies on
smaller, more strategic movement of goods. These improvements have made mobile inventories

31
the norm, resulting in the nation’s trucks literally becoming rolling warehouses. This practice
makes traffic operations and time delay a critically important factor in economic development.
Highways are vitally important to continued economic development in Washington,
particularly to the state’s agriculture, manufacturing, tourism, mining and health care sectors. As
the economy expands, creating more jobs and increasing consumer confidence, the demand for
consumer and business products grows. In turn, manufacturers ship greater quantities of goods to
market to meet this demand, a process that adds to truck traffic on the state’s highways and
major arterial roads.
Annually, $181 billion in goods are shipped from sites in Washington to sites outside the
state, $169 billion worth of goods were shipped into the state and $253 billion of freight was
shipped within the state, mostly by truck. Fifty-eight percent of the goods shipped annually in
Washington are carried by trucks and another 20 percent are carried by courier services or
multiple mode deliveries, which include trucking.32
The cost of road and bridge improvements are more than offset by the reduction of user
costs associated with driving on rough roads, the improvement in business productivity, the
reduction in delays and the improvement in traffic safety. The Federal Highway Administration
estimates that each dollar spent on road, highway and bridge improvements results in an average
benefit of $5.20 in the form of reduced vehicle maintenance costs, reduced delays, reduced fuel
consumption, improved safety, reduced road and bridge maintenance costs and reduced
emissions as a result of improved traffic flow.33
Local, regional and state economic performance is improved when a region’s surface
transportation system is expanded or repaired. This improvement comes as a result of the initial
job creation and increased employment created over the long-term because of improved access,
reduced transport costs and improved safety. In fact, highway accessibility was ranked the

32
number two site selection factor behind only the availability of skilled labor in a 2013 survey of
corporate executives by Area Development Magazine.34
Increasingly, companies are looking at the quality of a region’s transportation system
when deciding where to re-locate or expand. Regions with congested or poorly maintained roads
may see businesses relocate to areas with a smoother, more efficient and more modern
transportation system.
A 2014 report by the Oregon Department of Transportation (ODOT) concluded that
allowing the state’s major roads, highways and bridges to deteriorate would result in significant
reduction in job growth and reduced state gross domestic product as a result of reduced
economic efficiency.
The ODOT report used a sophisticated model which integrates transportation, land use
and economic activity to compare how an economy operates when a transportation system is
well-maintained versus when it is allowed to deteriorate. The report found that deteriorated
pavements, which result in a rougher and slower ride for vehicles, and deteriorated bridges,
which need to be closed to heavy trucks, reduce economic productivity by increasing
transportation costs.
The report found that allowing roads and bridges to deteriorate reduces business
productivity by increasing vehicle operating costs as a result of driving on rough roads, reducing
travel speeds and increasing travel times because of route detours necessitated by weight-
restricted bridges and reducing the ability of transportation agencies to fund needed highway
modernization projects to improve access.35
As road and bridge conditions deteriorate, transportation agencies are likely to shift
resources from preservation projects, which extend the service life of roads and bridges, to more

33
reactive maintenance projects, which results in higher lifecycle costs, the report found.36
Transportation agencies are also likely to respond to increased road and bridge deterioration by
shifting funds from modernization projects, which relieve congestion and increase business
productivity, to maintenance projects.
The ODOT report estimated that the road, highway and bridge deterioration anticipated
over the next 20 years will result in Oregon creating 100,000 fewer jobs and generating $9.4
billion less in state gross domestic product (GDP).37 Oregon could avoid losing 100,000 jobs and
$9.4 billion in GDP through 2035 by spending an additional $810 million more on road, highway
and bridge repairs – nearly a 12 to 1 return on investment.38
Study on Impact of U.S. Highway Capacity Additions
A national report that studied the economic results of 100 recent highway capacity
expansion projects has provided significant new insights into how enhancing regional mobility
provides long-term economic benefits. The 2012 report, “Interactions Between Transportation
Capacity, Economic Systems and Land Use,” was prepared by the Strategic Highway Research
Program for the Transportation Research Board, which is a program of the National Academy of
Sciences. The report reviewed 100 projects, costing a minimum of $10 million, which expanded
transportation capacity either to relieve congestion or enhance access.
The projects were carefully selected to ensure a wide range of project types and land use
settings. The projects, completed no later than 2005, included a wide variety of urban and rural
projects, including the provision or expansion of intercity highways, local access roads,
interchanges, bridges, bypasses and intermodal facilities. The projects expanded or added major

34
highways, beltways, connectors, bypasses, bridges, interchanges, industrial access roads,
intermodal freight terminals and intermodal passenger terminals. The expanded capacity
provided by the projects resulted in improved access, which resulted in reduced travel-related
costs, faster and more reliable travel, greater travel speeds, improved reliability and increased
travel volume.
The report found that the improved access as a result of capacity expansions provided
numerous regional economic benefits, including increased employment, increased land value,
increased tax revenue, increased intensity of economic activity, increased land prices and
additional construction as a result of the intensified use.39
The report further noted that improved transportation access benefits a region by:
enhancing the desirability of an area for living, working or recreating, thus increasing its land
value; increasing building construction in a region due to increased desirability for homes and
businesses; increasing employment as a result of increased private and commercial land use; and
increasing tax revenue as a result of increased property taxes, increased employment and
increased consumption, which increases sales tax collection.40
According to the report, “transportation projects lead to multifaceted forms of economic
development impact, which may include effects on employment, income, land use, property
values or business construction.”41
The report found that benefits of a transportation capacity expansion unfolded over
several years and that the extent of the benefits were impacted by other factors including: the
presence of complimentary infrastructure such as water, sewer and telecommunications; local
land use policy; the local economic and business climate; and whether the expanded capacity
was integrated with other public investment and development efforts. “In some cases, an area

35
with a higher growth trend may tend to be better positioned to take advantage of new highway
connections or capacity,” the report found.42
The report provided estimates on the average number of long-term jobs created as a result
of increased transportation capacity, both within the local area and also outside of the immediate
area of the improved access. For every $1 million spent on increased transportation capacity, the
report estimated that an average of seven local, long-term jobs were created at nearby locations
as a result of improved access. An additional 4.2 jobs outside the local area were created,
including businesses that supplied local businesses or otherwise benefited from the increased
regional economic activity.43
Highway and other intermodal capacity projects in urban areas created a greater number
of long-term jobs than in rural areas, largely due to the more robust economic environment and
greater density in urban communities.44 Every $1 million spent on urban highway or intermodal
expansion projects was found to result in an additional 7.2 local long-term jobs and an additional
4.4 non-local, long-term jobs, while every $1 million spent on rural highway or intermodal
expansion projects was found to result in an additional 2.9 local, long-term jobs and an
additional 1.6 non-local, long-term jobs.45
Conclusion
As Washington works to build and enhance a thriving, growing and dynamic state, it will
be critical that it is able to provide a 21st Century transportation system that can accommodate
the mobility demands of a modern society.
36
Making needed improvements to Washington’s transportation system could provide a
significant boost to the state’s economy by creating jobs in the short term and stimulating long
term economic growth as a result of enhanced mobility and access.
Without substantial and reliable federal, state and local transportation funding, numerous
projects to improve the condition, safety and efficiency of Washington’s transportation system
will not be able to proceed, hampering the state’s ability to improve the condition and
performance of its roads, highways, bridges and transit systems to enhance safety, quality of life
and economic development opportunities in the state.
# # #

37
Endnotes
1 U.S. Census Bureau (2013). 2 Highway Statistics (2013). Federal Highway Administration. DL-1C 3 TRIP analysis of Bureau of Economic Analysis data. 4 U.S. Department of Transportation - Federal Highway Administration: Highway Statistics 1990 and 2013. 5 TRIP analysis of Federal Highway Administration data. FHWA Highway Statistics 2013. 6 Ibid. 7 Ibid. 8 Ibid. 9 The Gray Notebook. WSDOT’s quarterly performance report on transportation systems, programs and department management. Published February 2015. 10 Ibid. 11 Pavement Preservation: What Does 40 % Funding Do? (2015) Washington State Department of Transportation. 12 Ibid. 13 Selecting a Preventative Maintenance Treatment for Flexible Pavements. R. Hicks, J. Moulthrop. Transportation Research Board. 1999. Figure 1. 14 TRIP calculation. 15 Highway Development and Management: Volume Seven. Modeling Road User and Environmental Effects in HDM-4. Bennett, C. and Greenwood, I. 2000. 16 Your Driving Costs. American Automobile Association. 2014. 17 Federal Highway Administration (2015). National Bridge Inventory. 18 Ibid. 19 WSDOT response to TRIP survey. 20 Ibid. 21 Ibid. 22 The 2014 Corridor Capacity Report. WSDOT, December 2014. 23 Ibid. 24 Ibid. 25 WA Traffic Safety Commission - FARS data (2014). 26 TRIP analysis of National Highway Traffic Safety Administration data. 27 Ibid. 28 “Surface Transportation Reauthorization and the Solvency of the Highway Trust Fund,” presentation by Jim Tyson, American Association of State Highway and Transportation Officials (2014). 29 2015 AASHTO Bottom Line Report (2014) AASHTO. P. 2. 30 2015 AASHTO Bottom Line Report (2014) AASHTO. P. 3. 31 Ibid. 32 FHWA Freight Analysis Framework (2014). http://faf.ornl.gov/fafweb/Extraction1.aspx , http://faf.ornl.gov/fafweb/FUT.aspx 33 FHWA estimate based on its analysis of 2006 data. For more information on FHWA’s cost-benefit analysis of highway investment, see the 2008 Status of the Nation's Highways, Bridges, and Transit: Conditions and Performance. 34 Area Development Magazine (2014). 28th Annual Survey of Corporate Executives: Availability of Skilled Labor New Top Priority. . http://www.areadevelopment.com/Corporate-Consultants-Survey-Results/Q1-2014/28th-Corporate-Executive-RE-survey-results-6574981.shtml?Page=2 35 Rough Roads Ahead: The Cost of Poor Highway Conditions to Oregon’s Economy. P. 1. 36 Ibid. 37 Ibid. 38 Rough Roads Ahead: The Cost of Poor Highway Conditions to Oregon’s Economy. P. 2, 16.

38
39 Strategic Highway Research Program (2012). Transportation Research Board. “Interactions Between Transportation Capacity, Economic Systems and Land Use.” P. 6 40 Ibid. P. 17. 41 Strategic Highway Research Program (2012). Transportation Research Board. “Interactions Between Transportation Capacity, Economic Systems and Land Use.” P. 1. 42 Strategic Highway Research Program (2012). Transportation Research Board. “Interactions Between Transportation Capacity, Economic Systems and Land Use.” P. 11. 43 Strategic Highway Research Program (2012). Transportation Research Board. “Interactions Between Transportation Capacity, Economic Systems and Land Use.” P. 22. Additional employment estimates were provided in response to a TRIP request. 44 Strategic Highway Research Program (2012). Transportation Research Board. “Interactions Between Transportation Capacity, Economic Systems and Land Use.” P. 8. 45 Strategic Highway Research Program (2012). Transportation Research Board. “Interactions Between Transportation Capacity, Economic Systems and Land Use.” P. 22. Additional employment estimates were provided in response to a TRIP request.


