NIAS
MA NDAILINGNATAL
TAPANULISELATAN
NIASSELATAN
PADANGLAWAS
KEP ULA UANMENTAWA I
PESISIRSELATAN
SOLOK
SIJUN JU NG
TANAHDATARPADANG
PARIAMAN
AGAM
LIMAPULUHKOTA
PASAMAN
SOLOKSELATAN
DHARMASRAYA
PASAMANBARAT
KOTAPADANG
KOTASOLOK
KOTASAWAHLUNTO
KOTAPADANG
PANJANG
KOTABUKITTINGGI
KOTAPAYAKUMBUH
KOTAPARIAMAN
KUANTANSIN GINGI
INDRAGIRI
PELALAWAN
SIA K
KAMPAR
ROKANHULU
BENGKALIS
KOTAPEKANBA RU
KERINCIMERAN GIN
BUNGO
SUNGAIPEN UH
BENGKULUUTARA
MU KOMUKO
Hutapanjang
Kerinci
Kunyit
Marapi
Pendan
Sarik-Gajah
Sorikmarapi
Sumbing
Talak Mau
Talang
Tandikat
Pekanbaru
Padang
Panyabungan
Sibuhuan
Pekanbaru
Bangkinang
Pangkalan Kerinci
Teluk Kuantan
Pasir Pengaraian
Siak Sri Indrapura
Padang
Bukittinggi
Padangpanjang
Pariaman
Payakumbuh
Sawahlunto
Solok
Lubuk Basung
LubukSikaping
Painan
MuaroSijunjung
Batusangkar
PulauPunjung
Tuapejat
Sarilamak
ParitMalintang
Simpang Empat
Arosuka
Padang Aro
Sungai Penuh
MuaraBungo
Siulak
Arga Makmur
Mukomuko
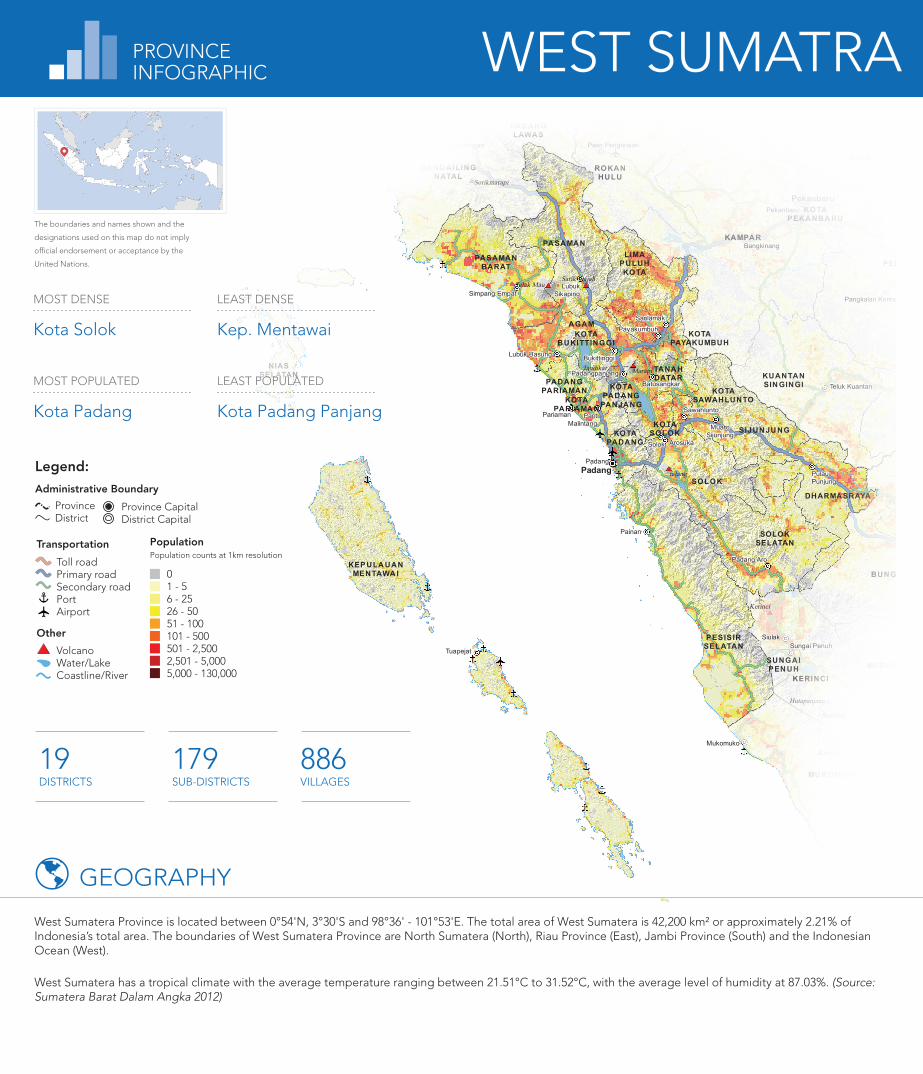
LEAST POPULATED
Kota Padang Panjang
MOST DENSE
Kota Solok
MOST POPULATED
Kota Padang
LEAST DENSE
Kep. Mentawai
19DISTRICTS
179SUB-DISTRICTS
886VILLAGES
GEOGRAPHY
West Sumatera Province is located between 0°54'N, 3°30'S and 98°36' - 101°53'E. The total area of West Sumatera is 42,200 km² or approximately 2.21% of Indonesia’s total area. The boundaries of West Sumatera Province are North Sumatera (North), Riau Province (East), Jambi Province (South) and the Indonesian Ocean (West).
West Sumatera has a tropical climate with the average temperature ranging between 21.51°C to 31.52°C, with the average level of humidity at 87.03%. (Source: Sumatera Barat Dalam Angka 2012)
01 - 56 - 2526 - 5051 - 100101 - 500501 - 2,5002,501 - 5,0005,000 - 130,000
PopulationPopulation counts at 1km resolution
Transportation
Toll roadPrimary roadSecondary roadPortAirport
Province CapitalDistrict Capital
Other
VolcanoWater/LakeCoastline/River
Administrative Boundary
Legend:
ProvinceDistrict
The boundaries and names shown and the
designations used on this map do not imply
official endorsement or acceptance by the
United Nations.
PROVINCEINFOGRAPHIC WEST SUMATRA
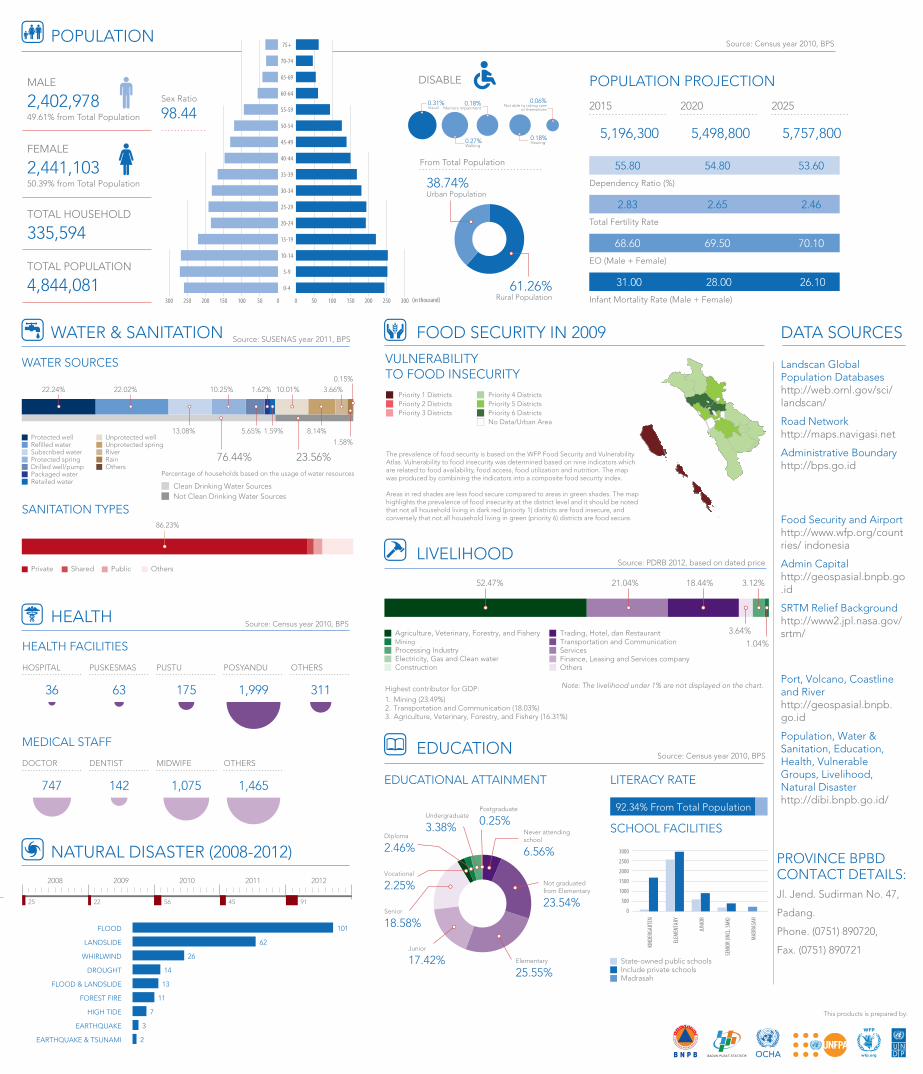
POPULATION
24
WATER & SANITATION
HEALTH FACILITIES
MEDICAL STAFF
PUSKESMAS PUSTUHOSPITAL POSYANDU OTHERS
63 17536 1,999 311
747 142 1,4651,075
DENTIST MIDWIFEDOCTOR OTHERS
2008 2009 2010 2011 2012
9145562225
14
62
26
11
7
13
3
101FLOOD
FLOOD & LANDSLIDE
HIGH TIDE
EARTHQUAKE
EARTHQUAKE & TSUNAMI
FOREST FIRE
DROUGHT
WHIRLWIND
LANDSLIDE
2
Priority 1 DistrictsPriority 2 DistrictsPriority 3 Districts
Priority 4 DistrictsPriority 5 DistrictsPriority 6 DistrictsNo Data/Urban Area
The prevalence of food security is based on the WFP Food Security and Vulnerability Atlas. Vulnerability to food insecurity was determined based on nine indicators which are related to food availability, food access, food utilization and nutrition. The map was produced by combining the indicators into a composite food security index. Areas in red shades are less food secure compared to areas in green shades. The map highlights the prevalence of food insecurity at the district level and it should be noted that not all household living in dark red (priority 1) districts are food insecure, and conversely that not all household living in green (priority 6) districts are food secure.
EDUCATIONAL ATTAINMENT LITERACY RATE
State-owned public schoolsInclude private schoolsMadrasah
KIND
ERGA
RTEN
ELEM
ENTA
RY
JUNI
OR
SENI
OR (I
NCL.
SMK)
MAD
RASA
H
SCHOOL FACILITIES
0
500
1000
1500
2000
2500
3000
Senior
18.58%
Vocational
2.25% Not graduatedfrom Elementary
23.54%
Elementary
25.55%
Junior
17.42%
Diploma
2.46%
Undergraduate
3.38%
Postgraduate
0.25%Never attendingschool
6.56%
92.34% From Total Population
Highest contributor for GDP:1. Mining (23.49%)2. Transportation and Communication (18.03%)3. Agriculture, Veterinary, Forestry, and Fishery (16.31%)
ServicesFinance, Leasing and Services companyOthers
Transportation and CommunicationTrading, Hotel, dan Restaurant
Processing IndustryElectricity, Gas and Clean waterConstruction
MiningAgriculture, Veterinary, Forestry, and Fishery
21.04% 18.44% 3.12%52.47%
3.64%
Note: The livelihood under 1% are not displayed on the chart.
1.04%
HEALTH
NATURAL DISASTER (2008-2012)
FOOD SECURITY IN 2009
LIVELIHOOD
EDUCATION
Source: SUSENAS year 2011, BPS
Source: Census year 2010, BPS
Source: Census year 2010, BPS
Source: PDRB 2012, based on dated price
Source: Census year 2010, BPS
DATA SOURCES
PROVINCE BPBD CONTACT DETAILS: Jl. Jend. Sudirman No. 47,
Padang.
Phone. (0751) 890720,
Fax. (0751) 890721
Landscan Global Population Databaseshttp://web.ornl.gov/sci/ landscan/
Road Networkhttp://maps.navigasi.net
Administrative Boundaryhttp://bps.go.id
Food Security and Airporthttp://www.wfp.org/countries/ indonesia
Admin Capitalhttp://geospasial.bnpb.go.id
SRTM Relief Backgroundhttp://www2.jpl.nasa.gov/srtm/
Port, Volcano, Coastline and Riverhttp://geospasial.bnpb.go.id
Population, Water & Sanitation, Education, Health, Vulnerable Groups, Livelihood, Natural Disasterhttp://dibi.bnpb.go.id/
VULNERABILITYTO FOOD INSECURITY
This products is prepared by:
INDRAGIRIHULU
INDRAGIRIHIL IR
KEP ULA UANMERAN TI
SARO LAN GUN
BATANGHARI
TEB O
MUSIRAWAS
REJANGLEB ONG
LEB ONG
KEPAHIANG
Belirang-Beriti
BukitDaun
Rengat
Siak Sri Indrapura
Bangko
MuaraTebo
Curup
Muara Aman
0-4
5-9
10-14
15-19
20-24
25-29
30-34
35-39
40-44
45-49
50-54
55-59
60-64
65-69
70-74
75+
0 50 100 150 200 250 300050100150200250300 (in thousand)
2015
5,196,300
2020
5,498,800
2025
5,757,800
POPULATION PROJECTION
Total Fertility Rate
Infant Mortality Rate (Male + Female)
Dependency Ratio (%)
EO (Male + Female)
55.80
2.83
68.60
31.00
53.60
2.46
70.10
26.10
54.80
2.65
69.50
28.00
TOTAL HOUSEHOLD
335,594
TOTAL POPULATION
4,844,081
MALE
2,402,97849.61% from Total Population
Sex Ratio
98.44
FEMALE
2,441,10350.39% from Total Population 38.74%
Urban Population
61.26%Rural Population
SANITATION TYPES86.23%
Private Public OthersShared
76.44% 23.56%
22.24% 22.02%
13.08%
10.25%
5.65%
1.62%
1.59%
10.01%
8.14%
3.66%
1.58%
0.15%
WATER SOURCES
Protected well
Packaged water
Refilled water
Protected springSubscribed water
Drilled well/pump
Retailed water
Unprotected well
Others
RiverUnprotected spring
Rain
Clean Drinking Water Sources Not Clean Drinking Water Sources
Percentage of households based on the usage of water resources
DISABLE
From Total Population
0.31%Visual
0.27%Walking
0.18%Memory impairment
0.18%Hearing
0.06%Not able to taking care
of themselves


