What can fingerprinting tell usabout PCB sources in the Spokane
River?
Lisa A. Rodenburg
Department of Environmental SciencesSchool of Environmental and Biological Sciences
Rutgers, the State University of New Jersey
PCB fingerprinting made possible by:
• Measuring most or all congeners– EPA method 1668 (all 209 congeners)
OR– Analysis of a long list of congeners by
ECD or other methodsBUT
– Virtually impossible to combine datafrom different methods
• Sophisticated sourceapportionment tools such as:– Polytopic Vector Analysis (PVA)– Positive Matrix Factorization (PMF)

But also by:
• Good data management!– Much more than just an Excel spreadsheet– All data is transmitted and maintained (inc. metadata, blanks, etc.)
– Use an EDD (electronic data delivery) format
• Metadata!– Detection limits and surrogate recoveries
• Public availability of data– And metadata! (Ex: STORET doesn’t include surrogate recoveries)
– Query is easy, output makes sense!
• Good project planning– Using the same method for all media– Measuring all analytes in all samples– Making sure all partners follow the same procedures
(USACE, USFWS, state, federal agencies)

PCB source categories
• Non-Aroclor sources (esp. pigments)
• Dechlorination of Aroclors
• Aroclors
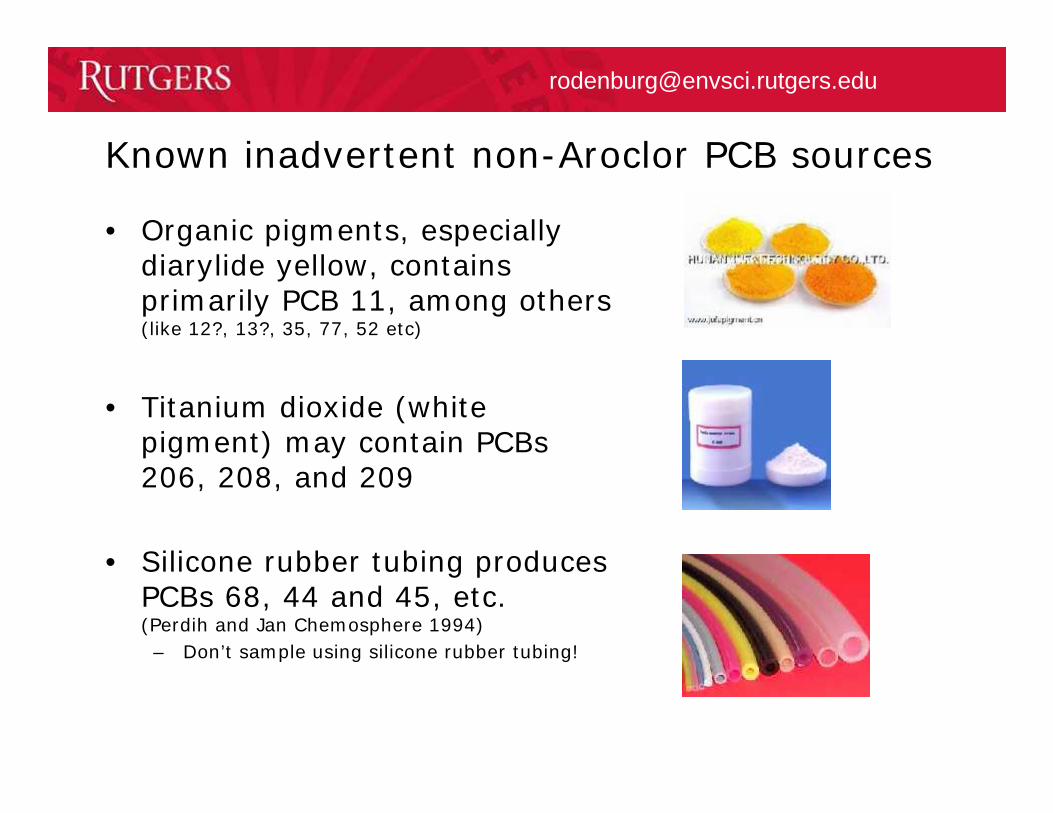
Known inadvertent non-Aroclor PCB sources
• Organic pigments, especiallydiarylide yellow, containsprimarily PCB 11, among others(like 12?, 13?, 35, 77, 52 etc)
• Titanium dioxide (whitepigment) may contain PCBs206, 208, and 209
• Silicone rubber tubing producesPCBs 68, 44 and 45, etc.(Perdih and Jan Chemosphere 1994)– Don’t sample using silicone rubber tubing!

Comparison ofdechlorinationpatterns
0%5%
10%15%20%25%30%35%40%45%50%
4 15 16 17 18 19 20 22 25 26 31 37 40 42 43 44 45 46 48 49 50 56 59 60 61 64 66 82 83 84 85 86 90 92 105
110
118
128
129
132
135
136
137
141
146
147
153
156
158
167
170
171
172
174
177
178
179
180
187
190
194
195
196
198
NY/NJ Harbor dischargers(advanced dechlorination factor from Rodenburg et al. 2012)
0%
5%
10%
15%
20%
25%
4 15 16 17 18 19 20 22 25 26 31 37 40 42 43 44 45 46 48 49 50 56 59 60 61 64 66 82 83 84 85 86 90 92 105
110
118
128
129
132
135
136
137
141
146
147
153
156
158
167
170
171
172
174
177
178
179
180
187
190
194
195
196
198
Delaware River dischargers(advanced dechlorination factor from Rodenburg et al. 2010)
0%
2%
4%
6%
8%
10%
12%
14%
4 15 16 17 18 19 20 22 25 26 31 37 40 42 43 44 45 46 48 49 50 56 59 60 61 64 66 82 83 84 85 86 90 92 105
110
118
128
129
132
135
136
137
141
146
147
153
156
158
167
170
171
172
174
177
178
179
180
187
190
194
195
196
198
NY/NJ Harbor ambient(lone dechlorination factor from Rodenburg et al. 2011)
0%2%4%6%8%
10%12%14%16%18%20%
4 15 16 17 18 19 20 22 25 26 31 37 40 42 43 44 45 46 48 49 50 56 59 60 61 64 66 82 83 84 85 86 90 92 105
110
118
128
129
132
135
136
137
141
146
147
153
156
158
167
170
171
172
174
177
178
179
180
187
190
194
195
196
198
Portland ambient(lone dechlorination factor from this study)

Factor Analysis Equation
X = G F + E
(m×n) (m×p) (p×n)
Use this equation to predictconcentrations, then minimizethe sum of squared residualsbetween measured andpredicted concentrations (E)until a stable solution is found.
You do NOT need anyinformation about the sources,such as their fingerprints, oreven how many there are!
Applies to Principle Components Analysis, PMF, PVA etc.
Note: in all forms of factor analysis, the user has to decide what is the‘correct’ number of sources based on model output.
X = input data matrixG = matrix of conc of each factor in each
sample generated by modelF = matrix of fingerprint of each factor (p)
generated by modelE = leftover or residualn = number of analytesm = number of samplesp = number of factors (sources)

Advantages of Positive Matrix Factorizationover other models, for example Principle Components Analysis
• Positive correlations only – mass balance model• Assign a point-by-point uncertainty estimate• Missing and below detection limit values can be
included by assigning them a high uncertainty• “Robust” mode can be used so that outlier values
will not skew the factor profiles• PMF provides the quantitative contribution
estimate from each factor for each sample.

PMF input matrixes• For all matrixes:
– 209 congeners measured in ~160 peaks– Discard any peaks that are BDL in more than ~50% of samples– Usually use about 90 peaks– Iterative process. Remember the Rodenburg principle:
“Smaller data sets often yield more factors”
• Concentration matrix:– Replace missing data with geometric mean– Replace BDL data with random number between 0 and LOD
• Uncertainty matrix:– RSD of surrogate recoveries for detected concentrations– 3X this uncertainty for BDL and missing data (x,3x)
• LOD matrix:– Use actual LOD for every data point where possible.– If LODs all similar, then you can use an average.
Metadata matters!When LOD and uncmatrix are not correct,the model blows upand the output is notuseful.

These matrixesmatter!
• Changes to LODand uncertaintymatrices can makethe output unstable
• In the worst case, ifthese matrices arenot constructedcorrectly, the modeloutput will be un-interpretable.
0%
10%
20%
30%
40%
50%
60%
70%
Base
case
(x,3
x)(x
,4x)
(x,5
x)(x
,6x)
(x,7
x)(x
,1.6
6)(0
.2,0
.6)
(0.2
,0.8
)(0
.2,1
.0)
(0.2
,1.2
)(0
.2,1
.4)
(0.2
,1.6
6)(0
.3,0
.6)
(0.3
,0.8
)(0
.3,1
.0)
(0.3
,1.2
)(0
.3,1
.4)
(0.3
,1.6
6)(r
and,
3ran
d)(r
anbt
,3ra
nbt)
RSD
of 9
seed
runs
Changes to Uncertainty Matrix
0%
10%
20%
30%
40%
50%
60%
70%
RSD
of 9
seed
runs
Changes to LOD Matrix
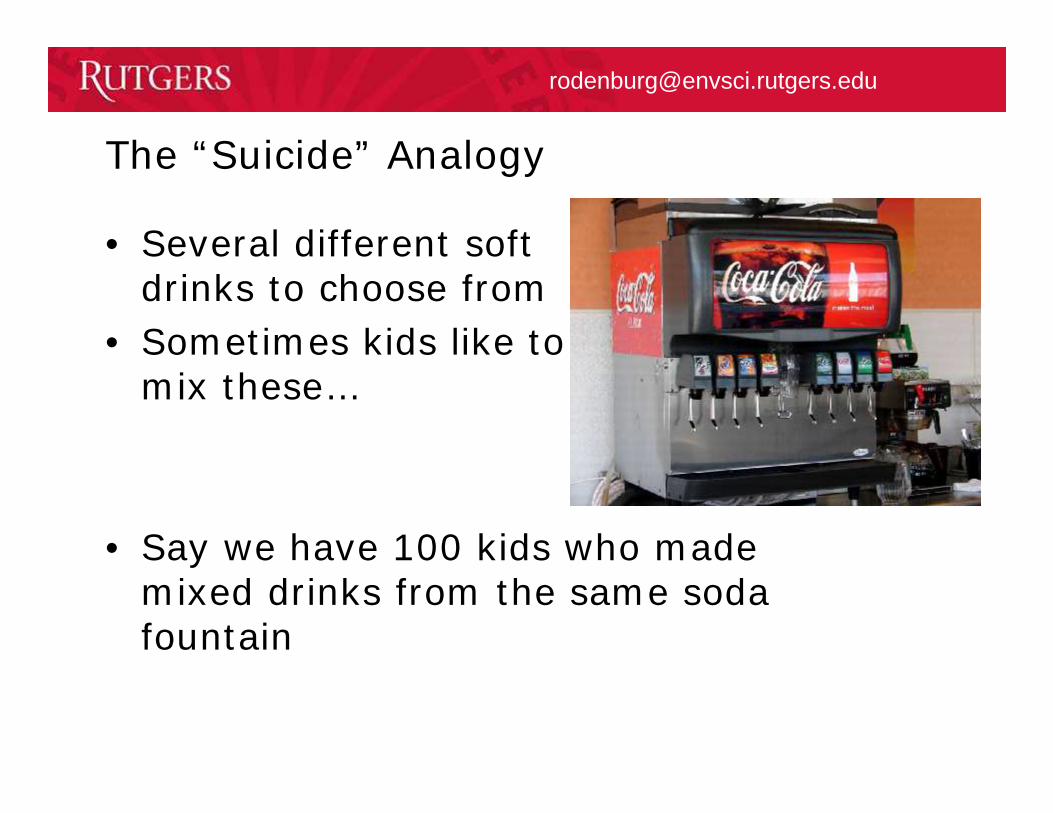
The “Suicide” Analogy
• Several different softdrinks to choose from
• Sometimes kids like tomix these…
• Say we have 100 kids who mademixed drinks from the same sodafountain


PMF results
PMF can tell you:• How many sources
(fingerprints, factors)• Their fingerprints (F
matrix)• How abundant each
fingerprint is in eachsample (G matrix)
Caramelcolor
Sugar
Aspartame
0
1
2
3
4
5
6
Caramel color sugar aspartame lemon-limeflavoring
cola flavoring caffiene
cont
ribut
ion
tota
l con
c.
01234567
Caramel color sugar aspartame lemon-limeflavoring
cola flavoring caffiene
cont
ribut
ion
tota
l con
c.
0
1
2
3
4
5
6
Caramel color sugar aspartame lemon-limeflavoring
cola flavoring caffiene
cont
ribut
ion
tota
l con
c.01234567
Caramel color sugar aspartame lemon-limeflavoring
cola flavoring caffieneco
ntrib
utio
n to
tal c
onc.
0123456
cont
ribut
ion
tota
l con
c.
“F matrix”

0
1
2
3
4
5
6
Caramel color sugar aspartame lemon-limeflavoring
cola flavoring caffiene
cont
ribut
ion
tota
l con
c.
01234567
Caramel color sugar aspartame lemon-limeflavoring
cola flavoring caffiene
cont
ribut
ion
tota
l con
c.
0
1
2
3
4
5
6
Caramel color sugar aspartame lemon-limeflavoring
cola flavoring caffiene
cont
ribut
ion
tota
l con
c.
01234567
Caramel color sugar aspartame lemon-limeflavoring
cola flavoring caffieneco
ntrib
utio
n to
tal c
onc.
0
1
2
3
4
5
6
cont
ribut
ion
tota
l con
c.
PMF results
PMF can’t tell you:• What it all means
• YOU have to interpretthis information
Mountain Dew
Diet Coke
Sprite…or 7-Up?
Coke…or Pepsi?Vanilla coke?
Cherry Coke

PMF Results
• G matrix:abundance ofeach factor ineach sample
• Helps with Q’slike:– Older people
prefer diet soda?– Women prefer
non-caffeinateddrinks?
– More caffeineconsumed later atnight?
CherryCoke Coke Sprite Diet Coke Mt Dew
Anna 16% 20% 13% 19% 32%Bruce 20% 30% 9% 28% 13%Carlos 25% 2% 26% 29% 19%Donna 10% 30% 29% 12% 19%Emily 34% 9% 35% 12% 10%Francis 24% 21% 16% 21% 18%George 3% 11% 30% 17% 38%Harriet 42% 23% 1% 11% 23%Inga 19% 27% 8% 37% 9%John 10% 31% 25% 6% 28%Karl 29% 15% 25% 25% 5%Lisa 8% 22% 17% 34% 19%Michael 0% 37% 38% 7% 18%Nick 22% 21% 11% 1% 44%Olga 12% 16% 19% 21% 32%
Rows sum to 100%
Need ancillary info, such as age,gender, time of day etc.

Case Study:
Portland Harbor Superfund Site
(Rodenburg et al. ES&T 2015)

Portland Harbor – water column
• SPB-octyl column (I prefer!)• Dissolved + particle phase
summed• 85 PCB peaks (congeners)
in 120 samples
• Five source terms (factors)identified– Three resemble Aroclors– One factor is rich in PCB 11
probably wastewater/stormwater/CSOs
– One factor is dominated byPCBs 4 and 19 = dechlorination
22%
72%
6.3%
Dechlorination
Aroclors
WW/SW/CSOs (PCB 11)

Watercolumnfactors -fingerprints 0%
2%
4%
6%
8%
10%
12%
14%
16%
4 6 8 10 11 15 16 17 18 19 20 21 22 25 26 27 31 32 37 40 42 44 45 46 48 49 50 52 54 56 59 60 61 64 66 77 81 82 83 84 85 86 88 90 92 93 94 103
105
110
114
123
128
129
130
132
134
135
136
141
144
146
147
153
156
158
164
169
170
171
172
174
176
177
178
179
180
183
187
189
190
194
195
196
197
198
202
203
206
209
Perc
ent o
f tot
al P
CBs
W2 Dechlorination(22% of total PCB mass in water)
0%5%
10%15%20%25%30%35%40%45%
4 6 8 10 11 15 16 17 18 19 20 21 22 25 26 27 31 32 37 40 42 44 45 46 48 49 50 52 54 56 59 60 61 64 66 77 81 82 83 84 85 86 88 90 92 93 94 103
105
110
114
123
128
129
130
132
134
135
136
141
144
146
147
153
156
158
164
169
170
171
172
174
176
177
178
179
180
183
187
189
190
194
195
196
197
198
202
203
206
209
Perc
ent o
f tot
al P
CBs W4 PCB 11 from pigment use and CSOs
(6.3% of total PCB mass in water)
0%1%2%3%4%5%6%7%8%9%
4 6 8 10 11 15 16 17 18 19 20 21 22 25 26 27 31 32 37 40 42 44 45 46 48 49 50 52 54 56 59 60 61 64 66 77 81 82 83 84 85 86 88 90 92 93 94 103
105
110
114
123
128
129
130
132
134
135
136
141
144
146
147
153
156
158
164
169
170
171
172
174
176
177
178
179
180
183
187
189
190
194
195
196
197
198
202
203
206
209
Perc
ent o
f tot
al P
CBs
W1 Aroclor 1242 (R2 = 0.89)(16% of total PCB mass in water)
0%1%2%3%4%5%6%7%8%9%
4 6 8 10 11 15 16 17 18 19 20 21 22 25 26 27 31 32 37 40 42 44 45 46 48 49 50 52 54 56 59 60 61 64 66 77 81 82 83 84 85 86 88 90 92 93 94 103
105
110
114
123
128
129
130
132
134
135
136
141
144
146
147
153
156
158
164
169
170
171
172
174
176
177
178
179
180
183
187
189
190
194
195
196
197
198
202
203
206
209
Perc
ent o
f tot
al P
CBs W3 Aroclor 1254 (R2 = 0.80)
(16% of total PCB mass in water)
0%
2%
4%
6%
8%
10%
12%
4 6 8 10 11 15 16 17 18 19 20 21 22 25 26 27 31 32 37 40 42 44 45 46 48 49 50 52 54 56 59 60 61 64 66 77 81 82 83 84 85 86 88 90 92 93 94 103
105
110
114
123
128
129
130
132
134
135
136
141
144
146
147
153
156
158
164
169
170
171
172
174
176
177
178
179
180
183
187
189
190
194
195
196
197
198
202
203
206
209
Perc
ent o
f tot
al P
CBs
W5 Aroclor 1260 (R2 = 0.99)(41% of total PCB mass in water)
Note:no Aroclor1248 factor
PCB 11 from pigments
Dechlorination
Aroclor 1242
Aroclor 1254
Aroclor 1260

PortlandHarborsedimentNote: NoDechlorination
0%
1%
2%
3%
4%
5%
6%
7%
8%4 11 16 17 18 19 20 22 26 28 31 37 41 42 43 44 47 48 52 53 56 61 66 74 77 82 84 85 87 88 90 95 97 99 105
106
107
108
110
114
128
129
130
132
133
134
135
136
137
138
139
141
144
146
151
153
156
157
158
167
170
171
172
174
176
177
178
179
180
182
183
185
189
190
193
194
195
196
199
202
206
208
209
Perc
ent o
f tot
al P
CBs
Sed3 Non-Aroclor, rich in PCB 11(1.1% of total PCBs in sediment)
0%
2%
4%
6%
8%
10%
12%
4 11 16 17 18 19 20 22 26 28 31 37 41 42 43 44 47 48 52 53 56 61 66 74 77 82 84 85 87 88 90 95 97 99 105
106
107
108
110
114
128
129
130
132
133
134
135
136
137
138
139
141
144
146
151
153
156
157
158
167
170
171
172
174
176
177
178
179
180
182
183
185
189
190
193
194
195
196
199
202
206
208
209
Perc
ent o
f tot
al P
CBs
Sed2 Aroclor 1254 (R2 = 0.97)(28% of total PCBs in sediment)
0%1%2%3%4%5%6%7%8%9%
4 11 16 17 18 19 20 22 26 28 31 37 41 42 43 44 47 48 52 53 56 61 66 74 77 82 84 85 87 88 90 95 97 99 105
106
107
108
110
114
128
129
130
132
133
134
135
136
137
138
139
141
144
146
151
153
156
157
158
167
170
171
172
174
176
177
178
179
180
182
183
185
189
190
193
194
195
196
199
202
206
208
209
Perc
ent o
f tot
al P
CBs
Sed1 Aroclor 1248 (R2 = 0.88)(42% of total PCBs in sediment)
0%
2%
4%
6%
8%
10%
12%
4 11 16 17 18 19 20 22 26 28 31 37 41 42 43 44 47 48 52 53 56 61 66 74 77 82 84 85 87 88 90 95 97 99 105
106
107
108
110
114
128
129
130
132
133
134
135
136
137
138
139
141
144
146
151
153
156
157
158
167
170
171
172
174
176
177
178
179
180
182
183
185
189
190
193
194
195
196
199
202
206
208
209
Perc
ent o
f tot
al P
CBs
Sed4 Aroclor 1260 (R2 = 0.94)(29% of total PCBs in sediment)
A1248,42%
A1254,28%
WW/SW/CSOs
(PCB 11),1.12%
A1260,29%
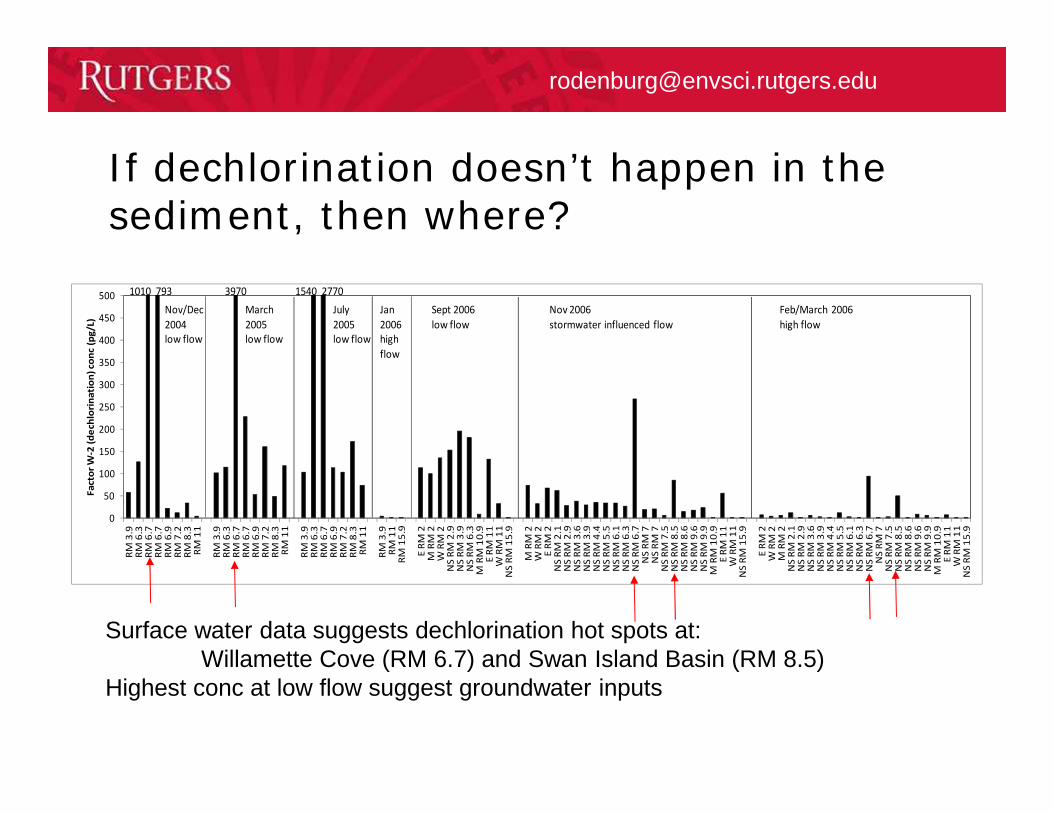
If dechlorination doesn’t happen in thesediment, then where?
0
50
100
150
200
250
300
350
400
450
500
RM 3
.9RM
6.3
RM 6
.7RM
6.7
RM 6
.9RM
7.2
RM 8
.3RM
11
RM 3
.9RM
6.3
RM 6
.7RM
6.7
RM 6
.9RM
7.2
RM 8
.3RM
11
RM 3
.9RM
6.3
RM 6
.7RM
6.9
RM 7
.2RM
8.3
RM 1
1
RM 3
.9RM
11
RM 1
5.9
E RM
2M
RM
2W
RM
2N
S RM
2.9
NS
RM 3
.9N
S RM
6.3
M R
M 1
0.9
E RM
11
W R
M 1
1N
S RM
15.
9
M R
M 2
W R
M 2
E RM
2N
S RM
2.1
NS
RM 2
.9N
S RM
3.6
NS
RM 3
.9N
S RM
4.4
NS
RM 5
.5N
S RM
6.1
NS
RM 6
.3N
S RM
6.7
NS
RM 7
NS
RM 7
NS
RM 7
.5N
S RM
8.5
NS
RM 8
.6N
S RM
9.6
NS
RM 9
.9M
RM
10.
9E
RM 1
1W
RM
11
NS
RM 1
5.9
E RM
2W
RM
2M
RM
2N
S RM
2.1
NS
RM 2
.9N
S RM
3.6
NS
RM 3
.9N
S RM
4.4
NS
RM 5
.5N
S RM
6.1
NS
RM 6
.3N
S RM
6.7
NS
RM 7
NS
RM 7
.5N
S RM
8.5
NS
RM 8
.6N
S RM
9.6
NS
RM 9
.9M
RM
10.
9E
RM 1
1W
RM
11
NS
RM 1
5.9
Fact
or W
-2 (d
echl
orin
atio
n) c
onc
(pg/
L)
March2005low flow
July2005low flow
Jan2006highflow
Sept 2006low flow
Nov 2006stormwater influenced flow
Feb/March 2006high flow
Nov/Dec2004low flow
1010 793 3970 1540 2770
Surface water data suggests dechlorination hot spots at:Willamette Cove (RM 6.7) and Swan Island Basin (RM 8.5)
Highest conc at low flow suggest groundwater inputs

Groundwaterinflows
Based on PCB 4residual*,dechlorinationproducts enter theriver at several pointsalong the river bank
* i.e. PCB 4+10 concentration inexcess of that predicted by themodel
Note log scale

PortlandHarbor benthicorganisms(in prep.)
• ADME changescongener patterns inbiota
• absorption, distribution,metabolism, and excretion
• PCBs 153, 180 etc. arebioaccumulated
0%
2%
4%
6%
8%
10%
12%
14%
16%
PCB4
PCB8
PCB1
1PC
B18
PCB2
0PC
B21
PCB2
2PC
B26
PCB3
1PC
B37
PCB4
0PC
B42
PCB4
4PC
B45
PCB4
8PC
B49
PCB5
0PC
B52
PCB5
6PC
B59
PCB6
0PC
B61
PCB6
4PC
B66
PCB7
7PC
B82
PCB8
3PC
B84
PCB8
5PC
B86
PCB9
0PC
B92
PCB1
05PC
B107
PCB1
10PC
B118
PCB1
28PC
B129
PCB1
30PC
B132
PCB1
34PC
B135
PCB1
36PC
B137
PCB1
41PC
B144
PCB1
46PC
B147
PCB1
53PC
B156
PCB1
58PC
B164
PCB1
67PC
B170
PCB1
71PC
B172
PCB1
74PC
B176
PCB1
77PC
B178
PCB1
79PC
B180
PCB1
83PC
B187
PCB1
90PC
B194
PCB1
95PC
B196
PCB1
98PC
B201
PCB2
02PC
B203
PCB2
06PC
B207
PCB2
08PC
B209
Perc
ent o
f tot
al
Factor 1 resembles Aroclor 1242 (R2 = 0.86)12% of mass in the data set
0%
1%
2%
3%
4%
5%
6%
7%
8%
9%
10%
PCB4
PCB8
PCB1
1PC
B18
PCB2
0PC
B21
PCB2
2PC
B26
PCB3
1PC
B37
PCB4
0PC
B42
PCB4
4PC
B45
PCB4
8PC
B49
PCB5
0PC
B52
PCB5
6PC
B59
PCB6
0PC
B61
PCB6
4PC
B66
PCB7
7PC
B82
PCB8
3PC
B84
PCB8
5PC
B86
PCB9
0PC
B92
PCB1
05PC
B107
PCB1
10PC
B118
PCB1
28PC
B129
PCB1
30PC
B132
PCB1
34PC
B135
PCB1
36PC
B137
PCB1
41PC
B144
PCB1
46PC
B147
PCB1
53PC
B156
PCB1
58PC
B164
PCB1
67PC
B170
PCB1
71PC
B172
PCB1
74PC
B176
PCB1
77PC
B178
PCB1
79PC
B180
PCB1
83PC
B187
PCB1
90PC
B194
PCB1
95PC
B196
PCB1
98PC
B201
PCB2
02PC
B203
PCB2
06PC
B207
PCB2
08PC
B209
Perc
ent o
f tot
al
Factor 2 resembles Aroclor 1254 (R2 = 0.75)26% of mass in the data set
0%
5%
10%
15%
20%
25%
PCB4
PCB8
PCB1
1PC
B18
PCB2
0PC
B21
PCB2
2PC
B26
PCB3
1PC
B37
PCB4
0PC
B42
PCB4
4PC
B45
PCB4
8PC
B49
PCB5
0PC
B52
PCB5
6PC
B59
PCB6
0PC
B61
PCB6
4PC
B66
PCB7
7PC
B82
PCB8
3PC
B84
PCB8
5PC
B86
PCB9
0PC
B92
PCB1
05PC
B107
PCB1
10PC
B118
PCB1
28PC
B129
PCB1
30PC
B132
PCB1
34PC
B135
PCB1
36PC
B137
PCB1
41PC
B144
PCB1
46PC
B147
PCB1
53PC
B156
PCB1
58PC
B164
PCB1
67PC
B170
PCB1
71PC
B172
PCB1
74PC
B176
PCB1
77PC
B178
PCB1
79PC
B180
PCB1
83PC
B187
PCB1
90PC
B194
PCB1
95PC
B196
PCB1
98PC
B201
PCB2
02PC
B203
PCB2
06PC
B207
PCB2
08PC
B209
Perc
ent o
f tot
al
Factor 3 does not resemble any Aroclor4% of mass in the data set
0%
5%
10%
15%
20%
25%
PCB4
PCB8
PCB1
1PC
B18
PCB2
0PC
B21
PCB2
2PC
B26
PCB3
1PC
B37
PCB4
0PC
B42
PCB4
4PC
B45
PCB4
8PC
B49
PCB5
0PC
B52
PCB5
6PC
B59
PCB6
0PC
B61
PCB6
4PC
B66
PCB7
7PC
B82
PCB8
3PC
B84
PCB8
5PC
B86
PCB9
0PC
B92
PCB1
05PC
B107
PCB1
10PC
B118
PCB1
28PC
B129
PCB1
30PC
B132
PCB1
34PC
B135
PCB1
36PC
B137
PCB1
41PC
B144
PCB1
46PC
B147
PCB1
53PC
B156
PCB1
58PC
B164
PCB1
67PC
B170
PCB1
71PC
B172
PCB1
74PC
B176
PCB1
77PC
B178
PCB1
79PC
B180
PCB1
83PC
B187
PCB1
90PC
B194
PCB1
95PC
B196
PCB1
98PC
B201
PCB2
02PC
B203
PCB2
06PC
B207
PCB2
08PC
B209
Perc
ent o
f tot
alFactor 4 resembles Aroclor 1260 (R2 = 0.68)
37% of mass in the data set
0%
2%
4%
6%
8%
10%
12%
PCB4
PCB8
PCB1
1PC
B18
PCB2
0PC
B21
PCB2
2PC
B26
PCB3
1PC
B37
PCB4
0PC
B42
PCB4
4PC
B45
PCB4
8PC
B49
PCB5
0PC
B52
PCB5
6PC
B59
PCB6
0PC
B61
PCB6
4PC
B66
PCB7
7PC
B82
PCB8
3PC
B84
PCB8
5PC
B86
PCB9
0PC
B92
PCB1
05PC
B107
PCB1
10PC
B118
PCB1
28PC
B129
PCB1
30PC
B132
PCB1
34PC
B135
PCB1
36PC
B137
PCB1
41PC
B144
PCB1
46PC
B147
PCB1
53PC
B156
PCB1
58PC
B164
PCB1
67PC
B170
PCB1
71PC
B172
PCB1
74PC
B176
PCB1
77PC
B178
PCB1
79PC
B180
PCB1
83PC
B187
PCB1
90PC
B194
PCB1
95PC
B196
PCB1
98PC
B201
PCB2
02PC
B203
PCB2
06PC
B207
PCB2
08PC
B209
Perc
ent o
f tot
al
Factor 5 resembles Aroclor 1260 (R2 = 0.65)10% of mass in the data set

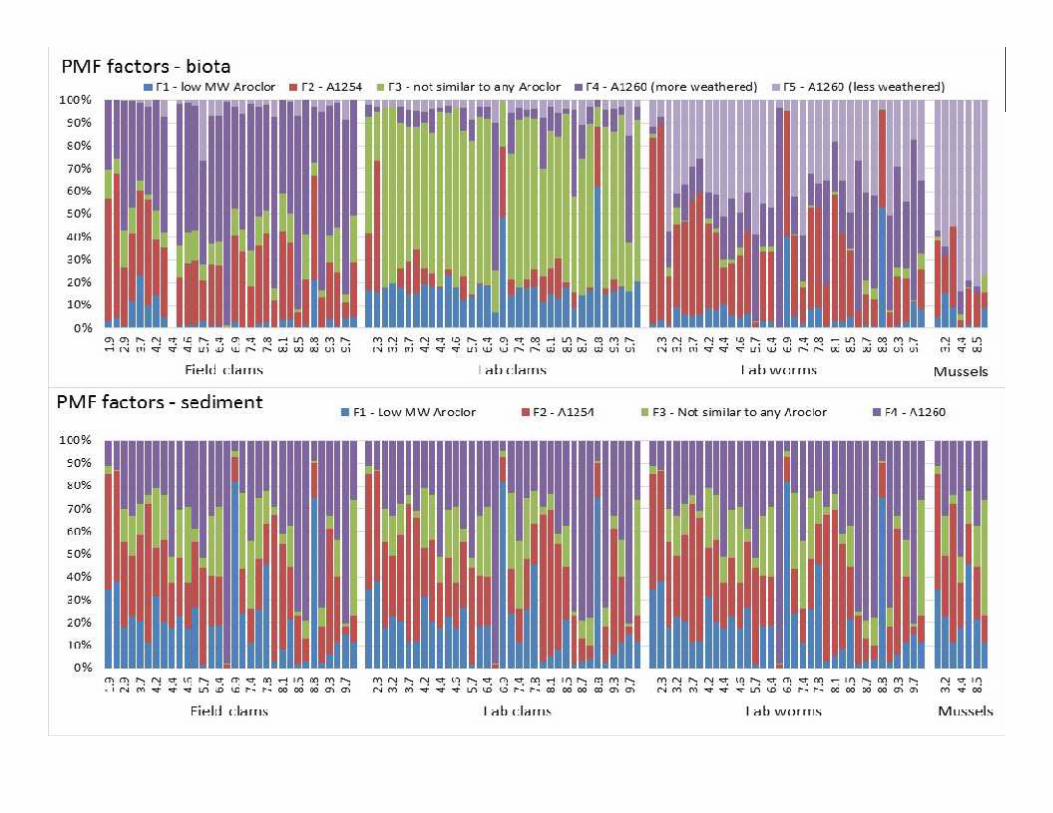
PCB sources to benthic biota
Aroclor 1260
Aroclor 1254
Aroclor 1260
Other
Factors 4 and 5 both resemble Aroclor 1260, butfactor 4 has more evidence of bioaccumulation
Notedifferencebt lab and
fieldclams
Aroclor 1242
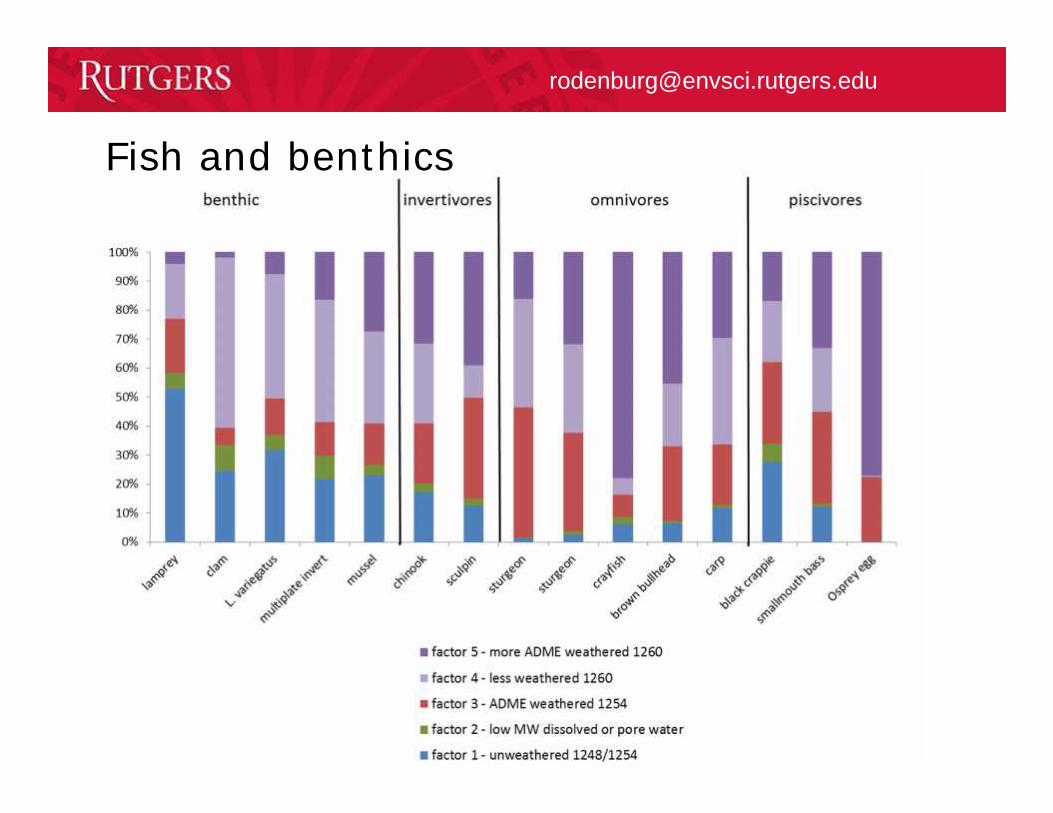

Lessons
• Congener fingerprints change from water to sedimentto biota
• Still, can generally identify the proportions of thedifferent Aroclors in the all compartments
• High MW Aroclors bioaccumulate more, esp. at highertrophic levels
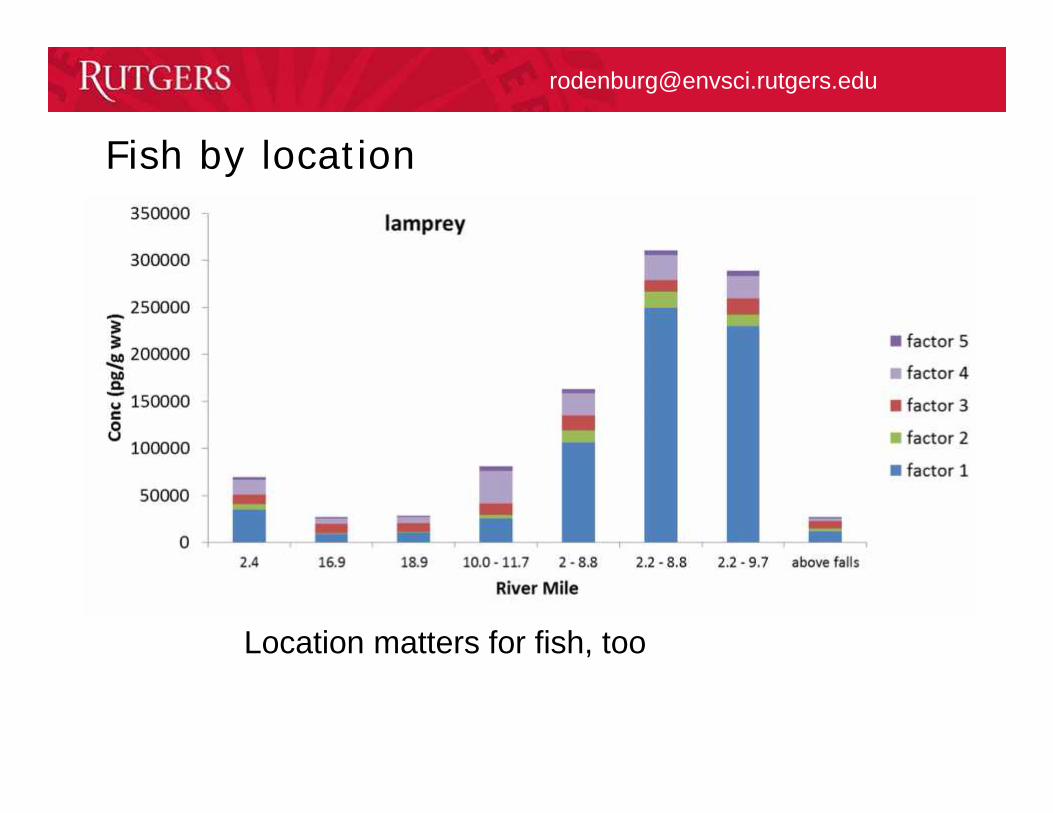
• For benthic organisms, location matters a lot• For fish, location matters some, tooi• Lab bioaccumulation studies give very different results
than field

Spokane River
• Limited fish data• Good amount of water column data• WWTP data• Blank issues

Water column – some PCB 11, but mostly Aroclors
Station Location Type of SampleSR-1 Spokane River Below 9 Mile Dam In-stream
HC-1 Latah (Hangman) Creek Discharge
SR-2City of Spokane Riverside Park AdvancedWWTP
Discharge
SR-3 Spokane River at Spokane In-stream
SR-4 Spokane River at Greene Street Bridge In-stream
SR-5Spokane County Regional WaterReclamation Facility
Discharge
SR-6 Inland Empire Paper Discharge
SR-7 Spokane River at Below Trent Bridge In-stream
SR-8 Kaiser Aluminum Discharge
SR-9 Spokane River at Barker Road Bridge In-stream
SR-10 Liberty Lake Sewer & Water District Discharge
SR-11 Post Falls WWTP Discharge
SR-12 Spokane River at Post Falls In-stream
SR-13**Hayden Area Regional Sewer BoardWWTP
Discharge
SR-14 Coeur d’Alene Advanced WWTP Discharge
SR-15 Lake Coeur d’Alene Outlet In-stream
In streamDischarge
Preliminary Data
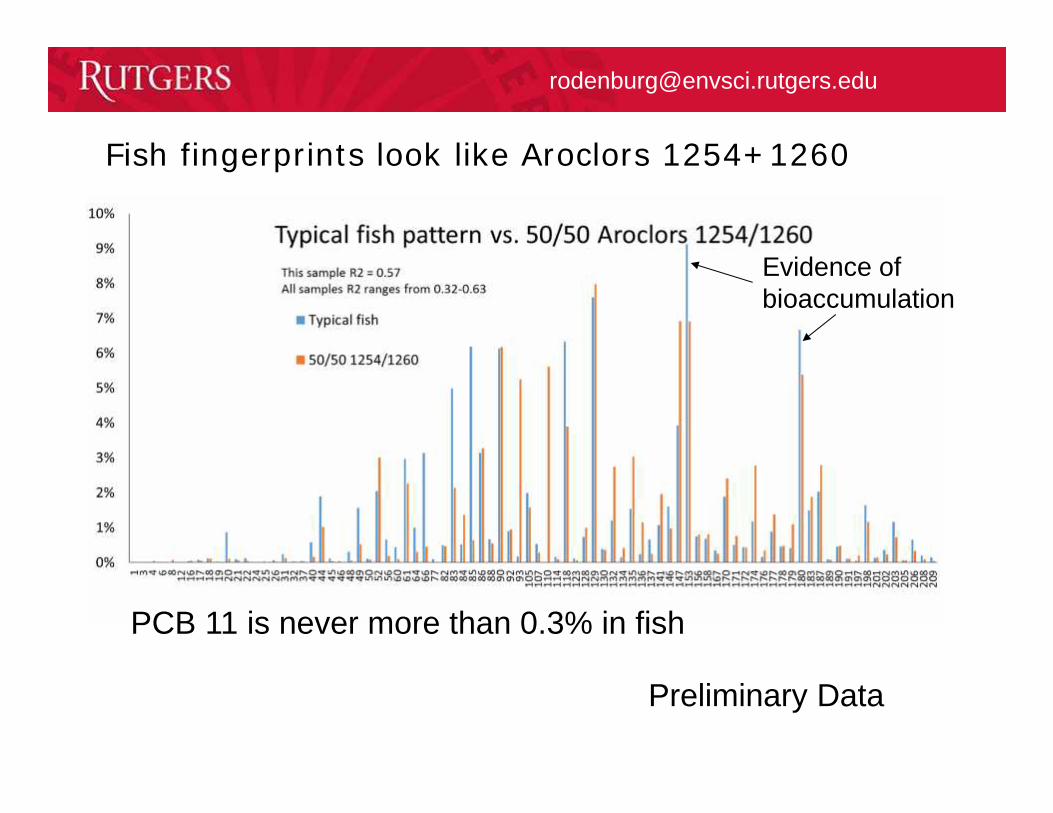
Fish fingerprints look like Aroclors 1254+1260
Evidence ofbioaccumulation
PCB 11 is never more than 0.3% in fish
Preliminary Data

Wastewater0%
1%
2%
3%
4%
5%
6%
90
11
09
35
26
11
29
11
11
81
53
86
14
78
34
42
03
11
80
13
56
61
05
18
71
32
84
49
18
21
40
92 8
64
19
88
51
74
56
22
13
61
41
18
31
61
70
88
14
61
28
17
82
17
91
51
56
37
20
66
0
% o
f to
tal (
bas
ed
on
me
dia
n c
on
c)
PCB congener
SVIPS
0%
1%
2%
3%
4%
5%
6%
90
11
09
35
26
11
29
11
11
81
53
86
14
78
34
42
03
11
80
13
56
61
05
18
71
32
84
49
18
21
40
92 8
64
19
88
51
74
56
22
13
61
41
18
31
61
70
88
14
61
28
17
82
17
91
51
56
37
20
66
0
% o
f to
tal (
bas
ed
on
me
dia
n c
on
c)
PCB congener
NVIPS
0%
1%
2%
3%
4%
5%
6%
7%
8%
9%
90
11
09
35
26
11
29
11
11
81
53
86
14
78
34
42
03
11
80
13
56
61
05
18
71
32
84
49
18
21
40
92 8
64
19
88
51
74
56
22
13
61
41
18
31
61
70
88
14
61
28
17
82
17
91
51
56
37
20
66
0
% o
f to
tal (
bas
ed
on
avg
co
nc)
PCB congener
Effluent(blank corrected)
PCB 11 is significant in influent,but most abundant congener ineffluent due to excellent solidsremoval.
Pigments are a major source ofPCBs in this system.
Reducing legacy PCB sourceswill not fix this problem.
Sewer line 1
Sewer line 2
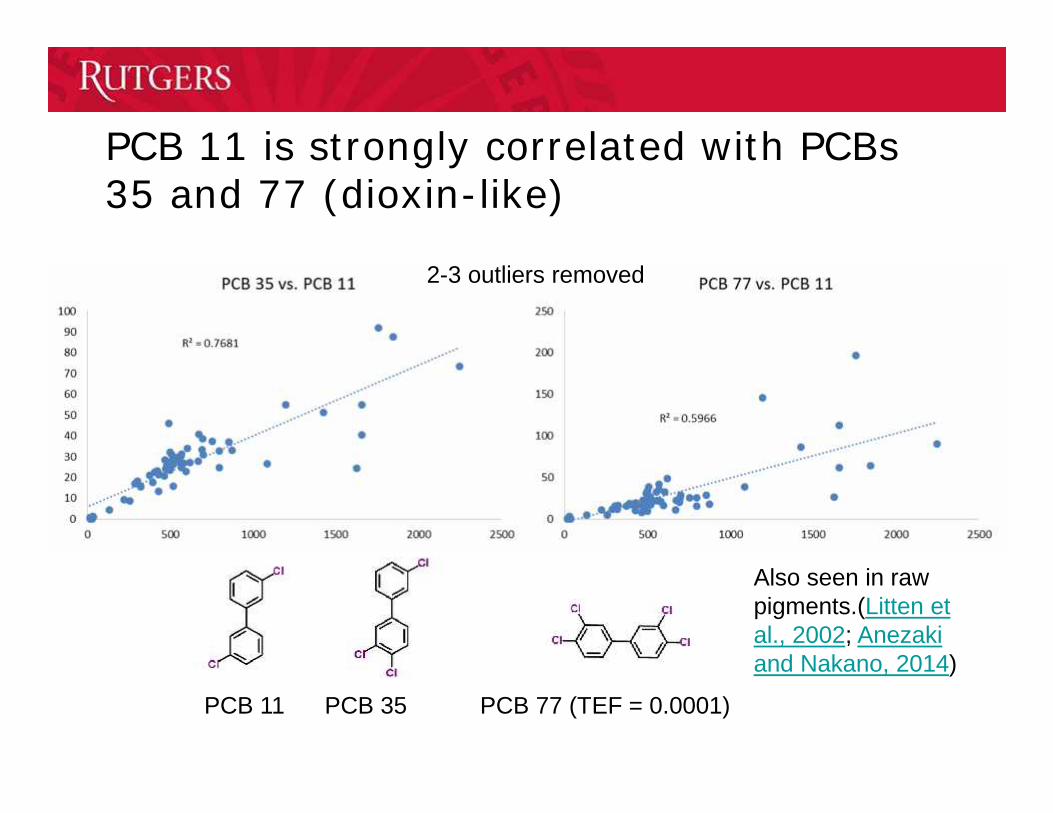
PCB 11 is strongly correlated with PCBs35 and 77 (dioxin-like)
PCB 11 PCB 35 PCB 77 (TEF = 0.0001)
2-3 outliers removed
Also seen in rawpigments.(Litten etal., 2002; Anezakiand Nakano, 2014)

Conclusions• Fingerprinting can help determine where and when certain types
of PCB sources are important
• Non-Aroclor sources are a problem in the Spokane River– Correlation between PCB 11 and PCB 77 is troubling
• Fingerprints look more like Aroclors close to the source in timeand space, but less and less as they move away and as they areprocessed by fish
• In the Spokane River, Aroclors are the most important source tofish


