Download - WHO Child Growth Standards

In 1993 the World Health Organization (WHO) undertook a comprehensive review of the uses and interpretation of anthropometric references. The review concluded that the NCHS/WHO growth reference, which had been recommended for international use since the late 1970s, did not adequately represent early childhood growth and that new growth curves were necessary. The World Health Assembly endorsed this recommendation in 1994. The WHO Multicentre Growth Reference Study (MGRS) was undertaken in response to that endorsement and implemented between 1997 and 2003 to generate new curves for assessing the growth and development of children the world over. The MGRS collected primary growth data and related information from 8440 healthy breastfed infants and young children from diverse ethnic backgrounds and cultural settings (Brazil, Ghana, India, Norway, Oman and USA). The growth standards developed based on these data and presented in this report provide a technically robust tool that represents the best description of physiological growth for children under five years of age. The standards depict normal early childhood growth under optimal environmental conditions and can be used to assess children everywhere, regardless of ethnicity, socioeconomic status and type of feeding.
WHO Child Growth StandardsWHO Child Growth Standards
1 year 2 years 3 years 4 years 5 years
Head circumference-for-age, arm circumference-for-age, triceps skinfold-for-age and subscapular skinfold-for-age
Methods and development
ISBN 9789241547185

Department of Nutrition for
Health and Development
WWHHOO CChhiilldd GGrroowwtthh SSttaannddaarrddss
Head circumference-for-age, arm circumference-for-age,
triceps skinfold-for-age and subscapular skinfold-for-age
Methods and development
WHO Library Cataloguing-in-Publication Data WHO child growth standards : head circumference-for-age, arm circumference-for-
age, triceps skinfold-for-age and subscapular skinfold-for-age : methods and development.
Coordinating team: Mercedes de Onis ... [et al.].
1.Anthropometry. 2.Anthropometry - methods. 3.Body size - standards. 4.Child development. 5.Growth. 6.Reference standards. 7.Nutrition assessment. I.de Onis, Mercedes. II.World Health Organization. III.Title: World Health Organization child growth standards. ISBN 978 92 4 154718 5 (NLM classification: WS 103)
© World Health Organization 2007
All rights reserved. Publications of the World Health Organization can be obtained from WHO Press, World Health Organization, 20 Avenue Appia, 1211 Geneva 27, Switzerland (tel.: +41 22 791 3264; fax: +41 22 791 4857; e-mail: [email protected]). Requests for permission to reproduce or translate WHO publications – whether for sale or for noncommercial distribution – should be addressed to WHO Press, at the above address (fax: +41 22 791 4806; e-mail: [email protected]).
The designations employed and the presentation of the material in this publication do not imply the expression of any opinion whatsoever on the part of the World Health Organization concerning the legal status of any country, territory, city or area or of its authorities, or concerning the delimitation of its frontiers or boundaries. Dotted lines on maps represent approximate border lines for which there may not yet be full agreement. The mention of specific companies or of certain manufacturers’ products does not imply that they are endorsed or recommended by the World Health Organization in preference to others of a similar nature that are not mentioned. Errors and omissions excepted, the names of proprietary products are distinguished by initial capital letters. All reasonable precautions have been taken by the World Health Organization to verify the information contained in this publication. However, the published material is being distributed without warranty of any kind, either expressed or implied. The responsibility for the interpretation and use of the material lies with the reader. In no event shall the World Health Organization be liable for damages arising from its use.
Printed in China, Hong Kong Special Administrative Region.
- iii -
Members of the WHO Multicentre Growth Reference Study Group
Coordinating Team
Mercedes de Onis [Study Coordinator], Adelheid Onyango, Elaine Borghi, Amani Siyam, Alain Pinol
(Department of Nutrition for Health and Development, World Health Organization).
Executive Committee
Cutberto Garza [Chair], Mercedes de Onis, Jose Martines, Reynaldo Martorell, Cesar G. Victora (up
to October 2002), Maharaj K. Bhan (from November 2002).
Steering Committee
Coordinating Centre (WHO, Geneva): Mercedes de Onis, Jose Martines, Adelheid Onyango, Alain
Pinol.
Investigators (by country): Cesar G. Victora and Cora Luiza Araújo (Brazil), Anna Lartey and
William B. Owusu (Ghana), Maharaj K. Bhan and Nita Bhandari (India), Kaare R. Norum and Gunn-
Elin Aa. Bjoerneboe (Norway), Ali Jaffer Mohamed (Oman), Kathryn G. Dewey (USA).
United Nations Agency Representatives: Cutberto Garza (UNU), Krishna Belbase (UNICEF).
Advisory Group
Maureen Black, Wm. Cameron Chumlea, Tim Cole, Edward Frongillo, Laurence Grummer-Strawn,
Reynaldo Martorell, Roger Shrimpton, Jan Van den Broeck. For the work presented in this document,
Huiqi Pan, Robert Rigby, Mikis Stasinopoulos and Stef van Buuren, participated in an advisory
capacity.
Participating countries and investigators
Brazil: Cora Luiza Araújo, Cesar G. Victora, Elaine Albernaz, Elaine Tomasi, Rita de Cássia Fossati
da Silveira, Gisele Nader (Departamento de Nutrição and Departamento de Medicina Social, Universidade Federal de Pelotas; and Núcleo de Pediatria and Escola de Psicologia, Universidade
Católica de Pelotas).
Ghana: Anna Lartey, William B. Owusu, Isabella Sagoe-Moses, Veronica Gomez, Charles Sagoe-
Moses (Department of Nutrition and Food Science, University of Ghana; and Ghana Health Service).
India: Nita Bhandari, Maharaj K. Bhan, Sunita Taneja, Temsunaro Rongsen, Jyotsna Chetia, Pooja Sharma, Rajiv Bahl (All India Institute of Medical Sciences).
Norway: Gunn-Elin Aa. Bjoerneboe, Anne Baerug, Elisabeth Tufte, Kaare R. Norum, Karin Rudvin,
Hilde Nysaether (Directorate of Health and Social Affairs; National Breastfeeding Centre,
Rikshospitalet University Hospital; and Institute for Nutrition Research, University of Oslo).
Oman: Ali Jaffer Mohamed, Deena Alasfoor, Nitya S. Prakash, Ruth M. Mabry, Hanadi Jamaan Al
Rajab, Sahar Abdou Helmi (Ministry of Health).
USA: Kathryn G. Dewey, Laurie A. Nommsen-Rivers, Roberta J. Cohen, M. Jane Heinig (University
of California, Davis).

- iv -
Acknowledgements
The WHO Child Growth Standards were constructed by the Coordinating Team in the Department of
Nutrition for Health and Development of the World Health Organization.
The Study Group is indebted to the parents, children and more than 200 field staff that participated in
the WHO Multicentre Growth Reference Study. The generous contribution of many individuals that
provided expertise and advice was also crucial to the development of the growth standards.
The project has received funding from the Bill & Melinda Gates Foundation, the Netherlands Minister for Development Cooperation, the Norwegian Royal Ministry of Foreign Affairs, and the United
States Department of Agriculture (USDA). Financial support was also provided by the Ministry of
Health of Oman, the United States National Institutes of Health, the Brazilian Ministry of Health and
Ministry of Science and Technology, the Canadian International Development Agency, the United
Nations University, the Arab Gulf Fund for United Nations Development, the Office of the WHO Representative to India, and the Department of Child and Adolescent Health and Development.

- v -
Contents
Executive summary...........................................................................................................................xv
1. Introduction....................................................................................................................................1
2. Methodology..................................................................................................................................3
2.1 Design of the WHO Multicentre Growth Reference Study....................................................3
2.2 Anthropometry methods.........................................................................................................3
2.3 Sample description .................................................................................................................4
2.4 Data cleaning procedures and exclusions...............................................................................5
2.5 Statistical methods for constructing the growth curves..........................................................6
3. Construction of the head circumference-for-age standards ...........................................................7
3.1 Indicator-specific methodology..............................................................................................7
3.2 Head circumference-for-age for boys.....................................................................................7
3.2.1 Sample size ..................................................................................................................7
3.2.2 Model selection and results..........................................................................................7
3.2.3 WHO standards..........................................................................................................20
Charts .........................................................................................................................21
Tables.........................................................................................................................23
3.3 Head circumference-for-age for girls ...................................................................................31
3.3.1 Sample size ................................................................................................................31
3.3.2 Model selection and results........................................................................................31
3.3.3 WHO standards..........................................................................................................43
Charts .........................................................................................................................44
Tables.........................................................................................................................46
3.4 Comparisons between boys and girls ...................................................................................54
3.4.1 WHO..........................................................................................................................55
4. Construction of the arm circumference-for-age standards...........................................................57
4.1 Indicator-specific methodology............................................................................................57
4.2 Arm circumference-for-age for boys....................................................................................57
4.2.1 Sample size ................................................................................................................57
4.2.2 Model selection and results........................................................................................57
4.2.3 WHO standards..........................................................................................................72
Charts .........................................................................................................................73
Tables.........................................................................................................................75
4.3 Arm circumference-for-age for girls ....................................................................................81
4.3.1 Sample size ................................................................................................................81
4.3.2 Model selection and results........................................................................................81
4.3.3 WHO standards..........................................................................................................96
Charts .........................................................................................................................97
Tables.........................................................................................................................99
4.4 Comparisons between boys and girls .................................................................................105
4.4.1 WHO........................................................................................................................106
5. Construction of the triceps skinfold-for-age standards ..............................................................107
5.1 Indicator-specific methodology..........................................................................................107
5.2 Triceps skinfold-for-age for boys.......................................................................................107
5.2.1 Sample size ..............................................................................................................107
5.2.2 Model selection and results......................................................................................107
5.2.3 WHO standards........................................................................................................122
Charts .......................................................................................................................123
Tables.......................................................................................................................125
5.3 Triceps skinfold-for-age for girls .......................................................................................131
5.3.1 Sample size ..............................................................................................................131

- vi -
5.3.2 Model selection and results ..................................................................................... 131 5.3.3 WHO standards ....................................................................................................... 145
Charts ...................................................................................................................... 146 Tables ...................................................................................................................... 148
5.4 Comparisons between boys and girls ................................................................................ 154 5.4.1 WHO ....................................................................................................................... 155
6. Construction of the subscapular skinfold-for-age standards ..................................................... 157 6.1 Indicator-specific methodology......................................................................................... 157 6.2 Subscapular skinfold-for-age for boys .............................................................................. 157
6.2.1 Sample size.............................................................................................................. 157 6.2.2 Model selection and results ..................................................................................... 157 6.2.3 WHO standards ....................................................................................................... 172
Charts ...................................................................................................................... 173 Tables ...................................................................................................................... 175
6.3 Subscapular skinfold-for-age for girls ............................................................................... 181 6.3.1 Sample size.............................................................................................................. 181 6.3.2 Model selection and results ..................................................................................... 181 6.3.3 WHO standards ....................................................................................................... 198
Charts ...................................................................................................................... 199 Tables ...................................................................................................................... 201
6.4 Comparisons between boys and girls ................................................................................ 207 6.4.1 WHO ....................................................................................................................... 208
7. Computation of centiles and z-scores for head circumference-for-age, arm circumference -for-age, triceps skinfold-for-age, subscapular skinfold-for-age............................................... 209
8. Conclusion................................................................................................................................. 213 9. Bibliography.............................................................................................................................. 215 Appendix A. Model specifications of the WHO child growth standards ....................................... 217

- vii -
Figures
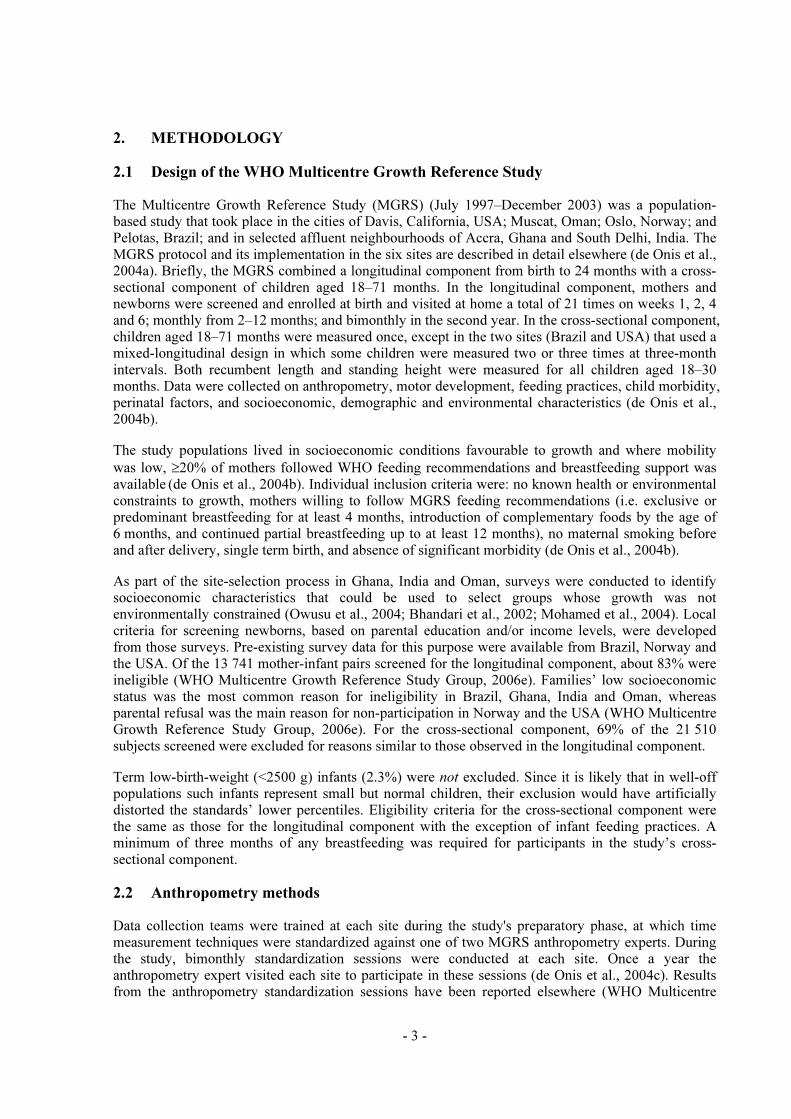
Figure 1 Fitting of µ and σ curves of Model 1 for head circumference-for-age for boys
(dotted line) and their respective sample estimates (points with solid line) .....................9
Figure 2 Centile residuals from fitting Model 1 for head circumference-for-age from 0 to 24
months for boys...............................................................................................................10
Figure 3 Centile residuals from fitting Model 1 for head circumference-for-age from 24 to 71 months for boys...............................................................................................................10
Figure 4 Worm plots of z-scores for Model 1 for head circumference-for-age for boys ..............11
Figure 5 3rd, 10th, 50th, 90th, 97th smoothed centile curves and empirical values: head circumference-for-age for boys from birth to 24 months...............................................16
Figure 6 5th, 25th, 50th, 75th, 95th smoothed centile curves and empirical values: head circumference-for-age for boys from birth to 24 months................................................17
Figure 7 3rd, 10th, 50th, 90th, 97th smoothed centile curves and empirical values: head
circumference-for-age for boys from 24 to 71 months ...................................................18
Figure 8 5th, 25th, 50th, 75th, 95th smoothed centile curves and empirical values: head
circumference-for-age for boys from 24 to 71 months ..................................................19
Figure 9 WHO head circumference-for-age z-scores for boys from birth to 60 months...............21
Figure 10 WHO head circumference -for-age percentiles for boys from birth to 60 months .........22
Figure 11 Fitting of the µ and σ curves of Model 1 for head circumference-for-age for girls
(dotted line) and their respective sample estimates (points with solid line) ...................33
Figure 12 Centile residuals from fitting Model 1 for head circumference-for-age from 0 to 24
months for girls ...............................................................................................................34
Figure 13 Centile residuals from fitting Model 1 for head circumference-for-age from 24 to 71 months for girls ...............................................................................................................34
Figure 14 Worm plots of z-scores for Model 1 for head circumference-for-age for girls...............37
Figure 15 3rd, 10th, 50th, 90th, 97th smoothed centile curves and empirical values: head circumference-for-age for girls from birth to 24 months ...............................................39
Figure 16 5th, 25th, 50th, 75th, 95th smoothed centile curves and empirical values: head circumference-for-age for girls from birth to 24 months ................................................40
Figure 17 3rd, 10th, 50th, 90th, 97th smoothed centile curves and empirical values: head
circumference-for-age for girls from 24 to 71 months....................................................41
Figure 18 5th, 25th, 50th, 75th, 95th smoothed centile curves and empirical values: head
circumference-for-age for girls from 24 to 71 months....................................................42
Figure 19 WHO head circumference-for-age z-scores for girls from birth to 60 months ...............44
Figure 20 WHO head circumference-for-age percentiles for girls from birth to 60 months...........45
Figure 21 Comparison of boys' and girls' head circumference-for-age z-scores.............................55
Figure 22 Worm plots of z-scores for Model 1 for arm circumference-for-age for boys................59
Figure 23 Fitting of the µ, σ, and ν curves of Model 2 for arm circumference-for-age for
boys from 3 to 71 months (dotted line) and their respective sample estimates
(points with solid line) ....................................................................................................62
Figure 24 Centile residuals from fitting Model 2 for arm circumference-for-age from 3 to 24
months for boys...............................................................................................................63

- viii -
Figure 25 Centile residuals from fitting Model 2 for arm circumference-for-age from 24 to 71
months for boys .............................................................................................................. 63
Figure 26 Worm plots of z-scores for Model 2 for arm circumference-for-age for boys............... 64
Figure 27 3rd, 10th, 50th, 90th, 97th smoothed centile curves and empirical values: arm
circumference-for-age for boys from 3 to 24 months..................................................... 68
Figure 28 5th, 25th, 50th, 75th, 95th smoothed centile curves and empirical values: arm
circumference-for-age for boys from 3 to 24 months..................................................... 69
Figure 29 3rd, 10th, 50th, 90th, 97th smoothed centile curves and empirical values: arm circumference-for-age for boys from 24 to 71 months................................................... 70
Figure 30 5th, 25th, 50th, 75th, 95th smoothed centile curves and empirical values: arm circumference-for-age for boys from 24 to 71 months.................................................. 71
Figure 31 WHO arm circumference-for-age z-scores for boys from 3 to 60 months..................... 73
Figure 32 WHO arm circumference-for-age percentiles for boys from 3 to 60 months................. 74
Figure 33 Worm plots of z-scores for Model 1 for arm circumference-for-age for girls ............... 83
Figure 34 Fitting of the µ, σ, and ν curves of Model 2 for arm circumference-for-age for
girls from 3 to 71 months (dotted line) and their respective sample estimates (points with solid line).................................................................................................... 86
Figure 35 Centile residuals from fitting Model 2 for arm circumference-for-age from 3 to 24
months for girls .............................................................................................................. 87
Figure 36 Centile residuals from fitting Model 2 for arm circumference-for-age from 24 to 71
months for girls .............................................................................................................. 87
Figure 37 Worm plots of z-scores for Model 2 for arm circumference-for-age for girls ............... 88
Figure 38 3rd, 10th, 50th, 90th, 97th smoothed centile curves and empirical values: arm
circumference-for-age for girls from 3 to 24 months ..................................................... 92
Figure 39 5th, 25th, 50th, 75th, 95th smoothed centile curves and empirical values: arm circumference-for-age for girls from 3 to 24 months ..................................................... 93
Figure 40 3rd, 10th, 50th, 90th, 97th smoothed centile curves and empirical values: arm
circumference-for-age for girls from 24 to 71 months ................................................... 94
Figure 41 5th, 25th, 50th, 75th, 95th smoothed centile curves and empirical values: arm
circumference-for-age for girls from 24 to 71 months .................................................. 95
Figure 42 WHO arm circumference-for-age z-scores for girls from 3 to 60 months ..................... 97
Figure 43 WHO arm circumference-for-age percentiles for girls from 3 to 60 months ................. 98
Figure 44 Comparison of boys' and girls' arm circumference-for-age z-scores ........................... 106
Figure 45 Worm plots of z-scores for Model 1 for triceps skinfold-for-age for boys .................. 109
Figure 46 Fitting of the µ, σ, and ν curves of Model 2 for triceps skinfold-for-age for boys
from 3 to 71 months (dotted line) and their respective sample estimates (points with solid line).............................................................................................................. 112
Figure 47 Centile residuals from fitting Model 2 for triceps skinfold-for-age from 3 to 24
months for boys ............................................................................................................ 113
Figure 48 Centile residuals from fitting Model 2 for triceps skinfold-for-age from 24 to 71
months for boys ............................................................................................................ 113
Figure 49 Worm plots of z-scores for Model 2 for triceps skinfold-for-age for boys .................. 114

- ix -
Figure 50 3rd, 10th, 50th, 90th, 97th smoothed centile curves and empirical values: triceps
skinfold-for-age for boys from 3 to 24 months .............................................................118
Figure 51 5th, 25th, 50th, 75th, 95th smoothed centile curves and empirical values: triceps
skinfold-for-age for boys from 3 to 24 months .............................................................119
Figure 52 3rd, 10th, 50th, 90th, 97th smoothed centile curves and empirical values: triceps skinfold-for-age for boys from 24 to 71 months ...........................................................120
Figure 53 5th, 25th, 50th, 75th, 95th smoothed centile curves and empirical values: triceps
skinfold-for-age for boys from 24 to 71 months ...........................................................121
Figure 54 WHO triceps skinfold-for-age z-scores for boys from 3 to 60 months.........................123
Figure 55 WHO triceps skinfold-for-age percentiles for boys from 3 to 60 months.....................124
Figure 56 Worm plots of z-scores for Model 1 for triceps skinfold-for-age for girls ...................133
Figure 57 Fitting of the µ, σ, and ν curves of Model 2 for triceps skinfold-for-age for girls
from 3 to 71 months (dotted line) and their respective sample estimates (points with solid line) ..............................................................................................................135
Figure 58 Centile residuals from fitting Model 2 for triceps skinfold-for-age from 3 to 24
months for girls .............................................................................................................136
Figure 59 Centile residuals from fitting Model 2 for triceps skinfold-for-age from 24 to 71
months for girls .............................................................................................................136
Figure 60 Worm plots of z-scores for Model 2 for triceps skinfold-for-age for girls ...................137
Figure 61 3rd, 10th, 50th, 90th, 97th smoothed centile curves and empirical values: triceps
skinfold-for-age for girls from 3 to 24 months .............................................................141
Figure 62 5th, 25th, 50th, 75th, 95th smoothed centile curves and empirical values: triceps skinfold-for-age for girls from 3 to 24 months .............................................................142
Figure 63 3rd, 10th, 50th, 90th, 97th smoothed centile curves and empirical values: triceps
skinfold-for-age for girls from 24 to 71 months ...........................................................143
Figure 64 5th, 25th, 50th, 75th, 95th smoothed centile curves and empirical values: triceps
skinfold-for-age for girls from 24 to 71 months ..........................................................144
Figure 65 WHO triceps skinfold-for-age z-scores for girls from 3 to 60 months .........................146
Figure 66 WHO triceps skinfold-for-age percentiles for girls from 3 to 60 months .....................147
Figure 67 Comparison of boys' and girls' triceps skinfold-for-age z-scores .................................155
Figure 68 Worm plots of z-scores for Model 1 for subscapular skinfold-for-age for boys...........159
Figure 69 Fitting of the µ, σ, and ν curves of Model 2 for subscapular skinfold-for-age for
boys from 3 to 71 months (dotted line) and their respective sample estimates (points with solid line) ..................................................................................................162
Figure 70 Centile residuals from fitting Model 2 for subscapular skinfold-for-age from
3 to 24 months for boys.................................................................................................163
Figure 71 Centile residuals from fitting Model 2 for subscapular skinfold-for-age from
24 to 71 months for boys...............................................................................................163
Figure 72 Worm plots of z-scores for Model 2 for subscapular skinfold-for-age for boys...........164
Figure 73 3rd, 10th, 50th, 90th, 97th smoothed centile curves and empirical values: subscapular
skinfold-for-age for boys from 3 to 24 months .............................................................168
Figure 74 5th, 25th, 50th, 75th, 95th smoothed centile curves and empirical values: subscapular skinfold-for-age for boys from 3 to 24 months ............................................................169

- x -
Figure 75 3rd, 10th, 50th, 90th, 97th smoothed centile curves and empirical values: subscapular
skinfold-for-age for boys from 24 to 71 months .......................................................... 170
Figure 76 5th, 25th, 50th, 75th, 95th smoothed centile curves and empirical values: subscapular
skinfold-for-age for boys from 24 to 71 months .......................................................... 171
Figure 77 WHO subscapular skinfold-for-age z-scores for boys from 3 to 60 months ................ 173
Figure 78 WHO subscapular skinfold-for-age percentiles for boys from 3 to 60 months............ 174
Figure 79 Worm plots of z-scores for Model 1 for subscapular skinfold-for-age for girls .......... 183
Figure 80 Fitting of the µ, σ, and ν curves of Model 2 for subscapular skinfold-for-age for girls from 3 to 71 months (dotted line) and their respective sample estimates
(points with solid line).................................................................................................. 186
Figure 81 Centile residuals from fitting Model 2 for subscapular skinfold-for-age from 3 to 24
months for girls ............................................................................................................ 187
Figure 82 Centile residuals from fitting Model 2 for subscapular skinfold-for-age from 24 to 71 months for girls ............................................................................................................ 187
Figure 83 Worm plots of z-scores for Model 2 for subscapular skinfold-for-age for girls .......... 188
Figure 84 Comparison of the fitted growth curves using Model 2 (solid line) with the model adjusting for kurtosis (dashed line) .............................................................................. 191
Figure 85 3rd, 10th, 50th, 90th, 97th smoothed centile curves and empirical values: subscapular
skinfold-for-age for girls from 3 to 24 months............................................................. 194
Figure 86 5th, 25th, 50th, 75th, 95th smoothed centile curves and empirical values: subscapular
skinfold-for-age for girls from 3 to 24 months............................................................. 195
Figure 87 3rd, 10th, 50th, 90th, 97th smoothed centile curves and empirical values: subscapular skinfold-for-age for girls from 24 to 71 months........................................................... 196
Figure 88 5th, 25th, 50th, 75th, 95th smoothed centile curves and empirical values: subscapular
skinfold-for-age for girls from 24 to 71 months........................................................... 197
Figure 89 WHO subscapular skinfold-for-age z-scores for girls from 3 to 60 months ................ 199
Figure 90 WHO subscapular skinfold-for-age percentiles for girls from 3 to 60 months ............ 200
Figure 91 Comparison of boys' and girls' subscapular skinfold-for-age z-score .......................... 208
Figure 92 Examples of children ranked according to the WHO arm circumference-for-age
standards....................................................................................................................... 211
- xi -
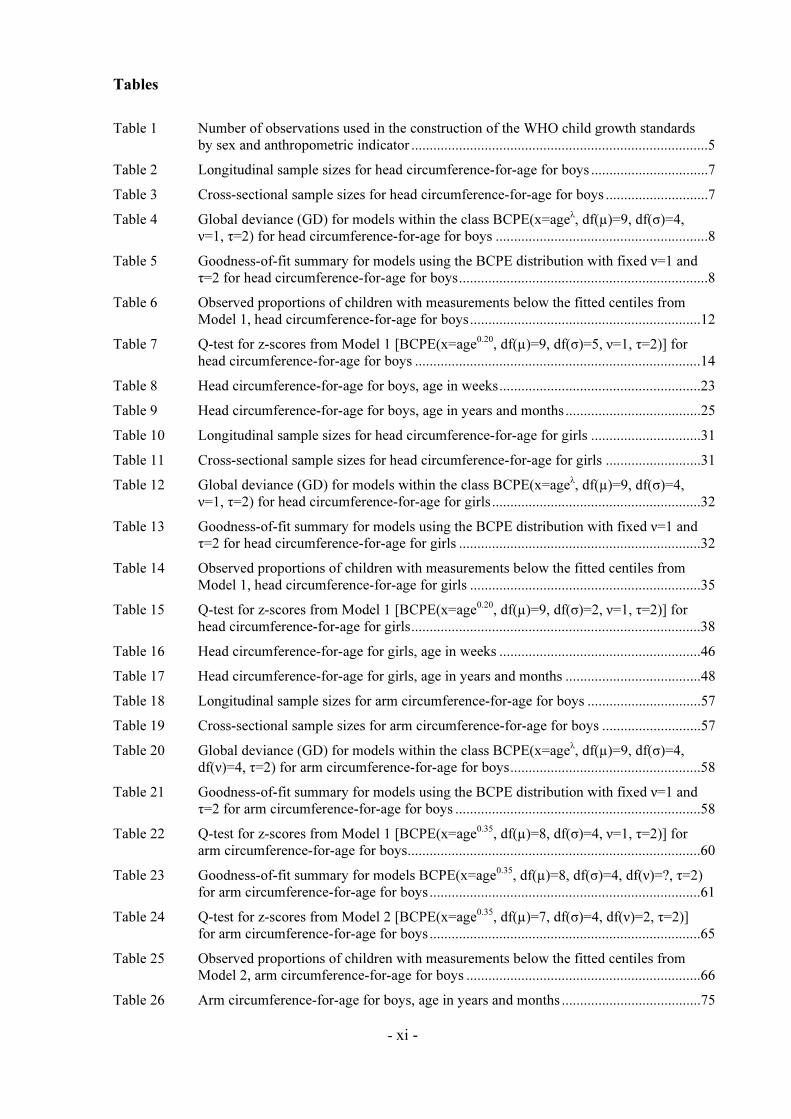
Tables
Table 1 Number of observations used in the construction of the WHO child growth standards
by sex and anthropometric indicator .................................................................................5
Table 2 Longitudinal sample sizes for head circumference-for-age for boys ................................7
Table 3 Cross-sectional sample sizes for head circumference-for-age for boys ............................7
Table 4 Global deviance (GD) for models within the class BCPE(x=ageλ, df(µ)=9, df(σ)=4, ν=1, τ=2) for head circumference-for-age for boys ..........................................................8
Table 5 Goodness-of-fit summary for models using the BCPE distribution with fixed ν=1 and
τ=2 for head circumference-for-age for boys....................................................................8
Table 6 Observed proportions of children with measurements below the fitted centiles from
Model 1, head circumference-for-age for boys...............................................................12
Table 7 Q-test for z-scores from Model 1 [BCPE(x=age0.20, df(µ)=9, df(σ)=5, ν=1, τ=2)] for
head circumference-for-age for boys ..............................................................................14
Table 8 Head circumference-for-age for boys, age in weeks.......................................................23
Table 9 Head circumference-for-age for boys, age in years and months.....................................25
Table 10 Longitudinal sample sizes for head circumference-for-age for girls ..............................31
Table 11 Cross-sectional sample sizes for head circumference-for-age for girls ..........................31
Table 12 Global deviance (GD) for models within the class BCPE(x=ageλ, df(µ)=9, df(σ)=4,
ν=1, τ=2) for head circumference-for-age for girls.........................................................32
Table 13 Goodness-of-fit summary for models using the BCPE distribution with fixed ν=1 and τ=2 for head circumference-for-age for girls ..................................................................32
Table 14 Observed proportions of children with measurements below the fitted centiles from
Model 1, head circumference-for-age for girls ...............................................................35
Table 15 Q-test for z-scores from Model 1 [BCPE(x=age0.20, df(µ)=9, df(σ)=2, ν=1, τ=2)] for
head circumference-for-age for girls...............................................................................38
Table 16 Head circumference-for-age for girls, age in weeks .......................................................46
Table 17 Head circumference-for-age for girls, age in years and months .....................................48
Table 18 Longitudinal sample sizes for arm circumference-for-age for boys ...............................57
Table 19 Cross-sectional sample sizes for arm circumference-for-age for boys ...........................57
Table 20 Global deviance (GD) for models within the class BCPE(x=ageλ, df(µ)=9, df(σ)=4,
df(ν)=4, τ=2) for arm circumference-for-age for boys....................................................58
Table 21 Goodness-of-fit summary for models using the BCPE distribution with fixed ν=1 and
τ=2 for arm circumference-for-age for boys ...................................................................58
Table 22 Q-test for z-scores from Model 1 [BCPE(x=age0.35, df(µ)=8, df(σ)=4, ν=1, τ=2)] for arm circumference-for-age for boys................................................................................60
Table 23 Goodness-of-fit summary for models BCPE(x=age0.35, df(µ)=8, df(σ)=4, df(ν)=?, τ=2)
for arm circumference-for-age for boys ..........................................................................61
Table 24 Q-test for z-scores from Model 2 [BCPE(x=age0.35, df(µ)=7, df(σ)=4, df(ν)=2, τ=2)]
for arm circumference-for-age for boys ..........................................................................65
Table 25 Observed proportions of children with measurements below the fitted centiles from Model 2, arm circumference-for-age for boys ................................................................66
Table 26 Arm circumference-for-age for boys, age in years and months ......................................75

- xii -
Table 27 Longitudinal sample sizes for arm circumference-for-age for girls ............................... 81
Table 28 Cross-sectional sample sizes for arm circumference-for-age for girls ........................... 81
Table 29 Global deviance (GD) for models within the class BCPE(x=ageλ, df(µ)=9, df(σ)=4,
df(ν)=4, τ=2) for arm circumference-for-age for girls ................................................... 82
Table 30 Goodness-of-fit summary for models using the BCPE distribution with fixed ν=1 and τ=2 for arm circumference-for-age for girls................................................................... 82
Table 31 Q-test for z-scores from Model 1 [BCPE(x=age0.35, df(µ)=8, df(σ)=4, ν=1, τ=2)] for
arm circumference-for-age for girls ............................................................................... 84
Table 32 Goodness-of-fit summary for models BCPE(x=age0.35, df(µ)=8, df(σ)=4, df(ν)=?, τ=2)
for arm circumference-for-age for girls.......................................................................... 85
Table 33 Q-test for z-scores from Model 2 [BCPE(x=age0.35, df(µ)=8, df(σ)=4, df(ν)=1, τ=2)]
for arm circumference-for-age for girls.......................................................................... 89
Table 34 Observed proportions of children with measurements below the fitted centiles from Model 2, arm circumference-for-age for girls ................................................................ 90
Table 35 Arm circumference-for-age for girls, age in years and months...................................... 99
Table 36 Longitudinal sample sizes for triceps skinfold-for-age for boys.................................. 107
Table 37 Cross-sectional sample sizes for triceps skinfold-for-age for boys.............................. 107
Table 38 Global deviance (GD) for models within the class BCPE(x=ageλ, df(µ)=9, df(σ)=4,
df(ν)=4, τ=2) for triceps skinfold-for-age for boys ...................................................... 108
Table 39 Goodness-of-fit summary for models using the BCPE distribution with fixed ν=1 and
τ=2 for triceps skinfold-for-age for boys...................................................................... 108
Table 40 Q-test for z-scores from Model 1 [BCPE(x=age0.30, df(µ)=7, df(σ)=5, ν=1, τ=2)] for triceps skinfold-for-age for boys .................................................................................. 110
Table 41 Goodness-of-fit summary for models BCPE(x=age0.30, df(µ)=7, df(σ)=5, df(ν)=?, τ=2)
for triceps skinfold-for-age for boys............................................................................. 111
Table 42 Q-test for z-scores from Model 2 [BCPE(x=age0.30, df(µ)=7, df(σ)=5, df(ν)=2, τ=2)]
for triceps skinfold-for-age for boys............................................................................. 115
Table 43 Observed proportions of children with measurements below the fitted centiles from Model 2, triceps skinfold-for-age for boys................................................................... 116
Table 44 Triceps skinfold-for-age for boys, age in years and months ........................................ 125
Table 45 Longitudinal sample sizes for triceps skinfold-for-age for girls .................................. 131
Table 46 Cross-sectional sample sizes for triceps skinfold-for-age for girls .............................. 131
Table 47 Global deviance (GD) for models within the class BCPE(x=ageλ, df(µ)=9, df(σ)=4, df(ν)=4, τ=2) for triceps skinfold-for-age for girls....................................................... 132
Table 48 Goodness-of-fit summary for models using the BCPE distribution with fixed ν=1 and
τ=2 for triceps skinfold-for-age for girls ...................................................................... 132
Table 49 Q-test for z-scores from Model 1 [BCPE(x=age0.15, df(µ)=7, df(σ)=5, ν=1, τ=2)] for
triceps skinfold-for-age for girls................................................................................... 134
Table 50 Goodness-of-fit summary for models BCPE(x=age0.15, df(µ)=7, df(σ)=5 df(ν)=?, τ=2) for triceps skinfold-for-age for girls ............................................................................. 134
Table 51 Q-test for z-scores from Model 2 [BCPE(x=age0.15, df(µ)=7, df(σ)=5, df(ν)=3, τ=2)]
for triceps skinfold-for-age for girls ............................................................................. 138

- xiii -
Table 52 Observed proportions of children with measurements below the fitted centiles from
Model 2, triceps skinfold-for-age for girls ....................................................................139
Table 53 Triceps skinfold-for-age for girls, age in years and months..........................................148
Table 54 Longitudinal sample sizes for subscapular skinfold-for-age for boys ..........................157
Table 55 Cross-sectional sample sizes for subscapular skinfold-for-age for boys ......................157
Table 56 Global deviance (GD) for models within the class BCPE(x=ageλ, df(µ)=9, df(σ)=4,
df(ν)=4, τ=2) for subscapular skinfold-for-age for boys...............................................158
Table 57 Goodness-of-fit summary for models using the BCPE distribution with fixed ν=1 and τ=2 for subscapular skinfold-for-age for boys .......................................................158
Table 58 Q-test for z-scores from Model 1 [BCPE(x=age0.65, df(µ)=6, df(σ)=3, ν=1, τ=2)] for subscapular skinfold-for-age for boys .....................................................................160
Table 59 Goodness-of-fit summary for models BCPE(x=age0.65, df(µ)=6, df(σ)=3, df(ν)=?,
τ=2) for subscapular skinfold-for-age for boys.............................................................161
Table 60 Goodness-of-fit summary for models using the BCPE distribution with df(ν)=2 and
τ=2 for subscapular skinfold-for-age for boys ..............................................................161
Table 61 Q-test for z-scores from Model 2 [BCPE(x=age0.65, df(µ)=6, df(σ)=2, df(ν)=2, τ=2)] for subscapular skinfold-for-age for boys .....................................................................165
Table 62 Observed proportions of children with measurements below the fitted centiles from
Model 2, subscapular skinfold-for-age for boys ...........................................................166
Table 63 Subscapular skinfold-for-age for boys, age in years and months..................................175
Table 64 Longitudinal sample sizes for subscapular skinfold-for-age for girls ...........................181
Table 65 Cross-sectional sample sizes for subscapular skinfold-for-age for girls .......................181
Table 66 Global deviance (GD) for models within the class BCPE(x=ageλ, df(µ)=9, df(σ)=4,
df(ν)=4, τ=2) for subscapular skinfold-for-age for girls ...............................................182
Table 67 Goodness-of-fit summary for models using the BCPE distribution with fixed ν=1 and τ=2 for subscapular skinfold-for-age for girls ........................................................182
Table 68 Q-test for z-scores from Model 1 [BCPE(x=age0.50, df(µ)=5, df(σ)=4, ν=1, τ=2)]
for subscapular skinfold-for-age for girls .....................................................................184
Table 69 Goodness-of-fit summary for models BCPE(x=age0.50, df(µ)=5, df(σ)=4, df(ν)=?,
τ=2) for subscapular skinfold-for-age for girls .............................................................184
Table 70 Goodness-of-fit summary for models using the BCPE distribution with λ=0.15,
df(ν)=2 and τ=2 for subscapular skinfold-for-age for girls ...........................................185
Table 71 Q-test for z-scores from Model 2 [BCPE(x=age0.15, df(µ)=5 df(σ)=4, df(ν)=2, τ=2)] for subscapular skinfold-for-age for girls .....................................................................189
Table 72 Goodness-of-fit summary for models BCPE(x=age0.15, df(µ)=5, df(σ)=4, df(ν)=2,
df(τ)=?) for subscapular skinfold-for-age for girls........................................................189
Table 73 Observed proportions of children with measurements below the fitted centiles from
Model 2, subscapular skinfold-for-age for girls............................................................192
Table 74 Subscapular skinfold-for-age for girls, age in years and months ..................................201

- xiv -
Glossary
BCPE The Box-Cox power exponential distribution.
µ The median of the Box-Cox power exponential distribution.
σ The approximate coefficient of variation of the Box-Cox power exponential distribution — related to the variance.
ν The power of the Box-Cox transformation (to the normal
distribution) of the Box-Cox power exponential distribution —
related to the skewness.
τ The power exponential parameter of the Box-Cox power exponential distribution — related to the kurtosis.
λ The power of the age (or length/height) transformation.
Body mass index (BMI) The ratio weight (in kg) / recumbent length or standing height
(in m2).
Box-Cox transformation A power transformation to the normal distribution.
Coefficient of variation The ratio of the standard deviation to the mean.
Cubic spline A piecewise third-order polynomial function that passes through
a set of m (or degrees of freedom) control points; it can have a
very simple form locally, yet be globally flexible and smooth.
Cut-off A designated limit beyond which a subject or observation is classified according to a pre-set condition.
Degrees of freedom (df) The number of control points used to fit the cubic splines.
Kurtosis An attribute of a distribution describing "peakedness". A high
kurtosis portrays a distribution with fat tails in contrast to a low
kurtosis, which portrays a distribution with skinny tails.
P-value The probability of falsely rejecting the hypothesis being tested. In this report all p-values were compared to a level of
significance set to 0.05.
Q-test A statistical test which combines overall and local tests
assessing departures from the normal distribution with respect to
median, variance, skewness and kurtosis.
Skewness A statistical term used to describe a distribution's asymmetry in relation to a normal distribution.
Standard deviation score (SD) See z-score.
Worm plots A set of detrended Q-Q plots — plots that compare the
distribution of a given set of observations to the normal
distribution.
Z-score The deviation of an individual's value from the median value of
a reference population, divided by the standard deviation of the
reference population (or transformed to normal distribution).

- xv -
Executive summary
In 1993 the World Health Organization (WHO) undertook a comprehensive review of the uses and
interpretation of anthropometric references. The review concluded that the NCHS/WHO growth
reference, which had been recommended for international use since the late 1970s, did not adequately
represent early childhood growth and that new growth curves were necessary. The World Health
Assembly endorsed this recommendation in 1994. In response WHO undertook the Multicentre
Growth Reference Study (MGRS) between 1997 and 2003 to generate new curves for assessing the
growth and development of children the world over.
The MGRS combined a longitudinal follow-up from birth to 24 months and a cross-sectional survey of children aged 18 to 71 months. Primary growth data and related information were gathered from 8440
healthy breastfed infants and young children from widely diverse ethnic backgrounds and cultural
settings (Brazil, Ghana, India, Norway, Oman and USA). The MGRS is unique in that it was
purposely designed to produce a standard by selecting healthy children living under conditions likely
to favour the achievement of their full genetic growth potential. Furthermore, the mothers of the children selected for the construction of the standards engaged in fundamental health-promoting
practices, namely breastfeeding and not smoking.
This report presents the second set of WHO Child Growth Standards (i.e. head circumference-for-age,
arm circumference-for-age, triceps skinfold-for-age and subscapular skinfold-for-age) and describes
the methodical process followed in their development. The first step in this process was a consultative
expert review of some 30 growth curve construction methods, including types of distributions and
smoothing techniques to identify the best approach to constructing the standards. Next was the selection of a software package flexible enough to allow the comparative testing of the alternative
methods used to generate the growth curves. Then the selected approach was applied systematically to
search for the best models to fit the data for each indicator.
The Box-Cox-power-exponential (BCPE) method, with curve smoothing by cubic splines was selected
for constructing the WHO child growth curves. The BCPE accommodates various kinds of
distributions, from normal to skewed or kurtotic. The age-based indicators originating at birth required
a power-transformation to stretch the age scale (x-axis) as a preliminary step to fitting the curves. For each set of curves, the search for the best model specification began by examining various
combinations of degrees of freedom to fit the median and variance estimator curves. When data had a
non-normal distribution, degrees of freedom for parameters to model skewness and kurtosis were
added to the initial model and adequacy of fit evaluated. Apart from head circumference-for-age,
which followed a normal distribution, the other standards in the second set required the modelling of
skewness, but not kurtosis. The diagnostic tools used iteratively to detect possible model misfits and biases in the fitted curves included various tests of local and global goodness of fit, worm plots and
residual plots. Patterns of differences between empirical and fitted percentiles were also examined, as
were proportions of observed versus expected percentages of children with measurements below
selected percentiles.
The sample used for the construction of the second set of growth standards was the same one used for
the construction of the first set of standards. The methodology described above was followed to
generate ─ for boys and girls ─ percentile and z-score curves for head circumference-for-age (0 to 60 months), arm circumference-for-age (3 to 60 months), triceps skinfold-for-age (3 to 60 months) and
subscapular skinfold-for-age (3 to 60 months).
The data of the longitudinal and cross-sectional samples were merged without any adjustments and a
single model was fitted to generate one continuous set of curves constituting each sex-specific
standard.
- xvi -
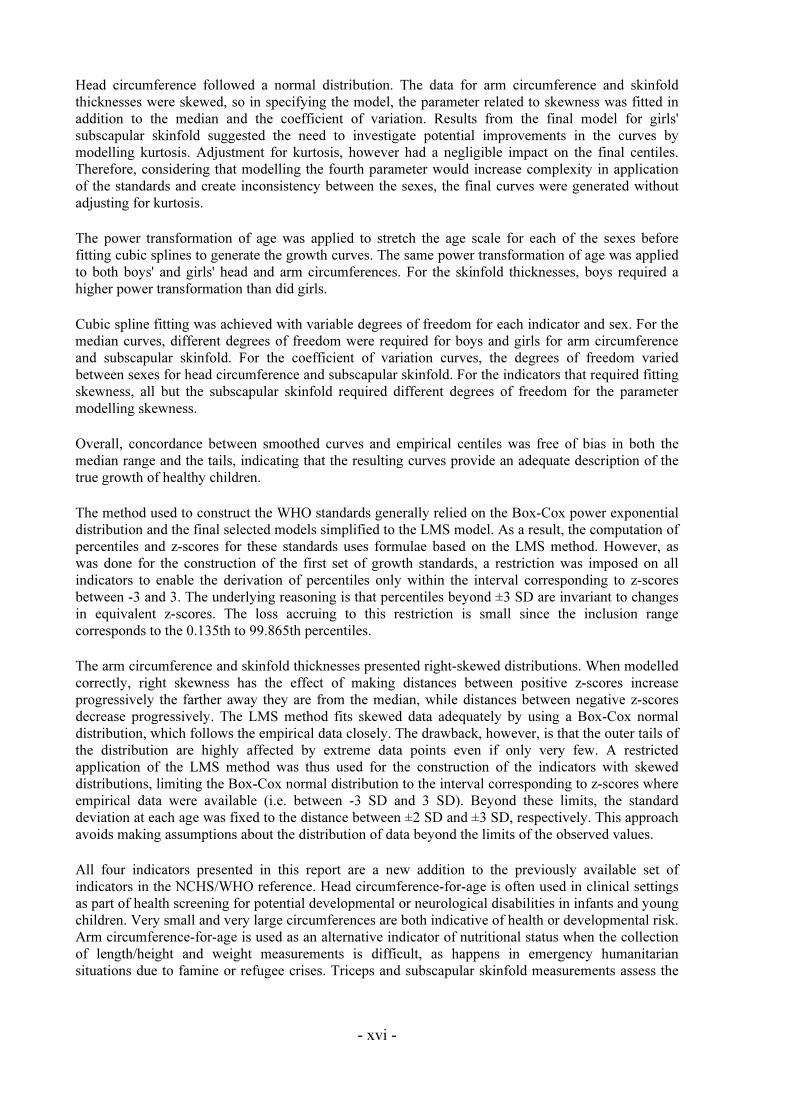
Head circumference followed a normal distribution. The data for arm circumference and skinfold
thicknesses were skewed, so in specifying the model, the parameter related to skewness was fitted in
addition to the median and the coefficient of variation. Results from the final model for girls'
subscapular skinfold suggested the need to investigate potential improvements in the curves by modelling kurtosis. Adjustment for kurtosis, however had a negligible impact on the final centiles.
Therefore, considering that modelling the fourth parameter would increase complexity in application
of the standards and create inconsistency between the sexes, the final curves were generated without
adjusting for kurtosis.
The power transformation of age was applied to stretch the age scale for each of the sexes before
fitting cubic splines to generate the growth curves. The same power transformation of age was applied
to both boys' and girls' head and arm circumferences. For the skinfold thicknesses, boys required a
higher power transformation than did girls.
Cubic spline fitting was achieved with variable degrees of freedom for each indicator and sex. For the median curves, different degrees of freedom were required for boys and girls for arm circumference
and subscapular skinfold. For the coefficient of variation curves, the degrees of freedom varied
between sexes for head circumference and subscapular skinfold. For the indicators that required fitting
skewness, all but the subscapular skinfold required different degrees of freedom for the parameter
modelling skewness.
Overall, concordance between smoothed curves and empirical centiles was free of bias in both the
median range and the tails, indicating that the resulting curves provide an adequate description of the
true growth of healthy children.
The method used to construct the WHO standards generally relied on the Box-Cox power exponential distribution and the final selected models simplified to the LMS model. As a result, the computation of
percentiles and z-scores for these standards uses formulae based on the LMS method. However, as
was done for the construction of the first set of growth standards, a restriction was imposed on all
indicators to enable the derivation of percentiles only within the interval corresponding to z-scores
between -3 and 3. The underlying reasoning is that percentiles beyond ±3 SD are invariant to changes
in equivalent z-scores. The loss accruing to this restriction is small since the inclusion range
corresponds to the 0.135th to 99.865th percentiles.
The arm circumference and skinfold thicknesses presented right-skewed distributions. When modelled
correctly, right skewness has the effect of making distances between positive z-scores increase
progressively the farther away they are from the median, while distances between negative z-scores
decrease progressively. The LMS method fits skewed data adequately by using a Box-Cox normal
distribution, which follows the empirical data closely. The drawback, however, is that the outer tails of
the distribution are highly affected by extreme data points even if only very few. A restricted application of the LMS method was thus used for the construction of the indicators with skewed
distributions, limiting the Box-Cox normal distribution to the interval corresponding to z-scores where
empirical data were available (i.e. between -3 SD and 3 SD). Beyond these limits, the standard
deviation at each age was fixed to the distance between ±2 SD and ±3 SD, respectively. This approach
avoids making assumptions about the distribution of data beyond the limits of the observed values.
All four indicators presented in this report are a new addition to the previously available set of
indicators in the NCHS/WHO reference. Head circumference-for-age is often used in clinical settings as part of health screening for potential developmental or neurological disabilities in infants and young
children. Very small and very large circumferences are both indicative of health or developmental risk.
Arm circumference-for-age is used as an alternative indicator of nutritional status when the collection
of length/height and weight measurements is difficult, as happens in emergency humanitarian
situations due to famine or refugee crises. Triceps and subscapular skinfold measurements assess the

- xvii -
thickness of subcutaneous tissue and reflect fatness primarily. The skinfold indicators are thus a useful
addition to the battery of growth standards for assessing childhood obesity.
The WHO Child Growth Standards provide a technically robust set of tool that represents the best
description of physiological growth for children under five years of age. The standards depict normal
early childhood growth under optimal environmental conditions and can be used to assess children
everywhere, regardless of ethnicity, socioeconomic status and type of feeding.


- 1 -
1. INTRODUCTION
Growth charts are an essential component of the paediatric toolkit. Their value resides in helping to determine the degree to which physiological needs for growth and development are met during the
important childhood period. Beyond their usefulness in assessing children's nutritional status, many
governmental and United Nations agencies rely on growth charts to measure the general well-being of
populations, formulate health and related policies, and plan interventions and monitor their
effectiveness.
The origin of the WHO Child Growth Standards dates back to the early 1990s when a group of experts
was appointed to conduct a meticulous evaluation of the National Center for Health Statistics/World Health Organization (NCHS/WHO) growth reference that had been recommended for international use
since the late 1970s (WHO, 1995). The limitations of the NCHS/WHO reference have been
documented (WHO Working Group on Infant Growth, 1994; de Onis and Habicht, 1996; de Onis and
Yip, 1996). The data used to construct the reference covering birth to three years of age came from a
longitudinal study of children of European ancestry from a single community in the USA. These
children were measured every three months, which is inadequate to describe the rapid and changing rate of growth in early infancy. Also, the statistical methods available at the time the NCHS/WHO
growth curves were constructed were too limited to correctly model the pattern and variability of
growth. As a result, the NCHS/WHO curves do not adequately represent early childhood growth.
The initial phase of the expert group's work documented the deficiencies of the reference and led to a
plan for developing new growth charts that would show how children should grow in all countries
rather than merely describing how they grew at a particular time and place. The experts underscored
the importance of ensuring that the new growth charts were consistent with "best" health practices
(Garza and de Onis, 2004).
A logical outcome of this plan was the WHO Multicentre Growth Reference Study (MGRS), which was implemented between 1997 and 2003 (de Onis et al., 2004a). The MGRS is unique in that it was
purposely designed to produce a standard rather than a reference. Although standards and references
both serve as a basis for comparison, each enables a different interpretation. Since a standard defines
how children should grow, deviations from the pattern it describes are evidence of abnormal growth.
A reference, on the other hand, does not provide as sound a basis for such value judgments, although
in practice references often are mistakenly used as standards.
The MGRS data provide a solid foundation for developing a standard because they are based on healthy children living under conditions likely to favour achievement of their full genetic growth
potential. Furthermore, the mothers of the children selected for the construction of the standards
engaged in fundamental health-promoting practices, namely breastfeeding and not smoking (de Onis
et al., 2004b).
A second feature of the study that makes it attractive as a basis for an internationally applicable
standard is that it included children from a diverse set of countries: Brazil, Ghana, India, Norway,
Oman and the USA. By selecting privileged, healthy populations the study reduced the impact of environmental variation (WHO Multicentre Growth Reference Study Group, 2006a). Another key
characteristic of the new standards is that they explicitly identify breastfeeding as the biological norm
and establish the breastfed child as the normative model for growth and development (WHO
Multicentre Growth Reference Study Group, 2006b). In addition, the new standards include windows
of achievement for six gross motor developmental milestones which are presented elsewhere (WHO
Multicentre Growth Reference Study Group, 2006c). Although WHO in the past issued recommendations concerning attained physical growth, it had not previously made any
recommendations for assessing motor development.

2 Introduction
This report presents the second set of WHO Child Growth Standards and describes the methods used
to construct the standards for head circumference-for-age, arm circumference-for-age, triceps skinfold-
for-age and subscapular skinfold-for-age. The standards based on length or height, weight and age are
presented in an earlier publication (WHO Multicentre Growth Reference Study Group, 2006d; Web
site www.who.int/childgrowth/publications/technical_report_pub/en/index.html). Electronic copies of
the WHO growth charts and tables together with tools developed to facilitate their use are available on
the Web: www.who.int/childgrowth/en.
- 3 -
2. METHODOLOGY
2.1 Design of the WHO Multicentre Growth Reference Study
The Multicentre Growth Reference Study (MGRS) (July 1997–December 2003) was a population-based study that took place in the cities of Davis, California, USA; Muscat, Oman; Oslo, Norway; and Pelotas, Brazil; and in selected affluent neighbourhoods of Accra, Ghana and South Delhi, India. The MGRS protocol and its implementation in the six sites are described in detail elsewhere (de Onis et al., 2004a). Briefly, the MGRS combined a longitudinal component from birth to 24 months with a cross-sectional component of children aged 18–71 months. In the longitudinal component, mothers and newborns were screened and enrolled at birth and visited at home a total of 21 times on weeks 1, 2, 4 and 6; monthly from 2–12 months; and bimonthly in the second year. In the cross-sectional component, children aged 18–71 months were measured once, except in the two sites (Brazil and USA) that used a mixed-longitudinal design in which some children were measured two or three times at three-month intervals. Both recumbent length and standing height were measured for all children aged 18–30 months. Data were collected on anthropometry, motor development, feeding practices, child morbidity, perinatal factors, and socioeconomic, demographic and environmental characteristics (de Onis et al., 2004b).
The study populations lived in socioeconomic conditions favourable to growth and where mobility
was low, ≥20% of mothers followed WHO feeding recommendations and breastfeeding support was available (de Onis et al., 2004b). Individual inclusion criteria were: no known health or environmental constraints to growth, mothers willing to follow MGRS feeding recommendations (i.e. exclusive or predominant breastfeeding for at least 4 months, introduction of complementary foods by the age of 6 months, and continued partial breastfeeding up to at least 12 months), no maternal smoking before and after delivery, single term birth, and absence of significant morbidity (de Onis et al., 2004b).
As part of the site-selection process in Ghana, India and Oman, surveys were conducted to identify socioeconomic characteristics that could be used to select groups whose growth was not environmentally constrained (Owusu et al., 2004; Bhandari et al., 2002; Mohamed et al., 2004). Local criteria for screening newborns, based on parental education and/or income levels, were developed from those surveys. Pre-existing survey data for this purpose were available from Brazil, Norway and the USA. Of the 13 741 mother-infant pairs screened for the longitudinal component, about 83% were ineligible (WHO Multicentre Growth Reference Study Group, 2006e). Families’ low socioeconomic status was the most common reason for ineligibility in Brazil, Ghana, India and Oman, whereas parental refusal was the main reason for non-participation in Norway and the USA (WHO Multicentre Growth Reference Study Group, 2006e). For the cross-sectional component, 69% of the 21 510 subjects screened were excluded for reasons similar to those observed in the longitudinal component.
Term low-birth-weight (<2500 g) infants (2.3%) were not excluded. Since it is likely that in well-off populations such infants represent small but normal children, their exclusion would have artificially distorted the standards’ lower percentiles. Eligibility criteria for the cross-sectional component were the same as those for the longitudinal component with the exception of infant feeding practices. A minimum of three months of any breastfeeding was required for participants in the study’s cross-sectional component.
2.2 Anthropometry methods
Data collection teams were trained at each site during the study's preparatory phase, at which time measurement techniques were standardized against one of two MGRS anthropometry experts. During the study, bimonthly standardization sessions were conducted at each site. Once a year the anthropometry expert visited each site to participate in these sessions (de Onis et al., 2004c). Results from the anthropometry standardization sessions have been reported elsewhere (WHO Multicentre

4 Methodology
Growth Reference Study Group, 2006f). For the longitudinal component of the study, screening teams measured newborns within 24 hours of delivery, and follow-up teams conducted home visits until 24 months of age. The follow-up teams were also responsible for taking measurements in the cross-sectional component involving children aged 18–71 months (de Onis et al., 2004b). The MGRS data included weight and head circumference at all ages, recumbent length (longitudinal component), height (cross-sectional component), and arm circumference, triceps and subscapular skinfolds (all children aged ≥3 months). This report presents only the standards based on head circumference, arm circumference and skinfolds. The standards based on length or height and weight are presented in an earlier publication (WHO Multicentre Growth Reference Study Group, 2006d; web site http://www.who.int/childgrowth/publications/technical_report_pub/en/index.html).
Observers working in pairs collected anthropometric data. Each observer independently measured and recorded a complete set of measurements, after which the two compared their readings. If any pair of readings exceeded the maximum allowable difference for a given variable (e.g. head circumference, 5 mm; arm circumference, 5 mm; skinfold thickness, 2 mm), both observers once again independently measured and recorded a second and, if necessary, a third set of readings for the variable(s) in question (de Onis et al., 2004c).
All study sites used identical measuring equipment. Instruments needed to be highly accurate and
precise. A self-retracting, 0.7 cm-wide, flat metal tape with blank lead-in strip (range, 0–200 cm,
calibrated to 1 mm), was used to measure circumferences. Metal tapes were chosen because they are
more robust and accurate, and stay in a single plane around the head. They were replaced on a regular
basis when the grading marks faded. The Holtain/Tanner-Whitehouse skinfold caliper (jaw face area,
35 mm2; pressure between the jaws, 10 ± 2 g/mm2; range, 0–40 mm; calibrated to 0.2 mm) was used to
measure skinfolds. The skinfold calipers, being particularly fragile, were checked before each use with
calibration blocks of various widths for accuracy and to ensure that the needle moved smoothly and
continuously with the opening of the caliper jaws. Full details of the instruments used and how
measurements were taken are provided elsewhere (de Onis et al., 2004c).
2.3 Sample description
The total sample size for the longitudinal and cross-sectional components from all six sites was 8440
children. A total of 1743 children were enrolled in the longitudinal sample, six of whom were excluded for morbidities affecting growth (4 cases of repeated episodes of diarrhoea, 1 case of
repeated episodes of malaria, and 1 case of protein-energy malnutrition) leaving a sample of 1737
children (894 boys and 843 girls). Of these, the mothers of 882 children (428 boys and 454 girls)
complied fully with the MGRS infant-feeding and no-smoking criteria and completed the follow-up
period of 24 months (96% of compliant children completed the 24-month follow-up). The other 855
either failed to comply with the study's infant-feeding and no-smoking criteria or dropped out before
24 months. These children, whose size at birth was similar to that of the compliant sample, contributed
only birth measurements. The increased sample size at birth served to minimize the left-edge effect in
the head circumference-for-age curves. For arm circumference and the skinfolds, which were
measured starting at age 3 months, the data did not allow for this correction in the corresponding
standards. The total number of records for the longitudinal component was 19 900.
The cross-sectional sample comprised 6697 children. Of these, 28 were excluded for medical
conditions affecting growth (20 cases of protein-energy malnutrition, five cases of haemolytic anaemia
G6PD deficiency, two cases of renal tubulo-interstitial disease, and one case of Crohn disease) leaving
a final sample of 6669 children (3450 boys and 3219 girls). The total number of records in the cross-
sectional component was 8306 as some children in Brazil and the USA were measured two or three
times at three-month intervals. A full description of the MGRS sample with regard to screening,

Methodology 5
recruitment, sample attrition and compliance, as well as the baseline characteristics of the study
sample is provided elsewhere (WHO Multicentre Growth Reference Study Group, 2006e).
2.4 Data cleaning procedures and exclusions
Data cleaning
The MGRS data management protocol (Onyango et al., 2004) was designed to create and manage a large databank of information collected from multiple sites over a period of several years. Data
collection and processing instruments were prepared centrally and used in a standardized fashion
across sites. The data management system contained internal validation features for timely detection of
data errors and its standard operating procedures stipulated a method of master file updating and
correction that maintained a clear trail for data-auditing purposes. Each site was responsible for collecting, entering, verifying and validating data, and for creating site-level master files. Data from
the sites were sent to WHO/HQ every month for master file consolidation and more extensive quality
control checking. All errors identified were communicated to the site for correction at source.
After data collection was completed at a given site, a period of about 6 months was dedicated to in-
depth data quality checking and master file cleaning. Detailed validation reports, descriptive statistics and plots were produced from the site’s master files. For the longitudinal component, each
anthropometric measurement was plotted for every child from birth to the end of his/her participation.
These plots were examined individually for any questionable patterns. Query lists from these analyses
were sent to the site for investigation and correction, or confirmation, as required. As with the data
collection process, the site data manager prepared correction batches to update the master files. The
updated master files were then sent to WHO/HQ and this iterative quality assurance process continued until all identifiable problems had been detected and corrected. The rigorous implementation of what
was a highly demanding protocol yielded very high-quality data.
Data exclusions
In addition to exclusions of data based on weight-for-height (WHO Multicentre Growth Reference
Study Group, 2006d), a few influential observations outside ±4 SD were excluded when constructing
the individual standards included in this report. These were, for head circumference-for-age: boys, all
21 observations belonging to one boy in the longitudinal sample (0.15%) and one single observation (0.01%) among girls; for triceps skinfold-for-age: boys, 7 (0.06%) and girls, 9 (0.08%); for
subscapular skinfold-for-age: boys, 17 (0.16%) and girls, 19 (0.17%) observations. These observations
were set to missing in the final data set and therefore did not contribute to the construction of the
corresponding standards. The final number of observations used in the construction of the WHO child
growth standards is shown in Table 1.
Table 1 Number of observations used in the construction of the WHO child growth standards
by sex and anthropometric indicator
Indicator Girls Boys Total
Head circumference-for-age 13 798 13 541 27 339
Arm circumference-for-age 10 970 10 770 21 740
Triceps skinfold-for-age 10 943 10 762 21 705
Subscapular skinfold-for-age 10 934 10 757 21 691

6 Methodology
2.5 Statistical methods for constructing the growth curves
The underlying methodology used for constructing the head circumference-for-age, arm circumference
-for-age, triceps skinfold-for-age and subscapular skinfold-for-age standards was the same used to construct the standards for length/height-for-age, weight-for-age, weight-for-length, weight-for-height
and body mass index-for-age. The growth curve fitting method and diagnostic tools used to select the
best models for each of the indicators are described in detail in the report of the first set of standards
(WHO Multicentre Growth Reference Study Group, 2006d, 2006g).
The Box-Cox-power-exponential (BCPE) method (Rigby and Stasinopoulos, 2004), with curve
smoothing by cubic splines was selected for constructing the WHO child growth curves. The BCPE
accommodates various kinds of distributions, from normal to skewed or kurtotic. All the indicators in this second set standards required a power-transformation to stretch the age scale (x-axis) as a
preliminary step to fitting the curves. For each set of curves, the search for the best model specification
began by examining various combinations of degrees of freedom to fit the median and variance
estimator curves. When data had a non-normal distribution, degrees of freedom for parameters to
model skewness and kurtosis were added to the initial model and adequacy of fit was evaluated. Apart from head circumference-for-age, which followed a normal distribution, the other standards required
the modelling of skewness, but not kurtosis. The diagnostic tools used iteratively to detect possible
model misfits and biases in the fitted curves included various tests of local and global goodness of fit,
like Q-tests (Royston and Wright, 2000), worm plots (van Buuren and Fredriks, 2001) and residual
plots. Patterns of differences between empirical and fitted percentiles were also examined, as were
proportions of observed versus expected percentages of children with measurements below selected percentiles. The curves were constructed using all available data (i.e. from birth to 71 months) but the
final standards were truncated at 60 completed months to avoid the right-edge effect (Borghi et al.,
2006).
The GAMLSS package (Stasinopoulos et al., 2004) was used for the construction of the growth curves.

- 7 -
3. CONSTRUCTION OF THE HEAD CIRCUMFERENCE-FOR-AGE STANDARDS
3.1 Indicator-specific methodology
The same approach as that described to select the best model for the length/height-for-age growth curves (WHO Multicentre Growth Reference Study Group, 2006d) was followed to select the best
model to construct the head circumference-for-age growth standards. The BCPE method was used and,
starting from the simplest model (i.e. with the normal distribution), the best model was sought and its
goodness of fit evaluated. The diagnostic tools applied to evaluate and compare candidate models were
the same as those used for constructing the first set of indicators. All data up to 71 months were used for modelling the head circumference-for-age growth curves and the standards afterwards truncated at
60 completed months to correct for the right-edge effect (Borghi et al., 2006).
3.2 Head circumference-for-age for boys
3.2.1 Sample size
There were 13 541 head circumference observations for boys. The longitudinal and cross-sectional
sample sizes by visit and age are shown in Tables 2 and 3.
Table 2 Longitudinal sample sizes for head circumference-for-age for boys
Visit Birth 1 2 3 4 5 6
Age 0 2 wk 4 wk 6 wk 2 mo 3 mo 4 mo
N 893 424 423 423 422 418 417
Visit 7 8 9 10 11 12 13
Age 5 mo 6 mo 7 mo 8 mo 9 mo 10 mo 11 mo
N 419 422 418 418 413 409 420
Visit 14 15 16 17 18 19 20
Age 12 mo 14 mo 16 mo 18 mo 20 mo 22 mo 24 mo
N 420 418 417 416 422 416 421
Table 3 Cross-sectional sample sizes for head circumference-for-age for boys
Age (mo) <18 18–20 21–23 24–26 27–29 30–32 33–35
N 3 184 191 244 267 229 261
Age (mo) 36–38 39–41 42–44 45–47 48–50 51–53 54–56
N 274 254 263 244 245 229 233
Age (mo) 57–59 60–62 63–65 66–68 69–71 >71
N 245 236 221 224 221 4
3.2.2 Model selection and results
The model BCPE(x=ageλ, df(µ)=9, df(σ)=4, ν=1, τ=2) served as a starting point to construct the head
circumference-for-age growth curves. Improvement of the model's fit was investigated by studying
changes in global deviance at varying levels of the age-transformation power λ. Table 4 shows the
global deviance for a grid of λ values. The smallest global deviance corresponded to age-
transformation power λ=0.20.

8 Head circumference-for-age, boys
Table 4 Global deviance (GD) for models within the class BCPE(x=ageλ, df(µ)=9, df(σ)=4, ν=1,
τ=2) for head circumference-for-age for boys
λ 0.05 0.10 0.15 0.20 0.25 0.30 0.35 0.40 0.45 0.50
GDa 735.7 735.9 735.8 735.5 735.9 738.6 744.9 755.6 769.6 783.6
λ 0.55 0.60 0.65 0.70 0.75 0.80 0.85 0.90 0.95 1.00
GDa 793.4 795.7 791.3 786.9 795.4 835.5 929.0 NA NA NA
a In excess of 45 000; NA: not available (method did not converge with this power).
Having chosen the age-transformation power λ=0.20, the search for the best df(µ) and df(σ) followed, comparing models in which the parameters ν and τ had the fixed values 1 and 2, respectively, i.e.
adjusting neither for skewness nor for kurtosis. For this, all possible combinations of df(µ) ranging
from 5 to 15 and df(σ) from 2 to 10 were considered. Partial results are presented in Table 5.
Table 5 Goodness-of-fit summary for models using the BCPE distribution with fixed ν=1 and
τ=2 for head circumference-for-age for boys
df(µ) df(σ) GDa
AICa
GAIC(3)a
Total df
3 758.7 778.7 788.7 10
4 747.4 769.4 780.4 11
5 743.6 767.6 779.6 12
6 741.9 767.9 780.9 13
7
7 741.1 769.1 783.1 14
3 750.3 772.3 783.3 11
4 739.0 763.0 775.0 12
5 735.2 761.2 774.2 13
6 733.6 761.6 775.6 14
8
7 732.7 762.7 777.7 15
3 746.9 770.9 782.9 12
4 735.5 761.5 774.5 13
5 731.8 759.8 773.8 14
6 730.1 760.1 775.1 15
9
7 729.3 761.3 777.3 16
3 745.2 771.2 784.2 13
4 733.8 761.8 775.8 14
5 730.1 760.1 775.1 15
6 728.5 760.5 776.5 16
10
7 727.7 761.7 778.7 17
3 744.2 772.2 786.2 14
4 732.9 762.9 777.9 15
5 729.2 761.2 777.2 16
6 727.6 761.6 778.6 17
11
7 726.7 762.7 780.7 18
GD, Global Deviance; AIC, Akaike Information Criterion;
GAIC(3), Generalized AIC with penalty equal to 3; a In excess of 45 000.
The best combination of AIC and GAIC(3) corresponds to df(µ)=9 and df(σ)=5. Further evaluations of this model were carried out by examining the fit of the µ and σ curves and the patterns of the centile
residuals (the empirical minus the fitted centiles) across age.
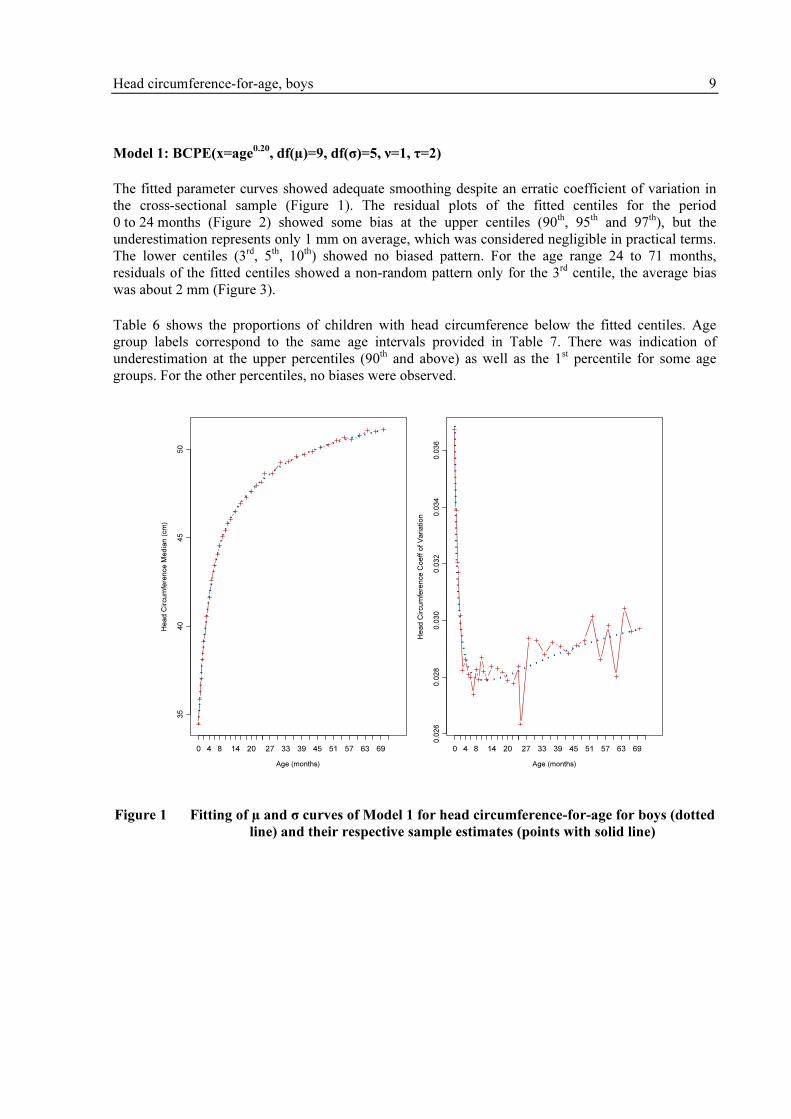
Head circumference-for-age, boys 9
Model 1: BCPE(x=age0.20
, df(µ)=9, df(σ)=5, ν=1, τ=2)
The fitted parameter curves showed adequate smoothing despite an erratic coefficient of variation in the cross-sectional sample (Figure 1). The residual plots of the fitted centiles for the period
0 to 24 months (Figure 2) showed some bias at the upper centiles (90th, 95th and 97th), but the
underestimation represents only 1 mm on average, which was considered negligible in practical terms.
The lower centiles (3rd, 5th, 10th) showed no biased pattern. For the age range 24 to 71 months,
residuals of the fitted centiles showed a non-random pattern only for the 3rd centile, the average bias
was about 2 mm (Figure 3).
Table 6 shows the proportions of children with head circumference below the fitted centiles. Age group labels correspond to the same age intervals provided in Table 7. There was indication of
underestimation at the upper percentiles (90th and above) as well as the 1st percentile for some age
groups. For the other percentiles, no biases were observed.
Age (months)
He
ad
Cir
cu
mfe
ren
ce
Me
dia
n (
cm
)
35
40
45
50
0 4 8 14 20 27 33 39 45 51 57 63 69
Age (months)
He
ad
Cir
cu
mfe
ren
ce
Co
eff
of
Va
ria
tio
n
0.0
26
0.0
28
0.0
30
0.0
32
0.0
34
0.0
36
0 4 8 14 20 27 33 39 45 51 57 63 69
Figure 1 Fitting of µ and σ curves of Model 1 for head circumference-for-age for boys (dotted
line) and their respective sample estimates (points with solid line)
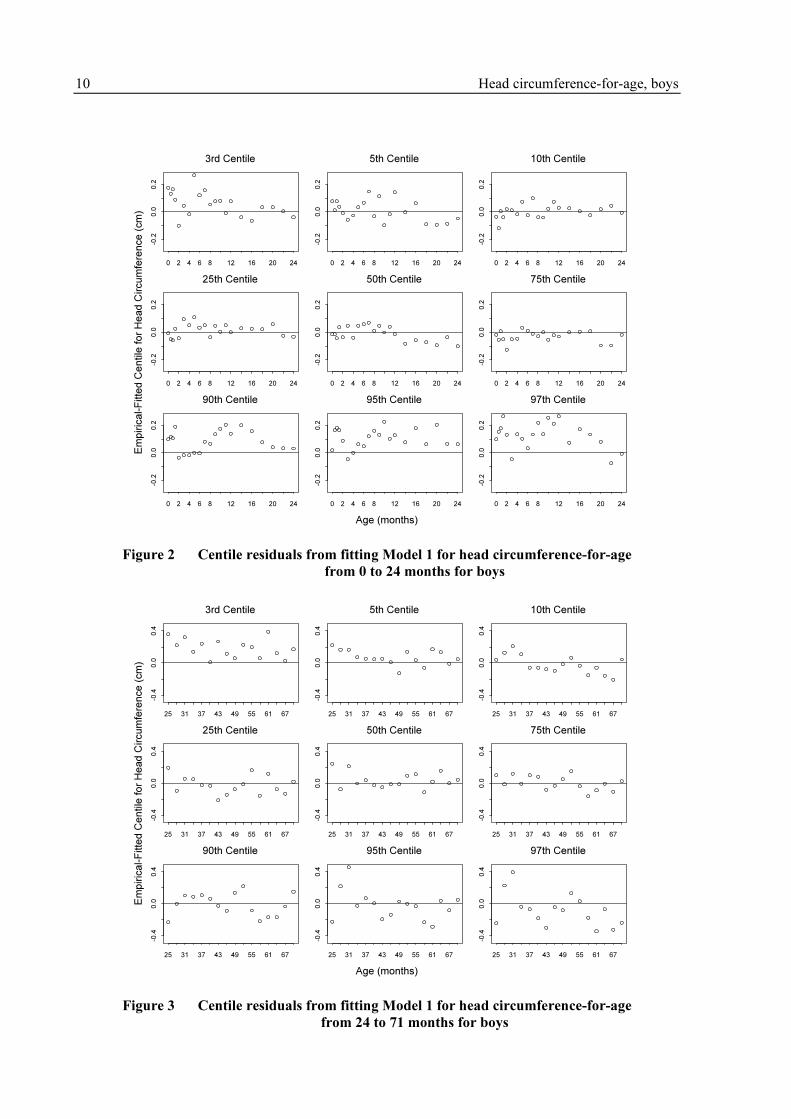
10 Head circumference-for-age, boys
3rd Centile-0.2
0.0
0.2
0 2 4 6 8 12 16 20 24
5th Centile
-0.2
0.0
0.2
0 2 4 6 8 12 16 20 24
10th Centile
-0.2
0.0
0.2
0 2 4 6 8 12 16 20 24
25th Centile
-0.2
0.0
0.2
0 2 4 6 8 12 16 20 24
50th Centile
-0.2
0.0
0.2
0 2 4 6 8 12 16 20 24
75th Centile
-0.2
0.0
0.2
0 2 4 6 8 12 16 20 24
90th Centile
-0.2
0.0
0.2
0 2 4 6 8 12 16 20 24
95th Centile
-0.2
0.0
0.2
0 2 4 6 8 12 16 20 24
97th Centile
-0.2
0.0
0.2
0 2 4 6 8 12 16 20 24
Age (months)
Em
piric
al-F
itte
d C
entile
for
Head C
ircum
fere
nce (
cm
)
Figure 2 Centile residuals from fitting Model 1 for head circumference-for-age
from 0 to 24 months for boys
3rd Centile
-0.4
0.0
0.4
25 31 37 43 49 55 61 67
5th Centile
-0.4
0.0
0.4
25 31 37 43 49 55 61 67
10th Centile
-0.4
0.0
0.4
25 31 37 43 49 55 61 67
25th Centile
-0.4
0.0
0.4
25 31 37 43 49 55 61 67
50th Centile
-0.4
0.0
0.4
25 31 37 43 49 55 61 67
75th Centile
-0.4
0.0
0.4
25 31 37 43 49 55 61 67
90th Centile
-0.4
0.0
0.4
25 31 37 43 49 55 61 67
95th Centile
-0.4
0.0
0.4
25 31 37 43 49 55 61 67
97th Centile
-0.4
0.0
0.4
25 31 37 43 49 55 61 67
Age (months)
Em
piric
al-F
itte
d C
entile
for
Head C
ircum
fere
nce (
cm
)
Figure 3 Centile residuals from fitting Model 1 for head circumference-for-age
from 24 to 71 months for boys

Head circumference-for-age, boys 11
The worm plots for Model 1 are shown in Figure 4. There are only three groups for which worms
present slight upward or downward shifts (40 mo, 52 mo and 58 mo), but overall, the fit of the median
is adequate. Groups at birth and 42 d present U-shaped worms, indicating residual skewness to the left.
There are no worms with a slope, which would indicate misfit in the variance curve. S-shaped worms
indicate a misfit in the curve of the parameter related to kurtosis as is the case in the 40 mo age group
only. Despite the slight deviances present in a few groups, overall, the worms fitted to the points (solid
red line) are all contained within the 95% confidence interval (dotted curves).
Birth 14 d 28 d 42 d 2 mo 3 mo
4 mo 5 mo 6 mo 7 mo 8 mo 9 mo
10 mo 11 mo 12 mo 14 mo 16 mo 18 mo
20 mo 22 mo 24 mo 28 mo 34 mo 40 mo
46 mo 52 mo 58 mo 64 mo 70 mo
Birth 14 d 28 d 42 d 2 mo 3 mo
4 mo 5 mo 6 mo 7 mo 8 mo 9 mo
10 mo 11 mo 12 mo 14 mo 16 mo 18 mo
20 mo 22 mo 24 mo 28 mo 34 mo 40 mo
46 mo 52 mo 58 mo 64 mo 70 mo
Birth 14 d 28 d 42 d 2 mo 3 mo
4 mo 5 mo 6 mo 7 mo 8 mo 9 mo
10 mo 11 mo 12 mo 14 mo 16 mo 18 mo
20 mo 22 mo 24 mo 28 mo 34 mo 40 mo
46 mo 52 mo 58 mo 64 mo 70 mo
Figure 4 Worm plots of z-scores for Model 1 for head circumference-for-age for boys
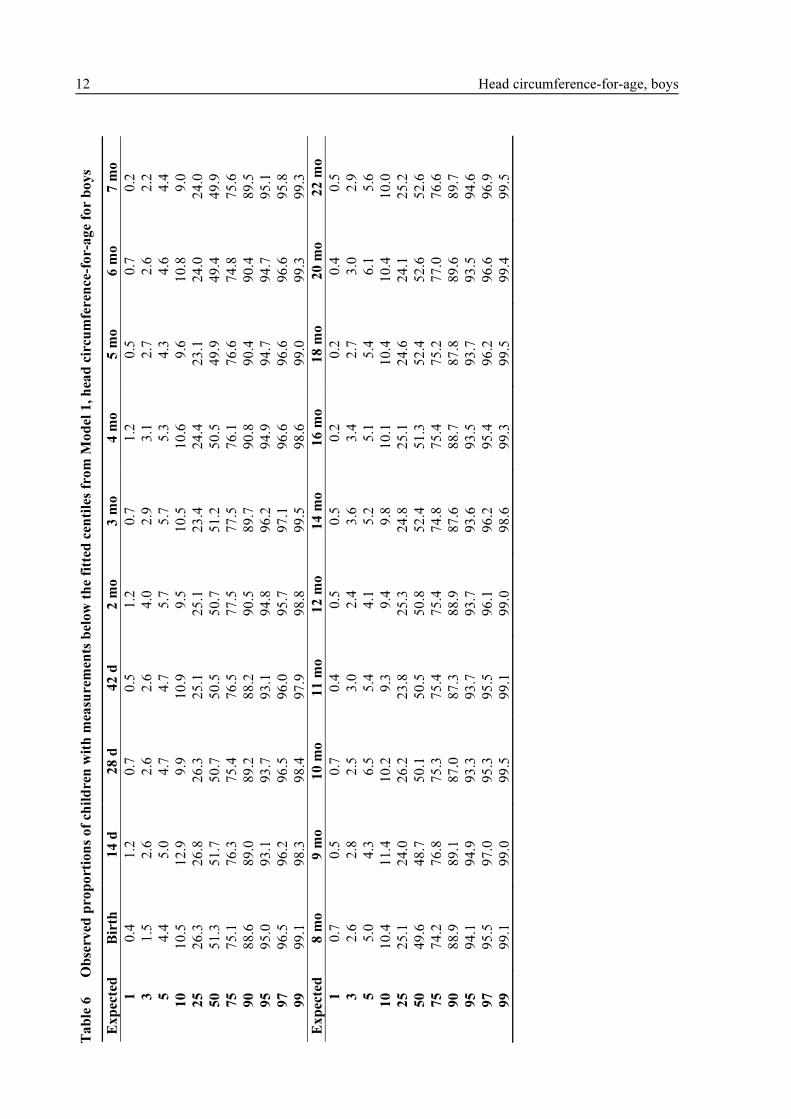
Ta
ble
6
Ob
serv
ed p
ro
po
rtio
ns
of
chil
dre
n w
ith
mea
surem
ents
bel
ow
th
e fi
tted
cen
tile
s fr
om
Mo
del
1, h
ead
cir
cum
feren
ce-f
or-
ag
e fo
r b
oy
s
Ex
pec
ted
B
irth
1
4 d
2
8 d
4
2 d
2
mo
3
mo
4
mo
5
mo
6
mo
7
mo
1
0.4
1
.2
0.7
0
.5
1.2
0
.7
1.2
0
.5
0.7
0
.2
3
1.5
2
.6
2.6
2
.6
4.0
2
.9
3.1
2
.7
2.6
2
.2
5
4.4
5
.0
4.7
4
.7
5.7
5
.7
5.3
4
.3
4.6
4
.4
10
1
0.5
1
2.9
9
.9
10
.9
9.5
1
0.5
1
0.6
9
.6
10
.8
9.0
25
2
6.3
2
6.8
2
6.3
2
5.1
2
5.1
2
3.4
2
4.4
2
3.1
2
4.0
2
4.0
50
5
1.3
5
1.7
5
0.7
5
0.5
5
0.7
5
1.2
5
0.5
4
9.9
4
9.4
4
9.9
75
7
5.1
7
6.3
7
5.4
7
6.5
7
7.5
7
7.5
7
6.1
7
6.6
7
4.8
7
5.6
90
8
8.6
8
9.0
8
9.2
8
8.2
9
0.5
8
9.7
9
0.8
9
0.4
9
0.4
8
9.5
95
9
5.0
9
3.1
9
3.7
9
3.1
9
4.8
9
6.2
9
4.9
9
4.7
9
4.7
9
5.1
97
9
6.5
9
6.2
9
6.5
9
6.0
9
5.7
9
7.1
9
6.6
9
6.6
9
6.6
9
5.8
99
9
9.1
9
8.3
9
8.4
9
7.9
9
8.8
9
9.5
9
8.6
9
9.0
9
9.3
9
9.3
Ex
pec
ted
8
mo
9
mo
1
0 m
o
11
mo
1
2 m
o
14
mo
1
6 m
o
18
mo
2
0 m
o
22
mo
1
0.7
0
.5
0.7
0
.4
0.5
0
.5
0.2
0
.2
0.4
0
.5
3
2.6
2
.8
2.5
3
.0
2.4
3
.6
3.4
2
.7
3.0
2
.9
5
5.0
4
.3
6.5
5
.4
4.1
5
.2
5.1
5
.4
6.1
5
.6
10
1
0.4
1
1.4
1
0.2
9
.3
9.4
9
.8
10
.1
10
.4
10
.4
10
.0
25
2
5.1
2
4.0
2
6.2
2
3.8
2
5.3
2
4.8
2
5.1
2
4.6
2
4.1
2
5.2
50
4
9.6
4
8.7
5
0.1
5
0.5
5
0.8
5
2.4
5
1.3
5
2.4
5
2.6
5
2.6
75
7
4.2
7
6.8
7
5.3
7
5.4
7
5.4
7
4.8
7
5.4
7
5.2
7
7.0
7
6.6
90
8
8.9
8
9.1
8
7.0
8
7.3
8
8.9
8
7.6
8
8.7
8
7.8
8
9.6
8
9.7
95
9
4.1
9
4.9
9
3.3
9
3.7
9
3.7
9
3.6
9
3.5
9
3.7
9
3.5
9
4.6
97
9
5.5
9
7.0
9
5.3
9
5.5
9
6.1
9
6.2
9
5.4
9
6.2
9
6.6
9
6.9
99
9
9.1
9
9.0
9
9.5
9
9.1
9
9.0
9
8.6
9
9.3
9
9.5
9
9.4
9
9.5
12 Head circumference-for-age, boys
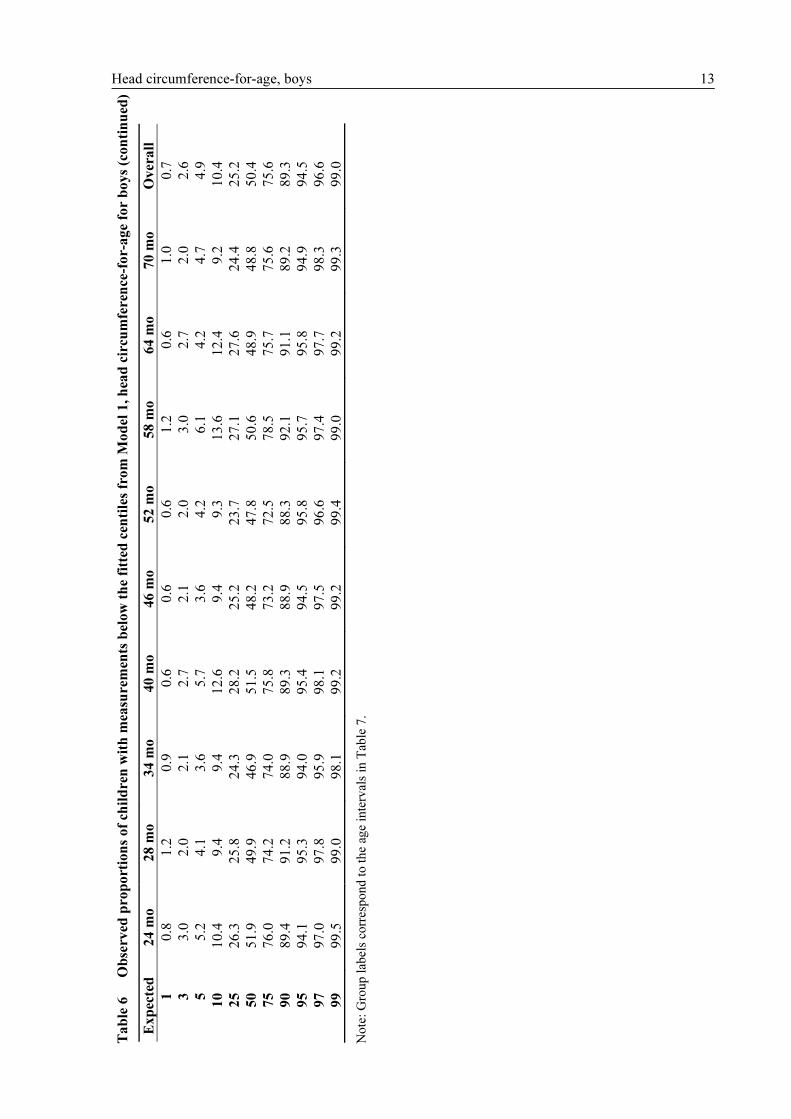
Ta
ble
6
Ob
serv
ed p
ro
po
rtio
ns
of
chil
dre
n w
ith
mea
surem
ents
bel
ow
th
e fi
tted
cen
tile
s fr
om
Mo
del
1, h
ead
cir
cum
feren
ce-f
or-
ag
e fo
r b
oy
s (c
on
tin
ued
)
Ex
pec
ted
2
4 m
o
28
mo
3
4 m
o
40
mo
4
6 m
o
52
mo
5
8 m
o
64
mo
7
0 m
o
Ov
era
ll
1
0.8
1
.2
0.9
0
.6
0.6
0
.6
1.2
0
.6
1.0
0
.7
3
3.0
2
.0
2.1
2
.7
2.1
2
.0
3.0
2
.7
2.0
2
.6
5
5.2
4
.1
3.6
5
.7
3.6
4
.2
6.1
4
.2
4.7
4
.9
10
1
0.4
9
.4
9.4
1
2.6
9
.4
9.3
1
3.6
1
2.4
9
.2
10
.4
25
2
6.3
2
5.8
2
4.3
2
8.2
2
5.2
2
3.7
2
7.1
2
7.6
2
4.4
2
5.2
50
5
1.9
4
9.9
4
6.9
5
1.5
4
8.2
4
7.8
5
0.6
4
8.9
4
8.8
5
0.4
75
7
6.0
7
4.2
7
4.0
7
5.8
7
3.2
7
2.5
7
8.5
7
5.7
7
5.6
7
5.6
90
8
9.4
9
1.2
8
8.9
8
9.3
8
8.9
8
8.3
9
2.1
9
1.1
8
9.2
8
9.3
95
9
4.1
9
5.3
9
4.0
9
5.4
9
4.5
9
5.8
9
5.7
9
5.8
9
4.9
9
4.5
97
9
7.0
9
7.8
9
5.9
9
8.1
9
7.5
9
6.6
9
7.4
9
7.7
9
8.3
9
6.6
99
9
9.5
9
9.0
9
8.1
9
9.2
9
9.2
9
9.4
9
9.0
9
9.2
9
9.3
9
9.0
No
te:
Gro
up l
abel
s co
rres
pond
to t
he
age
inte
rval
s in
Tab
le 7
.
Head circumference-for-age, boys 13
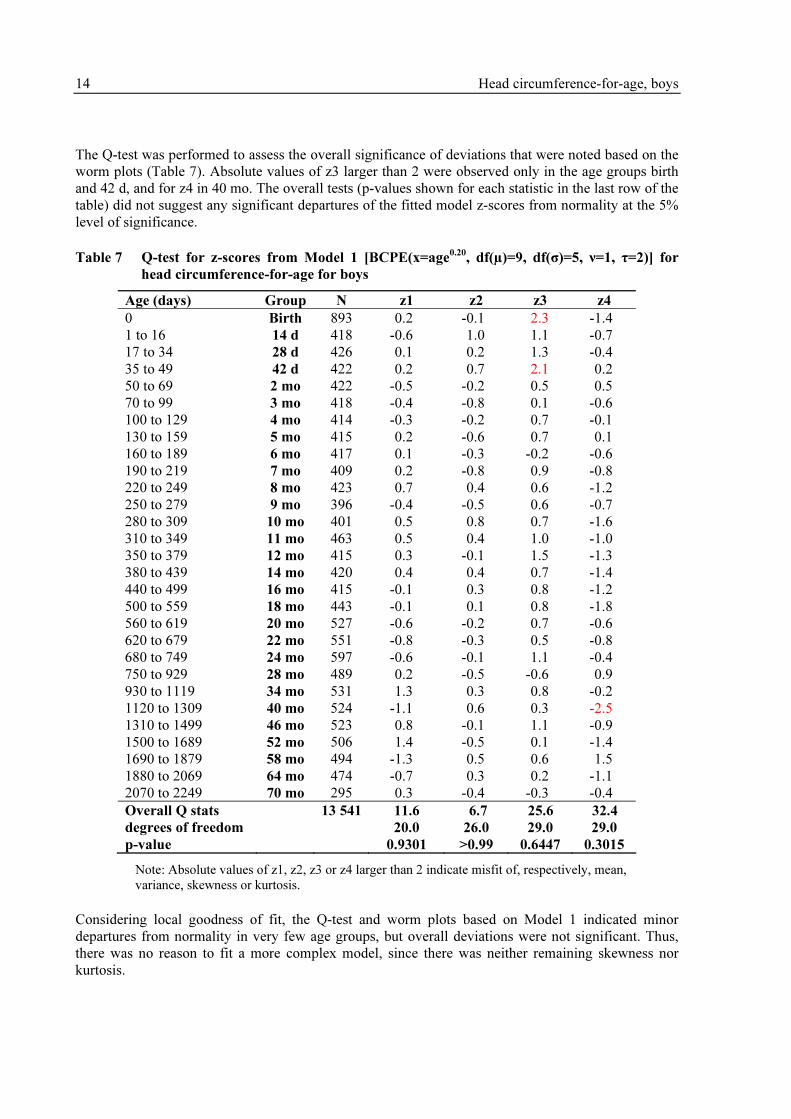
14 Head circumference-for-age, boys
The Q-test was performed to assess the overall significance of deviations that were noted based on the
worm plots (Table 7). Absolute values of z3 larger than 2 were observed only in the age groups birth
and 42 d, and for z4 in 40 mo. The overall tests (p-values shown for each statistic in the last row of the
table) did not suggest any significant departures of the fitted model z-scores from normality at the 5%
level of significance.
Table 7 Q-test for z-scores from Model 1 [BCPE(x=age0.20
, df(µ)=9, df(σ)=5, ν=1, τ=2)] for
head circumference-for-age for boys
Age (days) Group N z1 z2 z3 z4
0 Birth 893 0.2 -0.1 2.3 -1.4
1 to 16 14 d 418 -0.6 1.0 1.1 -0.7
17 to 34 28 d 426 0.1 0.2 1.3 -0.4
35 to 49 42 d 422 0.2 0.7 2.1 0.2
50 to 69 2 mo 422 -0.5 -0.2 0.5 0.5
70 to 99 3 mo 418 -0.4 -0.8 0.1 -0.6
100 to 129 4 mo 414 -0.3 -0.2 0.7 -0.1
130 to 159 5 mo 415 0.2 -0.6 0.7 0.1
160 to 189 6 mo 417 0.1 -0.3 -0.2 -0.6
190 to 219 7 mo 409 0.2 -0.8 0.9 -0.8
220 to 249 8 mo 423 0.7 0.4 0.6 -1.2
250 to 279 9 mo 396 -0.4 -0.5 0.6 -0.7
280 to 309 10 mo 401 0.5 0.8 0.7 -1.6
310 to 349 11 mo 463 0.5 0.4 1.0 -1.0
350 to 379 12 mo 415 0.3 -0.1 1.5 -1.3
380 to 439 14 mo 420 0.4 0.4 0.7 -1.4
440 to 499 16 mo 415 -0.1 0.3 0.8 -1.2
500 to 559 18 mo 443 -0.1 0.1 0.8 -1.8
560 to 619 20 mo 527 -0.6 -0.2 0.7 -0.6
620 to 679 22 mo 551 -0.8 -0.3 0.5 -0.8
680 to 749 24 mo 597 -0.6 -0.1 1.1 -0.4
750 to 929 28 mo 489 0.2 -0.5 -0.6 0.9
930 to 1119 34 mo 531 1.3 0.3 0.8 -0.2
1120 to 1309 40 mo 524 -1.1 0.6 0.3 -2.5
1310 to 1499 46 mo 523 0.8 -0.1 1.1 -0.9
1500 to 1689 52 mo 506 1.4 -0.5 0.1 -1.4
1690 to 1879 58 mo 494 -1.3 0.5 0.6 1.5
1880 to 2069 64 mo 474 -0.7 0.3 0.2 -1.1
2070 to 2249 70 mo 295 0.3 -0.4 -0.3 -0.4
Overall Q stats 13 541 11.6 6.7 25.6 32.4
degrees of freedom 20.0 26.0 29.0 29.0
p-value 0.9301 >0.99 0.6447 0.3015
Note: Absolute values of z1, z2, z3 or z4 larger than 2 indicate misfit of, respectively, mean,
variance, skewness or kurtosis.
Considering local goodness of fit, the Q-test and worm plots based on Model 1 indicated minor
departures from normality in very few age groups, but overall deviations were not significant. Thus,
there was no reason to fit a more complex model, since there was neither remaining skewness nor
kurtosis.

Head circumference-for-age, boys 15
Model 1 was selected and a new iteration was done using the values df(µ)=9 and df(σ)=5 to re-search
for the best age-transformation power λ. The smallest global deviance in this case was for λ=0.05
(GD=45 731.0), but with only a very minor difference from the model using λ=0.20 (GD=45 731.8).
There was thus no need to update λ, and the selected model for constructing the head circumference-
for-age growth curves for boys remained BCPE(x= age0.20, df(µ)=9, df(σ)=5, ν=1, τ=2). Figures 5 to 8
show the fitted centile curves derived from the selected model against empirical head circumference-
for-age values.

Ag
e (
mo
nth
s)
Head Circumference (cm)
35404550
02
46
81
01
21
41
61
82
02
22
4
3rd
10th
50th
90th
97th
Fig
ure
5
3rd
, 1
0th
, 5
0th
, 9
0th
, 9
7th
sm
oo
thed
cen
tile
cu
rves
an
d e
mp
iric
al
va
lues
: h
ead
cir
cum
fere
nce
-fo
r-a
ge
for
bo
ys
from
bir
th t
o 2
4 m
on
ths
16 Head circumference-for-age, boys

Age (
month
s)
Head Circumference (cm)
35404550
02
46
810
12
14
16
18
20
22
24
5th
25th
50th
75th
95th
Fig
ure
6
5th
, 2
5th
, 5
0th
, 7
5th
, 9
5th
sm
oo
thed
cen
tile
cu
rves
an
d e
mp
iric
al
va
lues
: h
ead
cir
cum
fere
nce
-fo
r-a
ge
for
bo
ys
from
bir
th t
o 2
4 m
on
ths
Head circumference-for-age, boys 17

Age (
month
s)
Head Circumference (cm)
4648505254
24
27
30
33
36
39
42
45
48
51
54
57
60
63
66
69
72
3rd
10th
50th
90th
97th
Fig
ure
7
3rd
, 1
0th
, 5
0th
, 9
0th
, 9
7th
sm
oo
thed
cen
tile
cu
rves
an
d e
mp
iric
al
va
lues
: h
ead
cir
cum
fere
nce
-fo
r-a
ge
for
bo
ys
from
24
to
71 m
on
ths
18 Head circumference-for-age, boys

Ag
e (
mo
nth
s)
Head Circumference (cm)
4648505254
24
27
30
33
36
39
42
45
48
51
54
57
60
63
66
69
72
5th
25th
50th
75th
95th
Fig
ure
8
5th
, 2
5th
, 5
0th
, 7
5th
, 9
5th
sm
oo
thed
cen
tile
cu
rves
an
d e
mp
iric
al
va
lues
: h
ead
cir
cum
fere
nce
-fo
r-a
ge
for
bo
ys
fro
m 2
4 t
o 7
1 m
on
ths
Head circumference-for-age, boys 19

20 Head circumference-for-age, boys
3.2.3 WHO standards
This section presents the final WHO head circumference-for-age z-score and percentile charts (Figures
9 and 10) and tables (Tables 8 and 9) for boys.

Ch
arts
Ag
e (
mo
nth
s)
Head Circumference (cm)
303540455055
02
46
81
21
62
02
42
83
23
64
04
44
85
25
66
0
123 0 -1 -2 -3
Fig
ure
9
WH
O h
ead
cir
cum
fere
nce-
for-
ag
e z-
sco
res
for
bo
ys
fro
m b
irth
to
60
mo
nth
s
Head circumference-for-age, boys 21
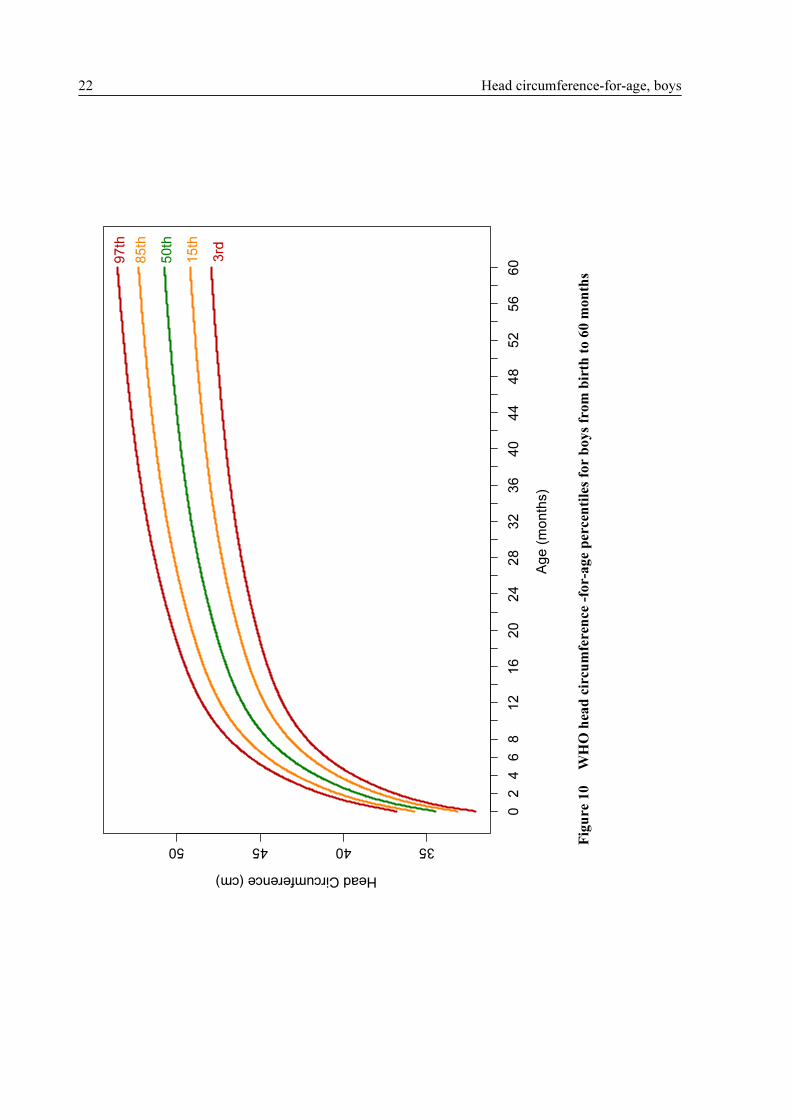
Ag
e (
mo
nth
s)
Head Circumference (cm)
35404550
02
46
812
16
20
24
28
32
36
40
44
48
52
56
603
rd
50
th
97
th
15
th
85
th
Fig
ure
10
WH
O h
ead
cir
cum
fere
nce
-fo
r-a
ge
per
cen
tile
s fo
r b
oy
s fr
om
bir
th t
o 6
0 m
on
ths
22 Head circumference-for-age, boys

Ta
ble
s
Ta
ble
8
Hea
d c
ircu
mfe
ren
ce-
for-
ag
e fo
r b
oy
s, a
ge
in w
eek
s
P
ercen
tile
s (h
ea
d c
ircu
mfe
ren
ce i
n c
m)
Week
L
M
S
S
D
1st
3
rd
5
th
15th
2
5th
5
0th
7
5th
8
5th
9
5th
9
7th
9
9th
0
1
34.4
61
8
0.0
368
6
1.2
703
3
1.5
3
2.1
3
2.4
3
3.1
3
3.6
3
4.5
3
5.3
3
5.8
3
6.6
3
6.9
3
7.4
1
1
35.1
63
4
0.0
347
2
1.2
209
3
2.3
3
2.9
3
3.2
3
3.9
3
4.3
3
5.2
3
6.0
3
6.4
3
7.2
3
7.5
3
8.0
2
1
35.8
64
9
0.0
325
8
1.1
685
3
3.1
3
3.7
3
3.9
3
4.7
3
5.1
3
5.9
3
6.7
3
7.1
3
7.8
3
8.1
3
8.6
3
1
36.5
21
6
0.0
319
7
1.1
676
3
3.8
3
4.3
3
4.6
3
5.3
3
5.7
3
6.5
3
7.3
3
7.7
3
8.4
3
8.7
3
9.2
4
1
37.0
92
6
0.0
314
8
1.1
677
3
4.4
3
4.9
3
5.2
3
5.9
3
6.3
3
7.1
3
7.9
3
8.3
3
9.0
3
9.3
3
9.8
5
1
37.6
01
0
0.0
310
7
1.1
683
3
4.9
3
5.4
3
5.7
3
6.4
3
6.8
3
7.6
3
8.4
3
8.8
3
9.5
3
9.8
4
0.3
6
1
38.0
60
9
0.0
307
2
1.1
692
3
5.3
3
5.9
3
6.1
3
6.8
3
7.3
3
8.1
3
8.8
3
9.3
4
0.0
4
0.3
4
0.8
7
1
38.4
82
4
0.0
304
1
1.1
703
3
5.8
3
6.3
3
6.6
3
7.3
3
7.7
3
8.5
3
9.3
3
9.7
4
0.4
4
0.7
4
1.2
8
1
38.8
72
4
0.0
301
4
1.1
716
3
6.1
3
6.7
3
6.9
3
7.7
3
8.1
3
8.9
3
9.7
4
0.1
4
0.8
4
1.1
4
1.6
9
1
39.2
36
8
0.0
299
0
1.1
732
3
6.5
3
7.0
3
7.3
3
8.0
3
8.4
3
9.2
4
0.0
4
0.5
4
1.2
4
1.4
4
2.0
10
1
3
9.5
79
7
0.0
296
9
1.1
751
3
6.8
3
7.4
3
7.6
3
8.4
3
8.8
3
9.6
4
0.4
4
0.8
4
1.5
4
1.8
4
2.3
11
1
3
9.9
03
3
0.0
295
0
1.1
772
3
7.2
3
7.7
3
8.0
3
8.7
3
9.1
3
9.9
4
0.7
4
1.1
4
1.8
4
2.1
4
2.6
12
1
4
0.2
09
6
0.0
293
3
1.1
794
3
7.5
3
8.0
3
8.3
3
9.0
3
9.4
4
0.2
4
1.0
4
1.4
4
2.1
4
2.4
4
3.0
13
1
4
0.5
00
8
0.0
291
8
1.1
818
3
7.8
3
8.3
3
8.6
3
9.3
3
9.7
4
0.5
4
1.3
4
1.7
4
2.4
4
2.7
4
3.3
Head circumference-for-age, boys 23
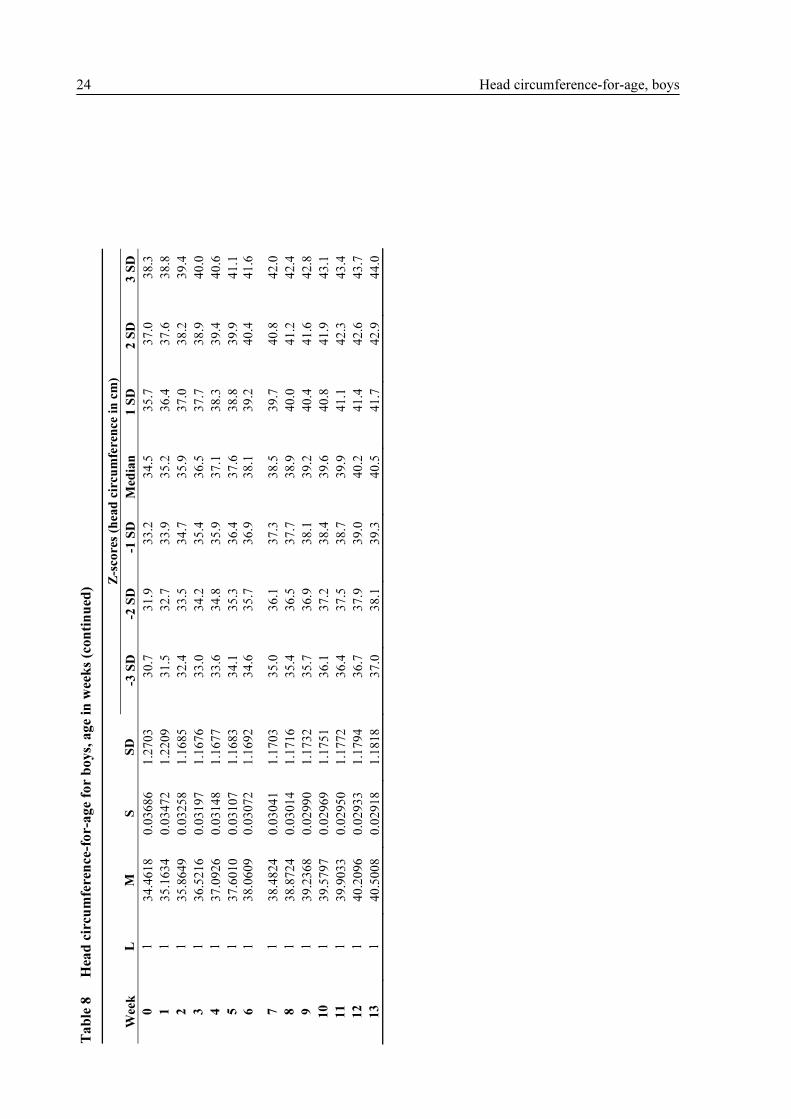
Ta
ble
8
Hea
d c
ircu
mfe
ren
ce-
for-
ag
e fo
r b
oy
s, a
ge
in w
eek
s (c
on
tin
ued
)
Z
-sco
res
(head
cir
cu
mfe
ren
ce i
n c
m)
Week
L
M
S
S
D
-3 S
D
-2 S
D
-1 S
D
Med
ian
1
SD
2
SD
3
SD
0
1
34.4
61
8
0.0
368
6
1.2
703
3
0.7
3
1.9
3
3.2
3
4.5
3
5.7
3
7.0
3
8.3
1
1
35.1
63
4
0.0
347
2
1.2
209
3
1.5
3
2.7
3
3.9
3
5.2
3
6.4
3
7.6
3
8.8
2
1
35.8
64
9
0.0
325
8
1.1
685
3
2.4
3
3.5
3
4.7
3
5.9
3
7.0
3
8.2
3
9.4
3
1
36.5
21
6
0.0
319
7
1.1
676
3
3.0
3
4.2
3
5.4
3
6.5
3
7.7
3
8.9
4
0.0
4
1
37.0
92
6
0.0
314
8
1.1
677
3
3.6
3
4.8
3
5.9
3
7.1
3
8.3
3
9.4
4
0.6
5
1
37.6
01
0
0.0
310
7
1.1
683
3
4.1
3
5.3
3
6.4
3
7.6
3
8.8
3
9.9
4
1.1
6
1
38.0
60
9
0.0
307
2
1.1
692
3
4.6
3
5.7
3
6.9
3
8.1
3
9.2
4
0.4
4
1.6
7
1
38.4
82
4
0.0
304
1
1.1
703
3
5.0
3
6.1
3
7.3
3
8.5
3
9.7
4
0.8
4
2.0
8
1
38.8
72
4
0.0
301
4
1.1
716
3
5.4
3
6.5
3
7.7
3
8.9
4
0.0
4
1.2
4
2.4
9
1
39.2
36
8
0.0
299
0
1.1
732
3
5.7
3
6.9
3
8.1
3
9.2
4
0.4
4
1.6
4
2.8
10
1
3
9.5
79
7
0.0
296
9
1.1
751
3
6.1
3
7.2
3
8.4
3
9.6
4
0.8
4
1.9
4
3.1
11
1
3
9.9
03
3
0.0
295
0
1.1
772
3
6.4
3
7.5
3
8.7
3
9.9
4
1.1
4
2.3
4
3.4
12
1
4
0.2
09
6
0.0
293
3
1.1
794
3
6.7
3
7.9
3
9.0
4
0.2
4
1.4
4
2.6
4
3.7
13
1
4
0.5
00
8
0.0
291
8
1.1
818
3
7.0
3
8.1
3
9.3
4
0.5
4
1.7
4
2.9
4
4.0
24 Head circumference-for-age, boys

Ta
ble
9
Hea
d c
ircu
mfe
ren
ce-
for-
ag
e fo
r b
oy
s, a
ge
in y
ears
an
d m
on
ths
Percen
tile
s (h
ea
d c
ircu
mfe
ren
ce i
n c
m)
Yea
r: M
on
th
Mon
th
L
M
S
SD
1
st
3rd
5
th
15th
2
5th
5
0th
7
5th
8
5th
9
5th
9
7th
9
9th
0:
0
0
1
34.4
61
8
0.0
368
6
1.2
703
3
1.5
3
2.1
3
2.4
3
3.1
3
3.6
3
4.5
3
5.3
3
5.8
3
6.6
3
6.9
3
7.4
0:
1
1
1
37.2
75
9
0.0
313
3
1.1
679
3
4.6
3
5.1
3
5.4
3
6.1
3
6.5
3
7.3
3
8.1
3
8.5
3
9.2
3
9.5
4
0.0
0:
2
2
1
39.1
28
5
0.0
299
7
1.1
727
3
6.4
3
6.9
3
7.2
3
7.9
3
8.3
3
9.1
3
9.9
4
0.3
4
1.1
4
1.3
4
1.9
0:
3
3
1
40.5
13
5
0.0
291
8
1.1
822
3
7.8
3
8.3
3
8.6
3
9.3
3
9.7
4
0.5
4
1.3
4
1.7
4
2.5
4
2.7
4
3.3
0:
4
4
1
41.6
31
7
0.0
286
8
1.1
940
3
8.9
3
9.4
3
9.7
4
0.4
4
0.8
4
1.6
4
2.4
4
2.9
4
3.6
4
3.9
4
4.4
0:
5
5
1
42.5
57
6
0.0
283
7
1.2
074
3
9.7
4
0.3
4
0.6
4
1.3
4
1.7
4
2.6
4
3.4
4
3.8
4
4.5
4
4.8
4
5.4
0:
6
6
1
43.3
30
6
0.0
281
7
1.2
206
4
0.5
4
1.0
4
1.3
4
2.1
4
2.5
4
3.3
4
4.2
4
4.6
4
5.3
4
5.6
4
6.2
0:
7
7
1
43.9
80
3
0.0
280
4
1.2
332
4
1.1
4
1.7
4
2.0
4
2.7
4
3.1
4
4.0
4
4.8
4
5.3
4
6.0
4
6.3
4
6.8
0:
8
8
1
44.5
30
0
0.0
279
6
1.2
451
4
1.6
4
2.2
4
2.5
4
3.2
4
3.7
4
4.5
4
5.4
4
5.8
4
6.6
4
6.9
4
7.4
0:
9
9
1
44.9
99
8
0.0
279
2
1.2
564
4
2.1
4
2.6
4
2.9
4
3.7
4
4.2
4
5.0
4
5.8
4
6.3
4
7.1
4
7.4
4
7.9
0:1
0
10
1
4
5.4
05
1
0.0
279
0
1.2
668
4
2.5
4
3.0
4
3.3
4
4.1
4
4.6
4
5.4
4
6.3
4
6.7
4
7.5
4
7.8
4
8.4
0:1
1
11
1
4
5.7
57
3
0.0
278
9
1.2
762
4
2.8
4
3.4
4
3.7
4
4.4
4
4.9
4
5.8
4
6.6
4
7.1
4
7.9
4
8.2
4
8.7
1:
0
12
1
4
6.0
66
1
0.0
278
9
1.2
848
4
3.1
4
3.6
4
4.0
4
4.7
4
5.2
4
6.1
4
6.9
4
7.4
4
8.2
4
8.5
4
9.1
1:
1
13
1
4
6.3
39
5
0.0
278
9
1.2
924
4
3.3
4
3.9
4
4.2
4
5.0
4
5.5
4
6.3
4
7.2
4
7.7
4
8.5
4
8.8
4
9.3
1:
2
14
1
4
6.5
84
4
0.0
279
1
1.3
002
4
3.6
4
4.1
4
4.4
4
5.2
4
5.7
4
6.6
4
7.5
4
7.9
4
8.7
4
9.0
4
9.6
1:
3
15
1
4
6.8
06
0
0.0
279
2
1.3
068
4
3.8
4
4.3
4
4.7
4
5.5
4
5.9
4
6.8
4
7.7
4
8.2
4
9.0
4
9.3
4
9.8
1:
4
16
1
4
7.0
08
8
0.0
279
5
1.3
139
4
4.0
4
4.5
4
4.8
4
5.6
4
6.1
4
7.0
4
7.9
4
8.4
4
9.2
4
9.5
5
0.1
1:
5
17
1
4
7.1
96
2
0.0
279
7
1.3
201
4
4.1
4
4.7
4
5.0
4
5.8
4
6.3
4
7.2
4
8.1
4
8.6
4
9.4
4
9.7
5
0.3
1:
6
18
1
4
7.3
71
1
0.0
280
0
1.3
264
4
4.3
4
4.9
4
5.2
4
6.0
4
6.5
4
7.4
4
8.3
4
8.7
4
9.6
4
9.9
5
0.5
1:
7
19
1
4
7.5
35
7
0.0
280
3
1.3
324
4
4.4
4
5.0
4
5.3
4
6.2
4
6.6
4
7.5
4
8.4
4
8.9
4
9.7
5
0.0
5
0.6
1:
8
20
1
4
7.6
91
9
0.0
280
6
1.3
382
4
4.6
4
5.2
4
5.5
4
6.3
4
6.8
4
7.7
4
8.6
4
9.1
4
9.9
5
0.2
5
0.8
1:
9
21
1
4
7.8
40
8
0.0
281
0
1.3
443
4
4.7
4
5.3
4
5.6
4
6.4
4
6.9
4
7.8
4
8.7
4
9.2
5
0.1
5
0.4
5
1.0
1:1
0
22
1
4
7.9
83
3
0.0
281
3
1.3
498
4
4.8
4
5.4
4
5.8
4
6.6
4
7.1
4
8.0
4
8.9
4
9.4
5
0.2
5
0.5
5
1.1
1:1
1
23
1
4
8.1
20
1
0.0
281
7
1.3
555
4
5.0
4
5.6
4
5.9
4
6.7
4
7.2
4
8.1
4
9.0
4
9.5
5
0.3
5
0.7
5
1.3
2:
0
24
1
4
8.2
51
5
0.0
282
1
1.3
612
4
5.1
4
5.7
4
6.0
4
6.8
4
7.3
4
8.3
4
9.2
4
9.7
5
0.5
5
0.8
5
1.4
Head circumference-for-age, boys 25

Ta
ble
9
Hea
d c
ircu
mfe
ren
ce-
for-
ag
e fo
r b
oy
s, a
ge
in y
ears
an
d m
on
ths
(co
nti
nu
ed)
Percen
tile
s (h
ea
d c
ircu
mfe
ren
ce i
n c
m)
Yea
r: M
on
th
Mon
th
L
M
S
SD
1
st
3rd
5
th
15th
2
5th
5
0th
7
5th
8
5th
9
5th
9
7th
9
9th
2:
1
25
1
4
8.3
77
7
0.0
282
5
1.3
667
4
5.2
4
5.8
4
6.1
4
7.0
4
7.5
4
8.4
4
9.3
4
9.8
5
0.6
5
0.9
5
1.6
2:
2
26
1
4
8.4
98
9
0.0
283
0
1.3
725
4
5.3
4
5.9
4
6.2
4
7.1
4
7.6
4
8.5
4
9.4
4
9.9
5
0.8
5
1.1
5
1.7
2:
3
27
1
4
8.6
15
1
0.0
283
4
1.3
778
4
5.4
4
6.0
4
6.3
4
7.2
4
7.7
4
8.6
4
9.5
5
0.0
5
0.9
5
1.2
5
1.8
2:
4
28
1
4
8.7
26
4
0.0
283
8
1.3
829
4
5.5
4
6.1
4
6.5
4
7.3
4
7.8
4
8.7
4
9.7
5
0.2
5
1.0
5
1.3
5
1.9
2:
5
29
1
4
8.8
33
1
0.0
284
2
1.3
878
4
5.6
4
6.2
4
6.6
4
7.4
4
7.9
4
8.8
4
9.8
5
0.3
5
1.1
5
1.4
5
2.1
2:
6
30
1
4
8.9
35
1
0.0
284
7
1.3
932
4
5.7
4
6.3
4
6.6
4
7.5
4
8.0
4
8.9
4
9.9
5
0.4
5
1.2
5
1.6
5
2.2
2:
7
31
1
4
9.0
32
7
0.0
285
1
1.3
979
4
5.8
4
6.4
4
6.7
4
7.6
4
8.1
4
9.0
5
0.0
5
0.5
5
1.3
5
1.7
5
2.3
2:
8
32
1
4
9.1
26
0
0.0
285
5
1.4
026
4
5.9
4
6.5
4
6.8
4
7.7
4
8.2
4
9.1
5
0.1
5
0.6
5
1.4
5
1.8
5
2.4
2:
9
33
1
4
9.2
15
3
0.0
285
9
1.4
071
4
5.9
4
6.6
4
6.9
4
7.8
4
8.3
4
9.2
5
0.2
5
0.7
5
1.5
5
1.9
5
2.5
2:1
0
34
1
4
9.3
00
7
0.0
286
3
1.4
115
4
6.0
4
6.6
4
7.0
4
7.8
4
8.3
4
9.3
5
0.3
5
0.8
5
1.6
5
2.0
5
2.6
2:1
1
35
1
4
9.3
82
6
0.0
286
7
1.4
158
4
6.1
4
6.7
4
7.1
4
7.9
4
8.4
4
9.4
5
0.3
5
0.8
5
1.7
5
2.0
5
2.7
3:
0
36
1
4
9.4
61
2
0.0
287
1
1.4
200
4
6.2
4
6.8
4
7.1
4
8.0
4
8.5
4
9.5
5
0.4
5
0.9
5
1.8
5
2.1
5
2.8
3:
1
37
1
4
9.5
36
7
0.0
287
5
1.4
242
4
6.2
4
6.9
4
7.2
4
8.1
4
8.6
4
9.5
5
0.5
5
1.0
5
1.9
5
2.2
5
2.8
3:
2
38
1
4
9.6
09
3
0.0
287
8
1.4
278
4
6.3
4
6.9
4
7.3
4
8.1
4
8.6
4
9.6
5
0.6
5
1.1
5
2.0
5
2.3
5
2.9
3:
3
39
1
4
9.6
79
1
0.0
288
2
1.4
318
4
6.3
4
7.0
4
7.3
4
8.2
4
8.7
4
9.7
5
0.6
5
1.2
5
2.0
5
2.4
5
3.0
3:
4
40
1
4
9.7
46
5
0.0
288
6
1.4
357
4
6.4
4
7.0
4
7.4
4
8.3
4
8.8
4
9.7
5
0.7
5
1.2
5
2.1
5
2.4
5
3.1
3:
5
41
1
4
9.8
11
6
0.0
288
9
1.4
391
4
6.5
4
7.1
4
7.4
4
8.3
4
8.8
4
9.8
5
0.8
5
1.3
5
2.2
5
2.5
5
3.2
3:
6
42
1
4
9.8
74
5
0.0
289
3
1.4
429
4
6.5
4
7.2
4
7.5
4
8.4
4
8.9
4
9.9
5
0.8
5
1.4
5
2.2
5
2.6
5
3.2
3:
7
43
1
4
9.9
35
4
0.0
289
6
1.4
461
4
6.6
4
7.2
4
7.6
4
8.4
4
9.0
4
9.9
5
0.9
5
1.4
5
2.3
5
2.7
5
3.3
3:
8
44
1
4
9.9
94
2
0.0
289
9
1.4
493
4
6.6
4
7.3
4
7.6
4
8.5
4
9.0
5
0.0
5
1.0
5
1.5
5
2.4
5
2.7
5
3.4
3:
9
45
1
5
0.0
51
2
0.0
290
3
1.4
530
4
6.7
4
7.3
4
7.7
4
8.5
4
9.1
5
0.1
5
1.0
5
1.6
5
2.4
5
2.8
5
3.4
3:1
0
46
1
5
0.1
06
4
0.0
290
6
1.4
561
4
6.7
4
7.4
4
7.7
4
8.6
4
9.1
5
0.1
5
1.1
5
1.6
5
2.5
5
2.8
5
3.5
3:1
1
47
1
5
0.1
59
8
0.0
290
9
1.4
592
4
6.8
4
7.4
4
7.8
4
8.6
4
9.2
5
0.2
5
1.1
5
1.7
5
2.6
5
2.9
5
3.6
4:
0
48
1
5
0.2
11
5
0.0
291
2
1.4
622
4
6.8
4
7.5
4
7.8
4
8.7
4
9.2
5
0.2
5
1.2
5
1.7
5
2.6
5
3.0
5
3.6
26 Head circumference-for-age, boys

Ta
ble
9
Hea
d c
ircu
mfe
ren
ce-
for-
ag
e fo
r b
oy
s, a
ge
in y
ears
an
d m
on
ths
(co
nti
nu
ed)
Percen
tile
s (h
ea
d c
ircu
mfe
ren
ce i
n c
m)
Yea
r: M
on
th
Mon
th
L
M
S
SD
1
st
3rd
5
th
15th
2
5th
5
0th
7
5th
8
5th
9
5th
9
7th
9
9th
4:
1
49
1
5
0.2
61
7
0.0
291
5
1.4
651
4
6.9
4
7.5
4
7.9
4
8.7
4
9.3
5
0.3
5
1.2
5
1.8
5
2.7
5
3.0
5
3.7
4:
2
50
1
5
0.3
10
5
0.0
291
8
1.4
681
4
6.9
4
7.5
4
7.9
4
8.8
4
9.3
5
0.3
5
1.3
5
1.8
5
2.7
5
3.1
5
3.7
4:
3
51
1
5
0.3
57
8
0.0
292
1
1.4
710
4
6.9
4
7.6
4
7.9
4
8.8
4
9.4
5
0.4
5
1.3
5
1.9
5
2.8
5
3.1
5
3.8
4:
4
52
1
5
0.4
03
9
0.0
292
4
1.4
738
4
7.0
4
7.6
4
8.0
4
8.9
4
9.4
5
0.4
5
1.4
5
1.9
5
2.8
5
3.2
5
3.8
4:
5
53
1
5
0.4
48
8
0.0
292
7
1.4
766
4
7.0
4
7.7
4
8.0
4
8.9
4
9.5
5
0.4
5
1.4
5
2.0
5
2.9
5
3.2
5
3.9
4:
6
54
1
5
0.4
92
6
0.0
292
9
1.4
789
4
7.1
4
7.7
4
8.1
4
9.0
4
9.5
5
0.5
5
1.5
5
2.0
5
2.9
5
3.3
5
3.9
4:
7
55
1
5
0.5
35
4
0.0
293
2
1.4
817
4
7.1
4
7.7
4
8.1
4
9.0
4
9.5
5
0.5
5
1.5
5
2.1
5
3.0
5
3.3
5
4.0
4:
8
56
1
5
0.5
77
2
0.0
293
5
1.4
844
4
7.1
4
7.8
4
8.1
4
9.0
4
9.6
5
0.6
5
1.6
5
2.1
5
3.0
5
3.4
5
4.0
4:
9
57
1
5
0.6
18
3
0.0
293
8
1.4
872
4
7.2
4
7.8
4
8.2
4
9.1
4
9.6
5
0.6
5
1.6
5
2.2
5
3.1
5
3.4
5
4.1
4:1
0
58
1
5
0.6
58
7
0.0
294
0
1.4
894
4
7.2
4
7.9
4
8.2
4
9.1
4
9.7
5
0.7
5
1.7
5
2.2
5
3.1
5
3.5
5
4.1
4:1
1
59
1
5
0.6
98
4
0.0
294
3
1.4
921
4
7.2
4
7.9
4
8.2
4
9.2
4
9.7
5
0.7
5
1.7
5
2.2
5
3.2
5
3.5
5
4.2
5:
0
60
1
5
0.7
37
5
0.0
294
6
1.4
947
4
7.3
4
7.9
4
8.3
4
9.2
4
9.7
5
0.7
5
1.7
5
2.3
5
3.2
5
3.5
5
4.2
Head circumference-for-age, boys 27

Ta
ble
9
Hea
d c
ircu
mfe
ren
ce-
for-
ag
e fo
r b
oy
s, a
ge
in y
ears
an
d m
on
ths
(co
nti
nu
ed)
Z-s
co
res
(head
cir
cu
mfe
ren
ce i
n c
m)
Yea
r: M
on
th
Mon
th
L
M
S
SD
-3
SD
-2
SD
-1
SD
M
ed
ian
1
SD
2
SD
3
SD
0:
0
0
1
34.4
61
8
0.0
368
6
1.2
703
3
0.7
3
1.9
3
3.2
3
4.5
3
5.7
3
7.0
3
8.3
0:
1
1
1
37.2
75
9
0.0
313
3
1.1
679
3
3.8
3
4.9
3
6.1
3
7.3
3
8.4
3
9.6
4
0.8
0:
2
2
1
39.1
28
5
0.0
299
7
1.1
727
3
5.6
3
6.8
3
8.0
3
9.1
4
0.3
4
1.5
4
2.6
0:
3
3
1
40.5
13
5
0.0
291
8
1.1
822
3
7.0
3
8.1
3
9.3
4
0.5
4
1.7
4
2.9
4
4.1
0:
4
4
1
41.6
31
7
0.0
286
8
1.1
940
3
8.0
3
9.2
4
0.4
4
1.6
4
2.8
4
4.0
4
5.2
0:
5
5
1
42.5
57
6
0.0
283
7
1.2
074
3
8.9
4
0.1
4
1.4
4
2.6
4
3.8
4
5.0
4
6.2
0:
6
6
1
43.3
30
6
0.0
281
7
1.2
206
3
9.7
4
0.9
4
2.1
4
3.3
4
4.6
4
5.8
4
7.0
0:
7
7
1
43.9
80
3
0.0
280
4
1.2
332
4
0.3
4
1.5
4
2.7
4
4.0
4
5.2
4
6.4
4
7.7
0:
8
8
1
44.5
30
0
0.0
279
6
1.2
451
4
0.8
4
2.0
4
3.3
4
4.5
4
5.8
4
7.0
4
8.3
0:
9
9
1
44.9
99
8
0.0
279
2
1.2
564
4
1.2
4
2.5
4
3.7
4
5.0
4
6.3
4
7.5
4
8.8
0:1
0
10
1
4
5.4
05
1
0.0
279
0
1.2
668
4
1.6
4
2.9
4
4.1
4
5.4
4
6.7
4
7.9
4
9.2
0:1
1
11
1
4
5.7
57
3
0.0
278
9
1.2
762
4
1.9
4
3.2
4
4.5
4
5.8
4
7.0
4
8.3
4
9.6
1:
0
12
1
4
6.0
66
1
0.0
278
9
1.2
848
4
2.2
4
3.5
4
4.8
4
6.1
4
7.4
4
8.6
4
9.9
1:
1
13
1
4
6.3
39
5
0.0
278
9
1.2
924
4
2.5
4
3.8
4
5.0
4
6.3
4
7.6
4
8.9
5
0.2
1:
2
14
1
4
6.5
84
4
0.0
279
1
1.3
002
4
2.7
4
4.0
4
5.3
4
6.6
4
7.9
4
9.2
5
0.5
1:
3
15
1
4
6.8
06
0
0.0
279
2
1.3
068
4
2.9
4
4.2
4
5.5
4
6.8
4
8.1
4
9.4
5
0.7
1:
4
16
1
4
7.0
08
8
0.0
279
5
1.3
139
4
3.1
4
4.4
4
5.7
4
7.0
4
8.3
4
9.6
5
1.0
1:
5
17
1
4
7.1
96
2
0.0
279
7
1.3
201
4
3.2
4
4.6
4
5.9
4
7.2
4
8.5
4
9.8
5
1.2
1:
6
18
1
4
7.3
71
1
0.0
280
0
1.3
264
4
3.4
4
4.7
4
6.0
4
7.4
4
8.7
5
0.0
5
1.4
1:
7
19
1
4
7.5
35
7
0.0
280
3
1.3
324
4
3.5
4
4.9
4
6.2
4
7.5
4
8.9
5
0.2
5
1.5
1:
8
20
1
4
7.6
91
9
0.0
280
6
1.3
382
4
3.7
4
5.0
4
6.4
4
7.7
4
9.0
5
0.4
5
1.7
1:
9
21
1
4
7.8
40
8
0.0
281
0
1.3
443
4
3.8
4
5.2
4
6.5
4
7.8
4
9.2
5
0.5
5
1.9
1:1
0
22
1
4
7.9
83
3
0.0
281
3
1.3
498
4
3.9
4
5.3
4
6.6
4
8.0
4
9.3
5
0.7
5
2.0
1:1
1
23
1
4
8.1
20
1
0.0
281
7
1.3
555
4
4.1
4
5.4
4
6.8
4
8.1
4
9.5
5
0.8
5
2.2
2:
0
24
1
4
8.2
51
5
0.0
282
1
1.3
612
4
4.2
4
5.5
4
6.9
4
8.3
4
9.6
5
1.0
5
2.3
28 Head circumference-for-age, boys

Ta
ble
9
Hea
d c
ircu
mfe
ren
ce-
for-
ag
e fo
r b
oy
s, a
ge
in y
ears
an
d m
on
ths
(co
nti
nu
ed)
Z-s
co
res
(head
cir
cu
mfe
ren
ce i
n c
m)
Yea
r: M
on
th
Mon
th
L
M
S
SD
-3
SD
-2
SD
-1
SD
M
ed
ian
1
SD
2
SD
3
SD
2:
1
25
1
4
8.3
77
7
0.0
282
5
1.3
667
4
4.3
4
5.6
4
7.0
4
8.4
4
9.7
5
1.1
5
2.5
2:
2
26
1
4
8.4
98
9
0.0
283
0
1.3
725
4
4.4
4
5.8
4
7.1
4
8.5
4
9.9
5
1.2
5
2.6
2:
3
27
1
4
8.6
15
1
0.0
283
4
1.3
778
4
4.5
4
5.9
4
7.2
4
8.6
5
0.0
5
1.4
5
2.7
2:
4
28
1
4
8.7
26
4
0.0
283
8
1.3
829
4
4.6
4
6.0
4
7.3
4
8.7
5
0.1
5
1.5
5
2.9
2:
5
29
1
4
8.8
33
1
0.0
284
2
1.3
878
4
4.7
4
6.1
4
7.4
4
8.8
5
0.2
5
1.6
5
3.0
2:
6
30
1
4
8.9
35
1
0.0
284
7
1.3
932
4
4.8
4
6.1
4
7.5
4
8.9
5
0.3
5
1.7
5
3.1
2:
7
31
1
4
9.0
32
7
0.0
285
1
1.3
979
4
4.8
4
6.2
4
7.6
4
9.0
5
0.4
5
1.8
5
3.2
2:
8
32
1
4
9.1
26
0
0.0
285
5
1.4
026
4
4.9
4
6.3
4
7.7
4
9.1
5
0.5
5
1.9
5
3.3
2:
9
33
1
4
9.2
15
3
0.0
285
9
1.4
071
4
5.0
4
6.4
4
7.8
4
9.2
5
0.6
5
2.0
5
3.4
2:1
0
34
1
4
9.3
00
7
0.0
286
3
1.4
115
4
5.1
4
6.5
4
7.9
4
9.3
5
0.7
5
2.1
5
3.5
2:1
1
35
1
4
9.3
82
6
0.0
286
7
1.4
158
4
5.1
4
6.6
4
8.0
4
9.4
5
0.8
5
2.2
5
3.6
3:
0
36
1
4
9.4
61
2
0.0
287
1
1.4
200
4
5.2
4
6.6
4
8.0
4
9.5
5
0.9
5
2.3
5
3.7
3:
1
37
1
4
9.5
36
7
0.0
287
5
1.4
242
4
5.3
4
6.7
4
8.1
4
9.5
5
1.0
5
2.4
5
3.8
3:
2
38
1
4
9.6
09
3
0.0
287
8
1.4
278
4
5.3
4
6.8
4
8.2
4
9.6
5
1.0
5
2.5
5
3.9
3:
3
39
1
4
9.6
79
1
0.0
288
2
1.4
318
4
5.4
4
6.8
4
8.2
4
9.7
5
1.1
5
2.5
5
4.0
3:
4
40
1
4
9.7
46
5
0.0
288
6
1.4
357
4
5.4
4
6.9
4
8.3
4
9.7
5
1.2
5
2.6
5
4.1
3:
5
41
1
4
9.8
11
6
0.0
288
9
1.4
391
4
5.5
4
6.9
4
8.4
4
9.8
5
1.3
5
2.7
5
4.1
3:
6
42
1
4
9.8
74
5
0.0
289
3
1.4
429
4
5.5
4
7.0
4
8.4
4
9.9
5
1.3
5
2.8
5
4.2
3:
7
43
1
4
9.9
35
4
0.0
289
6
1.4
461
4
5.6
4
7.0
4
8.5
4
9.9
5
1.4
5
2.8
5
4.3
3:
8
44
1
4
9.9
94
2
0.0
289
9
1.4
493
4
5.6
4
7.1
4
8.5
5
0.0
5
1.4
5
2.9
5
4.3
3:
9
45
1
5
0.0
51
2
0.0
290
3
1.4
530
4
5.7
4
7.1
4
8.6
5
0.1
5
1.5
5
3.0
5
4.4
3:1
0
46
1
5
0.1
06
4
0.0
290
6
1.4
561
4
5.7
4
7.2
4
8.7
5
0.1
5
1.6
5
3.0
5
4.5
3:1
1
47
1
5
0.1
59
8
0.0
290
9
1.4
592
4
5.8
4
7.2
4
8.7
5
0.2
5
1.6
5
3.1
5
4.5
4:
0
48
1
5
0.2
11
5
0.0
291
2
1.4
622
4
5.8
4
7.3
4
8.7
5
0.2
5
1.7
5
3.1
5
4.6
Head circumference-for-age, boys 29

Ta
ble
9
Hea
d c
ircu
mfe
ren
ce-
for-
ag
e fo
r b
oy
s, a
ge
in y
ears
an
d m
on
ths
(co
nti
nu
ed)
Z-s
co
res
(head
cir
cu
mfe
ren
ce i
n c
m)
Yea
r: M
on
th
Mon
th
L
M
S
SD
-3
SD
-2
SD
-1
SD
M
ed
ian
1
SD
2
SD
3
SD
4:
1
49
1
5
0.2
61
7
0.0
291
5
1.4
651
4
5.9
4
7.3
4
8.8
5
0.3
5
1.7
5
3.2
5
4.7
4:
2
50
1
5
0.3
10
5
0.0
291
8
1.4
681
4
5.9
4
7.4
4
8.8
5
0.3
5
1.8
5
3.2
5
4.7
4:
3
51
1
5
0.3
57
8
0.0
292
1
1.4
710
4
5.9
4
7.4
4
8.9
5
0.4
5
1.8
5
3.3
5
4.8
4:
4
52
1
5
0.4
03
9
0.0
292
4
1.4
738
4
6.0
4
7.5
4
8.9
5
0.4
5
1.9
5
3.4
5
4.8
4:
5
53
1
5
0.4
48
8
0.0
292
7
1.4
766
4
6.0
4
7.5
4
9.0
5
0.4
5
1.9
5
3.4
5
4.9
4:
6
54
1
5
0.4
92
6
0.0
292
9
1.4
789
4
6.1
4
7.5
4
9.0
5
0.5
5
2.0
5
3.5
5
4.9
4:
7
55
1
5
0.5
35
4
0.0
293
2
1.4
817
4
6.1
4
7.6
4
9.1
5
0.5
5
2.0
5
3.5
5
5.0
4:
8
56
1
5
0.5
77
2
0.0
293
5
1.4
844
4
6.1
4
7.6
4
9.1
5
0.6
5
2.1
5
3.5
5
5.0
4:
9
57
1
5
0.6
18
3
0.0
293
8
1.4
872
4
6.2
4
7.6
4
9.1
5
0.6
5
2.1
5
3.6
5
5.1
4:1
0
58
1
5
0.6
58
7
0.0
294
0
1.4
894
4
6.2
4
7.7
4
9.2
5
0.7
5
2.1
5
3.6
5
5.1
4:1
1
59
1
5
0.6
98
4
0.0
294
3
1.4
921
4
6.2
4
7.7
4
9.2
5
0.7
5
2.2
5
3.7
5
5.2
5:
0
60
1
5
0.7
37
5
0.0
294
6
1.4
947
4
6.3
4
7.7
4
9.2
5
0.7
5
2.2
5
3.7
5
5.2
30 Head circumference-for-age, boys

Head circumference-for-age, girls 31
3.3 Head circumference-for-age for girls
The choice of the model to construct the head circumference-for-age standard for girls followed the
steps described for the corresponding standard for boys. In principle, unless a clear inadequacy is
detected, models used for constructing the standards for both sexes should belong to the same class.
3.3.1 Sample size
There were 13 798 head circumference observations for girls. The longitudinal and cross-sectional
sample sizes by visit and age are presented in Tables 10 and 11.
Table 10 Longitudinal sample sizes for head circumference-for-age for girls
Visit Birth 1 2 3 4 5 6
Age 0 2 wk 4 wk 6 wk 2 mo 3 mo 4 mo
N 841 449 449 447 447 448 447
Visit 7 8 9 10 11 12 13
Age 5 mo 6 mo 7 mo 8 mo 9 mo 10 mo 11 mo
N 450 448 448 445 449 446 446
Visit 14 15 16 17 18 19 20
Age 12 mo 14 mo 16 mo 18 mo 20 mo 22 mo 24 mo
N 452 452 445 449 445 439 449
Table 11 Cross-sectional sample sizes for head circumference-for-age for girls
Age (mo) <18 18–20 21–23 24–26 27–29 30–32 33–35
N 2 164 177 249 220 237 230
Age (mo) 36–38 39–41 42–44 45–47 48–50 51–53 54–56
N 226 242 254 218 232 208 239
Age (mo) 57–59 60–62 63–65 66–68 69–71 >71
N 241 223 205 230 210 0
3.3.2 Model selection and results
Using the model BCPE(x=ageλ, df(µ)=9, df(σ)=4, ν=1, τ=2) as the starting point, the best age-
transformation power (λ) was sought. As for boys, the same value λ=0.20 corresponded to the smallest
value of global deviance and was selected as the age-transformation power (Table 12). A search
followed for the best combination of degrees of freedom for the cubic splines to fit the BCPE
distribution parameter curves.
32 Head circumference-for-age, girls
Table 12 Global deviance (GD) for models within the class BCPE(x=ageλ, df(µ)=9, df(σ)=4, ν=1,
τ=2) for head circumference-for-age for girls
λ 0.05 0.10 0.15 0.20 0.25 0.30 0.35 0.40 0.45 0.50
GDa
989.1 988.7 988.3 988.1 988.9 991.7 997.4 1006.3 1017.3 1027.3
λ 0.55 0.60 0.65 0.70 0.75 0.80 0.85 0.90 0.95 1.00
GDa
1033.0 1031.8 1024.8 1018.4 1024.3 1058.8 1140.1 NA NA NA
a In excess of 46 000; NA: not available (method did not converge with this power).
The search for the best combination of degrees of freedom for the cubic splines to fit the µ and σ
parameter curves started from the simplest class of models using the BCPE distribution and fixing ν=1,
τ=2, and λ=0.20. Table 13 shows various combinations that were considered. The best combination of
AIC and GAIC(3) supported the model with df(µ)=9 and df(σ)=2. The properties of this model were
evaluated using the same set of diagnostic tools as those used for boys' head circumference-for-age.
Table 13 Goodness-of-fit summary for models using the BCPE distribution with fixed ν=1 and
τ=2 for head circumference-for-age for girls
df(µ) df(σ) GDa
AICa
GAIC(3)a
Total df
1 1077.7 1093.7 1101.7 8
2 1002.9 1020.9 1029.9 9
3 1000.9 1020.9 1030.9 10
4 1000.2 1022.2 1033.2 11
7
5 998.9 1022.9 1034.9 12
1 1069.9 1087.9 1096.9 9
2 994.8 1014.8 1024.8 10
3 992.9 1014.9 1025.9 11
4 992.1 1016.1 1028.1 12
8
5 990.8 1016.8 1029.8 13
1 1066.0 1086.0 1096.0 10
2 990.9 1012.9 1023.9 11
3 988.9 1012.9 1024.9 12
4 988.1 1014.1 1027.1 13
9
5 986.8 1014.8 1028.8 14
1 1063.8 1085.8 1096.8 11
2 988.7 1012.7 1024.7 12
3 986.6 1012.6 1025.6 13
4 985.9 1013.9 1027.9 14
10
5 984.6 1014.6 1029.6 15
1 1062.4 1086.4 1098.4 12
2 987.2 1013.2 1026.2 13
3 985.2 1013.2 1027.2 14
4 984.4 1014.4 1029.4 15
11
5 983.1 1015.1 1031.1 16
GD, Global Deviance; AIC, Akaike Information Criterion;
GAIC(3), Generalized AIC with penalty equal to 3; a In excess of 46 000.

Head circumference-for-age, girls 33
Model 1: BCPE(x=age0.20
, df(µ)=9, df(σ)=2, ν=1, τ=2)
The two fitted parameter curves, i.e. the median and coefficient of variation appeared to be adequately
smoothed, considering the substantial variation observed in the empirical coefficient of variation
pattern in the cross-sectional sample (Figure 11). With respect to the differences between empirical
values and fitted centiles (Figures 12 and 13), there was some evidence of bias for a few of the
considered percentiles. There seemed to be underestimation around the 3rd centile and overestimation
around the 10th centile between birth and 24 months. The average bias was approximately 1 mm.
Fitted centile residuals for the age interval 24 to 71 months showed a mild systematic underestimation,
only for the 25th centile curve, of less than 2 mm on average (Figure 13). These biases were very small
when compared to the SD values that varied from 1.2 cm to 1.4 cm in the entire age range. Examining
Table 14, the proportions of children in the sample that were below the 1st and 3
rd fitted centiles
confirmed some underestimation in the lower tail. For the other centiles, the distribution of the
proportions below each of the fitted centiles did not indicate any systematic bias.
Age (months)
Head C
ircum
fere
nce M
edia
n (
cm
)
35
40
45
50
0 4 8 14 20 27 33 39 45 51 57 63 69
Age (months)
Head C
ircum
fere
nce C
oeff
of
Variation
0.0
28
0.0
30
0.0
32
0.0
34
0.0
36
0 4 8 14 20 27 33 39 45 51 57 63 69
Figure 11 Fitting of the µ and σ curves of Model 1 for head circumference-for-age for girls
(dotted line) and their respective sample estimates (points with solid line)
Figure 14 showed the worm plots for Model 1. For only two age groups, the shapes of the
worms departed from the flat shape. The group 28 mo presented a slope, indicating misfit of
the variance, and the worm corresponding to group 52 mo was slightly S-shaped, suggesting
remaining kurtosis. Group 70 mo presented a worm that was U-shaped which would indicate
skewness, yet the worm lay within the 95% confidence interval.

34 Head circumference-for-age, girls
3rd Centile-0.2
0.0
0.1
0.2
0 2 4 6 8 12 16 20 24
5th Centile
-0.2
0.0
0.1
0.2
0 2 4 6 8 12 16 20 24
10th Centile
-0.2
0.0
0.1
0.2
0 2 4 6 8 12 16 20 24
25th Centile
-0.2
0.0
0.1
0.2
0 2 4 6 8 12 16 20 24
50th Centile
-0.2
0.0
0.1
0.2
0 2 4 6 8 12 16 20 24
75th Centile
-0.2
0.0
0.1
0.2
0 2 4 6 8 12 16 20 24
90th Centile
-0.2
0.0
0.1
0.2
0 2 4 6 8 12 16 20 24
95th Centile
-0.2
0.0
0.1
0.2
0 2 4 6 8 12 16 20 24
97th Centile
-0.2
0.0
0.1
0.2
0 2 4 6 8 12 16 20 24
Age (months)
Em
piric
al-F
itte
d C
en
tile
fo
r H
ea
d C
ircu
mfe
ren
ce
(cm
)
Figure 12 Centile residuals from fitting Model 1 for head circumference-for-age
from 0 to 24 months for girls
3rd Centile
-0.2
0.0
0.2
25 31 37 43 49 55 61 67
5th Centile
-0.2
0.0
0.2
25 31 37 43 49 55 61 67
10th Centile
-0.2
0.0
0.2
25 31 37 43 49 55 61 67
25th Centile
-0.2
0.0
0.2
25 31 37 43 49 55 61 67
50th Centile
-0.2
0.0
0.2
25 31 37 43 49 55 61 67
75th Centile
-0.2
0.0
0.2
25 31 37 43 49 55 61 67
90th Centile
-0.2
0.0
0.2
25 31 37 43 49 55 61 67
95th Centile
-0.2
0.0
0.2
25 31 37 43 49 55 61 67
97th Centile
-0.2
0.0
0.2
25 31 37 43 49 55 61 67
Age (months)
Em
piric
al-F
itte
d C
en
tile
fo
r H
ea
d C
ircu
mfe
ren
ce
(cm
)
Figure 13 Centile residuals from fitting Model 1 for head circumference-for-age
from 24 to 71 months for girls

Ta
ble
14
Ob
serv
ed p
ro
po
rtio
ns
of
chil
dre
n w
ith
mea
surem
ents
bel
ow
th
e fi
tted
cen
tile
s fr
om
Mo
del
1, h
ead
cir
cum
feren
ce-f
or-
ag
e fo
r g
irls
Ex
pec
ted
B
irth
1
4 d
2
8 d
4
2 d
2
mo
3
mo
4
mo
5
mo
6
mo
7
mo
1
0.7
1
.6
0.2
0
.7
0.2
0
.4
0.7
0
.2
0.0
0
.0
3
2.5
3
.4
2.7
1
.8
1.8
1
.6
2.2
2
.3
2.7
2
.3
5
4.0
5
.1
4.4
4
.3
4.5
4
.3
4.9
4
.7
5.2
5
.3
10
1
0.5
1
1.9
1
0.4
9
.9
9.9
1
1.4
1
1.0
1
1.0
1
1.9
1
0.6
25
2
6.2
2
5.7
2
3.7
2
2.7
2
5.4
2
5.1
2
5.5
2
5.5
2
6.1
2
5.9
50
4
9.0
5
1.7
4
9.7
5
0.5
5
2.8
5
1.1
5
0.6
4
8.2
4
8.9
4
9.3
75
7
5.0
7
6.5
7
4.9
7
4.8
7
6.0
7
6.2
7
5.4
7
6.6
7
5.7
7
4.1
90
8
9.3
8
9.7
8
8.9
8
9.2
9
0.6
9
0.6
9
1.1
8
9.4
8
9.6
8
9.4
95
9
4.6
9
6.0
9
4.9
9
4.1
9
5.5
9
5.5
9
5.3
9
5.5
9
5.5
9
4.5
97
9
6.0
9
6.4
9
7.6
9
6.6
9
6.9
9
7.5
9
7.8
9
7.3
9
7.5
9
7.0
99
9
8.6
9
8.7
9
8.7
9
8.9
9
9.1
9
9.1
9
9.1
9
9.3
9
9.1
9
9.1
Ex
pec
ted
8
mo
9
mo
1
0 m
o
11
mo
1
2 m
o
14
mo
1
6 m
o
18
mo
2
0 m
o
22
mo
1
0.2
0
.5
0.2
0
.2
0.4
0
.2
0.2
0
.4
0.5
0
.4
3
2.5
2
.5
2.0
1
.7
2.2
1
.6
3.1
3
.4
2.9
2
.7
5
4.5
5
.4
5.8
6
.4
6.2
6
.0
5.8
5
.5
4.9
5
.7
10
1
0.5
1
0.2
1
1.0
9
.3
9.9
1
1.8
1
1.6
1
1.7
1
1.3
1
3.1
25
2
5.9
2
4.4
2
6.0
2
5.5
2
5.8
2
5.6
2
6.4
2
6.1
2
7.0
2
9.0
50
5
0.7
4
9.8
5
0.7
4
9.8
5
0.0
4
8.8
4
9.4
4
9.6
5
0.5
5
0.9
75
7
4.1
7
4.4
7
4.2
7
3.7
7
4.9
7
4.2
7
3.4
7
5.6
7
6.3
7
7.0
90
9
0.2
8
9.4
8
9.0
9
0.0
8
9.0
8
9.3
8
8.8
9
0.0
9
0.0
9
0.3
95
9
5.0
9
4.6
9
3.7
9
5.2
9
4.5
9
4.2
9
4.2
9
4.5
9
5.6
9
6.0
97
9
6.1
9
6.4
9
6.9
9
7.1
9
7.1
9
6.2
9
6.0
9
6.4
9
6.2
9
6.9
99
9
8.4
9
8.9
9
8.9
9
9.2
9
8.9
9
9.3
9
8.4
9
9.2
9
9.1
9
8.9
Head circumference-for-age, girls 35

Ta
ble
14
Ob
serv
ed p
ro
po
rtio
ns
of
chil
dre
n w
ith
mea
surem
ents
bel
ow
th
e fi
tted
cen
tile
s fr
om
Mo
del
1, h
ead
cir
cum
feren
ce-f
or-
ag
e fo
r g
irls
(co
nt)
Ex
pec
ted
2
4 m
o
28
mo
3
4 m
o
40
mo
4
6 m
o
52
mo
5
8 m
o
64
mo
7
0 m
o
Ov
era
ll
1
0.3
0
.0
0.4
0
.6
1.5
1
.1
1.0
1
.2
1.3
0
.5
3
3.3
1
.1
2.3
2
.2
3.0
4
.1
3.0
2
.8
3.9
2
.5
5
5.5
3
.0
3.3
4
.3
5.5
5
.6
5.2
4
.7
6.8
5
.0
10
1
1.8
8
.4
8.5
9
.0
10
.8
10
.5
9.9
1
0.1
1
4.0
1
0.7
25
2
5.6
2
3.4
2
4.3
2
4.1
2
5.6
2
4.1
2
2.1
2
2.6
2
6.4
2
5.3
50
5
0.7
4
6.4
4
8.7
5
0.5
5
1.3
5
1.3
5
0.5
4
9.5
4
9.2
5
0.0
75
7
6.2
7
4.7
7
4.8
7
5.9
7
5.0
7
7.4
7
7.3
7
4.8
7
4.3
7
5.3
90
8
9.9
8
9.9
8
8.7
9
0.6
9
0.5
8
9.1
9
0.3
8
9.9
8
9.9
8
9.7
95
9
6.2
9
5.8
9
5.5
9
3.9
9
4.3
9
3.2
9
5.4
9
4.8
9
5.4
9
5.0
97
9
7.8
9
7.9
9
7.1
9
6.7
9
6.6
9
5.1
9
6.6
9
7.6
9
7.7
9
6.8
99
9
9.3
9
9.4
9
8.8
9
9.0
9
8.7
9
8.3
9
8.8
9
8.8
9
9.7
9
8.9
No
te:
Gro
up l
abel
s co
rres
pond
to t
he
age
inte
rval
s in
Tab
le 1
5.
36 Head circumference-for-age, girls

Head circumference-for-age, girls 37
Birth 14 d 28 d 42 d 2 mo 3 mo
4 mo 5 mo 6 mo 7 mo 8 mo 9 mo
10 mo 11 mo 12 mo 14 mo 16 mo 18 mo
20 mo 22 mo 24 mo 28 mo 34 mo 40 mo
46 mo 52 mo 58 mo 64 mo 70 mo
Birth 14 d 28 d 42 d 2 mo 3 mo
4 mo 5 mo 6 mo 7 mo 8 mo 9 mo
10 mo 11 mo 12 mo 14 mo 16 mo 18 mo
20 mo 22 mo 24 mo 28 mo 34 mo 40 mo
46 mo 52 mo 58 mo 64 mo 70 mo
Birth 14 d 28 d 42 d 2 mo 3 mo
4 mo 5 mo 6 mo 7 mo 8 mo 9 mo
10 mo 11 mo 12 mo 14 mo 16 mo 18 mo
20 mo 22 mo 24 mo 28 mo 34 mo 40 mo
46 mo 52 mo 58 mo 64 mo 70 mo
Figure 14 Worm plots of z-scores for Model 1 for head circumference-for-age for girls
Results of the Q-test presented in Table 15 showed that only the misfit of the variance (group 28 mo)
was significant, i.e. the corresponding z2 absolute value was above 2. For the same age group, the Q-
test suggested remaining kurtosis (z4 absolute value greater than 2), likely a consequence of the misfit
of the variance. However, Q-test results for the z-scores derived from the selected model when applied
across all age groups bore evidence of the model's overall adequacy (p-values corresponding to overall
statistics are all greater than 0.30). More complex modelling (e.g. fitting parameter ν) was therefore
not pursued.
A new iteration was done to re-search for the best λ with df(µ)=9 and df(σ)=2. This exercise did not
result in any notable changes to the previous findings. The model BCPE(x= age0.20
, df(µ)=9, df(σ)=2,
ν=1, τ=2) was thus chosen to construct the head circumference-for-age growth curves for girls. Figures
15 to 18 show the empirical and fitted centiles derived from the selected model for the head
circumference-for-age (0 to 60 months) growth standard.

38 Head circumference-for-age, girls
Table 15 Q-test for z-scores from Model 1 [BCPE(x=age0.20
, df(µ)=9, df(σ)=2, ν=1, τ=2)] for
head circumference-for-age for girls
Age (days) Group N z1 z2 z3 z4
0 Birth 841 0.1 0.9 1.4 0.5
1 to 16 14 d 447 -0.7 1.0 0.3 1.4
17 to 34 28 d 451 0.3 -0.4 1.3 0.4
35 to 49 42 d 444 0.3 -0.5 1.6 0.5
50 to 69 2 mo 445 -0.4 -0.7 1.9 -0.4
70 to 99 3 mo 446 -0.5 -1.0 0.6 -1.3
100 to 129 4 mo 447 -0.4 -0.3 0.9 -0.5
130 to 159 5 mo 444 0.1 -0.7 0.7 -0.6
160 to 189 6 mo 444 0.1 -0.2 0.6 -1.0
190 to 219 7 mo 436 0.4 -0.1 1.0 -1.0
220 to 249 8 mo 440 0.3 0.0 0.6 -0.9
250 to 279 9 mo 442 0.5 0.1 0.6 -0.6
280 to 309 10 mo 446 -0.1 0.2 1.7 -0.4
310 to 349 11 mo 482 0.4 -0.5 0.7 -0.7
350 to 379 12 mo 454 0.1 0.2 1.2 -0.4
380 to 439 14 mo 449 0.3 0.1 1.0 -0.8
440 to 499 16 mo 447 0.3 1.1 1.5 -0.6
500 to 559 18 mo 472 0.0 0.7 1.3 -0.1
560 to 619 20 mo 549 -0.4 0.5 0.9 -0.3
620 to 679 22 mo 548 -1.3 0.4 1.3 -1.1
680 to 749 24 mo 602 -0.7 -0.2 0.4 -0.9
750 to 929 28 mo 474 1.2 -2.2 0.5 -2.3
930 to 1119 34 mo 485 0.8 -0.9 0.9 -1.1
1120 to 1309 40 mo 489 0.1 -0.4 0.8 0.4
1310 to 1499 46 mo 472 -0.4 1.0 0.2 1.6
1500 to 1689 52 mo 468 0.0 1.5 1.6 2.0
1690 to 1879 58 mo 503 0.1 -0.4 -0.3 1.1
1880 to 2069 64 mo 424 0.2 -0.2 -0.5 -0.1
2070 to 2191 70 mo 307 -0.9 1.0 -1.2 -0.6
Overall Q stats 13 798 7.5 16.8 32.3 27.3
degrees of freedom 20.0 27.5 29.0 29.0
p-value 0.9947 0.9440 0.3074 0.5551
Note: Absolute values of z1, z2, z3 or z4 larger than 2 indicate misfit of, respectively, mean, variance,
skewness or kurtosis.

Ag
e (
mo
nth
s)
Head Circumference (cm)
35404550
02
46
81
01
21
41
61
82
02
22
4
3rd
10th
50th
90th
97th
Fig
ure
15
3rd
, 1
0th
, 5
0th
, 9
0th
, 9
7th
sm
oo
thed
cen
tile
cu
rves
an
d e
mp
iric
al
va
lues
: h
ead
cir
cum
fere
nce
-fo
r-a
ge
for
gir
ls f
rom
bir
th t
o 2
4 m
on
ths
Head circumference-for-age, girls 39

Ag
e (
mo
nth
s)
Head Circumference (cm)
35404550
02
46
81
01
21
41
61
82
02
22
4
5th
25th
50th
75th
95th
Fig
ure
16
5th
, 2
5th
, 5
0th
, 7
5th
, 9
5th
sm
oo
thed
cen
tile
cu
rves
an
d e
mp
iric
al
va
lues
: h
ead
cir
cum
fere
nce
-fo
r-a
ge
for
gir
ls f
rom
bir
th t
o 2
4 m
on
ths
40 Head circumference-for-age, girls
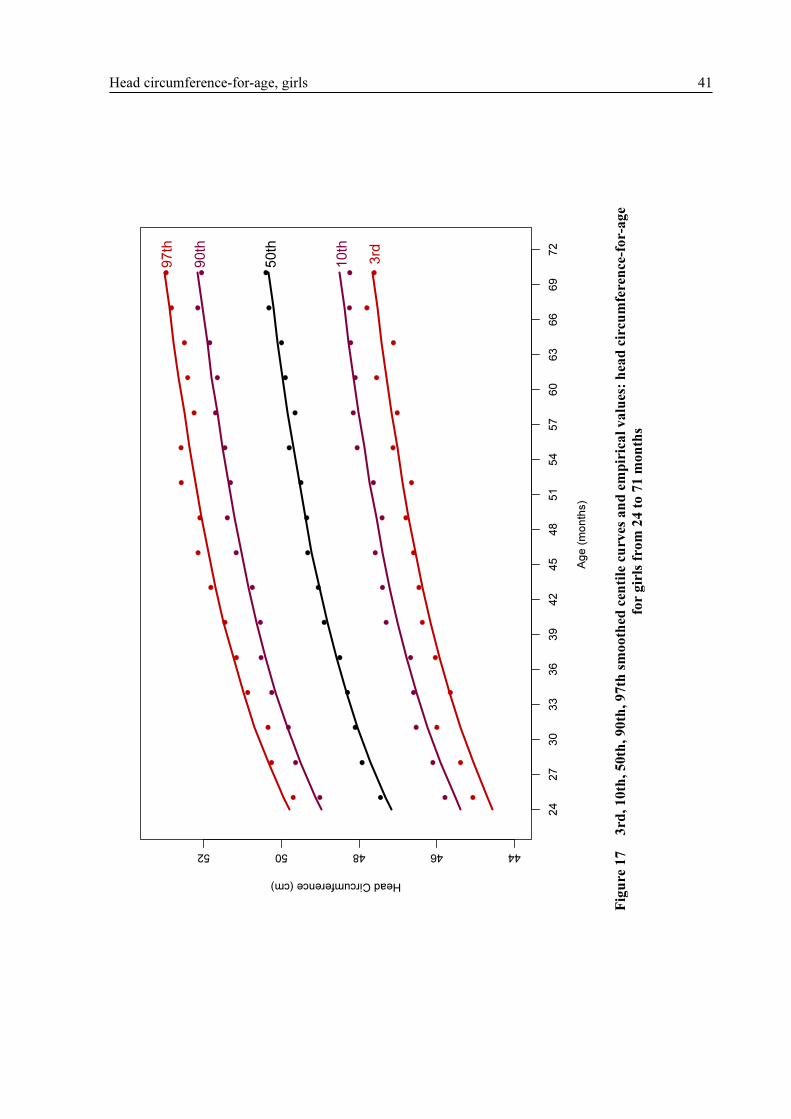
Ag
e (
mo
nth
s)
Head Circumference (cm)
4446485052
24
27
30
33
36
39
42
45
48
51
54
57
60
63
66
69
72
3rd
10th
50th
90th
97th
Fig
ure
17
3rd
, 1
0th
, 5
0th
, 9
0th
, 9
7th
sm
oo
thed
cen
tile
cu
rves
an
d e
mp
iric
al
va
lues
: h
ead
cir
cum
fere
nce
-fo
r-a
ge
for
gir
ls f
rom
24
to
71 m
on
ths
Head circumference-for-age, girls 41
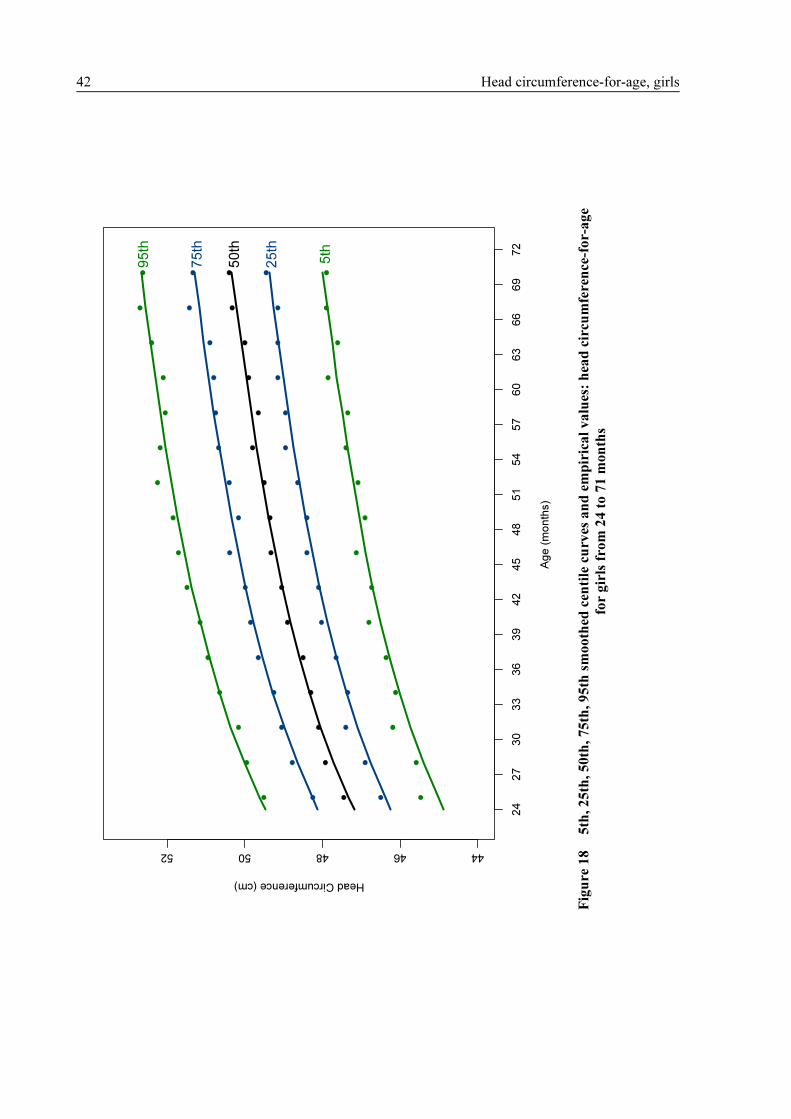
Ag
e (
mo
nth
s)
Head Circumference (cm)
4446485052
24
27
30
33
36
39
42
45
48
51
54
57
60
63
66
69
72
5th
25th
50th
75th
95th
Fig
ure
18
5th
, 2
5th
, 5
0th
, 7
5th
, 9
5th
sm
oo
thed
cen
tile
cu
rves
an
d e
mp
iric
al
va
lues
: h
ead
cir
cum
fere
nce
-fo
r-a
ge
for
gir
ls f
rom
24
to
71 m
on
ths
42 Head circumference-for-age, girls

Head circumference-for-age, girls 43
3.3.3 WHO standards
This section presents the final WHO head circumference-for-age z-score and percentile charts (Figures
19 and 20) and tables (Tables 16 and 17) for girls.

Ch
arts
Ag
e (
mo
nth
s)
Head Circumference (cm)
303540455055
02
46
81
21
62
02
42
83
23
64
04
44
85
25
66
0
123 0 -1 -2 -3
Fig
ure
19
WH
O h
ead
cir
cum
fere
nce-
for-
ag
e z-
sco
res
for
gir
ls f
rom
bir
th t
o 6
0 m
on
ths
44 Head circumference-for-age, girls

Ag
e (
mo
nth
s)
Head Circumference (cm)
35404550
02
46
81
21
62
02
42
83
23
64
04
44
85
25
66
03rd
50
th
97
th
15
th
85
th
Fig
ure
20
WH
O h
ead
cir
cum
fere
nce-
for-
ag
e p
erce
nti
les
for
gir
ls f
rom
bir
th t
o 6
0 m
on
ths
Head circumference-for-age, girls 45

Ta
ble
s
Ta
ble
16
Hea
d c
ircu
mfe
ren
ce-
for-
ag
e fo
r g
irls
, a
ge
in w
eek
s
P
ercen
tile
s (h
ea
d c
ircu
mfe
ren
ce i
n c
m)
Week
L
M
S
S
D
1st
3
rd
5
th
15th
2
5th
5
0th
7
5th
8
5th
9
5th
9
7th
9
9th
0
1
33.8
78
7
0.0
349
6
1.1
844
3
1.1
3
1.7
3
1.9
3
2.7
3
3.1
3
3.9
3
4.7
3
5.1
3
5.8
3
6.1
3
6.6
1
1
34.5
52
9
0.0
337
4
1.1
658
3
1.8
3
2.4
3
2.6
3
3.3
3
3.8
3
4.6
3
5.3
3
5.8
3
6.5
3
6.7
3
7.3
2
1
35.2
27
2
0.0
325
1
1.1
452
3
2.6
3
3.1
3
3.3
3
4.0
3
4.5
3
5.2
3
6.0
3
6.4
3
7.1
3
7.4
3
7.9
3
1
35.8
43
0
0.0
323
1
1.1
581
3
3.1
3
3.7
3
3.9
3
4.6
3
5.1
3
5.8
3
6.6
3
7.0
3
7.7
3
8.0
3
8.5
4
1
36.3
76
1
0.0
321
5
1.1
695
3
3.7
3
4.2
3
4.5
3
5.2
3
5.6
3
6.4
3
7.2
3
7.6
3
8.3
3
8.6
3
9.1
5
1
36.8
47
2
0.0
320
2
1.1
799
3
4.1
3
4.6
3
4.9
3
5.6
3
6.1
3
6.8
3
7.6
3
8.1
3
8.8
3
9.1
3
9.6
6
1
37.2
71
1
0.0
319
1
1.1
893
3
4.5
3
5.0
3
5.3
3
6.0
3
6.5
3
7.3
3
8.1
3
8.5
3
9.2
3
9.5
4
0.0
7
1
37.6
58
4
0.0
318
2
1.1
983
3
4.9
3
5.4
3
5.7
3
6.4
3
6.9
3
7.7
3
8.5
3
8.9
3
9.6
3
9.9
4
0.4
8
1
38.0
16
7
0.0
317
3
1.2
063
3
5.2
3
5.7
3
6.0
3
6.8
3
7.2
3
8.0
3
8.8
3
9.3
4
0.0
4
0.3
4
0.8
9
1
38.3
51
6
0.0
316
6
1.2
142
3
5.5
3
6.1
3
6.4
3
7.1
3
7.5
3
8.4
3
9.2
3
9.6
4
0.3
4
0.6
4
1.2
10
1
3
8.6
67
3
0.0
315
8
1.2
211
3
5.8
3
6.4
3
6.7
3
7.4
3
7.8
3
8.7
3
9.5
3
9.9
4
0.7
4
1.0
4
1.5
11
1
3
8.9
66
1
0.0
315
2
1.2
282
3
6.1
3
6.7
3
6.9
3
7.7
3
8.1
3
9.0
3
9.8
4
0.2
4
1.0
4
1.3
4
1.8
12
1
3
9.2
50
1
0.0
314
6
1.2
348
3
6.4
3
6.9
3
7.2
3
8.0
3
8.4
3
9.3
4
0.1
4
0.5
4
1.3
4
1.6
4
2.1
13
1
3
9.5
21
0
0.0
314
0
1.2
410
3
6.6
3
7.2
3
7.5
3
8.2
3
8.7
3
9.5
4
0.4
4
0.8
4
1.6
4
1.9
4
2.4
46 Head circumference-for-age, girls

Ta
ble
16
Hea
d c
ircu
mfe
ren
ce-
for-
ag
e fo
r g
irls
, a
ge
in w
eek
s (c
on
tin
ued
)
Z
-sco
res
(head
cir
cu
mfe
ren
ce i
n c
m)
Week
L
M
S
S
D
-3 S
D
-2 S
D
-1 S
D
Med
ian
1
SD
2
SD
3
SD
0
1
33.8
78
7
0.0
349
6
1.1
844
3
0.3
3
1.5
3
2.7
3
3.9
3
5.1
3
6.2
3
7.4
1
1
34.5
52
9
0.0
337
4
1.1
658
3
1.1
3
2.2
3
3.4
3
4.6
3
5.7
3
6.9
3
8.1
2
1
35.2
27
2
0.0
325
1
1.1
452
3
1.8
3
2.9
3
4.1
3
5.2
3
6.4
3
7.5
3
8.7
3
1
35.8
43
0
0.0
323
1
1.1
581
3
2.4
3
3.5
3
4.7
3
5.8
3
7.0
3
8.2
3
9.3
4
1
36.3
76
1
0.0
321
5
1.1
695
3
2.9
3
4.0
3
5.2
3
6.4
3
7.5
3
8.7
3
9.9
5
1
36.8
47
2
0.0
320
2
1.1
799
3
3.3
3
4.5
3
5.7
3
6.8
3
8.0
3
9.2
4
0.4
6
1
37.2
71
1
0.0
319
1
1.1
893
3
3.7
3
4.9
3
6.1
3
7.3
3
8.5
3
9.6
4
0.8
7
1
37.6
58
4
0.0
318
2
1.1
983
3
4.1
3
5.3
3
6.5
3
7.7
3
8.9
4
0.1
4
1.3
8
1
38.0
16
7
0.0
317
3
1.2
063
3
4.4
3
5.6
3
6.8
3
8.0
3
9.2
4
0.4
4
1.6
9
1
38.3
51
6
0.0
316
6
1.2
142
3
4.7
3
5.9
3
7.1
3
8.4
3
9.6
4
0.8
4
2.0
10
1
3
8.6
67
3
0.0
315
8
1.2
211
3
5.0
3
6.2
3
7.4
3
8.7
3
9.9
4
1.1
4
2.3
11
1
3
8.9
66
1
0.0
315
2
1.2
282
3
5.3
3
6.5
3
7.7
3
9.0
4
0.2
4
1.4
4
2.7
12
1
3
9.2
50
1
0.0
314
6
1.2
348
3
5.5
3
6.8
3
8.0
3
9.3
4
0.5
4
1.7
4
3.0
13
1
3
9.5
21
0
0.0
314
0
1.2
410
3
5.8
3
7.0
3
8.3
3
9.5
4
0.8
4
2.0
4
3.2
Head circumference-for-age, girls 47

Ta
ble
17
Hea
d c
ircu
mfe
ren
ce-
for-
ag
e fo
r g
irls
, a
ge
in y
ears
an
d m
on
ths
Percen
tile
s (h
ea
d c
ircu
mfe
ren
ce i
n c
m)
Yea
r: M
on
th
Mon
th
L
M
S
SD
1
st
3rd
5
th
15th
2
5th
5
0th
7
5th
8
5th
9
5th
9
7th
9
9th
0:
0
0
1
33.8
78
7
0.0
349
6
1.1
844
3
1.1
3
1.7
3
1.9
3
2.7
3
3.1
3
3.9
3
4.7
3
5.1
3
5.8
3
6.1
3
6.6
0:
1
1
1
36.5
46
3
0.0
321
0
1.1
731
3
3.8
3
4.3
3
4.6
3
5.3
3
5.8
3
6.5
3
7.3
3
7.8
3
8.5
3
8.8
3
9.3
0:
2
2
1
38.2
52
1
0.0
316
8
1.2
118
3
5.4
3
6.0
3
6.3
3
7.0
3
7.4
3
8.3
3
9.1
3
9.5
4
0.2
4
0.5
4
1.1
0:
3
3
1
39.5
32
8
0.0
314
0
1.2
413
3
6.6
3
7.2
3
7.5
3
8.2
3
8.7
3
9.5
4
0.4
4
0.8
4
1.6
4
1.9
4
2.4
0:
4
4
1
40.5
81
7
0.0
311
9
1.2
657
3
7.6
3
8.2
3
8.5
3
9.3
3
9.7
4
0.6
4
1.4
4
1.9
4
2.7
4
3.0
4
3.5
0:
5
5
1
41.4
59
0
0.0
310
2
1.2
861
3
8.5
3
9.0
3
9.3
4
0.1
4
0.6
4
1.5
4
2.3
4
2.8
4
3.6
4
3.9
4
4.5
0:
6
6
1
42.1
99
5
0.0
308
7
1.3
027
3
9.2
3
9.7
4
0.1
4
0.8
4
1.3
4
2.2
4
3.1
4
3.5
4
4.3
4
4.6
4
5.2
0:
7
7
1
42.8
29
0
0.0
307
5
1.3
170
3
9.8
4
0.4
4
0.7
4
1.5
4
1.9
4
2.8
4
3.7
4
4.2
4
5.0
4
5.3
4
5.9
0:
8
8
1
43.3
67
1
0.0
306
3
1.3
283
4
0.3
4
0.9
4
1.2
4
2.0
4
2.5
4
3.4
4
4.3
4
4.7
4
5.6
4
5.9
4
6.5
0:
9
9
1
43.8
30
0
0.0
305
3
1.3
381
4
0.7
4
1.3
4
1.6
4
2.4
4
2.9
4
3.8
4
4.7
4
5.2
4
6.0
4
6.3
4
6.9
0:1
0
10
1
4
4.2
31
9
0.0
304
4
1.3
464
4
1.1
4
1.7
4
2.0
4
2.8
4
3.3
4
4.2
4
5.1
4
5.6
4
6.4
4
6.8
4
7.4
0:1
1
11
1
4
4.5
84
4
0.0
303
5
1.3
531
4
1.4
4
2.0
4
2.4
4
3.2
4
3.7
4
4.6
4
5.5
4
6.0
4
6.8
4
7.1
4
7.7
1:
0
12
1
4
4.8
96
5
0.0
302
7
1.3
590
4
1.7
4
2.3
4
2.7
4
3.5
4
4.0
4
4.9
4
5.8
4
6.3
4
7.1
4
7.5
4
8.1
1:
1
13
1
4
5.1
75
2
0.0
301
9
1.3
638
4
2.0
4
2.6
4
2.9
4
3.8
4
4.3
4
5.2
4
6.1
4
6.6
4
7.4
4
7.7
4
8.3
1:
2
14
1
4
5.4
26
5
0.0
301
2
1.3
683
4
2.2
4
2.9
4
3.2
4
4.0
4
4.5
4
5.4
4
6.3
4
6.8
4
7.7
4
8.0
4
8.6
1:
3
15
1
4
5.6
55
1
0.0
300
6
1.3
724
4
2.5
4
3.1
4
3.4
4
4.2
4
4.7
4
5.7
4
6.6
4
7.1
4
7.9
4
8.2
4
8.8
1:
4
16
1
4
5.8
65
0
0.0
299
9
1.3
755
4
2.7
4
3.3
4
3.6
4
4.4
4
4.9
4
5.9
4
6.8
4
7.3
4
8.1
4
8.5
4
9.1
1:
5
17
1
4
6.0
59
8
0.0
299
3
1.3
786
4
2.9
4
3.5
4
3.8
4
4.6
4
5.1
4
6.1
4
7.0
4
7.5
4
8.3
4
8.7
4
9.3
1:
6
18
1
4
6.2
42
4
0.0
298
7
1.3
813
4
3.0
4
3.6
4
4.0
4
4.8
4
5.3
4
6.2
4
7.2
4
7.7
4
8.5
4
8.8
4
9.5
1:
7
19
1
4
6.4
15
2
0.0
298
2
1.3
841
4
3.2
4
3.8
4
4.1
4
5.0
4
5.5
4
6.4
4
7.3
4
7.8
4
8.7
4
9.0
4
9.6
1:
8
20
1
4
6.5
80
1
0.0
297
7
1.3
867
4
3.4
4
4.0
4
4.3
4
5.1
4
5.6
4
6.6
4
7.5
4
8.0
4
8.9
4
9.2
4
9.8
1:
9
21
1
4
6.7
38
4
0.0
297
2
1.3
891
4
3.5
4
4.1
4
4.5
4
5.3
4
5.8
4
6.7
4
7.7
4
8.2
4
9.0
4
9.4
5
0.0
1:1
0
22
1
4
6.8
91
3
0.0
296
7
1.3
913
4
3.7
4
4.3
4
4.6
4
5.4
4
6.0
4
6.9
4
7.8
4
8.3
4
9.2
4
9.5
5
0.1
1:1
1
23
1
4
7.0
39
1
0.0
296
2
1.3
933
4
3.8
4
4.4
4
4.7
4
5.6
4
6.1
4
7.0
4
8.0
4
8.5
4
9.3
4
9.7
5
0.3
2:
0
24
1
4
7.1
82
2
0.0
295
7
1.3
952
4
3.9
4
4.6
4
4.9
4
5.7
4
6.2
4
7.2
4
8.1
4
8.6
4
9.5
4
9.8
5
0.4
48 Head circumference-for-age, girls

Ta
ble
17
Hea
d c
ircu
mfe
ren
ce-
for-
ag
e fo
r g
irls
, a
ge
in y
ears
an
d m
on
ths
(co
nti
nu
ed)
Percen
tile
s (h
ea
d c
ircu
mfe
ren
ce i
n c
m)
Yea
r: M
on
th
Mon
th
L
M
S
SD
1
st
3rd
5
th
15th
2
5th
5
0th
7
5th
8
5th
9
5th
9
7th
9
9th
2:
1
25
1
4
7.3
20
4
0.0
295
3
1.3
974
4
4.1
4
4.7
4
5.0
4
5.9
4
6.4
4
7.3
4
8.3
4
8.8
4
9.6
4
9.9
5
0.6
2:
2
26
1
4
7.4
53
6
0.0
294
9
1.3
994
4
4.2
4
4.8
4
5.2
4
6.0
4
6.5
4
7.5
4
8.4
4
8.9
4
9.8
5
0.1
5
0.7
2:
3
27
1
4
7.5
81
7
0.0
294
5
1.4
013
4
4.3
4
4.9
4
5.3
4
6.1
4
6.6
4
7.6
4
8.5
4
9.0
4
9.9
5
0.2
5
0.8
2:
4
28
1
4
7.7
04
5
0.0
294
1
1.4
030
4
4.4
4
5.1
4
5.4
4
6.3
4
6.8
4
7.7
4
8.7
4
9.2
5
0.0
5
0.3
5
1.0
2:
5
29
1
4
7.8
21
9
0.0
293
7
1.4
045
4
4.6
4
5.2
4
5.5
4
6.4
4
6.9
4
7.8
4
8.8
4
9.3
5
0.1
5
0.5
5
1.1
2:
6
30
1
4
7.9
34
0
0.0
293
3
1.4
059
4
4.7
4
5.3
4
5.6
4
6.5
4
7.0
4
7.9
4
8.9
4
9.4
5
0.2
5
0.6
5
1.2
2:
7
31
1
4
8.0
41
0
0.0
292
9
1.4
071
4
4.8
4
5.4
4
5.7
4
6.6
4
7.1
4
8.0
4
9.0
4
9.5
5
0.4
5
0.7
5
1.3
2:
8
32
1
4
8.1
43
2
0.0
292
6
1.4
087
4
4.9
4
5.5
4
5.8
4
6.7
4
7.2
4
8.1
4
9.1
4
9.6
5
0.5
5
0.8
5
1.4
2:
9
33
1
4
8.2
40
8
0.0
292
2
1.4
096
4
5.0
4
5.6
4
5.9
4
6.8
4
7.3
4
8.2
4
9.2
4
9.7
5
0.6
5
0.9
5
1.5
2:1
0
34
1
4
8.3
34
3
0.0
291
9
1.4
109
4
5.1
4
5.7
4
6.0
4
6.9
4
7.4
4
8.3
4
9.3
4
9.8
5
0.7
5
1.0
5
1.6
2:1
1
35
1
4
8.4
23
9
0.0
291
5
1.4
116
4
5.1
4
5.8
4
6.1
4
7.0
4
7.5
4
8.4
4
9.4
4
9.9
5
0.7
5
1.1
5
1.7
3:
0
36
1
4
8.5
09
9
0.0
291
2
1.4
126
4
5.2
4
5.9
4
6.2
4
7.0
4
7.6
4
8.5
4
9.5
5
0.0
5
0.8
5
1.2
5
1.8
3:
1
37
1
4
8.5
92
6
0.0
290
9
1.4
136
4
5.3
4
5.9
4
6.3
4
7.1
4
7.6
4
8.6
4
9.5
5
0.1
5
0.9
5
1.3
5
1.9
3:
2
38
1
4
8.6
72
2
0.0
290
6
1.4
144
4
5.4
4
6.0
4
6.3
4
7.2
4
7.7
4
8.7
4
9.6
5
0.1
5
1.0
5
1.3
5
2.0
3:
3
39
1
4
8.7
48
9
0.0
290
3
1.4
152
4
5.5
4
6.1
4
6.4
4
7.3
4
7.8
4
8.7
4
9.7
5
0.2
5
1.1
5
1.4
5
2.0
3:
4
40
1
4
8.8
22
8
0.0
290
0
1.4
159
4
5.5
4
6.2
4
6.5
4
7.4
4
7.9
4
8.8
4
9.8
5
0.3
5
1.2
5
1.5
5
2.1
3:
5
41
1
4
8.8
94
1
0.0
289
7
1.4
165
4
5.6
4
6.2
4
6.6
4
7.4
4
7.9
4
8.9
4
9.8
5
0.4
5
1.2
5
1.6
5
2.2
3:
6
42
1
4
8.9
62
9
0.0
289
4
1.4
170
4
5.7
4
6.3
4
6.6
4
7.5
4
8.0
4
9.0
4
9.9
5
0.4
5
1.3
5
1.6
5
2.3
3:
7
43
1
4
9.0
29
4
0.0
289
1
1.4
174
4
5.7
4
6.4
4
6.7
4
7.6
4
8.1
4
9.0
5
0.0
5
0.5
5
1.4
5
1.7
5
2.3
3:
8
44
1
4
9.0
93
7
0.0
288
8
1.4
178
4
5.8
4
6.4
4
6.8
4
7.6
4
8.1
4
9.1
5
0.1
5
0.6
5
1.4
5
1.8
5
2.4
3:
9
45
1
4
9.1
56
0
0.0
288
6
1.4
186
4
5.9
4
6.5
4
6.8
4
7.7
4
8.2
4
9.2
5
0.1
5
0.6
5
1.5
5
1.8
5
2.5
3:1
0
46
1
4
9.2
16
4
0.0
288
3
1.4
189
4
5.9
4
6.5
4
6.9
4
7.7
4
8.3
4
9.2
5
0.2
5
0.7
5
1.6
5
1.9
5
2.5
3:1
1
47
1
4
9.2
75
1
0.0
288
0
1.4
191
4
6.0
4
6.6
4
6.9
4
7.8
4
8.3
4
9.3
5
0.2
5
0.7
5
1.6
5
1.9
5
2.6
4:
0
48
1
4
9.3
32
1
0.0
287
8
1.4
198
4
6.0
4
6.7
4
7.0
4
7.9
4
8.4
4
9.3
5
0.3
5
0.8
5
1.7
5
2.0
5
2.6
Head circumference-for-age, girls 49

Ta
ble
17
Hea
d c
ircu
mfe
ren
ce-
for-
ag
e fo
r g
irls
, a
ge
in y
ears
an
d m
on
ths
(co
nti
nu
ed)
Percen
tile
s (h
ea
d c
ircu
mfe
ren
ce i
n c
m)
Yea
r: M
on
th
Mon
th
L
M
S
SD
1
st
3rd
5
th
15th
2
5th
5
0th
7
5th
8
5th
9
5th
9
7th
9
9th
4:
1
49
1
4
9.3
87
7
0.0
287
5
1.4
199
4
6.1
4
6.7
4
7.1
4
7.9
4
8.4
4
9.4
5
0.3
5
0.9
5
1.7
5
2.1
5
2.7
4:
2
50
1
4
9.4
41
9
0.0
287
3
1.4
205
4
6.1
4
6.8
4
7.1
4
8.0
4
8.5
4
9.4
5
0.4
5
0.9
5
1.8
5
2.1
5
2.7
4:
3
51
1
4
9.4
94
7
0.0
287
0
1.4
205
4
6.2
4
6.8
4
7.2
4
8.0
4
8.5
4
9.5
5
0.5
5
1.0
5
1.8
5
2.2
5
2.8
4:
4
52
1
4
9.5
46
4
0.0
286
8
1.4
210
4
6.2
4
6.9
4
7.2
4
8.1
4
8.6
4
9.5
5
0.5
5
1.0
5
1.9
5
2.2
5
2.9
4:
5
53
1
4
9.5
96
9
0.0
286
5
1.4
210
4
6.3
4
6.9
4
7.3
4
8.1
4
8.6
4
9.6
5
0.6
5
1.1
5
1.9
5
2.3
5
2.9
4:
6
54
1
4
9.6
46
4
0.0
286
3
1.4
214
4
6.3
4
7.0
4
7.3
4
8.2
4
8.7
4
9.6
5
0.6
5
1.1
5
2.0
5
2.3
5
3.0
4:
7
55
1
4
9.6
94
7
0.0
286
1
1.4
218
4
6.4
4
7.0
4
7.4
4
8.2
4
8.7
4
9.7
5
0.7
5
1.2
5
2.0
5
2.4
5
3.0
4:
8
56
1
4
9.7
42
1
0.0
285
9
1.4
221
4
6.4
4
7.1
4
7.4
4
8.3
4
8.8
4
9.7
5
0.7
5
1.2
5
2.1
5
2.4
5
3.1
4:
9
57
1
4
9.7
88
5
0.0
285
6
1.4
220
4
6.5
4
7.1
4
7.4
4
8.3
4
8.8
4
9.8
5
0.7
5
1.3
5
2.1
5
2.5
5
3.1
4:1
0
58
1
4
9.8
34
1
0.0
285
4
1.4
223
4
6.5
4
7.2
4
7.5
4
8.4
4
8.9
4
9.8
5
0.8
5
1.3
5
2.2
5
2.5
5
3.1
4:1
1
59
1
4
9.8
78
9
0.0
285
2
1.4
226
4
6.6
4
7.2
4
7.5
4
8.4
4
8.9
4
9.9
5
0.8
5
1.4
5
2.2
5
2.6
5
3.2
5:
0
60
1
4
9.9
22
9
0.0
285
0
1.4
228
4
6.6
4
7.2
4
7.6
4
8.4
4
9.0
4
9.9
5
0.9
5
1.4
5
2.3
5
2.6
5
3.2
50 Head circumference-for-age, girls

Ta
ble
17
Hea
d c
ircu
mfe
ren
ce-
for-
ag
e fo
r g
irls
, a
ge
in y
ears
an
d m
on
ths
(co
nti
nu
ed)
Z-s
co
res
(head
cir
cu
mfe
ren
ce i
n c
m)
Yea
r: M
on
th
Mon
th
L
M
S
SD
-3
SD
-2
SD
-1
SD
M
ed
ian
1
SD
2
SD
3
SD
0:
0
0
1
33.8
78
7
0.0
349
6
1.1
844
3
0.3
3
1.5
3
2.7
3
3.9
3
5.1
3
6.2
3
7.4
0:
1
1
1
36.5
46
3
0.0
321
0
1.1
731
3
3.0
3
4.2
3
5.4
3
6.5
3
7.7
3
8.9
4
0.1
0:
2
2
1
38.2
52
1
0.0
316
8
1.2
118
3
4.6
3
5.8
3
7.0
3
8.3
3
9.5
4
0.7
4
1.9
0:
3
3
1
39.5
32
8
0.0
314
0
1.2
413
3
5.8
3
7.1
3
8.3
3
9.5
4
0.8
4
2.0
4
3.3
0:
4
4
1
40.5
81
7
0.0
311
9
1.2
657
3
6.8
3
8.1
3
9.3
4
0.6
4
1.8
4
3.1
4
4.4
0:
5
5
1
41.4
59
0
0.0
310
2
1.2
861
3
7.6
3
8.9
4
0.2
4
1.5
4
2.7
4
4.0
4
5.3
0:
6
6
1
42.1
99
5
0.0
308
7
1.3
027
3
8.3
3
9.6
4
0.9
4
2.2
4
3.5
4
4.8
4
6.1
0:
7
7
1
42.8
29
0
0.0
307
5
1.3
170
3
8.9
4
0.2
4
1.5
4
2.8
4
4.1
4
5.5
4
6.8
0:
8
8
1
43.3
67
1
0.0
306
3
1.3
283
3
9.4
4
0.7
4
2.0
4
3.4
4
4.7
4
6.0
4
7.4
0:
9
9
1
43.8
30
0
0.0
305
3
1.3
381
3
9.8
4
1.2
4
2.5
4
3.8
4
5.2
4
6.5
4
7.8
0:1
0
10
1
4
4.2
31
9
0.0
304
4
1.3
464
4
0.2
4
1.5
4
2.9
4
4.2
4
5.6
4
6.9
4
8.3
0:1
1
11
1
4
4.5
84
4
0.0
303
5
1.3
531
4
0.5
4
1.9
4
3.2
4
4.6
4
5.9
4
7.3
4
8.6
1:
0
12
1
4
4.8
96
5
0.0
302
7
1.3
590
4
0.8
4
2.2
4
3.5
4
4.9
4
6.3
4
7.6
4
9.0
1:
1
13
1
4
5.1
75
2
0.0
301
9
1.3
638
4
1.1
4
2.4
4
3.8
4
5.2
4
6.5
4
7.9
4
9.3
1:
2
14
1
4
5.4
26
5
0.0
301
2
1.3
683
4
1.3
4
2.7
4
4.1
4
5.4
4
6.8
4
8.2
4
9.5
1:
3
15
1
4
5.6
55
1
0.0
300
6
1.3
724
4
1.5
4
2.9
4
4.3
4
5.7
4
7.0
4
8.4
4
9.8
1:
4
16
1
4
5.8
65
0
0.0
299
9
1.3
755
4
1.7
4
3.1
4
4.5
4
5.9
4
7.2
4
8.6
5
0.0
1:
5
17
1
4
6.0
59
8
0.0
299
3
1.3
786
4
1.9
4
3.3
4
4.7
4
6.1
4
7.4
4
8.8
5
0.2
1:
6
18
1
4
6.2
42
4
0.0
298
7
1.3
813
4
2.1
4
3.5
4
4.9
4
6.2
4
7.6
4
9.0
5
0.4
1:
7
19
1
4
6.4
15
2
0.0
298
2
1.3
841
4
2.3
4
3.6
4
5.0
4
6.4
4
7.8
4
9.2
5
0.6
1:
8
20
1
4
6.5
80
1
0.0
297
7
1.3
867
4
2.4
4
3.8
4
5.2
4
6.6
4
8.0
4
9.4
5
0.7
1:
9
21
1
4
6.7
38
4
0.0
297
2
1.3
891
4
2.6
4
4.0
4
5.3
4
6.7
4
8.1
4
9.5
5
0.9
1:1
0
22
1
4
6.8
91
3
0.0
296
7
1.3
913
4
2.7
4
4.1
4
5.5
4
6.9
4
8.3
4
9.7
5
1.1
1:1
1
23
1
4
7.0
39
1
0.0
296
2
1.3
933
4
2.9
4
4.3
4
5.6
4
7.0
4
8.4
4
9.8
5
1.2
2:
0
24
1
4
7.1
82
2
0.0
295
7
1.3
952
4
3.0
4
4.4
4
5.8
4
7.2
4
8.6
5
0.0
5
1.4
Head circumference-for-age, girls 51

Ta
ble
17
Hea
d c
ircu
mfe
ren
ce-
for-
ag
e fo
r g
irls
, a
ge
in y
ears
an
d m
on
ths
(co
nti
nu
ed)
Z-s
co
res
(head
cir
cu
mfe
ren
ce i
n c
m)
Yea
r: M
on
th
Mon
th
L
M
S
SD
-3
SD
-2
SD
-1
SD
M
ed
ian
1
SD
2
SD
3
SD
2:
1
25
1
4
7.3
20
4
0.0
295
3
1.3
974
4
3.1
4
4.5
4
5.9
4
7.3
4
8.7
5
0.1
5
1.5
2:
2
26
1
4
7.4
53
6
0.0
294
9
1.3
994
4
3.3
4
4.7
4
6.1
4
7.5
4
8.9
5
0.3
5
1.7
2:
3
27
1
4
7.5
81
7
0.0
294
5
1.4
013
4
3.4
4
4.8
4
6.2
4
7.6
4
9.0
5
0.4
5
1.8
2:
4
28
1
4
7.7
04
5
0.0
294
1
1.4
030
4
3.5
4
4.9
4
6.3
4
7.7
4
9.1
5
0.5
5
1.9
2:
5
29
1
4
7.8
21
9
0.0
293
7
1.4
045
4
3.6
4
5.0
4
6.4
4
7.8
4
9.2
5
0.6
5
2.0
2:
6
30
1
4
7.9
34
0
0.0
293
3
1.4
059
4
3.7
4
5.1
4
6.5
4
7.9
4
9.3
5
0.7
5
2.2
2:
7
31
1
4
8.0
41
0
0.0
292
9
1.4
071
4
3.8
4
5.2
4
6.6
4
8.0
4
9.4
5
0.9
5
2.3
2:
8
32
1
4
8.1
43
2
0.0
292
6
1.4
087
4
3.9
4
5.3
4
6.7
4
8.1
4
9.6
5
1.0
5
2.4
2:
9
33
1
4
8.2
40
8
0.0
292
2
1.4
096
4
4.0
4
5.4
4
6.8
4
8.2
4
9.7
5
1.1
5
2.5
2:1
0
34
1
4
8.3
34
3
0.0
291
9
1.4
109
4
4.1
4
5.5
4
6.9
4
8.3
4
9.7
5
1.2
5
2.6
2:1
1
35
1
4
8.4
23
9
0.0
291
5
1.4
116
4
4.2
4
5.6
4
7.0
4
8.4
4
9.8
5
1.2
5
2.7
3:
0
36
1
4
8.5
09
9
0.0
291
2
1.4
126
4
4.3
4
5.7
4
7.1
4
8.5
4
9.9
5
1.3
5
2.7
3:
1
37
1
4
8.5
92
6
0.0
290
9
1.4
136
4
4.4
4
5.8
4
7.2
4
8.6
5
0.0
5
1.4
5
2.8
3:
2
38
1
4
8.6
72
2
0.0
290
6
1.4
144
4
4.4
4
5.8
4
7.3
4
8.7
5
0.1
5
1.5
5
2.9
3:
3
39
1
4
8.7
48
9
0.0
290
3
1.4
152
4
4.5
4
5.9
4
7.3
4
8.7
5
0.2
5
1.6
5
3.0
3:
4
40
1
4
8.8
22
8
0.0
290
0
1.4
159
4
4.6
4
6.0
4
7.4
4
8.8
5
0.2
5
1.7
5
3.1
3:
5
41
1
4
8.8
94
1
0.0
289
7
1.4
165
4
4.6
4
6.1
4
7.5
4
8.9
5
0.3
5
1.7
5
3.1
3:
6
42
1
4
8.9
62
9
0.0
289
4
1.4
170
4
4.7
4
6.1
4
7.5
4
9.0
5
0.4
5
1.8
5
3.2
3:
7
43
1
4
9.0
29
4
0.0
289
1
1.4
174
4
4.8
4
6.2
4
7.6
4
9.0
5
0.4
5
1.9
5
3.3
3:
8
44
1
4
9.0
93
7
0.0
288
8
1.4
178
4
4.8
4
6.3
4
7.7
4
9.1
5
0.5
5
1.9
5
3.3
3:
9
45
1
4
9.1
56
0
0.0
288
6
1.4
186
4
4.9
4
6.3
4
7.7
4
9.2
5
0.6
5
2.0
5
3.4
3:1
0
46
1
4
9.2
16
4
0.0
288
3
1.4
189
4
5.0
4
6.4
4
7.8
4
9.2
5
0.6
5
2.1
5
3.5
3:1
1
47
1
4
9.2
75
1
0.0
288
0
1.4
191
4
5.0
4
6.4
4
7.9
4
9.3
5
0.7
5
2.1
5
3.5
4:
0
48
1
4
9.3
32
1
0.0
287
8
1.4
198
4
5.1
4
6.5
4
7.9
4
9.3
5
0.8
5
2.2
5
3.6
52 Head circumference-for-age, girls

Ta
ble
17
Hea
d c
ircu
mfe
ren
ce-
for-
ag
e fo
r g
irls
, a
ge
in y
ears
an
d m
on
ths
(co
nti
nu
ed)
Z-s
co
res
(head
cir
cu
mfe
ren
ce i
n c
m)
Yea
r: M
on
th
Mon
th
L
M
S
SD
-3
SD
-2
SD
-1
SD
M
ed
ian
1
SD
2
SD
3
SD
4:
1
49
1
4
9.3
87
7
0.0
287
5
1.4
199
4
5.1
4
6.5
4
8.0
4
9.4
5
0.8
5
2.2
5
3.6
4:
2
50
1
4
9.4
41
9
0.0
287
3
1.4
205
4
5.2
4
6.6
4
8.0
4
9.4
5
0.9
5
2.3
5
3.7
4:
3
51
1
4
9.4
94
7
0.0
287
0
1.4
205
4
5.2
4
6.7
4
8.1
4
9.5
5
0.9
5
2.3
5
3.8
4:
4
52
1
4
9.5
46
4
0.0
286
8
1.4
210
4
5.3
4
6.7
4
8.1
4
9.5
5
1.0
5
2.4
5
3.8
4:
5
53
1
4
9.5
96
9
0.0
286
5
1.4
210
4
5.3
4
6.8
4
8.2
4
9.6
5
1.0
5
2.4
5
3.9
4:
6
54
1
4
9.6
46
4
0.0
286
3
1.4
214
4
5.4
4
6.8
4
8.2
4
9.6
5
1.1
5
2.5
5
3.9
4:
7
55
1
4
9.6
94
7
0.0
286
1
1.4
218
4
5.4
4
6.9
4
8.3
4
9.7
5
1.1
5
2.5
5
4.0
4:
8
56
1
4
9.7
42
1
0.0
285
9
1.4
221
4
5.5
4
6.9
4
8.3
4
9.7
5
1.2
5
2.6
5
4.0
4:
9
57
1
4
9.7
88
5
0.0
285
6
1.4
220
4
5.5
4
6.9
4
8.4
4
9.8
5
1.2
5
2.6
5
4.1
4:1
0
58
1
4
9.8
34
1
0.0
285
4
1.4
223
4
5.6
4
7.0
4
8.4
4
9.8
5
1.3
5
2.7
5
4.1
4:1
1
59
1
4
9.8
78
9
0.0
285
2
1.4
226
4
5.6
4
7.0
4
8.5
4
9.9
5
1.3
5
2.7
5
4.1
5:
0
60
1
4
9.9
22
9
0.0
285
0
1.4
228
4
5.7
4
7.1
4
8.5
4
9.9
5
1.3
5
2.8
5
4.2
Head circumference-for-age, girls 53

54 Head circumference-for-age, boys & girls
3.4 Comparisons between boys and girls
This section presents the head circumference-for-age z-score comparisons between boys and girls for
the WHO standards (Figure 21).
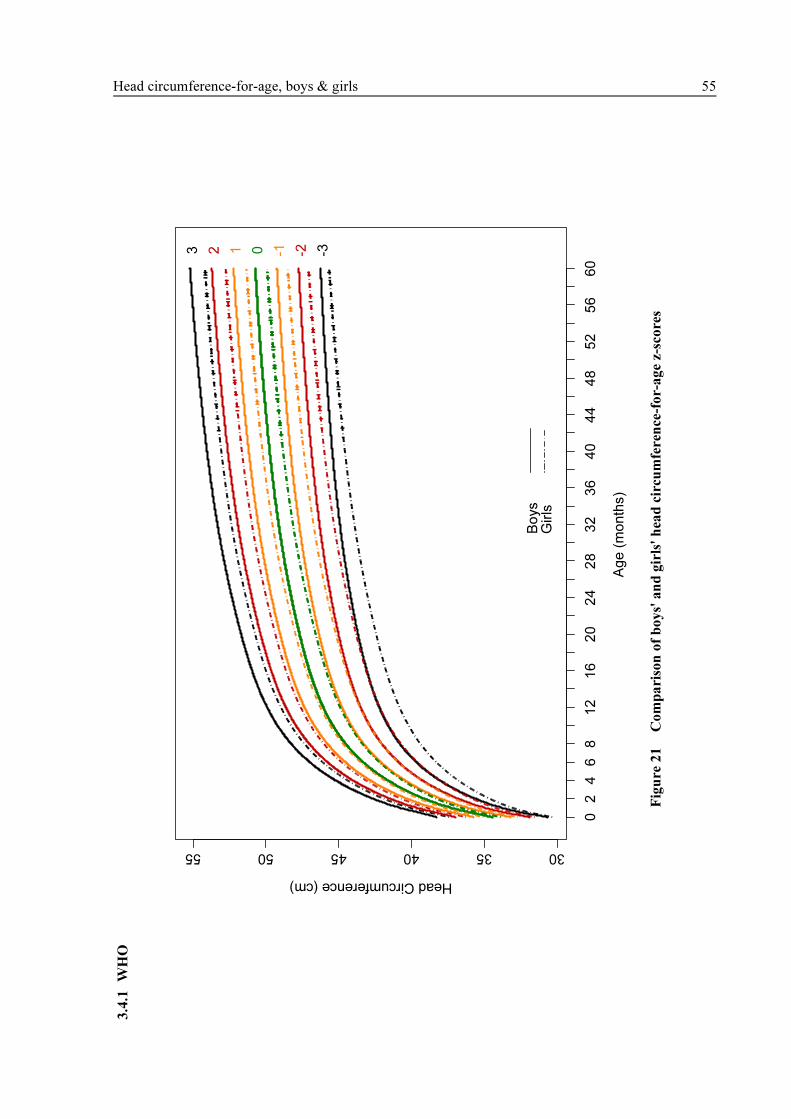
3.4
.1
WH
O
Ag
e (
mo
nth
s)
Head Circumference (cm)
303540455055
02
46
81
21
62
02
42
83
23
64
04
44
85
25
66
0
0 -1 -2 -3123
Bo
ys
Gir
ls
Fig
ure
21
Co
mp
ari
son
of
bo
ys'
an
d g
irls
' h
ead
cir
cum
feren
ce-f
or-
ag
e z-
sco
res
Head circumference-for-age, boys & girls 55


- 57 -
4. CONSTRUCTION OF THE ARM CIRCUMFERENCE-FOR-AGE STANDARDS
4.1 Indicator-specific methodology
Similar steps to those described for the head circumference-for-age growth curves were followed to
construct the arm circumference-for-age growth curves. The diagnostic tools applied to evaluate and
compare candidate models were also similar. All data up to 71 months were used for modelling the
arm circumference-for-age growth curves and the standards afterwards truncated at 60 completed
months to correct for the right-edge effect (Borghi et al., 2006).
4.2 Arm circumference-for-age for boys
4.2.1 Sample size
There were a total of 10 770 arm circumference observations for boys. The longitudinal and cross-
sectional sample sizes by visit and age are presented in Tables 18 and 19. The measurement of arm
circumference started at 3 months of age (de Onis et al., 2004b).
Table 18 Longitudinal sample sizes for arm circumference-for-age for boys
Visit 5 6 7 8 9 10
Age 3 mo 4 mo 5 mo 6 mo 7 mo 8 mo
N 413 407 412 417 415 415
Visit 11 12 13 14 15 16
Age 9 mo 10 mo 11 mo 12 mo 14 mo 16 mo
N 409 407 418 414 416 417
Visit 17 18 19 20
Age 18 mo 20 mo 22 mo 24 mo
N 416 422 415 421
Table 19 Cross-sectional sample sizes for arm circumference-for-age for boys
Age (mo) <18 18–20 21–23 24–26 27–29 30–32 33–35
N 3 177 183 236 257 218 252
Age (mo) 36–38 39–41 42–44 45–47 48–50 51–53 54–56
N 266 249 255 237 237 221 225
Age (mo) 57–59 60–62 63–65 66–68 69–71 >71
N 241 228 216 217 214 4
4.2.2 Model selection and results
To construct the arm circumference-for-age growth curves, the model BCPE(x=ageλ, df(µ)=9, df(σ)=4,
df(ν)=4, τ=2) was used as a starting point to search for the best value of the age-transformation power
λ by examining changes in global deviance. Note that, the empirical distribution clearly indicated
right-skewness, thus the starting arbitrary model included degrees of freedom for ν. Table 20 shows
the global deviance for values of λ from 0.05 to 1. The smallest value of global deviance was
associated with λ=0.35 and thus this age transformation power was selected.

58 Arm circumference-for-age, boys
Table 20 Global deviance (GD) for models within the class BCPE(x=ageλ, df(µ)=9, df(σ)=4,
df(ν)=4, τ=2) for arm circumference-for-age for boys
λ 0.05 0.10 0.15 0.20 0.25 0.30 0.35 0.40 0.45 0.50
GDa
230.1 229.6 229.1 228.7 228.4 228.2 228.1 228.2 228.4 228.8
λ 0.55 0.60 0.65 0.70 0.75 0.80 0.85 0.90 0.95 1.00
GDa
229.4 230.2 231.4 232.9 234.9 237.3 240.2 243.8 248.0 252.9
a In excess of 34 000.
The search for the best df(µ) and df(σ) followed, using λ=0.35, and fixing ν=1 and τ=2. All possible
combinations with df(µ) values ranging from 7 to 15 and df(σ) from 2 to 10 were considered and
partial results are presented in Table 21. No fitted model minimized both AIC and GAIC(3)
simultaneously. Overall it was noticed that for data with a higher dispersion such as arm
circumference and skinfolds, the criterion GAIC(3) provided more parsimonious models, and therefore
only this criterion was considered in selecting the final models for the construction of the standards for
these indicators. For boys' the arm circumference-for-age GAIC(3) was most minimized by the
combination df(µ)=8 and df(σ)=4. This model was thus selected for further evaluation.
Table 21 Goodness-of-fit summary for models using the BCPE distribution with fixed ν=1 and
τ=2 for arm circumference-for-age for boys
df(µ) df(σ) GDa
AICa
GAIC(3)a
Total df
2 360.9 378.9 387.9 9
3 351.9 371.9 381.9 10
4 348.6 370.6 381.6 11
5 347.2 371.2 383.2 12
7
6 346.1 372.1 385.1 13
2 357.5 377.5 387.5 10
3 348.5 370.5 381.5 11
4 345.2 369.2 381.2 12
5 343.7 369.7 382.7 13
8
6 342.6 370.6 384.6 14
2 355.5 377.5 388.5 11
3 346.5 370.5 382.5 12
4 343.2 369.2 382.2 13
5 341.8 369.8 383.8 14
9
6 340.6 370.6 385.6 15
2 354.2 378.2 390.2 12
3 345.2 371.2 384.2 13
4 341.8 369.8 383.8 14
5 340.4 370.4 385.4 15
10
6 339.3 371.3 387.3 16
2 353.2 379.2 392.2 13
3 344.2 372.2 386.2 14
4 340.8 370.8 385.8 15
5 339.4 371.4 387.4 16
11
6 338.2 372.2 389.2 17
GD, Global Deviance; AIC, Akaike Information Criterion;
GAIC(3), Generalized AIC with penalty equal to 3; a In excess of 34 000.

Arm circumference-for-age, boys 59
Model 1: BCPE(x=age0.35
, df(µ)=8, df(σ)=4, ν=1, τ=2)
For this model, both the worm plots (Figure 22) and the Q-test results (Table 22) indicated good model
fit of the µ and σ curves but pointed to the need to adjust for skewness. The worms had a U-shape in
most age groups after 12 months, indicating residual skewness. This finding was confirmed by the Q-
test results (Table 22), which showed various groups in the same age range with absolute values of z3
higher than 2. The overall test for skewness was significant (p-value < 0.01). Only two age groups
presented absolute values of z4 higher than 2, indicating residual kurtosis.
3 mo 4 mo 5 mo 6 mo 7 mo
8 mo 9 mo 10 mo 11 mo 12 mo
14 mo 16 mo 18 mo 20 mo 22 mo
24 mo 28 mo 34 mo 40 mo 46 mo
52 mo 58 mo 64 mo 70 mo
3 mo 4 mo 5 mo 6 mo 7 mo
8 mo 9 mo 10 mo 11 mo 12 mo
14 mo 16 mo 18 mo 20 mo 22 mo
24 mo 28 mo 34 mo 40 mo 46 mo
52 mo 58 mo 64 mo 70 mo
3 mo 4 mo 5 mo 6 mo 7 mo
8 mo 9 mo 10 mo 11 mo 12 mo
14 mo 16 mo 18 mo 20 mo 22 mo
24 mo 28 mo 34 mo 40 mo 46 mo
52 mo 58 mo 64 mo 70 mo
Figure 22 Worm plots of z-scores for Model 1 for arm circumference-for-age for boys

60 Arm circumference-for-age, boys
Table 22 Q-test for z-scores from Model 1 [BCPE(x=age0.35
, df(µ)=8, df(σ)=4, ν=1, τ=2)] for arm
circumference-for-age for boys
Age (days) Group N z1 z2 z3 z4
79 to 99 3 mo 409 -0.85 0.15 1.02 0.70
100 to 129 4 mo 404 0.23 -0.76 1.79 0.99
130 to 159 5 mo 409 1.15 -0.28 1.51 0.35
160 to 189 6 mo 411 -0.32 -0.38 1.33 -0.03
190 to 219 7 mo 406 0.25 1.44 1.03 1.08
220 to 249 8 mo 420 0.37 0.30 1.08 1.06
250 to 279 9 mo 392 -0.83 0.11 1.01 0.73
280 to 309 10 mo 399 0.41 0.53 0.19 -1.14
310 to 349 11 mo 461 0.24 -0.65 1.37 -0.67
350 to 379 12 mo 409 -0.39 -0.32 1.69 0.26
380 to 439 14 mo 418 0.33 -0.37 2.87 0.49
440 to 499 16 mo 415 -0.60 1.15 4.15 2.48
500 to 559 18 mo 442 0.66 0.80 3.52 1.59
560 to 619 20 mo 523 -0.04 0.05 2.43 0.65
620 to 679 22 mo 545 -1.38 -0.13 1.83 0.16
680 to 749 24 mo 591 -0.70 -0.69 1.69 -0.33
750 to 929 28 mo 471 1.58 -0.74 0.00 -0.42
930 to 1119 34 mo 510 1.01 -1.24 3.29 -0.07
1120 to 1309 40 mo 511 -1.01 0.64 2.24 0.73
1310 to 1499 46 mo 508 0.12 0.36 4.32 2.81
1500 to 1689 52 mo 487 0.21 -0.02 4.03 1.59
1690 to 1879 58 mo 482 -0.64 -1.15 2.91 0.00
1880 to 2069 64 mo 461 -0.14 1.06 1.31 -0.48
2070 to 2249 70 mo 286 0.67 0.44 3.18 0.64
Overall Q stats 10 770 12.22 11.66 137.37 27.45
degrees of freedom 16.0 21.5 24.0 24.0
p-value 0.7284 0.9569 <0.01 0.2841
Note: Absolute values of z1, z2, z3 or z4 larger than 2 indicate misfit of, respectively, mean, variance,
skewness or kurtosis.
The next step involved fitting the parameter ν for skewness using the BCPE distribution with fixed
parameter τ=2, keeping the degrees of freedom for the µ and σ curves selected for Model 1. Table 23
shows the GAIC(3) values for various degrees of freedom for the ν curve.

Arm circumference-for-age, boys 61
Table 23 Goodness-of-fit summary for models BCPE(x=age0.35
, df(µ)=8, df(σ)=4, df(ν)=?, τ=2)
for arm circumference-for-age for boys
df(ν) GDa
GAIC(3)a
Total df
1 238.3 277.3 13
2 232.0 274.0 14
3 231.4 276.4 15
4 230.2 278.3 16
5 228.1 279.1 17
6 225.1 279.1 18
7 222.2 279.2 19
GD, Global Deviance; GAIC(3), Generalized Akaike Information
Criterion with penalty equal to 3; a In excess of 34 000.
The smallest GAIC(3) value corresponded to df(ν)=2. A new iteration was performed using df(ν)=2 to
re-search for df(µ) and df(σ). This search led to similar results as before, i.e. df(µ)=8 and df(σ)=4 was
still the best combination (GAIC(3)=34274.0), but the combination df(µ)=7 and df(σ)=4 yielded a very
similar GAIC(3) value (34274.5) and thus it was selected in the interest of further smoothing the
median curve. A new search for the best df(ν) and, subsequently, age-transformation power λ using
this model was carried out, but results indicated no need to update the selected model. Thus, the model
BCPE(x=age0.35, df(µ)=7, df(σ)=4, df(ν)=2, τ=2) was further evaluated.
Model 2: BCPE(x= age0.35
, df(µ)=7, df(σ)=4, df(ν)=2, τ=2)
Figure 23 shows the fitting of the parameters µ, σ and ν for Model 2 with their respective sample
estimates, that is, the median for µ and Box-Cox transform power for ν. It should be noted that the
sample estimate for the parameter σ is no longer the coefficient of variation when the distribution
departs significantly from the normal distribution. In this case, the best estimator of σ is the sample
standard deviation of the Box-Cox transformed data (Cole and Green, 1992).
Figures 24 and 25 show the distribution of differences between empirical values and fitted centiles for
the longitudinal and cross-sectional samples, respectively. There was indication of systematic bias
between 3 and 24 months only for the 90th centile (Figure 24), and between 24 and 71 months only for
the 10th centile (Figure 25).
The worm plots for this model (Figure 26) were significantly improved compared to those of Model 1
(Figure 22). The U-shaped worms flattened out significantly (Figure 26), indicating that the residual
skewness associated with Model 1 had been corrected. There was indication of remaining skewness
only for one age group (28 mo). Another two groups presented slightly S-shaped worm (16 mo and
46 mo) suggesting residual kurtosis but it was contained within the 95% confidence interval.

62 Arm circumference-for-age, boys
Age (months)
Arm
Cir
cu
mfe
ren
ce
Me
dia
n (
cm
)
14
15
16
17
0 6 14 22 30 39 48 57 66
Age (months)
St D
ev B
ox-C
ox T
ran
form
ed
MU
AC
0.0
75
0.0
80
0.0
85
0.0
90
0 6 14 22 30 39 48 57 66
Age (months)
Bo
x-C
ox T
ran
sfo
rm P
ow
er
-1.5
-0.5
0.5
1.0
1.5
0 6 14 22 30 39 48 57 66
Figure 23 Fitting of the µ, σ, and ν curves of Model 2 for arm circumference-for-age
for boys from 3 to 71 months (dotted line) and their respective sample
estimates (points with solid line)

Arm circumference-for-age, boys 63
3rd Centile
-0.4
0.0
0.2
0.4
4 6 8 10 14 18 22
5th Centile
-0.4
0.0
0.2
0.4
4 6 8 10 14 18 22
10th Centile
-0.4
0.0
0.2
0.4
4 6 8 10 14 18 22
25th Centile
-0.4
0.0
0.2
0.4
4 6 8 10 14 18 22
50th Centile
-0.4
0.0
0.2
0.4
4 6 8 10 14 18 22
75th Centile
-0.4
0.0
0.2
0.4
4 6 8 10 14 18 22
90th Centile
-0.4
0.0
0.2
0.4
4 6 8 10 14 18 22
95th Centile
-0.4
0.0
0.2
0.4
4 6 8 10 14 18 22
97th Centile
-0.4
0.0
0.2
0.4
4 6 8 10 14 18 22
Age (months)
Em
piric
al-F
itte
d C
en
tile
fo
r A
rm C
ircu
mfe
ren
ce
(cm
)
Figure 24 Centile residuals from fitting Model 2 for arm circumference-for-age
from 3 to 24 months for boys
3rd Centile
-0.4
0.0
0.2
0.4
25 31 37 43 49 55 61 67
5th Centile
-0.4
0.0
0.2
0.4
25 31 37 43 49 55 61 67
10th Centile
-0.4
0.0
0.2
0.4
25 31 37 43 49 55 61 67
25th Centile
-0.4
0.0
0.2
0.4
25 31 37 43 49 55 61 67
50th Centile
-0.4
0.0
0.2
0.4
25 31 37 43 49 55 61 67
75th Centile
-0.4
0.0
0.2
0.4
25 31 37 43 49 55 61 67
90th Centile
-0.4
0.0
0.2
0.4
25 31 37 43 49 55 61 67
95th Centile
-0.4
0.0
0.2
0.4
25 31 37 43 49 55 61 67
97th Centile
-0.4
0.0
0.2
0.4
25 31 37 43 49 55 61 67
Age (months)
Em
piric
al-F
itte
d C
en
tile
fo
r A
rm C
ircu
mfe
ren
ce
(cm
)
Figure 25 Centile residuals from fitting Model 2 for arm circumference-for-age
from 24 to 71 months for boys

64 Arm circumference-for-age, boys
3 mo 4 mo 5 mo 6 mo 7 mo
8 mo 9 mo 10 mo 11 mo 12 mo
14 mo 16 mo 18 mo 20 mo 22 mo
24 mo 28 mo 34 mo 40 mo 46 mo
52 mo 58 mo 64 mo 70 mo
3 mo 4 mo 5 mo 6 mo 7 mo
8 mo 9 mo 10 mo 11 mo 12 mo
14 mo 16 mo 18 mo 20 mo 22 mo
24 mo 28 mo 34 mo 40 mo 46 mo
52 mo 58 mo 64 mo 70 mo
3 mo 4 mo 5 mo 6 mo 7 mo
8 mo 9 mo 10 mo 11 mo 12 mo
14 mo 16 mo 18 mo 20 mo 22 mo
24 mo 28 mo 34 mo 40 mo 46 mo
52 mo 58 mo 64 mo 70 mo
Figure 26 Worm plots of z-scores for Model 2 for arm circumference-for-age for boys
The Q-test results from Model 2 are shown in Table 24. There were two age groups with an absolute
value larger than 2 for the statistic z3 (16 mo and 28 mo) suggesting remaining skewness. No group
presented an absolute value of z4 greater than 2, indicating no remaining kurtosis. The overall Q-test
p-values were all non-significant, indicating an adequate fit of the boys' arm circumference-for-age
curves and presenting no justification for increasing the complexity of the model by adjusting for
kurtosis (modelling τ).
Table 25 presents observed percentages with arm circumferences below the fitted centiles. Age groups
above 24 months presented larger differences compared to the age range younger than 24 months, yet
there was no detectable pattern suggesting systematic bias.

Arm circumference-for-age, boys 65
Table 24 Q-test for z-scores from Model 2 [BCPE(x=age0.35
, df(µ)=7, df(σ)=4, df(ν)=2, τ=2)] for
arm circumference-for-age for boys
Age (days) Group N z1 z2 z3 z4
79 to 99 3 mo 409 -1.30 0.17 -0.21 0.71
100 to 129 4 mo 404 0.24 -0.85 0.54 0.65
130 to 159 5 mo 409 1.36 -0.40 0.25 -0.02
160 to 189 6 mo 411 -0.05 -0.37 0.02 -0.25
190 to 219 7 mo 406 0.43 1.47 -0.59 0.69
220 to 249 8 mo 420 0.54 0.32 -0.58 0.73
250 to 279 9 mo 392 -0.73 0.24 -0.60 0.49
280 to 309 10 mo 399 0.43 0.64 -1.21 -0.82
310 to 349 11 mo 461 0.26 -0.64 -0.16 -0.86
350 to 379 12 mo 409 -0.42 -0.28 0.02 0.41
380 to 439 14 mo 418 0.28 -0.53 1.25 0.02
440 to 499 16 mo 415 -0.73 0.94 2.03 1.96
500 to 559 18 mo 442 0.53 0.54 1.53 0.52
560 to 619 20 mo 523 -0.20 0.04 0.24 0.25
620 to 679 22 mo 545 -1.56 0.10 -0.44 0.06
680 to 749 24 mo 591 -0.77 -0.51 -0.61 -0.31
750 to 929 28 mo 471 1.72 -0.61 -2.12 0.00
930 to 1119 34 mo 510 1.27 -1.51 1.19 -1.28
1120 to 1309 40 mo 511 -1.03 0.90 -0.62 0.20
1310 to 1499 46 mo 508 0.04 0.15 0.87 1.88
1500 to 1689 52 mo 487 0.08 -0.26 1.05 0.40
1690 to 1879 58 mo 482 -0.66 -1.07 0.14 -0.94
1880 to 2069 64 mo 461 -0.14 1.45 -1.80 -0.72
2070 to 2249 70 mo 286 0.91 0.08 0.80 -0.78
Overall Q stats 10 770 15.93 12.75 23.65 15.46
degrees of freedom 17.0 21.5 22.0 24.0
p-value 0.5289 0.9291 0.3657 0.9064
Note: Absolute values of z1, z2, z3 or z4 larger than 2 indicate misfit of, respectively, mean, variance,
skewness or kurtosis.
In conclusion, the model selected for constructing the arm circumference-for-age growth curves for
boys was BCPE(x=age0.35, df(µ)=7, df(σ)=4, df(ν)=2, τ=2) that adjusts only for skewness, and thus
reduces in essence to the LMS method (Cole and Green, 1992). The fitted centile curves and empirical
centiles are shown in Figures 27 to 30.

Ta
ble
25
Ob
serv
ed p
ro
po
rtio
ns
of
chil
dre
n w
ith
mea
surem
ents
bel
ow
th
e fi
tted
cen
tile
s fr
om
Mo
del
2, a
rm c
ircu
mfe
ren
ce-f
or-
ag
e fo
r b
oy
s
Ex
pec
ted
3
mo
4
mo
5
mo
6
mo
7
mo
8
mo
9
mo
1
0 m
o
11
mo
1
1.0
1
.0
0.7
1
.0
1.7
1
.2
1.3
1
.5
1.1
3
4.2
2
.0
2.7
2
.7
4.4
3
.1
4.1
3
.8
2.4
5
6.1
4
.2
4.6
5
.4
6.7
5
.2
5.6
5
.5
3.9
10
1
0.5
8
.7
8.1
9
.2
11
.6
10
.5
12
.5
9.8
8
.9
25
2
7.6
2
4.3
2
4.9
2
5.3
2
3.9
2
4.0
2
2.7
2
5.6
2
4.7
50
5
2.1
4
9.5
4
7.9
4
8.9
4
7.8
4
6.9
5
0.5
4
7.1
5
0.5
75
7
8.5
7
6.5
7
2.1
7
3.5
7
2.7
7
4.3
7
5.5
7
2.4
7
3.5
90
9
1.2
9
0.1
9
0.2
9
0.0
9
0.1
9
0.7
9
2.1
8
8.7
9
0.9
95
9
5.6
9
5.5
9
4.1
9
5.1
9
4.6
9
4.8
9
4.9
9
5.7
9
6.1
97
9
7.1
9
6.8
9
6.6
9
6.8
9
5.8
9
7.1
9
6.7
9
7.2
9
7.4
99
9
8.5
9
9.0
9
8.8
9
9.0
9
8.0
9
8.3
9
8.7
9
9.2
9
9.1
Ex
pec
ted
1
2 m
o
14
mo
1
6 m
o
18
mo
2
0 m
o
22
mo
2
4 m
o
28
mo
3
4 m
o
1
1.2
0
.7
1.0
0
.9
1.5
1
.1
1.0
1
.1
0.4
3
2.2
1
.9
2.4
2
.0
3.1
4
.0
2.4
3
.2
1.4
5
3.4
2
.6
4.6
3
.6
4.6
5
.7
4.1
4
.9
2.9
10
9
.3
9.3
9
.4
9.3
9
.2
10
.8
10
.7
8.7
7
.3
25
2
6.9
2
6.3
2
6.3
2
5.8
2
6.4
2
8.8
2
7.1
2
1.9
2
3.5
50
5
1.8
5
2.2
5
3.3
4
9.3
5
0.1
5
1.4
5
1.3
4
6.3
4
8.6
75
7
5.1
7
3.4
7
8.3
7
2.9
7
4.8
7
8.0
7
5.5
7
1.5
7
3.5
90
9
1.0
9
1.1
9
1.3
8
9.1
9
1.0
9
2.1
9
1.4
9
1.1
8
9.2
95
9
5.1
9
4.3
9
3.7
9
5.5
9
4.5
9
4.9
9
5.1
9
5.1
9
4.3
97
9
6.3
9
5.9
9
5.9
9
6.4
9
7.3
9
6.9
9
7.3
9
7.2
9
6.7
99
9
9.3
9
8.8
9
7.8
9
8.4
9
8.9
9
9.3
9
9.5
9
9.2
9
9.4
66 Arm circumference-for-age, boys

Ta
ble
25
Ob
serv
ed p
ro
po
rtio
ns
of
chil
dre
n w
ith
mea
surem
ents
bel
ow
th
e fi
tted
cen
tile
s fr
om
Mo
del
2, a
rm c
ircu
mfe
ren
ce-f
or-
ag
e fo
r b
oy
s (c
on
t)
Ex
pec
ted
4
0 m
o
46
mo
5
2 m
o
58
mo
6
4 m
o
70
mo
O
ver
all
1
1.2
1
.2
1.0
1
.0
1.3
0
.0
1.1
3
5.3
4
.1
2.5
2
.3
4.1
3
.1
3.1
5
6.8
5
.5
4.1
4
.8
7.6
4
.5
4.9
10
1
1.2
8
.7
9.7
9
.5
11
.1
10
.1
9.7
25
2
5.2
2
2.8
2
6.3
2
8.4
2
7.3
2
2.7
2
5.5
50
5
1.9
4
8.6
4
9.5
5
1.7
4
9.7
4
9.3
4
9.9
75
7
5.9
7
8.3
7
5.6
7
5.5
7
1.6
7
1.7
7
4.7
90
9
0.8
9
0.7
8
9.9
9
2.1
8
9.2
8
8.1
9
0.6
95
9
4.9
9
3.7
9
4.3
9
5.2
9
5.7
9
3.0
9
4.8
97
9
7.1
9
5.7
9
6.7
9
7.5
9
7.4
9
6.5
9
6.8
99
9
9.0
9
8.4
9
8.8
9
9.6
9
9.3
9
9.0
9
8.9
No
te:
Gro
up l
abel
s co
rres
pond
to t
he
age
inte
rval
s in
Tab
le 2
4.
Arm circumference-for-age, boys 67

Ag
e (
mo
nth
s)
Arm Circumference (cm)
121314151617
36
91
21
51
82
12
4
3rd
10th
50th
90th
97th
Fitte
d
Em
pir
ica
l
Fig
ure
27
3rd
, 1
0th
, 5
0th
, 9
0th
, 9
7th
sm
oo
thed
cen
tile
cu
rves
an
d e
mp
iric
al
va
lues
: arm
cir
cum
fere
nce
-fo
r-a
ge
for
bo
ys
from
3 t
o 2
4 m
on
ths
68 Arm circumference-for-age, boys

Ag
e (
mo
nth
s)
Arm Circumference (cm)
121314151617
36
912
15
18
21
24
5th
25th
50th
75th
95th
Fitte
d
Em
pir
ica
l
Fig
ure
28
5th
, 2
5th
, 5
0th
, 7
5th
, 9
5th
sm
oo
thed
cen
tile
cu
rves
an
d e
mp
iric
al
va
lues
: arm
cir
cum
fere
nce
-fo
r-a
ge
for
bo
ys
from
3 t
o 2
4 m
on
ths
Arm circumference-for-age, boys 69

Ag
e (
mo
nth
s)
Arm Circumference (cm)
14161820
24
27
30
33
36
39
42
45
48
51
54
57
60
63
66
69
72
3rd
10th
50th
90th
97th
Fitte
d
Em
pir
ica
l
Fig
ure
29
3rd
, 1
0th
, 5
0th
, 9
0th
, 9
7th
sm
oo
thed
cen
tile
cu
rves
an
d e
mp
iric
al
va
lues
: arm
cir
cum
fere
nce
-fo
r-a
ge
for
bo
ys
from
24
to
71 m
on
ths
70 Arm circumference-for-age, boys

Age (
month
s)
Arm Circumference (cm)
14161820
24
27
30
33
36
39
42
45
48
51
54
57
60
63
66
69
72
5th
25th
50th
75th
95th
Fitte
d
Em
pir
ical
Fig
ure
30
5th
, 2
5th
, 5
0th
, 7
5th
, 9
5th
sm
oo
thed
cen
tile
cu
rves
an
d e
mp
iric
al
va
lues
: arm
cir
cum
fere
nce
-fo
r-a
ge
for
bo
ys
from
24
to
71 m
on
ths
Arm circumference-for-age, boys 71

72 Arm circumference-for-age, boys
4.2.3 WHO standards
This section presents the final WHO arm circumference-for-age z-score and percentile charts (Figures
31 and 32) and table (Table 26) for boys.
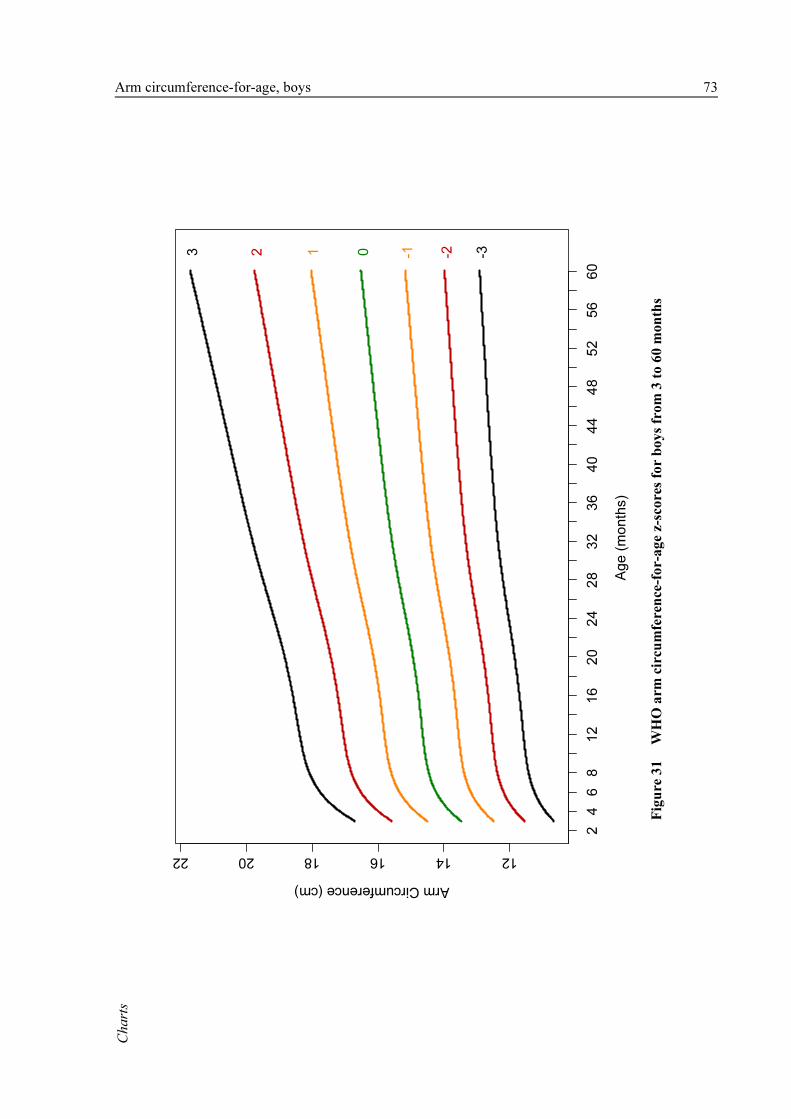
Ch
arts
Ag
e (
mo
nth
s)
Arm Circumference (cm)
121416182022
24
68
12
16
20
24
28
32
36
40
44
48
52
56
60
123 0 -1 -2 -3
Fig
ure
31
WH
O a
rm c
ircu
mfe
ren
ce-f
or-
ag
e z-
sco
res
for
bo
ys
fro
m 3
to
60 m
on
ths
Arm circumference-for-age, boys 73

Age (
month
s)
Arm Circumference (cm)
12141618
24
68
12
16
20
24
28
32
36
40
44
48
52
56
60
3rd
50th
97th
15th
85th
Fig
ure
32
WH
O a
rm c
ircu
mfe
ren
ce-f
or-
ag
e p
ercen
tile
s fo
r b
oy
s fr
om
3 t
o 6
0 m
on
ths
74 Arm circumference-for-age, boys

Ta
ble
s
Ta
ble
26
Arm
cir
cum
fere
nce-
for-
ag
e fo
r b
oy
s, a
ge
in y
ears
an
d m
on
ths
P
ercen
tile
s (a
rm
cir
cu
mfe
ren
ce i
n c
m)
Yea
r: M
on
th
Mon
th
L
M
S
1st
3
rd
5
th
15th
2
5th
5
0th
7
5th
8
5th
9
5th
9
7th
9
9th
0:
3
3
0.3
928
1
3.4
81
7
0.0
747
5
11.3
1
1.7
1
1.9
1
2.5
1
2.8
1
3.5
1
4.2
1
4.6
1
5.2
1
5.5
1
6.0
0:
4
4
0.3
475
1
3.8
09
7
0.0
752
3
11.5
1
1.9
1
2.2
1
2.8
1
3.1
1
3.8
1
4.5
1
4.9
1
5.6
1
5.9
1
6.4
0:
5
5
0.3
092
1
4.0
58
5
0.0
756
6
11.7
1
2.2
1
2.4
1
3.0
1
3.4
1
4.1
1
4.8
1
5.2
1
5.9
1
6.2
1
6.7
0:
6
6
0.2
755
1
4.2
38
9
0.0
760
1
11.9
1
2.3
1
2.5
1
3.1
1
3.5
1
4.2
1
5.0
1
5.4
1
6.1
1
6.4
1
6.9
0:
7
7
0.2
453
1
4.3
67
8
0.0
762
9
12.0
1
2.4
1
2.6
1
3.3
1
3.6
1
4.4
1
5.1
1
5.5
1
6.3
1
6.5
1
7.1
0:
8
8
0.2
179
1
4.4
59
1
0.0
765
0
12.1
1
2.5
1
2.7
1
3.3
1
3.7
1
4.5
1
5.2
1
5.6
1
6.4
1
6.7
1
7.2
0:
9
9
0.1
925
1
4.5
24
5
0.0
766
5
12.1
1
2.5
1
2.8
1
3.4
1
3.8
1
4.5
1
5.3
1
5.7
1
6.5
1
6.7
1
7.3
0:1
0
10
0
.1690
1
4.5
73
3
0.0
767
6
12.2
1
2.6
1
2.8
1
3.5
1
3.8
1
4.6
1
5.3
1
5.8
1
6.5
1
6.8
1
7.4
0:1
1
11
0
.1469
1
4.6
11
9
0.0
768
3
12.2
1
2.6
1
2.9
1
3.5
1
3.9
1
4.6
1
5.4
1
5.8
1
6.6
1
6.9
1
7.4
1:
0
12
0
.1261
1
4.6
44
9
0.0
768
9
12.2
1
2.7
1
2.9
1
3.5
1
3.9
1
4.6
1
5.4
1
5.9
1
6.6
1
6.9
1
7.5
1:
1
13
0
.1064
1
4.6
75
8
0.0
769
4
12.2
1
2.7
1
2.9
1
3.5
1
3.9
1
4.7
1
5.5
1
5.9
1
6.6
1
6.9
1
7.5
1:
2
14
0
.0876
1
4.7
06
3
0.0
769
9
12.3
1
2.7
1
2.9
1
3.6
1
4.0
1
4.7
1
5.5
1
5.9
1
6.7
1
7.0
1
7.6
1:
3
15
0
.0697
1
4.7
38
0
0.0
770
3
12.3
1
2.7
1
3.0
1
3.6
1
4.0
1
4.7
1
5.5
1
6.0
1
6.7
1
7.0
1
7.6
1:
4
16
0
.0526
1
4.7
72
3
0.0
770
7
12.3
1
2.8
1
3.0
1
3.6
1
4.0
1
4.8
1
5.6
1
6.0
1
6.8
1
7.1
1
7.7
1:
5
17
0
.0362
1
4.8
09
5
0.0
771
0
12.4
1
2.8
1
3.0
1
3.7
1
4.1
1
4.8
1
5.6
1
6.0
1
6.8
1
7.1
1
7.7
1:
6
18
0
.0204
1
4.8
49
6
0.0
771
3
12.4
1
2.8
1
3.1
1
3.7
1
4.1
1
4.8
1
5.6
1
6.1
1
6.9
1
7.2
1
7.8
1:
7
19
0
.0051
1
4.8
92
6
0.0
771
7
12.4
1
2.9
1
3.1
1
3.7
1
4.1
1
4.9
1
5.7
1
6.1
1
6.9
1
7.2
1
7.8
1:
8
20
-0
.009
7
14.9
38
8
0.0
772
1
12.5
1
2.9
1
3.2
1
3.8
1
4.2
1
4.9
1
5.7
1
6.2
1
7.0
1
7.3
1
7.9
1:
9
21
-0
.023
9
14.9
88
3
0.0
772
5
12.5
1
3.0
1
3.2
1
3.8
1
4.2
1
5.0
1
5.8
1
6.2
1
7.0
1
7.3
1
7.9
1:1
0
22
-0
.037
8
15.0
41
0
0.0
773
1
12.6
1
3.0
1
3.2
1
3.9
1
4.3
1
5.0
1
5.8
1
6.3
1
7.1
1
7.4
1
8.0
1:1
1
23
-0
.051
2
15.0
96
4
0.0
773
8
12.6
1
3.1
1
3.3
1
3.9
1
4.3
1
5.1
1
5.9
1
6.4
1
7.2
1
7.5
1
8.1
2:
0
24
-0
.064
3
15.1
53
6
0.0
774
6
12.7
1
3.1
1
3.3
1
4.0
1
4.4
1
5.2
1
6.0
1
6.4
1
7.2
1
7.5
1
8.2
Arm circumference-for-age, boys 75

Ta
ble
26
Arm
cir
cum
fere
nce-
for-
ag
e fo
r b
oy
s, a
ge
in y
ears
an
d m
on
ths
(co
nti
nu
ed)
P
ercen
tile
s (a
rm
cir
cu
mfe
ren
ce i
n c
m)
Yea
r: M
on
th
Mon
th
L
M
S
1st
3
rd
5
th
15th
2
5th
5
0th
7
5th
8
5th
9
5th
9
7th
9
9th
2:
1
25
-0
.077
0
15.2
11
5
0.0
775
5
12.7
1
3.2
1
3.4
1
4.0
1
4.4
1
5.2
1
6.0
1
6.5
1
7.3
1
7.6
1
8.2
2:
2
26
-0
.089
4
15.2
69
3
0.0
776
7
12.8
1
3.2
1
3.4
1
4.1
1
4.5
1
5.3
1
6.1
1
6.6
1
7.4
1
7.7
1
8.3
2:
3
27
-0
.101
4
15.3
25
9
0.0
778
0
12.8
1
3.3
1
3.5
1
4.1
1
4.5
1
5.3
1
6.2
1
6.6
1
7.4
1
7.8
1
8.4
2:
4
28
-0
.113
2
15.3
80
8
0.0
779
4
12.9
1
3.3
1
3.5
1
4.2
1
4.6
1
5.4
1
6.2
1
6.7
1
7.5
1
7.8
1
8.5
2:
5
29
-0
.124
8
15.4
33
6
0.0
781
0
12.9
1
3.3
1
3.6
1
4.2
1
4.6
1
5.4
1
6.3
1
6.7
1
7.6
1
7.9
1
8.5
2:
6
30
-0
.136
0
15.4
83
9
0.0
782
7
12.9
1
3.4
1
3.6
1
4.3
1
4.7
1
5.5
1
6.3
1
6.8
1
7.6
1
8.0
1
8.6
2:
7
31
-0
.147
0
15.5
31
7
0.0
784
6
13.0
1
3.4
1
3.7
1
4.3
1
4.7
1
5.5
1
6.4
1
6.9
1
7.7
1
8.0
1
8.7
2:
8
32
-0
.157
8
15.5
77
1
0.0
786
6
13.0
1
3.5
1
3.7
1
4.4
1
4.8
1
5.6
1
6.4
1
6.9
1
7.8
1
8.1
1
8.8
2:
9
33
-0
.168
4
15.6
20
1
0.0
788
7
13.0
1
3.5
1
3.7
1
4.4
1
4.8
1
5.6
1
6.5
1
7.0
1
7.8
1
8.2
1
8.8
2:1
0
34
-0
.178
8
15.6
61
1
0.0
790
9
13.1
1
3.5
1
3.8
1
4.4
1
4.9
1
5.7
1
6.5
1
7.0
1
7.9
1
8.2
1
8.9
2:1
1
35
-0
.189
0
15.7
00
3
0.0
793
3
13.1
1
3.6
1
3.8
1
4.5
1
4.9
1
5.7
1
6.6
1
7.1
1
7.9
1
8.3
1
8.9
3:
0
36
-0
.198
9
15.7
38
0
0.0
795
6
13.1
1
3.6
1
3.8
1
4.5
1
4.9
1
5.7
1
6.6
1
7.1
1
8.0
1
8.3
1
9.0
3:
1
37
-0
.208
7
15.7
74
5
0.0
798
1
13.1
1
3.6
1
3.9
1
4.5
1
5.0
1
5.8
1
6.7
1
7.1
1
8.0
1
8.4
1
9.1
3:
2
38
-0
.218
4
15.8
10
1
0.0
800
6
13.2
1
3.6
1
3.9
1
4.6
1
5.0
1
5.8
1
6.7
1
7.2
1
8.1
1
8.4
1
9.1
3:
3
39
-0
.227
8
15.8
45
0
0.0
803
2
13.2
1
3.7
1
3.9
1
4.6
1
5.0
1
5.8
1
6.7
1
7.2
1
8.1
1
8.5
1
9.2
3:
4
40
-0
.237
2
15.8
79
3
0.0
805
8
13.2
1
3.7
1
3.9
1
4.6
1
5.0
1
5.9
1
6.8
1
7.3
1
8.2
1
8.5
1
9.2
3:
5
41
-0
.246
3
15.9
13
2
0.0
808
5
13.2
1
3.7
1
4.0
1
4.6
1
5.1
1
5.9
1
6.8
1
7.3
1
8.2
1
8.6
1
9.3
3:
6
42
-0
.255
3
15.9
46
7
0.0
811
2
13.3
1
3.7
1
4.0
1
4.7
1
5.1
1
5.9
1
6.9
1
7.4
1
8.3
1
8.6
1
9.3
3:
7
43
-0
.264
2
15.9
79
7
0.0
813
9
13.3
1
3.8
1
4.0
1
4.7
1
5.1
1
6.0
1
6.9
1
7.4
1
8.3
1
8.7
1
9.4
3:
8
44
-0
.273
0
16.0
12
4
0.0
816
6
13.3
1
3.8
1
4.0
1
4.7
1
5.2
1
6.0
1
6.9
1
7.4
1
8.4
1
8.7
1
9.5
3:
9
45
-0
.281
6
16.0
44
7
0.0
819
4
13.3
1
3.8
1
4.1
1
4.8
1
5.2
1
6.0
1
7.0
1
7.5
1
8.4
1
8.8
1
9.5
3:1
0
46
-0
.290
1
16.0
76
7
0.0
822
2
13.3
1
3.8
1
4.1
1
4.8
1
5.2
1
6.1
1
7.0
1
7.5
1
8.5
1
8.8
1
9.6
3:1
1
47
-0
.298
5
16.1
08
5
0.0
825
0
13.4
1
3.8
1
4.1
1
4.8
1
5.2
1
6.1
1
7.0
1
7.6
1
8.5
1
8.9
1
9.6
4:
0
48
-0
.306
7
16.1
40
0
0.0
827
8
13.4
1
3.9
1
4.1
1
4.8
1
5.3
1
6.1
1
7.1
1
7.6
1
8.5
1
8.9
1
9.7
76 Arm circumference-for-age, boys

Ta
ble
26
Arm
cir
cum
fere
nce-
for-
ag
e fo
r b
oy
s, a
ge
in y
ears
an
d m
on
ths
(co
nti
nu
ed)
P
ercen
tile
s (a
rm
cir
cu
mfe
ren
ce i
n c
m)
Yea
r: M
on
th
Mon
th
L
M
S
1st
3
rd
5
th
15th
2
5th
5
0th
7
5th
8
5th
9
5th
9
7th
9
9th
4:
1
49
-0
.314
9
16.1
71
4
0.0
830
7
13.4
1
3.9
1
4.1
1
4.9
1
5.3
1
6.2
1
7.1
1
7.6
1
8.6
1
9.0
1
9.7
4:
2
50
-0
.322
9
16.2
02
7
0.0
833
5
13.4
1
3.9
1
4.2
1
4.9
1
5.3
1
6.2
1
7.1
1
7.7
1
8.6
1
9.0
1
9.8
4:
3
51
-0
.330
9
16.2
34
0
0.0
836
4
13.4
1
3.9
1
4.2
1
4.9
1
5.4
1
6.2
1
7.2
1
7.7
1
8.7
1
9.1
1
9.9
4:
4
52
-0
.338
7
16.2
65
4
0.0
839
2
13.5
1
3.9
1
4.2
1
4.9
1
5.4
1
6.3
1
7.2
1
7.8
1
8.7
1
9.1
1
9.9
4:
5
53
-0
.346
4
16.2
96
8
0.0
842
1
13.5
1
4.0
1
4.2
1
5.0
1
5.4
1
6.3
1
7.3
1
7.8
1
8.8
1
9.2
2
0.0
4:
6
54
-0
.354
1
16.3
28
3
0.0
845
0
13.5
1
4.0
1
4.3
1
5.0
1
5.4
1
6.3
1
7.3
1
7.8
1
8.8
1
9.2
2
0.0
4:
7
55
-0
.361
6
16.3
59
9
0.0
847
9
13.5
1
4.0
1
4.3
1
5.0
1
5.5
1
6.4
1
7.3
1
7.9
1
8.9
1
9.3
2
0.1
4:
8
56
-0
.369
1
16.3
91
6
0.0
850
8
13.5
1
4.0
1
4.3
1
5.0
1
5.5
1
6.4
1
7.4
1
7.9
1
8.9
1
9.3
2
0.1
4:
9
57
-0
.376
5
16.4
23
3
0.0
853
7
13.6
1
4.1
1
4.3
1
5.1
1
5.5
1
6.4
1
7.4
1
8.0
1
9.0
1
9.4
2
0.2
4:1
0
58
-0
.383
8
16.4
55
1
0.0
856
6
13.6
1
4.1
1
4.3
1
5.1
1
5.5
1
6.5
1
7.4
1
8.0
1
9.0
1
9.4
2
0.2
4:1
1
59
-0
.391
0
16.4
87
1
0.0
859
5
13.6
1
4.1
1
4.4
1
5.1
1
5.6
1
6.5
1
7.5
1
8.1
1
9.1
1
9.5
2
0.3
5:
0
60
-0
.398
1
16.5
19
1
0.0
862
4
13.6
1
4.1
1
4.4
1
5.1
1
5.6
1
6.5
1
7.5
1
8.1
1
9.1
1
9.5
2
0.4
Arm circumference-for-age, boys 77
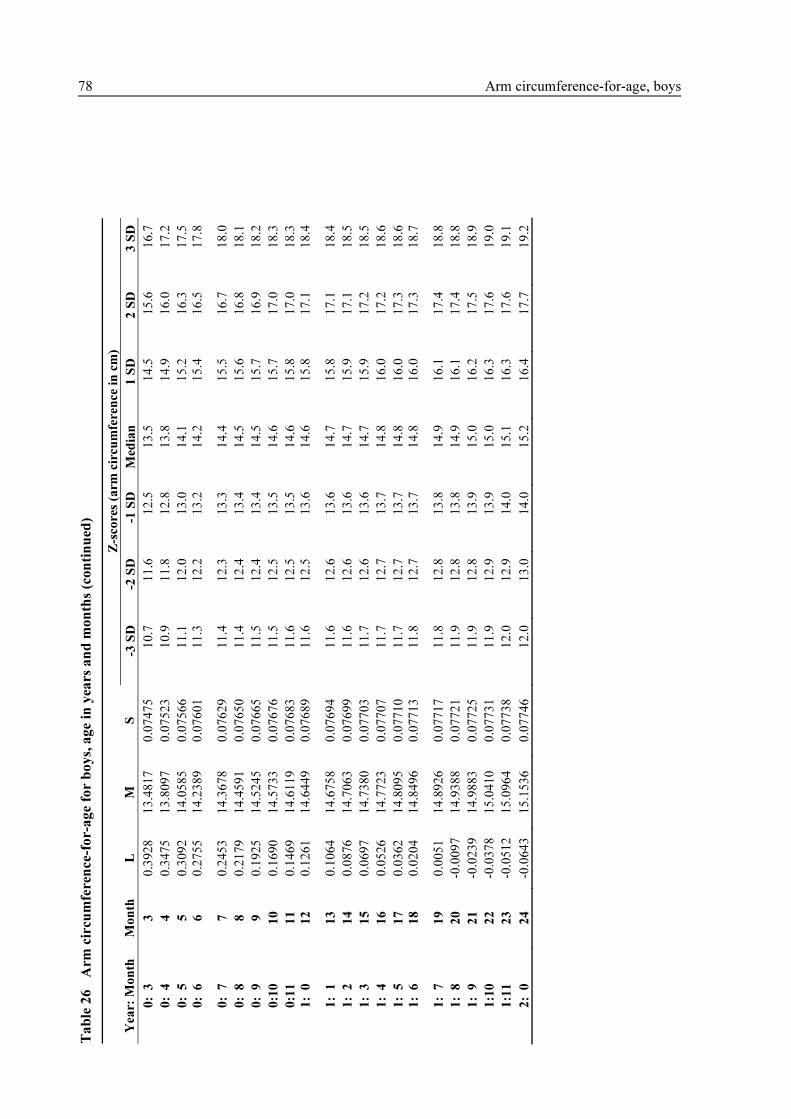
Ta
ble
26
Arm
cir
cum
fere
nce-
for-
ag
e fo
r b
oy
s, a
ge
in y
ears
an
d m
on
ths
(co
nti
nu
ed)
Z
-sco
res
(arm
cir
cu
mfe
ren
ce i
n c
m)
Yea
r: M
on
th
Mon
th
L
M
S
-3 S
D
-2 S
D
-1 S
D
Med
ian
1
SD
2
SD
3
SD
0:
3
3
0.3
928
1
3.4
81
7
0.0
747
5
10.7
1
1.6
1
2.5
1
3.5
1
4.5
1
5.6
1
6.7
0:
4
4
0.3
475
1
3.8
09
7
0.0
752
3
10.9
1
1.8
1
2.8
1
3.8
1
4.9
1
6.0
1
7.2
0:
5
5
0.3
092
1
4.0
58
5
0.0
756
6
11.1
1
2.0
1
3.0
1
4.1
1
5.2
1
6.3
1
7.5
0:
6
6
0.2
755
1
4.2
38
9
0.0
760
1
11.3
1
2.2
1
3.2
1
4.2
1
5.4
1
6.5
1
7.8
0:
7
7
0.2
453
1
4.3
67
8
0.0
762
9
11.4
1
2.3
1
3.3
1
4.4
1
5.5
1
6.7
1
8.0
0:
8
8
0.2
179
1
4.4
59
1
0.0
765
0
11.4
1
2.4
1
3.4
1
4.5
1
5.6
1
6.8
1
8.1
0:
9
9
0.1
925
1
4.5
24
5
0.0
766
5
11.5
1
2.4
1
3.4
1
4.5
1
5.7
1
6.9
1
8.2
0:1
0
10
0
.1690
1
4.5
73
3
0.0
767
6
11.5
1
2.5
1
3.5
1
4.6
1
5.7
1
7.0
1
8.3
0:1
1
11
0
.1469
1
4.6
11
9
0.0
768
3
11.6
1
2.5
1
3.5
1
4.6
1
5.8
1
7.0
1
8.3
1:
0
12
0
.1261
1
4.6
44
9
0.0
768
9
11.6
1
2.5
1
3.6
1
4.6
1
5.8
1
7.1
1
8.4
1:
1
13
0
.1064
1
4.6
75
8
0.0
769
4
11.6
1
2.6
1
3.6
1
4.7
1
5.8
1
7.1
1
8.4
1:
2
14
0
.0876
1
4.7
06
3
0.0
769
9
11.6
1
2.6
1
3.6
1
4.7
1
5.9
1
7.1
1
8.5
1:
3
15
0
.0697
1
4.7
38
0
0.0
770
3
11.7
1
2.6
1
3.6
1
4.7
1
5.9
1
7.2
1
8.5
1:
4
16
0
.0526
1
4.7
72
3
0.0
770
7
11.7
1
2.7
1
3.7
1
4.8
1
6.0
1
7.2
1
8.6
1:
5
17
0
.0362
1
4.8
09
5
0.0
771
0
11.7
1
2.7
1
3.7
1
4.8
1
6.0
1
7.3
1
8.6
1:
6
18
0
.0204
1
4.8
49
6
0.0
771
3
11.8
1
2.7
1
3.7
1
4.8
1
6.0
1
7.3
1
8.7
1:
7
19
0
.0051
1
4.8
92
6
0.0
771
7
11.8
1
2.8
1
3.8
1
4.9
1
6.1
1
7.4
1
8.8
1:
8
20
-0
.009
7
14.9
38
8
0.0
772
1
11.9
1
2.8
1
3.8
1
4.9
1
6.1
1
7.4
1
8.8
1:
9
21
-0
.023
9
14.9
88
3
0.0
772
5
11.9
1
2.8
1
3.9
1
5.0
1
6.2
1
7.5
1
8.9
1:1
0
22
-0
.037
8
15.0
41
0
0.0
773
1
11.9
1
2.9
1
3.9
1
5.0
1
6.3
1
7.6
1
9.0
1:1
1
23
-0
.051
2
15.0
96
4
0.0
773
8
12.0
1
2.9
1
4.0
1
5.1
1
6.3
1
7.6
1
9.1
2:
0
24
-0
.064
3
15.1
53
6
0.0
774
6
12.0
1
3.0
1
4.0
1
5.2
1
6.4
1
7.7
1
9.2
78 Arm circumference-for-age, boys

Ta
ble
26
Arm
cir
cum
fere
nce-
for-
ag
e fo
r b
oy
s, a
ge
in y
ears
an
d m
on
ths
(co
nti
nu
ed)
Z
-sco
res
(arm
cir
cu
mfe
ren
ce i
n c
m)
Yea
r: M
on
th
Mon
th
L
M
S
-3 S
D
-2 S
D
-1 S
D
Med
ian
1
SD
2
SD
3
SD
2:
1
25
-0
.077
0
15.2
11
5
0.0
775
5
12.1
1
3.0
1
4.1
1
5.2
1
6.4
1
7.8
1
9.2
2:
2
26
-0
.089
4
15.2
69
3
0.0
776
7
12.1
1
3.1
1
4.1
1
5.3
1
6.5
1
7.9
1
9.3
2:
3
27
-0
.101
4
15.3
25
9
0.0
778
0
12.2
1
3.1
1
4.2
1
5.3
1
6.6
1
7.9
1
9.4
2:
4
28
-0
.113
2
15.3
80
8
0.0
779
4
12.2
1
3.2
1
4.2
1
5.4
1
6.6
1
8.0
1
9.5
2:
5
29
-0
.124
8
15.4
33
6
0.0
781
0
12.3
1
3.2
1
4.3
1
5.4
1
6.7
1
8.1
1
9.6
2:
6
30
-0
.136
0
15.4
83
9
0.0
782
7
12.3
1
3.3
1
4.3
1
5.5
1
6.8
1
8.1
1
9.7
2:
7
31
-0
.147
0
15.5
31
7
0.0
784
6
12.3
1
3.3
1
4.4
1
5.5
1
6.8
1
8.2
1
9.7
2:
8
32
-0
.157
8
15.5
77
1
0.0
786
6
12.4
1
3.3
1
4.4
1
5.6
1
6.9
1
8.3
1
9.8
2:
9
33
-0
.168
4
15.6
20
1
0.0
788
7
12.4
1
3.4
1
4.4
1
5.6
1
6.9
1
8.3
1
9.9
2:1
0
34
-0
.178
8
15.6
61
1
0.0
790
9
12.4
1
3.4
1
4.5
1
5.7
1
7.0
1
8.4
2
0.0
2:1
1
35
-0
.189
0
15.7
00
3
0.0
793
3
12.4
1
3.4
1
4.5
1
5.7
1
7.0
1
8.4
2
0.0
3:
0
36
-0
.198
9
15.7
38
0
0.0
795
6
12.5
1
3.5
1
4.5
1
5.7
1
7.1
1
8.5
2
0.1
3:
1
37
-0
.208
7
15.7
74
5
0.0
798
1
12.5
1
3.5
1
4.6
1
5.8
1
7.1
1
8.6
2
0.2
3:
2
38
-0
.218
4
15.8
10
1
0.0
800
6
12.5
1
3.5
1
4.6
1
5.8
1
7.1
1
8.6
2
0.2
3:
3
39
-0
.227
8
15.8
45
0
0.0
803
2
12.5
1
3.5
1
4.6
1
5.8
1
7.2
1
8.7
2
0.3
3:
4
40
-0
.237
2
15.8
79
3
0.0
805
8
12.6
1
3.6
1
4.7
1
5.9
1
7.2
1
8.7
2
0.4
3:
5
41
-0
.246
3
15.9
13
2
0.0
808
5
12.6
1
3.6
1
4.7
1
5.9
1
7.3
1
8.8
2
0.4
3:
6
42
-0
.255
3
15.9
46
7
0.0
811
2
12.6
1
3.6
1
4.7
1
5.9
1
7.3
1
8.8
2
0.5
3:
7
43
-0
.264
2
15.9
79
7
0.0
813
9
12.6
1
3.6
1
4.7
1
6.0
1
7.4
1
8.9
2
0.6
3:
8
44
-0
.273
0
16.0
12
4
0.0
816
6
12.6
1
3.6
1
4.8
1
6.0
1
7.4
1
8.9
2
0.6
3:
9
45
-0
.281
6
16.0
44
7
0.0
819
4
12.7
1
3.7
1
4.8
1
6.0
1
7.4
1
9.0
2
0.7
3:1
0
46
-0
.290
1
16.0
76
7
0.0
822
2
12.7
1
3.7
1
4.8
1
6.1
1
7.5
1
9.0
2
0.8
3:1
1
47
-0
.298
5
16.1
08
5
0.0
825
0
12.7
1
3.7
1
4.8
1
6.1
1
7.5
1
9.1
2
0.8
4:
0
48
-0
.306
7
16.1
40
0
0.0
827
8
12.7
1
3.7
1
4.9
1
6.1
1
7.6
1
9.1
2
0.9
Arm circumference-for-age, boys 79
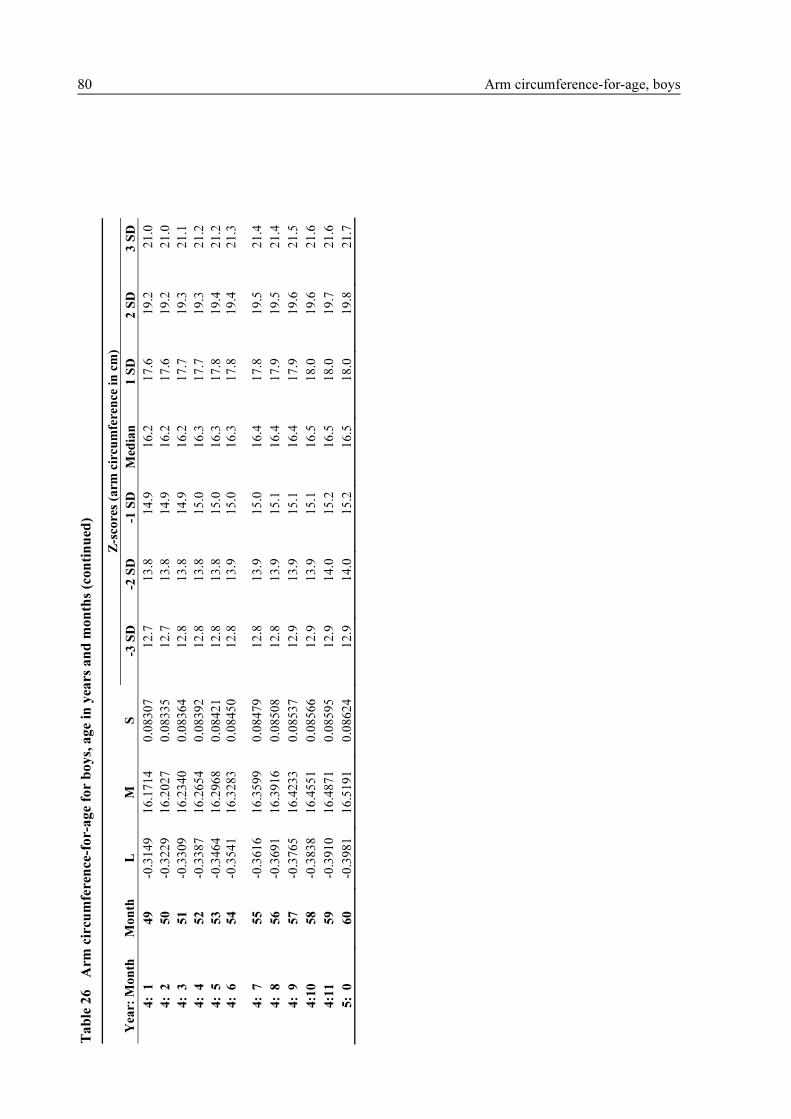
Ta
ble
26
Arm
cir
cum
fere
nce-
for-
ag
e fo
r b
oy
s, a
ge
in y
ears
an
d m
on
ths
(co
nti
nu
ed)
Z
-sco
res
(arm
cir
cu
mfe
ren
ce i
n c
m)
Yea
r: M
on
th
Mon
th
L
M
S
-3 S
D
-2 S
D
-1 S
D
Med
ian
1
SD
2
SD
3
SD
4:
1
49
-0
.314
9
16.1
71
4
0.0
830
7
12.7
1
3.8
1
4.9
1
6.2
1
7.6
1
9.2
2
1.0
4:
2
50
-0
.322
9
16.2
02
7
0.0
833
5
12.7
1
3.8
1
4.9
1
6.2
1
7.6
1
9.2
2
1.0
4:
3
51
-0
.330
9
16.2
34
0
0.0
836
4
12.8
1
3.8
1
4.9
1
6.2
1
7.7
1
9.3
2
1.1
4:
4
52
-0
.338
7
16.2
65
4
0.0
839
2
12.8
1
3.8
1
5.0
1
6.3
1
7.7
1
9.3
2
1.2
4:
5
53
-0
.346
4
16.2
96
8
0.0
842
1
12.8
1
3.8
1
5.0
1
6.3
1
7.8
1
9.4
2
1.2
4:
6
54
-0
.354
1
16.3
28
3
0.0
845
0
12.8
1
3.9
1
5.0
1
6.3
1
7.8
1
9.4
2
1.3
4:
7
55
-0
.361
6
16.3
59
9
0.0
847
9
12.8
1
3.9
1
5.0
1
6.4
1
7.8
1
9.5
2
1.4
4:
8
56
-0
.369
1
16.3
91
6
0.0
850
8
12.8
1
3.9
1
5.1
1
6.4
1
7.9
1
9.5
2
1.4
4:
9
57
-0
.376
5
16.4
23
3
0.0
853
7
12.9
1
3.9
1
5.1
1
6.4
1
7.9
1
9.6
2
1.5
4:1
0
58
-0
.383
8
16.4
55
1
0.0
856
6
12.9
1
3.9
1
5.1
1
6.5
1
8.0
1
9.6
2
1.6
4:1
1
59
-0
.391
0
16.4
87
1
0.0
859
5
12.9
1
4.0
1
5.2
1
6.5
1
8.0
1
9.7
2
1.6
5:
0
60
-0
.398
1
16.5
19
1
0.0
862
4
12.9
1
4.0
1
5.2
1
6.5
1
8.0
1
9.8
2
1.7
80 Arm circumference-for-age, boys

Arm circumference-for-age, girls 81
4.3 Arm circumference-for-age for girls
Steps similar to those described in the preceding sections were followed to select the best model to fit
the arm circumference-for-age growth curves for girls.
4.3.1 Sample size
There were a total of 10 970 arm circumference measurements for girls. The longitudinal and cross-
sectional sample sizes by visit and age are presented in Tables 27 and 28.
Table 27 Longitudinal sample sizes for arm circumference-for-age for girls
Visit 5 6 7 8 9 10
Age 3 mo 4 mo 5 mo 6 mo 7 mo 8 mo
N 437 440 447 445 444 440
Visit 11 12 13 14 15 16
Age 9 mo 10 mo 11 mo 12 mo 14 mo 16 mo
N 445 444 441 449 447 442
Visit 17 18 19 20
Age 18 mo 20 mo 22 mo 24 mo
N 445 443 434 446
Table 28 Cross-sectional sample sizes for arm circumference-for-age for girls
Age (mo) <18 18–20 21–23 24–26 27–29 30–32 33–35
N 2 159 167 238 214 227 223
Age (mo) 36–38 39–41 42–44 45–47 48–50 51–53 54–56
N 220 235 246 208 224 201 230
Age (mo) 57–59 60–62 63–65 66–68 69–71 >71
N 239 217 205 225 201 0
4.3.2 Model selection and results
The initial step in the modelling process was to search for the best age power transformation using the
same starting model as that used for boys. Table 29 shows the values of global deviance for a grid of
possible powers from 0.05 to 1. The smallest global deviance value was associated with λ=0.35, and
thus it was selected as the age-transformation power.

82 Arm circumference-for-age, girls
Table 29 Global deviance (GD) for models within the class BCPE(x=ageλ, df(µ)=9, df(σ)=4,
df(ν)=4, τ=2) for arm circumference-for-age for girls
λ 0.05 0.10 0.15 0.20 0.25 0.30 0.35 0.40 0.45 0.50
GDa
975.6 974.9 974.3 973.8 973.5 973.2 973.1 973.2 973.3 973.6
λ 0.55 0.60 0.65 0.70 0.75 0.80 0.85 0.90 0.95 1.00
GDa
974.1 974.7 975.5 976.6 978.0 979.7 981.7 984.1 986.9 990.2
a In excess of 35 000.
Using λ=0.35, optimal values for df(µ) and df(σ) were sought fixing ν=1 and τ=2. All possible
combinations of df(µ) values from 7 to 15 and df(σ) from 2 to 10 were considered. Partial results are
presented in Table 30. The smallest value of GAIC(3) corresponded to df(µ)=8 and df(σ)=4. Thus this
model was selected and further evaluated.
Table 30 Goodness-of-fit summary for models using the BCPE distribution with fixed ν=1 and
τ=2 for arm circumference-for-age for girls
df(µ) df(σ) GDa
AICa
GAIC(3)a
Total df
2 1170.7 1188.7 1197.7 9
3 1143.0 1163.0 1173.0 10
4 1133.6 1155.6 1166.6 11
5 1130.6 1154.6 1166.6 12
7
6 1129.5 1155.5 1168.5 13
2 1167.5 1187.5 1197.5 10
3 1139.6 1161.6 1172.6 11
4 1130.2 1154.2 1166.2 12
5 1127.2 1153.2 1166.2 13
8
6 1126.0 1154.0 1168.0 14
2 1165.0 1187.0 1198.0 11
3 1137.2 1161.2 1173.2 12
4 1127.6 1153.6 1166.6 13
5 1124.7 1152.7 1166.7 14
9
6 1123.5 1153.5 1168.5 15
2 1163.0 1187.0 1199.0 12
3 1135.1 1161.1 1174.1 13
4 1125.4 1153.4 1167.4 14
5 1122.4 1152.4 1167.4 15
10
6 1121.3 1153.3 1169.3 16
2 1161.0 1187.0 1200.0 13
3 1133.0 1161.0 1175.0 14
4 1123.3 1153.3 1168.3 15
5 1120.2 1152.2 1168.2 16
11
6 1119.1 1153.1 1170.1 17
GD, Global Deviance; AIC, Akaike Information Criterion;
GAIC(3), Generalized AIC with penalty equal to 3; a In excess of 35 000.
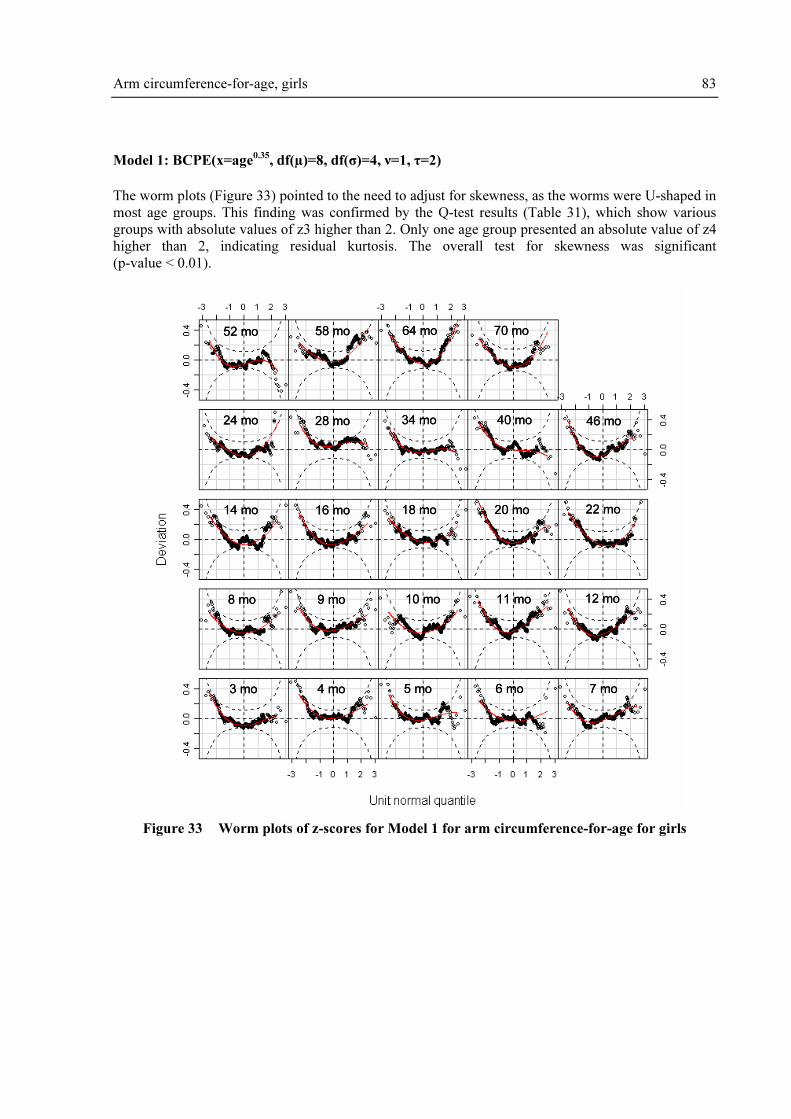
Arm circumference-for-age, girls 83
Model 1: BCPE(x=age0.35
, df(µ)=8, df(σ)=4, ν=1, τ=2)
The worm plots (Figure 33) pointed to the need to adjust for skewness, as the worms were U-shaped in
most age groups. This finding was confirmed by the Q-test results (Table 31), which show various
groups with absolute values of z3 higher than 2. Only one age group presented an absolute value of z4
higher than 2, indicating residual kurtosis. The overall test for skewness was significant
(p-value < 0.01).
3 mo 4 mo 5 mo 6 mo 7 mo
8 mo 9 mo 10 mo 11 mo 12 mo
14 mo 16 mo 18 mo 20 mo 22 mo
24 mo 28 mo 34 mo 40 mo 46 mo
52 mo 58 mo 64 mo 70 mo
3 mo 4 mo 5 mo 6 mo 7 mo
8 mo 9 mo 10 mo 11 mo 12 mo
14 mo 16 mo 18 mo 20 mo 22 mo
24 mo 28 mo 34 mo 40 mo 46 mo
52 mo 58 mo 64 mo 70 mo
3 mo 4 mo 5 mo 6 mo 7 mo
8 mo 9 mo 10 mo 11 mo 12 mo
14 mo 16 mo 18 mo 20 mo 22 mo
24 mo 28 mo 34 mo 40 mo 46 mo
52 mo 58 mo 64 mo 70 mo
Figure 33 Worm plots of z-scores for Model 1 for arm circumference-for-age for girls

84 Arm circumference-for-age, girls
Table 31 Q-test for z-scores from Model 1 [BCPE(x=age0.35
, df(µ)=8, df(σ)=4, ν=1, τ=2)] for arm
circumference-for-age for girls
Age (days) Group N z1 z2 z3 z4
83 to 99 3 mo 430 -0.92 -0.67 2.23 -0.68
100 to 129 4 mo 440 0.82 -0.06 2.15 -0.19
130 to 159 5 mo 441 0.29 -0.15 1.76 -0.81
160 to 189 6 mo 441 -0.10 -0.52 1.91 0.68
190 to 219 7 mo 432 0.28 1.13 1.51 -0.87
220 to 249 8 mo 435 -0.32 0.24 2.18 0.27
250 to 279 9 mo 438 0.47 0.00 1.85 -0.17
280 to 309 10 mo 444 -0.42 0.42 2.38 0.26
310 to 349 11 mo 477 0.67 0.91 2.82 -0.71
350 to 379 12 mo 451 -0.42 1.03 2.45 -0.71
380 to 439 14 mo 444 -0.26 -0.18 2.92 0.63
440 to 499 16 mo 444 -0.31 -0.02 2.73 -0.04
500 to 559 18 mo 467 0.09 -0.56 2.32 0.56
560 to 619 20 mo 543 0.28 -0.67 3.44 -0.42
620 to 679 22 mo 538 -0.42 -0.86 3.71 1.58
680 to 749 24 mo 592 -0.64 0.69 3.52 1.82
750 to 929 28 mo 456 1.53 -0.29 1.26 -1.54
930 to 1119 34 mo 470 -0.15 -0.58 1.16 -1.50
1120 to 1309 40 mo 475 0.27 -1.67 1.23 -1.12
1310 to 1499 46 mo 453 -0.44 0.66 2.54 -1.16
1500 to 1689 52 mo 451 -1.09 -0.31 0.94 -2.38
1690 to 1879 58 mo 494 0.67 1.10 2.98 0.48
1880 to 2069 64 mo 418 0.52 0.48 3.78 1.49
2070 to 2191 70 mo 296 -0.42 0.16 2.77 0.90
Overall Q stats 10 970 8.35 11.36 148.40 26.39
degrees of freedom 16.0 21.5 24.0 24.0
p-value 0.9376 0.9629 < 0.01 0.3338
Note: Absolute values of z1, z2, z3 or z4 larger than 2 indicate misfit of, respectively, mean, variance,
skewness or kurtosis.
The next step involved fitting the parameter ν for skewness using the BCPE distribution with fixed
parameter τ=2 and keeping the degrees of freedom for the µ and σ curves selected for Model 1.
Table 32 shows the GAIC(3) values for various degrees of freedom for the ν curve.

Arm circumference-for-age, girls 85
Table 32 Goodness-of-fit summary for models BCPE(x=age0.35
, df(µ)=8, df(σ)=4, df(ν)=?, τ=2)
for arm circumference-for-age for girls
df(ν) GDa
GAIC(3)a
Total df
1 978.9 1018.0 13
2 978.9 1020.9 14
3 977.7 1022.8 15
4 975.6 1023.6 16
5 973.8 1024.8 17
6 972.8 1026.8 18
7 972.2 1029.2 19
GD, Global Deviance; GAIC(3), Generalized Akaike Information
Criterion with penalty equal to 3; a In excess of 35 000.
The smallest GAIC(3) value corresponded to df(ν)=1 (i.e. fitting a constant for the ν curve). A new
iteration was performed using df(ν)=1 to re-search for df(µ) and df(σ). The best combination remained
df(µ)=8 and df(σ)=4. A new search for the best age-transformation power λ using this model was
carried out but results indicated no need to update the model. The model with λ=0.35, df(µ)=8,
df(σ)=4 and df(ν)=1 was thus further evaluated.
Model 2: BCPE(x= age0.35
, df(µ)=8, df(σ)=4, df(ν)=1, τ=2)
Figure 34 shows the fitting of the parameters µ, σ and ν for Model 2 with their respective sample
estimates, that is, the median for µ and Box-Cox transform power for ν. The fitted curve for σ ignores
a dip in the sample between 30 and 39 months, but overall the degree of smoothness for this parameter
seemed adequate. Similarly, the ν curve fitting smoothed out the zigzagging of empirical values.
Figures 35 and 36 show the distribution of differences between empirical values and fitted centiles for
the longitudinal and cross-sectional samples, respectively. There was some indication of bias in the 3rd
centile between 3 and 24 months (Figure 35) and also between 24 and 71 months, the average bias
being between 1 mm and 2 mm (Figure 36).
The worm plots for this model (Figure 37) were better conformed to a flat shape than the significant
deviations depicted by those from Model 1 (Figure 33). There was no indication of remaining
skewness or kurtosis.
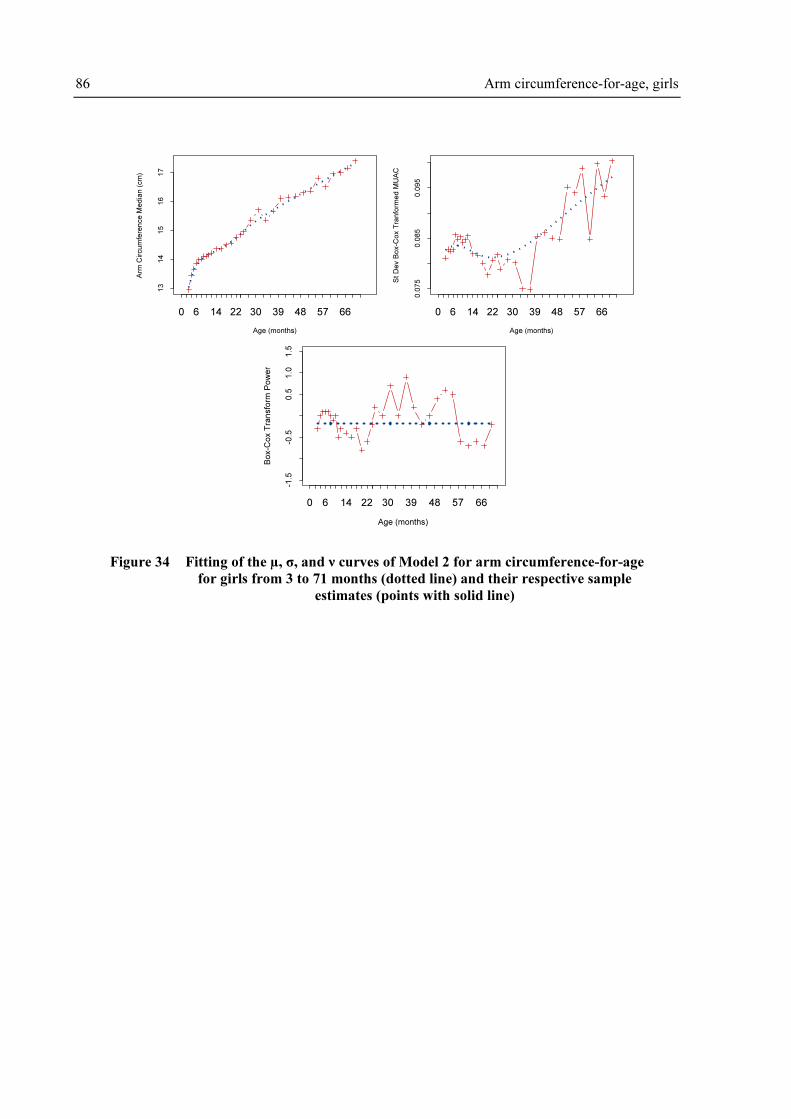
86 Arm circumference-for-age, girls
Age (months)
Arm
Cir
cu
mfe
ren
ce
Me
dia
n (
cm
)
13
14
15
16
17
0 6 14 22 30 39 48 57 66
Age (months)
St D
ev B
ox-C
ox T
ran
form
ed
MU
AC
0.0
75
0.0
85
0.0
95
0 6 14 22 30 39 48 57 66
Age (months)
Bo
x-C
ox T
ran
sfo
rm P
ow
er
-1.5
-0.5
0.5
1.0
1.5
0 6 14 22 30 39 48 57 66
Figure 34 Fitting of the µ, σ, and ν curves of Model 2 for arm circumference-for-age
for girls from 3 to 71 months (dotted line) and their respective sample
estimates (points with solid line)

Arm circumference-for-age, girls 87
3rd Centile
-0.2
0.0
0.2
4 6 8 10 14 18 22
5th Centile
-0.2
0.0
0.2
4 6 8 10 14 18 22
10th Centile
-0.2
0.0
0.2
4 6 8 10 14 18 22
25th Centile
-0.2
0.0
0.2
4 6 8 10 14 18 22
50th Centile
-0.2
0.0
0.2
4 6 8 10 14 18 22
75th Centile
-0.2
0.0
0.2
4 6 8 10 14 18 22
90th Centile
-0.2
0.0
0.2
4 6 8 10 14 18 22
95th Centile
-0.2
0.0
0.2
4 6 8 10 14 18 22
97th Centile
-0.2
0.0
0.2
4 6 8 10 14 18 22
Age (months)
Em
piric
al-F
itte
d C
en
tile
fo
r A
rm C
ircu
mfe
ren
ce
(cm
)
Figure 35 Centile residuals from fitting Model 2 for arm circumference-for-age
from 3 to 24 months for girls
3rd Centile
-0.4
0.0
0.4
25 31 37 43 49 55 61 67
5th Centile
-0.4
0.0
0.4
25 31 37 43 49 55 61 67
10th Centile
-0.4
0.0
0.4
25 31 37 43 49 55 61 67
25th Centile
-0.4
0.0
0.4
25 31 37 43 49 55 61 67
50th Centile
-0.4
0.0
0.4
25 31 37 43 49 55 61 67
75th Centile
-0.4
0.0
0.4
25 31 37 43 49 55 61 67
90th Centile
-0.4
0.0
0.4
25 31 37 43 49 55 61 67
95th Centile
-0.4
0.0
0.4
25 31 37 43 49 55 61 67
97th Centile
-0.4
0.0
0.4
25 31 37 43 49 55 61 67
Age (months)
Em
piric
al-F
itte
d C
en
tile
fo
r A
rm C
ircu
mfe
ren
ce
(cm
)
Figure 36 Centile residuals from fitting Model 2 for arm circumference-for-age
from 24 to 71 months for girls

88 Arm circumference-for-age, girls
3 mo 4 mo 5 mo 6 mo 7 mo
8 mo 9 mo 10 mo 11 mo 12 mo
14 mo 16 mo 18 mo 20 mo 22 mo
24 mo 28 mo 34 mo 40 mo 46 mo
52 mo 58 mo 64 mo 70 mo
3 mo 4 mo 5 mo 6 mo 7 mo
8 mo 9 mo 10 mo 11 mo 12 mo
14 mo 16 mo 18 mo 20 mo 22 mo
24 mo 28 mo 34 mo 40 mo 46 mo
52 mo 58 mo 64 mo 70 mo
3 mo 4 mo 5 mo 6 mo 7 mo
8 mo 9 mo 10 mo 11 mo 12 mo
14 mo 16 mo 18 mo 20 mo 22 mo
24 mo 28 mo 34 mo 40 mo 46 mo
52 mo 58 mo 64 mo 70 mo
Figure 37 Worm plots of z-scores for Model 2 for arm circumference-for-age for girls
The Q-test results from Model 2 are shown in Table 33. Only one age group (46 mo) had a z4 absolute
value larger than 2, suggesting remaining kurtosis. The overall Q-test p-values were all non-significant,
indicating an adequate fit of the girls' arm circumference-for-age curves. There was thus no need for
modelling τ to adjust for kurtosis.
Table 34 presents observed percentages with arm circumferences below the fitted centiles. As was the
case for the boys, no systematic bias was detected.

Arm circumference-for-age, girls 89
Table 33 Q-test for z-scores from Model 2 [BCPE(x=age0.35
, df(µ)=8, df(σ)=4, df(ν)=1, τ=2)] for
arm circumference-for-age for girls
Age (days) Group N z1 z2 z3 z4
83 to 99 3 mo 430 -0.98 -0.61 0.15 -1.25
100 to 129 4 mo 440 0.77 -0.20 -0.12 -0.79
130 to 159 5 mo 441 0.28 -0.15 -0.41 -1.25
160 to 189 6 mo 441 -0.05 -0.46 -0.52 -0.38
190 to 219 7 mo 432 0.25 1.20 -0.74 -1.34
220 to 249 8 mo 435 -0.25 0.31 -0.26 -0.17
250 to 279 9 mo 438 0.57 0.01 -0.46 -0.74
280 to 309 10 mo 444 -0.34 0.49 -0.09 -0.08
310 to 349 11 mo 477 0.73 0.74 0.57 -1.37
350 to 379 12 mo 451 -0.40 1.08 0.21 -1.25
380 to 439 14 mo 444 -0.22 -0.21 0.58 -0.33
440 to 499 16 mo 444 -0.34 -0.02 0.54 -1.00
500 to 559 18 mo 467 0.06 -0.51 -0.11 -0.22
560 to 619 20 mo 543 0.25 -0.85 1.25 -1.55
620 to 679 22 mo 538 -0.43 -0.95 1.09 0.19
680 to 749 24 mo 592 -0.73 0.69 0.48 0.55
750 to 929 28 mo 456 1.51 -0.35 -0.84 -1.35
930 to 1119 34 mo 470 -0.25 -0.41 -0.98 -1.54
1120 to 1309 40 mo 475 0.27 -1.59 -0.95 -1.38
1310 to 1499 46 mo 453 -0.52 0.63 0.35 -2.09
1500 to 1689 52 mo 451 -1.03 0.08 -1.24 -1.95
1690 to 1879 58 mo 494 0.70 0.98 -0.03 0.31
1880 to 2069 64 mo 418 0.59 0.21 1.01 0.32
2070 to 2191 70 mo 296 -0.35 0.19 0.41 0.08
Overall Q stats 10 970 8.56 10.83 10.72 28.08
degrees of freedom 16.0 21.5 23.0 24.0
p-value 0.9306 0.9720 0.9859 0.2569
Note: Absolute values of z1, z2, z3 or z4 larger than 2 indicate misfit of, respectively, mean, variance,
skewness or kurtosis.
In conclusion, the model selected for constructing the arm circumference-for-age growth curves for
girls was BCPE(x=age0.35, df(µ)=8, df(σ)=4, df(ν)=1, τ=2) that adjusts only for skewness, and thus
reduces to the LMS method. The fitted centile curves and empirical centiles are shown in Figures 38 to
41.
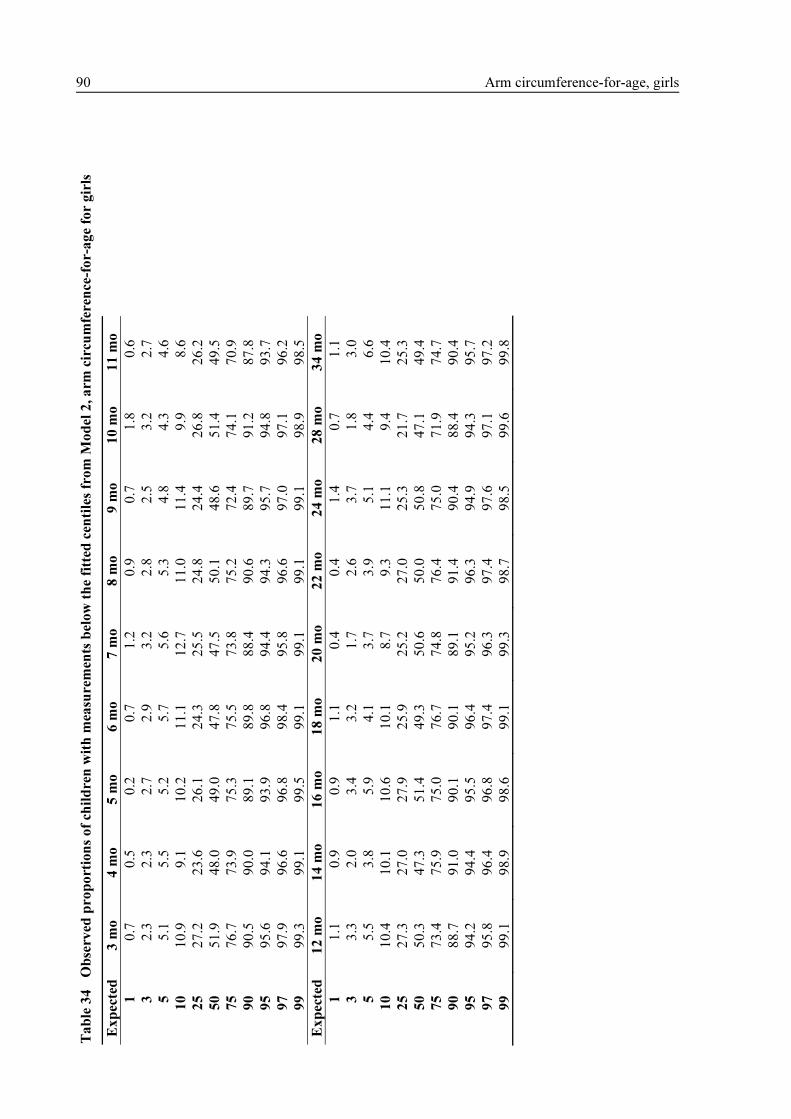
Ta
ble
34
Ob
serv
ed p
ro
po
rtio
ns
of
chil
dre
n w
ith
mea
surem
ents
bel
ow
th
e fi
tted
cen
tile
s fr
om
Mo
del
2, a
rm c
ircu
mfe
ren
ce-f
or-
ag
e fo
r g
irls
Ex
pec
ted
3
mo
4
mo
5
mo
6
mo
7
mo
8
mo
9
mo
1
0 m
o
11
mo
1
0.7
0
.5
0.2
0
.7
1.2
0
.9
0.7
1
.8
0.6
3
2.3
2
.3
2.7
2
.9
3.2
2
.8
2.5
3
.2
2.7
5
5.1
5
.5
5.2
5
.7
5.6
5
.3
4.8
4
.3
4.6
10
1
0.9
9
.1
10
.2
11
.1
12
.7
11
.0
11
.4
9.9
8
.6
25
2
7.2
2
3.6
2
6.1
2
4.3
2
5.5
2
4.8
2
4.4
2
6.8
2
6.2
50
5
1.9
4
8.0
4
9.0
4
7.8
4
7.5
5
0.1
4
8.6
5
1.4
4
9.5
75
7
6.7
7
3.9
7
5.3
7
5.5
7
3.8
7
5.2
7
2.4
7
4.1
7
0.9
90
9
0.5
9
0.0
8
9.1
8
9.8
8
8.4
9
0.6
8
9.7
9
1.2
8
7.8
95
9
5.6
9
4.1
9
3.9
9
6.8
9
4.4
9
4.3
9
5.7
9
4.8
9
3.7
97
9
7.9
9
6.6
9
6.8
9
8.4
9
5.8
9
6.6
9
7.0
9
7.1
9
6.2
99
9
9.3
9
9.1
9
9.5
9
9.1
9
9.1
9
9.1
9
9.1
9
8.9
9
8.5
Ex
pec
ted
1
2 m
o
14
mo
1
6 m
o
18
mo
2
0 m
o
22
mo
2
4 m
o
28
mo
3
4 m
o
1
1.1
0
.9
0.9
1
.1
0.4
0
.4
1.4
0
.7
1.1
3
3.3
2
.0
3.4
3
.2
1.7
2
.6
3.7
1
.8
3.0
5
5.5
3
.8
5.9
4
.1
3.7
3
.9
5.1
4
.4
6.6
10
1
0.4
1
0.1
1
0.6
1
0.1
8
.7
9.3
1
1.1
9
.4
10
.4
25
2
7.3
2
7.0
2
7.9
2
5.9
2
5.2
2
7.0
2
5.3
2
1.7
2
5.3
50
5
0.3
4
7.3
5
1.4
4
9.3
5
0.6
5
0.0
5
0.8
4
7.1
4
9.4
75
7
3.4
7
5.9
7
5.0
7
6.7
7
4.8
7
6.4
7
5.0
7
1.9
7
4.7
90
8
8.7
9
1.0
9
0.1
9
0.1
8
9.1
9
1.4
9
0.4
8
8.4
9
0.4
95
9
4.2
9
4.4
9
5.5
9
6.4
9
5.2
9
6.3
9
4.9
9
4.3
9
5.7
97
9
5.8
9
6.4
9
6.8
9
7.4
9
6.3
9
7.4
9
7.6
9
7.1
9
7.2
99
9
9.1
9
8.9
9
8.6
9
9.1
9
9.3
9
8.7
9
8.5
9
9.6
9
9.8
90 Arm circumference-for-age, girls

Ta
ble
34
Ob
serv
ed p
ro
po
rtio
ns
of
chil
dre
n w
ith
mea
surem
ents
bel
ow
th
e fi
tted
cen
tile
s fr
om
Mo
del
2, a
rm c
ircu
mfe
ren
ce-f
or-
ag
e fo
r g
irls
(co
nt)
Ex
pec
ted
4
0 m
o
46
mo
5
2 m
o
58
mo
6
4 m
o
70
mo
O
ver
all
1
0.6
0
.7
1.3
1
.4
0.5
1
.0
0.9
3
2.1
3
.1
2.7
3
.4
2.6
2
.7
2.8
5
3.6
5
.7
6.0
5
.3
5.0
4
.4
4.9
10
9
.9
11
.5
12
.6
10
.3
9.1
1
1.1
1
0.4
25
2
6.5
2
7.4
2
7.1
2
3.7
2
4.4
2
5.3
2
5.7
50
4
7.6
5
1.0
5
1.7
5
0.4
4
9.0
5
0.7
4
9.6
75
7
7.1
7
3.3
7
4.9
7
3.9
7
4.9
7
5.7
7
4.6
90
9
1.6
8
9.4
9
0.7
8
7.0
8
9.5
8
9.9
8
9.8
95
9
5.8
9
5.1
9
5.3
9
2.9
9
3.8
9
4.3
9
4.9
97
9
7.1
9
6.7
9
8.4
9
5.5
9
5.9
9
6.3
9
6.9
99
9
9.6
9
9.1
9
9.8
9
9.0
9
8.6
9
9.3
9
9.1
No
te:
Gro
up l
abel
s co
rres
pond
to t
he
age
inte
rval
s in
Tab
le 3
3.
Arm circumference-for-age, girls 91

Ag
e (
mo
nth
s)
Arm Circumference (cm)
121314151617
36
91
21
51
82
12
4
3rd
10th
50th
90th
97th
Fitte
d
Em
pir
ica
l
Fig
ure
38
3rd
, 1
0th
, 5
0th
, 9
0th
, 9
7th
sm
oo
thed
cen
tile
cu
rves
an
d e
mp
iric
al
va
lues
: arm
cir
cum
fere
nce
-fo
r-a
ge
for
gir
ls f
rom
3 t
o 2
4 m
on
ths
92 Arm circumference-for-age, girls

Ag
e (
mo
nth
s)
Arm Circumference (cm)
121314151617
36
912
15
18
21
24
5th
25th
50th
75th
95th
Fitte
d
Em
piric
al
Fig
ure
39
5th
, 2
5th
, 5
0th
, 7
5th
, 9
5th
sm
oo
thed
cen
tile
cu
rves
an
d e
mp
iric
al
va
lues
: arm
cir
cum
fere
nce
-fo
r-a
ge
for
gir
ls f
rom
3 t
o 2
4 m
on
ths
Arm circumference-for-age, girls 93

Ag
e (
mo
nth
s)
Arm Circumference (cm)
14161820
24
27
30
33
36
39
42
45
48
51
54
57
60
63
66
69
72
3rd
10th
50th
90th
97th
Fitte
d
Em
pir
ica
l
Fig
ure
40
3rd
, 1
0th
, 5
0th
, 9
0th
, 9
7th
sm
oo
thed
cen
tile
cu
rves
an
d e
mp
iric
al
va
lues
: arm
cir
cum
fere
nce
-fo
r-a
ge
for
gir
ls f
rom
24
to
71 m
on
ths
94 Arm circumference-for-age, girls

Ag
e (
mo
nth
s)
Arm Circumference (cm)
14161820
24
27
30
33
36
39
42
45
48
51
54
57
60
63
66
69
72
5th
25th
50th
75th
95th
Fitte
d
Em
pir
ica
l
Fig
ure
41
5th
, 2
5th
, 5
0th
, 7
5th
, 9
5th
sm
oo
thed
cen
tile
cu
rves
an
d e
mp
iric
al
va
lues
: arm
cir
cum
fere
nce
-fo
r-a
ge
for
gir
ls f
rom
24
to
71 m
on
ths
Arm circumference-for-age, girls 95

96 Arm circumference-for-age, girls
4.3.3 WHO standards
This section presents the final WHO arm circumference-for-age z-score and percentile charts (Figures
42 and 43) and table (Table 35) for girls.

Ch
arts
Ag
e (
mo
nth
s)
Arm Circumference (cm)
10121416182022
24
68
12
16
20
24
28
32
36
40
44
48
52
56
60
123 0 -1 -2 -3
Fig
ure
42
WH
O a
rm c
ircu
mfe
ren
ce-f
or-
ag
e z-
sco
res
for
gir
ls f
rom
3 t
o 6
0 m
on
ths
Arm circumference-for-age, girls 97
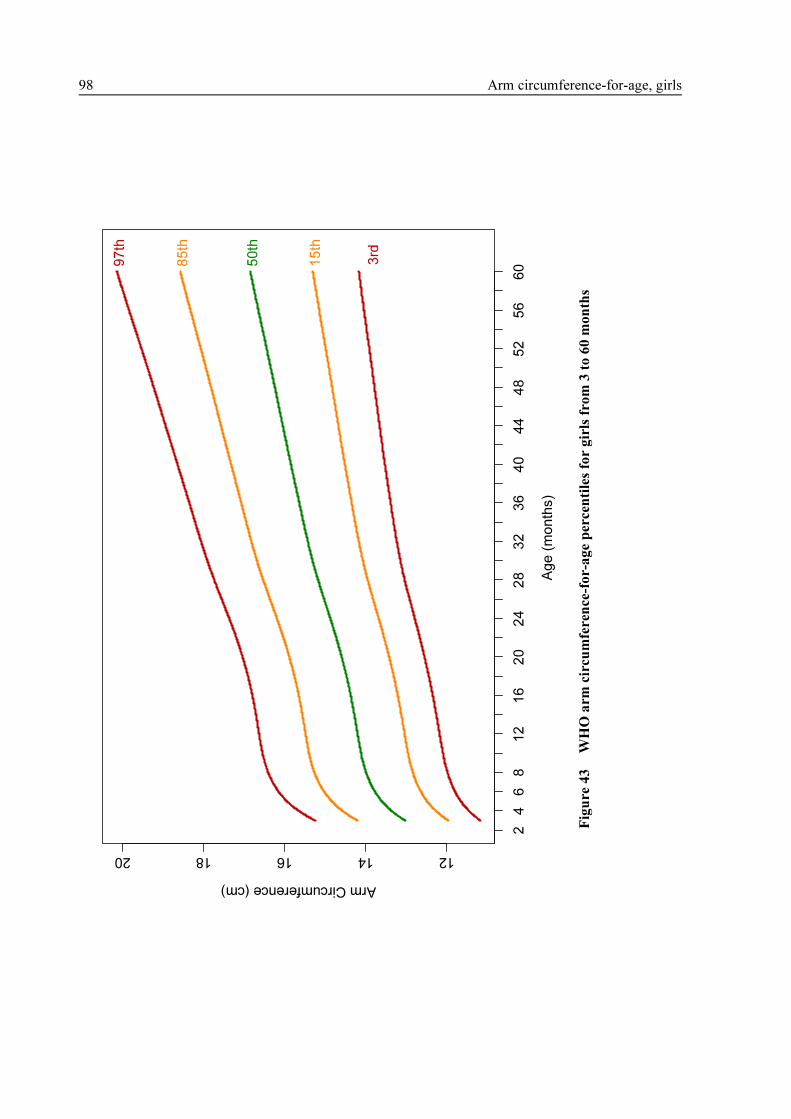
Ag
e (
mo
nth
s)
Arm Circumference (cm)
1214161820
24
68
12
16
20
24
28
32
36
40
44
48
52
56
60
3rd
50
th
97
th
15
th
85
th
Fig
ure
43
WH
O a
rm c
ircu
mfe
ren
ce-f
or-
ag
e p
ercen
tile
s fo
r g
irls
fro
m 3
to
60
mo
nth
s
98 Arm circumference-for-age, girls
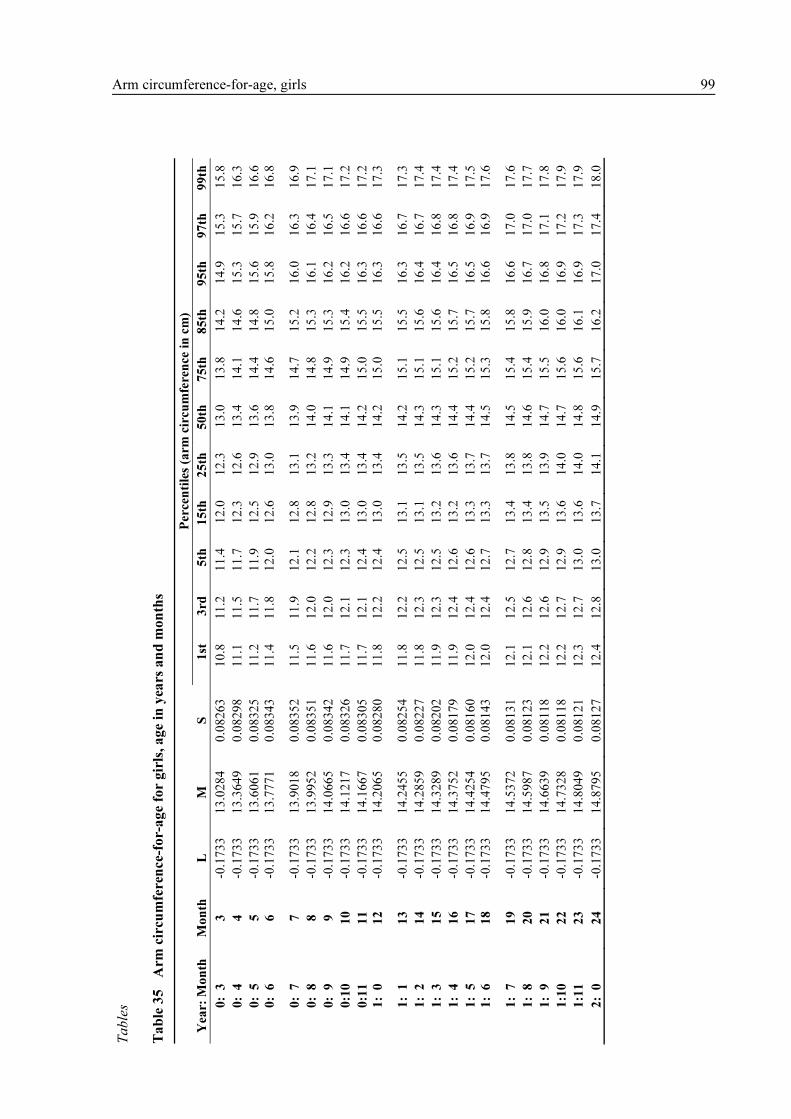
Ta
ble
s
Ta
ble
35
Arm
cir
cum
fere
nce-
for-
ag
e fo
r g
irls
, a
ge
in y
ears
an
d m
on
ths
P
ercen
tile
s (a
rm
cir
cu
mfe
ren
ce i
n c
m)
Yea
r: M
on
th
Mon
th
L
M
S
1st
3
rd
5
th
15th
2
5th
5
0th
7
5th
8
5th
9
5th
9
7th
9
9th
0:
3
3
-0.1
73
3
13.0
28
4
0.0
826
3
10.8
1
1.2
1
1.4
1
2.0
1
2.3
1
3.0
1
3.8
1
4.2
1
4.9
1
5.3
1
5.8
0:
4
4
-0.1
73
3
13.3
64
9
0.0
829
8
11.1
1
1.5
1
1.7
1
2.3
1
2.6
1
3.4
1
4.1
1
4.6
1
5.3
1
5.7
1
6.3
0:
5
5
-0.1
73
3
13.6
06
1
0.0
832
5
11.2
1
1.7
1
1.9
1
2.5
1
2.9
1
3.6
1
4.4
1
4.8
1
5.6
1
5.9
1
6.6
0:
6
6
-0.1
73
3
13.7
77
1
0.0
834
3
11.4
1
1.8
1
2.0
1
2.6
1
3.0
1
3.8
1
4.6
1
5.0
1
5.8
1
6.2
1
6.8
0:
7
7
-0.1
73
3
13.9
01
8
0.0
835
2
11.5
1
1.9
1
2.1
1
2.8
1
3.1
1
3.9
1
4.7
1
5.2
1
6.0
1
6.3
1
6.9
0:
8
8
-0.1
73
3
13.9
95
2
0.0
835
1
11.6
1
2.0
1
2.2
1
2.8
1
3.2
1
4.0
1
4.8
1
5.3
1
6.1
1
6.4
1
7.1
0:
9
9
-0.1
73
3
14.0
66
5
0.0
834
2
11.6
1
2.0
1
2.3
1
2.9
1
3.3
1
4.1
1
4.9
1
5.3
1
6.2
1
6.5
1
7.1
0:1
0
10
-0
.173
3
14.1
21
7
0.0
832
6
11.7
1
2.1
1
2.3
1
3.0
1
3.4
1
4.1
1
4.9
1
5.4
1
6.2
1
6.6
1
7.2
0:1
1
11
-0
.173
3
14.1
66
7
0.0
830
5
11.7
1
2.1
1
2.4
1
3.0
1
3.4
1
4.2
1
5.0
1
5.5
1
6.3
1
6.6
1
7.2
1:
0
12
-0
.173
3
14.2
06
5
0.0
828
0
11.8
1
2.2
1
2.4
1
3.0
1
3.4
1
4.2
1
5.0
1
5.5
1
6.3
1
6.6
1
7.3
1:
1
13
-0
.173
3
14.2
45
5
0.0
825
4
11.8
1
2.2
1
2.5
1
3.1
1
3.5
1
4.2
1
5.1
1
5.5
1
6.3
1
6.7
1
7.3
1:
2
14
-0
.173
3
14.2
85
9
0.0
822
7
11.8
1
2.3
1
2.5
1
3.1
1
3.5
1
4.3
1
5.1
1
5.6
1
6.4
1
6.7
1
7.4
1:
3
15
-0
.173
3
14.3
28
9
0.0
820
2
11.9
1
2.3
1
2.5
1
3.2
1
3.6
1
4.3
1
5.1
1
5.6
1
6.4
1
6.8
1
7.4
1:
4
16
-0
.173
3
14.3
75
2
0.0
817
9
11.9
1
2.4
1
2.6
1
3.2
1
3.6
1
4.4
1
5.2
1
5.7
1
6.5
1
6.8
1
7.4
1:
5
17
-0
.173
3
14.4
25
4
0.0
816
0
12.0
1
2.4
1
2.6
1
3.3
1
3.7
1
4.4
1
5.2
1
5.7
1
6.5
1
6.9
1
7.5
1:
6
18
-0
.173
3
14.4
79
5
0.0
814
3
12.0
1
2.4
1
2.7
1
3.3
1
3.7
1
4.5
1
5.3
1
5.8
1
6.6
1
6.9
1
7.6
1:
7
19
-0
.173
3
14.5
37
2
0.0
813
1
12.1
1
2.5
1
2.7
1
3.4
1
3.8
1
4.5
1
5.4
1
5.8
1
6.6
1
7.0
1
7.6
1:
8
20
-0
.173
3
14.5
98
7
0.0
812
3
12.1
1
2.6
1
2.8
1
3.4
1
3.8
1
4.6
1
5.4
1
5.9
1
6.7
1
7.0
1
7.7
1:
9
21
-0
.173
3
14.6
63
9
0.0
811
8
12.2
1
2.6
1
2.9
1
3.5
1
3.9
1
4.7
1
5.5
1
6.0
1
6.8
1
7.1
1
7.8
1:1
0
22
-0
.173
3
14.7
32
8
0.0
811
8
12.2
1
2.7
1
2.9
1
3.6
1
4.0
1
4.7
1
5.6
1
6.0
1
6.9
1
7.2
1
7.9
1:1
1
23
-0
.173
3
14.8
04
9
0.0
812
1
12.3
1
2.7
1
3.0
1
3.6
1
4.0
1
4.8
1
5.6
1
6.1
1
6.9
1
7.3
1
7.9
2:
0
24
-0
.173
3
14.8
79
5
0.0
812
7
12.4
1
2.8
1
3.0
1
3.7
1
4.1
1
4.9
1
5.7
1
6.2
1
7.0
1
7.4
1
8.0
Arm circumference-for-age, girls 99

Ta
ble
35
Arm
cir
cum
fere
nce-
for-
ag
e fo
r g
irls
, a
ge
in y
ears
an
d m
on
ths
(co
nti
nu
ed)
P
ercen
tile
s (a
rm
cir
cu
mfe
ren
ce i
n c
m)
Yea
r: M
on
th
Mon
th
L
M
S
1st
3
rd
5
th
15th
2
5th
5
0th
7
5th
8
5th
9
5th
9
7th
9
9th
2:
1
25
-0
.173
3
14.9
55
9
0.0
813
6
12.4
1
2.9
1
3.1
1
3.8
1
4.2
1
5.0
1
5.8
1
6.3
1
7.1
1
7.5
1
8.1
2:
2
26
-0
.173
3
15.0
32
7
0.0
814
7
12.5
1
2.9
1
3.2
1
3.8
1
4.2
1
5.0
1
5.9
1
6.4
1
7.2
1
7.6
1
8.2
2:
3
27
-0
.173
3
15.1
08
5
0.0
816
1
12.5
1
3.0
1
3.2
1
3.9
1
4.3
1
5.1
1
6.0
1
6.5
1
7.3
1
7.7
1
8.3
2:
4
28
-0
.173
3
15.1
81
7
0.0
817
8
12.6
1
3.0
1
3.3
1
4.0
1
4.4
1
5.2
1
6.0
1
6.5
1
7.4
1
7.7
1
8.4
2:
5
29
-0
.173
3
15.2
51
4
0.0
819
6
12.6
1
3.1
1
3.3
1
4.0
1
4.4
1
5.3
1
6.1
1
6.6
1
7.5
1
7.8
1
8.5
2:
6
30
-0
.173
3
15.3
16
8
0.0
821
7
12.7
1
3.2
1
3.4
1
4.1
1
4.5
1
5.3
1
6.2
1
6.7
1
7.6
1
7.9
1
8.6
2:
7
31
-0
.173
3
15.3
77
9
0.0
824
0
12.7
1
3.2
1
3.4
1
4.1
1
4.6
1
5.4
1
6.3
1
6.8
1
7.6
1
8.0
1
8.7
2:
8
32
-0
.173
3
15.4
35
1
0.0
826
5
12.8
1
3.2
1
3.5
1
4.2
1
4.6
1
5.4
1
6.3
1
6.8
1
7.7
1
8.1
1
8.8
2:
9
33
-0
.173
3
15.4
89
5
0.0
829
2
12.8
1
3.3
1
3.5
1
4.2
1
4.7
1
5.5
1
6.4
1
6.9
1
7.8
1
8.1
1
8.8
2:1
0
34
-0
.173
3
15.5
42
3
0.0
832
0
12.8
1
3.3
1
3.6
1
4.3
1
4.7
1
5.5
1
6.4
1
7.0
1
7.9
1
8.2
1
8.9
2:1
1
35
-0
.173
3
15.5
94
1
0.0
835
1
12.9
1
3.4
1
3.6
1
4.3
1
4.7
1
5.6
1
6.5
1
7.0
1
7.9
1
8.3
1
9.0
3:
0
36
-0
.173
3
15.6
45
6
0.0
838
3
12.9
1
3.4
1
3.7
1
4.4
1
4.8
1
5.6
1
6.6
1
7.1
1
8.0
1
8.4
1
9.1
3:
1
37
-0
.173
3
15.6
96
9
0.0
841
6
12.9
1
3.4
1
3.7
1
4.4
1
4.8
1
5.7
1
6.6
1
7.1
1
8.1
1
8.4
1
9.2
3:
2
38
-0
.173
3
15.7
48
3
0.0
845
1
13.0
1
3.5
1
3.7
1
4.4
1
4.9
1
5.7
1
6.7
1
7.2
1
8.1
1
8.5
1
9.2
3:
3
39
-0
.173
3
15.7
99
7
0.0
848
7
13.0
1
3.5
1
3.8
1
4.5
1
4.9
1
5.8
1
6.7
1
7.3
1
8.2
1
8.6
1
9.3
3:
4
40
-0
.173
3
15.8
50
9
0.0
852
5
13.0
1
3.5
1
3.8
1
4.5
1
5.0
1
5.9
1
6.8
1
7.3
1
8.3
1
8.6
1
9.4
3:
5
41
-0
.173
3
15.9
01
6
0.0
856
3
13.1
1
3.6
1
3.8
1
4.6
1
5.0
1
5.9
1
6.9
1
7.4
1
8.3
1
8.7
1
9.5
3:
6
42
-0
.173
3
15.9
51
8
0.0
860
2
13.1
1
3.6
1
3.9
1
4.6
1
5.1
1
6.0
1
6.9
1
7.5
1
8.4
1
8.8
1
9.6
3:
7
43
-0
.173
3
16.0
01
6
0.0
864
2
13.1
1
3.6
1
3.9
1
4.6
1
5.1
1
6.0
1
7.0
1
7.5
1
8.5
1
8.9
1
9.6
3:
8
44
-0
.173
3
16.0
50
9
0.0
868
3
13.2
1
3.7
1
3.9
1
4.7
1
5.1
1
6.1
1
7.0
1
7.6
1
8.5
1
8.9
1
9.7
3:
9
45
-0
.173
3
16.1
00
1
0.0
872
3
13.2
1
3.7
1
4.0
1
4.7
1
5.2
1
6.1
1
7.1
1
7.6
1
8.6
1
9.0
1
9.8
3:1
0
46
-0
.173
3
16.1
49
1
0.0
876
5
13.2
1
3.7
1
4.0
1
4.8
1
5.2
1
6.1
1
7.1
1
7.7
1
8.7
1
9.1
1
9.9
3:1
1
47
-0
.173
3
16.1
98
3
0.0
880
6
13.2
1
3.8
1
4.0
1
4.8
1
5.3
1
6.2
1
7.2
1
7.8
1
8.8
1
9.2
2
0.0
4:
0
48
-0
.173
3
16.2
47
7
0.0
884
8
13.3
1
3.8
1
4.1
1
4.8
1
5.3
1
6.2
1
7.3
1
7.8
1
8.8
1
9.2
2
0.0
100 Arm circumference-for-age, girls

Ta
ble
35
Arm
cir
cum
fere
nce-
for-
ag
e fo
r g
irls
, a
ge
in y
ears
an
d m
on
ths
(co
nti
nu
ed)
P
ercen
tile
s (a
rm
cir
cu
mfe
ren
ce i
n c
m)
Yea
r: M
on
th
Mon
th
L
M
S
1st
3
rd
5
th
15th
2
5th
5
0th
7
5th
8
5th
9
5th
9
7th
9
9th
4:
1
49
-0
.173
3
16.2
97
4
0.0
889
0
13.3
1
3.8
1
4.1
1
4.9
1
5.4
1
6.3
1
7.3
1
7.9
1
8.9
1
9.3
2
0.1
4:
2
50
-0
.173
3
16.3
47
5
0.0
893
2
13.3
1
3.9
1
4.1
1
4.9
1
5.4
1
6.3
1
7.4
1
7.9
1
9.0
1
9.4
2
0.2
4:
3
51
-0
.173
3
16.3
98
1
0.0
897
4
13.4
1
3.9
1
4.2
1
5.0
1
5.4
1
6.4
1
7.4
1
8.0
1
9.0
1
9.5
2
0.3
4:
4
52
-0
.173
3
16.4
49
0
0.0
901
6
13.4
1
3.9
1
4.2
1
5.0
1
5.5
1
6.4
1
7.5
1
8.1
1
9.1
1
9.5
2
0.4
4:
5
53
-0
.173
3
16.5
00
1
0.0
905
7
13.4
1
4.0
1
4.2
1
5.0
1
5.5
1
6.5
1
7.5
1
8.1
1
9.2
1
9.6
2
0.5
4:
6
54
-0
.173
3
16.5
51
4
0.0
909
9
13.4
1
4.0
1
4.3
1
5.1
1
5.6
1
6.6
1
7.6
1
8.2
1
9.3
1
9.7
2
0.5
4:
7
55
-0
.173
3
16.6
02
6
0.0
914
0
13.5
1
4.0
1
4.3
1
5.1
1
5.6
1
6.6
1
7.7
1
8.3
1
9.3
1
9.8
2
0.6
4:
8
56
-0
.173
3
16.6
53
4
0.0
918
1
13.5
1
4.0
1
4.3
1
5.2
1
5.7
1
6.7
1
7.7
1
8.3
1
9.4
1
9.8
2
0.7
4:
9
57
-0
.173
3
16.7
03
9
0.0
922
1
13.5
1
4.1
1
4.4
1
5.2
1
5.7
1
6.7
1
7.8
1
8.4
1
9.5
1
9.9
2
0.8
4:1
0
58
-0
.173
3
16.7
53
9
0.0
926
2
13.6
1
4.1
1
4.4
1
5.2
1
5.7
1
6.8
1
7.8
1
8.5
1
9.6
2
0.0
2
0.9
4:1
1
59
-0
.173
3
16.8
03
4
0.0
930
1
13.6
1
4.1
1
4.4
1
5.3
1
5.8
1
6.8
1
7.9
1
8.5
1
9.6
2
0.1
2
0.9
5:
0
60
-0
.173
3
16.8
52
6
0.0
934
1
13.6
1
4.2
1
4.5
1
5.3
1
5.8
1
6.9
1
8.0
1
8.6
1
9.7
2
0.1
2
1.0
Arm circumference-for-age, girls 101

Ta
ble
35
Arm
cir
cum
fere
nce-
for-
ag
e fo
r g
irls
, a
ge
in y
ears
an
d m
on
ths
(co
nti
nu
ed)
Z
-sco
res
(arm
cir
cu
mfe
ren
ce i
n c
m)
Yea
r: M
on
th
Mon
th
L
M
S
-3 S
D
-2 S
D
-1 S
D
Med
ian
1
SD
2
SD
3
SD
0:
3
3
-0.1
73
3
13.0
28
4
0.0
826
3
10.2
1
1.1
1
2.0
1
3.0
1
4.2
1
5.4
1
6.8
0:
4
4
-0.1
73
3
13.3
64
9
0.0
829
8
10.5
1
1.3
1
2.3
1
3.4
1
4.5
1
5.8
1
7.2
0:
5
5
-0.1
73
3
13.6
06
1
0.0
832
5
10.7
1
1.5
1
2.5
1
3.6
1
4.8
1
6.1
1
7.6
0:
6
6
-0.1
73
3
13.7
77
1
0.0
834
3
10.8
1
1.7
1
2.7
1
3.8
1
5.0
1
6.3
1
7.8
0:
7
7
-0.1
73
3
13.9
01
8
0.0
835
2
10.9
1
1.8
1
2.8
1
3.9
1
5.1
1
6.5
1
8.0
0:
8
8
-0.1
73
3
13.9
95
2
0.0
835
1
11.0
1
1.9
1
2.9
1
4.0
1
5.2
1
6.6
1
8.1
0:
9
9
-0.1
73
3
14.0
66
5
0.0
834
2
11.0
1
1.9
1
2.9
1
4.1
1
5.3
1
6.7
1
8.2
0:1
0
10
-0
.173
3
14.1
21
7
0.0
832
6
11.1
1
2.0
1
3.0
1
4.1
1
5.4
1
6.7
1
8.2
0:1
1
11
-0
.173
3
14.1
66
7
0.0
830
5
11.1
1
2.0
1
3.0
1
4.2
1
5.4
1
6.8
1
8.3
1:
0
12
-0
.173
3
14.2
06
5
0.0
828
0
11.1
1
2.1
1
3.1
1
4.2
1
5.4
1
6.8
1
8.3
1:
1
13
-0
.173
3
14.2
45
5
0.0
825
4
11.2
1
2.1
1
3.1
1
4.2
1
5.5
1
6.8
1
8.3
1:
2
14
-0
.173
3
14.2
85
9
0.0
822
7
11.2
1
2.1
1
3.2
1
4.3
1
5.5
1
6.9
1
8.4
1:
3
15
-0
.173
3
14.3
28
9
0.0
820
2
11.3
1
2.2
1
3.2
1
4.3
1
5.6
1
6.9
1
8.4
1:
4
16
-0
.173
3
14.3
75
2
0.0
817
9
11.3
1
2.2
1
3.3
1
4.4
1
5.6
1
7.0
1
8.5
1:
5
17
-0
.173
3
14.4
25
4
0.0
816
0
11.4
1
2.3
1
3.3
1
4.4
1
5.7
1
7.0
1
8.5
1:
6
18
-0
.173
3
14.4
79
5
0.0
814
3
11.4
1
2.3
1
3.4
1
4.5
1
5.7
1
7.1
1
8.6
1:
7
19
-0
.173
3
14.5
37
2
0.0
813
1
11.4
1
2.4
1
3.4
1
4.5
1
5.8
1
7.1
1
8.7
1:
8
20
-0
.173
3
14.5
98
7
0.0
812
3
11.5
1
2.4
1
3.5
1
4.6
1
5.8
1
7.2
1
8.7
1:
9
21
-0
.173
3
14.6
63
9
0.0
811
8
11.6
1
2.5
1
3.5
1
4.7
1
5.9
1
7.3
1
8.8
1:1
0
22
-0
.173
3
14.7
32
8
0.0
811
8
11.6
1
2.6
1
3.6
1
4.7
1
6.0
1
7.4
1
8.9
1:1
1
23
-0
.173
3
14.8
04
9
0.0
812
1
11.7
1
2.6
1
3.7
1
4.8
1
6.1
1
7.5
1
9.0
2:
0
24
-0
.173
3
14.8
79
5
0.0
812
7
11.7
1
2.7
1
3.7
1
4.9
1
6.1
1
7.5
1
9.1
102 Arm circumference-for-age, girls

Ta
ble
35
Arm
cir
cum
fere
nce-
for-
ag
e fo
r g
irls
, a
ge
in y
ears
an
d m
on
ths
(co
nti
nu
ed)
Z
-sco
res
(arm
cir
cu
mfe
ren
ce i
n c
m)
Yea
r: M
on
th
Mon
th
L
M
S
-3 S
D
-2 S
D
-1 S
D
Med
ian
1
SD
2
SD
3
SD
2:
1
25
-0
.173
3
14.9
55
9
0.0
813
6
11.8
1
2.7
1
3.8
1
5.0
1
6.2
1
7.6
1
9.2
2:
2
26
-0
.173
3
15.0
32
7
0.0
814
7
11.8
1
2.8
1
3.9
1
5.0
1
6.3
1
7.7
1
9.3
2:
3
27
-0
.173
3
15.1
08
5
0.0
816
1
11.9
1
2.9
1
3.9
1
5.1
1
6.4
1
7.8
1
9.4
2:
4
28
-0
.173
3
15.1
81
7
0.0
817
8
11.9
1
2.9
1
4.0
1
5.2
1
6.5
1
7.9
1
9.5
2:
5
29
-0
.173
3
15.2
51
4
0.0
819
6
12.0
1
3.0
1
4.1
1
5.3
1
6.6
1
8.0
1
9.6
2:
6
30
-0
.173
3
15.3
16
8
0.0
821
7
12.0
1
3.0
1
4.1
1
5.3
1
6.6
1
8.1
1
9.7
2:
7
31
-0
.173
3
15.3
77
9
0.0
824
0
12.1
1
3.1
1
4.2
1
5.4
1
6.7
1
8.2
1
9.8
2:
8
32
-0
.173
3
15.4
35
1
0.0
826
5
12.1
1
3.1
1
4.2
1
5.4
1
6.8
1
8.3
1
9.9
2:
9
33
-0
.173
3
15.4
89
5
0.0
829
2
12.1
1
3.2
1
4.3
1
5.5
1
6.8
1
8.3
2
0.0
2:1
0
34
-0
.173
3
15.5
42
3
0.0
832
0
12.2
1
3.2
1
4.3
1
5.5
1
6.9
1
8.4
2
0.1
2:1
1
35
-0
.173
3
15.5
94
1
0.0
835
1
12.2
1
3.2
1
4.4
1
5.6
1
7.0
1
8.5
2
0.1
3:
0
36
-0
.173
3
15.6
45
6
0.0
838
3
12.2
1
3.3
1
4.4
1
5.6
1
7.0
1
8.5
2
0.2
3:
1
37
-0
.173
3
15.6
96
9
0.0
841
6
12.3
1
3.3
1
4.4
1
5.7
1
7.1
1
8.6
2
0.3
3:
2
38
-0
.173
3
15.7
48
3
0.0
845
1
12.3
1
3.3
1
4.5
1
5.7
1
7.1
1
8.7
2
0.4
3:
3
39
-0
.173
3
15.7
99
7
0.0
848
7
12.3
1
3.4
1
4.5
1
5.8
1
7.2
1
8.8
2
0.5
3:
4
40
-0
.173
3
15.8
50
9
0.0
852
5
12.3
1
3.4
1
4.6
1
5.9
1
7.3
1
8.8
2
0.6
3:
5
41
-0
.173
3
15.9
01
6
0.0
856
3
12.4
1
3.4
1
4.6
1
5.9
1
7.3
1
8.9
2
0.7
3:
6
42
-0
.173
3
15.9
51
8
0.0
860
2
12.4
1
3.5
1
4.6
1
6.0
1
7.4
1
9.0
2
0.8
3:
7
43
-0
.173
3
16.0
01
6
0.0
864
2
12.4
1
3.5
1
4.7
1
6.0
1
7.5
1
9.1
2
0.9
3:
8
44
-0
.173
3
16.0
50
9
0.0
868
3
12.4
1
3.5
1
4.7
1
6.1
1
7.5
1
9.1
2
1.0
3:
9
45
-0
.173
3
16.1
00
1
0.0
872
3
12.5
1
3.6
1
4.8
1
6.1
1
7.6
1
9.2
2
1.0
3:1
0
46
-0
.173
3
16.1
49
1
0.0
876
5
12.5
1
3.6
1
4.8
1
6.1
1
7.6
1
9.3
2
1.1
3:1
1
47
-0
.173
3
16.1
98
3
0.0
880
6
12.5
1
3.6
1
4.8
1
6.2
1
7.7
1
9.4
2
1.2
4:
0
48
-0
.173
3
16.2
47
7
0.0
884
8
12.5
1
3.6
1
4.9
1
6.2
1
7.8
1
9.4
2
1.3
Arm circumference-for-age, girls 103

Ta
ble
35
Arm
cir
cum
fere
nce-
for-
ag
e fo
r g
irls
, a
ge
in y
ears
an
d m
on
ths
(co
nti
nu
ed)
Z
-sco
res
(arm
cir
cu
mfe
ren
ce i
n c
m)
Yea
r: M
on
th
Mon
th
L
M
S
-3 S
D
-2 S
D
-1 S
D
Med
ian
1
SD
2
SD
3
SD
4:
1
49
-0
.173
3
16.2
97
4
0.0
889
0
12.6
1
3.7
1
4.9
1
6.3
1
7.8
1
9.5
2
1.4
4:
2
50
-0
.173
3
16.3
47
5
0.0
893
2
12.6
1
3.7
1
5.0
1
6.3
1
7.9
1
9.6
2
1.5
4:
3
51
-0
.173
3
16.3
98
1
0.0
897
4
12.6
1
3.7
1
5.0
1
6.4
1
8.0
1
9.7
2
1.6
4:
4
52
-0
.173
3
16.4
49
0
0.0
901
6
12.6
1
3.8
1
5.0
1
6.4
1
8.0
1
9.8
2
1.7
4:
5
53
-0
.173
3
16.5
00
1
0.0
905
7
12.7
1
3.8
1
5.1
1
6.5
1
8.1
1
9.8
2
1.8
4:
6
54
-0
.173
3
16.5
51
4
0.0
909
9
12.7
1
3.8
1
5.1
1
6.6
1
8.1
1
9.9
2
1.9
4:
7
55
-0
.173
3
16.6
02
6
0.0
914
0
12.7
1
3.9
1
5.2
1
6.6
1
8.2
2
0.0
2
2.0
4:
8
56
-0
.173
3
16.6
53
4
0.0
918
1
12.7
1
3.9
1
5.2
1
6.7
1
8.3
2
0.1
2
2.1
4:
9
57
-0
.173
3
16.7
03
9
0.0
922
1
12.7
1
3.9
1
5.2
1
6.7
1
8.3
2
0.1
2
2.2
4:1
0
58
-0
.173
3
16.7
53
9
0.0
926
2
12.8
1
4.0
1
5.3
1
6.8
1
8.4
2
0.2
2
2.3
4:1
1
59
-0
.173
3
16.8
03
4
0.0
930
1
12.8
1
4.0
1
5.3
1
6.8
1
8.5
2
0.3
2
2.4
5:
0
60
-0
.173
3
16.8
52
6
0.0
934
1
12.8
1
4.0
1
5.4
1
6.9
1
8.5
2
0.4
2
2.5
104 Arm circumference-for-age, girls
Arm circumference-for-age, boys & girls 105
4.4 Comparisons between boys and girls
This section presents the arm circumference-for-age z-score comparisons between boys and girls for
the WHO standards (Figure 44)

4.4
.1
WH
O
Age (
month
s)
Arm Circumference (cm)
10121416182022
24
68
12
16
20
24
28
32
36
40
44
48
52
56
60
0 -1 -2 -3123B
oys
Girls
Fig
ure
44
Co
mp
ari
son
of
bo
ys'
an
d g
irls
' a
rm c
ircu
mfe
ren
ce-f
or-
ag
e z-
sco
res
106 Arm circumference-for-age, boys & girls

- 107 -
5. CONSTRUCTION OF THE TRICEPS SKINFOLD-FOR-AGE STANDARDS
5.1 Indicator-specific methodology
Similar steps to those described to select the best model for the head circumference-for-age and arm-
circumference-for-age curves were followed to select the best model to construct the triceps skinfold-
for-age standards. The diagnostic tools applied to evaluate and compare candidate models were the
same. All data up to 71 months were used for modelling the triceps skinfold-for-age growth curves
and the standards afterwards truncated at 60 completed months to correct for the right-edge effect
(Borghi et al., 2006).
5.2 Triceps skinfold-for-age for boys
5.2.1 Sample size
There were a total of 10 762 triceps skinfold observations for boys. The longitudinal and cross-
sectional sample sizes by visit and age are presented in Tables 36 and 37. The measurement of triceps
skinfold started at 3 months of age (de Onis et al., 2004b).
Table 36 Longitudinal sample sizes for triceps skinfold-for-age for boys
Visit 5 6 7 8 9 10
Age 3 mo 4 mo 5 mo 6 mo 7 mo 8 mo
N 419 411 412 417 414 414
Visit 11 12 13 14 15 16
Age 9 mo 10 mo 11 mo 12 mo 14 mo 16 mo
N 407 407 418 412 416 417
Visit 17 18 19 20
Age 18 mo 20 mo 22 mo 24 mo
N 415 421 415 421
Table 37 Cross-sectional sample sizes for triceps skinfold-for-age for boys
Age (mo) <18 18–20 21–23 24–26 27–29 30–32 33–35
N 3 175 183 236 255 217 252
Age (mo) 36–38 39–41 42–44 45–47 48–50 51–53 54–56
N 265 249 255 236 236 221 225
Age (mo) 57–59 60–62 63–65 66–68 69–71 >71
N 239 228 216 217 214 4
5.2.2 Model selection and results
To search for the best value of the age-transformation power λ, the model BCPE(x=ageλ, df(µ)=9,
df(σ)=4, df(ν)=4, τ=2) was used as a starting point. Table 38 shows the global deviance for values of λ
from 0.05 to 1. The global deviance value was smallest for λ=0.30 and thus this age-transformation
power was selected.

108 Triceps skinfold-for-age, boys
Table 38 Global deviance (GD) for models within the class BCPE(x=ageλ, df(µ)=9, df(σ)=4,
df(ν)=4, τ=2) for triceps skinfold-for-age for boys
λ 0.05 0.10 0.15 0.20 0.25 0.30 0.35 0.40 0.45 0.50
GDa 628.4 627.7 627.1 626.8 626.6 626.5 626.6 626.8 627.2 627.6
λ 0.55 0.60 0.65 0.70 0.75 0.80 0.85 0.90 0.95 1.00
GDa 628.2 628.9 629.6 630.3 631.0 631.7 632.4 633.1 633.8 634.5
a In excess of 41 000.
The search for the best df(µ) and df(σ) followed, fixing λ=0.30, ν=1 and τ=2. All possible
combinations with df(µ) values ranging from 6 to 15 and df(σ) from 2 to 10 were considered and
partial results are presented in Table 39. The criterion considered was the GAIC(3), as for the
construction of arm circumference-for-age (see Section 4.2.2). The model with df(µ)=8 and df(σ)=5
provided the smallest value of GAIC(3) but the model with df(µ)=7 and df(σ)=5, with a smoother
median curve, yielded a very similar GAIC(3) value and thus the latter was selected for further
evaluation.
Table 39 Goodness-of-fit summary for models using the BCPE distribution with fixed ν=1 and
τ=2 for triceps skinfold-for-age for boys
df(µ) df(σ) GDa
AICa
GAIC(3)a
Total df
3 1 597.8 1 615.8 1 624.8 9
4 1 585.3 1 605.3 1 615.3 10
5 1 579.8 1 601.8 1 612.8 11
6 1 576.8 1 600.8 1 612.8 12
6
7 1 574.2 1 600.2 1 613.2 13
3 1 591.7 1 611.7 1 621.7 10
4 1 579.1 1 601.1 1 612.1 11
5 1 573.7 1 597.7 1 609.7 12
6 1 570.8 1 596.8 1 609.8 13
7
7 1 568.3 1 596.3 1 610.3 14
3 1 588.3 1 610.3 1 621.3 11
4 1 575.6 1 599.6 1 611.6 12
5 1 570.3 1 596.3 1 609.3 13
6 1 567.3 1 595.4 1 609.4 14
8
7 1 564.9 1 594.9 1 609.9 15
3 1 585.7 1 609.7 1 621.7 12
4 1 573.0 1 599.0 1 612.0 13
5 1 567.7 1 595.7 1 609.7 14
6 1 564.8 1 594.8 1 609.8 15
9
7 1 562.4 1 594.4 1 610.4 16
3 1 583.5 1 609.5 1 622.5 13
4 1 570.8 1 598.8 1 612.8 14
5 1 565.4 1 595.5 1 610.5 15
6 1 562.6 1 594.6 1 610.6 16
10
7 1 560.2 1 594.2 1 611.2 17
GD, Global Deviance; AIC, Akaike Information Criterion;
GAIC(3), Generalized AIC with penalty equal to 3; a In excess of 41 000.

Triceps skinfold-for-age, boys 109
Model 1: BCPE(x=age0.30
, df(µ)=7, df(σ)=5, ν=1, τ=2)
This model was inadequate as there was clear evidence of residual skewness in both the worm plots
(Figure 45) and the Q-test results (Table 40). The worms depicted U-shapes for most age groups and
Q-test results (Table 40) showed all groups with absolute values of z3 higher than 2. Most of the age
groups also presented absolute values of z4 higher than 2, indicating residual kurtosis. The overall
tests for skewness and kurtosis were significant (p-values < 0.01). Only two groups presented absolute
values of z2 larger than 2, indicating misfit of the variance (40 mo and 58 mo).
3 mo 4 mo 5 mo 6 mo 7 mo
8 mo 9 mo 10 mo 11 mo 12 mo
14 mo 16 mo 18 mo 20 mo 22 mo
24 mo 28 mo 34 mo 40 mo 46 mo
52 mo 58 mo 64 mo 70 mo
3 mo 4 mo 5 mo 6 mo 7 mo
8 mo 9 mo 10 mo 11 mo 12 mo
14 mo 16 mo 18 mo 20 mo 22 mo
24 mo 28 mo 34 mo 40 mo 46 mo
52 mo 58 mo 64 mo 70 mo
3 mo 4 mo 5 mo 6 mo 7 mo
8 mo 9 mo 10 mo 11 mo 12 mo
14 mo 16 mo 18 mo 20 mo 22 mo
24 mo 28 mo 34 mo 40 mo 46 mo
52 mo 58 mo 64 mo 70 mo
Figure 45 Worm plots of z-scores for Model 1 for triceps skinfold-for-age for boys
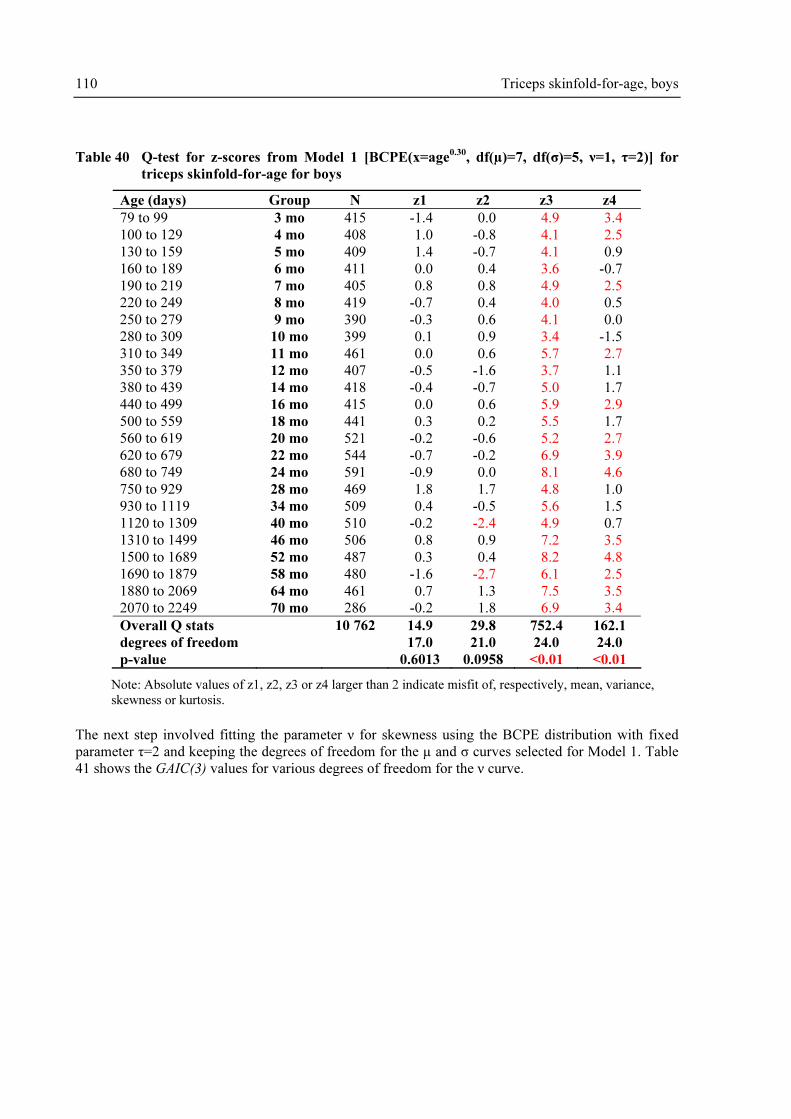
110 Triceps skinfold-for-age, boys
Table 40 Q-test for z-scores from Model 1 [BCPE(x=age0.30
, df(µ)=7, df(σ)=5, ν=1, τ=2)] for
triceps skinfold-for-age for boys
Age (days) Group N z1 z2 z3 z4
79 to 99 3 mo 415 -1.4 0.0 4.9 3.4
100 to 129 4 mo 408 1.0 -0.8 4.1 2.5
130 to 159 5 mo 409 1.4 -0.7 4.1 0.9
160 to 189 6 mo 411 0.0 0.4 3.6 -0.7
190 to 219 7 mo 405 0.8 0.8 4.9 2.5
220 to 249 8 mo 419 -0.7 0.4 4.0 0.5
250 to 279 9 mo 390 -0.3 0.6 4.1 0.0
280 to 309 10 mo 399 0.1 0.9 3.4 -1.5
310 to 349 11 mo 461 0.0 0.6 5.7 2.7
350 to 379 12 mo 407 -0.5 -1.6 3.7 1.1
380 to 439 14 mo 418 -0.4 -0.7 5.0 1.7
440 to 499 16 mo 415 0.0 0.6 5.9 2.9
500 to 559 18 mo 441 0.3 0.2 5.5 1.7
560 to 619 20 mo 521 -0.2 -0.6 5.2 2.7
620 to 679 22 mo 544 -0.7 -0.2 6.9 3.9
680 to 749 24 mo 591 -0.9 0.0 8.1 4.6
750 to 929 28 mo 469 1.8 1.7 4.8 1.0
930 to 1119 34 mo 509 0.4 -0.5 5.6 1.5
1120 to 1309 40 mo 510 -0.2 -2.4 4.9 0.7
1310 to 1499 46 mo 506 0.8 0.9 7.2 3.5
1500 to 1689 52 mo 487 0.3 0.4 8.2 4.8
1690 to 1879 58 mo 480 -1.6 -2.7 6.1 2.5
1880 to 2069 64 mo 461 0.7 1.3 7.5 3.5
2070 to 2249 70 mo 286 -0.2 1.8 6.9 3.4
Overall Q stats 10 762 14.9 29.8 752.4 162.1
degrees of freedom 17.0 21.0 24.0 24.0
p-value 0.6013 0.0958 <0.01 <0.01
Note: Absolute values of z1, z2, z3 or z4 larger than 2 indicate misfit of, respectively, mean, variance,
skewness or kurtosis.
The next step involved fitting the parameter ν for skewness using the BCPE distribution with fixed
parameter τ=2 and keeping the degrees of freedom for the µ and σ curves selected for Model 1. Table
41 shows the GAIC(3) values for various degrees of freedom for the ν curve.
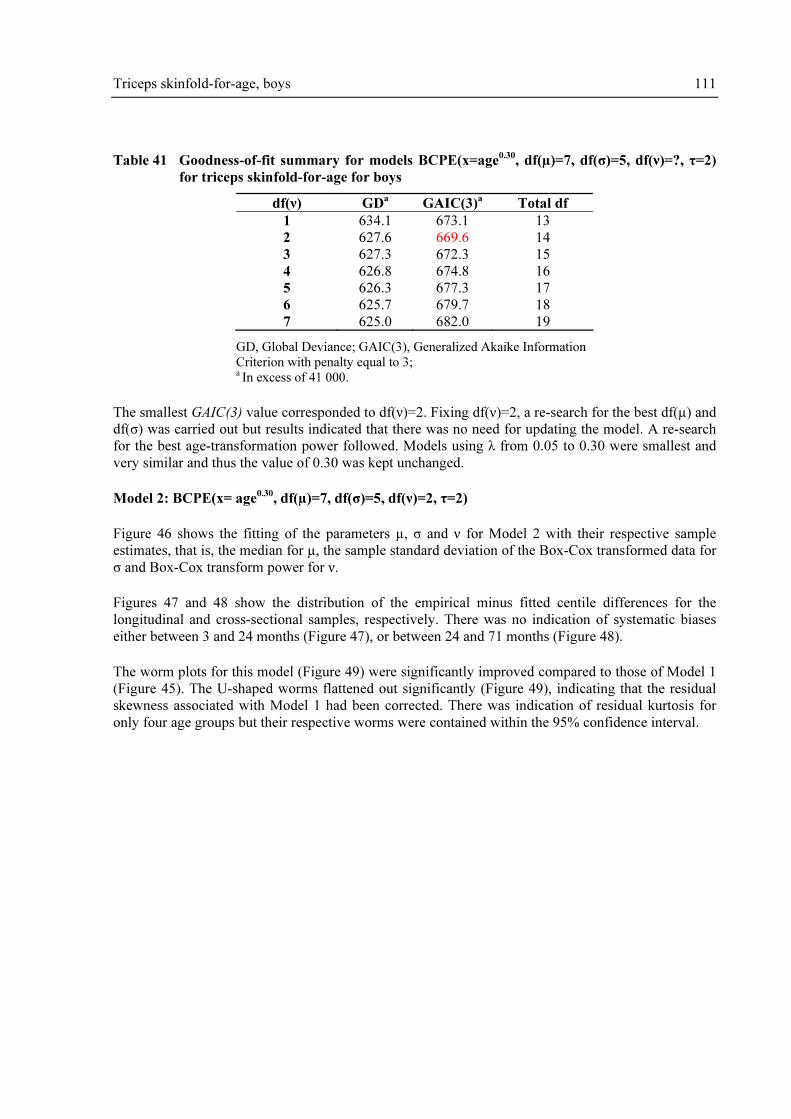
Triceps skinfold-for-age, boys 111
Table 41 Goodness-of-fit summary for models BCPE(x=age0.30
, df(µ)=7, df(σ)=5, df(ν)=?, τ=2)
for triceps skinfold-for-age for boys
df(ν) GDa
GAIC(3)a
Total df
1 634.1 673.1 13
2 627.6 669.6 14
3 627.3 672.3 15
4 626.8 674.8 16
5 626.3 677.3 17
6 625.7 679.7 18
7 625.0 682.0 19
GD, Global Deviance; GAIC(3), Generalized Akaike Information
Criterion with penalty equal to 3; a In excess of 41 000.
The smallest GAIC(3) value corresponded to df(ν)=2. Fixing df(ν)=2, a re-search for the best df(µ) and
df(σ) was carried out but results indicated that there was no need for updating the model. A re-search
for the best age-transformation power followed. Models using λ from 0.05 to 0.30 were smallest and
very similar and thus the value of 0.30 was kept unchanged.
Model 2: BCPE(x= age0.30
, df(µ)=7, df(σ)=5, df(ν)=2, τ=2)
Figure 46 shows the fitting of the parameters µ, σ and ν for Model 2 with their respective sample
estimates, that is, the median for µ, the sample standard deviation of the Box-Cox transformed data for
σ and Box-Cox transform power for ν.
Figures 47 and 48 show the distribution of the empirical minus fitted centile differences for the
longitudinal and cross-sectional samples, respectively. There was no indication of systematic biases
either between 3 and 24 months (Figure 47), or between 24 and 71 months (Figure 48).
The worm plots for this model (Figure 49) were significantly improved compared to those of Model 1
(Figure 45). The U-shaped worms flattened out significantly (Figure 49), indicating that the residual
skewness associated with Model 1 had been corrected. There was indication of residual kurtosis for
only four age groups but their respective worms were contained within the 95% confidence interval.
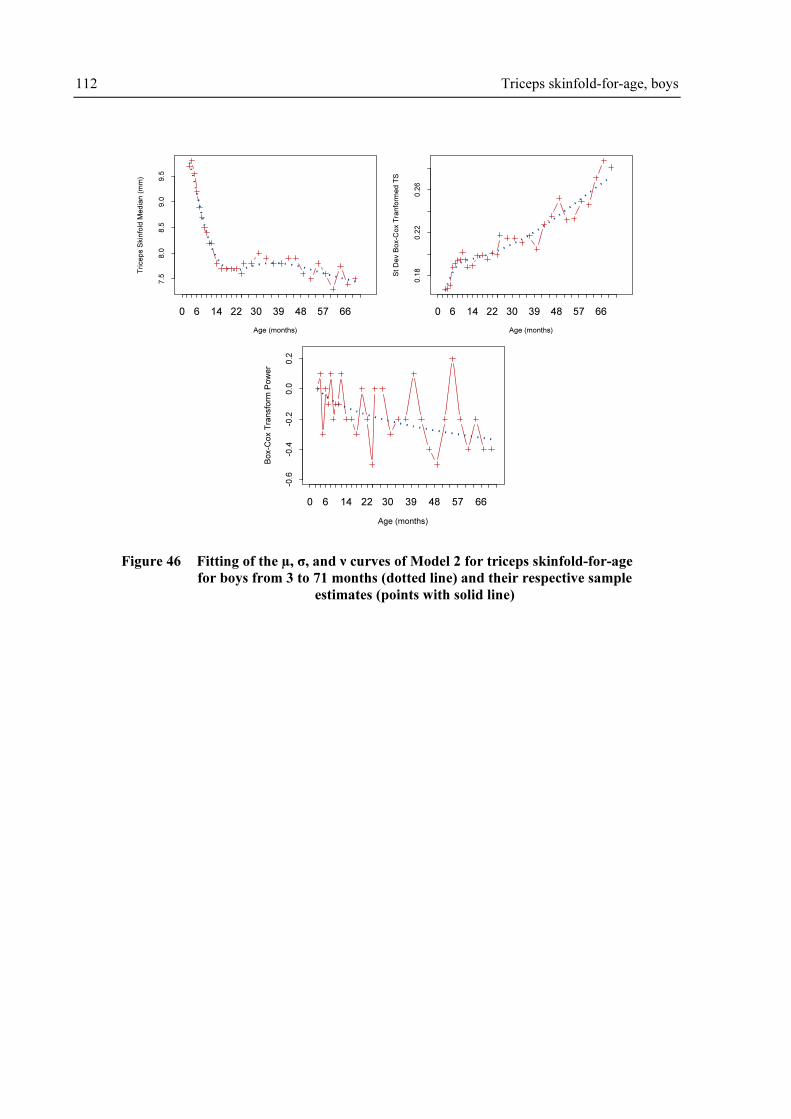
112 Triceps skinfold-for-age, boys
Age (months)
Tri
ce
ps S
kin
fold
Me
dia
n (
mm
)
7.5
8.0
8.5
9.0
9.5
0 6 14 22 30 39 48 57 66
Age (months)
St
De
v B
ox-C
ox T
ran
form
ed
TS
0.1
80
.22
0.2
6
0 6 14 22 30 39 48 57 66
Age (months)
Box-C
ox T
ransfo
rm P
ow
er
-0.6
-0.4
-0.2
0.0
0.2
0 6 14 22 30 39 48 57 66
Figure 46 Fitting of the µ, σ, and ν curves of Model 2 for triceps skinfold-for-age
for boys from 3 to 71 months (dotted line) and their respective sample
estimates (points with solid line)

Triceps skinfold-for-age, boys 113
3rd Centile
-0.4
0.0
0.4
4 6 8 10 14 18 22
5th Centile
-0.4
0.0
0.4
4 6 8 10 14 18 22
10th Centile
-0.4
0.0
0.4
4 6 8 10 14 18 22
25th Centile
-0.4
0.0
0.4
4 6 8 10 14 18 22
50th Centile
-0.4
0.0
0.4
4 6 8 10 14 18 22
75th Centile
-0.4
0.0
0.4
4 6 8 10 14 18 22
90th Centile
-0.4
0.0
0.4
4 6 8 10 14 18 22
95th Centile
-0.4
0.0
0.4
4 6 8 10 14 18 22
97th Centile
-0.4
0.0
0.4
4 6 8 10 14 18 22
Age (months)
Em
pir
ica
l-F
itte
d C
en
tile
fo
r T
rice
ps S
kin
fold
(m
m)
Figure 47 Centile residuals from fitting Model 2 for triceps skinfold-for-age
from 3 to 24 months for boys
3rd Centile
-1.0
0.0
1.0
25 31 37 43 49 55 61 67
5th Centile
-1.0
0.0
1.0
25 31 37 43 49 55 61 67
10th Centile
-1.0
0.0
1.0
25 31 37 43 49 55 61 67
25th Centile
-1.0
0.0
1.0
25 31 37 43 49 55 61 67
50th Centile
-1.0
0.0
1.0
25 31 37 43 49 55 61 67
75th Centile
-1.0
0.0
1.0
25 31 37 43 49 55 61 67
90th Centile
-1.0
0.0
1.0
25 31 37 43 49 55 61 67
95th Centile
-1.0
0.0
1.0
25 31 37 43 49 55 61 67
97th Centile
-1.0
0.0
1.0
25 31 37 43 49 55 61 67
Age (months)
Em
pir
ica
l-F
itte
d C
en
tile
fo
r T
rice
ps S
kin
fold
(m
m)
Figure 48 Centile residuals from fitting Model 2 for triceps skinfold-for-age
from 24 to 71 months for boys

114 Triceps skinfold-for-age, boys
3 mo 4 mo 5 mo 6 mo 7 mo
8 mo 9 mo 10 mo 11 mo 12 mo
14 mo 16 mo 18 mo 20 mo 22 mo
24 mo 28 mo 34 mo 40 mo 46 mo
52 mo 58 mo 64 mo 70 mo
3 mo 4 mo 5 mo 6 mo 7 mo
8 mo 9 mo 10 mo 11 mo 12 mo
14 mo 16 mo 18 mo 20 mo 22 mo
24 mo 28 mo 34 mo 40 mo 46 mo
52 mo 58 mo 64 mo 70 mo
3 mo 4 mo 5 mo 6 mo 7 mo
8 mo 9 mo 10 mo 11 mo 12 mo
14 mo 16 mo 18 mo 20 mo 22 mo
24 mo 28 mo 34 mo 40 mo 46 mo
52 mo 58 mo 64 mo 70 mo
Figure 49 Worm plots of z-scores for Model 2 for triceps skinfold-for-age for boys
The Q-test results from Model 2 are shown in Table 42. There were no longer indications of misfit of
variance, as no z2 absolute values were larger than 2. There were also no groups with absolute value
larger than 2 for the statistic z3 that would suggest remaining skewness. Three age groups presented
absolute values of z4 greater than 2, indicating remaining kurtosis, but the overall test statistic for
kurtosis had a p-value not significant at the 5% level. The overall Q-test p-values were all non-
significant, indicating an adequate fit of the boys' triceps skinfold-for-age curves and providing no
justification for increasing the complexity of the model by adjusting for kurtosis (modelling τ).
Table 43 presents observed percentages with triceps skinfolds below the fitted centiles. There was no
detectable pattern suggesting a systematic bias.

Triceps skinfold-for-age, boys 115
Table 42 Q-test for z-scores from Model 2 [BCPE(x=age0.30
, df(µ)=7, df(σ)=5, df(ν)=2, τ=2)] for
triceps skinfold-for-age for boys
Age (days) Group N z1 z2 z3 z4
79 to 99 3 mo 415 -1.6 0.2 0.1 1.5
100 to 129 4 mo 408 1.0 -1.0 -0.4 0.8
130 to 159 5 mo 409 1.4 -1.0 0.3 -0.9
160 to 189 6 mo 411 0.0 0.5 0.0 -2.4
190 to 219 7 mo 405 0.8 0.4 0.1 0.3
220 to 249 8 mo 419 -0.7 0.8 -0.4 -1.0
250 to 279 9 mo 390 -0.3 0.6 0.3 -2.3
280 to 309 10 mo 399 0.1 1.1 -0.6 -2.4
310 to 349 11 mo 461 0.0 0.2 0.7 -0.5
350 to 379 12 mo 407 -0.3 -1.1 -0.8 -1.1
380 to 439 14 mo 418 -0.4 -0.8 0.6 -1.1
440 to 499 16 mo 415 -0.2 0.3 0.5 0.5
500 to 559 18 mo 441 0.3 -0.1 0.8 -1.0
560 to 619 20 mo 521 -0.2 -0.1 -1.0 -0.2
620 to 679 22 mo 544 -0.6 -0.2 0.4 0.2
680 to 749 24 mo 591 -0.9 -0.4 1.5 0.5
750 to 929 28 mo 469 1.6 1.6 -0.8 -1.5
930 to 1119 34 mo 509 0.3 -0.4 -0.3 -1.1
1120 to 1309 40 mo 510 -0.2 -1.6 -1.3 -0.6
1310 to 1499 46 mo 506 0.5 0.5 0.2 -0.7
1500 to 1689 52 mo 487 0.2 -0.2 0.6 0.5
1690 to 1879 58 mo 480 -1.3 -1.2 -1.3 -0.4
1880 to 2069 64 mo 461 0.8 1.0 -0.2 -0.6
2070 to 2249 70 mo 286 -0.1 1.1 1.0 -0.4
Overall Q stats 10 762 13.3 16.0 12.2 31.0
degrees of freedom 17.0 21.0 22.0 24.0
p-value 0.7179 0.7701 0.9522 0.1551
Note: Absolute values of z1, z2, z3 or z4 larger than 2 indicate misfit of, respectively, mean, variance,
skewness or kurtosis.
In conclusion, the model selected for constructing the triceps skinfold-for-age growth curves for boys
was BCPE(x=age0.30, df(µ)=7, df(σ)=5, df(ν)=2, τ=2) that adjusts only for skewness, and thus reduces
to the LMS method. The fitted centile curves and empirical centiles are shown in Figures 50 to 53.
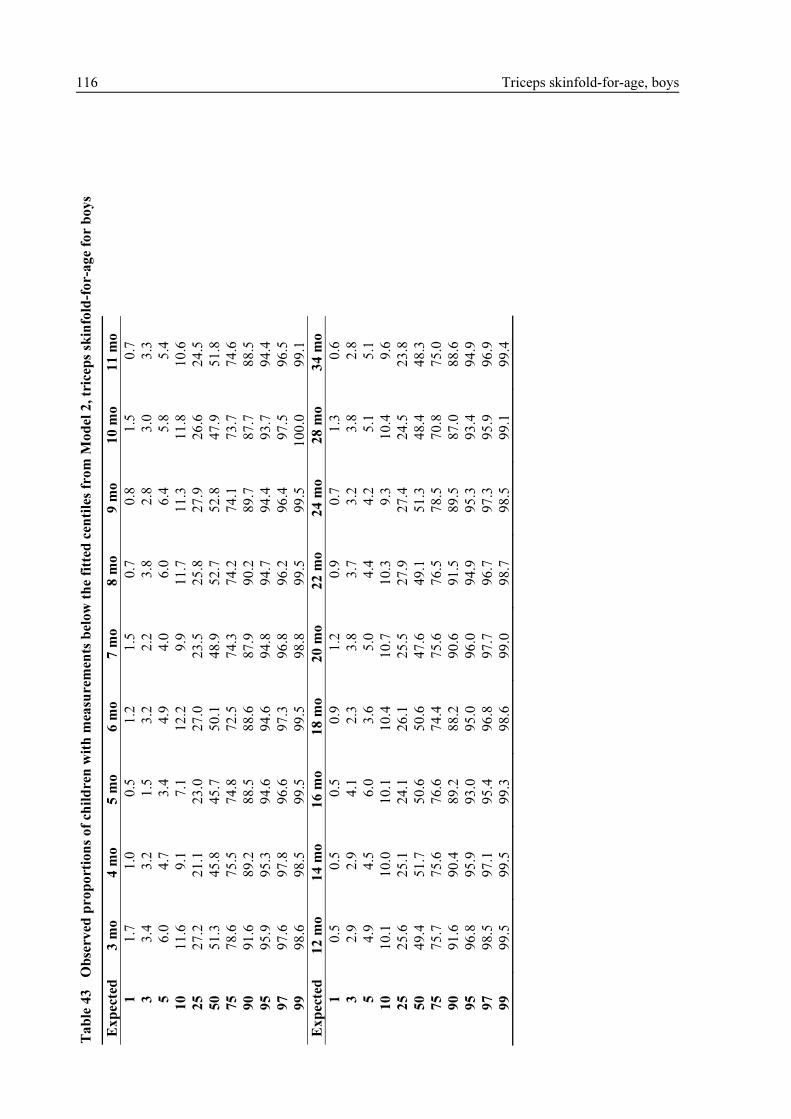
Ta
ble
43
Ob
serv
ed p
ro
po
rtio
ns
of
chil
dre
n w
ith
mea
surem
ents
bel
ow
th
e fi
tted
cen
tile
s fr
om
Mo
del
2, tr
icep
s sk
info
ld-f
or-
ag
e fo
r b
oy
s
Ex
pec
ted
3
mo
4
mo
5
mo
6
mo
7
mo
8
mo
9
mo
1
0 m
o
11
mo
1
1.7
1
.0
0.5
1
.2
1.5
0
.7
0.8
1
.5
0.7
3
3.4
3
.2
1.5
3
.2
2.2
3
.8
2.8
3
.0
3.3
5
6.0
4
.7
3.4
4
.9
4.0
6
.0
6.4
5
.8
5.4
10
1
1.6
9
.1
7.1
1
2.2
9
.9
11
.7
11
.3
11
.8
10
.6
25
2
7.2
2
1.1
2
3.0
2
7.0
2
3.5
2
5.8
2
7.9
2
6.6
2
4.5
50
5
1.3
4
5.8
4
5.7
5
0.1
4
8.9
5
2.7
5
2.8
4
7.9
5
1.8
75
7
8.6
7
5.5
7
4.8
7
2.5
7
4.3
7
4.2
7
4.1
7
3.7
7
4.6
90
9
1.6
8
9.2
8
8.5
8
8.6
8
7.9
9
0.2
8
9.7
8
7.7
8
8.5
95
9
5.9
9
5.3
9
4.6
9
4.6
9
4.8
9
4.7
9
4.4
9
3.7
9
4.4
97
9
7.6
9
7.8
9
6.6
9
7.3
9
6.8
9
6.2
9
6.4
9
7.5
9
6.5
99
9
8.6
9
8.5
9
9.5
9
9.5
9
8.8
9
9.5
9
9.5
1
00
.0
99
.1
Ex
pec
ted
1
2 m
o
14
mo
1
6 m
o
18
mo
2
0 m
o
22
mo
2
4 m
o
28
mo
3
4 m
o
1
0.5
0
.5
0.5
0
.9
1.2
0
.9
0.7
1
.3
0.6
3
2.9
2
.9
4.1
2
.3
3.8
3
.7
3.2
3
.8
2.8
5
4.9
4
.5
6.0
3
.6
5.0
4
.4
4.2
5
.1
5.1
10
1
0.1
1
0.0
1
0.1
1
0.4
1
0.7
1
0.3
9
.3
10
.4
9.6
25
2
5.6
2
5.1
2
4.1
2
6.1
2
5.5
2
7.9
2
7.4
2
4.5
2
3.8
50
4
9.4
5
1.7
5
0.6
5
0.6
4
7.6
4
9.1
5
1.3
4
8.4
4
8.3
75
7
5.7
7
5.6
7
6.6
7
4.4
7
5.6
7
6.5
7
8.5
7
0.8
7
5.0
90
9
1.6
9
0.4
8
9.2
8
8.2
9
0.6
9
1.5
8
9.5
8
7.0
8
8.6
95
9
6.8
9
5.9
9
3.0
9
5.0
9
6.0
9
4.9
9
5.3
9
3.4
9
4.9
97
9
8.5
9
7.1
9
5.4
9
6.8
9
7.7
9
6.7
9
7.3
9
5.9
9
6.9
99
9
9.5
9
9.5
9
9.3
9
8.6
9
9.0
9
8.7
9
8.5
9
9.1
9
9.4
116 Triceps skinfold-for-age, boys

Ta
ble
43
Ob
serv
ed p
ro
po
rtio
ns
of
chil
dre
n w
ith
mea
surem
ents
bel
ow
th
e fi
tted
cen
tile
s fr
om
Mo
del
2, tr
icep
s sk
info
ld-f
or-
ag
e fo
r b
oy
s (c
on
t)
Ex
pec
ted
4
0 m
o
46
mo
5
2 m
o
58
mo
6
4 m
o
70
mo
O
ver
all
1
1.0
0
.4
1.0
0
.8
0.7
1
.4
0.9
3
2.4
3
.4
2.1
3
.1
3.5
2
.8
3.1
5
4.7
5
.7
4.3
5
.6
5.0
4
.9
5.0
10
8
.8
10
.9
9.7
1
1.9
1
0.2
9
.4
10
.3
25
2
3.5
2
5.1
2
4.4
2
5.0
2
4.7
2
8.0
2
5.3
50
5
1.0
4
7.6
5
0.5
5
1.7
4
8.2
5
1.4
4
9.7
75
7
4.1
7
5.7
7
4.9
7
7.9
7
3.1
7
6.9
7
5.2
90
9
1.4
8
9.1
9
0.3
9
1.9
8
7.9
8
7.4
8
9.5
95
9
6.7
9
4.3
9
5.1
9
7.1
9
3.9
9
2.3
9
4.9
97
9
8.2
9
6.2
9
6.5
9
8.3
9
5.2
9
5.1
9
6.9
99
9
9.8
9
8.6
9
8.6
9
9.6
9
8.7
9
8.3
9
9.1
No
te:
Gro
up l
abel
s co
rres
pond
to t
he
age
inte
rval
s in
Tab
le 4
2.
Triceps skinfold-for-age, boys 117
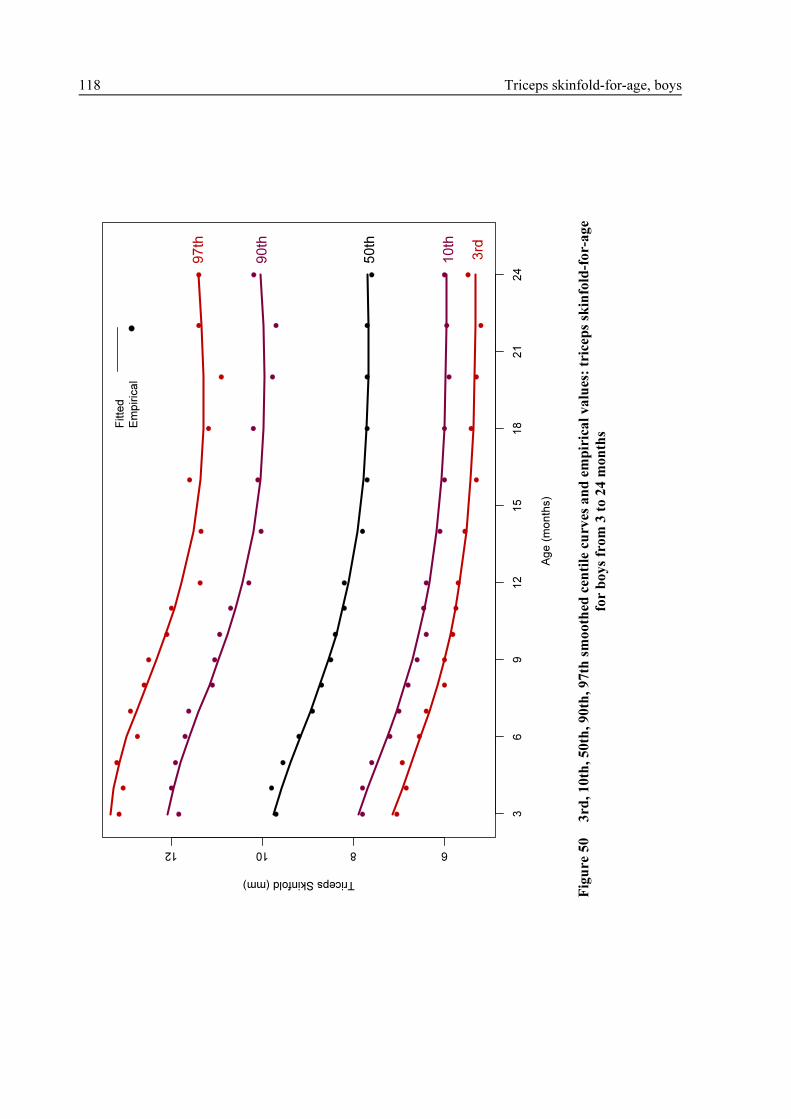
Ag
e (
mo
nth
s)
Triceps Skinfold (mm)
681012
36
91
21
51
82
12
4
3rd
10th
50th
90th
97th
Fitte
d
Em
pir
ica
l
Fig
ure
50
3rd
, 1
0th
, 5
0th
, 9
0th
, 9
7th
sm
oo
thed
cen
tile
cu
rves
an
d e
mp
iric
al
va
lues
: tr
icep
s sk
info
ld-f
or-
ag
e
for
bo
ys
from
3 t
o 2
4 m
on
ths
118 Triceps skinfold-for-age, boys

Ag
e (
mo
nth
s)
Triceps Skinfold (mm)
681012
36
91
21
51
82
12
4
5th
25th
50th
75th
95th
Fitte
d
Em
pir
ica
l
Fig
ure
51
5th
, 2
5th
, 5
0th
, 7
5th
, 9
5th
sm
oo
thed
cen
tile
cu
rves
an
d e
mp
iric
al
va
lues
: tr
icep
s sk
info
ld-f
or-
ag
e
for
bo
ys
from
3 t
o 2
4 m
on
ths
Triceps skinfold-for-age, boys 119

Ag
e (
mo
nth
s)
Triceps Skinfold (mm)
68101214
24
27
30
33
36
39
42
45
48
51
54
57
60
63
66
69
72
3rd
10th
50th
90th
97th
Fitte
d
Em
pir
ica
l
Fig
ure
52
3rd
, 1
0th
, 5
0th
, 9
0th
, 9
7th
sm
oo
thed
cen
tile
cu
rves
an
d e
mp
iric
al
va
lues
: tr
icep
s sk
info
ld-f
or-
ag
e
for
bo
ys
from
24
to
71 m
on
ths
120 Triceps skinfold-for-age, boys

Ag
e (
mo
nth
s)
Triceps Skinfold (mm)
68101214
24
27
30
33
36
39
42
45
48
51
54
57
60
63
66
69
72
5th
25th
50th
75th
95th
Fitte
d
Em
pir
ica
l
Fig
ure
53
5th
, 2
5th
, 5
0th
, 7
5th
, 9
5th
sm
oo
thed
cen
tile
cu
rves
an
d e
mp
iric
al
va
lues
: tr
icep
s sk
info
ld-f
or-
ag
e
for
bo
ys
from
24
to
71 m
on
ths
Triceps skinfold-for-age, boys 121

122 Triceps skinfold-for-age, boys
5.2.3 WHO standards
This section presents the final WHO triceps skinfold-for-age z-score and percentile charts (Figures 54
and 55) and table (Table 44) for boys.
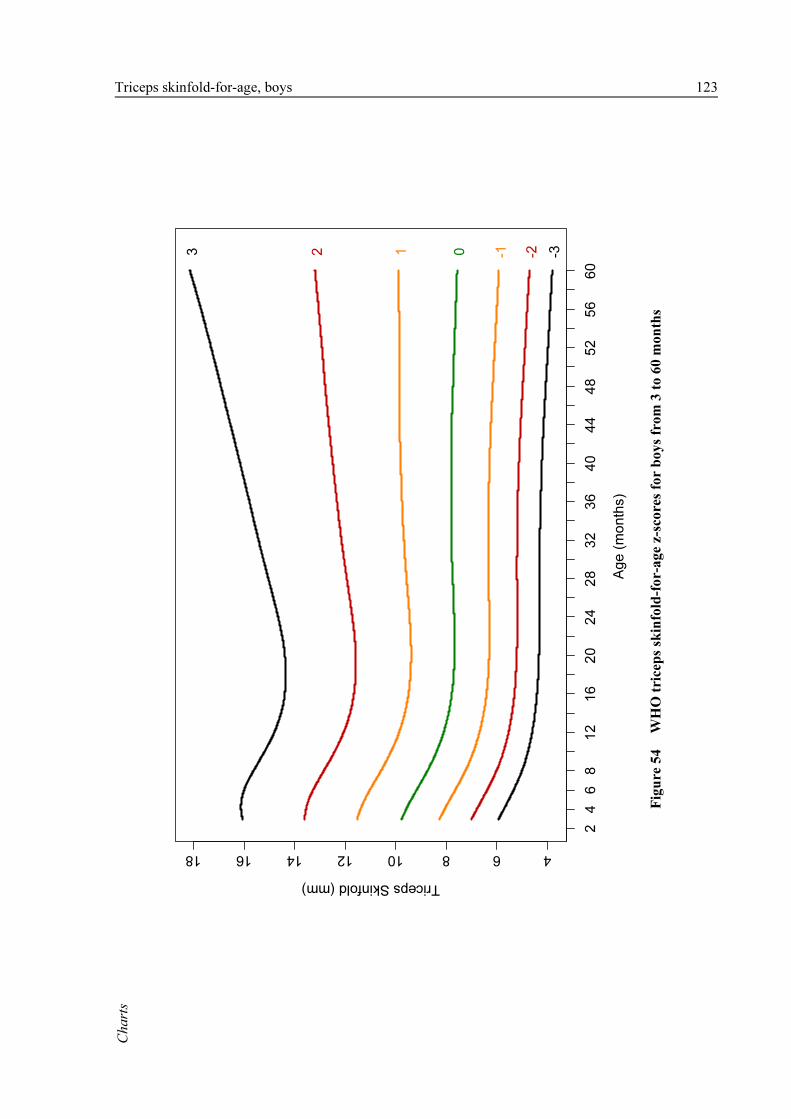
Ch
arts
Ag
e (
mo
nth
s)
Triceps Skinfold (mm)
4681012141618
24
68
12
16
20
24
28
32
36
40
44
48
52
56
60
123 0 -1 -2 -3
Fig
ure
54
WH
O t
rice
ps
skin
fold
-fo
r-a
ge
z-sc
ore
s fo
r b
oy
s fr
om
3 t
o 6
0 m
on
ths
Triceps skinfold-for-age, boys 123

Ag
e (
mo
nth
s)
Triceps Skinfold (mm)
681012
24
68
12
16
20
24
28
32
36
40
44
48
52
56
603
rd
50
th
97
th
15
th
85
th
Fig
ure
55
WH
O t
rice
ps
skin
fold
-fo
r-a
ge
per
cen
tile
s fo
r b
oy
s fr
om
3 t
o 6
0 m
on
ths
124 Triceps skinfold -for-age, boys

Ta
ble
s
Ta
ble
44
Tri
cep
s sk
info
ld-f
or-
ag
e fo
r b
oy
s, a
ge
in y
ears
an
d m
on
ths
P
erce
nti
les
(tri
cep
s sk
info
ld i
n m
m)
Yea
r: M
on
th
Mon
th
L
M
S
1st
3
rd
5th
1
5th
2
5th
5
0th
7
5th
8
5th
9
5th
9
7th
9
9th
0:
3
3
0.0
027
9
.7639
0
.1661
8
6.6
7
.1
7.4
8
.2
8.7
9
.8
10.9
1
1.6
1
2.8
1
3.3
1
4.4
0:
4
4
-0.0
16
5
9.5
840
0
.1726
4
6.4
6
.9
7.2
8
.0
8.5
9
.6
10.8
1
1.5
1
2.7
1
3.3
1
4.3
0:
5
5
-0.0
32
6
9.3
885
0
.1782
4
6.2
6
.7
7.0
7
.8
8.3
9
.4
10.6
1
1.3
1
2.6
1
3.2
1
4.3
0:
6
6
-0.0
46
6
9.1
729
0
.1830
4
6.0
6
.5
6.8
7
.6
8.1
9
.2
10.4
1
1.1
1
2.4
1
3.0
1
4.1
0:
7
7
-0.0
59
0
8.9
535
0
.1868
5
5.8
6
.3
6.6
7
.4
7.9
9
.0
10.2
1
0.9
1
2.2
1
2.8
1
3.9
0:
8
8
-0.0
70
3
8.7
435
0
.1896
8
5.7
6
.1
6.4
7
.2
7.7
8
.7
9.9
1
0.7
1
2.0
1
2.5
1
3.7
0:
9
9
-0.0
80
6
8.5
518
0
.1916
6
5.5
6
.0
6.3
7
.0
7.5
8
.6
9.7
1
0.4
1
1.8
1
2.3
1
3.5
0:1
0
10
-0
.090
1
8.3
812
0
.1930
0
5.4
5
.9
6.1
6
.9
7.4
8
.4
9.6
1
0.3
1
1.6
1
2.1
1
3.3
0:1
1
11
-0
.099
0
8.2
323
0
.1938
9
5.3
5
.8
6.0
6
.7
7.2
8
.2
9.4
1
0.1
1
1.4
1
1.9
1
3.1
1:
0
12
-0
.107
3
8.1
041
0
.1945
3
5.2
5
.7
5.9
6
.6
7.1
8
.1
9.2
9
.9
11.2
1
1.8
1
2.9
1:
1
13
-0
.115
2
7.9
958
0
.1950
6
5.1
5
.6
5.8
6
.5
7.0
8
.0
9.1
9
.8
11.1
1
1.6
1
2.7
1:
2
14
-0
.122
7
7.9
064
0
.1955
8
5.1
5
.5
5.8
6
.5
6.9
7
.9
9.0
9
.7
11.0
1
1.5
1
2.6
1:
3
15
-0
.129
7
7.8
345
0
.1961
2
5.0
5
.5
5.7
6
.4
6.9
7
.8
9.0
9
.6
10.9
1
1.4
1
2.5
1:
4
16
-0
.136
5
7.7
781
0
.1966
8
5.0
5
.4
5.7
6
.4
6.8
7
.8
8.9
9
.6
10.8
1
1.4
1
2.5
1:
5
17
-0
.143
0
7.7
351
0
.1972
8
5.0
5
.4
5.6
6
.3
6.8
7
.7
8.8
9
.5
10.8
1
1.3
1
2.4
1:
6
18
-0
.149
2
7.7
036
0
.1979
3
4.9
5
.4
5.6
6
.3
6.7
7
.7
8.8
9
.5
10.8
1
1.3
1
2.4
1:
7
19
-0
.155
2
7.6
821
0
.1986
2
4.9
5
.3
5.6
6
.3
6.7
7
.7
8.8
9
.5
10.7
1
1.3
1
2.4
1:
8
20
-0
.160
9
7.6
697
0
.1993
7
4.9
5
.3
5.6
6
.3
6.7
7
.7
8.8
9
.5
10.7
1
1.3
1
2.4
1:
9
21
-0
.166
5
7.6
652
0
.2001
8
4.9
5
.3
5.6
6
.3
6.7
7
.7
8.8
9
.5
10.8
1
1.3
1
2.4
1:1
0
22
-0
.171
9
7.6
675
0
.2010
5
4.9
5
.3
5.6
6
.2
6.7
7
.7
8.8
9
.5
10.8
1
1.3
1
2.5
1:1
1
23
-0
.177
1
7.6
750
0
.2019
6
4.9
5
.3
5.6
6
.2
6.7
7
.7
8.8
9
.5
10.8
1
1.4
1
2.5
2:
0
24
-0
.182
1
7.6
863
0
.2029
3
4.9
5
.3
5.6
6
.3
6.7
7
.7
8.8
9
.5
10.8
1
1.4
1
2.6
Triceps skinfold-for-age, boys 125

Ta
ble
44
Tri
cep
s sk
info
ld-f
or-
ag
e fo
r b
oy
s, a
ge
in y
ears
an
d m
on
ths
(co
nti
nu
ed)
P
erce
nti
les
(tri
cep
s sk
info
ld i
n m
m)
Yea
r: M
on
th
Mon
th
L
M
S
1st
3
rd
5th
1
5th
2
5th
5
0th
7
5th
8
5th
9
5th
9
7th
9
9th
2:
1
25
-0
.187
0
7.7
003
0
.2039
4
4.9
5
.3
5.6
6
.3
6.7
7
.7
8.9
9
.6
10.9
1
1.5
1
2.7
2:
2
26
-0
.191
8
7.7
156
0
.2049
7
4.9
5
.3
5.6
6
.3
6.7
7
.7
8.9
9
.6
10.9
1
1.5
1
2.7
2:
3
27
-0
.196
5
7.7
312
0
.2060
3
4.9
5
.3
5.6
6
.3
6.7
7
.7
8.9
9
.6
11.0
1
1.6
1
2.8
2:
4
28
-0
.201
0
7.7
463
0
.2071
0
4.9
5
.3
5.6
6
.3
6.7
7
.7
8.9
9
.6
11.0
1
1.6
1
2.9
2:
5
29
-0
.205
4
7.7
602
0
.2081
8
4.9
5
.3
5.6
6
.3
6.8
7
.8
8.9
9
.7
11.1
1
1.7
1
2.9
2:
6
30
-0
.209
7
7.7
726
0
.2092
8
4.9
5
.3
5.6
6
.3
6.8
7
.8
9.0
9
.7
11.1
1
1.7
1
3.0
2:
7
31
-0
.213
9
7.7
832
0
.2103
9
4.9
5
.3
5.6
6
.3
6.8
7
.8
9.0
9
.7
11.2
1
1.8
1
3.1
2:
8
32
-0
.218
0
7.7
920
0
.2115
3
4.9
5
.3
5.6
6
.3
6.8
7
.8
9.0
9
.8
11.2
1
1.8
1
3.1
2:
9
33
-0
.222
1
7.7
989
0
.2126
9
4.9
5
.3
5.6
6
.3
6.8
7
.8
9.0
9
.8
11.2
1
1.9
1
3.2
2:1
0
34
-0
.226
0
7.8
040
0
.2138
9
4.9
5
.3
5.6
6
.3
6.8
7
.8
9.0
9
.8
11.3
1
1.9
1
3.2
2:1
1
35
-0
.229
9
7.8
074
0
.2151
3
4.9
5
.3
5.6
6
.3
6.8
7
.8
9.0
9
.8
11.3
1
1.9
1
3.3
3:
0
36
-0
.233
6
7.8
094
0
.2164
1
4.9
5
.3
5.5
6
.3
6.8
7
.8
9.1
9
.8
11.3
1
2.0
1
3.3
3:
1
37
-0
.237
4
7.8
101
0
.2177
3
4.8
5
.3
5.5
6
.3
6.8
7
.8
9.1
9
.8
11.4
1
2.0
1
3.4
3:
2
38
-0
.241
0
7.8
096
0
.2190
9
4.8
5
.3
5.5
6
.3
6.8
7
.8
9.1
9
.9
11.4
1
2.1
1
3.5
3:
3
39
-0
.244
6
7.8
080
0
.2204
9
4.8
5
.3
5.5
6
.3
6.7
7
.8
9.1
9
.9
11.4
1
2.1
1
3.5
3:
4
40
-0
.248
1
7.8
051
0
.2219
4
4.8
5
.2
5.5
6
.2
6.7
7
.8
9.1
9
.9
11.4
1
2.1
1
3.6
3:
5
41
-0
.251
5
7.8
009
0
.2234
3
4.8
5
.2
5.5
6
.2
6.7
7
.8
9.1
9
.9
11.5
1
2.2
1
3.6
3:
6
42
-0
.254
9
7.7
954
0
.2249
6
4.8
5
.2
5.5
6
.2
6.7
7
.8
9.1
9
.9
11.5
1
2.2
1
3.7
3:
7
43
-0
.258
3
7.7
885
0
.2265
3
4.8
5
.2
5.5
6
.2
6.7
7
.8
9.1
9
.9
11.5
1
2.2
1
3.7
3:
8
44
-0
.261
6
7.7
804
0
.2281
3
4.7
5
.2
5.4
6
.2
6.7
7
.8
9.1
9
.9
11.5
1
2.3
1
3.8
3:
9
45
-0
.264
8
7.7
710
0
.2297
5
4.7
5
.2
5.4
6
.2
6.7
7
.8
9.1
9
.9
11.6
1
2.3
1
3.8
3:1
0
46
-0
.268
0
7.7
605
0
.2314
0
4.7
5
.1
5.4
6
.2
6.7
7
.8
9.1
9
.9
11.6
1
2.3
1
3.9
3:1
1
47
-0
.271
1
7.7
489
0
.2330
6
4.7
5
.1
5.4
6
.1
6.6
7
.7
9.1
9
.9
11.6
1
2.4
1
3.9
4:
0
48
-0
.274
2
7.7
364
0
.2347
3
4.7
5
.1
5.4
6
.1
6.6
7
.7
9.1
1
0.0
1
1.6
1
2.4
1
4.0
126 Triceps skinfold-for-age, boys

Ta
ble
44
Tri
cep
s sk
info
ld-f
or-
ag
e fo
r b
oy
s, a
ge
in y
ears
an
d m
on
ths
(co
nti
nu
ed)
P
erce
nti
les
(tri
cep
s sk
info
ld i
n m
m)
Yea
r: M
on
th
Mon
th
L
M
S
1st
3
rd
5th
1
5th
2
5th
5
0th
7
5th
8
5th
9
5th
9
7th
9
9th
4:
1
49
-0
.277
2
7.7
233
0
.2364
2
4.6
5
.1
5.3
6
.1
6.6
7
.7
9.1
1
0.0
1
1.7
1
2.4
1
4.0
4:
2
50
-0
.280
2
7.7
096
0
.2381
1
4.6
5
.1
5.3
6
.1
6.6
7
.7
9.1
1
0.0
1
1.7
1
2.4
1
4.1
4:
3
51
-0
.283
2
7.6
955
0
.2398
1
4.6
5
.0
5.3
6
.1
6.6
7
.7
9.1
1
0.0
1
1.7
1
2.5
1
4.1
4:
4
52
-0
.286
1
7.6
812
0
.2415
1
4.6
5
.0
5.3
6
.0
6.6
7
.7
9.1
1
0.0
1
1.7
1
2.5
1
4.2
4:
5
53
-0
.289
0
7.6
669
0
.2432
2
4.5
5
.0
5.3
6
.0
6.5
7
.7
9.1
1
0.0
1
1.7
1
2.5
1
4.2
4:
6
54
-0
.291
8
7.6
525
0
.2449
4
4.5
5
.0
5.2
6
.0
6.5
7
.7
9.1
1
0.0
1
1.7
1
2.6
1
4.3
4:
7
55
-0
.294
6
7.6
383
0
.2466
6
4.5
4
.9
5.2
6
.0
6.5
7
.6
9.1
1
0.0
1
1.8
1
2.6
1
4.3
4:
8
56
-0
.297
4
7.6
242
0
.2483
9
4.5
4
.9
5.2
5
.9
6.5
7
.6
9.1
1
0.0
1
1.8
1
2.6
1
4.4
4:
9
57
-0
.300
1
7.6
104
0
.2501
3
4.5
4
.9
5.2
5
.9
6.5
7
.6
9.0
1
0.0
1
1.8
1
2.6
1
4.4
4:1
0
58
-0
.302
8
7.5
968
0
.2518
6
4.4
4
.9
5.1
5
.9
6.4
7
.6
9.0
1
0.0
1
1.8
1
2.7
1
4.5
4:1
1
59
-0
.305
5
7.5
835
0
.2536
0
4.4
4
.9
5.1
5
.9
6.4
7
.6
9.0
1
0.0
1
1.8
1
2.7
1
4.5
5:
0
60
-0
.308
1
7.5
706
0
.2553
3
4.4
4
.8
5.1
5
.9
6.4
7
.6
9.0
1
0.0
1
1.9
1
2.7
1
4.6
Triceps skinfold-for-age, boys 127

Ta
ble
44
Tri
cep
s sk
info
ld-f
or-
ag
e fo
r b
oy
s, a
ge
in y
ears
an
d m
on
ths
(co
nti
nu
ed)
Z
-sco
res
(tri
cep
s sk
info
ld i
n m
m)
Yea
r: M
on
th
Mon
th
L
M
S
-3 S
D
-2 S
D
-1 S
D
Med
ian
1
SD
2
SD
3
SD
0:
3
3
0.0
027
9
.7639
0
.1661
8
5.9
7
.0
8.3
9
.8
11.5
1
3.6
1
6.1
0:
4
4
-0.0
16
5
9.5
840
0
.1726
4
5.7
6
.8
8.1
9
.6
11.4
1
3.5
1
6.1
0:
5
5
-0.0
32
6
9.3
885
0
.1782
4
5.5
6
.6
7.9
9
.4
11.2
1
3.4
1
6.1
0:
6
6
-0.0
46
6
9.1
729
0
.1830
4
5.3
6
.4
7.6
9
.2
11.0
1
3.3
1
6.0
0:
7
7
-0.0
59
0
8.9
535
0
.1868
5
5.2
6
.2
7.4
9
.0
10.8
1
3.1
1
5.8
0:
8
8
-0.0
70
3
8.7
435
0
.1896
8
5.0
6
.0
7.2
8
.7
10.6
1
2.8
1
5.6
0:
9
9
-0.0
80
6
8.5
518
0
.1916
6
4.9
5
.9
7.1
8
.6
10.4
1
2.6
1
5.4
0:1
0
10
-0
.090
1
8.3
812
0
.1930
0
4.8
5
.7
6.9
8
.4
10.2
1
2.4
1
5.2
0:1
1
11
-0
.099
0
8.2
323
0
.1938
9
4.7
5
.6
6.8
8
.2
10.0
1
2.2
1
5.0
1:
0
12
-0
.107
3
8.1
041
0
.1945
3
4.6
5
.5
6.7
8
.1
9.9
1
2.1
1
4.8
1:
1
13
-0
.115
2
7.9
958
0
.1950
6
4.5
5
.5
6.6
8
.0
9.7
1
1.9
1
4.7
1:
2
14
-0
.122
7
7.9
064
0
.1955
8
4.5
5
.4
6.5
7
.9
9.6
1
1.8
1
4.5
1:
3
15
-0
.129
7
7.8
345
0
.1961
2
4.4
5
.3
6.5
7
.8
9.6
1
1.7
1
4.4
1:
4
16
-0
.136
5
7.7
781
0
.1966
8
4.4
5
.3
6.4
7
.8
9.5
1
1.7
1
4.4
1:
5
17
-0
.143
0
7.7
351
0
.1972
8
4.4
5
.3
6.4
7
.7
9.4
1
1.6
1
4.4
1:
6
18
-0
.149
2
7.7
036
0
.1979
3
4.4
5
.2
6.3
7
.7
9.4
1
1.6
1
4.3
1:
7
19
-0
.155
2
7.6
821
0
.1986
2
4.3
5
.2
6.3
7
.7
9.4
1
1.6
1
4.4
1:
8
20
-0
.160
9
7.6
697
0
.1993
7
4.3
5
.2
6.3
7
.7
9.4
1
1.6
1
4.4
1:
9
21
-0
.166
5
7.6
652
0
.2001
8
4.3
5
.2
6.3
7
.7
9.4
1
1.6
1
4.4
1:1
0
22
-0
.171
9
7.6
675
0
.2010
5
4.3
5
.2
6.3
7
.7
9.4
1
1.6
1
4.5
1:1
1
23
-0
.177
1
7.6
750
0
.2019
6
4.3
5
.2
6.3
7
.7
9.4
1
1.7
1
4.6
2:
0
24
-0
.182
1
7.6
863
0
.2029
3
4.3
5
.2
6.3
7
.7
9.5
1
1.7
1
4.7
128 Triceps skinfold-for-age, boys
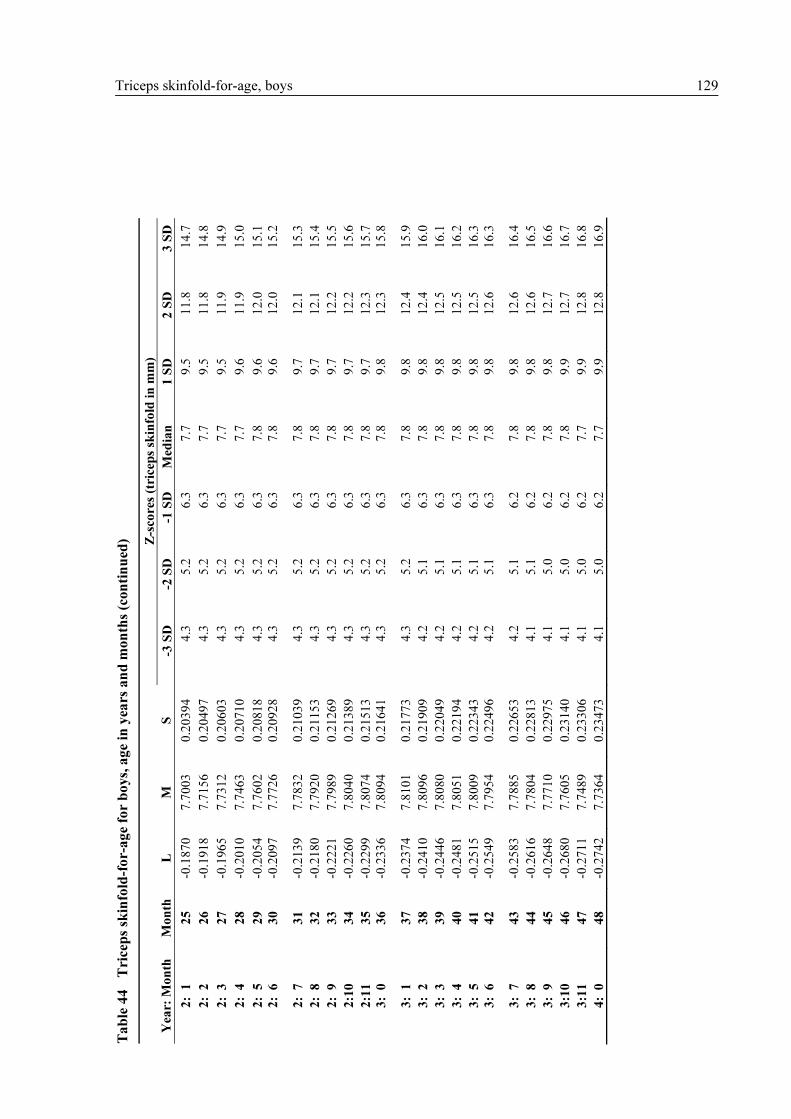
Ta
ble
44
Tri
cep
s sk
info
ld-f
or-
ag
e fo
r b
oy
s, a
ge
in y
ears
an
d m
on
ths
(co
nti
nu
ed)
Z
-sco
res
(tri
cep
s sk
info
ld i
n m
m)
Yea
r: M
on
th
Mon
th
L
M
S
-3 S
D
-2 S
D
-1 S
D
Med
ian
1
SD
2
SD
3
SD
2:
1
25
-0
.187
0
7.7
003
0
.2039
4
4.3
5
.2
6.3
7
.7
9.5
1
1.8
1
4.7
2:
2
26
-0
.191
8
7.7
156
0
.2049
7
4.3
5
.2
6.3
7
.7
9.5
1
1.8
1
4.8
2:
3
27
-0
.196
5
7.7
312
0
.2060
3
4.3
5
.2
6.3
7
.7
9.5
1
1.9
1
4.9
2:
4
28
-0
.201
0
7.7
463
0
.2071
0
4.3
5
.2
6.3
7
.7
9.6
1
1.9
1
5.0
2:
5
29
-0
.205
4
7.7
602
0
.2081
8
4.3
5
.2
6.3
7
.8
9.6
1
2.0
1
5.1
2:
6
30
-0
.209
7
7.7
726
0
.2092
8
4.3
5
.2
6.3
7
.8
9.6
1
2.0
1
5.2
2:
7
31
-0
.213
9
7.7
832
0
.2103
9
4.3
5
.2
6.3
7
.8
9.7
1
2.1
1
5.3
2:
8
32
-0
.218
0
7.7
920
0
.2115
3
4.3
5
.2
6.3
7
.8
9.7
1
2.1
1
5.4
2:
9
33
-0
.222
1
7.7
989
0
.2126
9
4.3
5
.2
6.3
7
.8
9.7
1
2.2
1
5.5
2:1
0
34
-0
.226
0
7.8
040
0
.2138
9
4.3
5
.2
6.3
7
.8
9.7
1
2.2
1
5.6
2:1
1
35
-0
.229
9
7.8
074
0
.2151
3
4.3
5
.2
6.3
7
.8
9.7
1
2.3
1
5.7
3:
0
36
-0
.233
6
7.8
094
0
.2164
1
4.3
5
.2
6.3
7
.8
9.8
1
2.3
1
5.8
3:
1
37
-0
.237
4
7.8
101
0
.2177
3
4.3
5
.2
6.3
7
.8
9.8
1
2.4
1
5.9
3:
2
38
-0
.241
0
7.8
096
0
.2190
9
4.2
5
.1
6.3
7
.8
9.8
1
2.4
1
6.0
3:
3
39
-0
.244
6
7.8
080
0
.2204
9
4.2
5
.1
6.3
7
.8
9.8
1
2.5
1
6.1
3:
4
40
-0
.248
1
7.8
051
0
.2219
4
4.2
5
.1
6.3
7
.8
9.8
1
2.5
1
6.2
3:
5
41
-0
.251
5
7.8
009
0
.2234
3
4.2
5
.1
6.3
7
.8
9.8
1
2.5
1
6.3
3:
6
42
-0
.254
9
7.7
954
0
.2249
6
4.2
5
.1
6.3
7
.8
9.8
1
2.6
1
6.3
3:
7
43
-0
.258
3
7.7
885
0
.2265
3
4.2
5
.1
6.2
7
.8
9.8
1
2.6
1
6.4
3:
8
44
-0
.261
6
7.7
804
0
.2281
3
4.1
5
.1
6.2
7
.8
9.8
1
2.6
1
6.5
3:
9
45
-0
.264
8
7.7
710
0
.2297
5
4.1
5
.0
6.2
7
.8
9.8
1
2.7
1
6.6
3:1
0
46
-0
.268
0
7.7
605
0
.2314
0
4.1
5
.0
6.2
7
.8
9.9
1
2.7
1
6.7
3:1
1
47
-0
.271
1
7.7
489
0
.2330
6
4.1
5
.0
6.2
7
.7
9.9
1
2.8
1
6.8
4:
0
48
-0
.274
2
7.7
364
0
.2347
3
4.1
5
.0
6.2
7
.7
9.9
1
2.8
1
6.9
Triceps skinfold-for-age, boys 129

Ta
ble
44
Tri
cep
s sk
info
ld-f
or-
ag
e fo
r b
oy
s, a
ge
in y
ears
an
d m
on
ths
(co
nti
nu
ed)
Z
-sco
res
(tri
cep
s sk
info
ld i
n m
m)
Yea
r: M
on
th
Mon
th
L
M
S
-3 S
D
-2 S
D
-1 S
D
Med
ian
1
SD
2
SD
3
SD
4:
1
49
-0
.277
2
7.7
233
0
.2364
2
4.0
5
.0
6.1
7
.7
9.9
1
2.8
1
7.0
4:
2
50
-0
.280
2
7.7
096
0
.2381
1
4.0
4
.9
6.1
7
.7
9.9
1
2.9
1
7.1
4:
3
51
-0
.283
2
7.6
955
0
.2398
1
4.0
4
.9
6.1
7
.7
9.9
1
2.9
1
7.2
4:
4
52
-0
.286
1
7.6
812
0
.2415
1
4.0
4
.9
6.1
7
.7
9.9
1
2.9
1
7.3
4:
5
53
-0
.289
0
7.6
669
0
.2432
2
4.0
4
.9
6.1
7
.7
9.9
1
3.0
1
7.4
4:
6
54
-0
.291
8
7.6
525
0
.2449
4
3.9
4
.8
6.0
7
.7
9.9
1
3.0
1
7.5
4:
7
55
-0
.294
6
7.6
383
0
.2466
6
3.9
4
.8
6.0
7
.6
9.9
1
3.0
1
7.6
4:
8
56
-0
.297
4
7.6
242
0
.2483
9
3.9
4
.8
6.0
7
.6
9.9
1
3.1
1
7.7
4:
9
57
-0
.300
1
7.6
104
0
.2501
3
3.9
4
.8
6.0
7
.6
9.9
1
3.1
1
7.8
4:1
0
58
-0
.302
8
7.5
968
0
.2518
6
3.8
4
.8
6.0
7
.6
9.9
1
3.1
1
7.9
4:1
1
59
-0
.305
5
7.5
835
0
.2536
0
3.8
4
.7
5.9
7
.6
9.9
1
3.2
1
8.0
5:
0
60
-0
.308
1
7.5
706
0
.2553
3
3.8
4
.7
5.9
7
.6
9.9
1
3.2
1
8.1
130 Triceps skinfold-for-age, boys
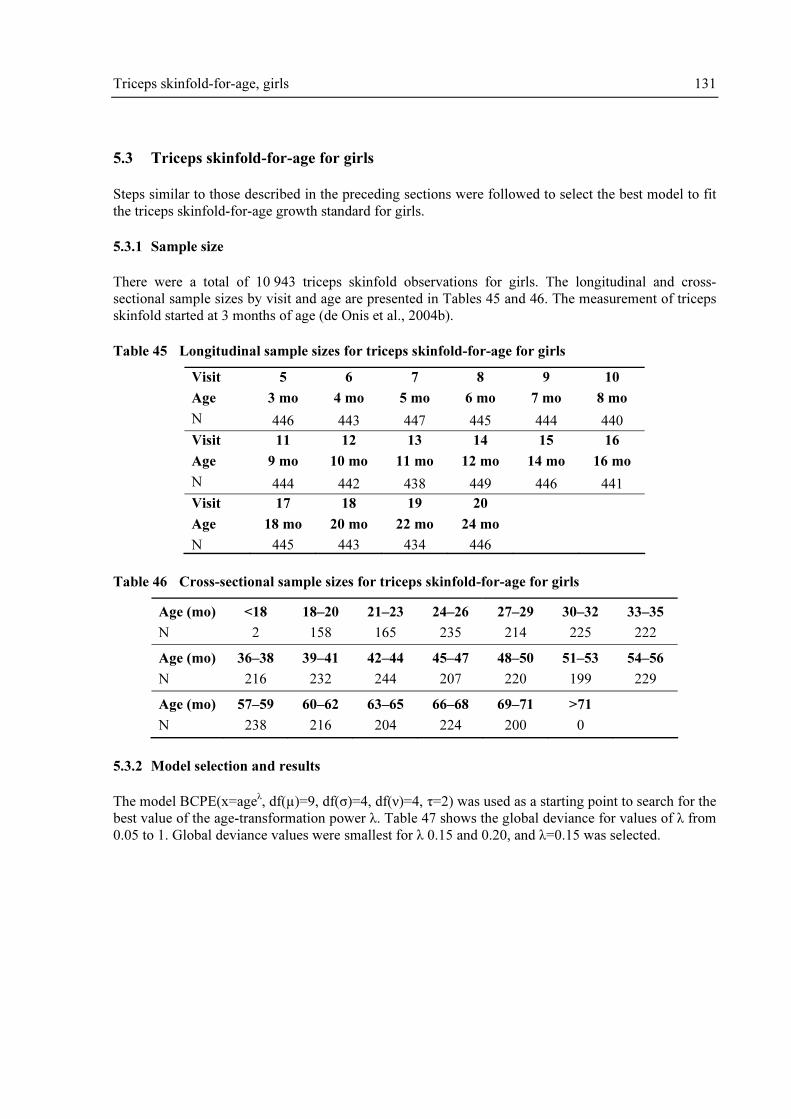
Triceps skinfold-for-age, girls 131
5.3 Triceps skinfold-for-age for girls
Steps similar to those described in the preceding sections were followed to select the best model to fit
the triceps skinfold-for-age growth standard for girls.
5.3.1 Sample size
There were a total of 10 943 triceps skinfold observations for girls. The longitudinal and cross-
sectional sample sizes by visit and age are presented in Tables 45 and 46. The measurement of triceps
skinfold started at 3 months of age (de Onis et al., 2004b).
Table 45 Longitudinal sample sizes for triceps skinfold-for-age for girls
Visit 5 6 7 8 9 10
Age 3 mo 4 mo 5 mo 6 mo 7 mo 8 mo
N 446 443 447 445 444 440
Visit 11 12 13 14 15 16
Age 9 mo 10 mo 11 mo 12 mo 14 mo 16 mo
N 444 442 438 449 446 441
Visit 17 18 19 20
Age 18 mo 20 mo 22 mo 24 mo
N 445 443 434 446
Table 46 Cross-sectional sample sizes for triceps skinfold-for-age for girls
Age (mo) <18 18–20 21–23 24–26 27–29 30–32 33–35
N 2 158 165 235 214 225 222
Age (mo) 36–38 39–41 42–44 45–47 48–50 51–53 54–56
N 216 232 244 207 220 199 229
Age (mo) 57–59 60–62 63–65 66–68 69–71 >71
N 238 216 204 224 200 0
5.3.2 Model selection and results
The model BCPE(x=ageλ, df(µ)=9, df(σ)=4, df(ν)=4, τ=2) was used as a starting point to search for the
best value of the age-transformation power λ. Table 47 shows the global deviance for values of λ from
0.05 to 1. Global deviance values were smallest for λ 0.15 and 0.20, and λ=0.15 was selected.

132 Triceps skinfold-for-age, girls
Table 47 Global deviance (GD) for models within the class BCPE(x=ageλ, df(µ)=9, df(σ)=4,
df(ν)=4, τ=2) for triceps skinfold-for-age for girls
λ 0.05 0.10 0.15 0.20 0.25 0.30 0.35 0.40 0.45 0.50
GDa
761.4 761.1 761.0 761.0 761.3 761.8 762.4 763.3 764.2 765.4
λ 0.55 0.60 0.65 0.70 0.75 0.80 0.85 0.90 0.95 1.00
GDa
766.7 768.0 769.4 770.8 772.3 773.7 775.1 776.4 777.7 779.0
a In excess of 43 000.
The search for the best df(µ) and df(σ) followed, fixing λ=0.15, ν=1 and τ=2. All possible
combinations with df(µ) values ranging from 6 to 15 and df(σ) from 2 to 10 were considered and
partial results are presented in Table 48. Only GAIC(3) was considered for selecting the best
combination. The model with df(µ)=7 and df(σ)=5 provided the smallest value of GAIC(3) and it was
thus selected for further evaluation.
Table 48 Goodness-of-fit summary for models using the BCPE distribution with fixed ν=1 and
τ=2 for triceps skinfold-for-age for girls
df(µ) df(σ) GDa
AICa
GAIC(3)a
Total df
3 1775.3 1793.3 1802.3 9.0
4 1759.0 1779.0 1789.0 10.0
5 1753.2 1775.2 1786.2 11.0
6 1751.2 1775.2 1787.2 12.0
6
7 1749.9 1775.9 1788.9 13.0
3 1770.9 1790.9 1800.9 10.0
4 1754.5 1776.5 1787.5 11.0
5 1748.4 1772.4 1784.4 12.0
6 1746.2 1772.2 1785.2 13.0
7
7 1744.9 1772.9 1786.9 14.0
3 1768.3 1790.3 1801.3 11.0
4 1751.7 1775.7 1787.7 12.0
5 1745.5 1771.5 1784.5 13.0
6 1743.2 1771.2 1785.2 14.0
8
7 1741.8 1771.8 1786.8 15.0
3 1766.4 1790.4 1802.4 12.0
4 1749.7 1775.7 1788.7 13.0
5 1743.4 1771.4 1785.4 14.0
6 1741.1 1771.1 1786.1 15.0
9
7 1739.7 1771.7 1787.7 16.0
3 1764.9 1790.9 1803.9 13.0
4 1748.2 1776.2 1790.2 14.0
5 1741.8 1771.8 1786.8 15.0
6 1739.5 1771.5 1787.5 16.0
10
7 1738.0 1772.0 1789.0 17.0
GD, Global Deviance; AIC, Akaike Information Criterion;
GAIC(3), Generalized AIC with penalty equal to 3; a In excess of 43 000.

Triceps skinfold-for-age, girls 133
Model 1: BCPE(x=age0.15
, df(µ)=7, df(σ)=5, ν=1, τ=2)
This model showed inadequacy as it clearly pointed to residual skewness in both the worm plots
(Figure 56) and the Q-test results (Table 49). The worms presented U-shapes in all age groups and the
Q-test results (Table 49) showed all groups with absolute values of z3 higher than 2. Most of the age
groups also presented absolute values of z4 higher than 2, indicating residual kurtosis. Both overall
tests for skewness and kurtosis were significant (p-value < 0.01). No misfit could be detected in the
mean and the variance.
3 mo 4 mo 5 mo 6 mo 7 mo
8 mo 9 mo 10 mo 11 mo 12 mo
14 mo 16 mo 18 mo 20 mo 22 mo
24 mo 28 mo 34 mo 40 mo 46 mo
52 mo 58 mo 64 mo 70 mo
3 mo 4 mo 5 mo 6 mo 7 mo
8 mo 9 mo 10 mo 11 mo 12 mo
14 mo 16 mo 18 mo 20 mo 22 mo
24 mo 28 mo 34 mo 40 mo 46 mo
52 mo 58 mo 64 mo 70 mo
3 mo 4 mo 5 mo 6 mo 7 mo
8 mo 9 mo 10 mo 11 mo 12 mo
14 mo 16 mo 18 mo 20 mo 22 mo
24 mo 28 mo 34 mo 40 mo 46 mo
52 mo 58 mo 64 mo 70 mo
Figure 56 Worm plots of z-scores for Model 1 for triceps skinfold-for-age for girls
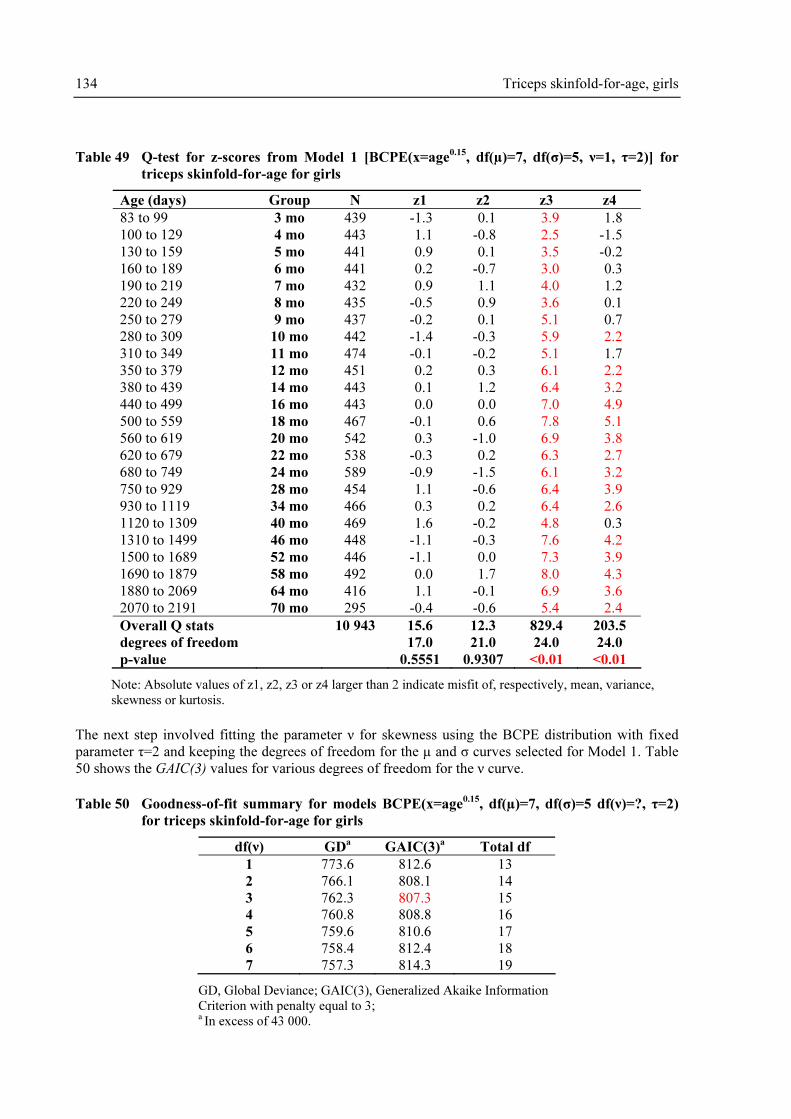
134 Triceps skinfold-for-age, girls
Table 49 Q-test for z-scores from Model 1 [BCPE(x=age0.15
, df(µ)=7, df(σ)=5, ν=1, τ=2)] for
triceps skinfold-for-age for girls
Age (days) Group N z1 z2 z3 z4
83 to 99 3 mo 439 -1.3 0.1 3.9 1.8
100 to 129 4 mo 443 1.1 -0.8 2.5 -1.5
130 to 159 5 mo 441 0.9 0.1 3.5 -0.2
160 to 189 6 mo 441 0.2 -0.7 3.0 0.3
190 to 219 7 mo 432 0.9 1.1 4.0 1.2
220 to 249 8 mo 435 -0.5 0.9 3.6 0.1
250 to 279 9 mo 437 -0.2 0.1 5.1 0.7
280 to 309 10 mo 442 -1.4 -0.3 5.9 2.2
310 to 349 11 mo 474 -0.1 -0.2 5.1 1.7
350 to 379 12 mo 451 0.2 0.3 6.1 2.2
380 to 439 14 mo 443 0.1 1.2 6.4 3.2
440 to 499 16 mo 443 0.0 0.0 7.0 4.9
500 to 559 18 mo 467 -0.1 0.6 7.8 5.1
560 to 619 20 mo 542 0.3 -1.0 6.9 3.8
620 to 679 22 mo 538 -0.3 0.2 6.3 2.7
680 to 749 24 mo 589 -0.9 -1.5 6.1 3.2
750 to 929 28 mo 454 1.1 -0.6 6.4 3.9
930 to 1119 34 mo 466 0.3 0.2 6.4 2.6
1120 to 1309 40 mo 469 1.6 -0.2 4.8 0.3
1310 to 1499 46 mo 448 -1.1 -0.3 7.6 4.2
1500 to 1689 52 mo 446 -1.1 0.0 7.3 3.9
1690 to 1879 58 mo 492 0.0 1.7 8.0 4.3
1880 to 2069 64 mo 416 1.1 -0.1 6.9 3.6
2070 to 2191 70 mo 295 -0.4 -0.6 5.4 2.4
Overall Q stats 10 943 15.6 12.3 829.4 203.5
degrees of freedom 17.0 21.0 24.0 24.0
p-value 0.5551 0.9307 <0.01 <0.01
Note: Absolute values of z1, z2, z3 or z4 larger than 2 indicate misfit of, respectively, mean, variance,
skewness or kurtosis.
The next step involved fitting the parameter ν for skewness using the BCPE distribution with fixed
parameter τ=2 and keeping the degrees of freedom for the µ and σ curves selected for Model 1. Table
50 shows the GAIC(3) values for various degrees of freedom for the ν curve.
Table 50 Goodness-of-fit summary for models BCPE(x=age0.15
, df(µ)=7, df(σ)=5 df(ν)=?, τ=2)
for triceps skinfold-for-age for girls
df(ν) GDa
GAIC(3)a
Total df
1 773.6 812.6 13
2 766.1 808.1 14
3 762.3 807.3 15
4 760.8 808.8 16
5 759.6 810.6 17
6 758.4 812.4 18
7 757.3 814.3 19
GD, Global Deviance; GAIC(3), Generalized Akaike Information
Criterion with penalty equal to 3; a In excess of 43 000.
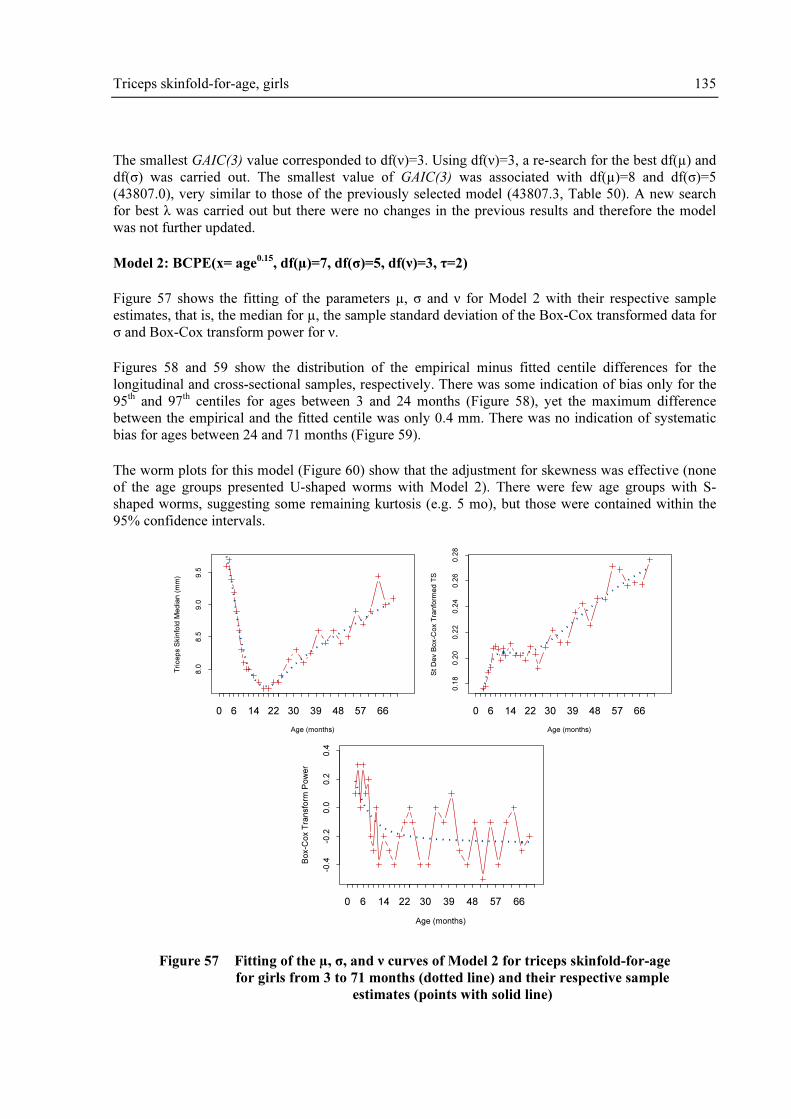
Triceps skinfold-for-age, girls 135
The smallest GAIC(3) value corresponded to df(ν)=3. Using df(ν)=3, a re-search for the best df(µ) and
df(σ) was carried out. The smallest value of GAIC(3) was associated with df(µ)=8 and df(σ)=5
(43807.0), very similar to those of the previously selected model (43807.3, Table 50). A new search
for best λ was carried out but there were no changes in the previous results and therefore the model
was not further updated.
Model 2: BCPE(x= age0.15
, df(µ)=7, df(σ)=5, df(ν)=3, τ=2)
Figure 57 shows the fitting of the parameters µ, σ and ν for Model 2 with their respective sample
estimates, that is, the median for µ, the sample standard deviation of the Box-Cox transformed data for
σ and Box-Cox transform power for ν.
Figures 58 and 59 show the distribution of the empirical minus fitted centile differences for the
longitudinal and cross-sectional samples, respectively. There was some indication of bias only for the
95th and 97
th centiles for ages between 3 and 24 months (Figure 58), yet the maximum difference
between the empirical and the fitted centile was only 0.4 mm. There was no indication of systematic
bias for ages between 24 and 71 months (Figure 59).
The worm plots for this model (Figure 60) show that the adjustment for skewness was effective (none
of the age groups presented U-shaped worms with Model 2). There were few age groups with S-
shaped worms, suggesting some remaining kurtosis (e.g. 5 mo), but those were contained within the
95% confidence intervals.
Age (months)
Tri
ce
ps S
kin
fold
Me
dia
n (
mm
)
8.0
8.5
9.0
9.5
0 6 14 22 30 39 48 57 66
Age (months)
St D
ev B
ox-C
ox T
ran
form
ed
TS
0.1
80
.20
0.2
20
.24
0.2
60
.28
0 6 14 22 30 39 48 57 66
Age (months)
Bo
x-C
ox T
ran
sfo
rm P
ow
er
-0.4
-0.2
0.0
0.2
0.4
0 6 14 22 30 39 48 57 66
Figure 57 Fitting of the µ, σ, and ν curves of Model 2 for triceps skinfold-for-age
for girls from 3 to 71 months (dotted line) and their respective sample
estimates (points with solid line)

136 Triceps skinfold-for-age, girls
3rd Centile-0.4
0.0
0.2
0.4
4 6 8 10 14 18 22
5th Centile
-0.4
0.0
0.2
0.4
4 6 8 10 14 18 22
10th Centile
-0.4
0.0
0.2
0.4
4 6 8 10 14 18 22
25th Centile
-0.4
0.0
0.2
0.4
4 6 8 10 14 18 22
50th Centile
-0.4
0.0
0.2
0.4
4 6 8 10 14 18 22
75th Centile
-0.4
0.0
0.2
0.4
4 6 8 10 14 18 22
90th Centile
-0.4
0.0
0.2
0.4
4 6 8 10 14 18 22
95th Centile
-0.4
0.0
0.2
0.4
4 6 8 10 14 18 22
97th Centile
-0.4
0.0
0.2
0.4
4 6 8 10 14 18 22
Age (months)
Em
pir
ica
l-F
itte
d C
en
tile
fo
r T
rice
ps S
kin
fold
(m
m)
Figure 58 Centile residuals from fitting Model 2 for triceps skinfold-for-age
from 3 to 24 months for girls
3rd Centile
-1.0
0.0
0.5
1.0
25 31 37 43 49 55 61 67
5th Centile
-1.0
0.0
0.5
1.0
25 31 37 43 49 55 61 67
10th Centile
-1.0
0.0
0.5
1.0
25 31 37 43 49 55 61 67
25th Centile
-1.0
0.0
0.5
1.0
25 31 37 43 49 55 61 67
50th Centile
-1.0
0.0
0.5
1.0
25 31 37 43 49 55 61 67
75th Centile
-1.0
0.0
0.5
1.0
25 31 37 43 49 55 61 67
90th Centile
-1.0
0.0
0.5
1.0
25 31 37 43 49 55 61 67
95th Centile
-1.0
0.0
0.5
1.0
25 31 37 43 49 55 61 67
97th Centile
-1.0
0.0
0.5
1.0
25 31 37 43 49 55 61 67
Age (months)
Em
pir
ica
l-F
itte
d C
en
tile
fo
r T
rice
ps S
kin
fold
(m
m)
Figure 59 Centile residuals from fitting Model 2 for triceps skinfold-for-age
from 24 to 71 months for girls

Triceps skinfold-for-age, girls 137
3 mo 4 mo 5 mo 6 mo 7 mo
8 mo 9 mo 10 mo 11 mo 12 mo
14 mo 16 mo 18 mo 20 mo 22 mo
24 mo 28 mo 34 mo 40 mo 46 mo
52 mo 58 mo 64 mo 70 mo
3 mo 4 mo 5 mo 6 mo 7 mo
8 mo 9 mo 10 mo 11 mo 12 mo
14 mo 16 mo 18 mo 20 mo 22 mo
24 mo 28 mo 34 mo 40 mo 46 mo
52 mo 58 mo 64 mo 70 mo
3 mo 4 mo 5 mo 6 mo 7 mo
8 mo 9 mo 10 mo 11 mo 12 mo
14 mo 16 mo 18 mo 20 mo 22 mo
24 mo 28 mo 34 mo 40 mo 46 mo
52 mo 58 mo 64 mo 70 mo
Figure 60 Worm plots of z-scores for Model 2 for triceps skinfold-for-age for girls
The Q-test results from Model 2 are shown in Table 51. There was no indication of misfit of the mean
or variance, as neither z1 nor z2 absolute values were larger than 2. There were also no groups with z3
absolute value larger than 2, indicating no remaining skewness. Only one age group presented an
absolute value of z4 greater than 2 (5 mo), suggesting remaining kurtosis, but the overall test statistic
for kurtosis had a p-value that was not significant at the 5% level. The overall Q-test p-values were all
non-significant, indicating an adequate fit of the girls' triceps skinfold-for-age curves and providing no
justification for increasing the complexity of the model by adjusting for kurtosis (modelling τ).
Table 52 presents observed percentages with triceps skinfolds below the fitted centiles. There was no
detectable pattern suggesting systematic bias, even though some detectable deviations occur
sporadically (e.g. only 0.9 % of children have triceps skinfolds below the 3rd
centile at age 12 months).

138 Triceps skinfold-for-age, girls
Table 51 Q-test for z-scores from Model 2 [BCPE(x=age0.15
, df(µ)=7, df(σ)=5, df(ν)=3, τ=2)] for
triceps skinfold-for-age for girls
Age (days) Group N z1 z2 z3 z4
83 to 99 3 mo 439 -1.4 0.1 0.3 0.3
100 to 129 4 mo 443 1.1 -1.0 -0.6 -1.9
130 to 159 5 mo 441 0.9 -0.1 0.1 -2.5
160 to 189 6 mo 441 0.3 -0.4 -1.3 -0.6
190 to 219 7 mo 432 0.8 1.0 -0.6 -0.9
220 to 249 8 mo 435 -0.5 1.4 -1.1 -0.9
250 to 279 9 mo 437 -0.1 -0.1 1.0 -1.9
280 to 309 10 mo 442 -1.3 -0.2 1.1 0.1
310 to 349 11 mo 474 0.1 0.1 -0.4 -0.1
350 to 379 12 mo 451 0.3 -0.1 1.5 -1.3
380 to 439 14 mo 443 0.0 1.0 0.5 0.7
440 to 499 16 mo 443 0.1 -0.2 0.5 1.1
500 to 559 18 mo 467 -0.2 0.1 1.2 1.6
560 to 619 20 mo 542 0.3 -1.1 0.0 1.5
620 to 679 22 mo 538 -0.6 0.5 0.0 -0.5
680 to 749 24 mo 589 -1.1 -0.6 -1.4 1.6
750 to 929 28 mo 454 1.0 -0.9 -0.1 0.4
930 to 1119 34 mo 466 0.2 0.1 0.3 -0.3
1120 to 1309 40 mo 469 1.6 -0.1 -1.0 -1.4
1310 to 1499 46 mo 448 -1.0 -0.3 0.8 0.6
1500 to 1689 52 mo 446 -1.0 0.2 0.5 -0.1
1690 to 1879 58 mo 492 -0.1 1.4 0.1 0.1
1880 to 2069 64 mo 416 1.3 -0.4 -1.0 1.2
2070 to 2191 70 mo 295 -0.4 -0.2 0.1 -1.7
Overall Q stats 10 943 16.0 10.4 15.6 33.7
degrees of freedom 17.0 21.0 21.0 24.0
p-value 0.5206 0.9736 0.7938 0.0899
Note: Absolute values of z1, z2, z3 or z4 larger than 2 indicate misfit of, respectively, mean, variance,
skewness or kurtosis.
The model BCPE(x=age0.15
, df(µ)=7, df(σ)=5, df(ν)=3, τ=2) was considered adequate and thus
selected for constructing the triceps skinfold-for-age growth curves for girls. It adjusts only for
skewness, since there was no evidence of significant kurtosis. The fitted centile curves and empirical
centiles are shown in Figures 61 to 64.
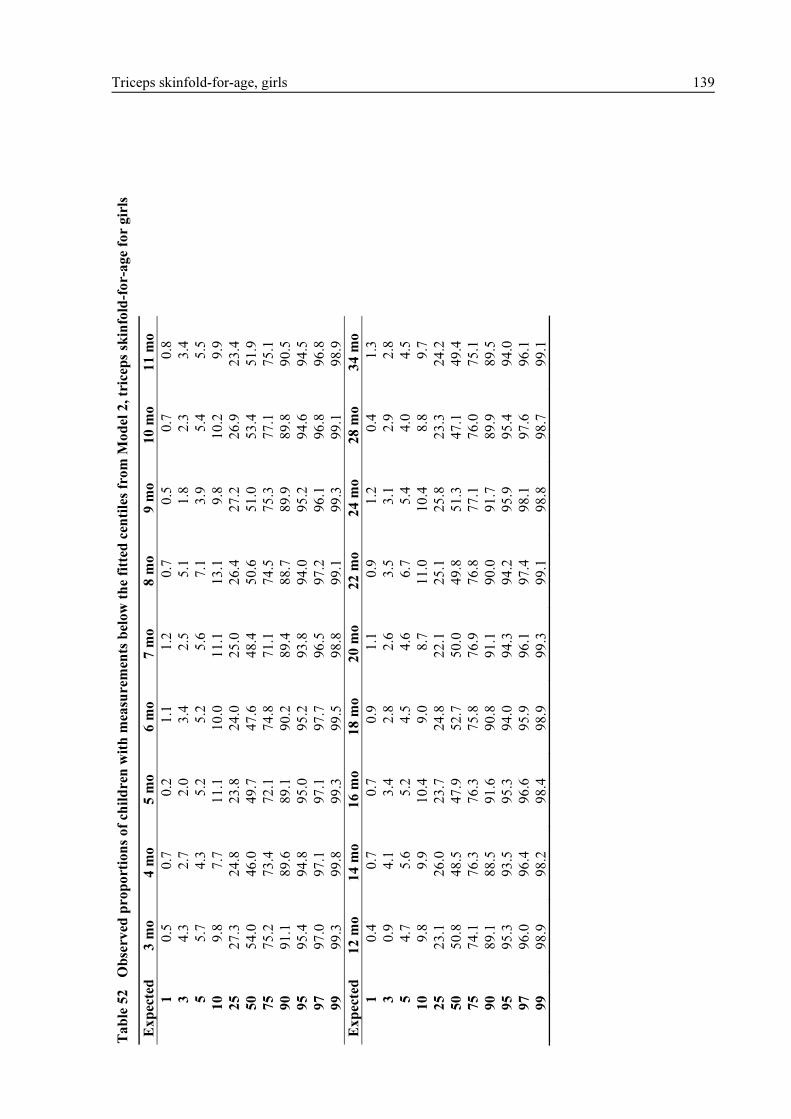
Ta
ble
52
Ob
serv
ed p
ro
po
rtio
ns
of
chil
dre
n w
ith
mea
surem
ents
bel
ow
th
e fi
tted
cen
tile
s fr
om
Mo
del
2, tr
icep
s sk
info
ld-f
or-
ag
e fo
r g
irls
Ex
pec
ted
3
mo
4
mo
5
mo
6
mo
7
mo
8
mo
9
mo
1
0 m
o
11
mo
1
0.5
0
.7
0.2
1
.1
1.2
0
.7
0.5
0
.7
0.8
3
4.3
2
.7
2.0
3
.4
2.5
5
.1
1.8
2
.3
3.4
5
5.7
4
.3
5.2
5
.2
5.6
7
.1
3.9
5
.4
5.5
10
9
.8
7.7
1
1.1
1
0.0
1
1.1
1
3.1
9
.8
10
.2
9.9
25
2
7.3
2
4.8
2
3.8
2
4.0
2
5.0
2
6.4
2
7.2
2
6.9
2
3.4
50
5
4.0
4
6.0
4
9.7
4
7.6
4
8.4
5
0.6
5
1.0
5
3.4
5
1.9
75
7
5.2
7
3.4
7
2.1
7
4.8
7
1.1
7
4.5
7
5.3
7
7.1
7
5.1
90
9
1.1
8
9.6
8
9.1
9
0.2
8
9.4
8
8.7
8
9.9
8
9.8
9
0.5
95
9
5.4
9
4.8
9
5.0
9
5.2
9
3.8
9
4.0
9
5.2
9
4.6
9
4.5
97
9
7.0
9
7.1
9
7.1
9
7.7
9
6.5
9
7.2
9
6.1
9
6.8
9
6.8
99
9
9.3
9
9.8
9
9.3
9
9.5
9
8.8
9
9.1
9
9.3
9
9.1
9
8.9
Ex
pec
ted
1
2 m
o
14
mo
1
6 m
o
18
mo
2
0 m
o
22
mo
2
4 m
o
28
mo
3
4 m
o
1
0.4
0
.7
0.7
0
.9
1.1
0
.9
1.2
0
.4
1.3
3
0.9
4
.1
3.4
2
.8
2.6
3
.5
3.1
2
.9
2.8
5
4.7
5
.6
5.2
4
.5
4.6
6
.7
5.4
4
.0
4.5
10
9
.8
9.9
1
0.4
9
.0
8.7
1
1.0
1
0.4
8
.8
9.7
25
2
3.1
2
6.0
2
3.7
2
4.8
2
2.1
2
5.1
2
5.8
2
3.3
2
4.2
50
5
0.8
4
8.5
4
7.9
5
2.7
5
0.0
4
9.8
5
1.3
4
7.1
4
9.4
75
7
4.1
7
6.3
7
6.3
7
5.8
7
6.9
7
6.8
7
7.1
7
6.0
7
5.1
90
8
9.1
8
8.5
9
1.6
9
0.8
9
1.1
9
0.0
9
1.7
8
9.9
8
9.5
95
9
5.3
9
3.5
9
5.3
9
4.0
9
4.3
9
4.2
9
5.9
9
5.4
9
4.0
97
9
6.0
9
6.4
9
6.6
9
5.9
9
6.1
9
7.4
9
8.1
9
7.6
9
6.1
99
9
8.9
9
8.2
9
8.4
9
8.9
9
9.3
9
9.1
9
8.8
9
8.7
9
9.1
Triceps skinfold-for-age, girls 139

Ta
ble
52
Ob
serv
ed p
ro
po
rtio
ns
of
chil
dre
n w
ith
mea
surem
ents
bel
ow
th
e fi
tted
cen
tile
s fr
om
Mo
del
2, tr
icep
s sk
info
ld-f
or-
ag
e fo
r g
irls
(co
nt)
Ex
pec
ted
4
0 m
o
46
mo
5
2 m
o
58
mo
6
4 m
o
70
mo
O
ver
all
1
0.9
1
.1
1.1
1
.8
1.4
0
.7
0.9
3
2.6
2
.5
3.4
3
.7
3.1
2
.4
3.0
5
4.5
5
.1
5.6
5
.1
4.1
5
.1
5.1
10
9
.2
10
.0
9.4
1
1.4
7
.9
12
.2
10
.0
25
2
2.0
2
6.8
2
6.0
2
5.8
2
2.6
2
5.8
2
4.8
50
4
6.7
5
2.0
5
3.6
4
9.0
4
6.9
5
1.9
5
0.0
75
7
2.9
7
7.5
7
6.5
7
5.6
7
5.7
7
4.2
7
5.3
90
8
7.8
9
1.3
9
0.6
8
9.0
8
8.7
9
0.5
9
0.0
95
9
4.5
9
4.2
9
4.8
9
4.9
9
4.0
9
5.3
9
4.7
97
9
6.6
9
6.9
9
6.6
9
6.1
9
7.1
9
8.0
9
6.8
99
9
9.8
9
8.7
9
8.9
9
8.6
9
8.3
9
9.3
9
9.0
No
te:
Gro
up l
abel
s co
rres
pond
to t
he
age
inte
rval
s in
Tab
le 5
1.
140 Triceps skinfold-for-age, girls
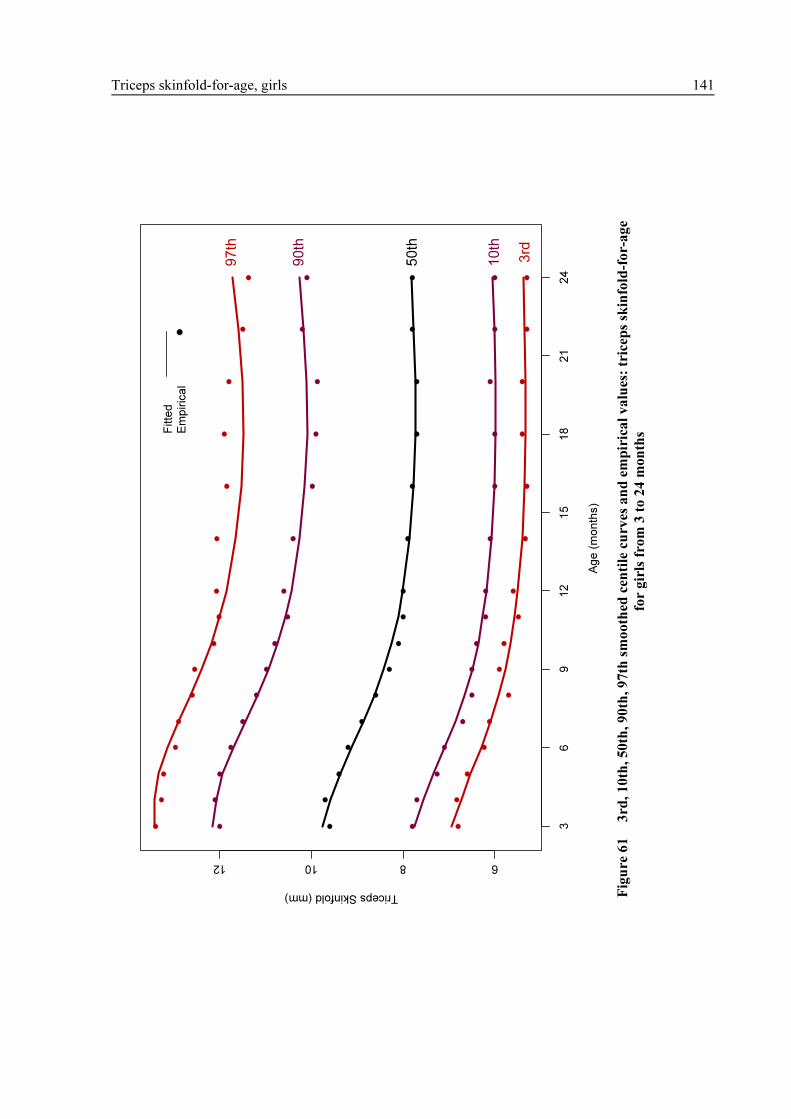
Age (
month
s)
Triceps Skinfold (mm)
681012
36
912
15
18
21
24
3rd
10th
50th
90th
97th
Fitte
d
Em
piric
al
Fig
ure
61
3rd
, 1
0th
, 5
0th
, 9
0th
, 9
7th
sm
oo
thed
cen
tile
cu
rves
an
d e
mp
iric
al
va
lues
: tr
icep
s sk
info
ld-f
or-
ag
e
for
gir
ls f
rom
3 t
o 2
4 m
on
ths
Triceps skinfold-for-age, girls 141

Ag
e (
mo
nth
s)
Triceps Skinfold (mm)
681012
36
91
21
51
82
12
4
5th
25th
50th
75th
95th
Fitte
d
Em
pir
ica
l
Fig
ure
62
5th
, 2
5th
, 5
0th
, 7
5th
, 9
5th
sm
oo
thed
cen
tile
cu
rves
an
d e
mp
iric
al
va
lues
: tr
icep
s sk
info
ld-f
or-
ag
e
for
gir
ls f
rom
3 t
o 2
4 m
on
ths
142 Triceps skinfold-for-age, girls

Ag
e (
mo
nth
s)
Triceps Skinfold (mm)
68101214
24
27
30
33
36
39
42
45
48
51
54
57
60
63
66
69
72
3rd
10th
50th
90th
97th
Fitte
d
Em
piric
al
Fig
ure
63
3rd
, 1
0th
, 5
0th
, 9
0th
, 9
7th
sm
oo
thed
cen
tile
cu
rves
an
d e
mp
iric
al
va
lues
: tr
icep
s sk
info
ld-f
or-
ag
e
for
gir
ls f
rom
24
to
71 m
on
ths
Triceps skinfold-for-age, girls 143

Ag
e (
mo
nth
s)
Triceps Skinfold (mm)
68101214
24
27
30
33
36
39
42
45
48
51
54
57
60
63
66
69
72
5th
25th
50th
75th
95th
Fitte
d
Em
pir
ica
l
Fig
ure
64
5th
, 2
5th
, 5
0th
, 7
5th
, 9
5th
sm
oo
thed
cen
tile
cu
rves
an
d e
mp
iric
al
va
lues
: tr
icep
s sk
info
ld-f
or-
ag
e
for
gir
ls f
rom
24
to
71 m
on
ths
144 Triceps skinfold-for-age, girls

Triceps skinfold-for-age, girls 145
5.3.3 WHO standards
This section presents the final WHO triceps skinfold-for-age z-score and percentile charts (Figures 65
and 66) and table (Table 53) for girls.

Ch
arts
Ag
e (
mo
nth
s)
Triceps Skinfold (mm)
5101520
24
68
12
16
20
24
28
32
36
40
44
48
52
56
60
123 0 -1 -2 -3
Fig
ure
65
WH
O t
rice
ps
skin
fold
-fo
r-a
ge
z-sc
ore
s fo
r g
irls
fro
m 3
to
60
mon
ths
146 Triceps skinfold-for-age, girls

Ag
e (
mo
nth
s)
Triceps Skinfold (mm)
68101214
24
68
12
16
20
24
28
32
36
40
44
48
52
56
60
3rd
50
th
97
th
15
th
85
th
Fig
ure
66
WH
O t
rice
ps
skin
fold
-fo
r-a
ge
per
cen
tile
s fo
r g
irls
fro
m 3
to
60 m
on
ths
Triceps skinfold-for-age, girls 147

Ta
ble
s
Ta
ble
53
Tri
cep
s sk
info
ld-f
or-
ag
e fo
r g
irls
, a
ge
in y
ears
an
d m
on
ths
P
erce
nti
les
(tri
cep
s sk
info
ld i
n m
m)
Yea
r: M
on
th
Mon
th
L
M
S
1st
3
rd
5th
1
5th
2
5th
5
0th
7
5th
8
5th
9
5th
9
7th
9
9th
0:
3
3
0.1
875
9
.7516
0
.1753
5
6.4
6
.9
7.2
8
.1
8.7
9
.8
11.0
1
1.7
1
2.9
1
3.4
1
4.4
0:
4
4
0.1
256
9
.5866
0
.1833
7
6.2
6
.7
7.0
7
.9
8.5
9
.6
10.8
1
1.6
1
2.9
1
3.4
1
4.5
0:
5
5
0.0
761
9
.3716
0
.1900
7
6.0
6
.5
6.8
7
.7
8.2
9
.4
10.6
1
1.4
1
2.8
1
3.3
1
4.5
0:
6
6
0.0
349
9
.1194
0
.1954
0
5.8
6
.3
6.6
7
.4
8.0
9
.1
10.4
1
1.2
1
2.6
1
3.1
1
4.3
0:
7
7
-0.0
00
3
8.8
621
0
.1993
4
5.6
6
.1
6.4
7
.2
7.7
8
.9
10.1
1
0.9
1
2.3
1
2.9
1
4.1
0:
8
8
-0.0
30
7
8.6
228
0
.2019
2
5.4
5
.9
6.2
7
.0
7.5
8
.6
9.9
1
0.6
1
2.0
1
2.6
1
3.8
0:
9
9
-0.0
57
2
8.4
164
0
.2033
9
5.3
5
.8
6.0
6
.8
7.3
8
.4
9.7
1
0.4
1
1.8
1
2.4
1
3.6
0:1
0
10
-0
.079
9
8.2
468
0
.2041
3
5.2
5
.7
5.9
6
.7
7.2
8
.2
9.5
1
0.2
1
1.6
1
2.2
1
3.4
0:1
1
11
-0
.099
5
8.1
114
0
.2044
2
5.1
5
.6
5.8
6
.6
7.1
8
.1
9.3
1
0.0
1
1.4
1
2.0
1
3.2
1:
0
12
-0
.116
1
8.0
042
0
.2044
5
5.0
5
.5
5.8
6
.5
7.0
8
.0
9.2
9
.9
11.3
1
1.9
1
3.1
1:
1
13
-0
.130
3
7.9
197
0
.2043
2
5.0
5
.4
5.7
6
.4
6.9
7
.9
9.1
9
.8
11.2
1
1.7
1
2.9
1:
2
14
-0
.142
4
7.8
538
0
.2040
9
5.0
5
.4
5.7
6
.4
6.9
7
.9
9.0
9
.7
11.1
1
1.7
1
2.8
1:
3
15
-0
.152
7
7.8
041
0
.2038
4
4.9
5
.4
5.6
6
.3
6.8
7
.8
9.0
9
.7
11.0
1
1.6
1
2.8
1:
4
16
-0
.161
5
7.7
681
0
.2036
3
4.9
5
.4
5.6
6
.3
6.8
7
.8
8.9
9
.6
11.0
1
1.5
1
2.7
1:
5
17
-0
.169
0
7.7
443
0
.2035
0
4.9
5
.3
5.6
6
.3
6.8
7
.7
8.9
9
.6
10.9
1
1.5
1
2.7
1:
6
18
-0
.175
5
7.7
315
0
.2035
0
4.9
5
.3
5.6
6
.3
6.8
7
.7
8.9
9
.6
10.9
1
1.5
1
2.7
1:
7
19
-0
.181
1
7.7
287
0
.2036
4
4.9
5
.3
5.6
6
.3
6.7
7
.7
8.9
9
.6
10.9
1
1.5
1
2.7
1:
8
20
-0
.185
9
7.7
347
0
.2039
3
4.9
5
.3
5.6
6
.3
6.8
7
.7
8.9
9
.6
10.9
1
1.5
1
2.7
1:
9
21
-0
.190
1
7.7
484
0
.2043
7
4.9
5
.3
5.6
6
.3
6.8
7
.7
8.9
9
.6
11.0
1
1.5
1
2.8
1:1
0
22
-0
.193
9
7.7
692
0
.2049
6
4.9
5
.4
5.6
6
.3
6.8
7
.8
8.9
9
.7
11.0
1
1.6
1
2.8
1:1
1
23
-0
.197
3
7.7
958
0
.2056
8
4.9
5
.4
5.6
6
.3
6.8
7
.8
9.0
9
.7
11.1
1
1.7
1
2.9
2:
0
24
-0
.200
4
7.8
273
0
.2065
2
4.9
5
.4
5.6
6
.3
6.8
7
.8
9.0
9
.7
11.1
1
1.7
1
3.0
148 Triceps skinfold-for-age, girls
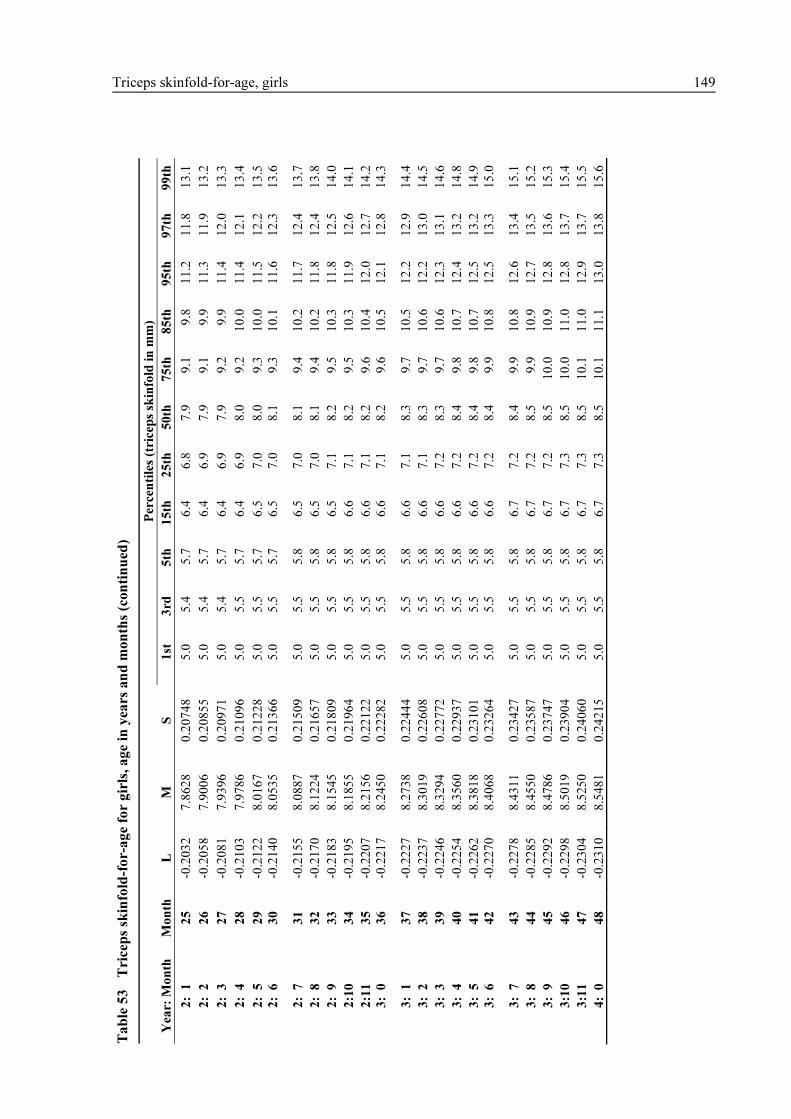
Ta
ble
53
Tri
cep
s sk
info
ld-f
or-
ag
e fo
r g
irls
, a
ge
in y
ears
an
d m
on
ths
(co
nti
nu
ed)
P
erce
nti
les
(tri
cep
s sk
info
ld i
n m
m)
Yea
r: M
on
th
Mon
th
L
M
S
1st
3
rd
5th
1
5th
2
5th
5
0th
7
5th
8
5th
9
5th
9
7th
9
9th
2:
1
25
-0
.203
2
7.8
628
0
.2074
8
5.0
5
.4
5.7
6
.4
6.8
7
.9
9.1
9
.8
11.2
1
1.8
1
3.1
2:
2
26
-0
.205
8
7.9
006
0
.2085
5
5.0
5
.4
5.7
6
.4
6.9
7
.9
9.1
9
.9
11.3
1
1.9
1
3.2
2:
3
27
-0
.208
1
7.9
396
0
.2097
1
5.0
5
.4
5.7
6
.4
6.9
7
.9
9.2
9
.9
11.4
1
2.0
1
3.3
2:
4
28
-0
.210
3
7.9
786
0
.2109
6
5.0
5
.5
5.7
6
.4
6.9
8
.0
9.2
1
0.0
1
1.4
1
2.1
1
3.4
2:
5
29
-0
.212
2
8.0
167
0
.2122
8
5.0
5
.5
5.7
6
.5
7.0
8
.0
9.3
1
0.0
1
1.5
1
2.2
1
3.5
2:
6
30
-0
.214
0
8.0
535
0
.2136
6
5.0
5
.5
5.7
6
.5
7.0
8
.1
9.3
1
0.1
1
1.6
1
2.3
1
3.6
2:
7
31
-0
.215
5
8.0
887
0
.2150
9
5.0
5
.5
5.8
6
.5
7.0
8
.1
9.4
1
0.2
1
1.7
1
2.4
1
3.7
2:
8
32
-0
.217
0
8.1
224
0
.2165
7
5.0
5
.5
5.8
6
.5
7.0
8
.1
9.4
1
0.2
1
1.8
1
2.4
1
3.8
2:
9
33
-0
.218
3
8.1
545
0
.2180
9
5.0
5
.5
5.8
6
.5
7.1
8
.2
9.5
1
0.3
1
1.8
1
2.5
1
4.0
2:1
0
34
-0
.219
5
8.1
855
0
.2196
4
5.0
5
.5
5.8
6
.6
7.1
8
.2
9.5
1
0.3
1
1.9
1
2.6
1
4.1
2:1
1
35
-0
.220
7
8.2
156
0
.2212
2
5.0
5
.5
5.8
6
.6
7.1
8
.2
9.6
1
0.4
1
2.0
1
2.7
1
4.2
3:
0
36
-0
.221
7
8.2
450
0
.2228
2
5.0
5
.5
5.8
6
.6
7.1
8
.2
9.6
1
0.5
1
2.1
1
2.8
1
4.3
3:
1
37
-0
.222
7
8.2
738
0
.2244
4
5.0
5
.5
5.8
6
.6
7.1
8
.3
9.7
1
0.5
1
2.2
1
2.9
1
4.4
3:
2
38
-0
.223
7
8.3
019
0
.2260
8
5.0
5
.5
5.8
6
.6
7.1
8
.3
9.7
1
0.6
1
2.2
1
3.0
1
4.5
3:
3
39
-0
.224
6
8.3
294
0
.2277
2
5.0
5
.5
5.8
6
.6
7.2
8
.3
9.7
1
0.6
1
2.3
1
3.1
1
4.6
3:
4
40
-0
.225
4
8.3
560
0
.2293
7
5.0
5
.5
5.8
6
.6
7.2
8
.4
9.8
1
0.7
1
2.4
1
3.2
1
4.8
3:
5
41
-0
.226
2
8.3
818
0
.2310
1
5.0
5
.5
5.8
6
.6
7.2
8
.4
9.8
1
0.7
1
2.5
1
3.2
1
4.9
3:
6
42
-0
.227
0
8.4
068
0
.2326
4
5.0
5
.5
5.8
6
.6
7.2
8
.4
9.9
1
0.8
1
2.5
1
3.3
1
5.0
3:
7
43
-0
.227
8
8.4
311
0
.2342
7
5.0
5
.5
5.8
6
.7
7.2
8
.4
9.9
1
0.8
1
2.6
1
3.4
1
5.1
3:
8
44
-0
.228
5
8.4
550
0
.2358
7
5.0
5
.5
5.8
6
.7
7.2
8
.5
9.9
1
0.9
1
2.7
1
3.5
1
5.2
3:
9
45
-0
.229
2
8.4
786
0
.2374
7
5.0
5
.5
5.8
6
.7
7.2
8
.5
10.0
1
0.9
1
2.8
1
3.6
1
5.3
3:1
0
46
-0
.229
8
8.5
019
0
.2390
4
5.0
5
.5
5.8
6
.7
7.3
8
.5
10.0
1
1.0
1
2.8
1
3.7
1
5.4
3:1
1
47
-0
.230
4
8.5
250
0
.2406
0
5.0
5
.5
5.8
6
.7
7.3
8
.5
10.1
1
1.0
1
2.9
1
3.7
1
5.5
4:
0
48
-0
.231
0
8.5
481
0
.2421
5
5.0
5
.5
5.8
6
.7
7.3
8
.5
10.1
1
1.1
1
3.0
1
3.8
1
5.6
Triceps skinfold-for-age, girls 149

Ta
ble
53
Tri
cep
s sk
info
ld-f
or-
ag
e fo
r g
irls
, a
ge
in y
ears
an
d m
on
ths
(co
nti
nu
ed)
P
erce
nti
les
(tri
cep
s sk
info
ld i
n m
m)
Yea
r: M
on
th
Mon
th
L
M
S
1st
3
rd
5th
1
5th
2
5th
5
0th
7
5th
8
5th
9
5th
9
7th
9
9th
4:
1
49
-0
.231
6
8.5
711
0
.2436
7
5.0
5
.5
5.8
6
.7
7.3
8
.6
10.1
1
1.1
1
3.1
1
3.9
1
5.7
4:
2
50
-0
.232
1
8.5
942
0
.2451
7
5.0
5
.5
5.8
6
.7
7.3
8
.6
10.2
1
1.2
1
3.1
1
4.0
1
5.8
4:
3
51
-0
.232
6
8.6
174
0
.2466
5
5.0
5
.5
5.8
6
.7
7.3
8
.6
10.2
1
1.2
1
3.2
1
4.1
1
6.0
4:
4
52
-0
.233
1
8.6
406
0
.2481
1
5.0
5
.5
5.9
6
.7
7.3
8
.6
10.2
1
1.3
1
3.3
1
4.2
1
6.1
4:
5
53
-0
.233
6
8.6
641
0
.2495
4
5.0
5
.6
5.9
6
.7
7.3
8
.7
10.3
1
1.3
1
3.3
1
4.2
1
6.2
4:
6
54
-0
.234
1
8.6
876
0
.2509
5
5.0
5
.6
5.9
6
.7
7.4
8
.7
10.3
1
1.4
1
3.4
1
4.3
1
6.3
4:
7
55
-0
.234
6
8.7
112
0
.2523
3
5.0
5
.6
5.9
6
.8
7.4
8
.7
10.4
1
1.4
1
3.5
1
4.4
1
6.4
4:
8
56
-0
.235
0
8.7
349
0
.2536
9
5.0
5
.6
5.9
6
.8
7.4
8
.7
10.4
1
1.5
1
3.6
1
4.5
1
6.5
4:
9
57
-0
.235
5
8.7
586
0
.2550
2
5.0
5
.6
5.9
6
.8
7.4
8
.8
10.4
1
1.5
1
3.6
1
4.6
1
6.6
4:1
0
58
-0
.235
9
8.7
824
0
.2563
3
5.0
5
.6
5.9
6
.8
7.4
8
.8
10.5
1
1.6
1
3.7
1
4.7
1
6.7
4:1
1
59
-0
.236
3
8.8
061
0
.2576
1
5.0
5
.6
5.9
6
.8
7.4
8
.8
10.5
1
1.6
1
3.8
1
4.7
1
6.8
5:
0
60
-0
.236
8
8.8
298
0
.2588
7
5.0
5
.6
5.9
6
.8
7.4
8
.8
10.6
1
1.7
1
3.8
1
4.8
1
6.9
150 Triceps skinfold-for-age, girls

Ta
ble
53
Tri
cep
s sk
info
ld-f
or-
ag
e fo
r g
irls
, a
ge
in y
ears
an
d m
on
ths
(co
nti
nu
ed)
Z
-sco
res
(tri
cep
s sk
info
ld i
n m
m)
Yea
r: M
on
th
Mon
th
L
M
S
-3 S
D
-2 S
D
-1 S
D
Med
ian
1
SD
2
SD
3
SD
0:
3
3
0.1
875
9
.7516
0
.1753
5
5.6
6
.8
8.2
9
.8
11.6
1
3.7
1
6.1
0:
4
4
0.1
256
9
.5866
0
.1833
7
5.4
6
.6
8.0
9
.6
11.5
1
3.7
1
6.3
0:
5
5
0.0
761
9
.3716
0
.1900
7
5.2
6
.4
7.7
9
.4
11.3
1
3.6
1
6.4
0:
6
6
0.0
349
9
.1194
0
.1954
0
5.0
6
.2
7.5
9
.1
11.1
1
3.4
1
6.3
0:
7
7
-0.0
00
3
8.8
621
0
.1993
4
4.9
5
.9
7.3
8
.9
10.8
1
3.2
1
6.1
0:
8
8
-0.0
30
7
8.6
228
0
.2019
2
4.7
5
.8
7.1
8
.6
10.6
1
2.9
1
5.9
0:
9
9
-0.0
57
2
8.4
164
0
.2033
9
4.6
5
.6
6.9
8
.4
10.3
1
2.7
1
5.7
0:1
0
10
-0
.079
9
8.2
468
0
.2041
3
4.5
5
.5
6.7
8
.2
10.1
1
2.5
1
5.5
0:1
1
11
-0
.099
5
8.1
114
0
.2044
2
4.5
5
.4
6.6
8
.1
10.0
1
2.3
1
5.3
1:
0
12
-0
.116
1
8.0
042
0
.2044
5
4.4
5
.4
6.5
8
.0
9.8
1
2.2
1
5.1
1:
1
13
-0
.130
3
7.9
197
0
.2043
2
4.4
5
.3
6.5
7
.9
9.7
1
2.1
1
5.0
1:
2
14
-0
.142
4
7.8
538
0
.2040
9
4.4
5
.3
6.4
7
.9
9.7
1
2.0
1
4.9
1:
3
15
-0
.152
7
7.8
041
0
.2038
4
4.3
5
.3
6.4
7
.8
9.6
1
1.9
1
4.8
1:
4
16
-0
.161
5
7.7
681
0
.2036
3
4.3
5
.2
6.4
7
.8
9.6
1
1.8
1
4.8
1:
5
17
-0
.169
0
7.7
443
0
.2035
0
4.3
5
.2
6.3
7
.7
9.5
1
1.8
1
4.8
1:
6
18
-0
.175
5
7.7
315
0
.2035
0
4.3
5
.2
6.3
7
.7
9.5
1
1.8
1
4.7
1:
7
19
-0
.181
1
7.7
287
0
.2036
4
4.3
5
.2
6.3
7
.7
9.5
1
1.8
1
4.8
1:
8
20
-0
.185
9
7.7
347
0
.2039
3
4.3
5
.2
6.3
7
.7
9.5
1
1.8
1
4.8
1:
9
21
-0
.190
1
7.7
484
0
.2043
7
4.3
5
.2
6.3
7
.7
9.5
1
1.9
1
4.9
1:1
0
22
-0
.193
9
7.7
692
0
.2049
6
4.3
5
.2
6.4
7
.8
9.6
1
1.9
1
5.0
1:1
1
23
-0
.197
3
7.7
958
0
.2056
8
4.4
5
.2
6.4
7
.8
9.6
1
2.0
1
5.1
2:
0
24
-0
.200
4
7.8
273
0
.2065
2
4.4
5
.3
6.4
7
.8
9.7
1
2.0
1
5.2
Triceps skinfold-for-age, girls 151

Ta
ble
53
Tri
cep
s sk
info
ld-f
or-
ag
e fo
r g
irls
, a
ge
in y
ears
an
d m
on
ths
(co
nti
nu
ed)
Z
-sco
res
(tri
cep
s sk
info
ld i
n m
m)
Yea
r: M
on
th
Mon
th
L
M
S
-3 S
D
-2 S
D
-1 S
D
Med
ian
1
SD
2
SD
3
SD
2:
1
25
-0
.203
2
7.8
628
0
.2074
8
4.4
5
.3
6.4
7
.9
9.7
1
2.1
1
5.3
2:
2
26
-0
.205
8
7.9
006
0
.2085
5
4.4
5
.3
6.4
7
.9
9.8
1
2.2
1
5.4
2:
3
27
-0
.208
1
7.9
396
0
.2097
1
4.4
5
.3
6.5
7
.9
9.8
1
2.3
1
5.6
2:
4
28
-0
.210
3
7.9
786
0
.2109
6
4.4
5
.3
6.5
8
.0
9.9
1
2.4
1
5.7
2:
5
29
-0
.212
2
8.0
167
0
.2122
8
4.4
5
.3
6.5
8
.0
10.0
1
2.5
1
5.9
2:
6
30
-0
.214
0
8.0
535
0
.2136
6
4.4
5
.4
6.5
8
.1
10.0
1
2.6
1
6.0
2:
7
31
-0
.215
5
8.0
887
0
.2150
9
4.4
5
.4
6.6
8
.1
10.1
1
2.7
1
6.2
2:
8
32
-0
.217
0
8.1
224
0
.2165
7
4.4
5
.4
6.6
8
.1
10.1
1
2.8
1
6.4
2:
9
33
-0
.218
3
8.1
545
0
.2180
9
4.4
5
.4
6.6
8
.2
10.2
1
2.9
1
6.5
2:1
0
34
-0
.219
5
8.1
855
0
.2196
4
4.4
5
.4
6.6
8
.2
10.3
1
3.0
1
6.7
2:1
1
35
-0
.220
7
8.2
156
0
.2212
2
4.4
5
.4
6.6
8
.2
10.3
1
3.1
1
6.8
3:
0
36
-0
.221
7
8.2
450
0
.2228
2
4.4
5
.4
6.6
8
.2
10.4
1
3.2
1
7.0
3:
1
37
-0
.222
7
8.2
738
0
.2244
4
4.4
5
.4
6.6
8
.3
10.4
1
3.3
1
7.2
3:
2
38
-0
.223
7
8.3
019
0
.2260
8
4.4
5
.4
6.7
8
.3
10.5
1
3.4
1
7.3
3:
3
39
-0
.224
6
8.3
294
0
.2277
2
4.4
5
.4
6.7
8
.3
10.5
1
3.5
1
7.5
3:
4
40
-0
.225
4
8.3
560
0
.2293
7
4.4
5
.4
6.7
8
.4
10.6
1
3.6
1
7.6
3:
5
41
-0
.226
2
8.3
818
0
.2310
1
4.4
5
.4
6.7
8
.4
10.6
1
3.7
1
7.8
3:
6
42
-0
.227
0
8.4
068
0
.2326
4
4.4
5
.4
6.7
8
.4
10.7
1
3.7
1
8.0
3:
7
43
-0
.227
8
8.4
311
0
.2342
7
4.4
5
.4
6.7
8
.4
10.7
1
3.8
1
8.1
3:
8
44
-0
.228
5
8.4
550
0
.2358
7
4.4
5
.4
6.7
8
.5
10.8
1
3.9
1
8.3
3:
9
45
-0
.229
2
8.4
786
0
.2374
7
4.4
5
.4
6.7
8
.5
10.8
1
4.0
1
8.5
3:1
0
46
-0
.229
8
8.5
019
0
.2390
4
4.4
5
.4
6.7
8
.5
10.9
1
4.1
1
8.6
3:1
1
47
-0
.230
4
8.5
250
0
.2406
0
4.4
5
.4
6.7
8
.5
10.9
1
4.2
1
8.8
4:
0
48
-0
.231
0
8.5
481
0
.2421
5
4.4
5
.4
6.8
8
.5
11.0
1
4.3
1
8.9
152 Triceps skinfold-for-age, girls

Ta
ble
53
Tri
cep
s sk
info
ld-f
or-
ag
e fo
r g
irls
, a
ge
in y
ears
an
d m
on
ths
(co
nti
nu
ed)
Z
-sco
res
(tri
cep
s sk
info
ld i
n m
m)
Yea
r: M
on
th
Mon
th
L
M
S
-3 S
D
-2 S
D
-1 S
D
Med
ian
1
SD
2
SD
3
SD
4:
1
49
-0
.231
6
8.5
711
0
.2436
7
4.4
5
.4
6.8
8
.6
11.0
1
4.4
1
9.1
4:
2
50
-0
.232
1
8.5
942
0
.2451
7
4.4
5
.4
6.8
8
.6
11.1
1
4.5
1
9.3
4:
3
51
-0
.232
6
8.6
174
0
.2466
5
4.4
5
.4
6.8
8
.6
11.1
1
4.6
1
9.4
4:
4
52
-0
.233
1
8.6
406
0
.2481
1
4.3
5
.4
6.8
8
.6
11.2
1
4.6
1
9.6
4:
5
53
-0
.233
6
8.6
641
0
.2495
4
4.3
5
.4
6.8
8
.7
11.2
1
4.7
1
9.7
4:
6
54
-0
.234
1
8.6
876
0
.2509
5
4.3
5
.4
6.8
8
.7
11.3
1
4.8
1
9.9
4:
7
55
-0
.234
6
8.7
112
0
.2523
3
4.3
5
.4
6.8
8
.7
11.3
1
4.9
2
0.0
4:
8
56
-0
.235
0
8.7
349
0
.2536
9
4.3
5
.4
6.8
8
.7
11.3
1
5.0
2
0.2
4:
9
57
-0
.235
5
8.7
586
0
.2550
2
4.3
5
.4
6.8
8
.8
11.4
1
5.1
2
0.4
4:1
0
58
-0
.235
9
8.7
824
0
.2563
3
4.3
5
.4
6.8
8
.8
11.4
1
5.2
2
0.5
4:1
1
59
-0
.236
3
8.8
061
0
.2576
1
4.3
5
.4
6.9
8
.8
11.5
1
5.3
2
0.7
5:
0
60
-0
.236
8
8.8
298
0
.2588
7
4.3
5
.4
6.9
8
.8
11.5
1
5.3
2
0.8
Triceps skinfold-for-age, girls 153
154 Triceps skinfold-for-age, boys & girls
5.4 Comparisons between boys and girls
This section presents the triceps skinfold-for-age z-score comparisons between boys and girls for the
WHO standards (Figure 67).

5.4
.1
WH
O
Ag
e (
mo
nth
s)
Triceps Skinfold (mm)
5101520
24
68
12
16
20
24
28
32
36
40
44
48
52
56
60
0 -1 -2 -3123
Bo
ys
Girls
Fig
ure
67
Co
mp
ari
son
of
bo
ys'
an
d g
irls
' tr
icep
s sk
info
ld-f
or-
ag
e z-
sco
res
Triceps skinfold-for-age, boys & girls 155

- 157 -
6. CONSTRUCTION OF THE SUBSCAPULAR SKINFOLD-FOR-AGE STANDARDS
6.1 Indicator-specific methodology
Similar steps to those described to select the best model for the head circumference-for-age, arm-circumference-for-age and triceps skinfold-for-age growth curves were followed to select the best model to construct the subscapular skinfold-for-age growth standards. The diagnostic tools applied to evaluate and compare candidate models were the same. All data up to 71 months were used for modelling the subscapular skinfold-for-age growth curves and the standards afterwards truncated at 60 completed months to correct for the right-edge effect (Borghi et al., 2006).
6.2 Subscapular skinfold-for-age for boys
6.2.1 Sample size
There were a total of 10 757 subscapular skinfold observations for boys. The longitudinal and cross-sectional sample sizes by visit and age are presented in Tables 54 and 55. The measurement of subscapular skinfold started at 3 months of age (de Onis et al., 2004b).
Table 54 Longitudinal sample sizes for subscapular skinfold-for-age for boys
Visit 5 6 7 8 9 10 Age 3 mo 4 mo 5 mo 6 mo 7 mo 8 mo N 418 410 413 417 415 415 Visit 11 12 13 14 15 16 Age 9 mo 10 mo 11 mo 12 mo 14 mo 16 mo N 408 407 417 415 416 417 Visit 17 18 19 20 Age 18 mo 20 mo 22 mo 24 mo N 415 422 417 421
Table 55 Cross-sectional sample sizes for subscapular skinfold-for-age for boys
Age (mo) <18 18–20 21–23 24–26 27–29 30–32 33–35 N 3 176 183 236 255 215 251
Age (mo) 36–38 39–41 42–44 45–47 48–50 51–53 54–56 N 264 248 254 235 235 218 225
Age (mo) 57–59 60–62 63–65 66–68 69–71 >71
N 239 228 216 216 213 4
6.2.2 Model selection and results
To search for the best value of the age-transformation power λ, the model BCPE(x=ageλ, df(µ)=9, df(σ)=4, df(ν)=4, τ=2) was used as a starting point when constructing the subscapular skinfold-for-age growth curves. Table 56 shows the global deviance for values of λ from 0.05 to 1. Global deviance values were smallest for λ 0.55 to 0.75 and we selected λ=0.65.

158 Subscapular skinfold-for-age, boys
Table 56 Global deviance (GD) for models within the class BCPE(x=ageλ, df(µ)=9, df(σ)=4,
df(ν)=4, τ=2) for subscapular skinfold-for-age for boys
λ 0.05 0.10 0.15 0.20 0.25 0.30 0.35 0.40 0.45 0.50
GDa
323.1 323.0 322.8 322.7 322.6 322.5 322.4 322.4 322.3 322.3
λ 0.55 0.60 0.65 0.70 0.75 0.80 0.85 0.90 0.95 1.00
GDa
322.2 322.2 322.2 322.2 322.2 322.3 322.5 322.8 323.3 324.1
a In excess of 33 000.
The search for the best df(µ) and df(σ) followed, fixing λ=0.65, ν=1 and τ=2. All possible
combinations with df(µ) values ranging from 5 to 15 and df(σ) from 2 to 10 were considered and
partial results are presented in Table 57. As for arm circumference-for-age and triceps skinfold-for-age,
we considered only the criterion GAIC(3) to select the best combination. The model with df(µ)=7 and
df(σ)=3 provided the smallest value of GAIC(3), but the model with the smoother µ curve, with
df(µ)=6 and df(σ)=3, yielded similar GAIC(3) values. The latter model was thus selected for further
evaluation.
Table 57 Goodness-of-fit summary for models using the BCPE distribution with fixed ν=1 and
τ=2 for subscapular skinfold-for-age for boys
df(µ) df(σ) GDa
AICa
GAIC(3)a
Total df
2 1895.9 1909.9 1916.9 7
3 1891.3 1907.3 1915.3 8
4 1888.9 1906.9 1915.9 9
5 1886.0 1906.0 1916.0 10
5
6 1882.7 1904.7 1915.7 11
2 1888.3 1904.3 1912.3 8
3 1883.8 1901.8 1910.8 9
4 1881.4 1901.4 1911.4 10
5 1878.6 1900.6 1911.6 11
6
6 1875.5 1899.6 1911.6 12
2 1885.0 1903.0 1912.0 9
3 1880.5 1900.5 1910.5 10
4 1878.1 1900.1 1911.1 11
5 1875.4 1899.4 1911.4 12
7
6 1872.5 1898.5 1911.5 13
2 1882.8 1902.8 1912.8 10
3 1878.3 1900.3 1911.3 11
4 1875.9 1899.9 1911.9 12
5 1873.4 1899.4 1912.4 13
8
6 1870.5 1898.5 1912.5 14
2 1881.0 1903.0 1914.0 11
3 1876.5 1900.5 1912.5 12
4 1874.2 1900.2 1913.2 13
5 1871.6 1899.6 1913.6 14
9
6 1868.9 1898.9 1913.9 15
GD, Global Deviance; AIC, Akaike Information Criterion;
GAIC(3), Generalized AIC with penalty equal to 3; a In excess of 33 000.
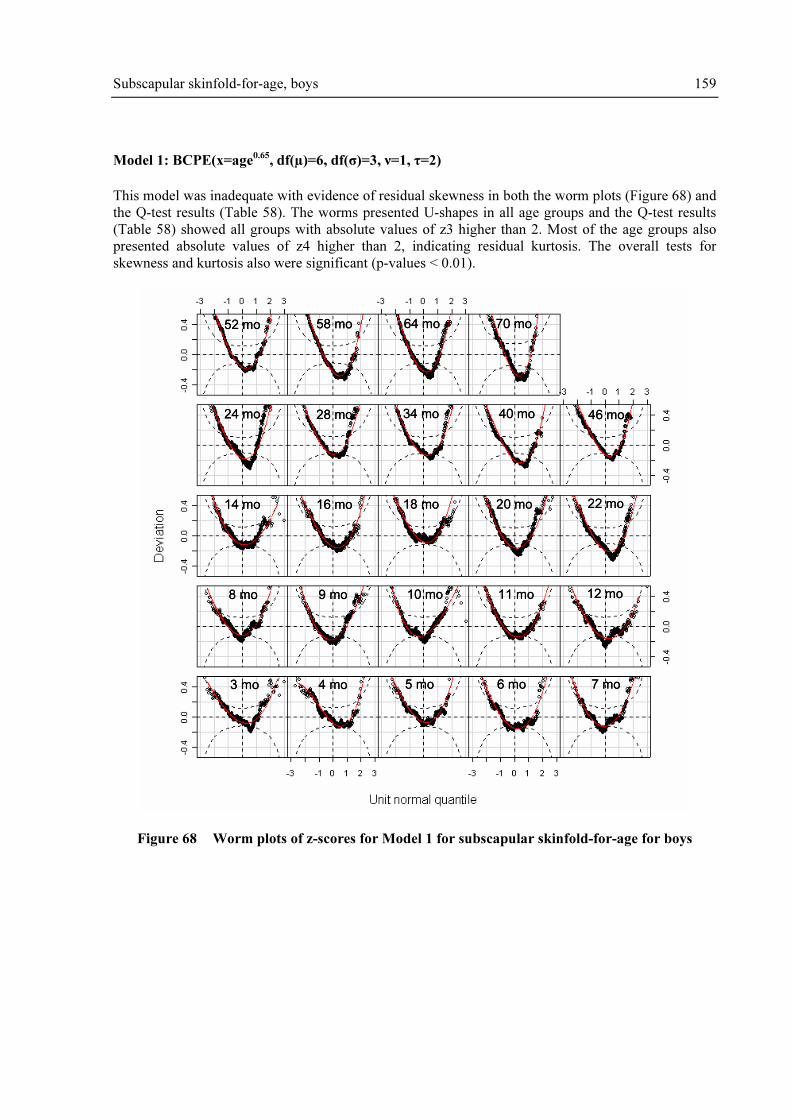
Subscapular skinfold-for-age, boys 159
Model 1: BCPE(x=age0.65
, df(µ)=6, df(σ)=3, ν=1, τ=2)
This model was inadequate with evidence of residual skewness in both the worm plots (Figure 68) and
the Q-test results (Table 58). The worms presented U-shapes in all age groups and the Q-test results
(Table 58) showed all groups with absolute values of z3 higher than 2. Most of the age groups also
presented absolute values of z4 higher than 2, indicating residual kurtosis. The overall tests for
skewness and kurtosis also were significant (p-values < 0.01).
3 mo 4 mo 5 mo 6 mo 7 mo
8 mo 9 mo 10 mo 11 mo 12 mo
14 mo 16 mo 18 mo 20 mo 22 mo
24 mo 28 mo 34 mo 40 mo 46 mo
52 mo 58 mo 64 mo 70 mo
3 mo 4 mo 5 mo 6 mo 7 mo
8 mo 9 mo 10 mo 11 mo 12 mo
14 mo 16 mo 18 mo 20 mo 22 mo
24 mo 28 mo 34 mo 40 mo 46 mo
52 mo 58 mo 64 mo 70 mo
3 mo 4 mo 5 mo 6 mo 7 mo
8 mo 9 mo 10 mo 11 mo 12 mo
14 mo 16 mo 18 mo 20 mo 22 mo
24 mo 28 mo 34 mo 40 mo 46 mo
52 mo 58 mo 64 mo 70 mo
Figure 68 Worm plots of z-scores for Model 1 for subscapular skinfold-for-age for boys

160 Subscapular skinfold-for-age, boys
Table 58 Q-test for z-scores from Model 1 [BCPE(x=age0.65
, df(µ)=6, df(σ)=3, ν=1, τ=2)] for
subscapular skinfold-for-age for boys
Age (days) Group N z1 z2 z3 z4
79 to 99 3 mo 414 0.3 -0.5 4.4 1.7
100 to 129 4 mo 407 0.5 -0.9 6.2 4.5
130 to 159 5 mo 410 1.2 0.3 6.0 3.2
160 to 189 6 mo 411 -0.7 -0.3 6.0 3.2
190 to 219 7 mo 406 0.1 1.2 5.6 2.4
220 to 249 8 mo 420 0.0 1.2 5.5 2.6
250 to 279 9 mo 391 -0.7 1.3 5.6 1.8
280 to 309 10 mo 399 -0.1 1.3 4.8 0.3
310 to 349 11 mo 460 -0.1 -0.9 6.3 2.9
350 to 379 12 mo 410 -1.1 -0.9 4.9 1.8
380 to 439 14 mo 418 -0.1 -1.2 5.2 1.3
440 to 499 16 mo 415 -0.3 -0.6 6.4 3.5
500 to 559 18 mo 440 1.2 0.3 7.2 5.1
560 to 619 20 mo 523 -0.3 -0.6 7.0 2.5
620 to 679 22 mo 547 -0.9 -0.6 8.0 4.2
680 to 749 24 mo 591 -0.2 0.6 8.8 4.6
750 to 929 28 mo 469 1.0 1.2 7.7 3.9
930 to 1119 34 mo 505 1.0 -0.2 7.7 4.1
1120 to 1309 40 mo 509 -0.9 -1.3 8.8 5.8
1310 to 1499 46 mo 505 1.1 0.4 9.1 5.8
1500 to 1689 52 mo 482 0.0 -0.4 8.4 4.7
1690 to 1879 58 mo 480 -1.0 -1.7 9.6 6.0
1880 to 2069 64 mo 460 -0.2 0.8 9.1 5.3
2070 to 2249 70 mo 285 0.5 2.0 9.3 6.2
Overall Q stats 10 757 11.5 23.0 1227.4 378.9
degrees of freedom 18.0 22.0 24.0 24.0
p-value 0.8718 0.4023 <0.01 <0.01
Note: Absolute values of z1, z2, z3 or z4 larger than 2 indicate misfit of, respectively, mean, variance,
skewness or kurtosis.
The next step involved fitting the parameter ν for skewness using the BCPE distribution with fixed
parameter τ=2 and keeping the degrees of freedom for the µ and σ curves identical to those selected
for Model 1. Table 59 shows the GAIC(3) values for various degrees of freedom for the ν curve.
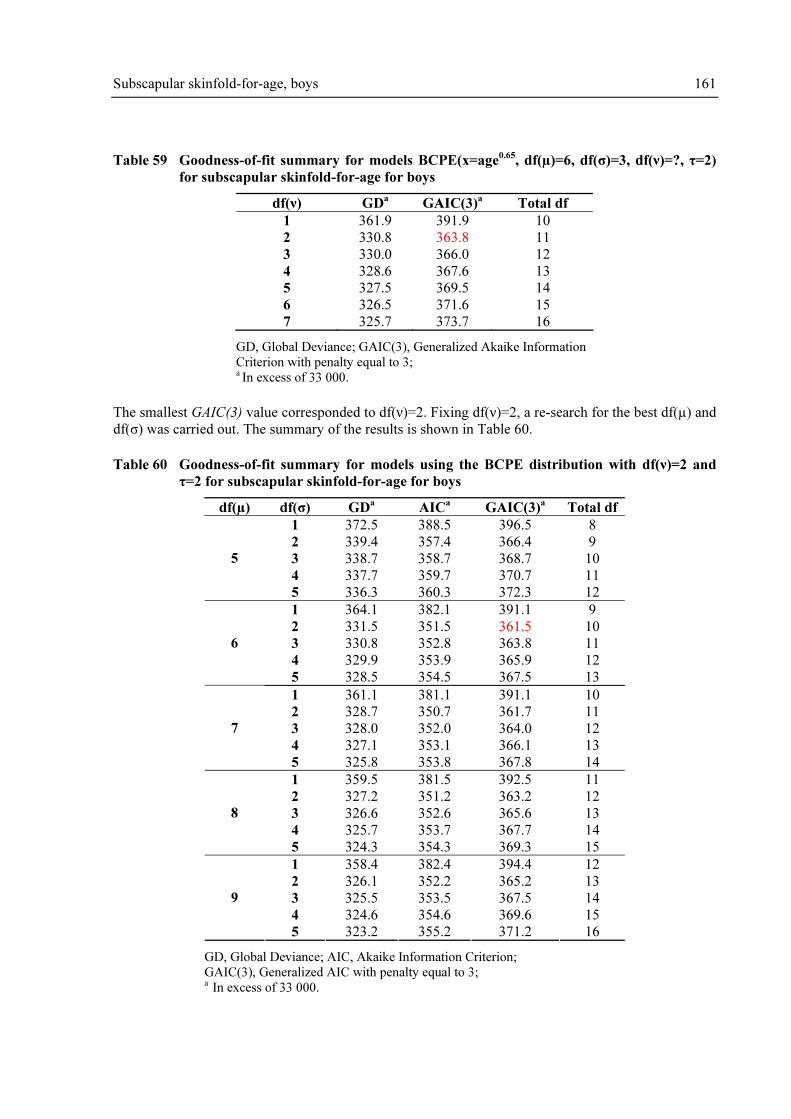
Subscapular skinfold-for-age, boys 161
Table 59 Goodness-of-fit summary for models BCPE(x=age0.65
, df(µ)=6, df(σ)=3, df(ν)=?, τ=2)
for subscapular skinfold-for-age for boys
df(ν) GDa
GAIC(3)a
Total df
1 361.9 391.9 10
2 330.8 363.8 11
3 330.0 366.0 12
4 328.6 367.6 13
5 327.5 369.5 14
6 326.5 371.6 15
7 325.7 373.7 16
GD, Global Deviance; GAIC(3), Generalized Akaike Information
Criterion with penalty equal to 3; a In excess of 33 000.
The smallest GAIC(3) value corresponded to df(ν)=2. Fixing df(ν)=2, a re-search for the best df(µ) and
df(σ) was carried out. The summary of the results is shown in Table 60.
Table 60 Goodness-of-fit summary for models using the BCPE distribution with df(ν)=2 and
τ=2 for subscapular skinfold-for-age for boys
df(µ) df(σ) GDa
AICa
GAIC(3)a
Total df
1 372.5 388.5 396.5 8
2 339.4 357.4 366.4 9
3 338.7 358.7 368.7 10
4 337.7 359.7 370.7 11
5
5 336.3 360.3 372.3 12
1 364.1 382.1 391.1 9
2 331.5 351.5 361.5 10
3 330.8 352.8 363.8 11
4 329.9 353.9 365.9 12
6
5 328.5 354.5 367.5 13
1 361.1 381.1 391.1 10
2 328.7 350.7 361.7 11
3 328.0 352.0 364.0 12
4 327.1 353.1 366.1 13
7
5 325.8 353.8 367.8 14
1 359.5 381.5 392.5 11
2 327.2 351.2 363.2 12
3 326.6 352.6 365.6 13
4 325.7 353.7 367.7 14
8
5 324.3 354.3 369.3 15
1 358.4 382.4 394.4 12
2 326.1 352.2 365.2 13
3 325.5 353.5 367.5 14
4 324.6 354.6 369.6 15
9
5 323.2 355.2 371.2 16
GD, Global Deviance; AIC, Akaike Information Criterion;
GAIC(3), Generalized AIC with penalty equal to 3; a In excess of 33 000.
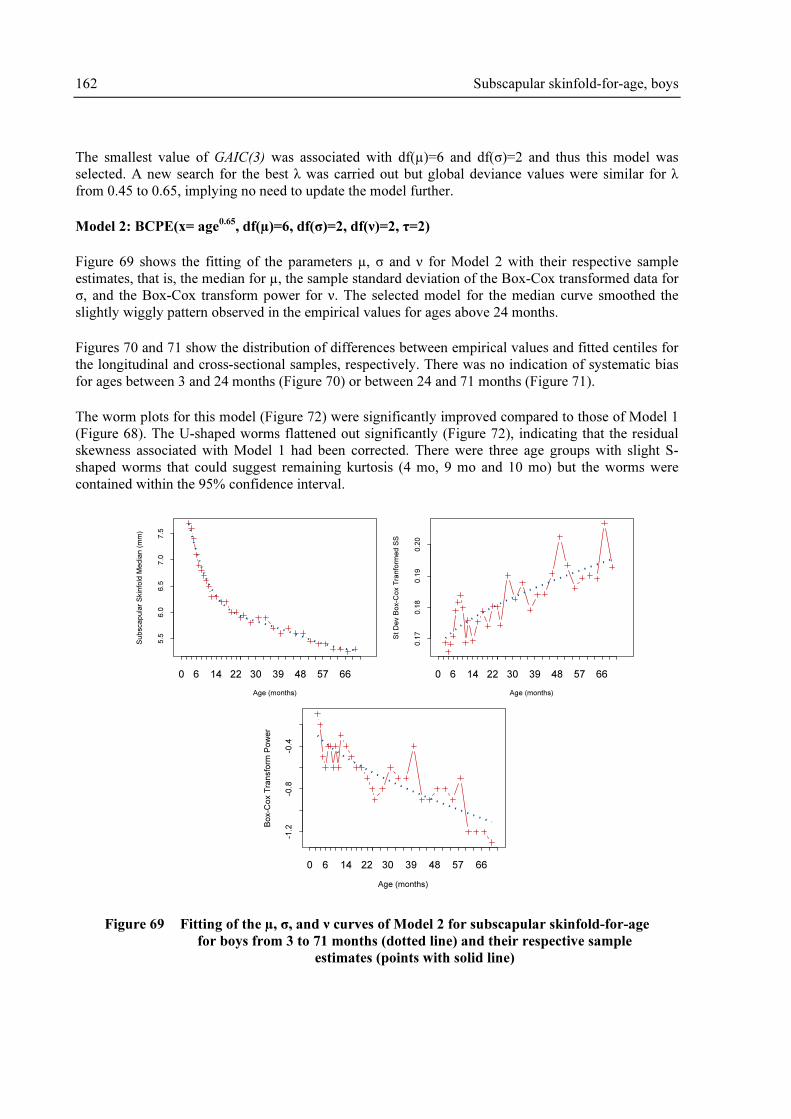
162 Subscapular skinfold-for-age, boys
The smallest value of GAIC(3) was associated with df(µ)=6 and df(σ)=2 and thus this model was
selected. A new search for the best λ was carried out but global deviance values were similar for λ
from 0.45 to 0.65, implying no need to update the model further.
Model 2: BCPE(x= age0.65
, df(µ)=6, df(σ)=2, df(ν)=2, τ=2)
Figure 69 shows the fitting of the parameters µ, σ and ν for Model 2 with their respective sample
estimates, that is, the median for µ, the sample standard deviation of the Box-Cox transformed data for
σ, and the Box-Cox transform power for ν. The selected model for the median curve smoothed the
slightly wiggly pattern observed in the empirical values for ages above 24 months.
Figures 70 and 71 show the distribution of differences between empirical values and fitted centiles for
the longitudinal and cross-sectional samples, respectively. There was no indication of systematic bias
for ages between 3 and 24 months (Figure 70) or between 24 and 71 months (Figure 71).
The worm plots for this model (Figure 72) were significantly improved compared to those of Model 1
(Figure 68). The U-shaped worms flattened out significantly (Figure 72), indicating that the residual
skewness associated with Model 1 had been corrected. There were three age groups with slight S-
shaped worms that could suggest remaining kurtosis (4 mo, 9 mo and 10 mo) but the worms were
contained within the 95% confidence interval.
Age (months)
Su
bsca
pu
lar
Skin
fold
Me
dia
n (
mm
)
5.5
6.0
6.5
7.0
7.5
0 6 14 22 30 39 48 57 66
Age (months)
St D
ev B
ox-C
ox T
ran
form
ed
SS
0.1
70
.18
0.1
90
.20
0 6 14 22 30 39 48 57 66
Age (months)
Bo
x-C
ox T
ran
sfo
rm P
ow
er
-1.2
-0.8
-0.4
0 6 14 22 30 39 48 57 66
Figure 69 Fitting of the µ, σ, and ν curves of Model 2 for subscapular skinfold-for-age
for boys from 3 to 71 months (dotted line) and their respective sample
estimates (points with solid line)

Subscapular skinfold-for-age, boys 163
3rd Centile
-0.2
0.0
0.2
4 6 8 10 14 18 22
5th Centile
-0.2
0.0
0.2
4 6 8 10 14 18 22
10th Centile
-0.2
0.0
0.2
4 6 8 10 14 18 22
25th Centile
-0.2
0.0
0.2
4 6 8 10 14 18 22
50th Centile
-0.2
0.0
0.2
4 6 8 10 14 18 22
75th Centile
-0.2
0.0
0.2
4 6 8 10 14 18 22
90th Centile
-0.2
0.0
0.2
4 6 8 10 14 18 22
95th Centile
-0.2
0.0
0.2
4 6 8 10 14 18 22
97th Centile
-0.2
0.0
0.2
4 6 8 10 14 18 22
Age (months)
Em
piric
al-F
itte
d C
en
tile
fo
r S
ub
sca
pu
lar
Skin
fold
(m
m)
Figure 70 Centile residuals from fitting Model 2 for subscapular skinfold-for-age
from 3 to 24 months for boys
3rd Centile
-0.6
-0.2
0.2
0.6
25 31 37 43 49 55 61 67
5th Centile
-0.6
-0.2
0.2
0.6
25 31 37 43 49 55 61 67
10th Centile
-0.6
-0.2
0.2
0.6
25 31 37 43 49 55 61 67
25th Centile
-0.6
-0.2
0.2
0.6
25 31 37 43 49 55 61 67
50th Centile
-0.6
-0.2
0.2
0.6
25 31 37 43 49 55 61 67
75th Centile
-0.6
-0.2
0.2
0.6
25 31 37 43 49 55 61 67
90th Centile
-0.6
-0.2
0.2
0.6
25 31 37 43 49 55 61 67
95th Centile
-0.6
-0.2
0.2
0.6
25 31 37 43 49 55 61 67
97th Centile
-0.6
-0.2
0.2
0.6
25 31 37 43 49 55 61 67
Age (months)
Em
piric
al-F
itte
d C
en
tile
fo
r S
ub
sca
pu
lar
Skin
fold
(m
m)
Figure 71 Centile residuals from fitting Model 2 for subscapular skinfold-for-age
from 24 to 71 months for boys
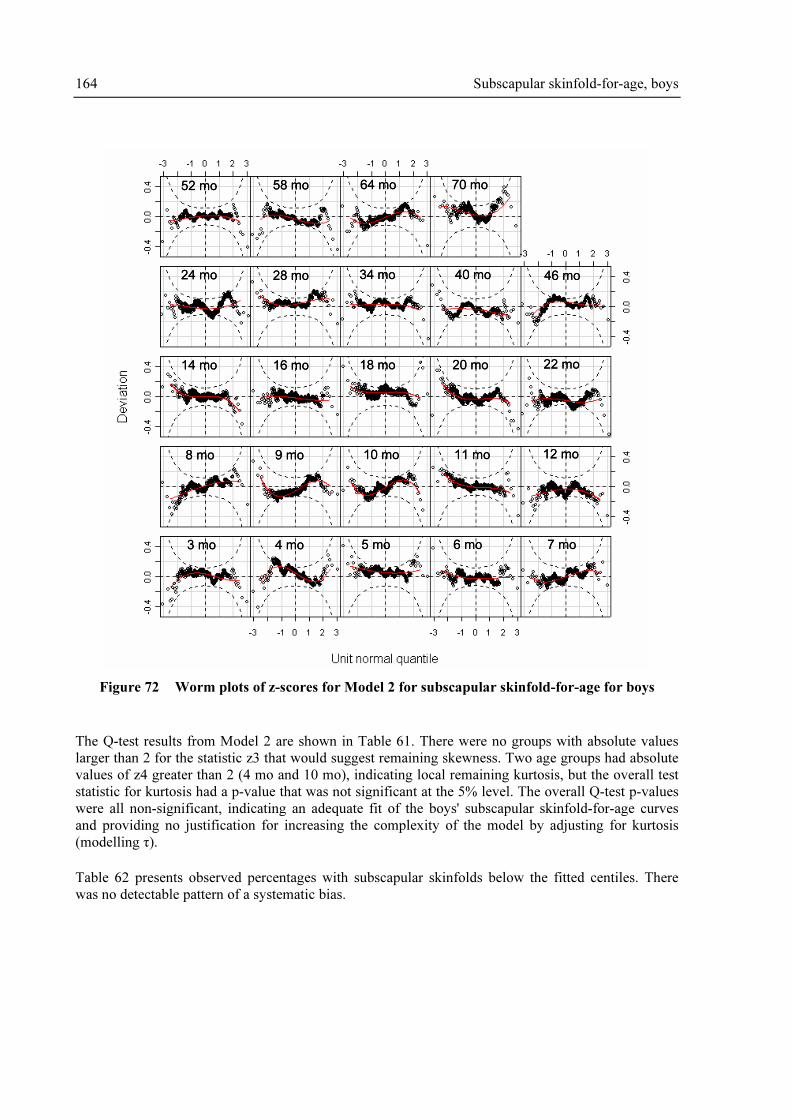
164 Subscapular skinfold-for-age, boys
3 mo 4 mo 5 mo 6 mo 7 mo
8 mo 9 mo 10 mo 11 mo 12 mo
14 mo 16 mo 18 mo 20 mo 22 mo
24 mo 28 mo 34 mo 40 mo 46 mo
52 mo 58 mo 64 mo 70 mo
3 mo 4 mo 5 mo 6 mo 7 mo
8 mo 9 mo 10 mo 11 mo 12 mo
14 mo 16 mo 18 mo 20 mo 22 mo
24 mo 28 mo 34 mo 40 mo 46 mo
52 mo 58 mo 64 mo 70 mo
3 mo 4 mo 5 mo 6 mo 7 mo
8 mo 9 mo 10 mo 11 mo 12 mo
14 mo 16 mo 18 mo 20 mo 22 mo
24 mo 28 mo 34 mo 40 mo 46 mo
52 mo 58 mo 64 mo 70 mo
Figure 72 Worm plots of z-scores for Model 2 for subscapular skinfold-for-age for boys
The Q-test results from Model 2 are shown in Table 61. There were no groups with absolute values
larger than 2 for the statistic z3 that would suggest remaining skewness. Two age groups had absolute
values of z4 greater than 2 (4 mo and 10 mo), indicating local remaining kurtosis, but the overall test
statistic for kurtosis had a p-value that was not significant at the 5% level. The overall Q-test p-values
were all non-significant, indicating an adequate fit of the boys' subscapular skinfold-for-age curves
and providing no justification for increasing the complexity of the model by adjusting for kurtosis
(modelling τ).
Table 62 presents observed percentages with subscapular skinfolds below the fitted centiles. There
was no detectable pattern of a systematic bias.

Subscapular skinfold-for-age, boys 165
Table 61 Q-test for z-scores from Model 2 [BCPE(x=age0.65
, df(µ)=6, df(σ)=2, df(ν)=2, τ=2)] for
subscapular skinfold-for-age for boys
Age (days) Group N z1 z2 z3 z4
79 to 99 3 mo 414 0.3 -0.2 -1.1 1.0
100 to 129 4 mo 407 0.7 -1.2 -0.4 2.2
130 to 159 5 mo 410 1.3 -0.3 0.5 0.1
160 to 189 6 mo 411 -0.5 -0.4 0.6 0.0
190 to 219 7 mo 406 0.1 1.0 0.4 -1.0
220 to 249 8 mo 420 0.0 1.4 -0.6 0.2
250 to 279 9 mo 391 -0.8 1.4 0.8 -1.7
280 to 309 10 mo 399 -0.3 1.6 0.0 -2.3
310 to 349 11 mo 460 0.1 -1.0 0.6 -0.7
350 to 379 12 mo 410 -1.1 0.0 -0.9 -0.2
380 to 439 14 mo 418 -0.1 -0.8 -0.1 -1.3
440 to 499 16 mo 415 -0.4 -0.5 -0.1 0.3
500 to 559 18 mo 440 1.1 -0.3 0.1 -0.4
560 to 619 20 mo 523 -0.3 -0.6 0.7 -0.9
620 to 679 22 mo 547 -0.9 -0.4 0.1 0.7
680 to 749 24 mo 591 -0.4 0.2 0.9 0.3
750 to 929 28 mo 469 0.9 0.4 0.7 -0.6
930 to 1119 34 mo 505 1.0 -0.4 -0.4 -0.2
1120 to 1309 40 mo 509 -1.0 -0.6 -0.5 0.1
1310 to 1499 46 mo 505 1.0 0.2 -1.2 1.0
1500 to 1689 52 mo 482 -0.1 0.2 -0.6 -0.1
1690 to 1879 58 mo 480 -0.7 -1.0 -0.1 1.0
1880 to 2069 64 mo 460 -0.2 1.4 0.0 -1.2
2070 to 2249 70 mo 285 0.8 -0.1 1.3 0.7
Overall Q stats 10 757 11.8 15.3 9.9 22.9
degrees of freedom 18.0 22.5 22.0 24.0
p-value 0.8550 0.8681 0.9870 0.5273
Note: Absolute values of z1, z2, z3 or z4 larger than 2 indicate misfit of, respectively, mean, variance,
skewness or kurtosis.
In conclusion, the model selected for constructing the subscapular skinfold-for-age growth curves for
boys was BCPE(x=age0.65, df(µ)=6, df(σ)=2, df(ν)=2, τ=2) that adjusts only for skewness, and thus
reduces to the LMS method. The fitted centile curves and empirical centiles are shown in Figures 73 to
76.

Ta
ble
62
Ob
serv
ed p
ro
po
rtio
ns
of
chil
dre
n w
ith
mea
surem
ents
bel
ow
th
e fi
tted
cen
tile
s fr
om
Mo
del
2, su
bsc
ap
ula
r sk
info
ld-f
or-
ag
e fo
r b
oy
s
Ex
pec
ted
3
mo
4
mo
5
mo
6
mo
7
mo
8
mo
9
mo
1
0 m
o
11
mo
1
1.2
1
.5
0.7
1
.0
0.7
2
.1
0.5
0
.8
0.7
3
3.1
2
.9
2.4
2
.9
3.4
4
.0
3.6
3
.0
2.0
5
4.1
4
.4
3.7
5
.8
4.9
5
.5
6.6
5
.8
3.5
10
9
.4
7.1
9
.3
9.0
1
0.8
1
0.2
1
1.8
1
3.0
8
.3
25
2
2.9
2
3.1
2
2.7
2
6.3
2
6.1
2
5.5
2
9.2
2
7.3
2
5.4
50
4
6.4
4
7.7
4
9.5
5
1.3
5
1.5
5
1.4
5
2.7
5
2.9
5
0.4
75
7
7.1
7
6.2
7
5.1
7
6.2
7
3.2
7
2.4
7
6.2
7
1.7
7
4.1
90
8
9.6
9
1.9
8
9.3
9
1.7
8
9.7
9
0.0
8
8.5
8
8.5
9
0.2
95
9
4.9
9
5.8
9
4.9
9
6.1
9
4.3
9
4.5
9
3.1
9
4.7
9
5.7
97
9
6.9
9
7.1
9
6.8
9
6.4
9
6.3
9
6.7
9
6.4
9
5.5
9
7.2
99
9
9.3
9
8.8
9
8.3
9
8.5
9
8.8
9
8.1
9
9.0
9
9.2
9
8.7
Ex
pec
ted
1
2 m
o
14
mo
1
6 m
o
18
mo
2
0 m
o
22
mo
2
4 m
o
28
mo
3
4 m
o
1
1.7
0
.5
1.0
0
.7
0.4
1
.3
1.0
0
.6
0.8
3
3.7
2
.9
3.6
2
.3
2.7
2
.9
2.4
3
.0
2.6
5
5.9
4
.5
4.8
4
.3
3.6
5
.1
5.9
4
.9
4.6
10
1
1.0
1
0.3
9
.2
10
.5
9.2
1
1.5
1
0.0
9
.2
10
.1
25
2
6.8
2
4.9
2
7.7
2
5.2
2
4.1
2
6.5
2
3.4
2
3.5
2
3.2
50
5
3.9
5
1.7
4
9.4
4
6.4
5
3.0
4
9.7
5
2.8
4
9.9
4
5.9
75
7
3.9
7
6.6
7
6.9
7
4.5
7
5.3
7
7.9
7
7.7
7
4.8
7
4.9
90
9
0.5
9
0.2
8
9.9
8
9.1
9
0.1
9
0.9
8
9.3
8
7.6
9
0.1
95
9
6.3
9
5.2
9
6.1
9
5.5
9
4.1
9
4.5
9
3.2
9
3.4
9
4.1
97
9
8.0
9
7.6
9
7.1
9
7.7
9
7.1
9
6.9
9
5.6
9
6.2
9
6.4
99
9
9.3
9
9.8
9
8.6
9
8.9
9
9.6
9
8.7
9
9.2
9
8.3
9
9.0
166 Subscapular skinfold-for-age, boys

Ta
ble
62
Ob
serv
ed p
ro
po
rtio
ns
of
chil
dre
n w
ith
mea
surem
ents
bel
ow
th
e fi
tted
cen
tile
s fr
om
Mo
del
2, su
bsc
ap
ula
r sk
info
ld-f
or-
ag
e fo
r b
oy
s (c
on
t)
Ex
pec
ted
4
0 m
o
46
mo
5
2 m
o
58
mo
6
4 m
o
70
mo
O
ver
all
1
1.2
1
.8
1.0
1
.0
1.1
0
.7
1.0
3
3.7
4
.0
3.3
2
.1
3.3
2
.1
3.0
5
6.5
5
.9
4.8
4
.4
6.7
4
.9
5.1
10
1
1.2
9
.5
8.9
1
0.0
1
1.5
1
0.2
1
0.0
25
2
4.8
2
0.6
2
5.9
2
4.8
2
6.5
2
0.4
2
4.8
50
5
2.7
4
6.3
5
0.0
5
1.5
4
9.8
4
8.8
5
0.2
75
7
8.6
7
4.7
7
4.9
7
6.7
7
5.4
7
5.8
7
5.5
90
9
1.0
9
0.1
8
9.4
9
0.8
8
8.0
8
7.7
8
9.8
95
9
5.7
9
3.7
9
5.2
9
5.8
9
3.5
9
3.7
9
4.7
97
9
7.6
9
7.0
9
6.7
9
6.9
9
7.0
9
5.1
9
6.8
99
9
9.4
9
9.0
9
9.0
9
9.4
9
8.9
9
7.5
9
8.9
No
te:
Gro
up l
abel
s co
rres
pond
to t
he
age
inte
rval
s in
Tab
le 6
1.
Subscapular skinfold-for-age, boys 167
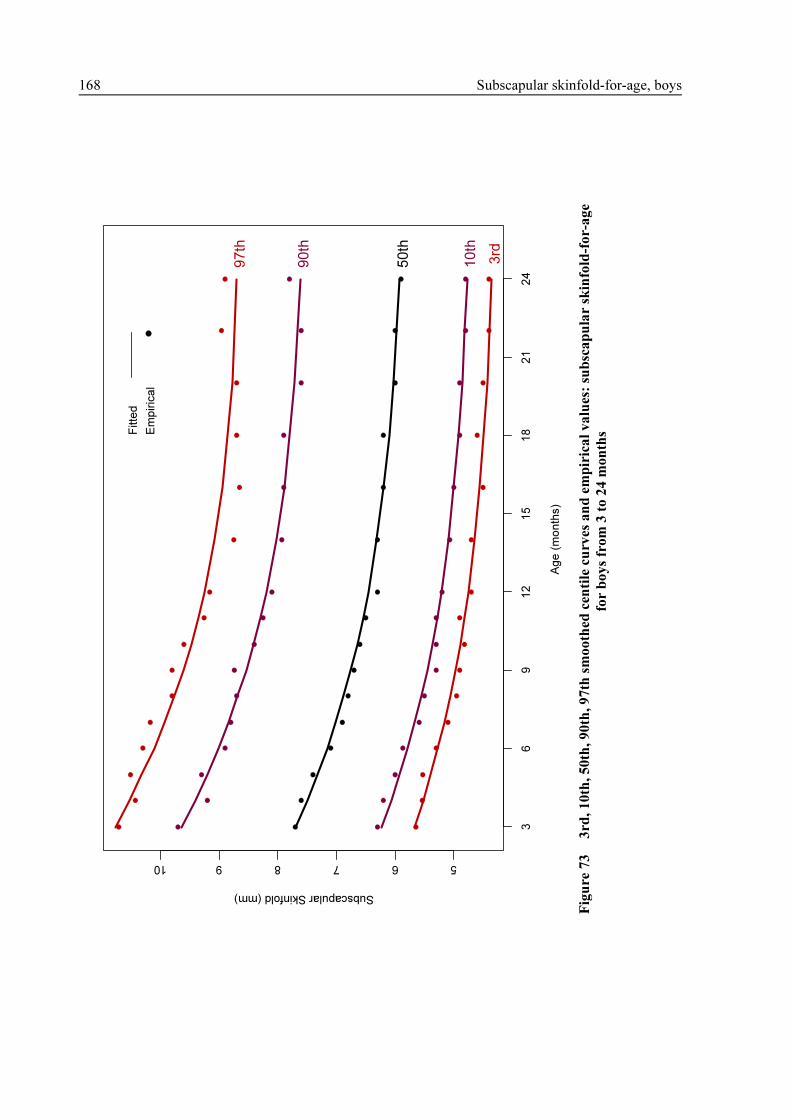
Age (
month
s)
Subscapular Skinfold (mm)
5678910
36
912
15
18
21
24
3rd
10th
50th
90th
97th
Fitte
d
Em
piric
al
Fig
ure
73
3rd
, 1
0th
, 5
0th
, 9
0th
, 9
7th
sm
oo
thed
cen
tile
cu
rves
an
d e
mp
iric
al
va
lues
: su
bsc
ap
ula
r sk
info
ld-f
or-
ag
e
for
bo
ys
from
3 t
o 2
4 m
on
ths
168 Subscapular skinfold-for-age, boys
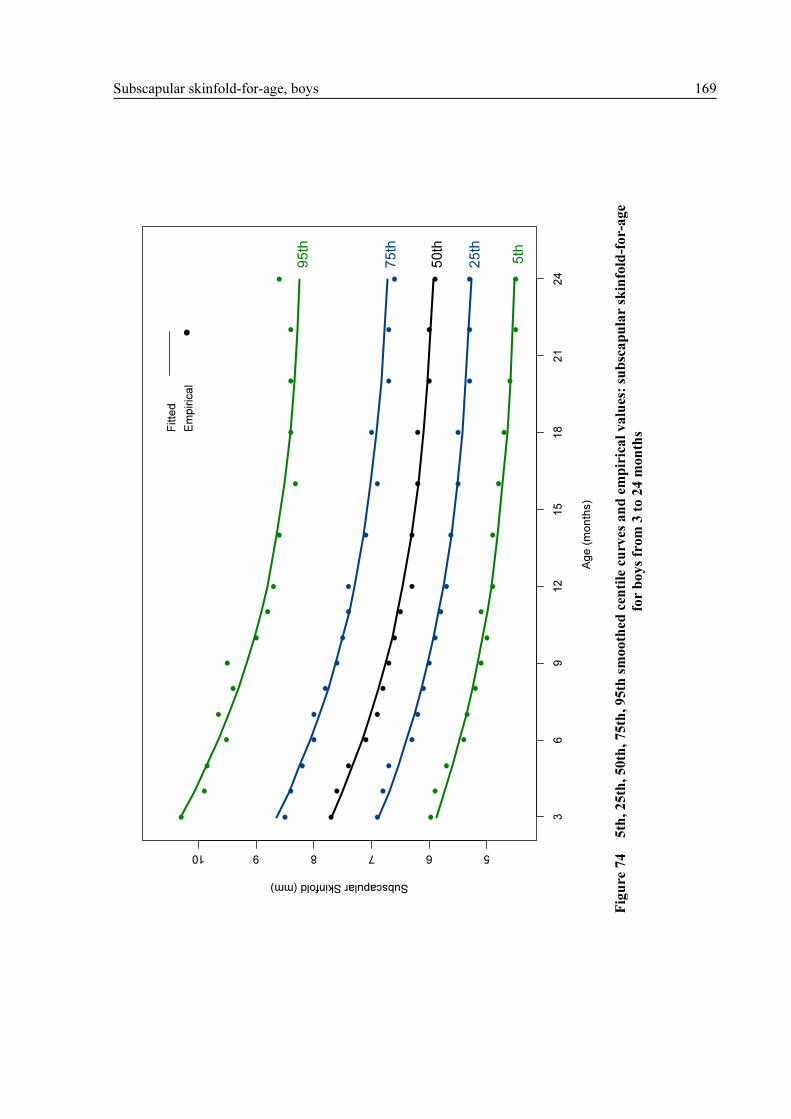
Ag
e (
mo
nth
s)
Subscapular Skinfold (mm)
5678910
36
91
21
51
82
12
4
5th
25th
50th
75th
95th
Fitte
d
Em
pir
ica
l
Fig
ure
74
5th
, 2
5th
, 5
0th
, 7
5th
, 9
5th
sm
oo
thed
cen
tile
cu
rves
an
d e
mp
iric
al
va
lues
: su
bsc
ap
ula
r sk
info
ld-f
or-
ag
e
for
bo
ys
from
3 t
o 2
4 m
on
ths
Subscapular skinfold-for-age, boys 169
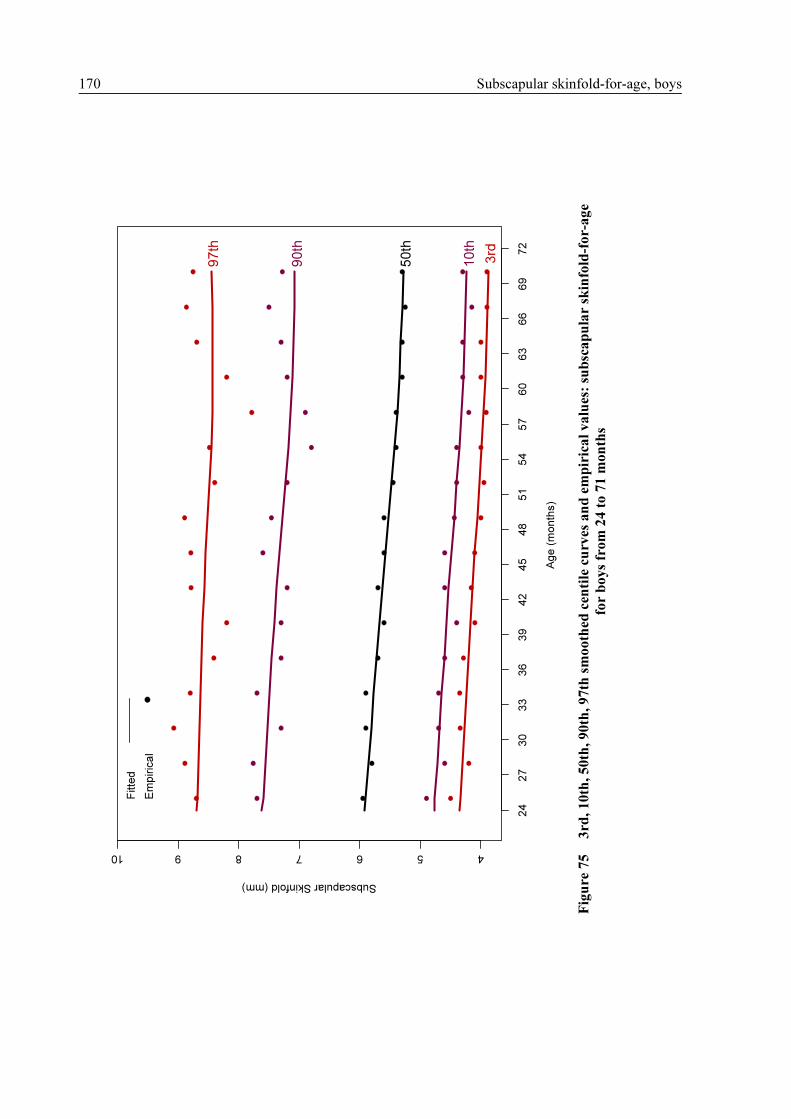
Ag
e (
mo
nth
s)
Subscapular Skinfold (mm)
45678910
24
27
30
33
36
39
42
45
48
51
54
57
60
63
66
69
72
3rd
10th
50th
90th
97th
Fitte
d
Em
piric
al
Fig
ure
75
3rd
, 1
0th
, 5
0th
, 9
0th
, 9
7th
sm
oo
thed
cen
tile
cu
rves
an
d e
mp
iric
al
va
lues
: su
bsc
ap
ula
r sk
info
ld-f
or-
ag
e
for
bo
ys
from
24
to
71 m
on
ths
170 Subscapular skinfold-for-age, boys

Age (
month
s)
Subscapular Skinfold (mm)
45678910
24
27
30
33
36
39
42
45
48
51
54
57
60
63
66
69
72
5th
25th
50th
75th
95th
Fitte
d
Em
piric
al
Fig
ure
76
5th
, 2
5th
, 5
0th
, 7
5th
, 9
5th
sm
oo
thed
cen
tile
cu
rves
an
d e
mp
iric
al
va
lues
: su
bsc
ap
ula
r sk
info
ld-f
or-
ag
e
for
bo
ys
from
24
to
71 m
on
ths
Subscapular skinfold-for-age, boys 171

172 Subscapular skinfold-for-age, boys
6.2.3 WHO standards
This section presents the final WHO subscapular skinfold-for-age z-score and percentile charts (Figures 77 and 78) and table (Table 63) for boys.

Ch
arts
Age (
month
s)
Subscapular Skinfold (mm)
4681012
24
68
12
16
20
24
28
32
36
40
44
48
52
56
60
123 0 -1 -2 -3
Fig
ure
77
WH
O s
ub
sca
pu
lar
skin
fold
-fo
r-a
ge
z-sc
ore
s fo
r b
oy
s fr
om
3 t
o 6
0 m
on
ths
Subscapular skinfold-for-age, boys 173
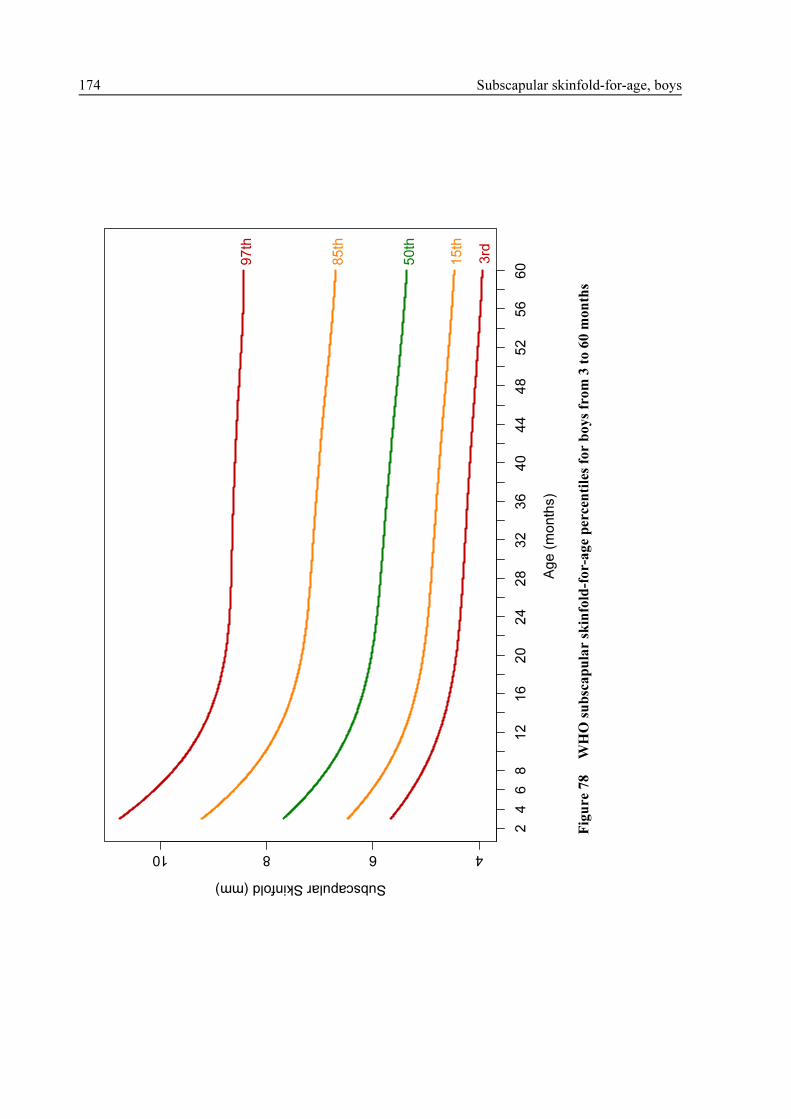
Ag
e (
mo
nth
s)
Subscapular Skinfold (mm)
46810
24
68
12
16
20
24
28
32
36
40
44
48
52
56
60
3rd
50
th
97
th
15
th
85
th
Fig
ure
78
WH
O s
ub
sca
pu
lar
skin
fold
-fo
r-a
ge
per
cen
tile
s fo
r b
oy
s fr
om
3 t
o 6
0 m
on
ths
174 Subscapular skinfold-for-age, boys
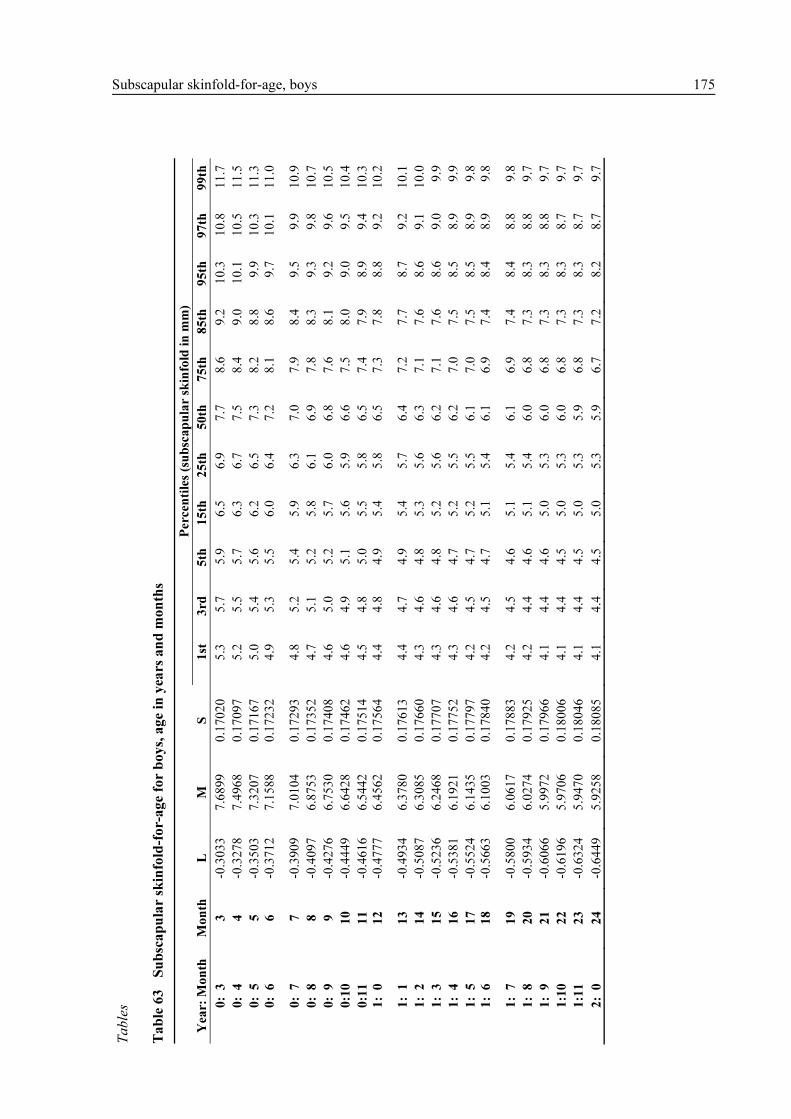
Ta
ble
s
Ta
ble
63
Su
bsc
ap
ula
r sk
info
ld-f
or-
ag
e fo
r b
oy
s, a
ge
in y
ears
an
d m
on
ths
P
erce
nti
les
(su
bsc
ap
ula
r sk
info
ld i
n m
m)
Yea
r: M
on
th
Mon
th
L
M
S
1st
3
rd
5th
1
5th
2
5th
5
0th
7
5th
8
5th
9
5th
9
7th
9
9th
0:
3
3
-0.3
03
3
7.6
899
0
.1702
0
5.3
5
.7
5.9
6
.5
6.9
7
.7
8.6
9
.2
10.3
1
0.8
1
1.7
0:
4
4
-0.3
27
8
7.4
968
0
.1709
7
5.2
5
.5
5.7
6
.3
6.7
7
.5
8.4
9
.0
10.1
1
0.5
1
1.5
0:
5
5
-0.3
50
3
7.3
207
0
.1716
7
5.0
5
.4
5.6
6
.2
6.5
7
.3
8.2
8
.8
9.9
1
0.3
1
1.3
0:
6
6
-0.3
71
2
7.1
588
0
.1723
2
4.9
5
.3
5.5
6
.0
6.4
7
.2
8.1
8
.6
9.7
1
0.1
1
1.0
0:
7
7
-0.3
90
9
7.0
104
0
.1729
3
4.8
5
.2
5.4
5
.9
6.3
7
.0
7.9
8
.4
9.5
9
.9
10.9
0:
8
8
-0.4
09
7
6.8
753
0
.1735
2
4.7
5
.1
5.2
5
.8
6.1
6
.9
7.8
8
.3
9.3
9
.8
10.7
0:
9
9
-0.4
27
6
6.7
530
0
.1740
8
4.6
5
.0
5.2
5
.7
6.0
6
.8
7.6
8
.1
9.2
9
.6
10.5
0:1
0
10
-0
.444
9
6.6
428
0
.1746
2
4.6
4
.9
5.1
5
.6
5.9
6
.6
7.5
8
.0
9.0
9
.5
10.4
0:1
1
11
-0
.461
6
6.5
442
0
.1751
4
4.5
4
.8
5.0
5
.5
5.8
6
.5
7.4
7
.9
8.9
9
.4
10.3
1:
0
12
-0
.477
7
6.4
562
0
.1756
4
4.4
4
.8
4.9
5
.4
5.8
6
.5
7.3
7
.8
8.8
9
.2
10.2
1:
1
13
-0
.493
4
6.3
780
0
.1761
3
4.4
4
.7
4.9
5
.4
5.7
6
.4
7.2
7
.7
8.7
9
.2
10.1
1:
2
14
-0
.508
7
6.3
085
0
.1766
0
4.3
4
.6
4.8
5
.3
5.6
6
.3
7.1
7
.6
8.6
9
.1
10.0
1:
3
15
-0
.523
6
6.2
468
0
.1770
7
4.3
4
.6
4.8
5
.2
5.6
6
.2
7.1
7
.6
8.6
9
.0
9.9
1:
4
16
-0
.538
1
6.1
921
0
.1775
2
4.3
4
.6
4.7
5
.2
5.5
6
.2
7.0
7
.5
8.5
8
.9
9.9
1:
5
17
-0
.552
4
6.1
435
0
.1779
7
4.2
4
.5
4.7
5
.2
5.5
6
.1
7.0
7
.5
8.5
8
.9
9.8
1:
6
18
-0
.566
3
6.1
003
0
.1784
0
4.2
4
.5
4.7
5
.1
5.4
6
.1
6.9
7
.4
8.4
8
.9
9.8
1:
7
19
-0
.580
0
6.0
617
0
.1788
3
4.2
4
.5
4.6
5
.1
5.4
6
.1
6.9
7
.4
8.4
8
.8
9.8
1:
8
20
-0
.593
4
6.0
274
0
.1792
5
4.2
4
.4
4.6
5
.1
5.4
6
.0
6.8
7
.3
8.3
8
.8
9.7
1:
9
21
-0
.606
6
5.9
972
0
.1796
6
4.1
4
.4
4.6
5
.0
5.3
6
.0
6.8
7
.3
8.3
8
.8
9.7
1:1
0
22
-0
.619
6
5.9
706
0
.1800
6
4.1
4
.4
4.5
5
.0
5.3
6
.0
6.8
7
.3
8.3
8
.7
9.7
1:1
1
23
-0
.632
4
5.9
470
0
.1804
6
4.1
4
.4
4.5
5
.0
5.3
5
.9
6.8
7
.3
8.3
8
.7
9.7
2:
0
24
-0
.644
9
5.9
258
0
.1808
5
4.1
4
.4
4.5
5
.0
5.3
5
.9
6.7
7
.2
8.2
8
.7
9.7
Subscapular skinfold-for-age, boys 175

Ta
ble
63
Su
bsc
ap
ula
r sk
info
ld-f
or-
ag
e fo
r b
oy
s, a
ge
in y
ears
an
d m
on
ths
(co
nti
nu
ed)
P
erce
nti
les
(su
bsc
ap
ula
r sk
info
ld i
n m
m)
Yea
r: M
on
th
Mon
th
L
M
S
1st
3
rd
5th
1
5th
2
5th
5
0th
7
5th
8
5th
9
5th
9
7th
9
9th
2:
1
25
-0
.657
3
5.9
067
0
.1812
4
4.1
4
.3
4.5
4
.9
5.3
5
.9
6.7
7
.2
8.2
8
.7
9.7
2:
2
26
-0
.669
5
5.8
891
0
.1816
2
4.1
4
.3
4.5
4
.9
5.2
5
.9
6.7
7
.2
8.2
8
.7
9.7
2:
3
27
-0
.681
6
5.8
729
0
.1819
9
4.0
4
.3
4.5
4
.9
5.2
5
.9
6.7
7
.2
8.2
8
.7
9.7
2:
4
28
-0
.693
5
5.8
576
0
.1823
7
4.0
4
.3
4.5
4
.9
5.2
5
.9
6.7
7
.2
8.2
8
.7
9.7
2:
5
29
-0
.705
3
5.8
431
0
.1827
3
4.0
4
.3
4.4
4
.9
5.2
5
.8
6.6
7
.2
8.2
8
.7
9.7
2:
6
30
-0
.716
9
5.8
290
0
.1830
9
4.0
4
.3
4.4
4
.9
5.2
5
.8
6.6
7
.1
8.2
8
.7
9.7
2:
7
31
-0
.728
3
5.8
150
0
.1834
5
4.0
4
.3
4.4
4
.9
5.2
5
.8
6.6
7
.1
8.2
8
.7
9.7
2:
8
32
-0
.739
7
5.8
011
0
.1838
1
4.0
4
.3
4.4
4
.9
5.2
5
.8
6.6
7
.1
8.2
8
.6
9.7
2:
9
33
-0
.750
9
5.7
870
0
.1841
6
4.0
4
.3
4.4
4
.8
5.1
5
.8
6.6
7
.1
8.2
8
.6
9.7
2:1
0
34
-0
.762
0
5.7
727
0
.1845
0
4.0
4
.2
4.4
4
.8
5.1
5
.8
6.6
7
.1
8.2
8
.6
9.7
2:1
1
35
-0
.773
0
5.7
580
0
.1848
5
4.0
4
.2
4.4
4
.8
5.1
5
.8
6.6
7
.1
8.1
8
.6
9.7
3:
0
36
-0
.783
9
5.7
430
0
.1851
9
4.0
4
.2
4.4
4
.8
5.1
5
.7
6.5
7
.1
8.1
8
.6
9.7
3:
1
37
-0
.794
7
5.7
278
0
.1855
2
4.0
4
.2
4.4
4
.8
5.1
5
.7
6.5
7
.1
8.1
8
.6
9.7
3:
2
38
-0
.805
4
5.7
125
0
.1858
5
3.9
4
.2
4.3
4
.8
5.1
5
.7
6.5
7
.0
8.1
8
.6
9.7
3:
3
39
-0
.815
9
5.6
971
0
.1861
8
3.9
4
.2
4.3
4
.8
5.1
5
.7
6.5
7
.0
8.1
8
.6
9.7
3:
4
40
-0
.826
4
5.6
815
0
.1865
1
3.9
4
.2
4.3
4
.7
5.0
5
.7
6.5
7
.0
8.1
8
.6
9.7
3:
5
41
-0
.836
8
5.6
658
0
.1868
4
3.9
4
.2
4.3
4
.7
5.0
5
.7
6.5
7
.0
8.1
8
.6
9.7
3:
6
42
-0
.847
1
5.6
500
0
.1871
6
3.9
4
.2
4.3
4
.7
5.0
5
.6
6.5
7
.0
8.1
8
.6
9.7
3:
7
43
-0
.857
4
5.6
339
0
.1874
8
3.9
4
.1
4.3
4
.7
5.0
5
.6
6.4
7
.0
8.1
8
.6
9.7
3:
8
44
-0
.867
5
5.6
174
0
.1877
9
3.9
4
.1
4.3
4
.7
5.0
5
.6
6.4
7
.0
8.0
8
.6
9.7
3:
9
45
-0
.877
5
5.6
006
0
.1881
1
3.9
4
.1
4.3
4
.7
5.0
5
.6
6.4
6
.9
8.0
8
.6
9.7
3:1
0
46
-0
.887
5
5.5
834
0
.1884
2
3.9
4
.1
4.2
4
.7
4.9
5
.6
6.4
6
.9
8.0
8
.5
9.7
3:1
1
47
-0
.897
4
5.5
659
0
.1887
3
3.8
4
.1
4.2
4
.6
4.9
5
.6
6.4
6
.9
8.0
8
.5
9.7
4:
0
48
-0
.907
3
5.5
482
0
.1890
3
3.8
4
.1
4.2
4
.6
4.9
5
.5
6.4
6
.9
8.0
8
.5
9.7
176 Subscapular skinfold-for-age, boys
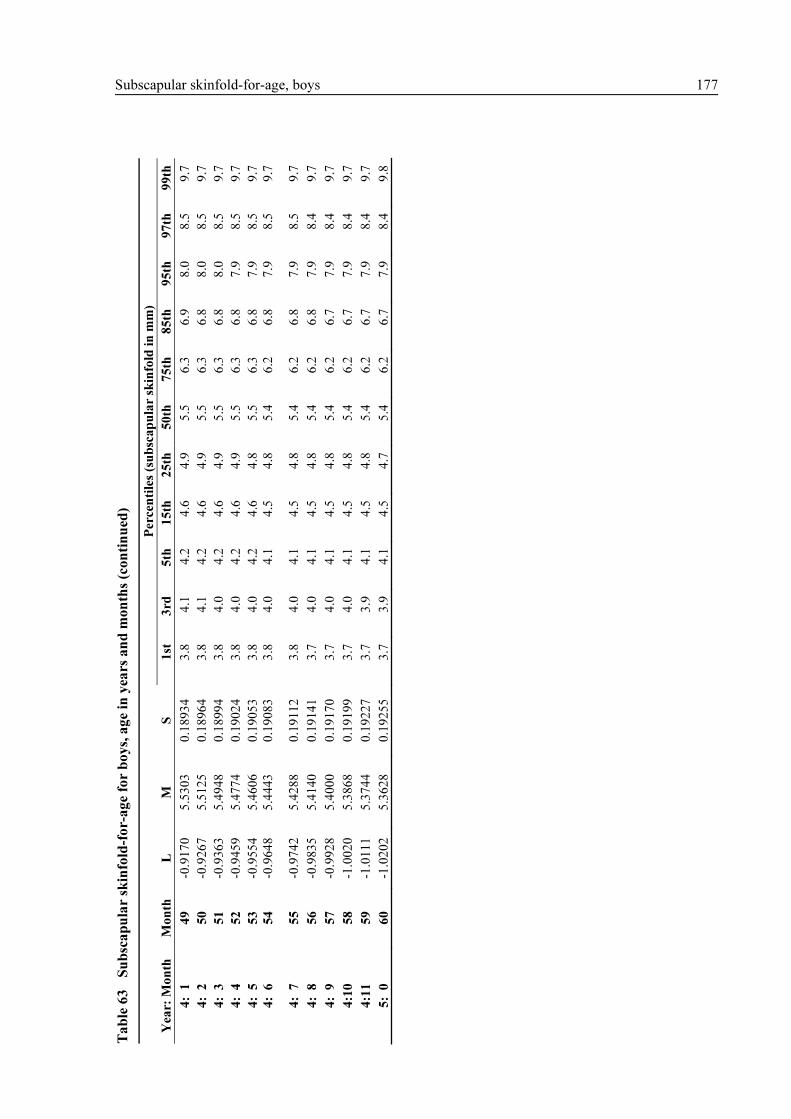
Ta
ble
63
Su
bsc
ap
ula
r sk
info
ld-f
or-
ag
e fo
r b
oy
s, a
ge
in y
ears
an
d m
on
ths
(co
nti
nu
ed)
P
erce
nti
les
(su
bsc
ap
ula
r sk
info
ld i
n m
m)
Yea
r: M
on
th
Mon
th
L
M
S
1st
3
rd
5th
1
5th
2
5th
5
0th
7
5th
8
5th
9
5th
9
7th
9
9th
4:
1
49
-0
.917
0
5.5
303
0
.1893
4
3.8
4
.1
4.2
4
.6
4.9
5
.5
6.3
6
.9
8.0
8
.5
9.7
4:
2
50
-0
.926
7
5.5
125
0
.1896
4
3.8
4
.1
4.2
4
.6
4.9
5
.5
6.3
6
.8
8.0
8
.5
9.7
4:
3
51
-0
.936
3
5.4
948
0
.1899
4
3.8
4
.0
4.2
4
.6
4.9
5
.5
6.3
6
.8
8.0
8
.5
9.7
4:
4
52
-0
.945
9
5.4
774
0
.1902
4
3.8
4
.0
4.2
4
.6
4.9
5
.5
6.3
6
.8
7.9
8
.5
9.7
4:
5
53
-0
.955
4
5.4
606
0
.1905
3
3.8
4
.0
4.2
4
.6
4.8
5
.5
6.3
6
.8
7.9
8
.5
9.7
4:
6
54
-0
.964
8
5.4
443
0
.1908
3
3.8
4
.0
4.1
4
.5
4.8
5
.4
6.2
6
.8
7.9
8
.5
9.7
4:
7
55
-0
.974
2
5.4
288
0
.1911
2
3.8
4
.0
4.1
4
.5
4.8
5
.4
6.2
6
.8
7.9
8
.5
9.7
4:
8
56
-0
.983
5
5.4
140
0
.1914
1
3.7
4
.0
4.1
4
.5
4.8
5
.4
6.2
6
.8
7.9
8
.4
9.7
4:
9
57
-0
.992
8
5.4
000
0
.1917
0
3.7
4
.0
4.1
4
.5
4.8
5
.4
6.2
6
.7
7.9
8
.4
9.7
4:1
0
58
-1
.002
0
5.3
868
0
.1919
9
3.7
4
.0
4.1
4
.5
4.8
5
.4
6.2
6
.7
7.9
8
.4
9.7
4:1
1
59
-1
.011
1
5.3
744
0
.1922
7
3.7
3
.9
4.1
4
.5
4.8
5
.4
6.2
6
.7
7.9
8
.4
9.7
5:
0
60
-1
.020
2
5.3
628
0
.1925
5
3.7
3
.9
4.1
4
.5
4.7
5
.4
6.2
6
.7
7.9
8
.4
9.8
Subscapular skinfold-for-age, boys 177

Ta
ble
63
Su
bsc
ap
ula
r sk
info
ld-f
or-
ag
e fo
r b
oy
s, a
ge
in y
ears
an
d m
on
ths
(co
nti
nu
ed)
Z
-sco
res
(su
bsc
ap
ula
r sk
info
ld i
n m
m)
Yea
r: M
on
th
Mon
th
L
M
S
-3 S
D
-2 S
D
-1 S
D
Med
ian
1
SD
2
SD
3
SD
0:
3
3
-0.3
03
3
7.6
899
0
.1702
0
4.8
5
.6
6.5
7
.7
9.2
1
1.0
1
3.4
0:
4
4
-0.3
27
8
7.4
968
0
.1709
7
4.7
5
.4
6.3
7
.5
8.9
1
0.8
1
3.1
0:
5
5
-0.3
50
3
7.3
207
0
.1716
7
4.6
5
.3
6.2
7
.3
8.7
1
0.6
1
2.9
0:
6
6
-0.3
71
2
7.1
588
0
.1723
2
4.5
5
.2
6.1
7
.2
8.6
1
0.4
1
2.7
0:
7
7
-0.3
90
9
7.0
104
0
.1729
3
4.4
5
.1
5.9
7
.0
8.4
1
0.2
1
2.5
0:
8
8
-0.4
09
7
6.8
753
0
.1735
2
4.3
5
.0
5.8
6
.9
8.2
1
0.0
1
2.3
0:
9
9
-0.4
27
6
6.7
530
0
.1740
8
4.2
4
.9
5.7
6
.8
8.1
9
.8
12.2
0:1
0
10
-0
.444
9
6.6
428
0
.1746
2
4.1
4
.8
5.6
6
.6
8.0
9
.7
12.1
0:1
1
11
-0
.461
6
6.5
442
0
.1751
4
4.1
4
.7
5.5
6
.5
7.9
9
.6
11.9
1:
0
12
-0
.477
7
6.4
562
0
.1756
4
4.0
4
.7
5.5
6
.5
7.8
9
.5
11.8
1:
1
13
-0
.493
4
6.3
780
0
.1761
3
4.0
4
.6
5.4
6
.4
7.7
9
.4
11.8
1:
2
14
-0
.508
7
6.3
085
0
.1766
0
3.9
4
.6
5.3
6
.3
7.6
9
.3
11.7
1:
3
15
-0
.523
6
6.2
468
0
.1770
7
3.9
4
.5
5.3
6
.2
7.5
9
.2
11.6
1:
4
16
-0
.538
1
6.1
921
0
.1775
2
3.9
4
.5
5.2
6
.2
7.5
9
.2
11.6
1:
5
17
-0
.552
4
6.1
435
0
.1779
7
3.8
4
.4
5.2
6
.1
7.4
9
.1
11.6
1:
6
18
-0
.566
3
6.1
003
0
.1784
0
3.8
4
.4
5.1
6
.1
7.4
9
.1
11.5
1:
7
19
-0
.580
0
6.0
617
0
.1788
3
3.8
4
.4
5.1
6
.1
7.3
9
.1
11.5
1:
8
20
-0
.593
4
6.0
274
0
.1792
5
3.8
4
.4
5.1
6
.0
7.3
9
.0
11.5
1:
9
21
-0
.606
6
5.9
972
0
.1796
6
3.8
4
.3
5.1
6
.0
7.3
9
.0
11.5
1:1
0
22
-0
.619
6
5.9
706
0
.1800
6
3.7
4
.3
5.0
6
.0
7.2
9
.0
11.5
1:1
1
23
-0
.632
4
5.9
470
0
.1804
6
3.7
4
.3
5.0
5
.9
7.2
9
.0
11.5
2:
0
24
-0
.644
9
5.9
258
0
.1808
5
3.7
4
.3
5.0
5
.9
7.2
8
.9
11.6
178 Subscapular skinfold-for-age, boys

Ta
ble
63
Su
bsc
ap
ula
r sk
info
ld-f
or-
ag
e fo
r b
oy
s, a
ge
in y
ears
an
d m
on
ths
(co
nti
nu
ed)
Z
-sco
res
(su
bsc
ap
ula
r sk
info
ld i
n m
m)
Yea
r: M
on
th
Mon
th
L
M
S
-3 S
D
-2 S
D
-1 S
D
Med
ian
1
SD
2
SD
3
SD
2:
1
25
-0
.657
3
5.9
067
0
.1812
4
3.7
4
.3
5.0
5
.9
7.2
8
.9
11.6
2:
2
26
-0
.669
5
5.8
891
0
.1816
2
3.7
4
.3
5.0
5
.9
7.1
8
.9
11.6
2:
3
27
-0
.681
6
5.8
729
0
.1819
9
3.7
4
.2
4.9
5
.9
7.1
8
.9
11.6
2:
4
28
-0
.693
5
5.8
576
0
.1823
7
3.7
4
.2
4.9
5
.9
7.1
8
.9
11.7
2:
5
29
-0
.705
3
5.8
431
0
.1827
3
3.7
4
.2
4.9
5
.8
7.1
8
.9
11.7
2:
6
30
-0
.716
9
5.8
290
0
.1830
9
3.7
4
.2
4.9
5
.8
7.1
8
.9
11.7
2:
7
31
-0
.728
3
5.8
150
0
.1834
5
3.7
4
.2
4.9
5
.8
7.1
8
.9
11.7
2:
8
32
-0
.739
7
5.8
011
0
.1838
1
3.7
4
.2
4.9
5
.8
7.1
8
.9
11.8
2:
9
33
-0
.750
9
5.7
870
0
.1841
6
3.6
4
.2
4.9
5
.8
7.1
8
.9
11.8
2:1
0
34
-0
.762
0
5.7
727
0
.1845
0
3.6
4
.2
4.9
5
.8
7.0
8
.9
11.8
2:1
1
35
-0
.773
0
5.7
580
0
.1848
5
3.6
4
.2
4.8
5
.8
7.0
8
.9
11.9
3:
0
36
-0
.783
9
5.7
430
0
.1851
9
3.6
4
.1
4.8
5
.7
7.0
8
.9
11.9
3:
1
37
-0
.794
7
5.7
278
0
.1855
2
3.6
4
.1
4.8
5
.7
7.0
8
.9
11.9
3:
2
38
-0
.805
4
5.7
125
0
.1858
5
3.6
4
.1
4.8
5
.7
7.0
8
.9
12.0
3:
3
39
-0
.815
9
5.6
971
0
.1861
8
3.6
4
.1
4.8
5
.7
7.0
8
.9
12.0
3:
4
40
-0
.826
4
5.6
815
0
.1865
1
3.6
4
.1
4.8
5
.7
7.0
8
.9
12.0
3:
5
41
-0
.836
8
5.6
658
0
.1868
4
3.6
4
.1
4.8
5
.7
6.9
8
.9
12.1
3:
6
42
-0
.847
1
5.6
500
0
.1871
6
3.6
4
.1
4.7
5
.6
6.9
8
.9
12.1
3:
7
43
-0
.857
4
5.6
339
0
.1874
8
3.6
4
.1
4.7
5
.6
6.9
8
.9
12.1
3:
8
44
-0
.867
5
5.6
174
0
.1877
9
3.6
4
.1
4.7
5
.6
6.9
8
.8
12.2
3:
9
45
-0
.877
5
5.6
006
0
.1881
1
3.5
4
.0
4.7
5
.6
6.9
8
.8
12.2
3:1
0
46
-0
.887
5
5.5
834
0
.1884
2
3.5
4
.0
4.7
5
.6
6.9
8
.8
12.2
3:1
1
47
-0
.897
4
5.5
659
0
.1887
3
3.5
4
.0
4.7
5
.6
6.8
8
.8
12.3
4:
0
48
-0
.907
3
5.5
482
0
.1890
3
3.5
4
.0
4.7
5
.5
6.8
8
.8
12.3
Subscapular skinfold-for-age, boys 179

Ta
ble
63
Su
bsc
ap
ula
r sk
info
ld-f
or-
ag
e fo
r b
oy
s, a
ge
in y
ears
an
d m
on
ths
(co
nti
nu
ed)
Z
-sco
res
(su
bsc
ap
ula
r sk
info
ld i
n m
m)
Yea
r: M
on
th
Mon
th
L
M
S
-3 S
D
-2 S
D
-1 S
D
Med
ian
1
SD
2
SD
3
SD
4:
1
49
-0
.917
0
5.5
303
0
.1893
4
3.5
4
.0
4.6
5
.5
6.8
8
.8
12.3
4:
2
50
-0
.926
7
5.5
125
0
.1896
4
3.5
4
.0
4.6
5
.5
6.8
8
.8
12.4
4:
3
51
-0
.936
3
5.4
948
0
.1899
4
3.5
4
.0
4.6
5
.5
6.8
8
.8
12.4
4:
4
52
-0
.945
9
5.4
774
0
.1902
4
3.5
4
.0
4.6
5
.5
6.8
8
.8
12.4
4:
5
53
-0
.955
4
5.4
606
0
.1905
3
3.5
3
.9
4.6
5
.5
6.7
8
.8
12.5
4:
6
54
-0
.964
8
5.4
443
0
.1908
3
3.5
3
.9
4.6
5
.4
6.7
8
.8
12.5
4:
7
55
-0
.974
2
5.4
288
0
.1911
2
3.4
3
.9
4.6
5
.4
6.7
8
.8
12.6
4:
8
56
-0
.983
5
5.4
140
0
.1914
1
3.4
3
.9
4.5
5
.4
6.7
8
.8
12.6
4:
9
57
-0
.992
8
5.4
000
0
.1917
0
3.4
3
.9
4.5
5
.4
6.7
8
.7
12.7
4:1
0
58
-1
.002
0
5.3
868
0
.1919
9
3.4
3
.9
4.5
5
.4
6.7
8
.7
12.7
4:1
1
59
-1
.011
1
5.3
744
0
.1922
7
3.4
3
.9
4.5
5
.4
6.7
8
.7
12.8
5:
0
60
-1
.020
2
5.3
628
0
.1925
5
3.4
3
.9
4.5
5
.4
6.6
8
.7
12.8
180 Subscapular skinfold-for-age, boys

Subscapular skinfold-for-age, girls 181
6.3 Subscapular skinfold-for-age for girls
Steps similar to those used to construct the subscapular skinfold-for-age growth curves for boys were followed to fit the subscapular skinfold-for-age growth curves for girls.
6.3.1 Sample size
There were a total of 10 934 subscapular skinfold observations for girls. The longitudinal and cross-sectional sample sizes by visit and age are presented in Tables 64 and 65. The measurement of subscapular skinfold started at 3 months of age (de Onis et al., 2004b).
Table 64 Longitudinal sample sizes for subscapular skinfold-for-age for girls
Visit 5 6 7 8 9 10 Age 3 mo 4 mo 5 mo 6 mo 7 mo 8 mo N 446 443 447 445 444 440 Visit 11 12 13 14 15 16 Age 9 mo 10 mo 11 mo 12 mo 14 mo 16 mo N 444 443 440 448 445 441 Visit 17 18 19 20 Age 18 mo 20 mo 22 mo 24 mo N 444 443 433 447
Table 65 Cross-sectional sample sizes for subscapular skinfold-for-age for girls
Age (mo) <18 18–20 21–23 24–26 27–29 30–32 33–35 N 2 159 167 237 213 224 222
Age (mo) 36–38 39–41 42–44 45–47 48–50 51–53 54–56 N 217 233 246 205 219 196 229
Age (mo) 57–59 60–62 63–65 66–68 69–71 >71
N 236 213 203 222 198 0
6.3.2 Model selection and results
The model BCPE(x=ageλ, df(µ)=9, df(σ)=4, df(ν)=4, τ=2) was used as a starting point to search for the best value of the age-transformation power λ. Table 66 shows the global deviance for values of λ from 0.05 to 1. The minimum global deviance value was for λ 0.45 to 0.60, and λ=0.50 was selected to continue the search for the best model.

182 Subscapular skinfold-for-age, girls
Table 66 Global deviance (GD) for models within the class BCPE(x=ageλ, df(µ)=9, df(σ)=4,
df(ν)=4, τ=2) for subscapular skinfold-for-age for girls
λ 0.05 0.10 0.15 0.20 0.25 0.30 0.35 0.40 0.45 0.50
GDa
658.1 657.6 657.2 656.9 656.7 656.5 656.3 656.3 656.2 656.2
λ 0.55 0.60 0.65 0.70 0.75 0.80 0.85 0.90 0.95 1.00
GDa
656.2 656.2 656.3 656.4 656.5 656.7 657.1 657.5 658.1 659.0
a In excess of 36 000.
The search for the best df(µ) and df(σ) followed, fixing λ=0.50, ν=1 and τ=2. All possible
combinations with df(µ) values ranging from 4 to 15 and df(σ) from 2 to 10 were considered and
partial results are presented in Table 67. The fitted model that minimized GAIC(3) was that with
df(µ)=5 and df(σ)=4 and it was thus selected for further evaluation.
Table 67 Goodness-of-fit summary for models using the BCPE distribution with fixed ν=1 and
τ=2 for subscapular skinfold-for-age for girls
df(µ) df(σ) GDa
AICa
GAIC(3)a
Total df
2 2485.9 2497.9 2503.9 6
3 2438.2 2452.2 2459.2 7
4 2433.0 2449.0 2457.0 8
5 2432.3 2450.3 2459.3 9
4
6 2431.6 2451.6 2461.6 10
2 2477.0 2491.0 2498.0 7
3 2430.9 2446.9 2454.9 8
4 2424.4 2442.4 2451.4 9
5 2423.2 2443.2 2453.2 10
5
6 2422.4 2444.4 2455.4 11
2 2475.2 2491.2 2499.2 8
3 2429.4 2447.4 2456.4 9
4 2422.5 2442.5 2452.5 10
5 2421.2 2443.2 2454.2 11
6
6 2420.4 2444.4 2456.4 12
2 2474.2 2492.2 2501.2 9
3 2428.5 2448.5 2458.5 10
4 2421.5 2443.5 2454.5 11
5 2420.1 2444.1 2456.1 12
7
6 2419.3 2445.3 2458.3 13
2 2473.0 2493.0 2503.0 10
3 2427.5 2449.5 2460.5 11
4 2420.4 2444.4 2456.4 12
5 2419.1 2445.1 2458.1 13
8
6 2418.2 2446.2 2460.2 14
GD, Global Deviance; AIC, Akaike Information Criterion;
GAIC(3), Generalized AIC with penalty equal to 3; a In excess of 36 000.

Subscapular skinfold-for-age, girls 183
Model 1: BCPE(x=age0.50
, df(µ)=5, df(σ)=4, ν=1, τ=2)
This model was inadequate with evidence of residual skewness in both the worm plots (Figure 79) and
the Q-test results (Table 68). The worms presented U-shapes in all age groups and the Q-test results
(Table 68) showed that all groups had absolute values of z3 higher than 2. Most of the age groups also
presented absolute values of z4 higher than 2, indicating residual kurtosis. Both overall tests for
skewness and kurtosis were significant (p-value < 0.01). No misfit was detected in the mean and the
variance.
3 mo 4 mo 5 mo 6 mo 7 mo
8 mo 9 mo 10
mo
11 mo 12 mo
14 mo 16 mo 18 mo 20 mo 22 mo
24 mo 28 mo 34 mo 40 mo 46 mo
52 mo 58 mo 64 mo 70 mo
3 mo 4 mo 5 mo 6 mo 7 mo
8 mo 9 mo 10
mo
11 mo 12 mo
14 mo 16 mo 18 mo 20 mo 22 mo
24 mo 28 mo 34 mo 40 mo 46 mo
52 mo 58 mo 64 mo 70 mo
3 mo 4 mo 5 mo 6 mo 7 mo
8 mo 9 mo 10
mo
11 mo 12 mo
14 mo 16 mo 18 mo 20 mo 22 mo
24 mo 28 mo 34 mo 40 mo 46 mo
52 mo 58 mo 64 mo 70 mo
Figure 79 Worm plots of z-scores for Model 1 for subscapular skinfold-for-age for girls
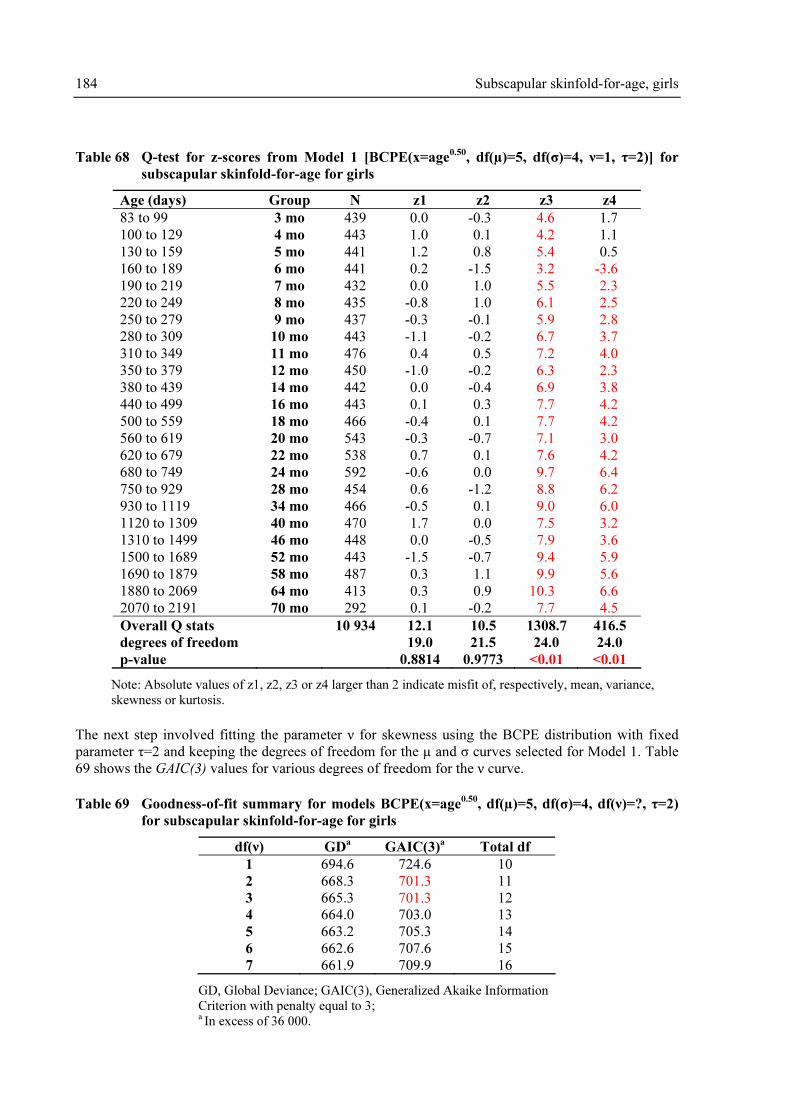
184 Subscapular skinfold-for-age, girls
Table 68 Q-test for z-scores from Model 1 [BCPE(x=age0.50
, df(µ)=5, df(σ)=4, ν=1, τ=2)] for
subscapular skinfold-for-age for girls
Age (days) Group N z1 z2 z3 z4
83 to 99 3 mo 439 0.0 -0.3 4.6 1.7
100 to 129 4 mo 443 1.0 0.1 4.2 1.1
130 to 159 5 mo 441 1.2 0.8 5.4 0.5
160 to 189 6 mo 441 0.2 -1.5 3.2 -3.6
190 to 219 7 mo 432 0.0 1.0 5.5 2.3
220 to 249 8 mo 435 -0.8 1.0 6.1 2.5
250 to 279 9 mo 437 -0.3 -0.1 5.9 2.8
280 to 309 10 mo 443 -1.1 -0.2 6.7 3.7
310 to 349 11 mo 476 0.4 0.5 7.2 4.0
350 to 379 12 mo 450 -1.0 -0.2 6.3 2.3
380 to 439 14 mo 442 0.0 -0.4 6.9 3.8
440 to 499 16 mo 443 0.1 0.3 7.7 4.2
500 to 559 18 mo 466 -0.4 0.1 7.7 4.2
560 to 619 20 mo 543 -0.3 -0.7 7.1 3.0
620 to 679 22 mo 538 0.7 0.1 7.6 4.2
680 to 749 24 mo 592 -0.6 0.0 9.7 6.4
750 to 929 28 mo 454 0.6 -1.2 8.8 6.2
930 to 1119 34 mo 466 -0.5 0.1 9.0 6.0
1120 to 1309 40 mo 470 1.7 0.0 7.5 3.2
1310 to 1499 46 mo 448 0.0 -0.5 7.9 3.6
1500 to 1689 52 mo 443 -1.5 -0.7 9.4 5.9
1690 to 1879 58 mo 487 0.3 1.1 9.9 5.6
1880 to 2069 64 mo 413 0.3 0.9 10.3 6.6
2070 to 2191 70 mo 292 0.1 -0.2 7.7 4.5
Overall Q stats 10 934 12.1 10.5 1308.7 416.5
degrees of freedom 19.0 21.5 24.0 24.0
p-value 0.8814 0.9773 <0.01 <0.01
Note: Absolute values of z1, z2, z3 or z4 larger than 2 indicate misfit of, respectively, mean, variance,
skewness or kurtosis.
The next step involved fitting the parameter ν for skewness using the BCPE distribution with fixed
parameter τ=2 and keeping the degrees of freedom for the µ and σ curves selected for Model 1. Table
69 shows the GAIC(3) values for various degrees of freedom for the ν curve.
Table 69 Goodness-of-fit summary for models BCPE(x=age0.50
, df(µ)=5, df(σ)=4, df(ν)=?, τ=2)
for subscapular skinfold-for-age for girls
df(ν) GDa
GAIC(3)a
Total df
1 694.6 724.6 10
2 668.3 701.3 11
3 665.3 701.3 12
4 664.0 703.0 13
5 663.2 705.3 14
6 662.6 707.6 15
7 661.9 709.9 16
GD, Global Deviance; GAIC(3), Generalized Akaike Information
Criterion with penalty equal to 3; a In excess of 36 000.

Subscapular skinfold-for-age, girls 185
The smallest GAIC(3) value corresponded to df(ν)=2 or 3. Selecting df(ν)=2, a re-search for the best
df(µ) and df(σ) was carried out and df(µ)=5 and df(σ)=4 was still the best choice. A re-search for the
age transformation power λ using the model BCPE(x=age0.50, df(µ)=5, df(σ)=4, df(ν)=2, τ=2) was
carried out and it pointed to the value 0.15 as the best choice of λ (GD=36665.5). Using λ=0.15 and
df(ν)=2, the best combination of df(µ) and df(σ) was sought. Partial results of this re-search are
presented in Table 70.
Table 70 Goodness-of-fit summary for models using the BCPE distribution with λ=0.15,
df(ν)=2 and τ=2 for subscapular skinfold-for-age for girls
df(µ) df(σ) GDa
AICa
GAIC(3)a
Total df
2 726.4 742.4 750.5 8
3 678.7 696.7 705.7 9
4 669.7 689.7 699.7 10
5 667.8 689.8 700.8 11
4
6 667.1 691.1 703.1 12
2 722.7 740.7 749.7 9
3 674.3 694.3 704.3 10
4 665.5 687.5 698.5 11
5 663.8 687.8 699.8 12
5
6 663.2 689.2 702.2 13
2 720.5 740.5 750.5 10
3 672.5 694.5 705.5 11
4 663.9 687.9 699.9 12
5 662.3 688.3 701.3 13
6
6 661.6 689.6 703.6 14
2 719.6 741.6 752.6 11
3 671.1 695.1 707.1 12
4 662.5 688.5 701.5 13
5 660.9 688.9 702.9 14
7
6 660.3 690.3 705.4 15
2 718.3 742.3 754.3 12
3 669.8 695.8 708.8 13
4 661.3 689.3 703.3 14
5 659.7 689.7 704.7 15
8
6 659.2 691.2 707.2 16
GD, Global Deviance; AIC, Akaike Information Criterion;
GAIC(3), Generalized AIC with penalty equal to 3; a In excess of 36 000.
The smallest GAIC(3) value was associated with df(µ)=5 and df(σ)=4 indicating no need for further
updating the model.
Model 2: BCPE(x=age0.15
, df(µ)=5, df(σ)=4, df(ν)=2, τ=2)
Figure 80 shows the fit of parameters µ, σ and ν for Model 2 with their respective sample estimates,
that is, the median for µ, the sample standard deviation of the Box-Cox transformed data for σ and
Box-Cox transform power for ν.
Figures 81 and 82 show the distribution of differences between empirical values and fitted centiles for
the longitudinal and cross-sectional samples, respectively. There was a non-random pattern only for

186 Subscapular skinfold-for-age, girls
the 75th centile for ages between 3 and 24 months (Figure 81), the maximum difference between the
empirical and the fitted centiles being less than 0.2 mm. There was no indication of systematic bias for
ages between 24 and 71 months (Figure 82).
The worm plots for this model (Figure 83) show that adjustment for skewness was effective (no age
groups presented U-shaped worms using Model 2). There were a few age groups with S-shaped worms
but these were contained within the 95% confidence intervals, except for age groups 5 mo and 6 mo,
which indicated remaining kurtosis. There was also a worm with slope at age group 28 mo, suggesting
misfit of the variance but it was contained within the 95% confidence interval.
Age (months)
Su
bsca
pu
lar
Skin
fold
Me
dia
n (
mm
)
6.0
6.5
7.0
7.5
0 6 14 22 30 39 48 57 66
Age (months)
St
De
v B
ox-C
ox T
ran
form
ed
SS
0.1
80
.20
0.2
20
.24
0.2
6
0 6 14 22 30 39 48 57 66
Age (months)
Bo
x-C
ox T
ran
sfo
rm P
ow
er
-1.2
-0.8
-0.4
0.0
0 6 14 22 30 39 48 57 66
Figure 80 Fitting of the µ, σ, and ν curves of Model 2 for subscapular skinfold-for-age
for girls from 3 to 71 months (dotted line) and their respective sample
estimates (points with solid line)

Subscapular skinfold-for-age, girls 187
3rd Centile
-0.4
0.0
0.2
0.4
4 6 8 10 14 18 22
5th Centile
-0.4
0.0
0.2
0.4
4 6 8 10 14 18 22
10th Centile
-0.4
0.0
0.2
0.4
4 6 8 10 14 18 22
25th Centile
-0.4
0.0
0.2
0.4
4 6 8 10 14 18 22
50th Centile
-0.4
0.0
0.2
0.4
4 6 8 10 14 18 22
75th Centile
-0.4
0.0
0.2
0.4
4 6 8 10 14 18 22
90th Centile
-0.4
0.0
0.2
0.4
4 6 8 10 14 18 22
95th Centile
-0.4
0.0
0.2
0.4
4 6 8 10 14 18 22
97th Centile
-0.4
0.0
0.2
0.4
4 6 8 10 14 18 22
Age (months)
Em
piric
al-F
itte
d C
en
tile
fo
r S
ub
sca
pu
lar
Skin
fold
(m
m)
Figure 81 Centile residuals from fitting Model 2 for subscapular skinfold-for-age
from 3 to 24 months for girls
3rd Centile
-1.0
0.0
1.0
25 31 37 43 49 55 61 67
5th Centile
-1.0
0.0
1.0
25 31 37 43 49 55 61 67
10th Centile
-1.0
0.0
1.0
25 31 37 43 49 55 61 67
25th Centile
-1.0
0.0
1.0
25 31 37 43 49 55 61 67
50th Centile
-1.0
0.0
1.0
25 31 37 43 49 55 61 67
75th Centile
-1.0
0.0
1.0
25 31 37 43 49 55 61 67
90th Centile
-1.0
0.0
1.0
25 31 37 43 49 55 61 67
95th Centile
-1.0
0.0
1.0
25 31 37 43 49 55 61 67
97th Centile
-1.0
0.0
1.0
25 31 37 43 49 55 61 67
Age (months)
Em
piric
al-F
itte
d C
en
tile
fo
r S
ub
sca
pu
lar
Skin
fold
(m
m)
Figure 82 Centile residuals from fitting Model 2 for subscapular skinfold-for-age
from 24 to 71 months for girls
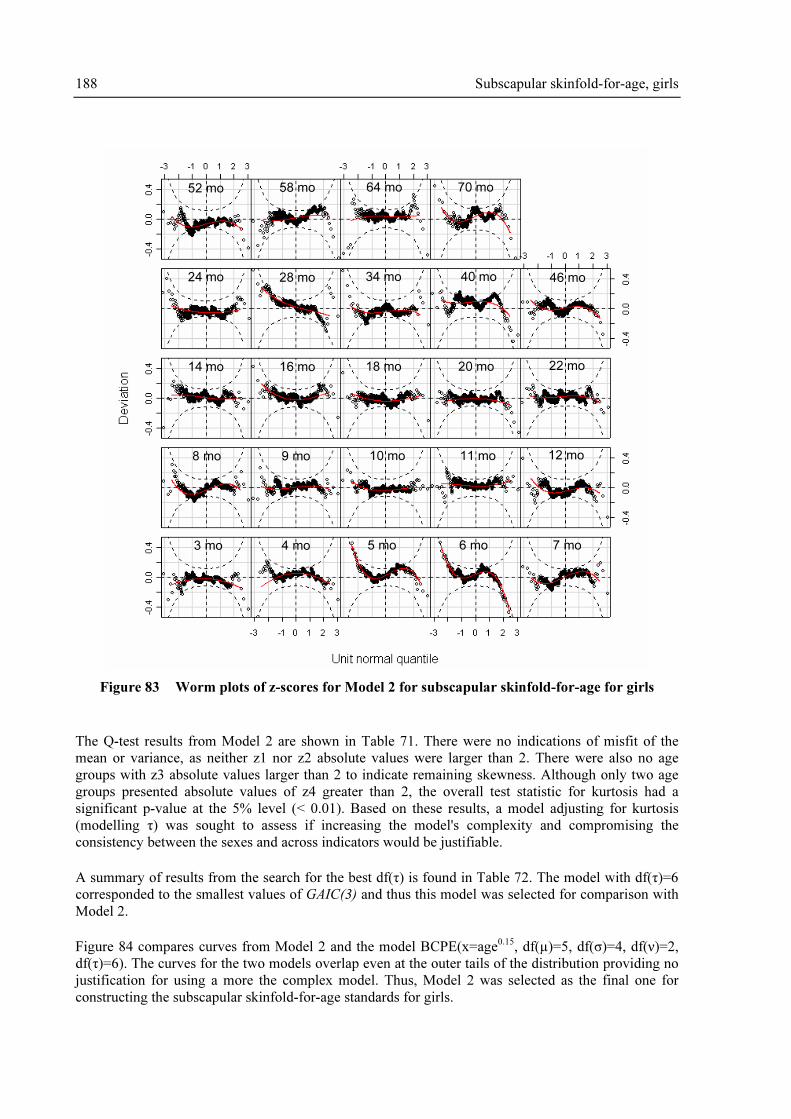
188 Subscapular skinfold-for-age, girls
3 mo 4 mo 5 mo 6 mo 7 mo
8 mo 9 mo 10 mo 11 mo 12 mo
14 mo 16 mo 18 mo 20 mo 22 mo
24 mo 28 mo 34 mo 40 mo 46 mo
52 mo 58 mo 64 mo 70 mo
3 mo 4 mo 5 mo 6 mo 7 mo
8 mo 9 mo 10 mo 11 mo 12 mo
14 mo 16 mo 18 mo 20 mo 22 mo
24 mo 28 mo 34 mo 40 mo 46 mo
52 mo 58 mo 64 mo 70 mo
Figure 83 Worm plots of z-scores for Model 2 for subscapular skinfold-for-age for girls
The Q-test results from Model 2 are shown in Table 71. There were no indications of misfit of the
mean or variance, as neither z1 nor z2 absolute values were larger than 2. There were also no age
groups with z3 absolute values larger than 2 to indicate remaining skewness. Although only two age
groups presented absolute values of z4 greater than 2, the overall test statistic for kurtosis had a
significant p-value at the 5% level (< 0.01). Based on these results, a model adjusting for kurtosis
(modelling τ) was sought to assess if increasing the model's complexity and compromising the
consistency between the sexes and across indicators would be justifiable.
A summary of results from the search for the best df(τ) is found in Table 72. The model with df(τ)=6
corresponded to the smallest values of GAIC(3) and thus this model was selected for comparison with
Model 2.
Figure 84 compares curves from Model 2 and the model BCPE(x=age0.15
, df(µ)=5, df(σ)=4, df(ν)=2,
df(τ)=6). The curves for the two models overlap even at the outer tails of the distribution providing no
justification for using a more the complex model. Thus, Model 2 was selected as the final one for
constructing the subscapular skinfold-for-age standards for girls.

Subscapular skinfold-for-age, girls 189
Table 71 Q-test for z-scores from Model 2 [BCPE(x=age0.15
, df(µ)=5 df(σ)=4, df(ν)=2, τ=2)] for
subscapular skinfold-for-age for girls
Age (days) Group N z1 z2 z3 z4
83 to 99 3 mo 439 -0.8 -0.2 -0.8 0.1
100 to 129 4 mo 443 0.6 0.2 -1.6 1.1
130 to 159 5 mo 441 1.1 0.1 1.2 -3.5
160 to 189 6 mo 441 0.6 -1.0 -0.5 -5.5
190 to 219 7 mo 432 0.1 1.1 -0.2 -1.5
220 to 249 8 mo 435 -0.6 1.1 0.7 -1.8
250 to 279 9 mo 437 0.1 0.0 -0.2 -0.4
280 to 309 10 mo 443 -0.7 0.0 0.6 -0.7
310 to 349 11 mo 476 0.7 0.1 0.5 0.2
350 to 379 12 mo 450 -0.8 0.2 0.6 -1.3
380 to 439 14 mo 442 0.2 -0.4 0.1 0.4
440 to 499 16 mo 443 0.1 -0.3 1.4 -0.1
500 to 559 18 mo 466 -0.6 0.0 0.8 0.0
560 to 619 20 mo 543 -0.5 -0.1 -0.6 0.3
620 to 679 22 mo 538 0.4 0.1 -0.4 -0.6
680 to 749 24 mo 592 -1.0 -0.1 0.6 0.0
750 to 929 28 mo 454 0.7 -1.9 0.7 -0.2
930 to 1119 34 mo 466 -0.9 0.2 0.1 -0.6
1120 to 1309 40 mo 470 1.7 -0.3 -0.6 -0.6
1310 to 1499 46 mo 448 0.1 -0.1 -0.1 -1.3
1500 to 1689 52 mo 443 -1.5 0.3 0.2 -1.2
1690 to 1879 58 mo 487 0.3 0.9 0.0 -0.1
1880 to 2069 64 mo 413 0.7 0.2 -0.2 0.7
2070 to 2191 70 mo 292 0.5 0.4 -0.3 -1.9
Overall Q stats 10 934 13.6 8.7 10.7 60.2
degrees of freedom 19.0 21.5 22.0 24.0
p-value 0.8093 0.9934 0.9790 <0.01
Note: Absolute values of z1, z2, z3 or z4 larger than 2 indicate misfit of, respectively, mean, variance,
skewness or kurtosis.
Table 72 Goodness-of-fit summary for models BCPE(x=age0.15
, df(µ)=5, df(σ)=4, df(ν)=2,
df(τ)=?) for subscapular skinfold-for-age for girls
df(τ) GDa
GAIC(3)a
Total df
1 655.3 691.3 12
2 652.6 691.7 13
3 648.3 690.3 14
4 643.1 688.2 15
5 638.5 686.5 16
6 635.2 686.2 17
7 632.8 686.8 18
GD, Global Deviance; GAIC(3), Generalized Akaike Information
Criterion with penalty equal to 3; a In excess of 36 000.

190 Subscapular skinfold-for-age, girls
Table 73 presents observed percentages with subscapular skinfolds below the fitted centiles. There
was no detectable pattern of a systematic bias.
The model BCPE(x=age0.15
, df(µ)=5, df(σ)=4, df(ν)=2, τ=2) was considered adequate and selected for
constructing the subscapular skinfold-for-age growth curves for girls. It adjusts only for skewness,
since there was no difference in the final curves when adjusting for kurtosis. The fitted centile curves
and empirical centiles are shown in Figures 85 to 88.

Ag
e (
mo
nth
s)
Subscapular Skinfold (mm)
51015
24
68
12
16
20
24
28
32
36
40
44
48
52
56
60
123 0 -1 -2 -3
Ad
justin
g f
or
ske
wn
ess
Ad
justin
g f
or
ske
wn
ess a
nd
ku
rto
sis
Fig
ure
84
Co
mp
ari
son
of
the
fitt
ed g
row
th c
urv
es u
sin
g M
od
el 2
(so
lid
lin
e) w
ith
th
e m
od
el a
dju
stin
g f
or
ku
rtosi
s (d
ash
ed l
ine)
Subscapular skinfold-for-age, girls 191

Ta
ble
73
Ob
serv
ed p
ro
po
rtio
ns
of
chil
dre
n w
ith
mea
surem
ents
bel
ow
th
e fi
tted
cen
tile
s fr
om
Mo
del
2, su
bsc
ap
ula
r sk
info
ld-f
or-
ag
e fo
r g
irls
Ex
pec
ted
3
mo
4
mo
5
mo
6
mo
7
mo
8
mo
9
mo
1
0 m
o
11
mo
1
0.9
0
.9
0.0
0
.0
0.9
0
.7
0.5
0
.9
1.5
3
4.6
2
.0
1.1
1
.6
3.0
2
.8
3.2
2
.9
1.7
5
5.9
4
.3
3.4
4
.1
5.3
4
.6
4.8
5
.0
5.0
10
1
0.0
9
.5
9.3
9
.8
10
.9
11
.3
8.7
1
0.2
8
.6
25
2
5.3
2
4.4
2
5.9
2
6.3
2
7.8
2
7.6
2
5.2
2
7.5
2
4.4
50
4
9.7
4
8.3
4
9.9
5
0.3
4
7.9
4
9.9
4
9.2
5
1.5
4
8.9
75
7
5.9
7
1.6
7
1.7
7
0.7
7
3.4
7
2.9
7
4.1
7
5.4
7
4.2
90
9
1.6
8
8.7
8
7.1
8
9.1
8
9.4
8
9.7
8
8.8
9
0.7
8
9.7
95
9
6.1
9
5.0
9
3.4
9
5.7
9
4.0
9
4.7
9
5.2
9
5.7
9
3.9
97
9
7.0
9
7.3
9
6.6
9
8.4
9
7.5
9
7.0
9
7.5
9
6.8
9
6.6
99
9
8.9
9
9.1
9
9.1
1
00
.0
98
.8
98
.9
98
.9
98
.9
98
.7
Ex
pec
ted
1
2 m
o
14
mo
1
6 m
o
18
mo
2
0 m
o
22
mo
2
4 m
o
28
mo
3
4 m
o
1
1.8
0
.7
0.7
1
.1
1.3
0
.7
0.7
0
.7
0.9
3
2.7
2
.3
1.8
3
.0
2.6
3
.3
4.1
1
.8
3.6
5
5.1
4
.1
4.1
5
.6
4.4
5
.4
6.4
2
.6
6.9
10
1
0.0
1
0.6
9
.5
10
.3
10
.9
10
.8
11
.0
8.8
1
1.4
25
2
6.2
2
4.0
2
4.6
2
6.2
2
4.1
2
5.7
2
7.0
2
2.7
2
6.8
50
5
3.8
4
5.7
5
0.8
5
1.7
4
8.8
4
8.5
5
2.5
4
8.0
4
8.7
75
7
5.6
7
5.8
7
5.6
7
7.9
7
5.9
7
4.3
7
7.7
7
5.6
7
7.5
90
8
9.1
8
9.8
9
0.1
9
0.3
9
0.4
9
0.1
9
1.2
9
0.1
9
1.0
95
9
5.1
9
4.8
9
4.4
9
4.2
9
4.7
9
4.4
9
5.6
9
6.3
9
5.5
97
9
7.6
9
6.4
9
5.5
9
6.6
9
7.2
9
6.1
9
7.0
9
8.5
9
7.0
99
9
8.9
9
9.1
9
8.9
9
8.7
9
9.3
9
8.9
9
8.8
9
9.1
9
9.1
192 Subscapular skinfold-for-age, girls

Ta
ble
73
Ob
serv
ed p
ro
po
rtio
ns
of
chil
dre
n w
ith
mea
surem
ents
bel
ow
th
e fi
tted
cen
tile
s fr
om
Mo
del
2, su
bsc
ap
ula
r sk
info
ld-f
or-
ag
e fo
r g
irls
(co
nt)
Ex
pec
ted
4
0 m
o
46
mo
5
2 m
o
58
mo
6
4 m
o
70
mo
O
ver
all
1
0.6
1
.1
1.4
1
.4
0.7
0
.3
0.9
3
3.2
2
.7
3.2
3
.1
2.4
2
.7
2.7
5
4.7
4
.9
4.7
4
.9
3.9
5
.5
4.8
10
7
.7
9.2
1
2.9
8
.8
8.7
1
1.6
1
0.0
25
2
2.8
2
5.2
2
8.0
2
4.8
2
4.5
2
7.4
2
5.6
50
4
6.6
5
0.7
5
2.1
5
1.1
4
8.2
4
6.2
4
9.6
75
7
3.0
7
3.7
7
7.4
7
4.9
7
4.8
7
5.0
7
4.8
90
8
7.0
8
8.6
9
0.5
8
8.1
8
9.3
9
0.1
8
9.6
95
9
2.6
9
4.9
9
5.7
9
4.0
9
4.9
9
4.2
9
4.8
97
9
6.6
9
7.1
9
7.3
9
5.7
9
6.1
9
6.2
9
6.9
99
9
9.8
9
9.3
9
8.9
9
8.8
9
8.1
9
9.7
9
9.0
No
te:
Gro
up l
abel
s co
rres
pond
to t
he
age
inte
rval
s in
Tab
le 7
1.
Subscapular skinfold-for-age, girls 193
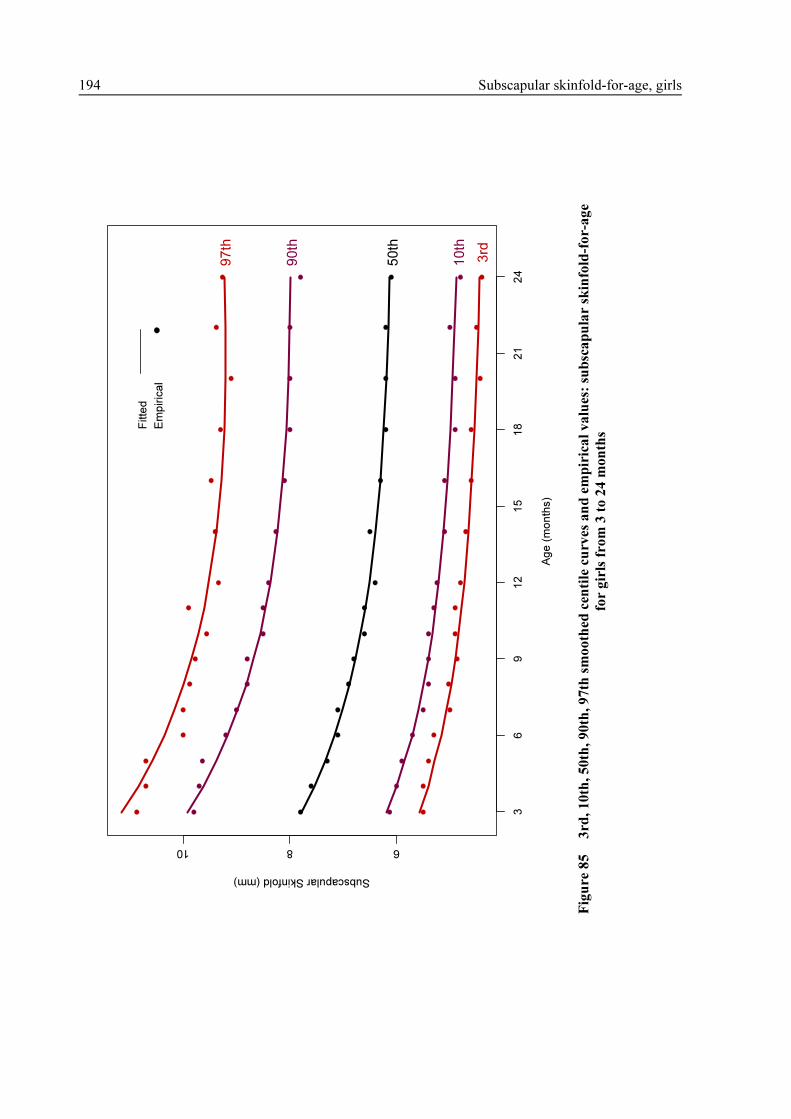
Ag
e (
mo
nth
s)
Subscapular Skinfold (mm)
6810
36
91
21
51
82
12
4
3rd
10th
50th
90th
97th
Fitte
d
Em
pir
ica
l
Fig
ure
85
3rd
, 1
0th
, 5
0th
, 9
0th
, 9
7th
sm
oo
thed
cen
tile
cu
rves
an
d e
mp
iric
al
va
lues
: su
bsc
ap
ula
r sk
info
ld-f
or-
ag
e
for
gir
ls f
rom
3 t
o 2
4 m
on
ths
194 Subscapular skinfold-for-age, girls

Ag
e (
mo
nth
s)
Subscapular Skinfold (mm)
6810
36
91
21
51
82
12
4
5th
25th
50th
75th
95th
Fitte
d
Em
pir
ica
l
Fig
ure
86
5th
, 2
5th
, 5
0th
, 7
5th
, 9
5th
sm
oo
thed
cen
tile
cu
rves
an
d e
mp
iric
al
va
lues
: su
bsc
ap
ula
r sk
info
ld-f
or-
ag
e
for
gir
ls f
rom
3 t
o 2
4 m
on
ths
Subscapular skinfold-for-age, girls 195

Age (
month
s)
Subscapular Skinfold (mm)
4681012
24
27
30
33
36
39
42
45
48
51
54
57
60
63
66
69
72
3rd
10th
50th
90th
97th
Fitte
d
Em
pir
ical
Fig
ure
87
3rd
, 1
0th
, 5
0th
, 9
0th
, 9
7th
sm
oo
thed
cen
tile
cu
rves
an
d e
mp
iric
al
va
lues
: su
bsc
ap
ula
r sk
info
ld-f
or-
ag
e
for
gir
ls f
rom
24
to
71 m
on
ths
196 Subscapular skinfold-for-age, girls
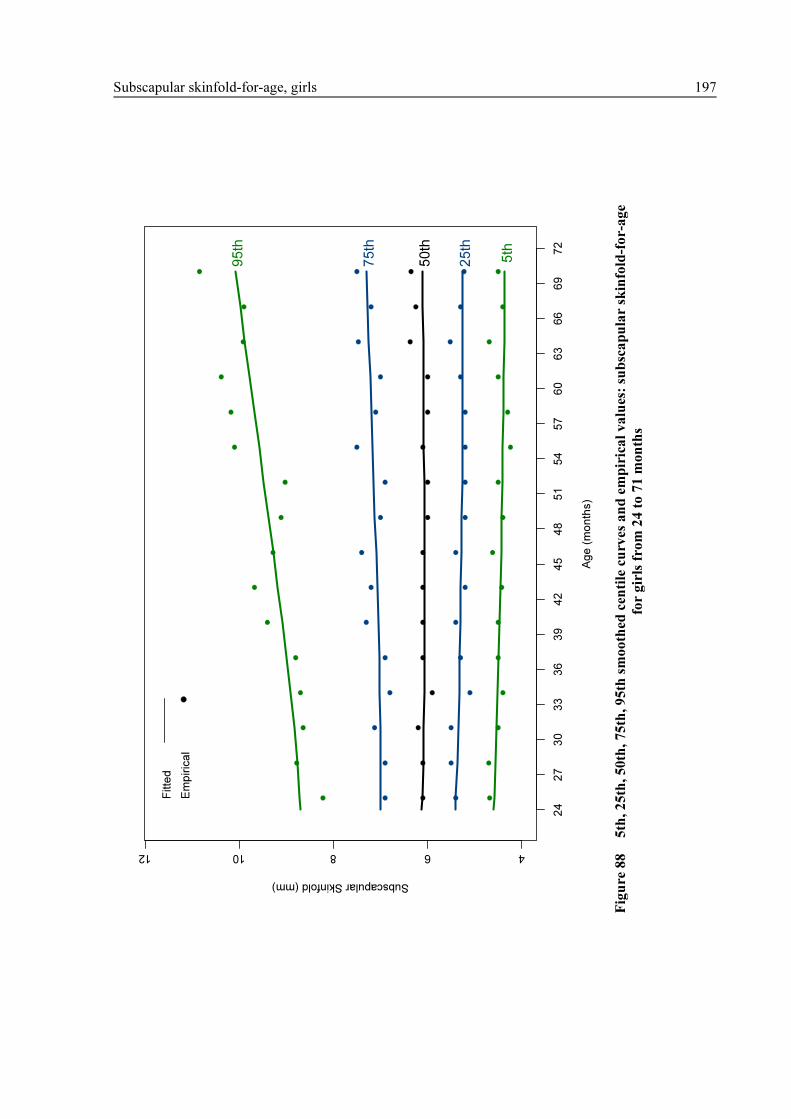
Ag
e (
mo
nth
s)
Subscapular Skinfold (mm)
4681012
24
27
30
33
36
39
42
45
48
51
54
57
60
63
66
69
72
5th
25th
50th
75th
95th
Fitte
d
Em
piric
al
Fig
ure
88
5th
, 2
5th
, 5
0th
, 7
5th
, 9
5th
sm
oo
thed
cen
tile
cu
rves
an
d e
mp
iric
al
va
lues
: su
bsc
ap
ula
r sk
info
ld-f
or-
ag
e
for
gir
ls f
rom
24
to
71 m
on
ths
Subscapular skinfold-for-age, girls 197

198 Subscapular skinfold-for-age, girls
6.2.3 WHO standards
This section presents the final WHO subscapular skinfold-for-age z-score and percentile charts
(Figures 89 and 90) and table (Table 74) for girls.

Ch
arts
Ag
e (
mo
nth
s)
Subscapular Skinfold (mm)
51015
24
68
12
16
20
24
28
32
36
40
44
48
52
56
60
123 0 -1 -2 -3
Fig
ure
89
WH
O s
ub
sca
pu
lar
skin
fold
-fo
r-a
ge
z-sc
ore
s fo
r g
irls
fro
m 3
to
60
mo
nth
s
Subscapular skinfold-for-age, girls 199

Ag
e (
mo
nth
s)
Subscapular Skinfold (mm)
46810
24
68
12
16
20
24
28
32
36
40
44
48
52
56
60
3rd
50
th
97
th
15
th
85
th
Fig
ure
90
WH
O s
ub
sca
pu
lar
skin
fold
-fo
r-a
ge
per
cen
tile
s fo
r g
irls
fro
m 3
to
60
mo
nth
s
200 Subscapular skinfold-for-age, girls

Ta
ble
s
Ta
ble
74
Su
bsc
ap
ula
r sk
info
ld-f
or-
ag
e fo
r g
irls
, a
ge
in y
ears
an
d m
on
ths
P
erce
nti
les
(su
bsc
ap
ula
r sk
info
ld i
n m
m)
Yea
r: M
on
th
Mon
th
L
M
S
1st
3
rd
5th
1
5th
2
5th
5
0th
7
5th
8
5th
9
5th
9
7th
9
9th
0:
3
3
-0.2
02
6
7.7
846
0
.1842
8
5.2
5
.6
5.8
6
.5
6.9
7
.8
8.8
9
.5
10.6
1
1.2
1
2.2
0:
4
4
-0.2
57
7
7.5
405
0
.1843
0
5.0
5
.4
5.6
6
.3
6.7
7
.5
8.6
9
.2
10.3
1
0.8
1
1.9
0:
5
5
-0.3
02
0
7.3
384
0
.1842
8
4.9
5
.3
5.5
6
.1
6.5
7
.3
8.3
8
.9
10.1
1
0.6
1
1.6
0:
6
6
-0.3
39
4
7.1
637
0
.1842
5
4.8
5
.2
5.4
6
.0
6.3
7
.2
8.1
8
.7
9.9
1
0.4
1
1.4
0:
7
7
-0.3
71
8
7.0
118
0
.1842
1
4.7
5
.1
5.3
5
.8
6.2
7
.0
8.0
8
.5
9.7
1
0.2
1
1.2
0:
8
8
-0.4
00
5
6.8
807
0
.1841
2
4.6
5
.0
5.2
5
.7
6.1
6
.9
7.8
8
.4
9.5
1
0.0
1
1.0
0:
9
9
-0.4
26
3
6.7
679
0
.1839
9
4.6
4
.9
5.1
5
.6
6.0
6
.8
7.7
8
.3
9.4
9
.8
10.9
0:1
0
10
-0
.449
8
6.6
707
0
.1838
7
4.5
4
.8
5.0
5
.6
5.9
6
.7
7.6
8
.1
9.2
9
.7
10.7
0:1
1
11
-0
.471
3
6.5
867
0
.1838
1
4.5
4
.8
5.0
5
.5
5.8
6
.6
7.5
8
.0
9.1
9
.6
10.6
1:
0
12
-0
.491
2
6.5
138
0
.1838
3
4.4
4
.7
4.9
5
.4
5.8
6
.5
7.4
8
.0
9.0
9
.5
10.5
1:
1
13
-0
.509
8
6.4
505
0
.1839
4
4.4
4
.7
4.9
5
.4
5.7
6
.5
7.3
7
.9
9.0
9
.4
10.5
1:
2
14
-0
.527
2
6.3
955
0
.1841
5
4.3
4
.7
4.8
5
.3
5.7
6
.4
7.3
7
.8
8.9
9
.4
10.4
1:
3
15
-0
.543
5
6.3
474
0
.1844
6
4.3
4
.6
4.8
5
.3
5.6
6
.3
7.2
7
.8
8.8
9
.3
10.3
1:
4
16
-0
.559
0
6.3
055
0
.1848
7
4.3
4
.6
4.8
5
.3
5.6
6
.3
7.2
7
.7
8.8
9
.3
10.3
1:
5
17
-0
.573
6
6.2
689
0
.1853
8
4.3
4
.6
4.7
5
.2
5.6
6
.3
7.1
7
.7
8.8
9
.2
10.3
1:
6
18
-0
.587
6
6.2
373
0
.1859
8
4.2
4
.5
4.7
5
.2
5.5
6
.2
7.1
7
.7
8.7
9
.2
10.3
1:
7
19
-0
.600
9
6.2
101
0
.1866
6
4.2
4
.5
4.7
5
.2
5.5
6
.2
7.1
7
.6
8.7
9
.2
10.3
1:
8
20
-0
.613
6
6.1
868
0
.1874
1
4.2
4
.5
4.7
5
.1
5.5
6
.2
7.1
7
.6
8.7
9
.2
10.3
1:
9
21
-0
.625
7
6.1
669
0
.1882
3
4.2
4
.5
4.6
5
.1
5.5
6
.2
7.0
7
.6
8.7
9
.2
10.3
1:1
0
22
-0
.637
4
6.1
500
0
.1891
1
4.2
4
.5
4.6
5
.1
5.4
6
.2
7.0
7
.6
8.7
9
.2
10.3
1:1
1
23
-0
.648
7
6.1
355
0
.1900
5
4.2
4
.4
4.6
5
.1
5.4
6
.1
7.0
7
.6
8.7
9
.2
10.3
2:
0
24
-0
.659
5
6.1
232
0
.1910
4
4.1
4
.4
4.6
5
.1
5.4
6
.1
7.0
7
.6
8.7
9
.2
10.4
Subscapular skinfold-for-age, girls 201

Ta
ble
74
Su
bsc
ap
ula
r sk
info
ld-f
or-
ag
e fo
r g
irls
, a
ge
in y
ears
an
d m
on
ths
(co
nti
nu
ed)
P
erce
nti
les
(su
bsc
ap
ula
r sk
info
ld i
n m
m)
Yea
r: M
on
th
Mon
th
L
M
S
1st
3
rd
5th
1
5th
2
5th
5
0th
7
5th
8
5th
9
5th
9
7th
9
9th
2:
1
25
-0
.670
0
6.1
129
0
.1920
7
4.1
4
.4
4.6
5
.1
5.4
6
.1
7.0
7
.6
8.7
9
.2
10.4
2:
2
26
-0
.680
1
6.1
041
0
.1931
5
4.1
4
.4
4.6
5
.1
5.4
6
.1
7.0
7
.6
8.7
9
.3
10.4
2:
3
27
-0
.689
9
6.0
968
0
.1942
6
4.1
4
.4
4.6
5
.0
5.4
6
.1
7.0
7
.6
8.7
9
.3
10.5
2:
4
28
-0
.699
4
6.0
905
0
.1954
0
4.1
4
.4
4.6
5
.0
5.4
6
.1
7.0
7
.6
8.8
9
.3
10.5
2:
5
29
-0
.708
6
6.0
851
0
.1965
7
4.1
4
.4
4.5
5
.0
5.4
6
.1
7.0
7
.6
8.8
9
.3
10.6
2:
6
30
-0
.717
5
6.0
806
0
.1977
6
4.1
4
.4
4.5
5
.0
5.4
6
.1
7.0
7
.6
8.8
9
.4
10.6
2:
7
31
-0
.726
2
6.0
766
0
.1989
8
4.1
4
.4
4.5
5
.0
5.3
6
.1
7.0
7
.6
8.8
9
.4
10.7
2:
8
32
-0
.734
7
6.0
733
0
.2002
1
4.1
4
.4
4.5
5
.0
5.3
6
.1
7.0
7
.6
8.9
9
.4
10.7
2:
9
33
-0
.742
9
6.0
705
0
.2014
5
4.1
4
.3
4.5
5
.0
5.3
6
.1
7.0
7
.6
8.9
9
.5
10.8
2:1
0
34
-0
.750
9
6.0
683
0
.2027
0
4.1
4
.3
4.5
5
.0
5.3
6
.1
7.0
7
.6
8.9
9
.5
10.9
2:1
1
35
-0
.758
7
6.0
665
0
.2039
5
4.0
4
.3
4.5
5
.0
5.3
6
.1
7.0
7
.6
8.9
9
.5
10.9
3:
0
36
-0
.766
4
6.0
652
0
.2052
1
4.0
4
.3
4.5
5
.0
5.3
6
.1
7.0
7
.7
9.0
9
.6
11.0
3:
1
37
-0
.773
8
6.0
643
0
.2064
7
4.0
4
.3
4.5
5
.0
5.3
6
.1
7.0
7
.7
9.0
9
.6
11.1
3:
2
38
-0
.781
1
6.0
637
0
.2077
3
4.0
4
.3
4.5
5
.0
5.3
6
.1
7.0
7
.7
9.0
9
.7
11.1
3:
3
39
-0
.788
2
6.0
633
0
.2089
9
4.0
4
.3
4.5
5
.0
5.3
6
.1
7.0
7
.7
9.1
9
.7
11.2
3:
4
40
-0
.795
2
6.0
632
0
.2102
4
4.0
4
.3
4.5
5
.0
5.3
6
.1
7.0
7
.7
9.1
9
.7
11.3
3:
5
41
-0
.802
0
6.0
632
0
.2114
9
4.0
4
.3
4.5
5
.0
5.3
6
.1
7.1
7
.7
9.1
9
.8
11.3
3:
6
42
-0
.808
7
6.0
634
0
.2127
3
4.0
4
.3
4.5
4
.9
5.3
6
.1
7.1
7
.7
9.1
9
.8
11.4
3:
7
43
-0
.815
2
6.0
637
0
.2139
6
4.0
4
.3
4.5
4
.9
5.3
6
.1
7.1
7
.7
9.2
9
.9
11.5
3:
8
44
-0
.821
7
6.0
641
0
.2151
8
4.0
4
.3
4.4
4
.9
5.3
6
.1
7.1
7
.8
9.2
9
.9
11.6
3:
9
45
-0
.828
0
6.0
647
0
.2163
8
4.0
4
.3
4.4
4
.9
5.3
6
.1
7.1
7
.8
9.2
1
0.0
1
1.6
3:1
0
46
-0
.834
1
6.0
653
0
.2175
8
4.0
4
.3
4.4
4
.9
5.3
6
.1
7.1
7
.8
9.3
1
0.0
1
1.7
3:1
1
47
-0
.840
2
6.0
661
0
.2187
6
4.0
4
.3
4.4
4
.9
5.3
6
.1
7.1
7
.8
9.3
1
0.0
1
1.8
4:
0
48
-0
.846
2
6.0
669
0
.2199
3
4.0
4
.3
4.4
4
.9
5.3
6
.1
7.1
7
.8
9.3
1
0.1
1
1.9
202 Subscapular skinfold-for-age, girls

Ta
ble
74
Su
bsc
ap
ula
r sk
info
ld-f
or-
ag
e fo
r g
irls
, a
ge
in y
ears
an
d m
on
ths
(co
nti
nu
ed)
P
erce
nti
les
(su
bsc
ap
ula
r sk
info
ld i
n m
m)
Yea
r: M
on
th
Mon
th
L
M
S
1st
3
rd
5th
1
5th
2
5th
5
0th
7
5th
8
5th
9
5th
9
7th
9
9th
4:
1
49
-0
.852
0
6.0
679
0
.2210
9
4.0
4
.3
4.4
4
.9
5.3
6
.1
7.1
7
.8
9.4
1
0.1
1
1.9
4:
2
50
-0
.857
8
6.0
690
0
.2222
3
4.0
4
.2
4.4
4
.9
5.3
6
.1
7.1
7
.8
9.4
1
0.2
1
2.0
4:
3
51
-0
.863
4
6.0
703
0
.2233
5
4.0
4
.2
4.4
4
.9
5.3
6
.1
7.1
7
.9
9.4
1
0.2
1
2.1
4:
4
52
-0
.869
0
6.0
717
0
.2244
7
3.9
4
.2
4.4
4
.9
5.3
6
.1
7.1
7
.9
9.5
1
0.3
1
2.2
4:
5
53
-0
.874
5
6.0
732
0
.2255
6
3.9
4
.2
4.4
4
.9
5.3
6
.1
7.2
7
.9
9.5
1
0.3
1
2.3
4:
6
54
-0
.879
9
6.0
748
0
.2266
4
3.9
4
.2
4.4
4
.9
5.3
6
.1
7.2
7
.9
9.5
1
0.4
1
2.3
4:
7
55
-0
.885
2
6.0
765
0
.2277
1
3.9
4
.2
4.4
4
.9
5.3
6
.1
7.2
7
.9
9.6
1
0.4
1
2.4
4:
8
56
-0
.890
4
6.0
784
0
.2287
6
3.9
4
.2
4.4
4
.9
5.3
6
.1
7.2
7
.9
9.6
1
0.5
1
2.5
4:
9
57
-0
.895
5
6.0
803
0
.2297
9
3.9
4
.2
4.4
4
.9
5.3
6
.1
7.2
7
.9
9.6
1
0.5
1
2.6
4:1
0
58
-0
.900
6
6.0
823
0
.2308
1
3.9
4
.2
4.4
4
.9
5.3
6
.1
7.2
8
.0
9.7
1
0.5
1
2.7
4:1
1
59
-0
.905
6
6.0
844
0
.2318
2
3.9
4
.2
4.4
4
.9
5.3
6
.1
7.2
8
.0
9.7
1
0.6
1
2.8
5:
0
60
-0
.910
5
6.0
865
0
.2328
0
3.9
4
.2
4.4
4
.9
5.3
6
.1
7.2
8
.0
9.7
1
0.6
1
2.8
Subscapular skinfold-for-age, girls 203

Ta
ble
74
Su
bsc
ap
ula
r sk
info
ld-f
or-
ag
e fo
r g
irls
, a
ge
in y
ears
an
d m
on
ths
(co
nti
nu
ed)
Z
-sco
res
(su
bsc
ap
ula
r sk
info
ld i
n m
m)
Yea
r: M
on
th
Mon
th
L
M
S
-3 S
D
-2 S
D
-1 S
D
Med
ian
1
SD
2
SD
3
SD
0:
3
3
-0.2
02
6
7.7
846
0
.1842
8
4.6
5
.5
6.5
7
.8
9.4
1
1.4
1
4.0
0:
4
4
-0.2
57
7
7.5
405
0
.1843
0
4.5
5
.3
6.3
7
.5
9.1
1
1.1
1
3.7
0:
5
5
-0.3
02
0
7.3
384
0
.1842
8
4.4
5
.2
6.1
7
.3
8.9
1
0.8
1
3.4
0:
6
6
-0.3
39
4
7.1
637
0
.1842
5
4.3
5
.1
6.0
7
.2
8.7
1
0.6
1
3.2
0:
7
7
-0.3
71
8
7.0
118
0
.1842
1
4.2
5
.0
5.9
7
.0
8.5
1
0.4
1
3.0
0:
8
8
-0.4
00
5
6.8
807
0
.1841
2
4.2
4
.9
5.8
6
.9
8.3
1
0.2
1
2.8
0:
9
9
-0.4
26
3
6.7
679
0
.1839
9
4.1
4
.8
5.7
6
.8
8.2
1
0.1
1
2.7
0:1
0
10
-0
.449
8
6.6
707
0
.1838
7
4.1
4
.7
5.6
6
.7
8.1
1
0.0
1
2.6
0:1
1
11
-0
.471
3
6.5
867
0
.1838
1
4.0
4
.7
5.5
6
.6
8.0
9
.9
12.5
1:
0
12
-0
.491
2
6.5
138
0
.1838
3
4.0
4
.6
5.5
6
.5
7.9
9
.8
12.4
1:
1
13
-0
.509
8
6.4
505
0
.1839
4
4.0
4
.6
5.4
6
.5
7.8
9
.7
12.3
1:
2
14
-0
.527
2
6.3
955
0
.1841
5
3.9
4
.6
5.4
6
.4
7.8
9
.6
12.3
1:
3
15
-0
.543
5
6.3
474
0
.1844
6
3.9
4
.5
5.3
6
.3
7.7
9
.6
12.3
1:
4
16
-0
.559
0
6.3
055
0
.1848
7
3.9
4
.5
5.3
6
.3
7.7
9
.5
12.2
1:
5
17
-0
.573
6
6.2
689
0
.1853
8
3.9
4
.5
5.3
6
.3
7.6
9
.5
12.2
1:
6
18
-0
.587
6
6.2
373
0
.1859
8
3.8
4
.5
5.2
6
.2
7.6
9
.5
12.3
1:
7
19
-0
.600
9
6.2
101
0
.1866
6
3.8
4
.4
5.2
6
.2
7.6
9
.5
12.3
1:
8
20
-0
.613
6
6.1
868
0
.1874
1
3.8
4
.4
5.2
6
.2
7.5
9
.5
12.3
1:
9
21
-0
.625
7
6.1
669
0
.1882
3
3.8
4
.4
5.2
6
.2
7.5
9
.5
12.4
1:1
0
22
-0
.637
4
6.1
500
0
.1891
1
3.8
4
.4
5.1
6
.2
7.5
9
.5
12.4
1:1
1
23
-0
.648
7
6.1
355
0
.1900
5
3.8
4
.4
5.1
6
.1
7.5
9
.5
12.5
2:
0
24
-0
.659
5
6.1
232
0
.1910
4
3.8
4
.4
5.1
6
.1
7.5
9
.5
12.6
204 Subscapular skinfold-for-age, girls
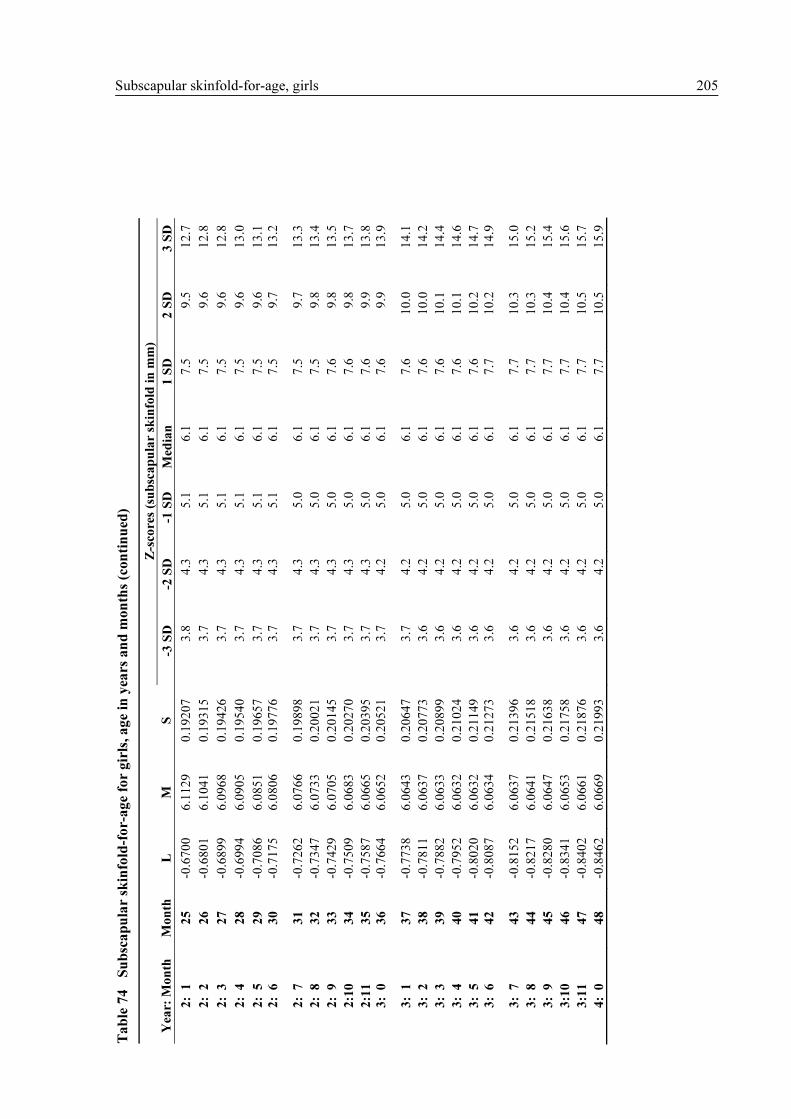
Ta
ble
74
Su
bsc
ap
ula
r sk
info
ld-f
or-
ag
e fo
r g
irls
, a
ge
in y
ears
an
d m
on
ths
(co
nti
nu
ed)
Z
-sco
res
(su
bsc
ap
ula
r sk
info
ld i
n m
m)
Yea
r: M
on
th
Mon
th
L
M
S
-3 S
D
-2 S
D
-1 S
D
Med
ian
1
SD
2
SD
3
SD
2:
1
25
-0
.670
0
6.1
129
0
.1920
7
3.8
4
.3
5.1
6
.1
7.5
9
.5
12.7
2:
2
26
-0
.680
1
6.1
041
0
.1931
5
3.7
4
.3
5.1
6
.1
7.5
9
.6
12.8
2:
3
27
-0
.689
9
6.0
968
0
.1942
6
3.7
4
.3
5.1
6
.1
7.5
9
.6
12.8
2:
4
28
-0
.699
4
6.0
905
0
.1954
0
3.7
4
.3
5.1
6
.1
7.5
9
.6
13.0
2:
5
29
-0
.708
6
6.0
851
0
.1965
7
3.7
4
.3
5.1
6
.1
7.5
9
.6
13.1
2:
6
30
-0
.717
5
6.0
806
0
.1977
6
3.7
4
.3
5.1
6
.1
7.5
9
.7
13.2
2:
7
31
-0
.726
2
6.0
766
0
.1989
8
3.7
4
.3
5.0
6
.1
7.5
9
.7
13.3
2:
8
32
-0
.734
7
6.0
733
0
.2002
1
3.7
4
.3
5.0
6
.1
7.5
9
.8
13.4
2:
9
33
-0
.742
9
6.0
705
0
.2014
5
3.7
4
.3
5.0
6
.1
7.6
9
.8
13.5
2:1
0
34
-0
.750
9
6.0
683
0
.2027
0
3.7
4
.3
5.0
6
.1
7.6
9
.8
13.7
2:1
1
35
-0
.758
7
6.0
665
0
.2039
5
3.7
4
.3
5.0
6
.1
7.6
9
.9
13.8
3:
0
36
-0
.766
4
6.0
652
0
.2052
1
3.7
4
.2
5.0
6
.1
7.6
9
.9
13.9
3:
1
37
-0
.773
8
6.0
643
0
.2064
7
3.7
4
.2
5.0
6
.1
7.6
1
0.0
1
4.1
3:
2
38
-0
.781
1
6.0
637
0
.2077
3
3.6
4
.2
5.0
6
.1
7.6
1
0.0
1
4.2
3:
3
39
-0
.788
2
6.0
633
0
.2089
9
3.6
4
.2
5.0
6
.1
7.6
1
0.1
1
4.4
3:
4
40
-0
.795
2
6.0
632
0
.2102
4
3.6
4
.2
5.0
6
.1
7.6
1
0.1
1
4.6
3:
5
41
-0
.802
0
6.0
632
0
.2114
9
3.6
4
.2
5.0
6
.1
7.6
1
0.2
1
4.7
3:
6
42
-0
.808
7
6.0
634
0
.2127
3
3.6
4
.2
5.0
6
.1
7.7
1
0.2
1
4.9
3:
7
43
-0
.815
2
6.0
637
0
.2139
6
3.6
4
.2
5.0
6
.1
7.7
1
0.3
1
5.0
3:
8
44
-0
.821
7
6.0
641
0
.2151
8
3.6
4
.2
5.0
6
.1
7.7
1
0.3
1
5.2
3:
9
45
-0
.828
0
6.0
647
0
.2163
8
3.6
4
.2
5.0
6
.1
7.7
1
0.4
1
5.4
3:1
0
46
-0
.834
1
6.0
653
0
.2175
8
3.6
4
.2
5.0
6
.1
7.7
1
0.4
1
5.6
3:1
1
47
-0
.840
2
6.0
661
0
.2187
6
3.6
4
.2
5.0
6
.1
7.7
1
0.5
1
5.7
4:
0
48
-0
.846
2
6.0
669
0
.2199
3
3.6
4
.2
5.0
6
.1
7.7
1
0.5
1
5.9
Subscapular skinfold-for-age, girls 205

Ta
ble
74
Su
bsc
ap
ula
r sk
info
ld-f
or-
ag
e fo
r g
irls
, a
ge
in y
ears
an
d m
on
ths
(co
nti
nu
ed)
Z
-sco
res
(su
bsc
ap
ula
r sk
info
ld i
n m
m)
Yea
r: M
on
th
Mon
th
L
M
S
-3 S
D
-2 S
D
-1 S
D
Med
ian
1
SD
2
SD
3
SD
4:
1
49
-0
.852
0
6.0
679
0
.2210
9
3.6
4
.2
5.0
6
.1
7.8
1
0.6
1
6.1
4:
2
50
-0
.857
8
6.0
690
0
.2222
3
3.6
4
.2
5.0
6
.1
7.8
1
0.6
1
6.3
4:
3
51
-0
.863
4
6.0
703
0
.2233
5
3.6
4
.2
4.9
6
.1
7.8
1
0.7
1
6.5
4:
4
52
-0
.869
0
6.0
717
0
.2244
7
3.6
4
.2
4.9
6
.1
7.8
1
0.7
1
6.7
4:
5
53
-0
.874
5
6.0
732
0
.2255
6
3.6
4
.2
4.9
6
.1
7.8
1
0.8
1
6.9
4:
6
54
-0
.879
9
6.0
748
0
.2266
4
3.6
4
.1
4.9
6
.1
7.8
1
0.8
1
7.1
4:
7
55
-0
.885
2
6.0
765
0
.2277
1
3.6
4
.1
4.9
6
.1
7.8
1
0.9
1
7.3
4:
8
56
-0
.890
4
6.0
784
0
.2287
6
3.6
4
.1
4.9
6
.1
7.9
1
0.9
1
7.6
4:
9
57
-0
.895
5
6.0
803
0
.2297
9
3.6
4
.1
4.9
6
.1
7.9
1
1.0
1
7.8
4:1
0
58
-0
.900
6
6.0
823
0
.2308
1
3.6
4
.1
4.9
6
.1
7.9
1
1.0
1
8.0
4:1
1
59
-0
.905
6
6.0
844
0
.2318
2
3.5
4
.1
4.9
6
.1
7.9
1
1.1
1
8.2
5:
0
60
-0
.910
5
6.0
865
0
.2328
0
3.5
4
.1
4.9
6
.1
7.9
1
1.2
1
8.5
206 Subscapular skinfold-for-age, girls

Subscapular skinfold-for-age, boys & girls 207
6.4 Comparisons between boys and girls
This section presents the subscapular skinfold-for-age z-score comparisons between boys and girls for the WHO standards (Figure 91).
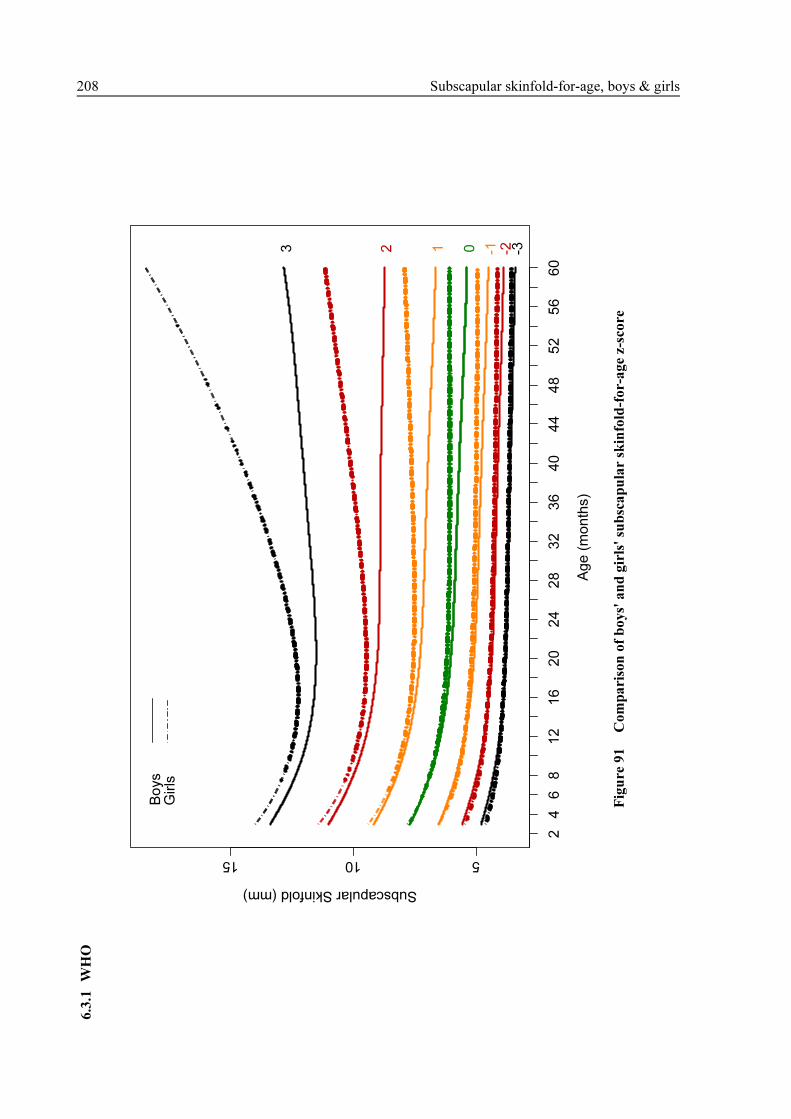
6.3
.1
WH
O
Ag
e (
mo
nth
s)
Subscapular Skinfold (mm)
51015
24
68
12
16
20
24
28
32
36
40
44
48
52
56
60
0 -1 -2 -3123
Bo
ys
Gir
ls
Fig
ure
91
Co
mp
ari
son
of
bo
ys'
an
d g
irls
' su
bsc
ap
ula
r sk
info
ld-f
or-
ag
e z-
sco
re
208 Subscapular skinfold-for-age, boys & girls

- 209 -
7. COMPUTATION OF CENTILES AND Z-SCORES FOR HEAD CIRCUMFE-
RENCE-FOR-AGE, ARM CIRCUMFERENCE-FOR-AGE, TRICEPS SKIN-
FOLD-FOR-AGE, SUBSCAPULAR SKINFOLD-FOR-AGE
The method used to construct the standards based on head circumference, arm circumference, skinfold
thicknesses and age, generally relied on GAMLSS with the Box-Cox power exponential distribution
(Rigby and Stasinopoulos, 2004). However, the final selected models simplified to the LMS model
(Cole and Green, 1992) since none of the standards required adjustment for kurtosis. As a result, the
computation of percentiles and z-scores for these standards uses formulae based on the LMS method.
However, a restriction was imposed on all indicators to enable the derivation of percentiles only within
the interval corresponding to z-scores between -3 and 3. The underlying reasoning is that percentiles
beyond ±3 SD are invariant to changes in equivalent z-scores. The loss accruing to this restriction is
small since the inclusion range corresponds to the 0.135th to 99.865th percentiles.
For all indicators, the tabulated fitted values of Box-Cox power, median and coefficient of variation
corresponding to age t are denoted by L(t), M(t) and S(t), respectively.
Centiles and z-scores for head circumference-for-age
For this indicator, L(t) is equal to 1, simplifying the Box-Cox normal distribution used in the LMS
method (Cole and Green, 1992) to the normal distribution. Therefore, differences between adjacent
standard deviations (e.g. between 2 SD and 3 SD) were constant for a specific age but varied at
different ages.
In this case, the centiles at age t can be estimated from:
[ ] [ ]
33,)()(
)(1)()()(1)()( )(1
100
≤≤−+=
+=+=
αα
ααα
ZZtStDevtM
ZtStMZtStLtMtC tL
where Zα is the normal equivalent deviate for tail area α, ( )tCα100 is the 100α-th centile, and
StDev(t) is the standard deviation at age t (derived from multiplying S(t) by M(t)).
The z-score for a measurement y at age t is computed as:
=indz
)()(
1)(
)(
tLtS
tMy
tL
−⎥⎦⎤
⎢⎣⎡
)(
)(
tStDev
tMy −=
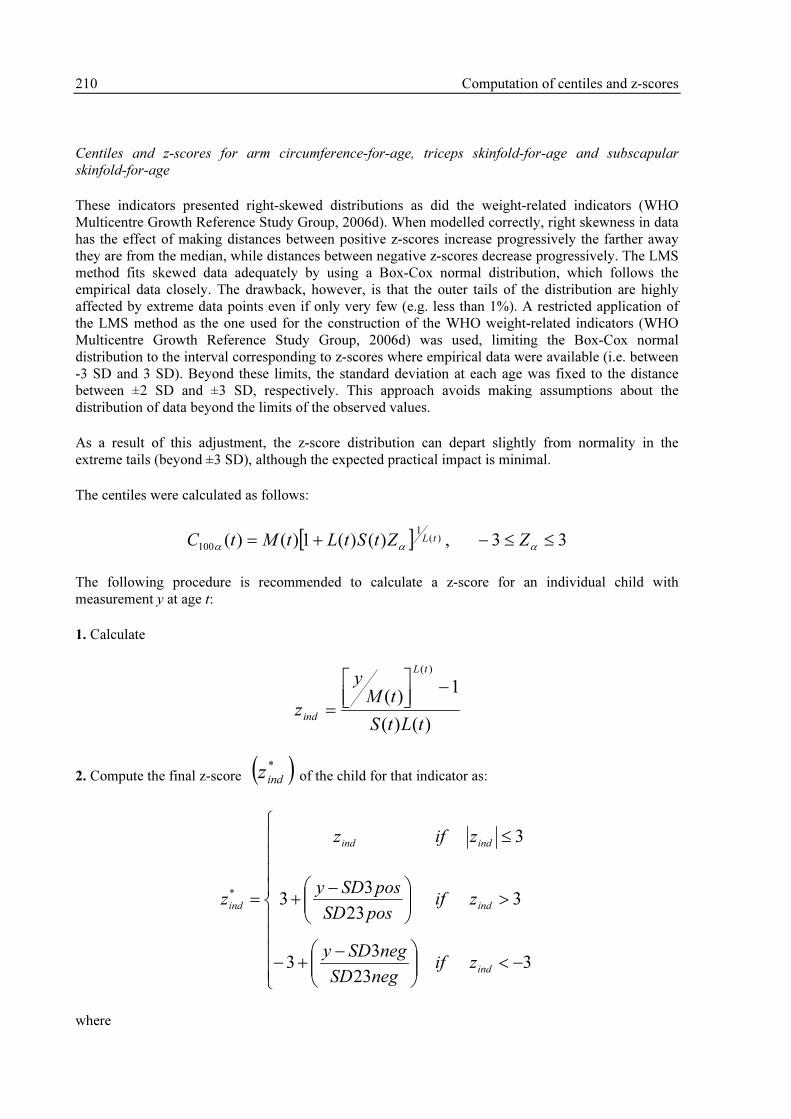
210 Computation of centiles and z-scores
Centiles and z-scores for arm circumference-for-age, triceps skinfold-for-age and subscapular
skinfold-for-age
These indicators presented right-skewed distributions as did the weight-related indicators (WHO
Multicentre Growth Reference Study Group, 2006d). When modelled correctly, right skewness in data
has the effect of making distances between positive z-scores increase progressively the farther away
they are from the median, while distances between negative z-scores decrease progressively. The LMS
method fits skewed data adequately by using a Box-Cox normal distribution, which follows the
empirical data closely. The drawback, however, is that the outer tails of the distribution are highly
affected by extreme data points even if only very few (e.g. less than 1%). A restricted application of
the LMS method as the one used for the construction of the WHO weight-related indicators (WHO
Multicentre Growth Reference Study Group, 2006d) was used, limiting the Box-Cox normal
distribution to the interval corresponding to z-scores where empirical data were available (i.e. between
-3 SD and 3 SD). Beyond these limits, the standard deviation at each age was fixed to the distance
between ±2 SD and ±3 SD, respectively. This approach avoids making assumptions about the
distribution of data beyond the limits of the observed values.
As a result of this adjustment, the z-score distribution can depart slightly from normality in the
extreme tails (beyond ±3 SD), although the expected practical impact is minimal.
The centiles were calculated as follows:
[ ] 33,)()(1)()( )(1
100 ≤≤−+=ααα
ZZtStLtMtC tL
The following procedure is recommended to calculate a z-score for an individual child with
measurement y at age t:
1. Calculate
)()(
1)(
)(
tLtS
tMy
z
tL
ind
−⎥⎦⎤
⎢⎣⎡
=
2. Compute the final z-score ( )*
indz of the child for that indicator as:
⎪⎪⎪⎪
⎩
⎪⎪⎪⎪
⎨
⎧
−<⎟⎟⎠
⎞⎜⎜⎝
⎛ −+−
>⎟⎟⎠
⎞⎜⎜⎝
⎛ −+
≤
=
323
33
323
33
3
*
ind
ind
indind
ind
zifnegSD
negSDy
zifposSD
posSDy
zifz
z
where

Computation of centiles and z-scores 211
posSD3 is the cut-off 3 SD calculated at t by the LMS method:
[ ] )(1
)3(*)(*)(1)(3 tLtStLtMposSD += ;
negSD3 is the cut-off -3 SD calculated at t by the LMS method:
[ ] )(1
)3(*)(*)(1)(3 tLtStLtMnegSD −+= ;
posSD23 is the difference between the cut-offs 3 SD and 2 SD calculated at t by the LMS method:
[ ] [ ] )(1
)(1
)2(*)(*)(1)()3(*)(*)(1)(23 tLtL tStLtMtStLtMposSD +−+= ;
and negSD23 is the difference between the cut-offs -2 SD and -3 SD calculated at t by the LMS
method:
[ ] [ ] )(1
)(1
)3(*)(*)(1)()2(*)(*)(1)(23 tLtL tStLtMtStLtMnegSD −+−−+=
To illustrate the procedure, an example with arm circumference-for-age for boys is provided below
and displayed in Figure 92.
Age (months)
Arm
Cir
cu
mfe
ren
ce
(cm
)
12
14
16
18
20
22
2 4 6 8 12 16 20 24 28 32 36 40 44 48 52 56 60
1
2
3
0
-1
-2
-3
x Child 1
x Child 2
x Child 3
Age (months)
Arm
Cir
cu
mfe
ren
ce
(cm
)
12
14
16
18
20
22
2 4 6 8 12 16 20 24 28 32 36 40 44 48 52 56 60
1
2
3
0
-1
-2
-3
x Child 1
x Child 2
x Child 3
Figure 92 Examples of children ranked according to the WHO arm circumference-for-age
standards
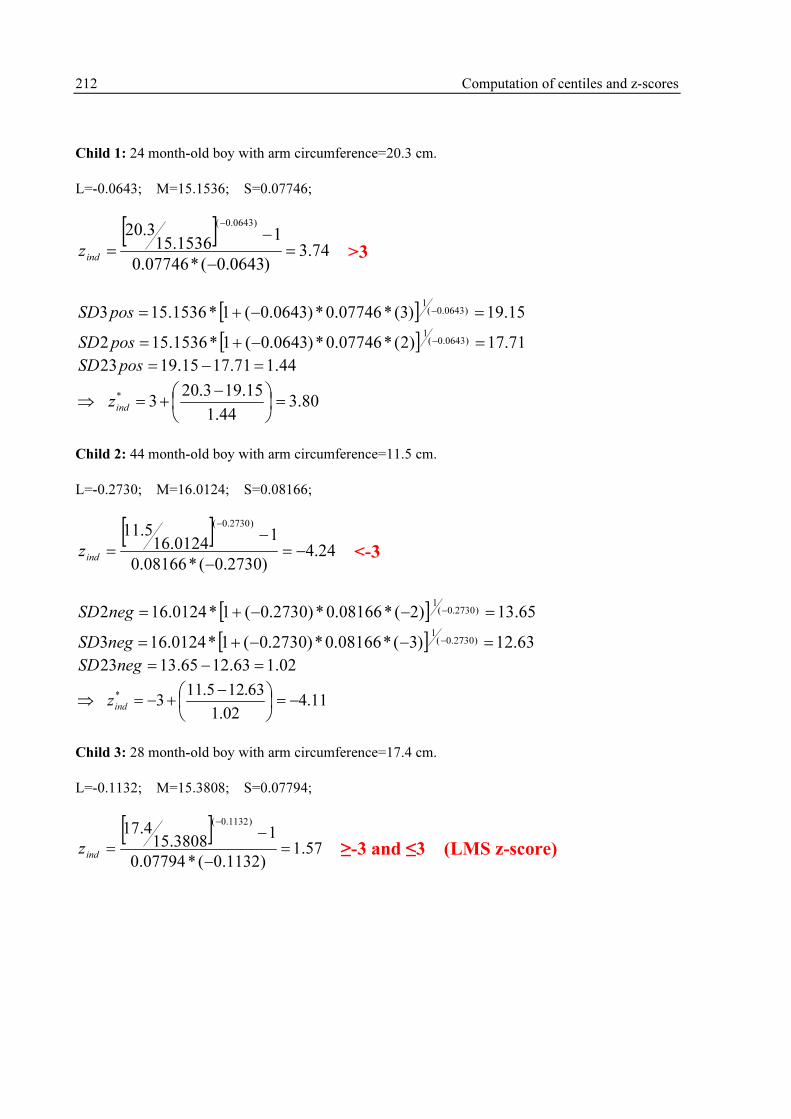
212 Computation of centiles and z-scores
Child 1: 24 month-old boy with arm circumference=20.3 cm.
L=-0.0643; M=15.1536; S=0.07746;
[ ]74.3
)0643.0(*07746.0
11536.15
3.20)0643.0(
=
−
−
=
−
indz
>3
[ ] 15.19)3(*07746.0*)0643.0(1*1536.153 )0643.0(1
=−+= −posSD
[ ] 71.17)2(*07746.0*)0643.0(1*1536.152 )0643.0(1
=−+= −posSD
44.171.1715.1923 =−=posSD
80.344.1
15.193.203
* =⎟⎠
⎞⎜⎝
⎛ −+=⇒
indz
Child 2: 44 month-old boy with arm circumference=11.5 cm.
L=-0.2730; M=16.0124; S=0.08166;
[ ]24.4
)2730.0(*08166.0
10124.16
5.11)2730.0(
−=
−
−
=
−
indz
<-3
[ ] 65.13)2(*08166.0*)2730.0(1*0124.162 )2730.0(1
=−−+= −negSD
[ ] 63.12)3(*08166.0*)2730.0(1*0124.163 )2730.0(1
=−−+= −negSD
02.163.1265.1323 =−=negSD
11.402.1
63.125.113
* −=⎟⎠
⎞⎜⎝
⎛ −+−=⇒
indz
Child 3: 28 month-old boy with arm circumference=17.4 cm.
L=-0.1132; M=15.3808; S=0.07794;
[ ]57.1
)1132.0(*07794.0
13808.15
4.17)1132.0(
=
−
−
=
−
indz
≥-3 and ≤3 (LMS z-score)
- 213 -
8. CONCLUSION
The goal of the MGRS was to describe the growth of healthy children. Well-defined criteria were applied in the study design to achieve this aim (de Onis et al., 2004b). The sample used for the construction of the growth standards for the head and arm circumferences and the skinfold thicknesses was the same one used for the construction of the standards based on length or height, weight and age (WHO Multicentre Growth Reference Study Group, 2006d, 2006g).
The construction of the child growth curves followed a careful, methodical process. Rigorous methods of data collection, standardized across sites, were followed during the entire study. Sound procedures for data management and cleaning were applied (Onyango et al., 2004). As a result, the anthropometric data available for analysis were of the highest possible quality. The selection of the best statistical approach to construct the standards followed a broad consultative process that included a thorough review of 30 available methods. State-of-the-art statistical methodologies were then employed to generate the standards (Borghi et al., 2006).
The Box-Cox-power-exponential (BCPE) method (Rigby and Stasinopoulos, 2004), with curve smoothing by cubic splines, was selected as the approach for constructing the growth curves. The BCPE accommodates various kinds of distributions, from normal to skewed or kurtotic, as necessary. There was wide variability in the degrees of freedom required for the cubic splines to achieve the best models. Except for head circumference-for-age, which followed a normal distribution, all other standards required the modelling of skewness but not kurtosis. A set of diagnostic tools was used to detect possible biases in estimated percentile or z-score curves. These included examining patterns of differences between empirical and fitted centiles, and comparing observed and expected proportions of children with measurements below selected percentile curves. Percentile and z-score curves for boys and girls were generated for head circumference-for-age (0–60 months), arm circumference-for-age (3–60 months), triceps skinfold-for-age and subscapular skinfold-for-age (3–60 months). Appendix A summarizes the specifications of the BCPE models for each of the standards.
Overall, concordance between smoothed curves and empirical centiles was free of bias in both the median range and the tails, indicating that the resulting curves are an adequate description of the true growth of healthy children. The average absolute difference between smoothed and empirical centiles was 0.091 cm for boys' and girls' head circumference-for-age (Figures 5-8 and 15-18); 0.102 cm and 0.098 cm for boys' and girls' arm circumference-for-age, respectively (Figures 27-30 and 38-41); 0.152 mm and 0.146 mm for boys' and girls' triceps skinfold-for-age, respectively (Figures 50-53 and 61-64); and 0.101 mm and 0.136 mm for boys' and girls' subscapular skinfold-for-age, respectively (Figures 73-76 and 85-88). Taking the sign into account, the average differences are close to zero: 0.031 cm and 0.022 cm for boys' and girls' head circumference-for-age, respectively; 0.004 cm and -0.003 cm for boys' and girls' arm circumference-for-age, respectively; 0.024 mm and 0.028 mm for boys' and girls' triceps skinfold-for-age, respectively; and 0.018 mm and 0.024 mm for boys' and girls' subscapular skinfold-for-age, respectively. These results indicate lack of bias in the fit between smoothed and empirical percentiles.
As was done for the construction of the first set of standards (WHO Multicentre Growth Reference Study Group, 2006d), a restricted application of the LMS method was used for the construction of the indicators arm circumference-for-age and skinfold thicknesses, limiting the Box-Cox normal distribution to the interval corresponding to z-scores where empirical data were available (i.e. between -3 SD and 3 SD). Beyond these limits, the standard deviation was fixed to the distance between ±2 SD and ±3 SD, respectively. This approach avoids making assumptions about the distribution of the data beyond the limits of the actual data (e.g. the 3 SD corresponds to the 99.9th percentile).
214 Conclusion
All four indicators presented in this report are a new addition to the previously available set of
indicators in the NCHS/WHO reference. Head circumference-for-age is often used in clinical settings
as part of health screening for potential developmental or neurological disabilities in infants and young
children (WHO, 1995). Very small and very large circumferences are both indicative of health or
developmental risk. Arm circumference-for-age is used as an alternative indicator of nutritional status
when the collection of length/height and weight measurements is difficult, as happens in emergency
humanitarian situations due to famine or refugee crises (WHO, 1995). Triceps and subscapular
skinfold measurements assess the thickness of subcutaneous tissue and reflect fatness primarily. The
skinfold indicators are thus a useful addition to the battery of growth standards for assessing childhood
obesity.
The WHO Child Growth Standards provide a technically robust set of tool for assessing the well-being
of infants and young children. They were derived from children who were raised in environments that
minimized constraints to growth such as poor diets and infection. In addition, their mothers followed
healthy practices such as breastfeeding their children and not smoking during and after pregnancy. The
standards depict normal early childhood growth under optimal environmental conditions and can be
used to assess children everywhere, regardless of ethnicity, socioeconomic status and type of feeding.
Together, three new elements — a prescriptive approach that moves beyond the development of
growth references towards a standard, inclusion of children from around the world, and links between
physical growth and motor development — provide a solid instrument for helping to assess the health
and nutritional needs of the world’s children.

- 215 -
9. BIBLIOGRAPHY
Bhandari N, Bahl R, Taneja S, de Onis M, Bhan MK (2002). Growth performance of affluent Indian
children is similar to that in developed countries. Bulletin of the World Health Organization,
80:189–195.
Borghi E, de Onis M, Garza C, Van den Broeck J, Frongillo EA, Grummer-Strawn L, van Buuren S,
Pan H, Molinari L, Martorell R, Onyango AW, Martines JC for the WHO Multicentre Growth
Reference Study Group (2006). Construction of the World Health Organization child growth standards:
selection of methods for attained growth curves. Statistics in Medicine, 25:247–265.
Cole TJ, Green PJ (1992). Smoothing reference centile curves: the LMS method and penalized
likelihood. Statistics in Medicine, 11:1305–1319.
de Onis M, Habicht JP (1996). Anthropometric reference data for international use: recommendations
from a World Health Organization Expert Committee. American Journal of Clinical Nutrition,
64:650–658.
de Onis M, Yip R (1996). The WHO growth chart: historical considerations and current scientific
issues. Bibliotheca Nutritio et Dieta, 53:74–89.
de Onis M, Garza C, Victora CG, Bhan MK, Norum KR, eds (2004a). WHO Multicentre Growth
Reference Study (MGRS): Rationale, planning and implementation. Food and Nutrition Bulletin,
25(Suppl 1):S1–S89.
de Onis M, Garza C, Victora CG, Onyango AW, Frongillo EA, Martines J, for the WHO Multicentre
Growth Reference Study Group (2004b). The WHO Multicentre Growth Reference Study: planning,
study design and methodology. Food and Nutrition Bulletin, 25(Suppl 1):S15–S26.
de Onis M, Onyango AW, Van den Broeck J, Chumlea WC, Martorell R, for the WHO Multicentre
Growth Reference Study Group (2004c). Measurement and standardization protocols for
anthropometry used in the construction of a new international growth reference. Food and Nutrition
Bulletin, 25(Suppl 1):S27–S36.
Garza C, de Onis M, for the WHO Multicentre Growth Reference Study Group (2004). Rationale for
developing a new international growth reference. Food and Nutrition Bulletin, 25(Suppl 1):S5–S14.
Mohamed AJ, Onyango AW, de Onis M, Prakash N, Mabry RM, Alasfoor DH (2004). Socioeconomic
predictors of unconstrained child growth in Muscat, Oman. Eastern Mediterranean Health Journal,
10:295–302.
Onyango AW, Pinol AJ, de Onis M, for the WHO Multicentre Growth Reference Study Group (2004).
Managing data for a multicountry longitudinal study: Experience from the WHO Multicentre Growth
Reference Study. Food and Nutrition Bulletin, 25 Suppl 1:S46–S52.
Owusu WB, Lartey A, de Onis M, Onyango AW, Frongillo EA (2004). Factors associated with
unconstrained growth among affluent Ghanaian children. Acta Paediatrica, 93:1115–1119.
Rigby RA, Stasinopoulos DM (2004). Smooth centile curves for skew and kurtotic data modelled
using the Box-Cox power exponential distribution. Statistics in Medicine, 23:3053–3076.
Royston P, Wright EM (2000). Goodness-of-fit statistics for age-specific reference intervals. Statistics
in Medicine, 19:2943–2962.

216 Bibliography
Stasinopoulos DM, Rigby RA, Akantziliotou C (2004). Instructions on how to use the GAMLSS
package in R. Technical Report 02/04. London: STORM Research Centre, London Metropolitan
University.
van Buuren S, Fredriks M (2001). Worm plot. A simple diagnostic device for modelling growth
reference curves. Statistics in Medicine, 20:1259–1277.
WHO. Physical status: the use and interpretation of anthropometry (1995). Report of a WHO Expert
Committee. World Health Organ Tech Rep Ser; 854:161–262.
WHO Multicentre Growth Reference Study Group (2006a). Assessment of differences in linear
growth among populations in the WHO Multicentre Growth Reference Study. Acta Paediatric, Suppl
450:56–65.
WHO Multicentre Growth Reference Study Group (2006b). Breastfeeding in the WHO Multicentre
Growth Reference Study. Acta Paediatrica, Suppl 450:16–26.
WHO Multicentre Growth Reference Study Group (2006c). WHO Motor Development Study:
Windows of achievement for six gross motor development milestones. Acta Paediatrica, Suppl
450:86–95.
WHO Multicentre Growth Reference Study Group (2006d). WHO Child Growth Standards:
Length/height-for-age, weight-for-age, weight-for-length, weight-for-height and body mass index-for-
age: Methods and development. Geneva: World Health Organization; pp 312.
WHO Multicentre Growth Reference Study Group (2006e). Enrolment and baseline characteristics in
the WHO Multicentre Growth Reference Study. Acta Paediatrica, Suppl 450:7–15.
WHO Multicentre Growth Reference Study Group (2006f). Reliability of anthropometric
measurements in the WHO Multicentre Growth Reference Study. Acta Paediatrica, Suppl 450:38–46.
WHO Multicentre Growth Reference Study Group (2006g). WHO Child Growth Standards based on
length/height, weight and age. Acta Paediatrica, Suppl 450:76–85.
WHO Working Group on Infant Growth (1994). An evaluation of infant growth. Geneva: World
Health Organization.
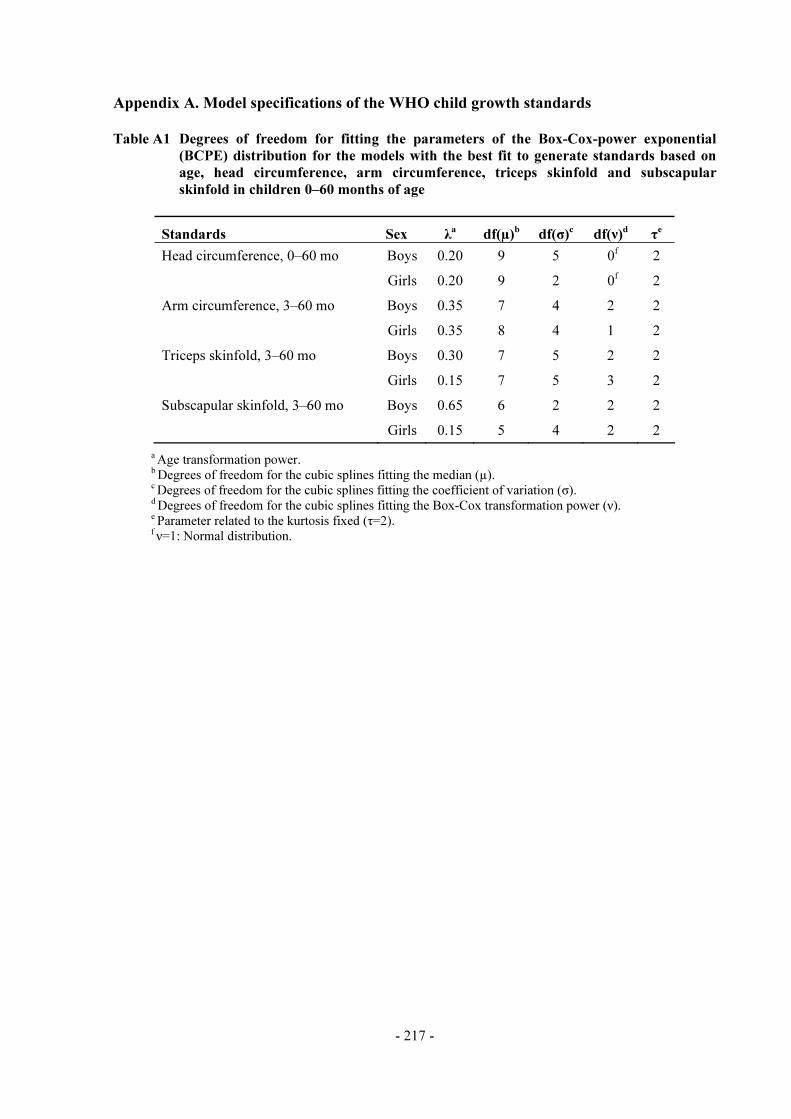
- 217 -
Appendix A. Model specifications of the WHO child growth standards
Table A1 Degrees of freedom for fitting the parameters of the Box-Cox-power exponential
(BCPE) distribution for the models with the best fit to generate standards based on
age, head circumference, arm circumference, triceps skinfold and subscapular
skinfold in children 0–60 months of age
Standards Sex λa
df(µ)b
df(σ)c
df(ν)d
τe
Head circumference, 0–60 mo Boys 0.20 9 5 0f
2
Girls 0.20 9 2 0f
2
Arm circumference, 3–60 mo Boys 0.35 7 4 2 2
Girls 0.35 8 4 1 2
Triceps skinfold, 3–60 mo Boys 0.30 7 5 2 2
Girls 0.15 7 5 3 2
Subscapular skinfold, 3–60 mo Boys 0.65 6 2 2 2
Girls 0.15 5 4 2 2
a Age transformation power. b Degrees of freedom for the cubic splines fitting the median (µ). c Degrees of freedom for the cubic splines fitting the coefficient of variation (σ). d Degrees of freedom for the cubic splines fitting the Box-Cox transformation power (ν). e Parameter related to the kurtosis fixed (τ=2). f ν=1: Normal distribution.


