
Who should be Running Ahead? The Roles of Two Types of Entrepreneurship in China’s Contemporary Economy
Ying Zhang André van Stel
Working Paper 16-086

Working Paper 16-086
Copyright © 2016 by Ying Zhang and André van Stel
Working papers are in draft form. This working paper is distributed for purposes of comment and discussion only. It may not be reproduced without permission of the copyright holder. Copies of working papers are available from the author.
Who should be Running Ahead? The Roles of Two Types of Entrepreneurship in China’s Contemporary Economy
Ying Zhang Harvard Business School
André van Stel Trinity Business School

1
Who should be Running Ahead?
The Roles of Two Types of Entrepreneurship in China’s
Contemporary Economy By YING ZHANG AND ANDRÉ VAN STEL
One of the most important transitions of China from a centrally planned
economy to a market-based economy was the emergence of entrepreneurship in
two different forms of private enterprise, viz. getihu and siyingqiye. Using a
unique database for 31 Chinese regions over the period 1997-2009, we
investigate the economic antecedents of regional rates of getihu and siyingqiye,
and find that the antecedents of these rates are substantially different. We also
investigate the mutual interactions between getihu and siyingqiye at the
regional level. Our analysis suggests that both types of entrepreneurship play
important but distinct roles in stimulating China’s economic development. Contact: Zhang: Rotterdam School of Management, Erasmus University Rotterdam, the Netherlands (email: [email protected]); Van Stel: Trinity Business School, Trinity College Dublin, Ireland (email: [email protected]) & Kozminski University, Warsaw, Poland.
INTRODUCTION
The Chinese economy has gone through major transitions in the last three
decades, where a substantial part of economic activity has shifted from state-
owned sectors to private sectors. With a population of more than 1.3 billion
people and a labor force of more than 800 million1, the economic potential of
China remains huge. Two developments characterize China’s economic
transition. First, China has transitioned from a tightly centrally-planned
economy to a market-orientated economy but still shaped by the government’s
long-term economic development plan and entrepreneurship focus (cf. Oi 1995;
Huang 2010). Policies have helped speeding up China’s economic development
by making important adjustments in the areas of education, national innovation
system, economic openness, market function, infrastructure investment, etc.
1 Source: World Bank, World Development Indicators.

2
This transition cycle has run for more than three decades and still plays a critical
role in China’s economic growth. One important characteristic of this economic
and institutional transition is the attitude transition in acknowledging
entrepreneurship. Second, China has been developing from a factor-driven
economy to an efficiency-driven economy in the past 30 years, and is now
transitioning to an innovation-driven stage. 2 These developments are not
independent from each other with entrepreneurship undoubtedly contributing to
China’s fascinating economic growth (with more than 60% of China’s Gross
Domestic Product (GDP) in 2012 being performed by the private sector).3
The number of studies on China’s economic and institutional transition
is booming (e.g., Ahlstrom and Bruton 2002; Anderson et al. 2003; Batjargal
and Liu 2004; Begley et al. 2005; Davies and Walters 2004; George and Prabhu
2000; Lau and Busenitz 2001). Two main streams of literature may be
distinguished. The first stream treats China as an institutional context and
investigates the institutional environment and entrepreneurship in China either
separately or in direct relation to each other (Qian, 2000; Yang and Li, 2008,
Zhou, 2014), but overlooks the aggregate indirect impact of economic
institutional transition on entrepreneurship development, i.e., through shaping
economic antecedents of entrepreneurship such as economic openness, human
capital, institutional market changes, etc. (see also Figure 1 in our theory
section).
The second stream statistically investigates the impact of a specific
economic factor (such as FDI, the cost of labor, social capital, industrialization,
etc.) on China’s economic performance, either at the micro or macro level
(Chuang and Hsu 2004; Madariaga and Poncet 2007; Buckley et al. 2007; Xing
2010; Li and Atuahene-Gima 2001; Lin & Germain 2003). These studies
2 Cf., in Global Innovation Index 2013, China was ranked 3rd regarding the dimension of knowledge & technology output and 4th in creative output (Cornell University, INSEAD, and WIPO, 2013). See Porter, Sachs and McArthur (2002), for a description of these different stages of economic development. 3 Calculated from data from the National Bureau of Statistics of China (NBSC): http://www.stats.gov.cn/ also news from http://english.cntv.cn/program/bizasia/20130206/105751.shtml

3
investigate a direct link between economic antecedents and economic
development, but overlook the intermediate mechanism of entrepreneurship,
where not only the number of private firms but also the quality of the private
firm sector play their own important roles in China’s economic development.
This study aims to address the crucial link between economic
antecedents and private firm rates in Chinese regions, in order to offer a better
understanding on the nature (in terms of both quality and quantity) of
entrepreneurship in China. Our analysis helps to predict to what extent
increasing numbers of private firms may contribute to economic development,
taking into account that not only the quantity but also the quality of a region’s
private firm population determines the economic impact of entrepreneurship
(Thurik et al., 2013).
In order to shed light on the quality of a region’s entrepreneurship
population, we investigate the missing link in the economic mechanism of
China’s entrepreneurship and economic development: the economic antecedents
of private firm rates in Chinese regions. Distinguishing between two different
types of private firms (getihu versus siyingqiye; to be introduced in the next
section), we investigate to what extent regional private firm rates are sourced
from ‘productive’ antecedents, i.e., antecedents which are in accordance with a
modern, innovation-driven (‘entrepreneurial’) type of economy (Audretsch and
Thurik, 2000, 2001, 2004; Thurik et al., 2013), where comparative advantage is
no longer based on exploitation of scale economies (as in the efficiency-driven
economy), but rather on the ability to generate and commercialize new
knowledge (Porter et al., 2002; Audretsch and Thurik, 2001). From the
perception of the economic consequences of entrepreneurship development,
establishing the economic antecedents of private firm rates then enables us to
reflect on the extent to which entrepreneurship development in China has been
up to speed with transitioning to the innovation-driven stage of economic
development. In particular, different antecedents will be associated with

4
different types of entrepreneurship and different roles played in the economy.
In the same spirit, we also investigate to what extent interactions between the
numbers of getihu and siyingqiye types of private firms are in line with an
‘entrepreneurial’ type of economy.
In terms of the title of our paper, by investigating regional antecedents
of getihu and siyingqiye and their mutual interactions, we aim at drawing
conclusions as to which type of private firm should take the lead (‘run ahead’)
in transitioning China towards the innovation-driven stage of economic
development, where knowledge-based entrepreneurial activity is key.
By investigating regional-level determinants of entrepreneurship in
China, our study contributes to extant literature in at least three ways. First and
as already mentioned, the antecedents of Chinese economic development (e.g.
FDI, labor costs, etc.) have often been investigated quantitatively, however the
intermediate mechanism of entrepreneurship influencing economic
development has been overlooked. This study therefore contributes by
investigating the role of economic antecedents in shaping entrepreneurship
development (see also Figure 1 in our theory section).
Second, as far as research on entrepreneurship is concerned, we move
analysis of entrepreneurship during economic transition in China beyond
qualitative evidence (case studies and descriptive statistics) of how
entrepreneurs adapt to changing economic circumstances. We apply
econometric analysis to quantify the impact of regional conditions on the rates
of two types of private firms in regional economies. Regional antecedents of
Chinese firm rates have been rarely investigated, let alone the antecedents of the
two main different types of private firms (Yang and Li, 2008).
Third, by applying a simulation analysis, we are able to shed light on
the size and magnitude of the mutual interaction between getihu firms and
siyingqiye firms in Chinese regions. This, in turn, gives us an indication to what
extent these types of firms are able to stimulate and challenge each other in the
current Chinese economy.

5
The paper is organized as follows. After reviewing the evolution of
China’s institutional environment and corresponding private firm development
since the 1980s, our theory section addresses the conceptual framework of this
study. This section also briefly describes how economic antecedents may be
different in the ‘managed’ versus the ‘entrepreneurial’ economy (Audretsch and
Thurik, 2001). Based on our theory section we then develop our hypotheses.
Next, we describe our data, model set-up and methodology. In the final sections
we present and discuss our results and conclusions.
HISTORICAL BACKGROUND OF CHINESE ENTREPRENEURSHIP
In a transition context, a successful entrepreneurial economy depends not only
on the initial conditions in the transition economy but also on the speed and
consistency with which the reform process is applied (Estrin, Meyer, and
Bytchkova 2006). In the last three decades, China has attempted an
entrepreneurial approach in the economic transition from a central-planning
system to a market-based economy. The major characteristics of China’s
institutional environment, especially formal institutions since the 1950s,
comprise the one party state and strong government intervention (Barkema et
al. 2015). Although Chinese government has been relaxing the impact of state
control on market and business, policy-driven economic transition still cannot
be denied as the major cause of China’s entrepreneurship development via the
shaping of economic antecedents. These antecedents have been considered as
the key factors in promoting efficient social reforms and economic development
(World Bank 1993), efficiently bringing Chinese society restrictive covenants
(Stiglitz and Yusuf 2001).
Since the late 1970s, Chinese entrepreneurship has experienced three
generations of organizational forms: commune and brigade enterprises,
Township and Village enterprises (TVE), and finally, getihu and siyingqiye.
Commune and brigade enterprises were the first generation, born in the 1980s,
designed by the central government to deal with the bad economic consequences
caused by China’s Cultural Revolution (1966 to 1976), particularly in
6
nonagricultural industries (Gregory, Tenev, and Wagle 2000). This
organizational form did not function in Chinese economy longer than a decade
and was then replaced by the second generation, TVEs, characterized by shared
ownership of local government and collectives. Similar to the first generation,
TVEs faced tremendous questioning on its ownership and the nature as private
firms. Though it contributed significantly to China’s economy in the late 1980s
(20% of China’s gross output; Liao and Sohmen 2001), TVEs were terminated
by gradually being replaced by the third generation of organizational forms from
the late 1980s: getihu and siyingqiye.
Getihu (in Chinese) are private businesses that are registered at the
Chinese Industry and Commerce Office in the enterprise category with no more
than seven people hired as employees.4 In June 1988, the Chinese central
government issued the tentative stipulations on private enterprise (TSPE),
stipulating that a unit with privately owned assets and more than seven
employees could be registered as another form of private enterprise named
siyingqiye (in Chinese).
Besides the difference in the maximum number of employees, there are
also some other important differences between getihu and siyingqiye. In
particular, getihu are restricted to only use individual or household assets for
running their firm but they register with a shorter procedure and wider cognitive
acceptance.5 In contrast, siyingqiye are given much more relaxed conditions in
terms of more allowed sources of registered capital (i.e., shareholders can be
from outside of the entrepreneur’s family), but are compulsory required to hold
a fixed amount of registration capital, causing higher start-up costs. For these
differences, getihu are usually smaller than siyingqiye in terms of organizational
size.
4 This policy was based on Marx’s theory that if a business is allowed more than seven employees, the result could be the exploitation of labor (from “Das Kapital” by Karl Marx, 1867). 5 In the early stage of China’s entrepreneurship development, entrepreneurs who chose to set up getihu were more often from necessity orientation. Getihu form received more legitimate support from government.

7
Introducing getihu and siyingqiye as new organizational forms of private
firms was a landmark for China’s economic transition, and very critical in
China’s entrepreneurship development. Since then, private firms have started
coexisting with State-Owned Enterprises (SOEs), though they only played a
marginal, stop-gap role in the economy in the early 1990s (Gregory, Tenev, and
Wagle 2000). However, given China’s policy-driven economic transition, the
early stage of governments’ discriminative attitude to private sectors hampered
Chinese entrepreneurs’ contribution due to a lack of acknowledgement,
resources, and development space. In 1989 and 1990, China’s economic growth
rate slowed to 4.4% and 3.9% respectively.
In 1992, Deng Xiaoping’s South Touring Talk changed Chinese
entrepreneurs’ situation. Deng’s suggestion of transforming China into an
economically strong country through entrepreneurial activities has guided
Chinese government to re-set the goal of economic reform to transit China into
a socialist market economy (announced at The Chinese Fourteenth Party
Congress in September 1992) on the foundations of entrepreneurship. A series
of reforms was executed, such as reducing state intervention to state-owned
companies, “selling off small ones” (Young 1995) and “grasping the large”
(zhuada fangxiao in Chinese, meaning saving the larger SOEs and letting
smaller SOEs exit or be acquired).6 Other new policies included the fields of
foreign exchange, taxes, monetary and fiscal system, and streamlining
government bureaucracy (Qian 2000). By 1996, these reforms had triggered a
second boom in entrepreneurial activities, following 50% to 70% of the SOEs
being privatized.
In the late 1990s, China’s entrepreneurship development entered a new
era. By 1998, getihu and siyingqiye together accounted for one-third of national
industrial output and one-fifth of national non-farm employment (Gregory,
Tenev, and Wagle 2000). Chinese government started to clarify the importance
6 Because it was no longer viable to sustain a vast number of small and medium-sized SOEs in the face of market competition (Xu, Lu, and Gu 2014)

8
of entrepreneurship in China’s economy. In 1999, the Second Plenary of the
Ninth People’s Congress gave the private sector the same legal footing as the
public sector, remarked as the central government’s formally granting private
sectors constitutional recognition (Zhou 2014).
This governmental attitude change is also echoed by Chinese
governmental de-centralization reform in the late 1990s, by which regional
governments have relatively independent authority to determine the structure of
regional expenditure (Qian 2000), issuing business license, coordinating
business development, resulting business disputes, and enacting tax policies
(Zhou 2014).Therefore, each provincial government had to figure out which
regulatory policies were most appropriate for their own region, or imitate
successful policies in other regions (Breznitz and Murphree 2011). Partly as a
result of differences in regional policies, there is considerable variation in
regional rates of getihu and siyingqiye.
To summarize, since the end of the 1990s private firms in the forms of
getihu and siyingqiye account for ever increasing shares of China’s GDP, and
there is considerable variation, both over time and across regions, in the relative
prevalence of these two types of private firms. This variation will be exploited
in the empirical analysis, where economic antecedents of getihu and siyingqiye
rates are investigated.
THEORY
Conceptual framework: The role of entrepreneurship in modern China
Current literature on China’s strong economic growth in recent decades has not
taken into account the bigger picture of China’s entrepreneurship and economic
development so that current knowledge about the role of entrepreneurship in
China’s economic development has been partial in nature. Figure 1 exhibits our
view on the bigger picture of the economic mechanism of China’s
entrepreneurship and economic development. Since 1978, Chinese government
has been gradually experimenting various transitional policies, which led to
improvement of welfare (the standard of living) for the majority of the

9
population (direct link between the most left and most right boxes in Figure 1),
but also to entrepreneurial activities being promoted in two ways. First, directly,
by allowing and acknowledging the important role of private enterprise in the
Chinese economy (arrow 1 in Figure 1), which contributed to an increase in the
numbers of private firms. Second, by improving the conditions for
entrepreneurship, such as the renovation of labor, attracting foreign investment,
facilitating urbanization, investing in knowledge stock and human resource
development, and upgrading the institutional environment 7 , entrepreneurial
activities may be boosted as well (see arrow 2 in Figure 1).
[Insert Figure 1 here]
In this study, we address the link between economic antecedents and private
firm rates in Chinese regions (arrow 2 in Figure 1). This link is crucial to
understand the nature (in terms of quality) of entrepreneurship in China. In
particular, while it is clear that the number of private firms has increased
considerably over the last two decades, it is not clear to what extent these
increased numbers may contribute to economic development (arrow 3 in Figure
1), because higher numbers of private firms do not necessarily spur economic
development (Van Praag and Van Stel 2013; Shane 2009). The economic
contribution of entrepreneurship has been found to differ across different types
of firms (e.g. ambitious vs. non-ambitious, opportunity vs. necessity-based),
and hence the economic impact of entrepreneurship will not only be determined
by the quantity but also by the quality of a region’s private firm population
(Thurik, Stam, and Audretsch 2013).
In order to shed light on the quality of a region’s entrepreneurship
population, we investigate the economic antecedents of (two types of) private
firm rates in Chinese regions. In particular, we investigate to what extent
regional private firm rates are sourced from ‘productive’ antecedents like, for
instance, a high education level of the regional population. Hence, by studying
the crucial link between economic antecedents and private firm rates, we are
7 See the arrow between China’s policy-driven economic institutional transition and economic antecedents in Figure 1.

10
able to understand the role of China’s macro-economic and economic
institutional transition in shaping Chinese private firms’ development, not only
directly in terms of facilitating higher numbers of private firms (arrow 1 in
Figure 1), but also in terms of shaping the right antecedents of entrepreneurship,
influencing the type (quality) of entrepreneurship, and specifically uncover the
economic antecedents of China’s two organizational forms of private firms:
getihu and siyingqiye.
We will select economic antecedents from the literature on regional
determinants of entrepreneurship (e.g. Reynolds, Storey, and Westhead 1994)
and empirically test to what extent economic antecedents of regional private
firm rates are in line with the theory of the ‘entrepreneurial economy’
(Audretsch and Thurik 2000, 2001, 2004; Thurik, Stam, and Audretsch 2013).
This theory, discussed in more detail later on, describes how entrepreneurship
contributes to macro-economic development in the innovation-driven stage of
economic development, and which factors (antecedents) determine productive
entrepreneurship (Baumol 1990). This theory is particularly relevant for
entrepreneurship development in China, which is moving from an efficiency-
driven economy towards the innovation-driven stage (Fu 2015; Fu and Mu
2014) with a number of regions taking the lead, such as Beijing, Shanghai, and
Shenzhen.8 If economic antecedents of regional private firm rates in China are
in line with those described in the theory of the ‘entrepreneurial economy’, it
may be expected that the economy has the right incentive structure in place to
produce high quality entrepreneurship, and hence, that the entrepreneurial
sector (private firm population) contributes substantially to economic
development.
Rather than attempting to establish a direct link between
entrepreneurship development and economic development (arrow 3 in Figure
1), which is hampered by the complexity of incorporating entrepreneurship in
8 From the speech of Chinese premier Li Keqiang at 2015 World Economic Forum (https://agenda.weforum.org/2015/01/chinese-premier-li-keqiangs-speech-at-davos-2015/).

11
formal models of economic theory and endogenous growth (Baumol 1968;
Carree and Thurik 2010), we take a more indirect approach by studying
economic antecedents of entrepreneurship (arrow 2 in Figure 1). As far as we
are aware of, this is one of the first (if not, the first) studies on economic
antecedents of regional rates of entrepreneurship in China, providing a better
understanding of the complex role of entrepreneurship in China’s economic
development. From the perception of the economic consequences of
entrepreneurship development (arrow 3 in Figure 1), this then enables us to
reflect on the extent to which entrepreneurship development in China has been
up to speed with transitioning to the innovation-driven stage of economic
development.
From a managed to an entrepreneurial economy
China’s current transition from an efficiency-driven stage to an innovation-
driven stage of economic development requires a different way of organizing
economic activity. In particular, in the efficiency-driven stage, comparative
advantage is realized by an efficient use of physical capital which facilitates
exploitation of scale economies. This exploitation typically takes place in an
environment where the value of new ideas is relatively certain, so that
economies of scale can also be achieved in the research and development sector.
The most profitable firms in such an economy are typically large firms which
can be relatively easy to maintain high profit levels. These are the characteristics
of the so-called ‘managed’ economy (Audretsch and Thurik 2001). In contrast,
in the ‘entrepreneurial’ economy, small and new firms play an important role,
introducing new products and services in highly uncertain economic
environments while quickly adapting to rapidly changing consumer
preferences. In this type of economy, knowledge is a crucially important factor
of production and the prime source of competitive advantage. Economic, and
particularly, innovative activity by a heterogeneous population of firms is
required for an innovation-driven economy (or ‘entrepreneurial’ economy) to
be competitive. In the entrepreneurial economy, competitive advantage of firms
12
is based on new knowledge that, as a result of globalization and fast and
expanding ICT developments, is highly uncertain in nature. This uncertainty
causes the success of introducing new products or services to be less predictable
than in the managed economy. A firm may only experience the economic value
of his idea once it introduces the idea to the market (passive learning). At the
macro-level the market will select the best firms with the economically most
valuable new product ideas. These firms will grow whereas the less innovative
firms will decline and eventually exit (Jovanovic 1982).
In this environment, where scale economies are relatively less
important and flexibility more important, smaller firms are relatively better
equipped to compete, and strong firm performance is generally less persistent
as competition is stronger. These are the characteristics of the ‘entrepreneurial’
economy (e.g. Audretsch and Thurik 2001). In such an environment,
entrepreneurs with higher human capital levels tend to select into
entrepreneurship, as higher skills are required to compete in the market (Van
Stel, Millán, and Román 2014). This notion is very much echoed by China’s
recent national economic development strategy of “Mass Entrepreneurship and
Innovation”9 to encourage and provide a better environment for Chinese people
in starting entrepreneurial activities and pursuing innovation at established
firms, so as to foster the new engine of economic growth.
DERIVATION OF HYPOTHESES
We will derive hypotheses from the regional determinants of entrepreneurship
literature (e.g. Reynolds, Storey, and Westhead 1994; Armington and Acs
2002). In this literature, determinants of entrepreneurship at the regional level
are typically classified in three categories (Bosma et al. 2008): (i) demand and
supply factors for entrepreneurship, (ii) agglomeration effects, and (iii) cultural
or policy environment determinants. Regional demand for entrepreneurship
relates to conditions for local consumer demand. For instance, higher average
9 From the speech of Chinese premier Li Keqiang at 2015 World Economic Forum (https://agenda.weforum.org/2015/01/chinese-premier-li-keqiangs-speech-at-davos-2015/).

13
incomes in a region imply that consumers have more money to spend, and hence
there is more room (‘demand’) for entrepreneurship. On the other hand, a region
with relatively highly educated inhabitants may produce relatively many
individuals with the right skills for entrepreneurship (‘supply’ of
entrepreneurship). We include in our study the main demand and supply side
variables of regional entrepreneurship, including industrial structure (demand
side), the stock of human capital (supply side) and the average wage rate, which
has features of both the demand and the supply side.
Furthermore, we also include explicit measures of agglomeration
effects and regional policy (such as the institutional environment) as well as two
variables which are particularly relevant for regional entrepreneurship in the
Chinese context, i.e., inward FDI and investments by state-owned enterprises,
both of which may be classified on the demand side of entrepreneurship. But
we will start our derivation of hypotheses with the interaction between the
numbers of getihu and the number of siyingqiye.
Interaction between getihu and siyingqiye. Our first hypothesis relates
to the interaction between getihu and siyingqiye firms. Although getihu has a
longer history than siyingqiye and are chosen by entrepreneurs in larger
numbers, getihu and siyingqiye may benefit from each other’s presence. First,
in China’s contemporary economy getihu and siyingqiye play different roles in
the value chain, where, in certain sectors such as retail, construction, trading
service, etc., (larger) siyingqiye firms often act as demanders of specialized,
high-quality, intermediate goods and services, while getihu, because of their
specialized activity and size, often act as suppliers. Hence, a stronger presence
of siyingqiye in a region may create more demand for intermediate goods and
services, allowing more room for specialized getihu firms in the market. This
suggests a positive effect of the number of siyingqiye on the number of getihu.
However, in other sectors, such as manufacturing, the reversed value chain
relation occurs as well, i.e., siyingqiye delivering products and services to
14
getihu (in line with a positive effect of the number of getihu on the number of
siyingqiye).
Second, in an ‘entrepreneurial’ economy, one may expect a continuous
battle between small, innovative firms, most of which may be expected to have
the lower-cost getihu organizational form (at least until it is clear that the firm
will be successful and grow beyond the seven employees limit). The most viable
firms with the best product ideas will grow out to larger size, and hence
transition to the siyingqiye organizational form. The more (high-quality) getihu
there are in an economy, the more competitive this evolutionary process will be,
and the larger the chance that the ‘winners’ from this process will grow bigger
to siyingqiye firms. This suggests a positive impact of the number of getihu on
the number of siyingqiye.
Importantly, for both processes described above, substantial
interaction between getihu and siyingqiye can only take place if the getihu firms
are of sufficient quality. Therefore, we interpret the strength of the interaction
between getihu and siyingqiye firms, in both directions, as a reflection of the
average quality of the getihu firms. We argue that a competitive getihu sector
strongly facilitates the emergence of an ‘entrepreneurial’ economy in China.
We thus hypothesize the interaction between getihu and siyingqiye
firms to be positive (in both directions). However, the strength of the mentioned
competition process (well-performing getihu challenging and stimulating
siyingqiye in a region) depends on the quality and innovative capacity of the
getihu firms, as weaker firms will not be able to challenge other firms, which
will then also not be stimulated to increase their performance (Fritsch and
Mueller 2004). As high-quality small and new firms play a more important role
in innovation-driven economies, we expect the effect of getihu on siyingqiye to
be especially strong, given the transition of China to an innovation-driven
economy (Fu and Mu 2014).
15
Hypothesis 1: The rate of getihu and the rate of siyingqiye have a
positive impact on each other but the impact of getihu on siyingqiye is relatively
stronger.
Remuneration of Labor. The remuneration of labor in a region, as
proxied by the level of the average regional wage rate, may have positive and
negative effects on the rate of private firms. High wage rates imply that labor
market participants may earn more income as an employee than as an
entrepreneur, lowering the supply of entrepreneurs. Also, for homogeneous
labor, high wages imply higher costs of employing personnel, which makes
running a business with sustainable profit levels more difficult. Hence, the
number of firms may be expected to be lower in high-wage regions (Ashcroft,
Love, and Malloy 1991). In contrast, higher wages may imply a higher demand
for products and services by consumers, and may therefore be associated with
more firms in the region. Moreover, in high-tech industries, higher wages may
actually be a sign of higher human capital levels of the employees, enabling
firms to outperform their rivals through higher productivity of their employees
(Okamuro 2008). In more ‘entrepreneurial’ economies, where producing at the
technological frontier is more common, higher wages may thus go together with
higher employment (Audretsch and Thurik 2001). Put differently, higher wages
may indicate higher regional supply of high human capital workers implying
higher productivity levels. Such regional labor markets are attractive
environments to operate private firms. This may hold especially for siyingqiye
firms which are not restricted in the number of (high-skilled) jobs they can
provide at the technological frontier of production.
Hypothesis 2: A region’s level of remuneration of labor is positively
related to the rate of private firms but stronger related to siyingqiye.
Stock of human capital. Opportunity-based entrepreneurial activities
are associated with entrepreneurs’ backgrounds and prior experience (Djankov
et al. 2006). According to Shane (2000), the factors that impact the discovery
of entrepreneurial opportunities are the possession of prior information and the

16
cognitive ability to value existing opportunities. Kaish et al (1991) state that
those who are better at identifying a new opportunity have prior information
complementary to the new information embedded in the opportunity, because
specialized information is more useful than general information for most
activities (Becker and Murphy 1992). Therefore, we argue that people with a
higher level of specialized education (or more generally, people with high
human capital) are more likely to exploit such opportunities.
As human capital is the main determinant of entrepreneurs’ earnings
(Van Praag 2005), regions with a higher proportion of college graduates (which
indicates higher human capital stock level) may generate higher rates of
entrepreneurs and firms (Armington and Acs 2002; Acs and Armington 2004).
However, as entrepreneurs with high human capital levels are typically able to
obtain such high earnings by running large firms with many employees (Lucas
1978), average firm size in regions with high stocks of human capital may be
higher. Indeed, Van Praag and Van Stel (2013) show that in economies with
higher educated labor forces, the number of employees per firm (i.e., average
firm size) tends to be higher. Consistent with this evidence, (Millán et al. 2014)
show that entrepreneurial performance of the average entrepreneur is stronger
in countries with higher educated populations, suggesting that labor market
participants with the highest entrepreneurial ability rates select into
entrepreneurship, as predicted by Lucas (1978).
Thus, it may be expected that in regions with higher rates of college
graduates, the number of entrepreneurs running larger (typically siyingqiye)
firms is relatively higher. Accordingly, the number of entrepreneurs running
smaller (typically getihu) firms will be relatively lower in such regions.
Hypothesis 3: A region’s stock of human capital is positively related to
the rate of siyingqiye firms but negatively related to the rate of getihu firms.
Institutional environment. China is often claimed to have an
underdeveloped institutional framework (Chen, Chen, and Huang 2013). World
Bank (2013) reports that China ranks 96th out of 189 countries worldwide

17
regarding the general ease of doing business. On a positive note, the report also
reports that China ranks among the top-15 economies regarding improvements
made in the ease of doing business between 2005 and 2013 (World Bank 2013).
Regarding such improvements, many studies have argued that China’s more
stable and efficient institutions have helped Chinese entrepreneurial firms take
long-term views and grow faster (Batjargal et al. 2013; Hitt et al. 2004). In
particular, China’s legal protection of property rights has had positive effects on
entrepreneurial activities in China (Cull and Xu 2005; Lu and Tao 2010; Zhou
2011).
Notwithstanding these institutional improvements, considerable
differences in the institutional environment still exist between Chinese regions
(Zhou 2014). These may impact regional differences in private firm rates. In
particular, in an institutional environment that is more business-friendly, the
relative number of firms is expected to be higher. This effect may be even
stronger for siyingqiye firms as they may have to deal with business regulations
on a more frequent basis, e.g. labor market regulations (i.e., the costs of hiring
and firing of workers). We hypothesize:
Hypothesis 4: A relatively well-developed institutional environment is
positively related to the rate of private firms but stronger related to siyingqiye.
Agglomeration effects. Heavily populated areas are attractive
locations for firms because of several advantages of agglomeration. First, in
dense areas the local demand for products and services is high (Reynolds,
Storey, and Westhead 1994). Second, the local supply of highly-educated
workers is high, reducing the search costs for qualified labor (Wheeler 2001).
Third, the closeness of people and firms provides an environment that is
particularly conducive to knowledge spillovers (Audretsch and Feldman 1996).
Other advantages include closeness of research institutions, closeness of
suppliers, clustering of innovative firms from the same industry, and room for
the creation of niche markets related to a high diversity of the population and
associated variety in demand for products and services (Bosma et al. 2008).
18
Despite negative agglomeration effects such as higher input prices and
congestion, the literature is dominated by the empirical evidence for positive
agglomeration effects on new firm formation (e.g. Reynolds et al., 1994;
Armington and Acs, 2002).
Particularly firms with growth potential may benefit from
agglomeration advantages (e.g. big sales markets, easy access to qualified labor,
good conditions for knowledge spillovers). We therefore hypothesize:
Hypothesis 5: A region’s agglomeration effect is positively related to
the rate of private firms but stronger related to siyingqiye.
Economic openness. Economic openness is considered as one of the
most important characteristics of transitional countries. Many latecomer
countries have shown that economic openness affects the economic output and
eventually the rate of economic growth, either by export or FDI. In this study,
we use inward FDI as an indicator of economic openness. For emerging
countries, FDI contributes to the local economy development through financial
capital and technology transfer. In particular, activities of multinational
enterprises (MNEs) in host countries may generate knowledge externalities
(technology spillovers) benefiting domestic firms in the local economy (Caves
1996; Blomström, Kokko, and Zejan 2000).
However, the other voice states that there might be no effect or even
negative effects (Aitken and Harrison 1999; Haddad and Harrison 1993). Aitken
and Harrison (1999) explain such a negative effect as “market stealing” or the
crowding-out effect.10 Caves (1996) and Blomström, Kokko, and Zejan (2000)
also argue that the likelihood that MNEs will crowd out local firms is larger in
developing than in developed countries. This is due to a higher technology gap
between domestic and foreign firms, because FDI often represents a “death
sentence” for local firms that usually cannot compete with MNEs that possess
technological and financial advantages. The case for no effect refers to
10 They argue that even though technology spillovers exist, more efficient foreign firms may draw demand from domestic firms, so the negative competitive effect may outweigh positive technology spillovers.

19
subsidiaries acting as enclaves in a developing country with lack of effective
linkages with the local economy (Aitken and Harrison 1999; Feinberg and
Majumdar 2001).
Pertaining to this study, we propose that economic openness, reflected
by FDI, has a positive impact on entrepreneurship, where complementary
effects dominate due to the reduced technological gap between MNEs and local
Chinese firms and network linkage effects in between (Rodriguez-Clare 1996;
Markusen and Venables 1999)). Yang, Tipton, and Li (2011) stress that by the
time China moves to the late stage of market transition, Chinese local firms have
benefited from foreign firms’ modern technologies through licensing,
international joint ventures (IJVs) and alliances. Complementary effects and
networking effects in this stage therefore appear stronger than the crowding out
effect. This stimulates local entrepreneurship if the necessary stimulating
conditions are created (De Backer and Sleuwaegen 2003). As siyingqiye have a
larger business scale than getihu and a stronger internal knowledge base to
collaborate with MNEs more often, we hypothesize:
Hypothesis 6: A region’s economic openness is positively related to the
rate of private firms but stronger related to siyingqiye.
METHODS
Data Source and Sample
We use two major data sources in this study. The first is formed by the various
China Statistical Yearbooks from the National Bureau of Statistics of China
(NBSC) database, covering 31 Chinese regions over 13 years (from 1997 to
2009, in total 403 region-year observations). The NBSC statistics, largely
accurate and internally consistent (Chow, 1993), include data about population,
economy, and society at the national and regional levels over years, quarters,
and months for thirty-one Chinese provinces in twenty-three categories (for
national accounts, population, finance, industry, agriculture, trade, education,
health, welfare, etc.) and have been used extensively in many China related
studies (e.g. Buckley, Clegg, and Wang 2007; Chang and Xu 2008; Tian 2007).

20
The second data source is the database containing the institutional index
developed by the Nevin Economic Research Institute (NERI) (Fan, Wang, and
Zhu 2010) to reflect the regional institutional environment. This index has
integrated the values from five dimensions of China’s institutional environment:
government and market forces, development of non-state-owned organizations,
development of commodity markets, development of factor markets (in which
local knowledge and scientist are evaluated), and the development of market
intermediaries and the legal environment. This index has been extensively used
in finance and economics (Chen, Ding, and Kim 2010), and has recently been
introduced to the management literature as well (Gao et al. 2010; Schotter and
Beamish 2011; Shi, Sun, and Peng 2012).
Dependent variable: Entrepreneurship
We define Chinese entrepreneurial activities as economic activities conducted
by two types of private firms: getihu and siyingqiye. According to NBSC
(2009), private enterprises are those having been registered at the departments
of industrial and commercial administration for which the business operations
are situated at a county town (i.e., a town where the county government is
located), or at urban areas with administrative hierarchy higher than a county
town. The main difference between getihu and siyingqiye is the number of
employees that they can hire. Following the organizational status perspective of
entrepreneurship (Audretsch, Kuratko, and Link 2015), we measure
entrepreneurship as the rate of private firms (cf. Congregado 2008). We drew
the number of getihu and siyingqiye private firms separately from each
provincial Statistical Yearbook (from 1997 to 2009). We merged collected data
and then divided the number of firms by the corresponding provincial
population size to reflect the firm rate (per thousand capita). The variable names
(as shown in Table 1) are GTHR for getihu rate and SYQYR for siyingqiye rate.
Independent Variables
We use the average (real) wage rate from town and cities to measure
remuneration of labor (e.g. Ashcroft, Love, and Malloy 1991; Okamuro 2008).
21
We abbreviate this variable as WAGE. Following previous studies (Millán et al.
2014; Acs and Armington 2004), we measure a region’s stock of human capital
by the share of population holding tertiary education. As tertiary education
(rather than primary or secondary education) is most likely to be associated with
productivity (Vandenbussche, Aghion, and Meghir 2006), we use the college
graduation rate (per thousand capita) as a proxy, including graduates from both
junior colleges (dazhuan) and senior colleges (daxue).11 Dividing by population
size, we express the number of college graduates per thousand capita. This
variable is abbreviated in the regression as CGR (college graduates rate). To
measure the quality of the institutional environment per region, we used the
NERI Index developed by the Nevin Economic Research Institute (NERI) (Fan,
Wang, and Zhu 2010). The index was drawn from the NERI index dataset and
is abbreviated as IE. Agglomeration effects are measured by population density
in this study (e.g. Reynolds et al., 1994; Armington and Acs, 2002). We divided
the total population by the territory size of the corresponding region
(abbreviated as PD). Economic openness is majorly echoed by the permission
of foreign direct investment. We divide the total amount of foreign investment
by the corresponding regional gross production (RGP) in the same year, and the
variable is abbreviated as FDI. Finally, to estimate mutual interactions, we also
included the (lagged) siyingqiye rate as a determinant in the getihu equation,
and vice versa.
Control Variables
We incorporate two control variables in our empirical analysis. First, we control
for regional industry structure. As firm size is larger in manufacturing compared
to, e.g., services (and hence the relative number of firms lower), a regional
economy with a higher share of manufacturing is expected to have a lower
private firm rate. We calculated manufacturing industry and service industry
shares (in terms of GDP) in the total regional economy and abbreviated them as
11 In China, dazhuan education takes three years and focuses more on practical capability training for industry, while daxue education takes four years and focuses more on academic training.

22
MI, SI in the regression tables. Second, we use a proxy for total investments by
state-owned units over regional GDP, labeled TIGDP. High investments from
state owned units may indicate high capital intensity where the large state-
owned enterprises have a comparative advantage. In such regions, private firms
may be crowded out and the rate of firms may be lower. The variable definitions
are summarized in Table 1.
[Insert Table 1 here]
Descriptive statistics
Figure 2 shows the evolution over time of the rate of private firms
(distinguishing between getihu and siyingqiye) while Figure 3 provides a
regional comparison for the most recent year 2009. Although the rate of
siyingqiye is far lower than that of getihu, our data show that, compared to
getihu firms, siyingqiye firms occur relatively more often in higher developed
regions: the correlation between the regional rates of siyingqiye and of
economic development (real GDP per capita) is significantly positive at 0.719
at 5% significance level, whereas this correlation is only 0.216 for the rate of
getihu. Accordingly, the cross-regional comparison (see Figure 3) presents a
sharp gap between the most developed regions such as Shanghai, Bejing,
Tianjing, Jiangsu and Zhejiang which rank top on the siyingqiye rate, and some
developing regions which in contrast rank higher on the getihu rate. These
correlations of the private firm rates with the regional level of economic
development (GDP per capita) raise the question of which economic
antecedents underlying the regional level of economic development are able to
explain the variations in private firm rates? This is the subject of our empirical
analysis.
[Insert Figures 2 and 3 here]
Table A1 in the (online) appendix presents descriptive statistics and the
correlation matrix for the variables used in our empirical analysis. It shows that
on average, the number of getihu has been about seven times higher than the

23
number of siyingqiye. However, the table conceals large regional differences
with regard to the relative number of getihu versus siyingqiye firms.
Estimation methodology
We aim at explaining the regional rates of getihu firms and siyingqiye firms
over the period 1997-2009 from the explanatory variables described above.
Moreover, we want to take account of the correlation between the two
dependent variables, i.e., the getihu and siyingqiye rates. Therefore, we apply
seemingly unrelated regression (SUR) estimation (e.g., Bosma et al., 2008, for
a similar application) to provide separate sets of coefficients for both equations
while acknowledging correlations between the error terms of both equations
(Zellner 1962, 1963).
We estimate two different set-ups of our two-equation model. In our first
set-up, we include variables for all (31) regions and all (12) years (1998-2009)
in our estimation sample and include regional fixed effects in our model.12
Hereby we focus on explaining the variations over time of the regional rates of
getihu and siyingqiye (as the structural cross-regional differences in these firm
rates are captured by the regional fixed effects, i.e., the terms !"# in the model
below). So, we investigate whether changes in our explanatory variables in a
region lead to changes in firm rates in that particular region (dynamic approach).
Our regression model looks as follows (indicators i and t represent region and
year, respectively):
GTHRit = β0 i +β1 *SYQYRi,t−1 +β2 *WAGEi,t−1 +β3 *CGRi,t−1 +β4 * IEi,t−1 +β5 *PDi,t−1 +β6 *FDIi,t−1+β7 *Controls+εit
SYQYRit = β0 i +β1 *GTHRi,t−1 +β2 *WAGEi,t−1 +β3 *CGRi,t−1 +β4 * IEi,t−1 +β5 *PDi,t−1 +β6 *FDIi,t−1+β7 *Controls+εit
In our second set-up, we include variables for all regions but include
only the years 1998, 2003 and 2009. Here we do not include regional fixed
effects but instead estimate a pooled (SUR) model.13 Hereby we focus on
12 Note that we lose one year of observations because we include a lag in our model. 13 The pooled model looks the same as the fixed effects model, with one exception: the !"# terms are replaced by !".

24
explaining the variations across regions of the regional rates of getihu and
siyingqiye, i.e., why do some regions have higher firm rates than other regions
(static approach)? We assume that the cross-region samples for 1998, 2003 and
2009 are sufficiently independent to warrant pooling them in one regression (see
Wennekers et al. 2007, for a similar set-up). Nevertheless we do include year
dummies to account for differences between these three years.
RESULTS
The estimation results of our two SUR model set-ups as described above
(regional fixed effects model versus pooled model) are presented in Tables 2
and 3.14 Regarding the interaction between getihu and siyingqiye in Hypothesis
1, we observe positive effects which are significant at the 1% level, in both
tables (models (1) and (2) in Tables 2 and 3). Moreover, the coefficients are in
the same order of magnitude across the fixed effects and pooled estimations,
rendering the results to be quite robust. Hence, on Hypothesis 1, we conclude
that the interaction effects between the rates of getihu and siyingqiye are
positive in both directions.
It is now interesting to consider which cross-effect dominates, in terms
of strength. Clearly, as the size of the coefficient for the effect of siyingqiye on
getihu (model (1)) is much higher, in absolute terms this effect dominates over
the strength of the vice versa effect (getihu on siyingqiye). However, this is
directly related to the much higher getihu rate (21.1 on average, see Table 2)
compared to the siyingqiye rate (3.1 on average). It is more interesting to
consider the relative impact of both cross-effects. To this end we introduce a
simulation analysis (see Appendix 1), where, in one exercise, we provide an
impulse of 10% to the number of getihu and consider how the number of
siyingqiye develops over time, based on our actually estimated parameter
estimates of their mutual interactions (holding the other independent variables
14 Note that in some model variants, the number of observations in Table 2 is slightly smaller than 372 (i.e., 31 regions times 12 years). This is due to some missing observations for some of the independent variables. Similarly, the number of observations in some variants of Table 3 is slightly smaller than 93 (i.e., 31*3).

25
constant).15 In a second exercise, we investigate the reverse impact (i.e., the
impact on the number of getihu of a shock of 10% to the number of siyingqiye).
We find that the elasticity of getihu on siyingqiye is 0.51 (i.e., a 10% increase
in the number of getihu leads to a 5.1% increase in the number of siyingqiye)
whereas the elasticity of siyingqiye on getihu is only 0.29.
Hence, the effect of the getihu rate on the siyingqiye rate is relatively
stronger than the vice versa effect, consistent with the second part of Hypothesis
1. Therefore, ceteris paribus the effect of other independent variables, our
empirical analysis predicts that the gap between the number of siyingqiye and
getihu will become smaller in the near feature. We refer to Appendix 1 for more
details about this simulation exercise.
Regarding a region’s level of remuneration of labor, we find a
significantly positive impact of the regional average wage rate on the rate of
siyingqiye, both in Tables 2 and 3. As explained in our theory section, higher
wages may reflect a higher regional supply of high human capital workers with
higher productivity levels. As such regional labor markets provide an attractive
environment to operate private firms, in particular firms which are not restricted
in size (i.e., siyingqiye firms), the relative number of siyingqiye firms is higher.
This result is in line with Hypothesis 2 and also in line with the theory of the
‘entrepreneurial economy’. Regarding the impact of wages on the rate of getihu,
results are mixed. Using the fixed effects model (Table 2), we find a positive
impact, whereas using the pooled model (Table 3), we find no significant effect.
Hence these results are not robust. Possibly, some of the negative influences of
higher wages on entrepreneurship discussed in the theory section, such as the
higher opportunity costs of entrepreneurship, may play a role. In other words, it
may be that in high-wage regions, labor market participants prefer a high wage
in paid employment over owning and running a getihu firm, which necessarily
remains small in size, thereby hampering the possibility of earning a high
income through owning and running a getihu firm. In contrast, in such regions,
15 See Burke and Van Stel (2014) for a similar simulation exercise predicting developments of entry and exit rates.

26
entrepreneurs of siyingqiye firms have more possibilities to earn a high income
by expanding their firm with high-quality employees, hence the positive effect
of wages on the rate of siyingqiye firms. We conclude that the impact of average
wages on the siyingqiye rate is in line with the ‘entrepreneurial economy’
whereas the impact of wages on the getihu rate is not. Accordingly, Hypothesis
2 is partly supported.
Regarding the impact of the regional stock of human capital, we see that
the coefficient of the college graduates rate for siyingqiye is significantly
positive in both Tables 2 and 3. Hence, in regions with relatively more higher
educated workers, the number of entrepreneurs running larger (siyingqiye)
firms is relatively higher, as theorized in the first part of Hypothesis 3. The
second part of Hypothesis 3, stating that the number of smaller (getihu) firms is
relatively lower in such regions, is only partly confirmed as the coefficient is
significantly negative in Table 2 (model 1) but not significant in Table 3.
Regarding the institutional environment, we find that regions with more
business-friendly institutions have higher siyingqiye rates, consistent with
Hypothesis 4. For getihu we do not find a significant effect. Hypothesis 4 is thus
only partly supported. Apparently, a business-friendly institutional environment
facilitates siyingqiye firms more than getihu firms.
On agglomeration effects, we find a negative sign of population density
for the rate of getihu and a positive sign for the rate of siyingqiye firms. The
latter effect is in accordance with our expectations as particularly large firms or
firms with growth ambitions will benefit from the advantages of agglomeration
(e.g. easy access to qualified labor). The former effect is somewhat surprising,
as for getihu firms, the disadvantages of agglomeration (e.g. congestion, high
input prices) seem to exceed the advantages. Thus, Hypothesis 5 is partly
confirmed.
Regarding the impact of a region’s economic openness, as proxied by
the rate of inward FDI, we find a non-significant relation between inward FDI
and the rate of getihu, possibly reflecting that getihu firms and foreign firms

27
compete on different markets. The relation of inward FDI with the rate of
siyingqiye is found to be negative. Apparently, foreign firms are able to draw
demand from siyingqiye, so that the market share of siyingqiye decreases when
FDI levels in a region are higher. Hypothesis 6 is not supported.
Finally, results of our control variables are in line with our expectations:
firstly, in regions with a higher share of manufacturing, the rate of siyingqiye is
lower, probably reflecting a higher average firm size (as manufacturing firms
require a considerable scale of operation to compensate for higher fixed costs);
secondly, private firms, and particularly siyingqiye firms, seem to find it hard
to compete with SOEs (witness the negative sign of TIGDP in Table 2 and 3).
[Insert Tables 2 and 3 here]
CONCLUSION AND DISCUSSION
Arguably the most important change in the transition of China from a
centrally planned economy to a market-based economy was the admission
and acknowledgement of private enterprises in the 1980s and 1990s in the
form of getihu and siyingqiye firms. In this study we investigated the
evolution and the economic antecedents of regional rates of siyingqiye and
getihu over a decade (from 1997 to 2009), as well as the interactions
between the regional rates of these two types of organizational forms.
A big literature exists on various aspects of China’s transition to a
market economy. However, to our knowledge no attention has been paid to
the variations in rates of siyingqiye and getihu, both across regions and
over time. This study not only documents these variations but also explains
them. By investigating to what extent regional antecedents of getihu and
siyingqiye rates are in line with those predicted by the theory of the
‘entrepreneurial economy’ (e.g. Audretsch and Thurik 2004), we are able
to reflect on the extent to which entrepreneurship development in China
has been up to speed with transitioning to the innovation-driven stage of
economic development.

28
We find that determinants of the regional rates of siyingqiye and
getihu are substantially different. Among others, a region’s prevalence of
college graduates is positively related to the rate of siyingqiye but not so to
the rate of getihu. Our results also suggest that agglomeration advantages
accrue to siyingqiye rather than getihu firms. Thus, siyingqiye firms are
relatively more often present in regions where economic antecedents are
conducive to knowledge production and knowledge spillovers. As
knowledge is the main source of competitive advantage in innovation-
driven economies, we may therefore say that regional incentive structures
for siyingqiye seem to be in line with a modern competitive economy,
where knowledge-based entrepreneurship is key.
Although siyingqiye firms thus seem to be conducive to China’s
innovation-driven economic development, our results also show that the
presence of large companies, either in the form of inward FDI or in the
form of SOEs, still crowds out domestic siyingqiye firms. This suggests
that, although China is transitioning towards an innovation-driven
economy, and away from an efficiency-driven economy, economies of
scale still play an important role in China’s contemporary economy.
Regarding getihu, we notice that antecedents of regional getihu rates
are less in line with the ‘entrepreneurial economy’. For instance, we do not find
evidence for a positive association between the education level of the regional
population and the number of getihu firms. This may reflect that part of getihu
firms are started out of a necessity-motivation. When labor market participants
have no other options for work, they may start their own firm, and the getihu
form is then the easiest (and cheapest) organizational form to choose. However,
notwithstanding the presence of necessity-motivated entrepreneurs in the getihu
sector, nowadays entrepreneurial activity among getihu is increasingly

29
opportunity-based.16 In this respect, the getihu form may offer advantages also
to ambitious entrepreneurs as the small scale and scope enables them to be
flexible and use a low-profile environment to experiment with new ideas.17
Our simulation exercise also seems to support this conjecture of an
increasing quality of the getihu sector: we find that there is relatively strong
interaction between regional rates of getihu and siyingqiye. We interpret the
relatively strong interaction between the two types of firms as a sign that the
getihu sector in China is of considerable quality.18 Regarding these interactions
we find that the impact of getihu on siyingqiye (estimated elasticity 0.51) is
even stronger than vice versa (0.29), predicting that, ceteris paribus, the gap
between the number of getihu and siyingqiye will decrease in the near future.
As siyingqiye antecedents have been found to be more in line with the
‘entrepreneurial’ economy, this predicted increase in the share of siyingqiye
firms (relative to getihu) suggests that China is slowly but surely transitioning
towards an ‘entrepreneurial’ economy.
On balance, our results suggest that siyingqiye and getihu each play
their own role in the modern Chinese economy. Siyingqiye firms have the
possibility to grow and are therefore attractive to ambitious, opportunity-
oriented entrepreneurs. Our analysis suggests that siyingqiye entrepreneurship
in China is indeed to a large extent opportunity-driven as its rates are found to
be highest in regions where economic antecedents are conducive to running
profitable, competitive firms in the modern knowledge-based economy.
Nevertheless, siyingqiye rates are lower in regions with a high large-firm
presence, marking China’s transitional stage between the efficiency-driven and
16 For instance, China’s national team in the Global Entrepreneurship Monitor reports that the proportion of opportunity-driven entrepreneurship increased from 40% in 2002 to 58% in 2011 (http://www.gemconsortium.org/country-profile/51). 17 Indeed, in the 2010s, in certain sectors such as the internet industry, many ambitious entrepreneurs choose the getihu form as it enables them to experiment in a small-scaled environment while enjoying a relatively easy registration procedure (http://news.xinhuanet.com/fortune/2015-03/26/c_1114778026.htm) 18 Regarding the quality of the getihu sector, the contradicting results for the regional wage rate are also insightful. For the static analysis, we find no significant relation, suggesting that positive (‘entrepreneurial economy’) effects are being offset by negative (‘managed economy’) effects. Through path-dependency, the static analysis results partly reflect the initial distribution of (necessity-based) getihu firms. In contrast, for the dynamic analysis we find a positive impact, consistent with increasing numbers of opportunity-oriented getihu firms over time.

30
innovation-driven economy, where economies of scale still play an important
role.
In contrast, antecedents of getihu firms are less clearly linked to
reaping the fruits of the ‘entrepreneurial’ economy, possibly indicating that the
getihu sector consists of a mixture between necessity-driven and opportunity-
driven entrepreneurs. However, our analysis also suggests that the share of high-
quality, opportunity-driven entrepreneurs in the getihu sector may be
increasing, as getihu firms were found to play an important role by enabling the
number of siyingqiye firms to increase.
Future research may focus on analyzing different types of
entrepreneurship, even within the getihu and siyingqiye forms. For instance, it
would be interesting if the numbers of getihu and siyingqiye could be split by
sector of economic activity, start-up motivation, innovation orientation, or other
dimensions. At present, as far as we are aware of, such detailed data are only
available to a limited extent though. Another interesting avenue for future
research is related to the competition of siyingqiye with foreign firms. Our
analysis suggested that, although siyingqiye firms seem to be well-equipped to
compete in a modern, knowledge-based economy, to some extent they seem to
fall victim to crowding-out effects by inward FDI. However, recent evidence
also shows that siyingqiye firms have started going abroad via the route of
outward FDI in overseas markets (such as Africa, South Asia, and Eastern
Europe). Whether inward FDI really has crowding-out effects for Chinese
private firms on the domestic market, and to what extent they respond by going
abroad (outward FDI) will be an interesting topic for future research.

31
Reference
Acs, Zoltan J., and Catherine Armington. 2004. “The Impact of Geographic Differences in Human Capital on Service Firm Formation Rates.” Journal of Urban Economics 56 (2): 244-78.
Ahlstrom, David, and Garry D. Bruton. 2002. “An Institutional Perspective on the Role of Culture in Shaping Strategic Actions by Technology-focused Entrepreneurial Firms in China.” Entrepreneurship Theory and Practice 26 (4): 53–69.
Aitken, Brian J., and Ann E. Harrison. 1999. “Do Domestic Firms Benefit from Direct Foreign Investment ? Evidence from Venezuela.” American Economic Review 89 (3): 605–18.
Anderson, Alistair R., Jin-Hai Li, Richard T. Harrison, and Paul J.A. Robson. 2003. “The Increasing Role of Small Business in the Chinese Economy.” Journal of Small Business Management 41 (3): 310–16.
Armington, Catherine, and Zoltan J. Acs. 2002. “The Determinants of Regional Variation in New Firm Formation.” Regional Studies 36 (1): 33–45.
Ashcroft, Brian, James H. Love, and Eleanor Malloy. 1991. “New Firm Formation in the British Counties with Special Reference to Scotland.” Regional Studies 25 (5): 395–409.
Audretsch, David B., Donald F. Kuratko, and Albert N. Link. 2015. “Making Sense of the Elusive Paradigm of Entrepreneurship.” Small Business Economics 45 (4): 703-12.
Audretsch, David B., and Maryann P. Feldman. 1996. “R&D Spillovers and the Geography of Innovation and Production.” American Economic Review 86 (3): 630–40.
Audretsch, David B., and A. Roy Thurik. 2000. “Capitalism and Democracy in the 21st Century: From the Managed to the Entrepreneurial Economy.” Journal of Evolutionary Economics 10 (1): 17–34.
———. 2001. “What’s New about the New Economy? Sources of Growth in the Managed and Entrepreneurial Economies.” Industrial and Corporate Change 10 (1): 267–315.
———. 2004. “A Model of the Entrepreneurial Economy.” International Journal of Entrepreneurship Education 2 (2): 143–66.
Barkema, Harry G., Xiao-Ping Chen, Gerard George, Yadong Luo, and Anne S. Tsui. 2015. “West Meets East: New Concepts and Theories.” Academy of Management Journal 58 (2): 460–79.
Batjargal, Bat, Michael A. Hitt, Anne S. Tsui, Jean-Luc Arregle, Justin W. Webb, and Toyah L. Miller. 2013. “Institutional Polycentrism, Entrepreneurs’ Social Networks, and New Venture Growth.” Academy of Management Journal 56 (4): 1024-49.
Batjargal, Bat, and Mannie (Manhong) Liu. 2004. “Entrepreneurs’ Access to Private Equity in China: The Role of Social Capital.” Organization Science 15 (2): 159–72.

32
Baumol, William J. 1968. “Entrepreneurship in Economic Theory”, American Economic Review 58 (2): 64-71.
———. 1990. “Entrepreneurship: Productive, Unproductive, and Destructive.” Journal of Business Venturing 98 (5): 893–921.
Becker, Gary S., and Kevin M. Murphy. 1992. “The Division of Labor, Coordination Costs, and Knowledge.” Quarterly Journal of Economics 107 (4): 1137-60.
Begley, Thomas M., Wee-Liang Tan, and Herbert Schoch. 2005. “Politico-Economic Factors Associated with Interest in Starting a Business: A Multi-Country Study.” Entrepreneurship Theory and Practice 29 (1): 35–55.
Blomström, Magnus, Ari Kokko, and Mario Zejan. 2000. Foreign Direct Investment: Firm and Host Country Strategies. New York: Palgrave Macmillan.
Bosma, Niels, André van Stel, and Kashifa Suddle. 2008. “The Geography of New Firm Formation: Evidence from Independent Start-Ups and New Subsidiaries in the Netherlands” International Entrepreneurship and Management Journal 4 (2): 129-46.
Breznitz, Dan, and Michael Murphree. 2011. Run of the Red Queen: Government, Innovation, Globalization, and Economic Growth in China. New Haven, CT: Yale University Press.
Buckley, Peter J., Jeremy Clegg, and Chengqi Wang. 2007. “Is the Relationship between Inward FDI and Spillover Effects Linear? An Empirical Examination of the Case of China.” Journal of International Business Studies 38 (3): 447–59.
Burke, Andrew, and André van Stel. 2014. “Entry and Exit in Disequilibrium.” Journal of Business Venturing 29 (1): 174–92.
Carree, Martin A., and A. Roy Thurik. 2010. “The Impact of Entrepreneurship on Economic Growth.” In Handbook of Entrepreneurship Research, edited by Zoltan J. Acs and David B. Audretsch, 557-94. Berlin/Heidelberg: Springer Verlag.
Caves, Richard E. 1996. Multinational Enterprise and Economic Analysis (Second Edition). Cambridge: Cambridge University Press.
Chang, Sea J., and Dean Xu. 2008. “Spillovers and Competition among Foreign and Local Firms in China.” Strategic Management Journal 29 (5): 495–518.
Chen, Chao C., Xiao-Ping Chen, and Shengsheng Huang. 2013. “Chinese Guanxi : An Integrative Review and New Directions for Future Research.” Management and Organization Review 9 (1): 167–207.
Chen, Charles J.P., Yuan Ding, and Chansog (Francis) Kim. 2010. “High-Level Politically Connected Firms, Corruption, and Analyst Forecast Accuracy around the World.” Journal of International Business Studies 41 (9): 1505–24.
Chow, Gregory C. 1993. “Capital Formation and Economic Growth in China”, Quarterly Journal of Economics 108 (3): 809–842.
Chuang, Yih-Chyi, and Pi-Fum Hsu. 2004. “FDI, Trade, and Spillover Efficiency: Evidence from China’s Manufacturing Sector.” Applied Economics 36 (10): 1103–15.
Congregado, Emilio, ed. 2008. Measuring Entrepreneurship (International Studies in Entrepreneurship series, Vol. 16), New York: Springer Science.
33
Cornell University, INSEAD, & WIPO. 2013. The Global Innovation Index 2013: The Local Dynamics of Innovation, Geneva, Ithaca, and Fontainebleau.
Cull, Robert, and Lixin C. Xu. 2005. “Institutions, Ownership, and Finance: The Determinants of Profit Reinvestment among Chinese Firms.” Journal of Financial Economics 77 (1): 117–46.
Davies, Howard, and Peter Walters. 2004. “Emergent Patterns of Strategy, Environment and Performance in a Transition Economy.” Strategic Management Journal 25 (4): 347–64.
De Backer, Koen, and Leo Sleuwaegen. 2003. “Does Foreign Direct Investment Crowd out Domestic Entrepreneurship?” Review of Industrial Organization 22 (2): 67–84.
Djankov, Simeon, Yingyi Qian, Gérard Roland, and Ekaterina Zhuravskaya. 2006. “Who Are China’s Entrepreneurs?” American Economic Review 96 (2): 348–52.
Estrin, Saul, Klaus E. Meyer, and Maria Bytchkova. 2006. “Entrepreneurship in Transition Economies.” In The Oxford Handbook of Entrepreneurship, edited by Mark Casson, Bernard Yeung, Anuradha Basu and Nigel Wadeson, 693-725. Oxford: Oxford University Press.
Fan, G., X.L. Wang, and H.P. Zhu. 2010. Marketization Index in China: The Regional Process Report of 2009. Beijing: Economic Science Press (in Chinese).
Feinberg, Susan E., and Sumit K. Majumdar. 2001. “Technology Spillovers from Foreign Direct Investment in the Indian Pharmaceutical Industry.” Journal of International Business Studies 32 (3): 421–37.
Fritsch Michael, and Pamela Mueller. 2004. “Effects of New Business Formation on Regional Development over Time.” Regional Studies 38 (8): 961-975.
Fu, Xiaolan. 2015. China’s Path to Innovation. Cambridge: Cambridge University Press.
Fu, Xiaolan, and Rongping Mu. 2014. “Enhancing China’s Innovation Performance: The Policy Choices.” China & World Economy 22 (2): 42–60.
Gao, Gerald Y., Janet Y. Murray, Masaaki Kotabe, and Jiangyong Lu. 2010. “A ‘Strategy Tripod’ Perspective on Export Behaviors: Evidence from Domestic and Foreign Firms Based in an Emerging Economy.” Journal of International Business Studies 41 (6): 377-96.
George, Gerard, and Ganesh N. Prabhu. 2000. “Developmental Financial Institutions as Catalysts of Entrepreneurship in Emerging Economies.” Academy of Management Review 25 (3): 620–29.
Gregory, Neil F., Stoyan Tenev, and Dileep M. Wagle. 2000. China’s Emerging Private Enterprises: Prospects for The New Century. Washington, DC: IFC.
Haddad, Mona, and Ann Harrison. 1993. “Are There Positive Spillovers from Direct Foreign Investment?: Evidence from Panel Data for Morocco.” Journal of Development Economics 42 (1): 51-74.
Hitt, Michael A., David Ahlstrom, M. Tina Dacin, Edward Levitas, and Lilia Svobodina. 2004. “The Institutional Effects on Strategic Alliance Partner

34
Selection in Transition Economies: China vs. Russia.” Organization Science 15 (2): 173–85.
Huang, Yasheng. 2010. “Debating China’s Economic Growth: The Beijing Consensus or The Washington Consensus.” Academy of Management Perspectives 24 (2): 31–47.
Jovanovic, Boyan. 1982. “Selection and the Evolution of Industry.” Econometrica 50 (3): 649–70.
Kaish, Stanley, Benjamin Gilad, Roger Frantz, Horst Sing, and James Gerber. 1991. Handbook of Behavioral Economics (Vol. 2). Greenwich, CT: JAI Press.
Lau, Chung-Ming and Lowell W. Busenitz. 2001. “Growth Intentions of Entrepreneurs in a Transition Economy: The People’s Republic of China.” Entrepreneurship: Theory & Practice 26 (1): 5–20.
Li, Haiyang, and Kwaku Atuahene-Gima. 2001. “Product Innovation Strategy and the Performance of New Technology Ventures in China.” Academy of Management Journal 44 (6): 1123–34.
Liao, Debbie, and Philip Sohmen. 2001. “The Development of Modern Entrepreneurship in China.” Stanford Journal of East Asian Affairs 1: 27–33.
Lin, Xiaohua, and Richard Germain. 2003. “Organizational Structure, Context, Customer Orientation, and Performance: Lessons from Chinese State-Owned Enterprises.” Strategic Management Journal 24 (11): 1131–51.
Lu, Jiangyong, and Zhigang Tao. 2010. “Determinants of Entrepreneurial Activities in China.” Journal of Business Venturing 25 (3): 261–73.
Lucas, Robert E. Jr. 1978. “On the Size Distribution of Business Firms.” The Bell Journal of Economics 9 (2): 508–23.
Madariaga, Nicole, and Sandra Poncet. 2007. “FDI in Chinese Cities: Spillovers and Impact on Growth.” World Economy 30 (5): 837–62.
Markusen, James R., and Anthony J. Venables. 1999. “Foreign Direct Investment as a Catalyst for Industrial Development.” European Economic Review 43 (2): 335–56.
Millán, José María, Emilio Congregado, Concepción Román, Mirjam van Praag, and André van Stel. 2014. “The Value of an Educated Population for an Individual’s Entrepreneurship Success.” Journal of Business Venturing 29 (5): 612–32.
NBSC. 2009. http://www.stats.gov.cn/. National Bureau of Statistics of China. Oi, Jean C. 1995. “The Role of the Local State in China’s Transitional Economy.”
The China Quarterly 144: 1132-49. Okamuro, Hiroyuki. 2008. “How Different Are the Regional Factors of High-Tech
and Low-Tech Start-Ups? Evidence from Japanese Manufacturing Industries.” International Entrepreneurship and Management Journal 4 (2): 199–215.
Porter, Michael E., Jeffrey D. Sachs, and John W. McArthur. 2002. “Competitiveness and Stages of Economic Development.” In The Global Competitiveness Report 2001-2002, edited by M.E. Porter, J.D. Sachs, P.K. Cornelius, J.W. McArthur and K. Schwab, 16–25. New York: Oxford University Press.

35
Qian, Yingyi. 2000. “The Process of China’s Market Transition (1978-1998): The Evolutionary, Historical, and Comparative Perspectives.” Journal of Institutional and Theoretical Economics 156 (1): 151–71.
Reynolds, Paul, David J. Storey, and Paul Westhead. 1994. “Cross-National Comparisons of the Variation in New Firm Formation Rates.” Regional Studies 28 (4): 443–56.
Rodriguez-Clare, Andres. 1996. “Multinationals , Linkages , and Economic Development.” American Economic Review 86 (4): 852–73.
Schotter, Andreas, and Paul W. Beamish. 2011. “General Manager Staffing and Performance in Transitional Economy Subsidiaries: A Subnational Analysis.” International Studies of Management and Organization 41 (2): 55–87.
Shane, Scott. 2000. Prior Knowledge and the Discovery of Entrepreneurial Opportunities, Organization Science 11 (4): 448-69.
———. 2009. “Why Encouraging More People to Become Entrepreneurs Is Bad Public Policy.” Small Business Economics 33 (2): 141–49.
Shi, Weilei S., Sunny L. Sun, and Mike W. Peng. 2012. “Sub-National Institutional Contingencies, Network Positions, and IJV Partner Selection.” Journal of Management Studies 49 (7): 1221–45.
Stiglitz, Joseph E., and Shahid Yusuf, eds. 2001. Rethinking the East Asian Miracle. Oxford: Oxford University Press.
Thurik, A. Roy, Erik Stam, and David B. Audretsch. 2013. “The Rise of the Entrepreneurial Economy and the Future of Dynamic Capitalism.” Technovation 33 (8-9): 302–10.
Tian, Xiaowen. 2007. “Accounting for Sources of FDI Technology Spillovers: Evidence from China.” Journal of International Business Studies 38 (1): 147–59.
Van Praag, Mirjam. 2005. Successful Entrepreneurship: Confronting Economic Theory with Empirical Practice. Cheltenham, UK: Edward Elgar.
Van Praag, Mirjam, and André van Stel. 2013. “The More Business Owners, the Merrier? The Role of Tertiary Education.” Small Business Economics 41 (2): 335–57.
Van Stel, André, José María Millán, and Concepción Román. 2014. “Investigating the Impact of the Technological Environment on Survival Chances of Employer Entrepreneurs.” Small Business Economics 43 (4): 839-55.
Vandenbussche, Jérôme, Philippe Aghion, and Costas Meghir. 2006. “Growth, Distance to Frontier and Composition of Human Capital.” Journal of Economic Growth 11 (2): 97–127.
Wennekers, Sander, Roy Thurik, André van Stel, and Niels Noorderhaven. 2007. “Uncertainty Avoidance and the Rate of Business Ownership across 21 OECD Countries, 1976-2004.” Journal of Evolutionary Economics 17 (2): 133-60.
Wheeler, Christopher H. 2001. “Search, Sorting, and Urban Agglomeration.” Journal of Labor Economics 19 (4): 879–99.
World Bank. 1993. The East Asian Miracle: Economic Growth and Public Policy. World Development Report. New York: Oxford University Press.
36
———. 2013. Doing Business 2014: Understanding Regulations for Small and Medium-Size Enterprises. Washington, DC: World Bank Group.
Xing, Yuqing. 2010. “Facts About and Impacts of FDI on China and the World Economy.” China: An International Journal 8 (2): 309–27.
Xu, Dean, Jane W. Lu, and Qian Gu. 2014. “Organizational Forms and Multi-Population Dynamics: Economic Transition in China.” Administrative Science Quarterly 59 (3): 517–47.
Yang, Jing Yu, and Jiatao Li. 2008. “The Development of Entrepreneurship in China.” Asia Pacific Journal of Management 25 (2): 335–59.
Yang, Jing Yu, Frank B. Tipton, and Jiatao Li. 2011. “A Review of Foreign Business Management in China.” Asia Pacific Journal of Management 28 (3): 627–59.
Young, Susan. 1995. Private Business and Economic Reform in China. New York: M.E. Sharpe.
Zellner, Arnold. 1962. “An Efficient Method of Estimating Seemingly Unrelated Regressions and Tests for Aggregation Bias.” Journal of the American Statistical Association 57 (298): 348–68.
———. 1963. “Estimators for Seemingly Unrelated Regression Equations: Some Exact Finite Sample Results.” Journal of the American Statistical Association 58 (304): 977–92.
Zhou, Wubiao. 2011. “Regional Deregulation and Entrepreneurial Growth in China’s Transition Economy.” Entrepreneurship & Regional Development 23 (9-10): 853–76.
———. 2014. “Regional Institutional Development, Political Connections, and Entrepreneurial Performance in China’s Transition Economy.” Small Business Economics 43 (1): 161–81.
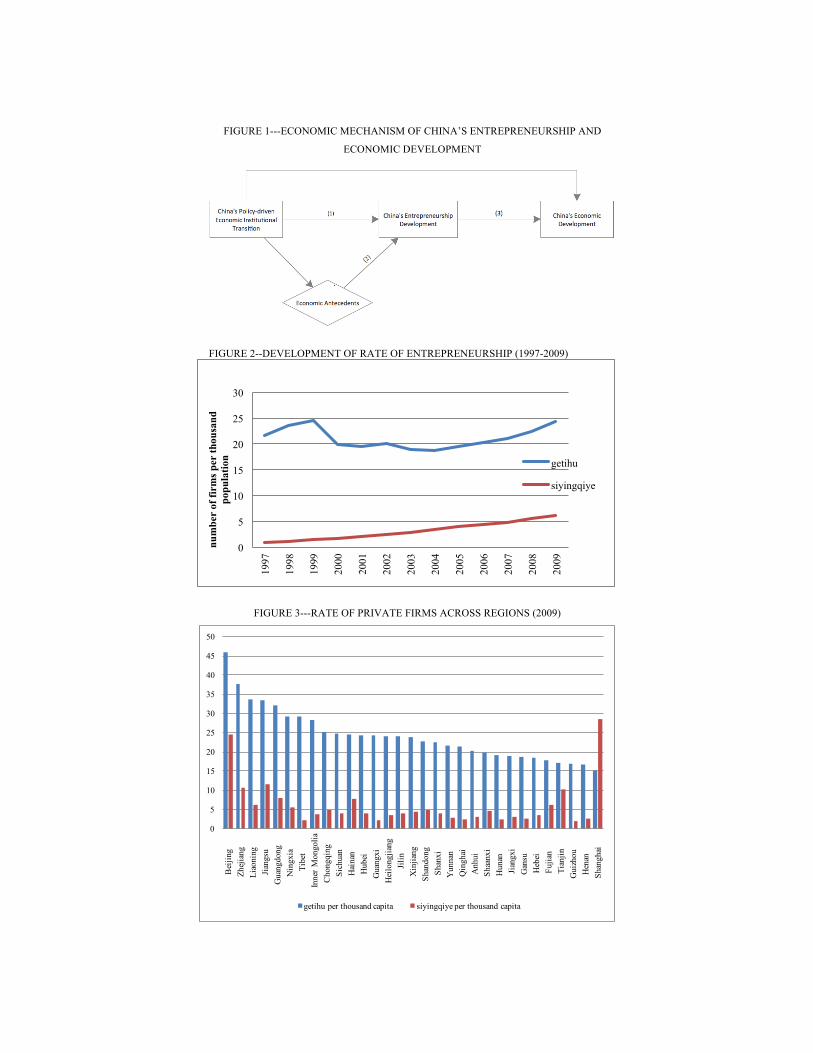
FIGURE 1---ECONOMIC MECHANISM OF CHINA’S ENTREPRENEURSHIP AND
ECONOMIC DEVELOPMENT
FIGURE 2--DEVELOPMENT OF RATE OF ENTREPRENEURSHIP (1997-2009)
FIGURE 3---RATE OF PRIVATE FIRMS ACROSS REGIONS (2009)
0
5
10
15
20
25
30
1997
1998
1999
2000
2001
2002
2003
2004
2005
2006
2007
2008
2009
num
ber
of fi
rms
per
thou
sand
po
pula
tion getihu
siyingqiye
0
5
10
15
20
25
30
35
40
45
50
Bei
jing
Zhej
iang
Liao
ning
Jian
gsu
Gua
ngdo
ng
N
ingx
ia
Tibe
t
Inne
r M
ongo
liaC
hong
qing
Sich
uan
Hai
nan
H
ubei
G
uang
xi
Hei
long
jiang
Ji
lin
Xin
jiang
Shan
dong
Shan
xi
Yun
nan
Q
ingh
ai
Anh
ui
Shaa
nxi
Hun
an
Jian
gxi
Gan
su
Heb
ei
Fujia
n
Tian
jin
Gui
zhou
H
enan
Sh
angh
ai
getihu per thousand capita siyingqiye per thousand capita
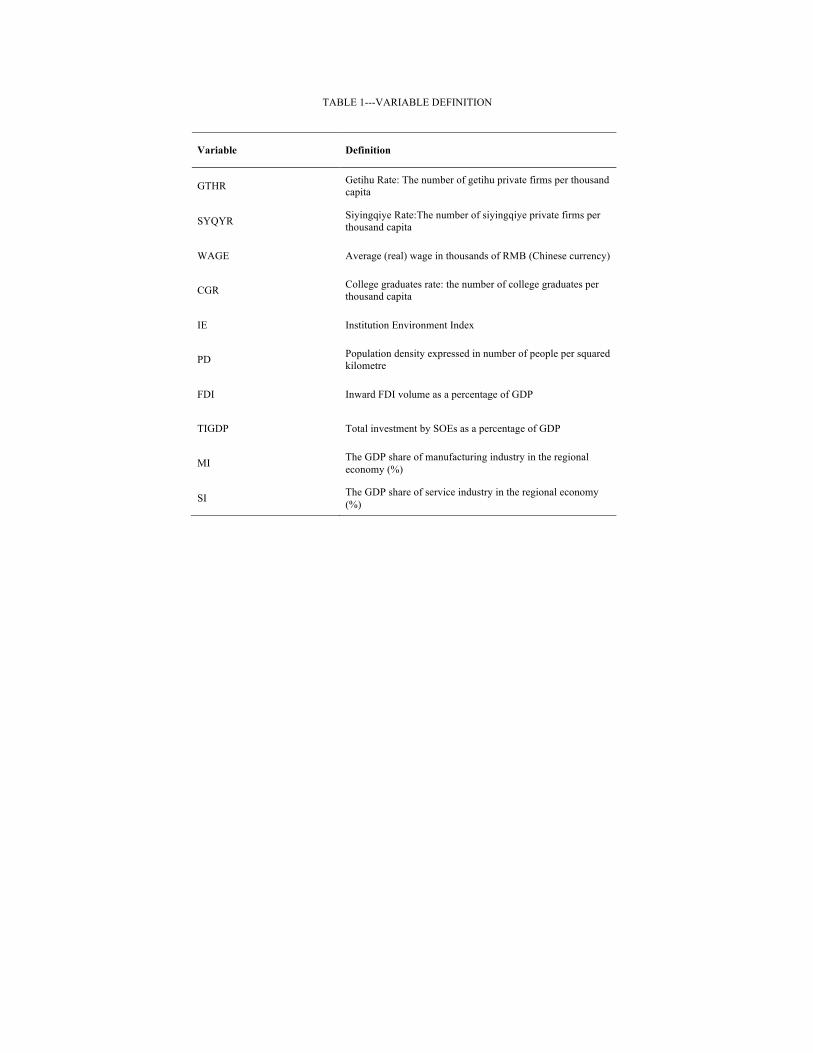
TABLE 1---VARIABLE DEFINITION
Variable Definition
GTHR Getihu Rate: The number of getihu private firms per thousand capita
SYQYR Siyingqiye Rate:The number of siyingqiye private firms per thousand capita
WAGE Average (real) wage in thousands of RMB (Chinese currency)
CGR College graduates rate: the number of college graduates per thousand capita
IE Institution Environment Index
PD Population density expressed in number of people per squared kilometre
FDI Inward FDI volume as a percentage of GDP
TIGDP Total investment by SOEs as a percentage of GDP
MI The GDP share of manufacturing industry in the regional economy (%)
SI The GDP share of service industry in the regional economy (%)

TABLE 2---SUR ANALYSIS OF ECONOMIC ANTECEDENTS OF
ENTREPRENEURSHIP DEVELOPMENT:����FIXED EFFECTS MODEL FOR 1998-2009
VARIABLE GTHR SYQYR
(1) (2)
SYQYR(t-1) 1.7495***
(0.254)
GTHR(t-1) 0.0666***
(0.008)
WAGE(t-1) 0.7051*** 0.2153***
(0.195) (0.033)
CGR(t-1) -1.8526*** 0.3558***
(0.549) (0.098)
IE(t-1) 0.7363 0.5382***
(0.519) (0.091)
PD(t-1) -0.0376*** 0.0119***
(0.005) (0.001)
FDI(t-1) 0.0860 -0.0230**
(0.059) (0.011)
TIGDP(t-1) -0.0406 -0.0215***
(0.038) (0.007)
MI(t-1) 0.1904 -0.0888***
(0.162) (0.029)
SI(t-1) 0.2493 -0.0333
(0.169) (0.031)
Constant 9.8999*** 0.0471
(1.518) (0.279)
Region Fixed Effects YES YES
Year Fixed Effects YES YES
Mean_DV 21.1 3.1
Observations 369 369
R-squared 0.382 0.899
Standard errors in parentheses *** p<0.01, ** p<0.05, * p<0.1 Mean_DV: Mean of dependent variable for estimation sample
TABLE 3---SUR ANALYSIS OF ECONOMIC ANTECEDENTS OF
ENTREPRENEURSHIP DEVELOPMENT: POOLED MODEL FOR 1998, 2003 AND
2009
VARIABLE GTHR SYQYR
(1) (2)
SYQYR(t-1) 1.8487***
(0.392)
GTHR(t-1) 0.1019***
(0.022)
WAGE(t-1) -0.0373 0.2943***
(0.259) (0.061)
CGR(t-1) -0.3929 0.3934**
(0.628) (0.161)
IE(t-1) 0.6748 0.4202***
(0.531) (0.132)
PD(t-1) -0.0142*** 0.0038***
(0.002) (0.000)
FDI(t-1) 0.0260 -0.0342*
(0.071) (0.018)
TIGDP(t-1) 0.0400 -0.0299*
(0.064) (0.016)
MI(t-1) 0.2952** -0.0947***
(0.116) (0.031)
SI(t-1) 0.2440 -0.0073
(0.196) (0.052)
Constant -9.062 -1.596
(9.606) (2.526)
Region Fixed Effects NO NO
Year Fixed Effects YES YES
Mean_DV 21.6 3.3
Observations 92 92
R-squared 0.414 0.893
Standard errors in parentheses *** p<0.01, ** p<0.05, * p<0.1 Mean_DV: Mean of dependent variable for estimation sample
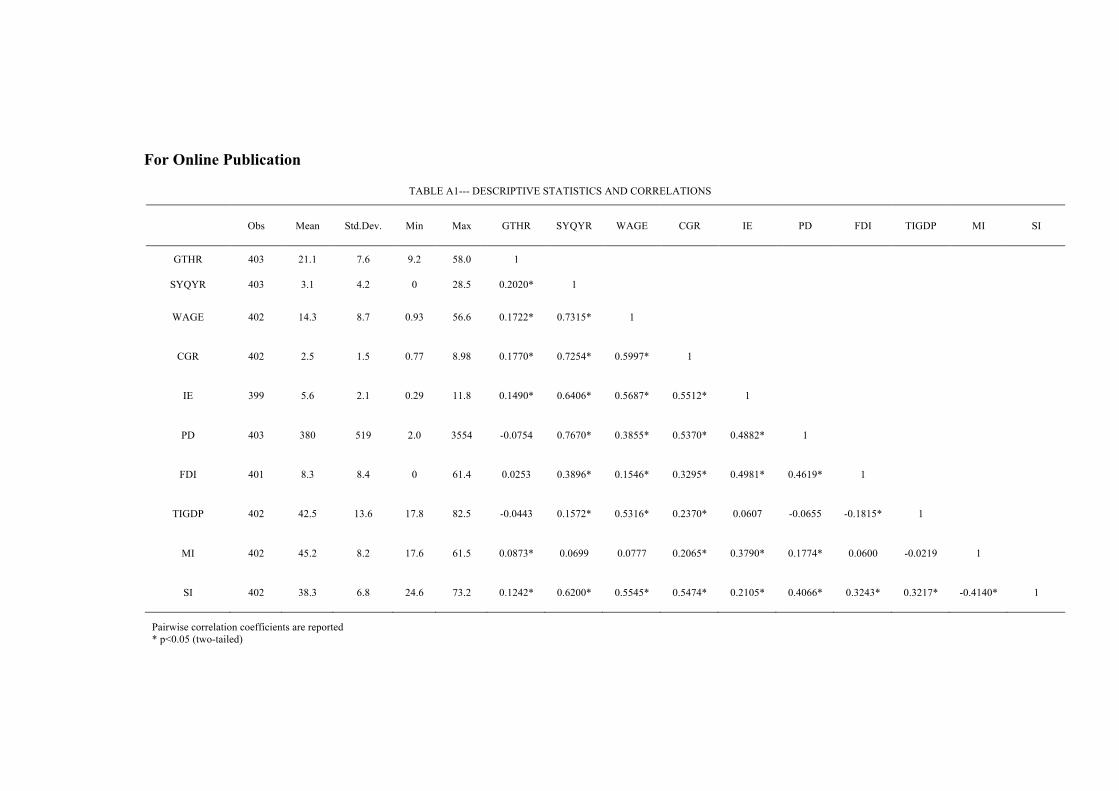
For Online Publication
TABLE A1--- DESCRIPTIVE STATISTICS AND CORRELATIONS
Obs Mean Std.Dev. Min Max GTHR SYQYR WAGE CGR IE PD FDI TIGDP MI SI
GTHR 403 21.1 7.6 9.2 58.0 1
SYQYR 403 3.1 4.2 0 28.5 0.2020* 1
WAGE 402 14.3 8.7 0.93 56.6 0.1722* 0.7315* 1
CGR 402 2.5 1.5 0.77 8.98 0.1770* 0.7254* 0.5997* 1
IE 399 5.6 2.1 0.29 11.8 0.1490* 0.6406* 0.5687* 0.5512* 1
PD 403 380 519 2.0 3554 -0.0754 0.7670* 0.3855* 0.5370* 0.4882* 1
FDI 401 8.3 8.4 0 61.4 0.0253 0.3896* 0.1546* 0.3295* 0.4981* 0.4619* 1
TIGDP 402 42.5 13.6 17.8 82.5 -0.0443 0.1572* 0.5316* 0.2370* 0.0607 -0.0655 -0.1815* 1
MI 402 45.2 8.2 17.6 61.5 0.0873* 0.0699 0.0777 0.2065* 0.3790* 0.1774* 0.0600 -0.0219 1
SI 402 38.3 6.8 24.6 73.2 0.1242* 0.6200* 0.5545* 0.5474* 0.2105* 0.4066* 0.3243* 0.3217* -0.4140* 1
Pairwise correlation coefficients are reported * p<0.05 (two-tailed)
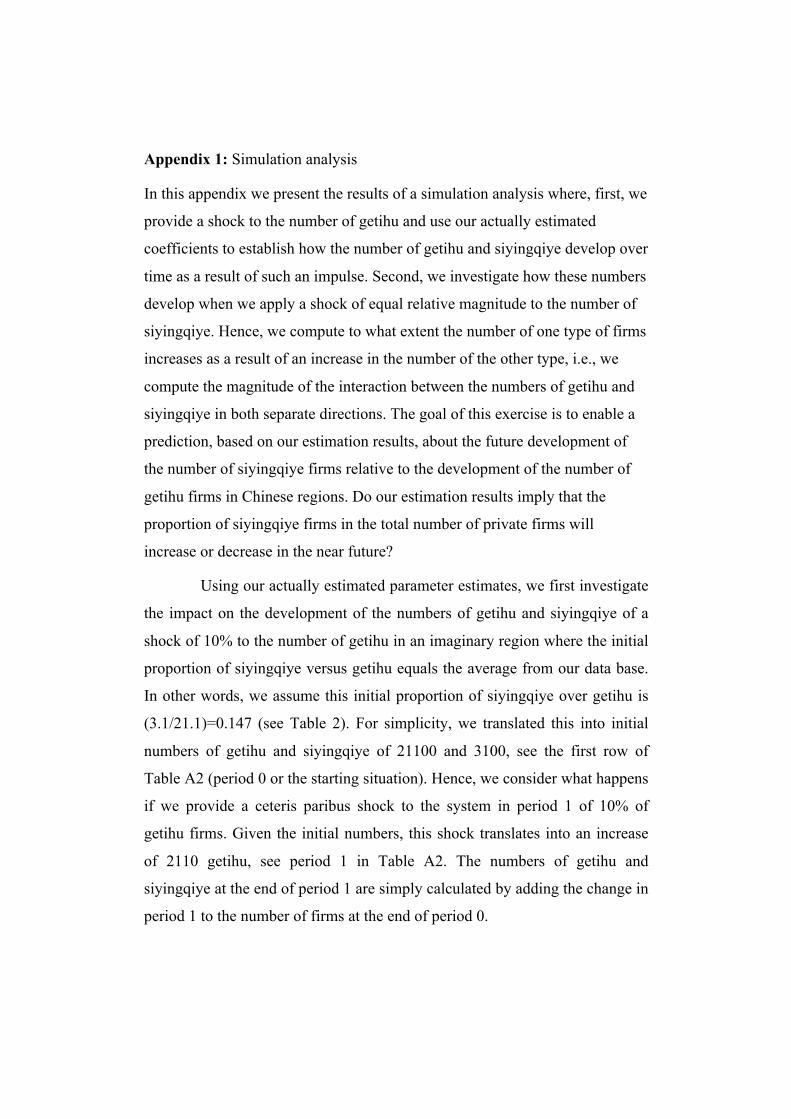
Appendix 1: Simulation analysis
In this appendix we present the results of a simulation analysis where, first, we
provide a shock to the number of getihu and use our actually estimated
coefficients to establish how the number of getihu and siyingqiye develop over
time as a result of such an impulse. Second, we investigate how these numbers
develop when we apply a shock of equal relative magnitude to the number of
siyingqiye. Hence, we compute to what extent the number of one type of firms
increases as a result of an increase in the number of the other type, i.e., we
compute the magnitude of the interaction between the numbers of getihu and
siyingqiye in both separate directions. The goal of this exercise is to enable a
prediction, based on our estimation results, about the future development of
the number of siyingqiye firms relative to the development of the number of
getihu firms in Chinese regions. Do our estimation results imply that the
proportion of siyingqiye firms in the total number of private firms will
increase or decrease in the near future?
Using our actually estimated parameter estimates, we first investigate
the impact on the development of the numbers of getihu and siyingqiye of a
shock of 10% to the number of getihu in an imaginary region where the initial
proportion of siyingqiye versus getihu equals the average from our data base.
In other words, we assume this initial proportion of siyingqiye over getihu is
(3.1/21.1)=0.147 (see Table 2). For simplicity, we translated this into initial
numbers of getihu and siyingqiye of 21100 and 3100, see the first row of
Table A2 (period 0 or the starting situation). Hence, we consider what happens
if we provide a ceteris paribus shock to the system in period 1 of 10% of
getihu firms. Given the initial numbers, this shock translates into an increase
of 2110 getihu, see period 1 in Table A2. The numbers of getihu and
siyingqiye at the end of period 1 are simply calculated by adding the change in
period 1 to the number of firms at the end of period 0.

In period 2, the lagged interaction effect of the shock to the number
of getihu is emerging. In particular, the number of siyingqiye changes with
0.0666 times 2110 (see Table 2, model (14), and period 1 in Table A2 below),
equaling 141.1 In contrast, the number of getihu does not change in period 2
because the change in the number of siyingqiye in the previous period (1) was
0. The numbers of getihu and siyingqiye at the end of period 2 are again
calculated by adding these changes to the number of firms from the previous
period. In period 3 the number of getihu changes with 1.7495*141=246. In the
periods that follow, there are still delayed effects on the number of firms of the
shock in period 1 but the effects fade away over time. Indeed, as can be seen
from Table A2, from period 8 onwards, the change in both the numbers of
getihu and siyingqiye is zero and the new equilibrium situation has been
reached.
It is now interesting to compare the numbers of getihu and siyingqiye
in the new equilibrium and the old equilibrium and consider the relative
change in these numbers. We then see in Table A2 that, as a result of the
initial shock of 10% to the number of getihu firms, the number of siyingqiye
has increased with 5.1%. This corresponds to an elasticity of 0.51, implying a
substantial impact of the number of getihu on the number of siyingqiye. Note
that in the new equilibrium, the number of getihu has increased with 11%, but
10% out of this 11% change is due to the initial shock.
The second exercise is similar to the first one, but instead of applying
a shock of 10% to the number of getihu, we apply a shock of 10% to the
number of siyingqiye. Results are in Table A3. Here we see that in the new
equilibrium, as a result of the initial shock of 10% to the number of siyingqiye
firms, the number of getihu has increased with 2.9%, corresponding to an
elasticity of 0.29.
1 Note that the fixed effects nature of the estimation model (i.e., the consideration of variations over time) requires us to apply the coefficients to the changes in the number of firms, instead of the levels.

Hence, the relative impact of getihu on siyingqiye (elasticity 0.51) is
much bigger than the reverse impact of siyingqiye on getihu (elasticity 0.29),
implying that the number of siyingqiye will increase much faster as a result of
a given increase in getihu, than the number of getihu will as a result of an
increase in siyingqiye of similar magnitude (+10%, in this example). Leaving
aside the influences of other independent variables (i.e., ceteris paribus), our
empirical analysis therefore predicts that, as a result of the mutual interaction
between the two types of firms, the proportion of siyingqiye relative to getihu
will increase in the near future, or in other words, our analysis predicts that the
number of siyingqiye will grow relatively faster than the number of getihu.
This, in turn, implies that the gap between the number of siyingqiye and getihu
will decrease in the near future.
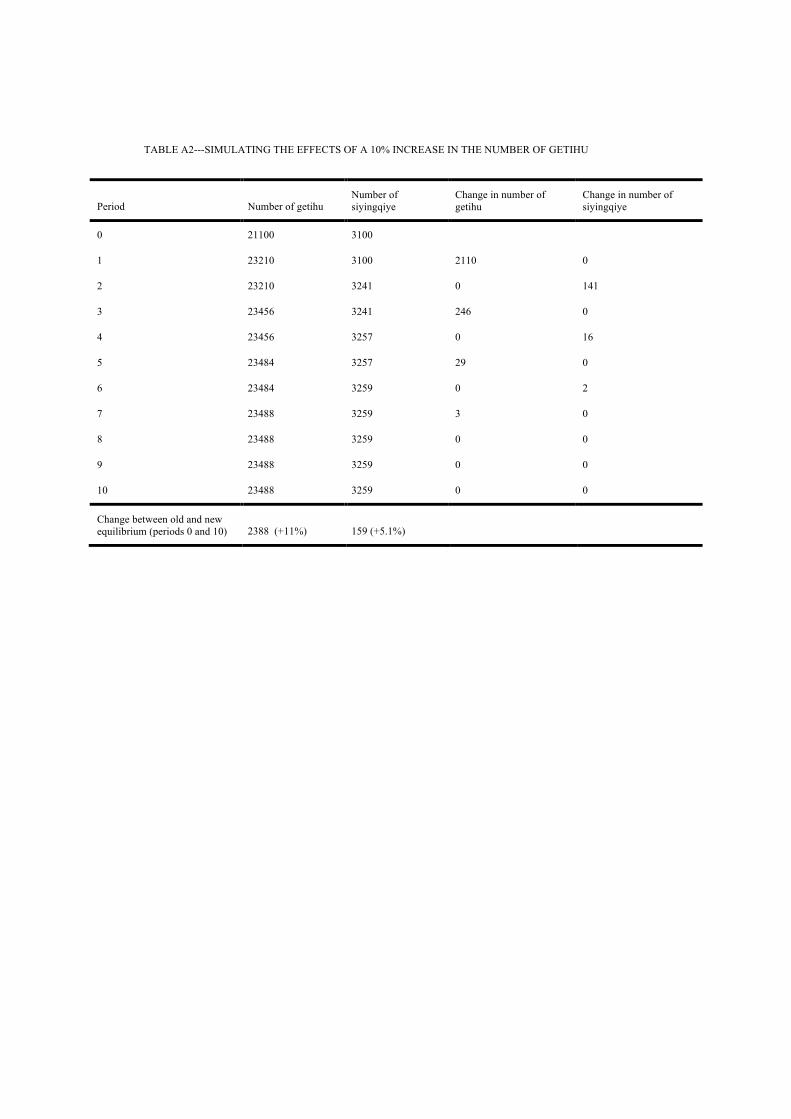
TABLE A2---SIMULATING THE EFFECTS OF A 10% INCREASE IN THE NUMBER OF GETIHU
Period Number of getihu Number of siyingqiye
Change in number of getihu
Change in number of siyingqiye
0 21100 3100
1 23210 3100 2110 0
2 23210 3241 0 141
3 23456 3241 246 0
4 23456 3257 0 16
5 23484 3257 29 0
6 23484 3259 0 2
7 23488 3259 3 0
8 23488 3259 0 0
9 23488 3259 0 0
10 23488 3259 0 0
Change between old and new equilibrium (periods 0 and 10) 2388 (+11%) 159 (+5.1%)

TABLE A3: SIMULATING THE EFFECTS OF A 10% INCREASE IN THE NUMBER OF SIYINGQIYE
Period Number of getihu Number of siyingqiye
Change in num-ber of getihu
Change in num-ber of siyingqiye
0 21100 3100
1 21100 3410 0 310
2 21642 3410 542 0
3 21642 3446 0 36
4 21706 3446 63 0
5 21706 3450 0 4
6 21713 3450 7 0
7 21713 3451 0 0
8 21714 3451 1 0
9 21714 3451 0 0
10 21714 3451 0 0
Change between old and new equilibrium (periods 0 and 10) 614 (+2.9%) 351 (+11%)


![CENTERITY SERVICE PACK FOR CLOUDERA€¦ · OOZIE [roles status] • CLOUDERA ROLES SOLR [roles status] • CLOUDERA ROLES SPARK [roles status] • CLOUDERA ROLES SQOOP [roles status]](https://cdn.vdocuments.net/doc/165x107/5fc0df6d43307a59a12ae0a7/centerity-service-pack-for-cloudera-oozie-roles-status-a-cloudera-roles-solr.jpg)
