
F.Lançon - CIRAD - World Rice Conference 2009 1
Will Growing Sub-Saharan African Rice Production Reduce
Imports?
Frédéric LançonARENA research unitCIRAD
World Rice Conference 2009Oct. 27-29 Cebu, PhilippinesShangri-La's Mactan Resort
[email protected] de coopérationinternationale en rechercheagronomique pour le développement

F.Lançon - CIRAD - World Rice Conference 2009 2
Plan of the presentation
1. The Recurring Sub-Saharan (SSA) rice challenge
2. Determining factors for promoting rice production development

F.Lançon - CIRAD - World Rice Conference 2009 3
1. The Recurring Sub-Saharan rice challenge

F.Lançon - CIRAD - World Rice Conference 2009 4
A renewed agenda for rice in SSA
Rice price surge put several SSA governments in a difficult political position:
Not able to ensure a steady supply of rice at affordable price.Limited capacity to address the issue at short term:
• Tariff and tax revision• Budgetary constraints
Renewed interest for expanding rice production since rice world market evolutions are unpredictable
F.Lançon - CIRAD - World Rice Conference 2009 5
Beyond the short term perspective…
Social unrests were not necessarily triggered by rice price increase on the world market.
Delay in transmission of priceSeveral countries had already considered revising their rice trade policy before the price surge:
Common Exterior Tariff negotiation within Economic Community of West African Sate
F.Lançon - CIRAD - World Rice Conference 2009 6
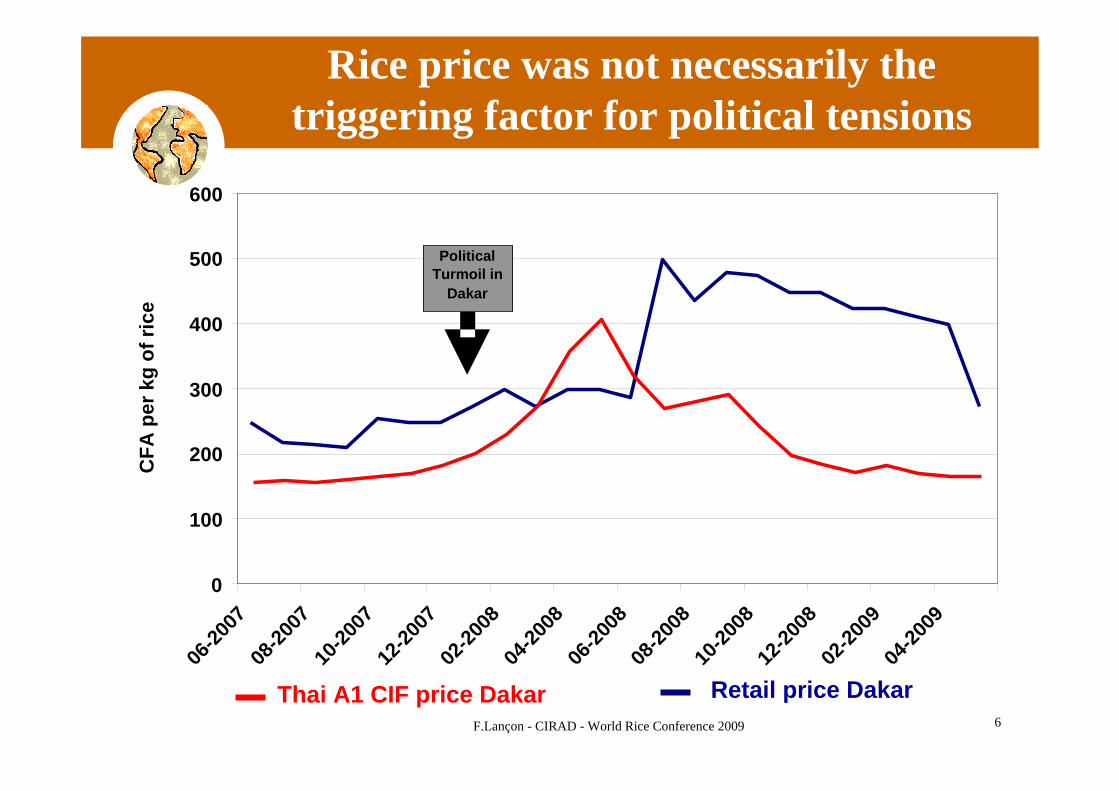
Rice price was not necessarily the triggering factor for political tensions
0
100
200
300
400
500
600
06-20
0708
-2007
10-20
0712
-2007
02-20
0804
-2008
06-20
0808
-2008
10-20
0812
-2008
02-20
0904
-2009
CFA
per
kg
of ri
ce
Retail price DakarThai A1 CIF price Dakar
PoliticalTurmoil in
Dakar
F.Lançon - CIRAD - World Rice Conference 2009 7
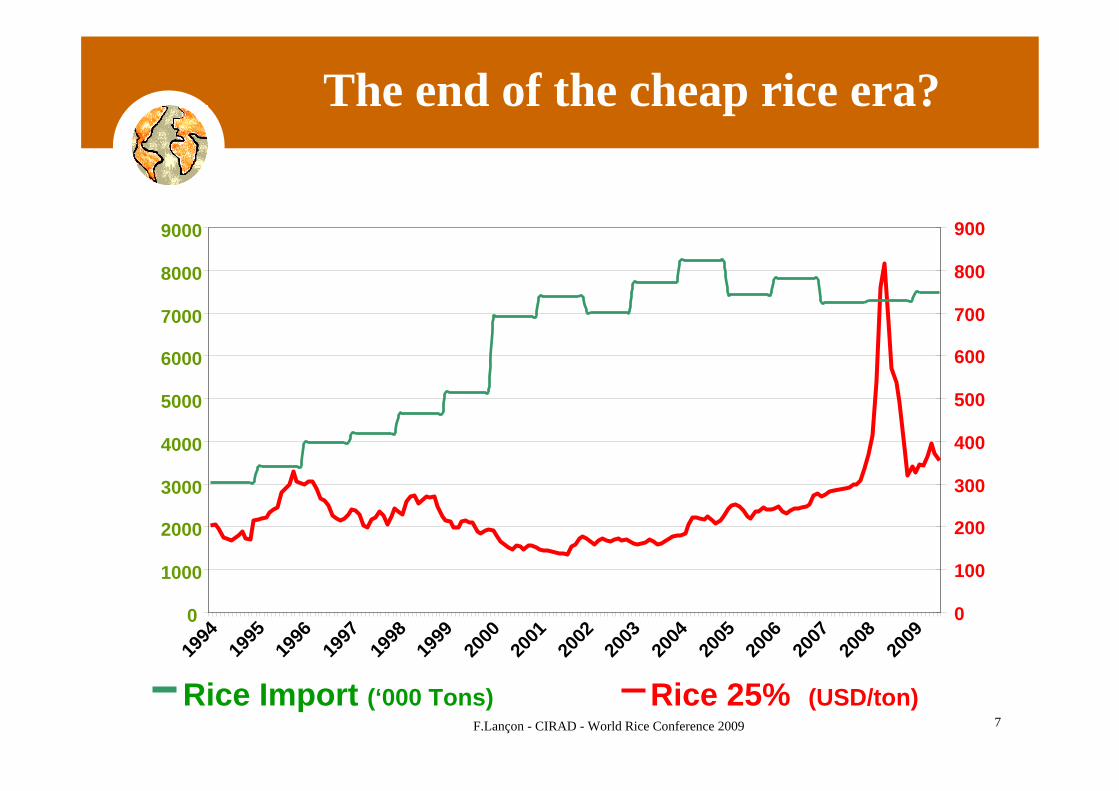
The end of the cheap rice era?
0
1000
2000
3000
4000
5000
6000
7000
8000
9000
1994
1995
1996
1997
1998
1999
2000
2001
2002
2003
2004
2005
2006
2007
2008
2009
0
100
200
300
400
500
600
700
800
900
Rice 25% (USD/ton)Rice Import (‘000 Tons)

F.Lançon - CIRAD - World Rice Conference 2009 8
Supply and demand trends (1990-2007)
Total SSA production increased at 4.8% per year:
Mostly because of area expansion: 3.8%Limited contribution of yield increase: 1%
Total SSA consumption increased at 5.4% per year due to:
Population growth: 2.5%And per capita consumption growth: 2.9%

F.Lançon - CIRAD - World Rice Conference 2009 9
Emerging markets and import dependency
Angola
BeninBurkina Faso
Cameroon
ChadCongo,
Côte d'Ivoire
Gambia
Ghana
GuineaGuinea-Bissau
KenyaLiberia
MadagascarMalawi Mali
MozambiqueNiger
Nigeria
Senegal
Sierra Leone
South Africa
Sudan
Tanzania
Togo
Zambia
0%
20%
40%
60%
80%
100%
120%
0 20 40 60 80 100 120 140
Per capita consumption (kg)
Import share in total supply
%

F.Lançon - CIRAD - World Rice Conference 2009 10
An accelerated rice growth in East Africa, but…
0%1%2%3%4%5%6%7%8%9%
Growth rate
1990 - 19992000 - 2007-9%
-7%-5%-3%-1%1%3%5%7%9%
Western Eastern Middle Southern
Total Consumption
Production

F.Lançon - CIRAD - World Rice Conference 2009 11
….West Africa is still dominant
Total production: 14 200 000 tons
Average values 2000 -2009FAOSTAT
Western63%
Eastern25%
Middle6%
Southern6%
Western66%
Eastern15%
Middle8%
Southern11%
Total imports: 7 200 000 tons
F.Lançon - CIRAD - World Rice Conference 2009 12
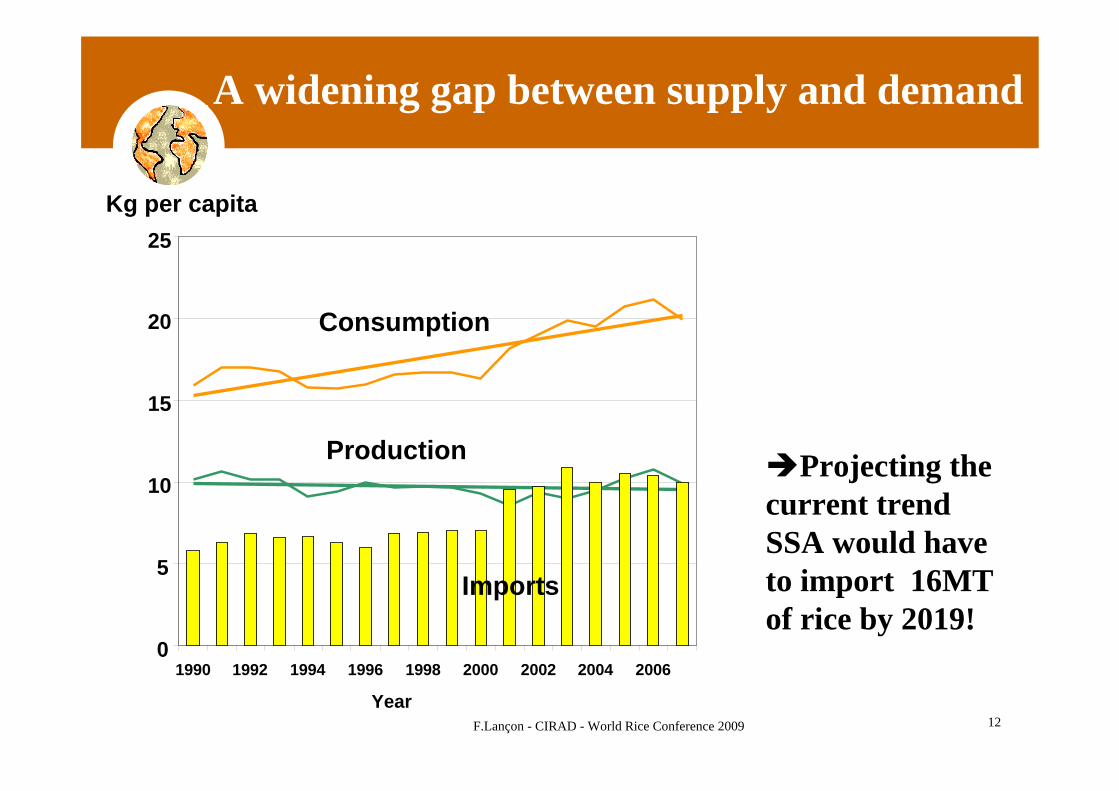
A widening gap between supply and demand
0
5
10
15
20
25
1990 1992 1994 1996 1998 2000 2002 2004 2006
Year
Kg per capita
Imports
Production
Consumption
Projecting the current trend SSA would have to import 16MT of rice by 2019!

F.Lançon - CIRAD - World Rice Conference 2009 13
Is per capita rice consumption growth reversible?
Example of CFA devaluation:Reduction of other staple and side dishes.
Substitution with other staples is limited due:to the higher convenience of rice compared to other
staples,unstable supply in urban markets of locally produced
staples.
Focus should be put on rice domestic supply and diet diversification.

F.Lançon - CIRAD - World Rice Conference 2009 14
1. The Recurring Sub-Saharan rice challenge
2. Determining factors for promoting rice production development.

F.Lançon - CIRAD - World Rice Conference 2009 15
Determining factors for a Sub-Saharan Rice Strategy
1. Technology development2. Cost-effectiveness of proposed
technical solutions: the macro-economic setting.
3. Institutional changes and enabling environment for building a competitive market for local rice.

F.Lançon - CIRAD - World Rice Conference 2009 16
Managing a wide range of rice cropping systems
Water table
-Dry Land-Rainfed
-HydromorphIc - Low Land - Swamp-Flooded
-Simple low land
-Improved low-land
- Irrigated
source: WARDA – 1999

F.Lançon - CIRAD - World Rice Conference 2009 17
Non-irrigated systems are dominant
Agro- ecologicalzones Swamp Flooded Irrigated
Inlandvalley Rainfed Total
Savana and Sahel 0.1% 4.5% 7.5% 1.8% 0.2% 14.1%Humid 3.1% 3.7% 3.1% 28.3% 47.8% 85.9%Total 3.2% 8.1% 10.6% 30.1% 48.0% 100.0%
Savana and Sahel 0.2% 2.7% 20.4% 2.2% 0.1% 25.5%Humid 3.7% 2.2% 5.6% 34.1% 28.9% 74.5%Total 3.9% 4.9% 25.9% 36.3% 29.0% 100.0%
Areas
Production
West Africa
Source, WARDA, 1998

F.Lançon - CIRAD - World Rice Conference 2009 18
Technology development
It is a challenging task (long term)Promising opportunities provided by the dissemination of the NERICA (New Rice for Africa)Other technologies have been developed for improving , pest and crop management.
Yet, other determining factors may hindered the SSA countries capacities to benefit from the NERICA

F.Lançon - CIRAD - World Rice Conference 2009 19
CASAMANCE
RIVER SENEGAL
0,9
SIERRA LEONE NORTH
SIERRA LEONE SOUTH
CdI NORTH
CdI N- WEST
CdI WEST
CdI S-WEST
OFFICE DU NIGERMOPTI
SIKASSO
NIGER
Rice variable comparative advantages across West Africa

F.Lançon - CIRAD - World Rice Conference 2009 20
Cost effective technical solution
Largely determined by:Yield achievedPrevailing price on the world market
Better prospects for cost-effective technologies
Several ecologies are achieving better economic performance.Comparative advantage threshold is about USD 300 to USD 350 per ton of rice, FOB Bangkok.
F.Lançon - CIRAD - World Rice Conference 2009 21
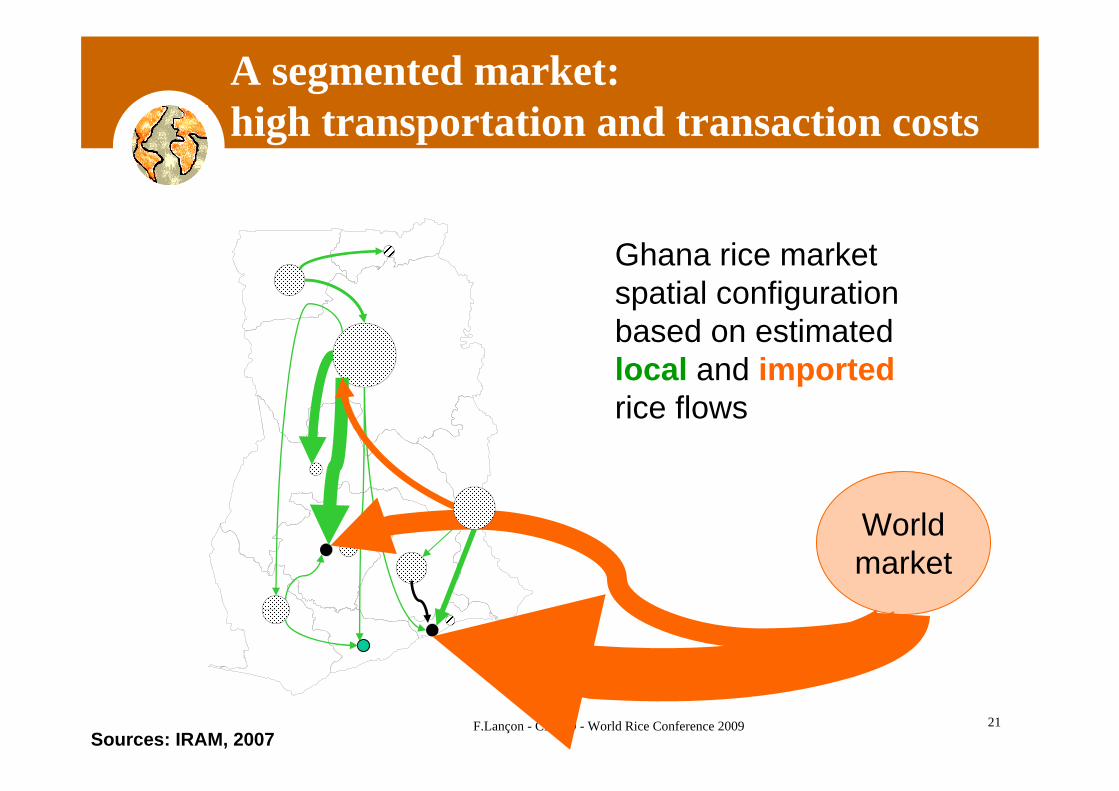
Northern
A segmented market: high transportation and transaction costs
World market
Ghana rice market spatial configuration based on estimated local and imported rice flows
Sources: IRAM, 2007

F.Lançon - CIRAD - World Rice Conference 2009 22
West African Consumers justifications for purchasing imported rice
0%
10%
20%
30%
40%
50%
60%
70%
80%
90%
100%
COTE D’IVOIRE NIGERIA
Other organolepticproperties
Nutritious properties
Taste
Cooking easiness
Swelling capacity
Cleanliness and appearance
Availability
Price
Percentage of responses
Increasing consumers’ awareness for quality
Sources: WARDA- Africa Rice Centre, 2001 and 2003
Import price < local price Import price > local price
F.Lançon - CIRAD - World Rice Conference 2009 23
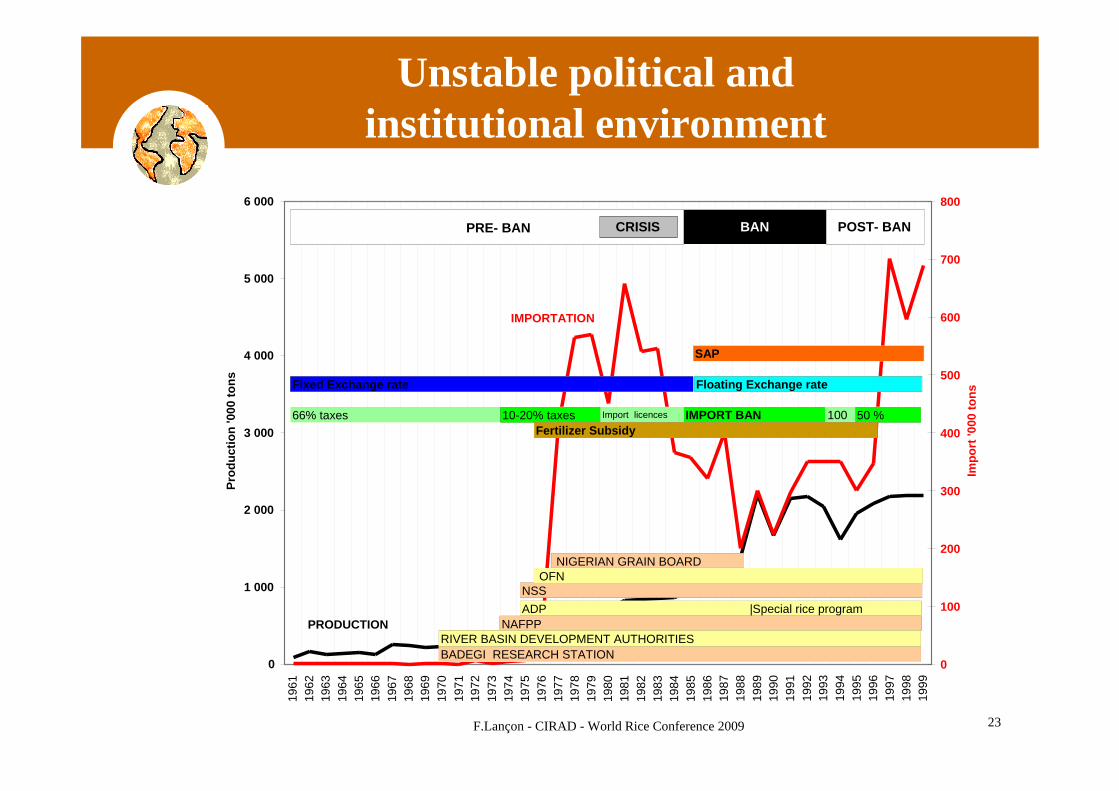
Unstable political and institutional environment
0
1 000
2 000
3 000
4 000
5 000
6 000
1961
1962
1963
1964
1965
1966
1967
1968
1969
1970
1971
1972
1973
1974
1975
1976
1977
1978
1979
1980
1981
1982
1983
1984
1985
1986
1987
1988
1989
1990
1991
1992
1993
1994
1995
1996
1997
1998
1999
Prod
uctio
n '0
00 to
ns
0
100
200
300
400
500
600
700
800
Impo
rt '0
00 to
ns
PRODUCTION
IMPORTATION
BADEGI RESEARCH STATION
NAFPP
NSSOFN
RIVER BASIN DEVELOPMENT AUTHORITIES
ADP |Special rice program
NIGERIAN GRAIN BOARD
66% taxes 10-20% taxes Import licences IMPORT BAN 100%
50 %
SAP
Fixed Exchange rate Floating Exchange rate
Fertilizer Subsidy
BANPRE- BAN CRISIS POST- BAN

F.Lançon - CIRAD - World Rice Conference 2009 24
Concluding remarks
Rice development in SSA remains a major challenge:Although: (+ + +)
Proven and promising technologies have been developed.The macro-economic setting is more favorable than in the past decadesPolicy makers and donors are more sensitive to the issue
Yet: ( - - - -)Weak market linkages and institutions do not provide a competitive hedge to local rice production.Quick technical integrated solution such as large scale agro-industrial rice scheme might not feasible or sustainableIt requires a long term commitment from decision makers.
If consumption expand at the same pace, stabilizing rice import volume would be an significant achievement.

F.Lançon - CIRAD - World Rice Conference 2009 25
Thank you

F.Lançon - CIRAD - World Rice Conference 2009 26
Mature and emerging markets
Angola
Benin
Burkina FasoCameroon
Chad
Congo,
Côte d'Ivoire
Gambia
GhanaGuinea
Guinea-BissauKenya
LiberiaMadagascar
Malawi
MaliMozambique
Niger
Nigeria
Senegal
Sierra LeoneSouth AfricaSudan
Tanzania
Togo
Zambia
-10%
-5%
0%
5%
10%
15%
20%
25%
0 20 40 60 80 100 120 140Per capita consumption (kg)
Per capita cons. growth rate
% per year

F.Lançon - CIRAD - World Rice Conference 2009 27
A contrasted situation across the sub-continent
Index value0.30 - 0.60 (9)0.15 - 0.30 (10)0.10 - 0.15 (15)0.00 - 0.10 (9)
Index value0.30 - 0.60 (9)0.15 - 0.30 (10)0.10 - 0.15 (15)0.00 - 0.10 (9)
source: WARDA – 2001
F.Lançon - CIRAD - World Rice Conference 2009 28
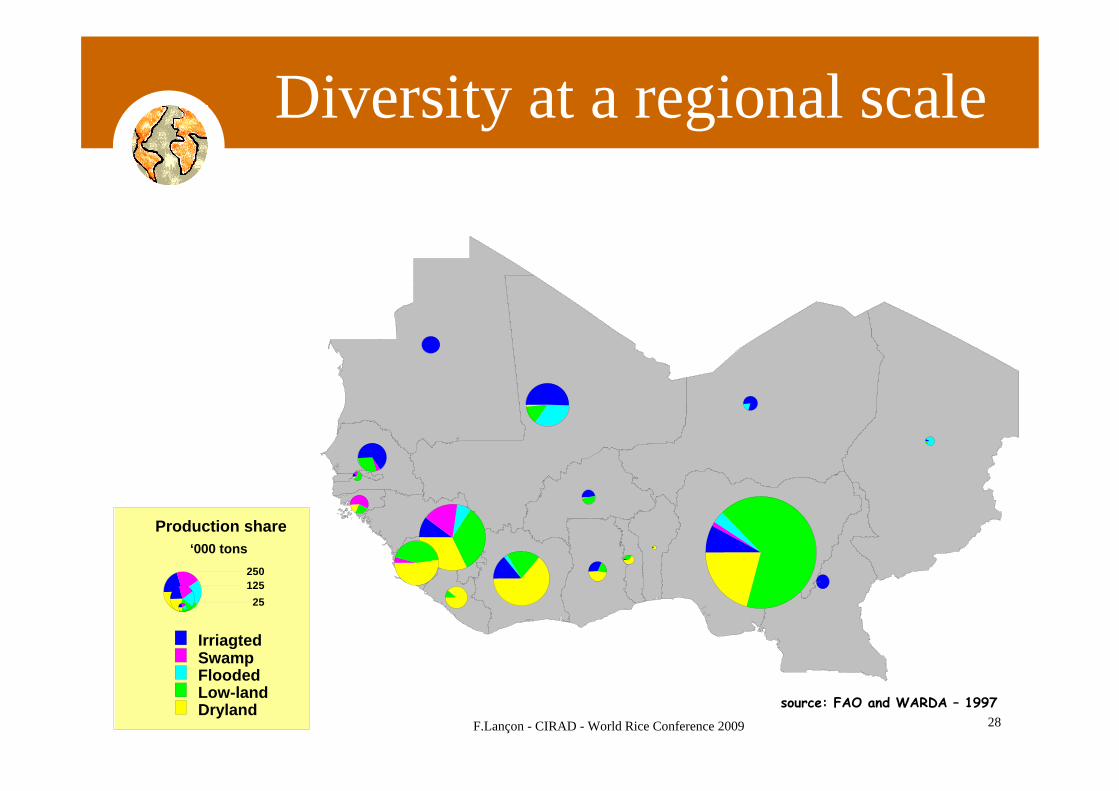
Diversity at a regional scale
Production share‘000 tons
250125
25
IrriagtedSwampFloodedLow-landDryland source: FAO and WARDA – 1997


