Download - Wind Presentation 1
8/8/2019 Wind Presentation 1
http://slidepdf.com/reader/full/wind-presentation-1 1/22
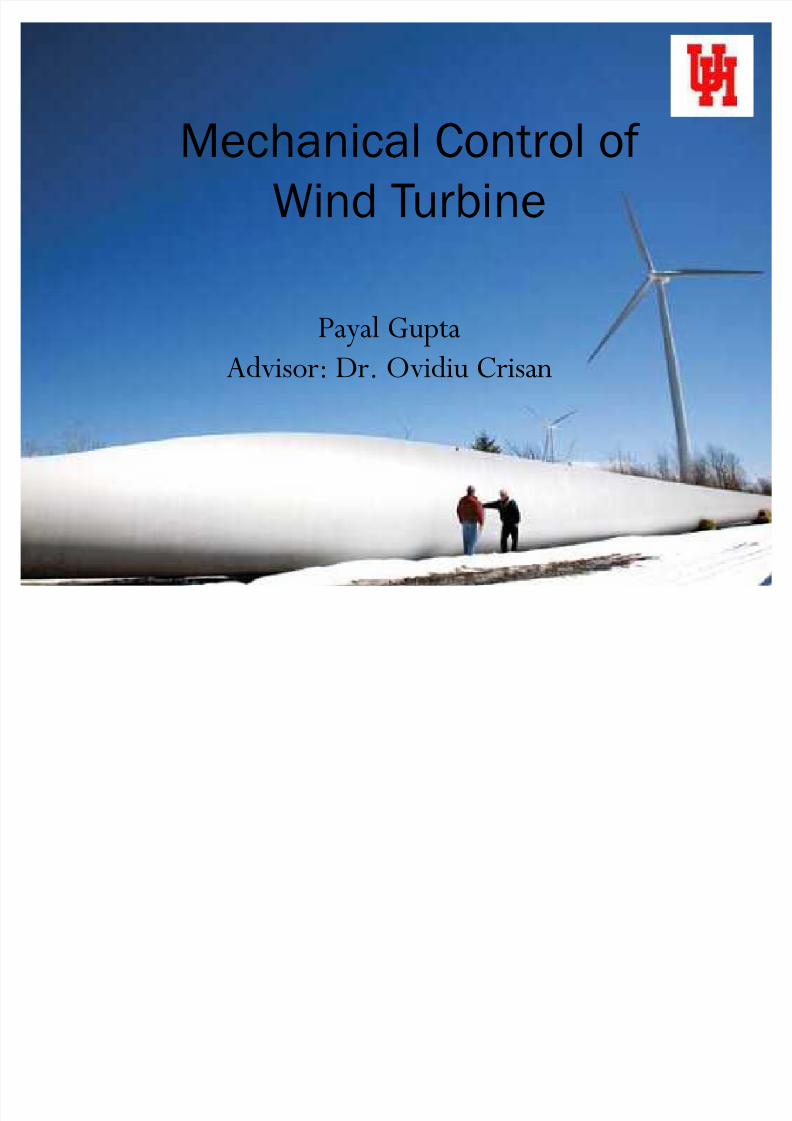
Mechanical Control of
Wind Turbine
Payal Gupta
Advisor: Dr. Ovidiu Crisan

8/8/2019 Wind Presentation 1
http://slidepdf.com/reader/full/wind-presentation-1 2/22
Contents
Objective Structure of wind turbine
Predicting Power Output
Calculation of Wind Power Limitations on Power Output of Wind
Turbine
Control on Wind Turbine Future Work
References
8/8/2019 Wind Presentation 1
http://slidepdf.com/reader/full/wind-presentation-1 3/22
Objective
To develop control system to enable the better use of turbine capacity along with relieving the aerodynamic
and mechanical loads that reduces the life of the
turbine.To improve the power quality so as to properly
integrate with the network with no adverse effect.
The main control goal for scheme design is to
maximize the energy capture taking account of safe
operation restriction like rated power, rated speed and
cut-out wind speed, etc.

8/8/2019 Wind Presentation 1
http://slidepdf.com/reader/full/wind-presentation-1 4/22
Orientation
Horizontal Axis WindTurbine Vertical Axis WindTurbine

8/8/2019 Wind Presentation 1
http://slidepdf.com/reader/full/wind-presentation-1 5/22
Structure Of Wind Turbine

8/8/2019 Wind Presentation 1
http://slidepdf.com/reader/full/wind-presentation-1 6/22
8/8/2019 Wind Presentation 1
http://slidepdf.com/reader/full/wind-presentation-1 7/22
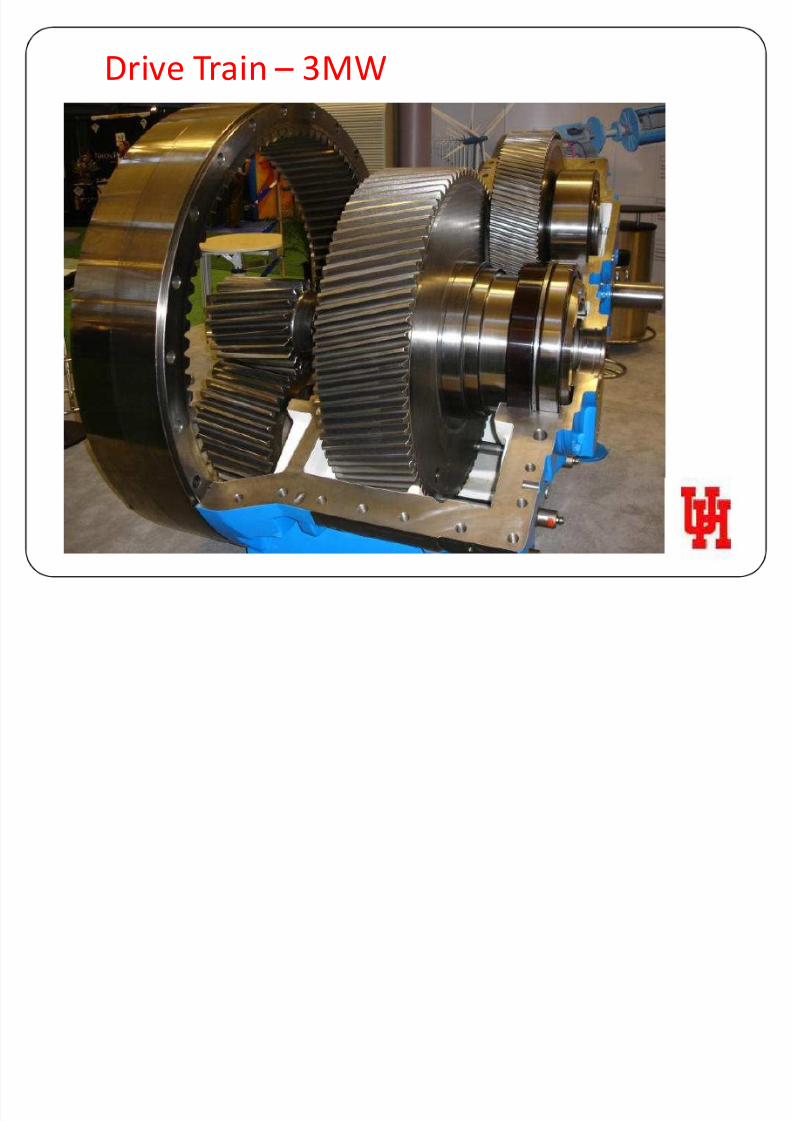
Drive Train 3MW

8/8/2019 Wind Presentation 1
http://slidepdf.com/reader/full/wind-presentation-1 8/22
Connection of Wind Farm to Power
System
8/8/2019 Wind Presentation 1
http://slidepdf.com/reader/full/wind-presentation-1 9/22
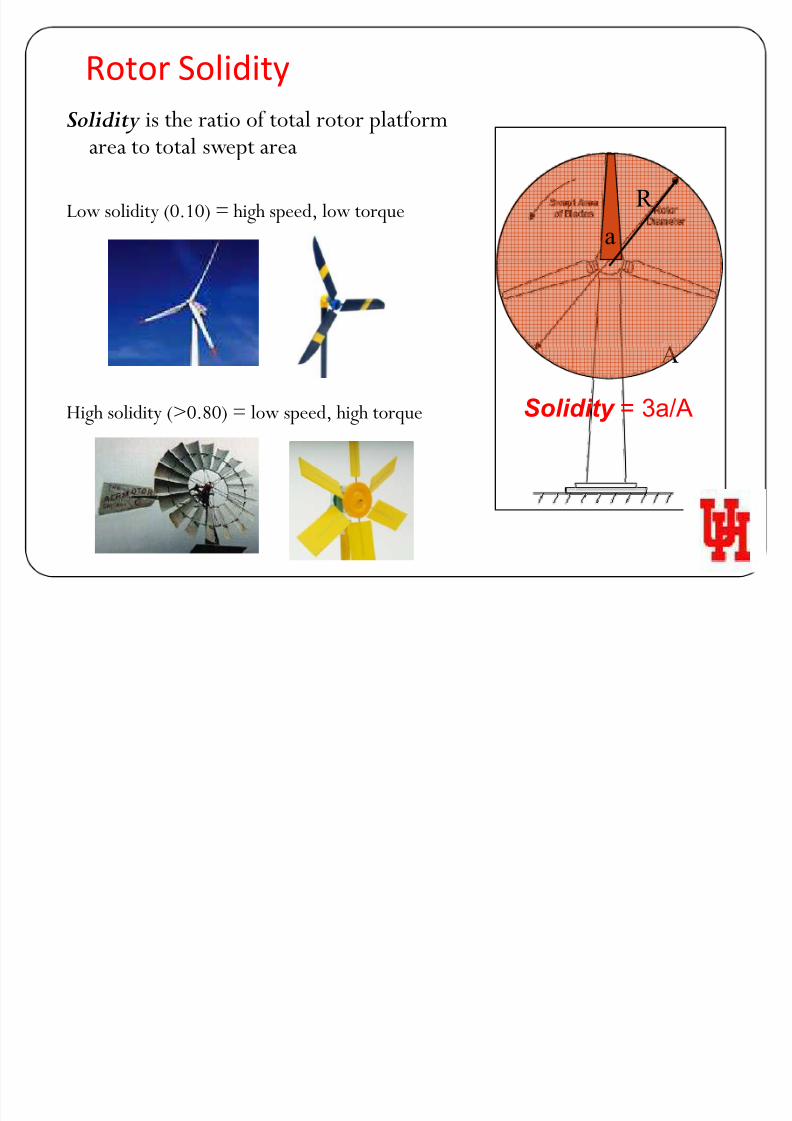
Rotor Solidity
Solidity is the ratio of total rotor platformarea to total swept area
Low solidity (0.10) = high speed, low torque
High solidity (>0.80) = low speed, high torque
A
R
a
Solidity = 3a/A

8/8/2019 Wind Presentation 1
http://slidepdf.com/reader/full/wind-presentation-1 10/22
Predicting Power Output
eWind Day-Ahead Hourly Forecast
0
20
40
60
80
100
120
140
2/5 2/6 2/7 2/8 2/9 2/10 2/11
Date
P o w e r O u t p u t ( M W
Reported eWind Forecast
8/8/2019 Wind Presentation 1
http://slidepdf.com/reader/full/wind-presentation-1 11/22
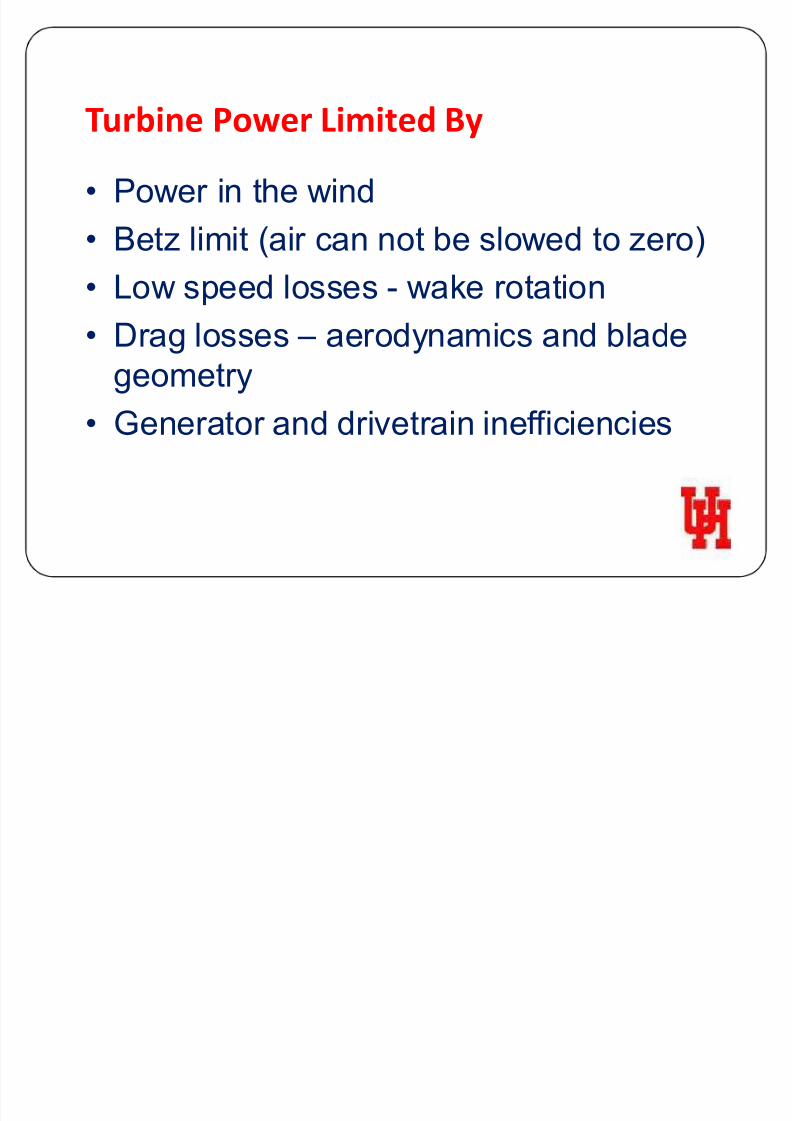
Turbine Power Limited By
Power in the wind
Betz limit (air can not be slowed to zero)
Low speed losses - wake rotation
Drag losses ± aerodynamics and blade
geometry
Generator and drivetrain inefficiencies

8/8/2019 Wind Presentation 1
http://slidepdf.com/reader/full/wind-presentation-1 12/22
Betz LimitAll wind power cannot be
captured by rotor or airwould be completely still
behind rotor and not allow
more wind to pass through.
Theoretical limit of rotorefficiency is 59%
Most modern wind turbines
are in the 35 ² 45% range

8/8/2019 Wind Presentation 1
http://slidepdf.com/reader/full/wind-presentation-1 13/22
Lift & Drag Forces
y The Lift Force is perpendicularto the direction of motion. We
want to make this force BIG.
y The Drag Force is parallel to thedirection of motion. We wantto make this force small.
= low
= medium<10 degrees
= HighStall!!

8/8/2019 Wind Presentation 1
http://slidepdf.com/reader/full/wind-presentation-1 14/22
Tip-Speed Ratio
Tip-speed ratio is the ratio of the speed of the rotating blade tip to the speed of the free stream wind.
There is an optimum angle of attackwhich creates the highest lift to dragratio.
Because angle of attack is dependant onwind speed, there is an optimum tip-speed ratio
R
V
TSR =Where,
= rotational speed in radians /sec
R = Rotor Radius
V = Wind ³Free Stream´ Velocity
R
R

8/8/2019 Wind Presentation 1
http://slidepdf.com/reader/full/wind-presentation-1 15/22
Calculation of Wind Power
Effect of swept area, A= R2
Effect of wind speed, V
Effect of air density, V
R
Power in the Wind = ½AV3
GeneratorTorque; c = K.2
Cp(*,*)

8/8/2019 Wind Presentation 1
http://slidepdf.com/reader/full/wind-presentation-1 16/22
Performance Over Range of Tip Speed
Ratios
Power Coefficient Varies with Tip Speed Ratio
Characterized by Cp vs Tip Speed Ratio Curve
0.4
0.3
0.2
0.1
0.0
Cp
121086420
Tip Speed Ratio

8/8/2019 Wind Presentation 1
http://slidepdf.com/reader/full/wind-presentation-1 17/22
Energy Production Terms
Power in the Wind =
1/2 V AV3
Betz Limit - 59% Max
Power Coefficient - Cp
Rated Power ± Maximum
power generator canproduce.
Capacity factor
± Actual energy/maximum
energy
Cut-in wind speed whereenergy production begins
Cut-out wind speed where
energy production ends.
Typical Power Curve

8/8/2019 Wind Presentation 1
http://slidepdf.com/reader/full/wind-presentation-1 18/22
Wind Turbine Control
Control of
the power of
a wind
turbine
Stall control
Pitch control
Yaw Control
8/8/2019 Wind Presentation 1
http://slidepdf.com/reader/full/wind-presentation-1 19/22
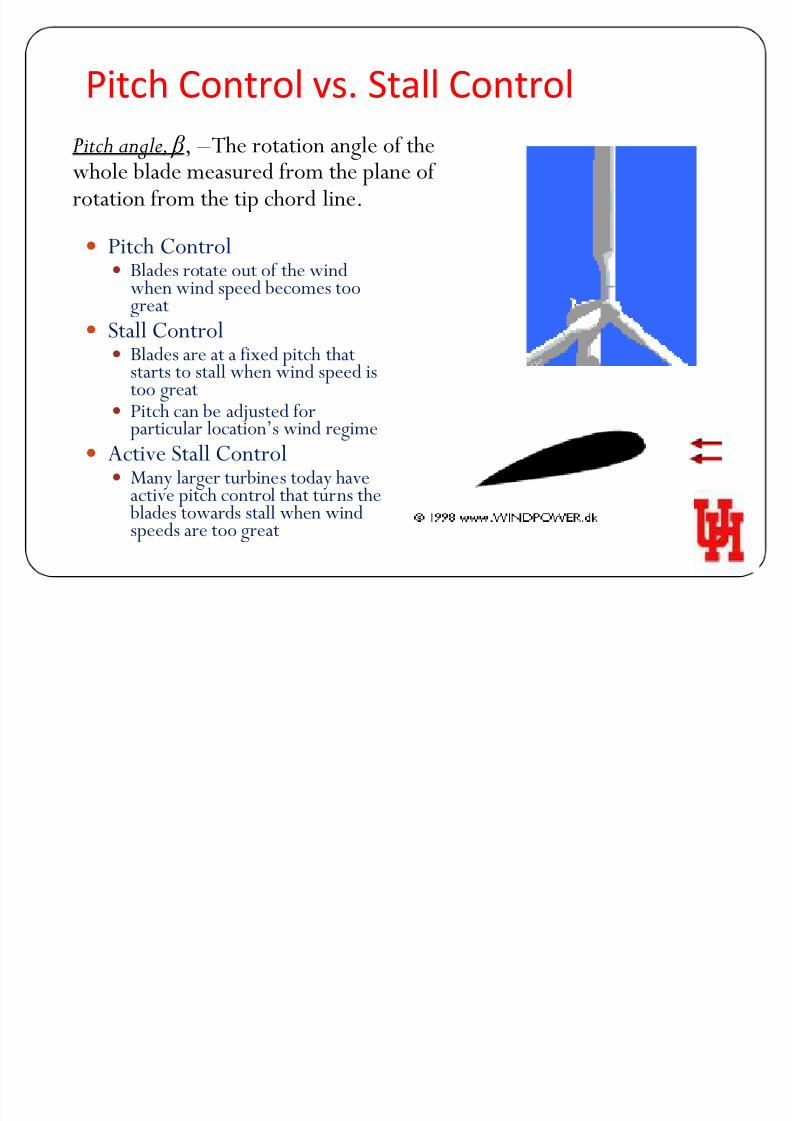
Pitch Control vs. Stall Control
y Pitch Controly
Blades rotate out of the windwhen wind speed becomes toogreat
y Stall Controly Blades are at a fixed pitch that
starts to stall when wind speed istoo great
y
Pitch can be adjusted forparticular location·s wind regime
y Active Stall Controly Many larger turbines today have
active pitch control that turns the blades towards stall when windspeeds are too great
P itch angle, , ² The rotation angle of thewhole blade measured from the plane of rotation from the tip chord line.
8/8/2019 Wind Presentation 1
http://slidepdf.com/reader/full/wind-presentation-1 20/22
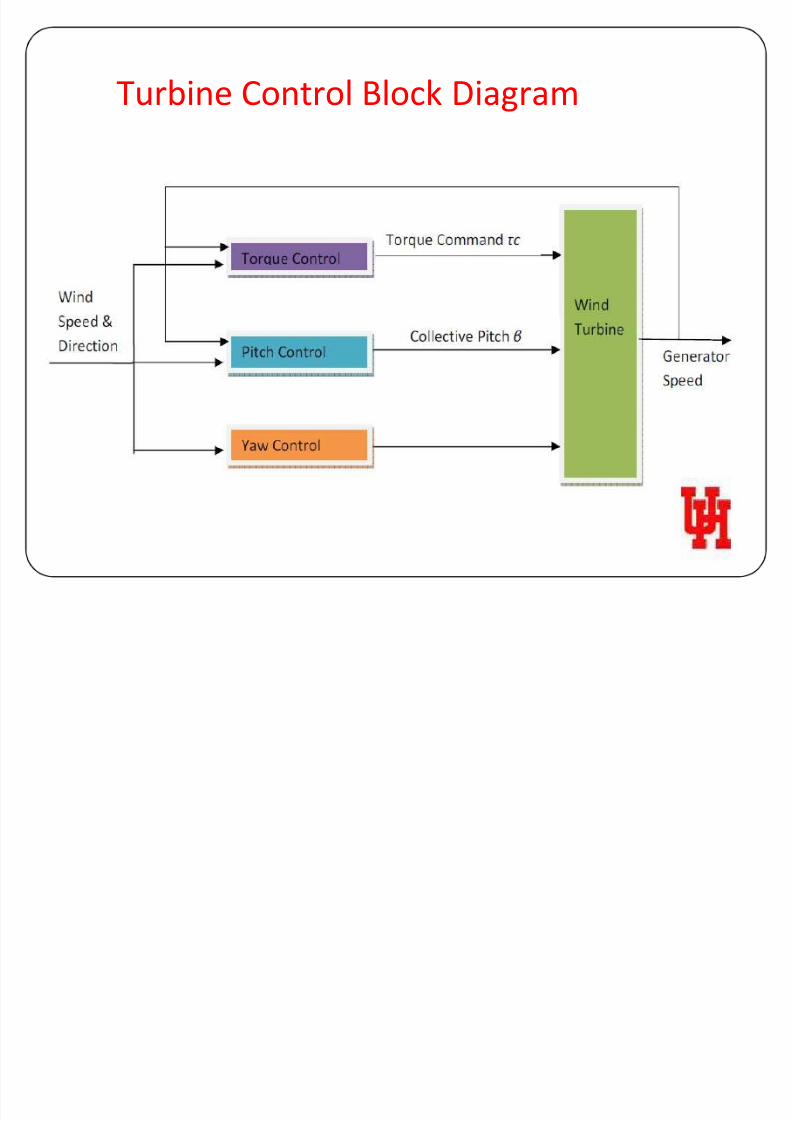
Turbine Control Block Diagram
8/8/2019 Wind Presentation 1
http://slidepdf.com/reader/full/wind-presentation-1 21/22
References
´WindTurbineµ,
http://en.wikipedia.org/wiki/Wind_turbine.
Fernando D. Bianchi,Hernan De Battista and Ricardo J.
Mantz, ´WindTurbine Control Systems -Principles,Modeling and Gain Scheduling Designµ, Springer-
Verlag London Limited 2007.
´Vestas -V 90 3.0 MWµ,
http://www.vestas.com/en/media/brochures.aspx. Jason H. Laks, Lucy Y. Pao, and Alan D. Wright,
´Control of WindTurbines: Past, Present, and Futureµ

8/8/2019 Wind Presentation 1
http://slidepdf.com/reader/full/wind-presentation-1 22/22
The Kidwind Project
www.kidwind.org
Thank You


