
1
With the Best of Intentions: School-Level Interventions and the Pursuit of Proficiency
Robert P. Strauss Professor of Economics
and Public Policy School of Public Policy and Management,
Heinz College Carnegie Mellon University
5000 Forbes Avenue Pittsburgh, PA 15213 [email protected]
Abby Clay Turner Doctoral Student in Economics
and Public Policy School of Public Policy and Management,
Heinz College and Tepper School of Business
Carnegie Mellon University 5000 Forbes Avenue Pittsburgh, PA 15213
December 16, 2009
This paper utilizes confidential student achievement information obtained under a signed confidentiality agreement with the Pennsylvania Department of Education. The authors wish to thank Jinxiang Liu for programming and database support. The authors benefited from discussions with Maria Ferreyra, Margaret McMacken, John Garrow, Dave Davare, Brian Junker, participants at the October 3, 2008 seminar on applied microeconomics at the Tepper School, participants at the May 23, 2009 seminar at Heinz College, and comments received at the 2009 Annual Meeting of the American Economic Finance Association and the 2009 Summer Meeting of the North American Econometric Society. Financial support from the Heinz Endowments and the William Penn Foundation is gratefully acknowledged. Responsibility for the findings and interpretation of this paper rests solely with the authors.

2
Abstract
This paper analyzes the effectiveness of a battery of formative assessments, 4Sight, which are
broadly aligned with annual assessments required by NCLB. These formative assessments are
designed to provide teachers with feedback on student performance throughout the year in order
to raise end of year student test scores. Methodologies for evaluating the effect of using 4Sight
on test score outcomes are drawn from the program evaluation literature, and include individual
and school-level OLS, quartile regressions, and probit regressions, as well as matching at the
school-level. Micro-econometric results show that 4Sight had no discernible effect on math
scores and a small negative effect on reading scores in its first year in Pennsylvania. Policy
recommendations include continuing a smaller-scale trial period of 4Sight for several more years
in conjunction with careful, improved alignment between 4Sight and PSSA, ongoing empirical
analysis of its effects, and incorporating more opportunity for feedback to teachers and students
to improve 4Sight as a formative assessment. Perhaps the most surprising finding of this paper is
that while 4Sight has a very small effect on student outcomes, students receiving tutoring under
NCLB are significantly and between four and nine percent less likely to pass their exams, even
after controlling for all covariates, including eligibility for tutoring. This implies that the
publicly-funded tutoring is actually disadvantaging those students who receive it. These results
should serve as a cautionary example to school, district, and state-level policy-makers when
choosing interventions designed to improve student performance on tests tied to NCLB.
1. Introduction and Research Questions
The enactment of the No Child Left Behind (NCLB) Act in 2002 has hastened the spread of a
culture of testing in the K – 12 public schools of our nation. Since its enactment, Section 1111 of
NCLB has required each state to devise academic standards on which to base their local school

3
curriculum and annual assessments in math, reading, writing, and science. Year after year,
NCLB requires an increasing fraction of public school students to pass these assessments as a
condition to the state, district, and school continuing to receive federal funding, which makes up
9% of public school funding nationwide.1 Failure at the school level to meet such targets over
time can lead to sanctions and mandatory school reform, and each summer the release of school-
level test results in every state has substantial repercussions for local superintendents, school
boards, teachers, and principals. Political consequences and push back at sanctions are
substantial, and the pressure to improve test scores increasingly reaches every classroom and
lesson plan on a daily basis in public education.
While there is growing focus and concern about the consequences of the culture of testing
on students, teachers, schools, and other stakeholders,2 there is far less focus on the tests
themselves, and on the procedures that states and school districts are using to raise their
performance. As a practical matter, it is extremely difficult to devise a test of 6th grade math of
several hours duration that will test the knowledge and skills of what a 6th grade student is
expected to know about math.3 Historically, teachers within a school or district, taking advice
from organizations such as the National Council of Teachers of Mathematics (NCTM) or the
National Council of Teachers of English (NCTE), would devise their own set of 6th grade math
or reading standards, upon which they would base their teaching, curriculum, and assessments.
With the advent of federally-mandated state-wide standardized testing, schools and districts have
had to realign their curricula and teaching to address the same academic standards that are
1 As of 2004-05. (Hoover Institution 2006) 2 News articles such as “Schools Found Likely to Miss NCLB Targets” (Cavanagh and Hoff 2008) and “No Easy Answers About NCLB’s Effect on ‘Poverty Gap’” (Viadero 2007) summarize some of the research and public opinion regarding the effects of NCLB. 3 See Table A.1 in the appendix for the list of Pennsylvania’s math academic standards for 6th graders.

4
assessed in the state exams. The principle of teaching to and assessing the same set of academic
skills is called alignment.
In response to increasing pressure for students to perform well on state assessments,
many states and districts are turning to intra-school year tests which demonstrate how each
student is progressing towards preparation for the end-of-year state assessment and enable
meeting deficiencies before the high stakes test. These interim tests are sometimes referred to as
formative assessments, “ongoing assessments designed to make students’ thinking visible to both
teachers and students” (National Research Council 2000, p.24), or as benchmark assessments,
which seek to predict a student’s score on an upcoming assessment, such as the state assessments
required under NCLB. This paper provides analysis of the alignment, use, and level of success
of one such set of tests, 4Sight, a “benchmark assessment” which is written and sold to school
districts in a variety of states by the Success for All Foundation of Maryland. In broader terms,
the use and analysis of 4Sight should be considered an example of a type of reform that schools,
districts, or states may choose to purchase and invest human resources into as part of the push to
increase student test scores motivated by the sanctions and reform mandated by NCLB.
Our analysis of 4Sight examines the Pennsylvania version of the reading and
mathematics tests at the 6th grade level. Our purpose is threefold. First, we examine the
alignment of 4Sight with the academic standards of the state of Pennsylvania. Second, we
examine the way Success for All and the Pennsylvania Department of Education (PDE) suggest
that 4Sight is used. Finally, we statistically analyze the effects of the initial use of 4Sight in
Pennsylvania and the subsequent performance of students on the state NCLB-approved
examination, the Pennsylvania State System of Assessment (PSSA).

5
Our findings indicate that 4Sight is not fully aligned with the state standards, with the
reading tests covering only 40% of the content contained in the Pennsylvania reading standards
and the math tests covering 80% of the content contained in the state math standards. We also
determine that, according to its proposed use by Success for All and the PDE, 4Sight only
provides feedback to teachers regarding their students’ performance. By not also providing
students with feedback as to their strengths and weaknesses, 4Sight fails to conform to the
definition of a formative assessment, as defined by the National Research Council. Finally, our
estimates of OLS and matching models of the education production function reveal that 4Sight
had little or no statistically significant effect on student performance on the PSSA in its pilot
year.
Our results suggest several policy recommendations. The failure of 4Sight to have a
significant positive effect on PSSA scores might be caused in part by its incomplete coverage or
its failure to conform to the criteria of formative assessment. We suggest that the coverage of
4Sight be expanded to become fully aligned with the Pennsylvania state standards in math and
reading. Furthermore, we suggest that Success for All and the PDE include additional tools and
training with 4Sight to allow both teachers and students to receive feedback from each test so
that it becomes a true formative assessment. Finally, we suggest that careful and thorough
statistical analysis of PSSA performance with regard to 4Sight use be continued for several more
years, until a reliable pattern of the effects of 4Sight use can be observed.
On a broader scale, our findings suggest that policy-makers within the school system
seeking any type of intervention to increase student test scores should proceed with caution.
Pennsylvania’s large-scale pilot-year implementation of 4Sight was most likely motivated by
increasing pressure to increase student performance. However, if the empirical results from the

6
pilot year are representative of the effect 4Sight will continue to have on student performance,
this is an intervention whose use it would have behooved the state to embark upon using a
smaller and more organized trial period, and this should serve as an example for policy-makers
in the future.
2. Some Background on Student Achievement Testing and Testing in Pennsylvania
Pennsylvania began testing students state-wide as a result of the School District Reorganization
Act (Act 229), which required the State Board of Education to develop an “evaluation procedure
designed to measure objectively the adequacy and efficiency of the educational program offered
by the public schools of the Commonwealth.”4 The purpose of these tests was to allow districts
to appraise their own educational performance and to provide “uniform evaluation” across school
districts. In conjunction with Educational Testing Service (ETS), the Pennsylvania Department
of Education (PDE) constructed the first state assessment of students in Pennsylvania, which
took place in the 1969-70 school year, testing students in grades 5 and 11 in many subject areas;
grade 8 testing was added in 1974. This program, which reported only school-level scores, ran
through 1988, when the state implemented student-level competency testing, Testing for
Essential Learning and Literary Skills (TELLS), designed to identify students in grades 3, 5, and
8 with difficulties in reading or mathematics. TELLS continued until 1991, and in 1992 the
current Pennsylvania System of School Assessment (PSSA) began testing reading and
mathematics at grades 5, 8, and 11, and writing at grades 6 and 9.
In 1999, the Pennsylvania State Board of Education adopted a new set of academic
standards detailing the knowledge and skills students should have at each grade level so that in
4 Quoted text in this section comes from Act 229. For further detail about the history of standardized testing in Pennsylvania, see Chapter 1 of the Technical report for the Pennsylvania System of School Assessment: 2006 Reading and mathematics grades 4, 6, and 7 (Data Recognition Corporation 2007).

7
2000, the purpose of the PSSA became two-fold: to measure student attainment of academic
standards and to assess the extent to which school policies enabled students to achieve
proficiency. This change pre-dated the inception of NCLB by two years. As a result,
Pennsylvania used the standards and assessments they already had in place in order to meet the
requirements of the federal legislation. Testing has expanded over the years since 2002; one
requirement of NCLB is that every student5 be tested in grades 3, 5, 8, and 11. The majority of
these students must also have their scores included in the school-level reports documenting the
fraction of students within subcategories6 that have performed at or above a level defined as
“proficient.”7 In 2006, Pennsylvania testing was expanded to include grades 4-8 and 11. To
meet the requirement of NCLB, each year a school must make Adequate Yearly Progress (AYP).
In 2006 in Pennsylvania, meeting AYP meant that a school had at least a 95% participation rate
in the PSSA, at least 45% of students scored at or above proficiency on the math assessment, and
at least 54% of students scored at or above proficiency on the reading assessment within each
subcategory.
In this paper, we use scores from the spring of 2006 6th grade math and reading PSSA
tests. The academic standards adopted by the PDE in 1999 are the foundation upon which these
tests are designed. In 2005, the PDE developed Assessment Anchor Content Standards
(Assessment Anchors) to further clarify the material students should learn and would be tested
on in each grade. As a result of these two adoptions, material on each of the tests is broken down
first into reporting categories, which describe broad categories of content, then further into
assessment anchors, and finally into eligible content, which specifies the type of question that
5 Students are exempted from taking the tests if they are in their first year as a limited English proficiency (LEP) student. Students with severe cognitive disabilities may qualify to take an alternate assessment. 6 Proficiency rates are reported for the entire school and nine subgroups (if they have at least 40 students): American Indian, Asian, Black, Hispanic, White, Multi-Racial, IEP, LEP, and Economically Disadvantaged. 7 Pennsylvania defines four performance indices: Advanced, Proficient, Basic, and Below Basic.
8
may be asked on the PSSA8 The reading test is broken into two reporting categories,
“Comprehension and Reading Skills” and “Interpretation and Analysis of Fictional and
Nonfictional Text.” The math test is broken into five reporting categories: “Numbers and
Operations,” “Measurement,” “Geometry,” “Algebraic Concepts,” and “Data Analysis and
Probability.” The further breakdown of reporting categories into assessment anchors and eligible
content is presented in Section 8 below.
3. Overview of 4Sight and its Use in Pennsylvania
4Sight is a set of math and reading tests written by the Success for All Foundation of Maryland
which they define as “a benchmark assessment tool that enables you to predict your students’
reading – and in some states, math – achievement multiple times throughout the year.” (Success
for All 2009b) As of the 2008-09 school year, versions of 4Sight are available in 16 states
(Success for All 2009c), with each state’s tests tailored to assess the current set of academic
standards on which that state bases its NCLB assessments. In Pennsylvania, 4Sight is available
for grades 3-11 in both math and reading. These tests are designed to be given to students up to
five times throughout the year, and predict student performance on the PSSA (Success for All
2009a).9 An analysis of the 6th grade Pennsylvania 4Sight tests administered during school year
2005-6 performed by the authors revealed that each test contains between 28 and 36 questions,
and each of the five versions of the math or reading test covers the same set of eligible content.
8 For a list of assessment anchors and eligible content by reporting category and grade, please see the appendix. 9 The 4Sight Reading and Math Benchmarks 2008-2009 Technical Report for Pennsylvania provides statistical evidence that 4Sight allows “educators to use the estimated student proficiency levels and diagnostic subscale data with confidence to inform their instruction and professional development.” (Success for All 2009a, p. 21) While the purpose of the Technical Report was to assess the accuracy of the predictive power the 4Sight exams provide for the PSSA, the purpose of our paper is to examine the effect of 4Sight on student performance on the PSSA.

9
Neither the reading nor the math 4Sight tests covers all of Pennsylvania’s eligible content,
meaning that students should be learning and will potentially be tested on the PSSA on content
not assessed by 4Sight. The details of 4Sight’s alignment with Pennsylvania’s 6th grade math
and reading eligible content are presented in Appendix Tables A.1 and A.2. These tables list the
reporting categories, assessment anchors, and eligible content covered by the PSSA. Eligible
content which is italicized is not assessed by 4Sight. We find that the 4Sight math test covers
80%, and the 4Sight reading test covers 40% of the eligible content contained in Pennsylvania’s
2006 academic standards.
The 2005-06 school-year was the pilot year for 4Sight in Pennsylvania. The use of
4Sight was determined at the school level, with 750 schools from 310 districts choosing to use
4Sight10. Schools chose to use 4Sight for one of several reasons, listed by the Pennsylvania
Training & Technical Assistance Network (PaTTAN), an initiative of PDE:
4Sight has been used to assist districts in promoting change, addressing program needs, initiating data
discussions, and fostering a data-driven culture. In addition, 4Sight has focused prevention and
intervention efforts and provided a consistent reporting system for Pennsylvania districts involved in the
Educational Assistance Program (EAP) Tutoring Initiative. (PaTTAN 2009)
Schools who chose to use 4Sight in 2005-06 paid $1,000 per building for up to 500 students to
use the online version of the test, or about $3 per student per subject to use the paper version of
the test.
Schools using 4Sight participated in training sessions organized by PaTTAN and
designed to instruct teachers and administrators on the successful use of 4Sight. Topics covered
in these sessions include general data analysis, using 4Sight data to prioritize concerns and
determine root causes, and identifying targets to improve student achievement (PaTTAN
10 Pennsylvania had approximately 3,000 public schools and 501 school districts in 2005-06, according to the National Center for Education Statistics (NCES) Common Core of Data (CCD).

10
2008).11 Teachers learned to interpret the results of the 4Sight exams in terms that allowed them
to alter their teaching and improve student performance on certain tasks/eligible content. Neither
PaTTAN nor Success for All provides a format specifically for feedback to the students, so while
4Sight does provide teachers with feedback regarding student performance, that feedback may
never explicitly reach the student. In this sense, the benchmark assessment 4Sight fails to
conform to the National Research Council’s definition of a formative assessment.
4. Evaluation Methodology and Data Requirements
We are interested in evaluating the impact of 4Sight use on student performance, as measured by
PSSA performance. In terms of statistical analysis, we are attempting to measure a “treatment
effect:” the effect on a student of being “treated” by 4Sight. There is an extensive literature on
the evaluation of social programs, most notably a literature evaluating the effectiveness of job
training programs, motivated by LaLonde (1986) and discussed in detail in a handbook chapter
by Heckman, LaLonde, and Smith (1999). In addition to the econometric hurdles of evaluating a
treatment effect, we must evaluate this effect in the context of an education production model,
which, in the absence of a large amount of data, adds to the complexity of the econometric
evaluation.
Data Requirements
Ideally, a model of student achievement would be evaluated using each student’s
complete history of educational inputs (Boardman, Davis, and Sanday 1977) and their
endowment, or natural ability as a student, which is inherently unobservable. A complete history
of educational inputs would include family inputs, such as the parents’ educational attainment
and intelligence, student inputs, such as the amount of time spent studying, teacher inputs, such 11Thanks also to Marge McMackin for detailing the training process to the authors.

11
as the teaching ability of each teacher the student has ever had, and school inputs, such as the
academic support that students receive over time. Unfortunately, an exhaustive amount of
information in each of these areas is never available to the econometrician, so we must make do
with what information and proxies are available, and choose a model carefully to control for
missing data as much as possible.
We can think of 4Sight as a treatment in the sense that some students receive it while
others do not. The coefficient we are interested in is the expected effect of using 4Sight on a
student’s PSSA score. In order to evaluate this coefficient, it is desirable to observe each
student’s PSSA score, with and without having been treated, as demonstrated in equation (1).
(1) ,4 ,4i Sight i SightPSSA PSSA⎡ ⎤−⎣ ⎦E
Since instead each student is either tested or not tested, and we observe only one PSSA score
(either under treatment or non-treatment), we must instead compare two groups of different
students, who have been either treated or not treated. Instead of evaluating the coefficient in
equation (1), we will be evaluating the coefficient in equation (2), which is equal to equation (1)
if the assignment of treatment is random.
(2) [ ] [ ]| 4 , | No 4 ,PSSA Sight X PSSA Sight X−E E
Descriptive Statistical Analysis
The basic framework for our models is of education production. Economic theory tells
us that student achievement can be thought of as a function of inputs from the student, the
student’s family, and the student’s schools over time. We first examine the efficacy of 4Sight
using OLS regression to estimate a linear version of the education production model of student
achievement including one lagged-test score along with the covariates. The model is illustrated
in equation (3), where PSSAt and PSSAt-1 are a student’s test scores in years t and t – 1

12
respectively, Xt includes a set of student characteristics at time t and St includes a set of school
characteristics at time t.
(3) ttttt SightSXPSSAPSSA εδγβα ++++= − 41
The major econometric hurdle to be overcome in models of student achievement is the lack of
data on each student’s complete history of educational inputs and their endowment, which is
difficult to observe. The model expressed in equation (3) overcomes the issue by using a lagged-
test score as a proxy for non-contemporary inputs, such as school and family inputs prior to time
t, and the student’s endowment. Identification of the coefficients of interest assumes that the
lagged-test score provides a sufficient statistic for unobserved non-contemporary and endowment
inputs which decline geometrically with age.12 Additionally, because our data is non-
experimental, identification of a “treatment” effect on students using 4Sight requires that no
endogeneity exists between unobservables not accounted for in the model and selection into the
treatment group.
Tables A.1 and A.2 in the appendix demonstrate that 4Sight covers between 35-100% of
the eligible content within a reporting category for any given grade. In order to examine the
relationship between alignment and student outcomes, we use this variation in coverage to
analyze the different effects of 4Sight between reporting categories. We use OLS to evaluate a
value-added model of student achievement within each reporting category and then compare the
coefficients on 4Sight with the coverage of the particular reporting category.
Correcting for Selection Bias
As stated above, we require selection into treatment to be random in order for equation
(2) to identify the average treatment effect of 4Sight. In fact, schools choose whether or not their
12 Todd and Wolpin (2003) provide a detailed discussion of the econometric assumptions imposed when using a single-year lagged test-score value-added model.

13
students use 4Sight, and these schools do not necessarily make the decision randomly. We might
assume that schools take into consideration the costs of 4Sight and compare them to what there is
to be gained: improvement in test scores. We might therefore expect that schools with more
money and lower test scores would be more likely to use 4Sight than schools with less money
and higher test scores.
As is evident from the descriptive statistics in Tables 1-8, the distribution of covariates
among students and schools using 4Sight and those not using 4Sight are different. This suggests
the use of a matching model to correct for selection bias and identify a treatment-on-the-treated
effect on test score outcomes. We use the approach first used by Rosenbaum and Rubin (1983)
of matching on propensity scores. The propensity score, or the probability of a student receiving
treatment given their characteristics, is defined in equation (4), where 4Sightit is a dummy
variable signifying whether student i received treatment in time t, PSSAit is a set of student i's test
scores in time t-1 and Xit and Sit, are sets of contemporaneous student and school characteristics
for student i in time t.
(4) ( ), 1Pr 4 1| , ,it i t it itSight PSSA X S−=
Because selection is determined at the school level, and because Sit is composed of all
individuals within a particular school, Sit is a sufficient statistic for determining student i's
treatment. For this reason, we have aggregated all data to the school level for the purpose of
calculating propensity scores. Matching thus occurs at the school level, estimating the average
treatment on the treated (ATT) in terms of average test score. Estimation of the ATT is
performed using the nearest-neighbor method.13
Dependent Variables
13 For a discussion on identifying ATT, see Heckman, Lalonde, and Smith (1999).

14
Data on student performance comes from the Data Recognition Corporation (DRC),
which writes, administers, and scores the Pennsylvania System of School Assessment (PSSA) for
the Pennsylvania Department of Education, under a signed confidentiality agreement with the
Pennsylvania Department of Education. For the 2004-05 school-year, data includes detailed test
score information for students in grades 5 and 11. For the 2005-06 school-year, data includes
detailed test score information for students in grades 3-8 and 11. Using identifiers14 from the
data, we have created a 2-year data set matched at the individual-level, with a match-rate of
89.0%, limited to students in 5th grade in 2004-05 advancing to 6th grade in 2005-06.
PSSA scores are reported to students as scaled scores, which translate a raw score into a
number greater than or equal to 700 according to a table created by PDE in association with
psychometricians in any given test year. These scaled scores are normed to a school-level mean
(1300) and standard deviation (100) based on raw school-level scores in the base year (1996).
These scores can be appropriately interpreted at an interval-level, meaning that a 5-point
difference means the same whether the base score is 1200 or 1600. 15 In addition, students see
their PSSA performance broken down by reporting category. To evaluate student performance
from year to year within each reporting category, we have constructed percentage correct scores
for each student in each reporting category, calculated simply as the number of questions a
student answered correctly divided by the number of questions asked in that category.
Explanatory Variables
The DRC test-score data includes identifying, socio-economic, and academic data for
each student taking the test. We have used this data to create a set of dummy variables for each
individual student including: gender (male = 0, female = 1), race categories (white, black,
14 Identifiers available were a state identification number, the student’s name, and the student’s birth date. 15 More information is available in the Technical Report for the Pennsylvania System of School Assessment: 2006 Reading and Mathematics Grades 4, 6, and 7 (Data Recognition Corporation 2007).

15
Hispanic, other), tutoring eligibility and tutoring status,16 Title I status (indicates that a student is
low-income or attending a school with a large percentage of low-income students), Title III
status (indicates that the student is receiving instruction in English as a second language), IEP
status (indicates that the student has a learning disability), and gifted status. We also know
which school each student attended in each year, and have merged student-level data to school-
level data according to the student’s sixth-grade school. School-level data includes mean teacher
experience,17 percentage of teachers with master’s degrees, mean teacher performance on
standardized-tests (Praxis and National Teacher Examinations (NTE)) measured as percent-
correct on the respective tests18, student-teacher ratio, weapons violations per student, percent of
students qualifying for Free and Reduced Lunch, and percent of white students. These data are
also provided by PDE to this project as part of the master confidentiality agreement.
Data on the use of 4Sight is at the school-level by grade and subject (math or reading),
and was available for a limited time from PDE.19 We have merged this data to the individual-
level dataset, so that a variable indicates whether a particular student used 4Sight math in 2005-
06 and another variable indicates whether the student used 4Sight reading in 2005-06. Data
regarding the coverage of 4Sight by reporting category comes from our analysis20 of the 4Sight
exams in conjunction with field discussions with area experts.
16 Tutoring eligibility and status refer to sanctions required by NCLB Section 1116 Subsection (e) (1). Low-income students at schools which have failed AYP for at least two years in a row become eligible for private tutoring, which is paid for using federal Title I money. Not all students who are eligible choose to use this service; the tutoring status variable indicates the student did choose to receive this tutoring. 17 Mean teacher experience is defined as the average number of years a teacher has been employed as a licensed professional in public K-12 in the state of Pennsylvania. 18 See Strauss, Bowes, Marks and Plesko (2000) for a discussion and rationale for this transformation of teacher test scores. See Strauss and Sawyer (1986) for an earlier analysis of the effects of NTE on student achievement in North Carolina. 19 We received this data from the PDE website in early 2008. It has since been removed. 20 The Pittsburgh Public Schools classified the questions on each 4Sight exam into the corresponding Reporting Categories, Assessment Anchors, and Eligible Content, and provided us with this information. The authors performed subsequent analysis of the coverage of 4Sight compared to the PSSA.

16
5. Empirical Results
Characteristics of the Data at the Student and School Levels
Descriptive statistics on students by 4Sight use, along with t- or F-values from a
difference of means test comparing 4Sight users with 4Sight non-users, are provided in Tables 1
and 3. Table 1 shows statistics for students using 4Sight for math, and Table 3 shows statistics
for students using 4Sight for reading. The correlation between students using 4Sight for math
and those using 4Sight for reading is 0.8, meaning that most students using one are also using the
other; as a result, the tables show similar statistics. Students using 4Sight are significantly more
white, richer (as indicated by their Title I status), more likely to speak English as a first language
(as indicated by their Title III status), more likely to be denoted as gifted, and less likely to be on
an individualized education plan (an indicator of special education status) than students not using
4Sight. Students are equally as likely to qualify for tutoring under NCLB, but more likely to
receive tutoring if they belong to the group using 4Sight. Differences in gender and
homelessness are insignificant between the two groups. Students using 4Sight have teachers
with significantly more experience and who are less likely to have a master’s degree. Students
using 4Sight are in significantly smaller classrooms as measured by student-teacher ratio, have
significantly more peers on free or reduced lunch, and have significantly more white peers.
These statistics indicate that students using 4Sight are more likely to belong to a school with
slightly higher socio-economic status than their non-4Sight counterparts, but that students at their
school are also more likely to be enrolled in programs such as Title I, NCLB tutoring, and free or
reduced lunch. This is in accord with a model in which schools that are more pro-active in
seeking helpful programs for their students are selecting into 4Sight use.

17
Descriptive statistics on schools by 4Sight use, along with t-values from a difference of
means test comparing 4Sight users with 4Sight non-users are provided in Tables 5 and 7. As in
the individual-level statistics, schools using 4Sight are significantly more white, richer (as
indicated by their Title I status), and have a higher percentage of students denoted as gifted, and
a lower percentage of students on an individualized education plan than schools not using 4Sight.
Schools using 4Sight have a higher percentage of students both qualifying for and receiving
tutoring. Student-teacher ratios remain significantly lower, and teacher experience remains
significantly higher for schools using 4Sight, but all other characteristics are not significantly
different. Again, this is in accord with a model in which pro-active schools, via their teachers,
administrators, or parents, self-select into treatment and use 4Sight.
Characteristics of the PSSA
Tables 2 and 4 show average student PSSA scores by 4Sight use. In both cases (4Sight
math and reading), 4Sight users have math and reading scores that are significantly lower (by 9-
11 points) than students not using 4Sight. One standard deviation for each of these tests is
between 207 and 226 points, so the group means differ by approximately 5% of a standard
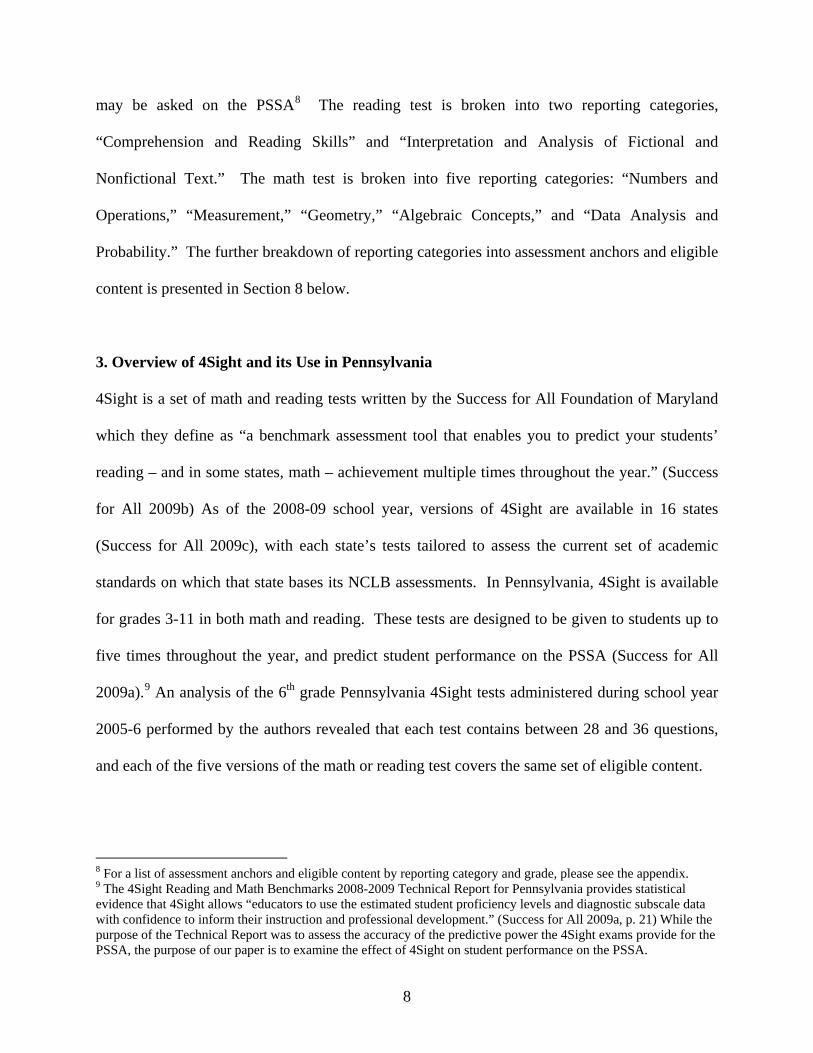
deviation. Tables 6 and 8 show average school PSSA scores by 4Sight use. There is no
statistically significant difference between either test for either 4Sight group at the school-level.
Individual Student Results: Scaled Scores
Individual-level OLS estimates of equation (3) were estimated21 with and without the
control variables, and are presented in Tables 10 and 11. Each table has six columns. The first
regresses a student’s math scaled score from 2006 on the student’s prior math scaled score from
2005, the second column adds dummy variables for treatment with 4Sight math and 4Sight
reading, and the third and fourth columns add individual and school characteristics (where white 21 The stochastic specifications for all models are presented in Table 9.

18
is the eliminated race category). The fifth and sixth columns include information on teachers’
Praxis scores and NTE scores, respectively. These have been run as separate regressions because
the data on teachers’ test scores are incomplete, and their inclusion reduces the number of
observations available for regression. In each case, the teacher test scores were also run in
separate regressions (so that only one teacher test score is included in each regression) in order to
correct for multicollinearity between these variables. Neither the signs nor the significance
levels of the coefficients on these variables change much when separate regressions are
performed, and results can be obtained from the authors by request.
Table 10 presents results for the PSSA math scaled scores. The first row of coefficients
can be interpreted as elasticities of student performance in 2006 given performance in 2005.
Column (1) shows that in the absence of covariates, a 10% increase in 2005 scaled score implies
an 8.5% increase in 2006 scaled score. This elasticity does not change in a statistically
significant manner in column (2), when the use of 4Sight is added to the regression. The
coefficient on 4Sight math is insignificant and near zero. Column (3) adds individual-level
covariates to the regression, all of which are significant. With the addition of the individual-
level covariates, the effect of 4Sight remains the same. Column (4) adds school-level covariates
to the regression, all of which are significant. With the addition of the school-level covariates,
the effect of 4Sight becomes positive and significant, but small; an effect of 0.12% is equivalent
to a 1.7-point improvement at the mean scaled score of 1406. The coefficients on the covariates
all take the expected signs, and are in line with estimates from previous studies (Krueger 1999;
Hanushek 1986). Column (5) adds teachers’ average Praxis scores, with a significant positive
coefficient on teachers’ writing scores, and significant negative coefficient on teachers’ math
scores. Column (6) adds teachers’ average NTE scores, with significant, positive coefficients on

19
professional and common knowledge scores, and a significant, negative coefficient on general
knowledge scores.22
Table 11 presents results for the PSSA reading scaled scores. Again, the first row of
coefficients can be interpreted as elasticities of student reading performance in 2006 given
performance in 2005. Column (1) shows that in the absence of covariates, a 10% increase in
2005 scaled score implies a 7.3% increase in 2006 scaled score, which is lower than in the case
of the math scaled scores. This elasticity does not change in column (2), when the use of 4Sight
is added to the regression. The coefficient on 4Sight is negative and significant; a 0.26% change
is equivalent to a 3.5-point decrease at the mean scaled score of 1343. This coefficient remains
negative and significant in all specifications of the model. Column (3) adds individual-level
covariates to the regression, all of which are significant. The coefficients on the covariates all
take the expected signs. Column (4) adds school-level covariates to the regression, all of which
are significant. The coefficients on the covariates all take the expected signs. Column (5) adds
teachers’ average Praxis scores, with a significant positive coefficient on teachers’ writing
scores, and significant negative coefficient on teachers’ math scores. Column (6) adds teachers’
average NTE scores, with significant, positive coefficients on professional and common
knowledge scores, and an insignificant coefficient on general knowledge scores.
Tables 12 and 13 present coefficients from quartile regressions with specifications
analogous to those in columns (1) through (4) in the OLS regressions. The quartile regressions
examine the impact of the covariates on students at the 25th, 50th, and 75th percentiles of
performance on the 2006 6th grade PSSA. Table 12 presents results for the PSSA math. Column
(1) shows what can again be interpreted as an elasticity of student performance in 2006 given
22 See Strauss and Vogt (2007) for somewhat different, district-level results that take into account teacher selection effects.

20
performance in 2005 in the absence of the covariates. These coefficients show that elasticity is
nearly invariant across the quartiles of performance, with performance in 2005 predicting 84-
85% of performance in 2006. Column (2) introduces a dummy variable for the use of 4Sight
math, and across all quartiles, there is a very small and insignificant positive or zero effect of
4Sight on PSSA score. Column (3) introduces individual-level covariates to the regression, all of
which are significant, with the exception of tutoring eligibility at the median, and gender at the
25th percentile. Race, homelessness, and IEP-status have increasing, negative effects moving
from the top of the distribution downward. Title I status has a fairly constant negative effect,
between 1-2%, across all quartiles, and gifted-status has a fairly constant positive effect, around
5%, across all quartiles. Title III status has a small, positive effect on performance which
increases from the top of the distribution downward. Column (4) introduces school-level
covariates to the regression, all of which are significant with the exception of the white-student
ratio (at all quartiles) and the student-teacher ratio at the median. These coefficients show that
mean teacher experience, free and reduced lunch ratio, weapons violations per student, and the
ratio of teachers with a Master’s degree all have the expected signs, with larger effects on the
lower quartiles of performance than the higher. Student-teacher ratio shows a negative effect on
the 25th percentile of performance, and a positive effect on the 75th percentile of performance.
Table 13 presents quartile results for PSSA reading. Column (1) shows that, unlike for
math scores, the prior year’s performance on PSSA reading has a differing and decreasing effect
across quartiles. Column (2) adds a dummy variable for the use of 4Sight reading. The
coefficients are small, negative, and significant for the 25th and 50th percentiles of performance.
Column (3) introduces individual-level covariates to the regression, all of which are significant,
with the exception of homelessness, which is only significant at the bottom quartile, and Title III

21
status, which is not significant in any quartile. Eligibility for tutoring has a negative effect across
quartiles, larger in magnitude at the bottom of the distribution; receiving tutoring has a negative
and constant effect of about 1% across all quartiles. Gender has a constant effect across
quartiles, with females performing a little bit less than 1% better than males. Race,
homelessness, Title I status, and IEP status have the expected signs, and show a larger effect
toward the bottom of the distribution of performance, as in the math results. Gifted status
remains constant across all quartiles, with these students performing about 4% better than their
peers. Column (4) adds school-level covariates. Mean teacher experience is insignificant and
near zero across the distribution, while the remaining school-level variables all have the expected
signs and show larger effects towards the bottom of the distribution.
Individual Student Results: Probit Regressions
Tables 10-13 presented the effects of 4Sight use and other covariates on the log of
student scores on the PSSA, however, the policy-relevant outcome in terms of NCLB is whether
or not a student performs at or above proficiency on the test. For Tables 14 and 15, the
dependent variable is categorical, taking a value of one if the student performed at or above
proficiency, as defined by the PDE, on the 2006 PSSA, and zero otherwise. Probit regressions
were performed, and marginal effects are reported. Table 14 presents the results for PSSA math.
In column (1), we see that, in the absence of covariates, performing at or above proficiency in
2005 meant the student had a 67% chance of performing at or above proficiency in 2006.
Column (2) adds a dummy variable for use of 4Sight math, which has a small positive but
insignificant effect on student proficiency. Column (3) includes dummy variables for whether
the student was eligible and/or received NCLB-mandated tutoring. Even after controlling for
eligibility, students had a 9% lower chance of performing at proficiency if they did receive

22
tutoring. This is a surprising result, given that tutoring is a federally-mandated program intended
to improve a student’s chance of performing well on the exam. Column (4) adds student-level
covariates, all of which are significant with the exception of tutoring eligibility, homelessness,
and Title III status. These coefficients all take the expected signs. Race and gifted/IEP status all
have effects greater than 10% on student proficiency. Column (5) adds school-level covariates.
Student-teacher ratio and white student ratio have insignificant effects on proficiency level.
Mean teacher experience and the ratio of teachers with Master’s degrees both have positive and
significant effects on student proficiency. Weapons violations per student and the free-and-
reduced lunch ratio both have large, negative, and significant effect on student proficiency.
4Sight math does not have a significant effect in any specification.
Table 14 presents the results for PSSA reading. In column (1), we see that, in the
absence of covariates, performing at or above proficiency in 2005 meant the student had a 65%
chance of performing at or above proficiency in 2006. Column (2) adds a dummy variable for
use of 4Sight reading, which has a small negative but insignificant effect on student proficiency.
Column (3) includes dummy variables for whether the student was eligible and/or received
NCLB-mandated tutoring. Again, even after controlling for eligibility, students had a 6% lower
chance of performing at proficiency if they did receive tutoring. Column (4) adds student-level
covariates, tutoring eligibility, receipt of tutoring, and homelessness have insignificant impacts
on student proficiency level. The remaining coefficients take the expected signs, with females
performing at proficiency 3% more often than males, black students about 2% less often and
Hispanic student about 13% less often than white students. Title III status has a negative effect
of about 2% on proficiency, and gifted/IEP status all have effects of the expected sign around
25% on student proficiency. Column (5) adds school-level covariates. Mean teacher experience,

23
student-teacher ratio, and white student ratio have insignificant effects on proficiency level. The
ratio of teachers with Master’s degrees has a positive and significant effects on student
proficiency. Weapons violations per student and the free-and-reduced lunch ratio both have
large, negative, and significant effect on student proficiency. 4Sight math has a negative effect
of 1-2% on proficiency level across all specifications, though the coefficient is only significant in
column (4).
Individual Student Results: Reporting Categories
Tables 16-19 present OLS regressions of student performance within reporting categories
which are measured as percent correct. Tables 16-17 are simple regressions of student
performance in 2005 on performance in 2006 within each reporting category. Table 16 shows
that a student’s math performance within a reporting category does predict their performance the
following year; the coefficients are all positive and significant, ranging from 0.90 in Category A
(Numbers and Operations) to 0.56 in Category B (Measurement). Table 17 shows that a
student’s reading performance within a reporting category predicts their performance the
following year. The coefficients are positive and significant.
Tables 18-19 add covariates to the regressions performed in Tables 16-17. Table 18
presents results for PSSA math by reporting category. The coefficient on 4Sight is positive and
significant in category A, negative and significant in category E, and insignificant and near zero
in categories B, C, and D. The coefficients on the covariates are significant and have the
expected signs, with the exception of gender, whose sign varies between reporting categories.
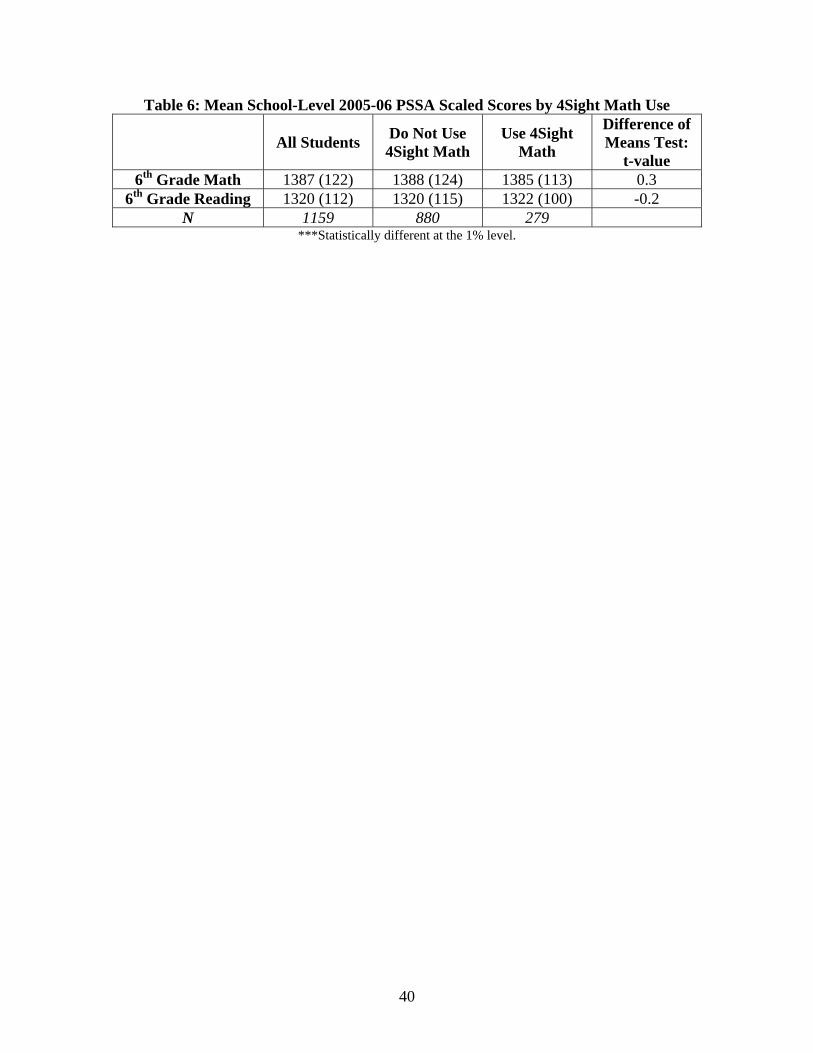
The coefficient on black varies in magnitude between reporting categories. Table 19 presents
results for PSSA reading by reporting category. The coefficients on 4Sight are negative,

24
significant, and larger in category A than in category B. The coefficients on the covariates have
the expected signs.
School-Level Results: OLS
School-level OLS estimates of equation (1) were estimated with and without the control
variables, and are presented in Tables 20 and 21. These regressions are identical to those run at
the individual-level (Tables 10 and 11), but use mean aggregated data in place of individual data.
Table 20 presents results for the PSSA math scaled scores. The first row of coefficients
can be interpreted as elasticities of student performance in 2006 given performance in 2005.
Column (1) shows that in the absence of covariates, a 10% increase in 2005 scaled score implies
a 9.7% increase in 2006 scaled score. This elasticity is noticeably larger than the elasticities
from the individual-level analysis. The coefficients on 4Sight are small and insignificant in all
specifications of the model. Column (3) adds individual-level covariates to the regression, all of
which have the expected signs. Column (4) adds teachers’ average Praxis scores, with a
significant positive coefficient on teachers’ writing scores, and significant negative coefficient on
teachers’ math scores. Column (5) adds teachers’ average NTE scores, with insignificant
coefficients on professional and common knowledge scores, and a significant, negative
coefficient on general knowledge scores.
Table 21 presents results for the PSSA reading scaled scores. Again, the first row of
coefficients can be interpreted as elasticities of student performance in 2006 given performance
in 2005. Column (1) shows that in the absence of covariates, a 10% increase in 2005 scaled
score implies an 8.7% increase in 2006 scaled score, which is again lower than in the case of the
math scaled scores at the school-level, and higher than the reading scaled scores at the
individual-level. The coefficients on 4Sight are small and insignificant in all specifications of

25
the model. Column (3) adds individual-level covariates to the regression, all of which have the
expected signs. Column (4) adds teachers’ average Praxis scores, with a significant positive
coefficient on teachers’ writing scores. Column (5) adds teachers’ average NTE scores, with
insignificant coefficients on professional and common knowledge scores, and a significant,
negative coefficient on general knowledge scores.
School-Level Results: Matching Models
Propensity scores were estimated using a probit model regressing 4Sight use on the
school-level covariates that were significantly different in Tables 5 and 7, and both the mean
math and mean reading scaled scores from 2005. Histograms of propensity scores for schools
using and not using 4Sight are presented in Figures 1 and 2. A two-sample Kolmogorov-
Smirnov test for distributional equality was performed to compare the distributions of propensity
scores for schools using and not using 4Sight, and for both reading and math these distributions
were found to be statistically different at the 1%-level. This is further evidence that there are in
fact differences between the treated and untreated groups. There is a large area of overlap over
the support for treated and non-treated districts for both 4Sight tests. Treated schools were
matched to their nearest-neighbor based on propensity score to calculate the ATT and the
standard errors were evaluated using the population variance estimator proposed in Abadie and
Imbens (2006). Estimates of the ATT are presented in Tables 22 and 23. The estimates are
negative. The estimate of -19.013 for reading is significant at the 5%-level.
Summary and Discussion
The coefficients on 4Sight vary in level of significance and in sign across the many
specifications. At the individual level, 4Sight has a small positive effect (one- to two-tenths of a
percentage point) in some specifications of the math model, and has a negative effect of slightly

26
larger magnitude in all specifications of the reading model. There does not appear to be a large
difference in the effect of 4Sight across the distribution of student performance. Similarly, the
probit regressions show that 4Sight does not have a significant effect on student proficiency level
in math, and has a small negative effect on student proficiency level in reading. When broken
down by reporting category, 4Sight math seems to have a positive effect in category A (Numbers
and Operations), and a slightly smaller negative effect in category E (Data and Probability). In
reading, 4Sight has a negative effect on both reporting categories. There is no clear pattern
between the coefficients on 4Sight use and the percentage of eligible content that is covered by
4Sight within each reporting category.23 This evidence suggests that in its first year 4Sight did
not improve student performance on the PSSA and in fact negatively affected reading scores.
The descriptive statistics show that the group of schools using 4Sight in 2005-06 is rich
and white compared to schools not using 4Sight. In addition, these schools have significantly
smaller class sizes. This suggests that the effect of 4Sight use that we have measured, the
“treatment on the treated,” is not necessarily accurate in terms of inference. In other words, we
cannot predict the effect of 4Sight on schools significantly different than those currently using
4Sight.
Some caution should be used in interpreting these results. OLS and matching estimators
do a good job of controlling for observed differences between treated and untreated students and
schools, but there is reason to suspect that some endogeneity remains in the model. If there is an
unobserved factor that both increases the likelihood that a school uses 4Sight and affects PSSA
scores, this can cause our estimates of the effect of 4Sight to be biased. The descriptive statistics
suggest that relatively wealthy schools that are more active in seeking additional help for their
23 A scatter plot comparing the percentage of coverage to the 4Sight coefficient within math reporting categories is presented in the appendix. No clear pattern emerges in this figure.

27
students are using 4Sight than those not using 4Sight; if we believe that an unobserved factor
common to these schools but not the others contributes to the school’s decision to use 4Sight,
then we might expect this factor also to cause treated students to have higher PSSA scores
regardless of 4Sight treatment. If this is the case, then our estimates of the 4Sight treatment
effect are upwardly biased, and 4Sight actually has more of a negative effect than the coefficients
convey.
An interesting outcome of the reporting category analysis is the emergence of differences
among demographic groups within certain reporting categories. Specifically, girls perform
significantly better than boys on reporting categories A (Numbers and Operations) and C
(Geometry) and significantly worse than boys on reporting categories B (Measurement) and E
(Data Analysis and Probability). Also, black students perform significantly worse than white
students in all math reporting categories, but the coefficient has twice the magnitude in reporting
category B (Measurement). The quartile regressions also reflect several interesting findings that
the authors have not seen reported in the literature.24 Minority status and poverty seem to have
larger effects on students towards the bottom of the distribution. Also, the elasticity of reading
test performance from year to year is much higher at lower percentiles of the distribution than
higher. Finally, probit regressions show that scoring at proficiency last year has surprisingly low
predictive power for scoring at proficiency level this year, and in addition, reveal that students
receiving tutoring under NCLB are significantly and between four and nine percent less likely to
pass their exams, even after controlling for all covariates, including eligibility for tutoring. This
is a surprising negative result, implying that this publicly-funded tutoring is actually hurting
those students who receive it.
24 Sudies such as Levin (2001) and Eide and Showalter (1998) have used quantile regression to analyze education production, but have not reported coefficients for individual student characteristics such as gender, race, or enrollment in various educational programs.

28
6. Conclusions, Implications, and Future Research
Our analysis of the alignment of the 6th grade Pennsylvania 4Sight exams has revealed coverage
of 40% of the eligible content on the reading exam and 80% of the eligible content on the math
exam. The failure of 4Sight to have a significant or positive effect on PSSA scores might be
caused in part by its incomplete coverage. We suggest that the coverage of 4Sight be expanded
to become fully aligned with the Pennsylvania state standards in math and reading. This is
feasible at the 6th grade level without lengthening the 4Sight exams. Our analysis of the current
training for and usage of 4Sight show that the assessment provides direct feedback to teachers
but not to students. We suggest that Success for All and the PDE include additional tools and
training with 4Sight to allow both teachers and students to receive formal feedback from each
test so that it becomes a true formative assessment as defined by the National Research Council.
Our estimates of OLS and matching models of the education production function reveal
that 4Sight has a small and indeterminate effect on student performance on the math PSSA in its
pilot year and a small and negative effect on student performance on the reading PSSA.25
Despite this evidence, careful and thorough statistical analysis of PSSA performance with regard
to 4Sight should be performed to establish a reliable pattern of the effects of the intervention. It
is clear from the initial results, however, that widespread use of 4Sight should be put off until it
can be improved as an effective tool for improving student performance. In light of these results,
policy-makers at the school, district, and state levels should be wary when committing to
25 These findings, in effect an evaluation of an intervention intended to boost student test scores, are not dissimilar to results from Bifulco, Duncombe, and Yinger (2005), in which the authors evaluated programs of whole-school reform, including one offered by Success for All, and found that these programs did not effect student reading outcomes.

29
interventions intended to improve student test scores in response to NCLB, especially when
choosing to use these interventions on a large scale.
In addition to our findings regarding school-level interventions designed to help raise
student performance on standardized tests, our analysis joins a rich literature which provides
estimates of the education production function. The coefficients on covariates in the individual
and school-level OLS models are within the range of coefficients commonly found in the
literature. In addition, we have provided coefficients on teacher test scores; Wayne and Youngs
(2003) survey the studies including teacher test scores in education production functions, and our
estimates on the National Teacher Examination (NTE) and Praxis tests confirm a finding
summarized in their paper: “test scores matter, if college ratings have not already been taken into
account” (Wayne and Youngs 2003, p.100). Perhaps the most surprising finding of this paper is
that while 4Sight has a little or no effect on student outcomes, students receiving tutoring under
NCLB are significantly and between four and nine percent less likely to pass their exams, even
after controlling for all covariates, including eligibility for tutoring. This implies that the
publicly-funded tutoring is actually hurting those students who receive it.

30
6. References
Abadie, Alberto, David Drukker, Jane Leber Herr, and Guido W. Imbens. 2001. Implementing
matching estimators for average treatment effects in Stata. The Stata Journal 1(1): 1-18.
Abadie, Alberto, and Guido W. Imbens. 2006. Large sample properties of matching estimators
for average treatment effects. Econometrica 74(1): 235-267.
Abadie, Alberto, and Guido W. Imbens. 2008. On the failure of the bootstrap for matching
estimators. Econometrica 76(6): 1537-1557.
Bifulco, Robert, William Duncombe, and John Yinger. 2005. Does whole-school reform boost
student performance? The case of New York City. Journal of Policy Analysis and Management
24 (1): 47-72.
Boardman, Anthony E., Otto A. Davis, and Peggy R. Sanday. 1977. A simultaneous equations
model of the educational process. Journal of Public Economics 7: 23-49.
Boardman, Anthony E., and Richard J. Murnane. 1979. Using Panel Data to Improve Estimates
of the Determinants of Educational Achievement. Sociology of Education 52(2): 113-121.
Cavanagh, Sean, and David J. Hoff. 2008. Schools found likely to miss NCLB targets. Education
Week 28 (6): 9.

31
Data Recognition Corporation. 2007. Technical report for the Pennsylvania System of School
Assessment: 2006 Reading and mathematics grades 4, 6, and 7. Available
http://www.pde.state.pa.us/a_and_t/lib/a_and_t/2006_ReadingMathGr4_6_7_Tech_Report.pdf.
Accessed 31 July 2008.
Data Recognition Corporation. 2005. Technical report for the Pennsylvania System of School
Assessment: 2005 reading and mathematics. Available
http://www.pde.state.pa.us/a_and_t/lib/a_and_t/
2005_PSSA_Reading_and_Math_Technical_Report.pdf. Accessed 31 July 2008.
Eide, Eric and Mark H. Showalter. 1998. The effect of school quality on student performance: A
quantile regression approach. Economic Letters 58: 345-350.
Hanushek, Eric A. 1986. The Economics of Schooling: Production and Efficiency in Public
Schools. Journal of Economic Literature 24(3): 1141-1177.
Heckman, James J. and Lalonde, Robert J. & Smith, Jeffrey A. 1999. The economics and
econometrics of active labor market programs. In Handbook of labor economics 1(3), edited by
O. Ashenfelter and D. Card, pp. 1865-2097. Amsterdam: Elsevier.
Hoover Institution, Stanford University. 2006. Facts on policy: School funding shift. Available
http://www.hoover.org/research/factsonpolicy/facts/4249156.html. Accessed 3 March 2009.

32
Krueger, Alan B. 1999. Experimental estimates of education production functions. The Quarterly
Journal of Economics 114(2): 497-532.
LaLonde, Robert J. 1986. Evaluating the econometric evaluations of training programs with
experimental data. American Economic Review 76 (4): 604-620.
Levin, Jesse. 2001. For whom the reductions count: A quantile regression analysis of class size
and peer effects on scholastic achievement. Empirical Economics 26: 221-246.
National Research Council. 2000. How people learn: Brain, mind, experience, and school. 5th
edition. Washington, D.C.: National Academy Press.
PaTTAN. 2008. Training Events. Available
http://www.pattan.k12.pa.us/TrainingEvents.aspx?ContentLocation=/teachlead/AssessingtoLear
n.aspx. Accessed 27 August 2009.
PaTTAN. 2009. Assessing to Learn: PA Benchmark Initiative. Available
http://www.pattan.net/teachlead/AssessingtoLearn.aspx. Accessed 27 September 2009.
The Pew Research Center for the People and the Press. 2007. Young women propel Clinton's
lead in '08 test: A year ahead, Republicans face tough political terrain. Press release, 31 October.
Available http://people-press.org/report/?pageid=1205. Accessed 27 August 2008.

33
Rosenbaum, Paul R. and Donald B. Rubin. 1983. The central role of the propensity score in
observational studies for causal effects. Biometrika 70: 41-55.
Strauss, Robert P and Elizabeth A. Sawyer. 1986. Some new evidence on teacher and student
competency. Economics of Education Review 5(1): 41-48.
Strauss, Robert P., Lori Bowes, Mindy Marks, and Mark Plesko. 2000. Improving teacher
preparation and selection: Lessons from the Pennsylvania experience, Economics of Education
Review 19(4): 387-415.
Strauss, Robert P. and William B. Vogt. 2007. Should teachers know, or know how to teach?
Unpublished manuscript, Heinz College, Carnegie Mellon.
Success for All Foundation. 2009a. 4Sight Reading and Math Benchmarks 2008-2009 Technical
Report for Pennsylvania. Unpublished manuscript.
Success for All Foundation. 2009b. Elementary 4Sight Benchmarks. Available
http://www.successforall.org/elementary/4sight.htm. Accessed 27 September 2009.
Success for All Foundation. 2009c. Making AYP: Active Benchmarks. Available
http://www.successforall.org/ayp/benchmarks.htm. Accessed 27 September 2009.

34
Todd, Petra E. and Kenneth I. Wolpin. 2003. Towards a unified approach for modeling the
production function for cognitive achievement. Economic Journal 113(485): 3-33.
Viadero, Debra. 2007. No easy answers about NCLB’s effect on ‘poverty gap.’ Education Week
27(12): 12.
Wayne, Andrew J. and Peter Youngs. 2003. Teacher characteristics and student achievement
gains: A review. Review of Educational Research 73(1): 89-122.

35
7. Tables & Figures
Table 1: Student-Level Descriptive Statistics by 4Sight Math Use Do Not Use
4Sight Math
Use 4Sight Math
Difference of Means
Test1
Female .491 (.500) .496 (.500) White .745 (.436) .782 (.413) Black .168 (.374) .126 (.332)
Hispanic .055 (.228) .072 (.259) Other .028 (.166) .015 (.120)
Eligible for Tutoring .025 (.155) .023 (.150) Received Tutoring .006 (.079) .009 (.094)
Homeless .001 (.031) .001 (.029) Title I .258 (.437) .209 (.406)
Title III .075 (.263) .093 (.291) Gifted .063 (.243) .048 (.214)
Stud
ent C
hara
cter
istic
s
IEP .146 (.353) .159 (.365)
86.123***
Mean Teacher Experience 13.7 (3.5) 14.1 (3.3) -16.6*** Student-Teacher Ratio 15.7 (3.3) 15.2 (2.0) 25.4***
Students on Free and Reduced Lunch
.317 (.272) .353 (.237) -20.0***
Percentage of White Students .742 (.326) .780 (.261) -18.2*** Weapons Violations Per Student .002 (.003) .002 (.003) 3.9*** Teachers With Master’s Degrees .4421 .415 (.155) 24.1***
Average Praxis I: Reading Percent Correct†
.757 (.055) .754 (.055) 9.6***
Average Praxis I: Writing Percent Correct††
.677 (.044) .676 (.044) 3.7***
Average Praxis I: Math Percent Correct†††
.771 (.070) .768 (.073) 6.4***
Average NTE: Common Knowledge Percent Correct‡
.652 (.045) .650 (.041) 6.3***
Average NTE: General Knowledge Percent Correct‡‡
.625 (.049) .627 (.042) -6.8*** Stud
ent’
s Sch
ool C
hara
cter
istic
s
Average NTE: Professional Knowledge Percent Correct‡‡‡
.654 (.060) .660 (.051) -16.6***
N 89,153 29,367 1For the set of binary variables, an F-statistic reflects the Hotelling generalized means test. For each continuous
variable, a t-statistic reflects a simple difference in means test. †N is 86,468 (non-users) and 27,744 (users). ††N is 86,386 (non-users) and 27,744 (users). †††N is 86,541(non-users) and 27,982 (users). ‡N is 88,475 (non-users) and
29,046 (users). ‡‡N is 88,595 (non-users) and 28,982 (users). ‡‡‡N is 84,089 (non-users) and 27,642 (users). *Statistically different at the 10% level. **Statistically different at the 5% level. ***Statistically different at the 1%
level.

36
Table 2: Mean Student-Level 2005-06 PSSA Scaled Scores by 4Sight Math Use
All Students Do Not Use 4Sight Math
Use 4Sight Math
Difference of Means Test:
t-value 6th Grade Math 1406 (226) 1411 (226) 1402 (223) 6.3***
6th Grade Reading 1341 (208) 1346 (207) 1335 (207) 7.6*** N 119,778 89,153 29,367
***Statistically different at the 1% level.

37
Table 3: Student Descriptive Statistics by 4Sight Reading Use Do Not Use
4Sight Reading
Use 4Sight Reading
Difference of Means
Test1 Female .491 (.500) .496 (.500) White .744 (.436) .784 (.411) Black .168 (.374) .126 (.332)
Hispanic .055 (.228) .071 (.257) Other .028 (.166) .015 (.121)
Eligible for Tutoring .024 (.152) .026 (.158) Received Tutoring .006 (.077) .010 (.100)
Homeless .001 (.032) .001 (.028) Title I .260 (.439) .203 (.402)
Title III .075 (.264) .091 (.288) Gifted .064 (.244) .047 (.211)
Stud
ent C
hara
cter
istic
s
IEP .147 (.353) .157 (.364)
94.796***
Mean Teacher Experience 13.7 (3.5) 14.0 (3.3) -15.1*** Student-Teacher Ratio 15.7 (3.3) 15.2 (1.9) 27.0***
Students on Free and Reduced Lunch
.317 (.273) .354 (.233) -21.0***
Percentage of White Students .742 (.326) .782 (.260) -19.3*** Weapons Violations Per Student .002 (.003) .002 (.003) 5.3*** Teachers With Master’s Degrees .444 (.171) .409 (.156) 31.8***
Average Praxis I: Reading Percent Correct†
.757 (.055) .753 (.055) 8.9***
Average Praxis I: Writing Percent Correct††
.677 (.044) .676 (.043) 2.5**
Average Praxis I: Math Percent Correct†††
.771 (.070) .769 (.072) 3.8***
Average NTE: Common Knowledge Percent Correct‡
.652 (.045) .651 (.041) 4.2***
Average NTE: General Knowledge Percent Correct‡‡
.625 (.049) .627 (.042) -7.3*** Stud
ent’
s Sch
ool C
hara
cter
istic
s
Average NTE: Professional Knowledge Percent Correct‡‡‡
.655 (.060) .660 (.052) -12.9***
N 88,626 29,894 1For the set of binary variables, an F-statistic reflects the Hotelling generalized means test. For each continuous
variable, a t-statistic reflects a simple difference in means test. †N is 85,941 (non-users) and 27,744 (users). ††N is 85,859 (non-users) and 27,744 (users). †††N is 86,014 (non-users) and 27,982 (users). ‡N is 87,948 (non-users) and
29,046 (users). ‡‡N is 88,068 (non-users) and 28,982 (users). ‡‡‡N is 83,560 (non-users) and 27,642 (users). *Statistically different at the 10% level. **Statistically different at the 5% level. ***Statistically different at the 1%
level.

38
Table 4: Mean Student-Level 2005-06 PSSA Scaled Scores by 4Sight Reading Use
All Students Do Not Use 4Sight Math
Use 4Sight Math
Difference of Means Test:
t-value 6th Grade Math 1409 (225) 1411 (227) 1402 (222) 6.2***
6th Grade Reading 1343 (207) 1346 (207) 1335 (206) 7.4*** N 118,520 88,626 29,894
***Statistically different at the 1% level.

39
Table 5: School-Level Descriptive Statistics by 4Sight Math Use Do Not Use
4Sight Math
Use 4Sight Math
Difference of Means
Test: t-value
Mean % Female .487 (.093) .494 (.112) -1.1 Mean % White .684 (.381) .767 (.308) -3.3*** Mean % Black .234 (.346) .160 (.263) 3.3***
Mean % Hispanic .050 (.129) .054 (.112) -0.4 Mean % Other .023 (.047) .014 (.027) 3.0***
Mean % Eligible for Tutoring .022 (.095) .040 (.139) -2.4** Mean % Received Tutoring .006 (.039) .016 (.080) -2.7***
Mean % Homeless .001 (.008) .001 (.006) 0.6 Mean % Title I .354 (.446) .263 (.396) 3.0***
Mean % Title III .088 (.251) .078 (.240) 0.6 Mean % Gifted .051 (.058) .041 (.049) 2.6***
Mean % IEP .165 (.111) .179 (.104) -2.2** Mean Teacher Experience 13.5 (4.19) 14.4 (3.69) -3.7***
Student-Teacher Ratio 15.7 (4.17) 15.0 (2.32) 2.7*** Students on Free and Reduced
Lunch .383 (.292) .389 (.249) -0.4
Weapons Violations Per Student .002 (.007) .002 (.003) 1.1 Teachers With Master’s Degrees .409 (.177) .412 (.163) -0.4
Average Praxis I: Reading Percent Correct†
.753 (.061) .747 (.063) 1.3
Average Praxis I: Writing Percent Correct††
.674 (.047) .671 (.051) 0.8
Average Praxis I: Math Percent Correct†††
.761 (.077) .759 (.083) 0.2
Average NTE: Common Knowledge Percent Correct‡
.645 (.053) .647 (.048) -0.6
Average NTE: General Knowledge Percent Correct‡‡
.615 (.057) .620 (.048) -1.3
Average NTE: Professional Knowledge Percent Correct‡‡‡
.652 (.068) .659 (.060) -1.4
N 880 279 †N is 822 (non-users) and 248 (users). ††N is 821 (non-users) and 248 (users). †††N is 823(non-users) and 251
(users). ‡N is 858 (non-users) and 270 (users). ‡‡N is 861 (non-users) and 268 (users). ‡‡‡N is 767 (non-users) and 246 (users). *Statistically different at the 10% level. **Statistically different at the 5% level. ***Statistically
different at the 1% level.
40
Table 6: Mean School-Level 2005-06 PSSA Scaled Scores by 4Sight Math Use
All Students Do Not Use 4Sight Math
Use 4Sight Math
Difference of Means Test:
t-value 6th Grade Math 1387 (122) 1388 (124) 1385 (113) 0.3
6th Grade Reading 1320 (112) 1320 (115) 1322 (100) -0.2 N 1159 880 279
***Statistically different at the 1% level.

41
Table 7: School-Level Descriptive Statistics by 4Sight Reading Use Do Not Use
4Sight Reading
Use 4Sight Reading
Difference of Means
Test: t-value
% Female .487 (.091) .493 (.112) -0.9 % White .682 (.382) .773 (.305) -3.6*** % Black .235 (.346) .155 (.259) 3.6***
% Hispanic .050 (.129) .052 (.111) -0.2 % Other .023 (.046) .014 (.027) 3.1***
% Eligible for Tutoring .021 (.092) .044 (.143) -3.1*** % Received Tutoring .006 (.038) .018 (.081) -3.5***
% Homeless .001 (.008) .001 (.006) 0.6 % Title I .355 (.447) .258 (.391) 3.3***
% Title III .089 (.252) .076 (.237) 0.7 % Gifted .051 (.058) .040 (.049) 3.0***
% IEP .164 (.104) .176 (.105) -1.7* Mean Teacher Experience 13.5 (4.18) 14.5 (3.69) -3.7***
Student-Teacher Ratio 15.8 (4.16) 15.0 (2.29) 2.9*** Students on Free and Reduced
Lunch .382 (.294) .391 (.245) -0.5
Weapons Violations Per Student .002 (.008) .002 (.003) 1.2 Teachers With Master’s Degrees .410 (.177) .407 (.163) 0.3
Average Praxis I: Reading Percent Correct†
.752 (.062) .747 (.063) 1.2
Average Praxis I: Writing Percent Correct††
.674 (.048) .672 (.050) 0.5
Average Praxis I: Math Percent Correct†††
.760 (.077) .761 (.082) -0.1
Average NTE: Common Knowledge Percent Correct‡
.644 (.053) .647 (.047) -0.8
Average NTE: General Knowledge Percent Correct‡‡
.615 (.057) .620 (.049) -1.4
Average NTE: Professional Knowledge Percent Correct‡‡‡
.652 (.068) .658 (.062) -1.2
N 874 285 †N is 816 (non-users) and 254 (users). ††N is 815 (non-users) and 254 (users). †††N is 817 (non-users) and 257
(users). ‡N is 852 (non-users) and 276 (users). ‡‡N is 855 (non-users) and 274 (users). ‡‡‡N is 763 (non-users) and 250 (users). *Statistically different at the 10% level. **Statistically different at the 5% level. ***Statistically
different at the 1% level.

42
Table 8: Mean School-Level 2005-06 PSSA Scaled Scores by 4Sight Reading Use
All Students Do Not Use 4Sight Math
Use 4Sight Math
Difference of Means Test:
t-value 6th Grade Math 1387 (122) 1388 (125) 1386 (112) 0.3
6th Grade Reading 1320 (112) 1320 (115) 1322 (99) -0.3 N 1159 874 285
***Statistically different at the 1% level.

43
Table 9: Stochastic Specifications Individual-Level OLS
( ) ( )( )( )( )
0 1
2
3 4 5 6 7 8 9 10 11
12 13 14 15
log 06 log 05
2 4
3
4
is is
s
is is is is is is is is is
s s s
PSSA PSSA
Sight
TutorElig Tutor Female RaceDummies Homeless TitleI TitleIII Gifted IEP
TeachExp StuTeachRat FRL WhiteStuR
β β
β
β β β β β β β β β
β β β β
= +
+
+ + + + + + + + +
+ + + +
( )( )
16 17
18
29
/
5
6
s s s
s
is
at Weapons Stu Masters
NTE
β β
β
β
ε
+ +
+
+
+
sPraxis
Individual-Level Quantile Regressions (25%, 50%, 75%) ( ) ( )
( )( )( )
0 1
2
3 4 5 6 7 8 9 10 11
12 13 14 15
log 06 log 05
2 4
3
4
is is
s
is is is is is is is is is
s s s
PSSA PSSA
Sight
TutorElig Tutor Female RaceDummies Homeless TitleI TitleIII Gifted IEP
TeachExp StuTeachRat FRL WhiteStuR
β β
β
β β β β β β β β β
β β β β
= +
+
+ + + + + + + + +
+ + + + 16 17/s s s
is
at Weapons Stu Mastersβ βε
+ +
+
Individual-Level Probit: Proficiency
( )( )( )
0 1
2
3 4 5 6 7 8 9 10 11
12 13 14 15
06 052 4
3
4
is is
s
is is is is is is is is is
s s s
proficient proficientSight
TutorElig Tutor Female RaceDummies Homeless TitleI TitleIII Gifted IEP
TeachExp StuTeachRat FRL Whi
β β
β
β β β β β β β β β
β β β β
= +
+
+ + + + + + + + +
+ + + + 16 17/s s s
is
teStuRat Weapons Stu Mastersβ β
ε
+ +
+
Individual-Level Tobit: Reporting Category
( )0 1
2 3 4 5 6 7 8 9 10 11
12 13 14
% %2 4
is is
s is is is is is is is is is
s s s
Category Correct Category CorrectSight TutorElig Tutor Female RaceDummies Homeless TitleI TitleIII Gifted IEP
TeachExp StuTeachRat FRL
β β
β β β β β β β β β β
β β β
= +
+ + + + + + + + + +
+ + + + 15 16 17/s s s
is
WhiteStuRat Weapons Stu Mastersβ β βε
+ +
+

44
Table 9 (continued): Stochastic Specifications School-Level OLS
( ) ( )( )( )
0 1
2
3 4 5 6 7 8 9 10 11
12 13 14 15
log 06 log 05
2 4
3 % % % % % % % % %/
s s
s
s s s s s s s s s
s s s
meanPSSA meanPSSA
Sight
TutorElig Tutor Female Race Homeless TitleI TitleIII Gifted IEPTeachExp StuTeachRat FRL Weapons Stu
β β
β
β β β β β β β β β
β β β β
= +
+
+ + + + + + + + +
+ + + +
( )( )
16
17
18
5
6
s
s
s
Masters
NTE
β
β
β
ε
+
+
+
+
sPraxis
Propensity Scores for Matching Models: Probit 0 1 2 3 4 5 6 7 8 9 104 05 % % % % %s s s s s s s s s s s sSight PSSA tutor tutorelig white black TitleI GIEP IEP TeachExp StuTeachRatβ β β β β β β β β β β ε= + + + + + + + + + + +

45
Table 10: Individual-level OLS Results: Math (1) (2) (3) (4) (4a)
Elasticities (5) (6)
Log of 2006 6th Grade Math Scaled Score 0.8473 0.8473 0.7415 0.7361 0.7344 0.7355 Log of 2005 5th Grade
Math Scaled Score (0.0040)*** (0.0039)*** (0.0046)*** (0.0045)*** (0.0046)*** (0.0047)*** 0.0001 -0.0008 0.0012 0.0008 0.0016 4Sight Math (0.0031) (0.0028) (0.0028) (0.0028) (0.0028) -0.0077 -0.0067 -0.0074 -0.0062 Eligible for Tutoring (0.006) (0.0058) (0.0062) (0.0062) -0.0105 -0.0145 -0.0142 -0.0152 Receiving Tutoring (0.0072) (0.0069)** (0.0073)** (0.0073)** -0.0013 -0.0015 -0.0015 -0.0015 Female (0.0006)** (0.0006)*** (0.0006)** (0.0006)*** -0.0327 -0.0245 -0.0249 -0.024 Black (0.0021)*** (0.0015)*** (0.0016)*** (0.0016)*** -0.0226 -0.0147 -0.0148 -0.0156 Hispanic (0.0029)*** (0.0026)*** (0.0026)*** (0.0026)*** 0.0165 0.0172 0.0169 0.0171 Other (0.0024)*** (0.0022)*** (0.0021)*** (0.0022)*** -0.0227 -0.0177 -0.0182 -0.0135 Homeless (0.0098)** (0.0095)* (0.0095)* (0.0103) -0.017 -0.0027 -0.0019 -0.0033 Title I (0.0024)*** (0.0031) (0.0032) (0.0032) 0.0037 0.0038 0.0033 0.004 Title III (0.0041) (0.004) (0.0042) (0.0042) 0.054 0.053 0.0534 0.0533 Gifted (0.0017)*** (0.0018)*** (0.0018)*** (0.0018)*** -0.047 -0.0476 -0.048 -0.0479 IEP (0.0015)*** (0.0015)*** (0.0015)*** (0.0016)*** 0.0005 0.0073 0.0005 0.0003 Mean Teacher
Experience (0.0004) (0.0004) (0.0004) -0.0001 -0.0013 0 0.0002 Student-Teacher Ratio (0.0004) (0.0004) (0.0004) -0.0321 -0.0105 -0.0322 -0.0324 Free and Reduced
Lunch Ratio (0.0059)*** (0.0060)*** (0.0061)*** 0.0022 0.0017 0.0036 0.0015 White Student Ratio (0.006) (0.0062) (0.0063) -0.8781 -0.0018 -0.73 -0.9287 Weapons Violations
Per Student (0.3727)** (0.3950)* (0.4260)** 0.0153 0.0067 0.0123 0.0179 Ratio of Teachers with
Master’s Degree (0.0066)** (0.0071)* (0.0070)** -0.0057 Mean Praxis Reading
Percent Correct (0.0258) 0.0791 Mean Praxis Writing
Percent Correct (0.0324)** -0.0324 Mean Praxis Math
Percent Correct (0.0190)* 0.0354 Mean NTE Common
Knowledge Percent Correct (0.0414)
-0.0532 Mean NTE General Knowledge Percent
Correct (0.0349)
0.022 Mean NTE Professional
Knowledge Percent Correct
(0.0224)
1.0938 1.0937 1.8754 1.9075 1.8934 1.9084 Constant (0.0285)*** (0.0283)*** (0.0335)*** (0.0338)*** (0.0386)*** (0.0393)***
Observations 118,391 118,391 118,391 118,391 113,878 111,626 Adjusted R-squared 0.6867 0.6867 0.7091 0.7117 0.7119 0.7120
Robust, clustered (by school) standard errors in parentheses * significant at 10%; ** significant at 5%; *** significant at 1%

46
Table 11: Individual-level OLS Results: Reading (1) (2) (3) (4) (4a)
Elasticities (5) (6)
Log of 2006 6th Grade Reading Scaled Score 0.7291 0.7290 0.6275 0.6204 0.6201 0.6185 Log of 2005 5th Grade
Reading Scaled Score (0.0032)*** (0.0032)*** (0.0033)*** (0.0032)*** (0.0033)*** (0.0033)*** -0.0027 -0.0039 -0.0017 -0.0017 -0.0016 4Sight Reading (0.0022) (0.0020)* (0.002) (0.0021) (0.0021) -0.0045 -0.0037 -0.0024 -0.0025 Eligible for Tutoring (0.0053) (0.0046) (0.0047) (0.0047) -0.011 -0.015 -0.0165 -0.015 Receiving Tutoring (0.0072) (0.0062)** (0.0062)*** (0.0063)** 0.0095 0.0095 0.0094 0.0095 Female (0.0006)*** (0.0006)*** (0.0006)*** (0.0006)*** -0.0309 -0.0229 -0.0228 -0.0229 Black (0.0020)*** (0.0016)*** (0.0016)*** (0.0016)*** -0.0229 -0.0157 -0.0154 -0.0169 Hispanic (0.0030)*** (0.0027)*** (0.0027)*** (0.0027)*** 0.0074 0.0079 0.0077 0.0068 Other (0.0020)*** (0.0020)*** (0.0020)*** (0.0020)*** -0.0249 -0.0199 -0.0203 -0.0085 Homeless (0.0119)** (0.0114)* (0.0115)*** (0.0108) -0.0185 -0.0052 -0.0044 -0.0061 Title I (0.0021)*** (0.0025)** (0.0026)* (0.0026)** 0.0009 0.0009 -0.0001 0.0007 Title III (0.0027) (0.0027) (0.0027) (0.0028) 0.0473 0.0465 0.0467 0.0465 Gifted (0.0013)*** (0.0013)*** (0.0013)*** (0.0013)*** -0.0534 -0.0547 -0.0548 -0.0551 IEP (0.0015)*** (0.0015)*** (0.0015)*** (0.0015)*** 0.0001 0.0017 0.0003 0.0002 Mean Teacher
Experience (0.0003) (0.0003) (0.0003) -0.0004 -0.0064 -0.0003 -0.0001 Student-Teacher Ratio (0.0003) (0.0003) (0.0003) -0.0236 -0.0077 -0.0234 -0.0235 Free and Reduced
Lunch Ratio (0.0048)*** (0.0051)*** (0.0051)*** 0.0047 0.0035 0.0046 0.0014 White Student Ratio (0.0047) (0.0049) (0.0049) -1.2875 -0.0027 -1.2953 -1.4479 Weapons Violations
Per Student (0.3053)*** (0.3267)*** (0.3377)*** 0.0241 0.0105 0.0227 0.0228 Ratio of Teachers with
Master’s Degree (0.0049)*** (0.0051)*** (0.0051)*** -0.0074 Mean Praxis Reading
Percent Correct (0.0173) 0.0704 Mean Praxis Writing
Percent Correct (0.0217)*** -0.0127 Mean Praxis Math
Percent Correct (0.0139) 0.0303 Mean NTE Common
Knowledge Percent Correct (0.0299)
-0.0015 Mean NTE General Knowledge Percent
Correct (0.0264)
0.0207 Mean NTE Professional
Knowledge Percent Correct
(0.0165)
1.9508 1.9523 2.6928 2.7401 2.7064 2.7186 Constant (0.0232)*** (0.0233)*** (0.0239)*** (0.0249)*** (0.0286)*** (0.0300)***
Observations 117,974 117,974 117,974 117,974 113,475 111,225 Adjusted R-squared 0.6691 0.6692 0.6916 0.6942 0.6944 0.6945 Robust, clustered (by school) standard errors in parentheses * significant at 10%; ** significant at 5%; *** significant at 1%

47
Table 12: Individual-Level Quartile Regressions: Math
(1) (2) (3) (3a) Elasticities (1) (2) (3) (3a)
Elasticities (1) (2) (3) (3a) Elasticities
Log of 2006 6th Grade Math Scaled Score 25% Quantile 50% Quantile 75% Quantile
0.8410 0.7362 0.731 0.8384 0.7362 0.7448 0.8456 0.7488 0.7429 Log of 2005 5th Grade Math Scaled Score2,3 (0.0033)*** (0.0025)*** (0.0024)*** (0.0018)*** (0.0025)*** (0.0026)*** (0.0032)*** (0.0018)*** (0.0033)***
0.0006 -0.0005 0.0016 0 -0.0006 0.0011 0 -0.0008 0.0011 4Sight Math (0.0008) (0.0007) (0.0007)* (0.0007) (0.0009) (0.0007) (0.0004) (0.0101) (0.0007)**
-0.0101 -0.0073 -0.0033 -0.0085 -0.0068 -0.0028 Eligible for Tutoring2
(0.0021)*** (0.0022)*** (0.0021) (0.0024) (0.0017)*** (0.0029)*** -0.0125 -0.009 -0.0179 -0.0171 -0.0076 -0.0171 Receiving Tutoring2
(0.0041)*** (0.0052)* (0.0051)*** (0.0047)*** (0.0049) (0.0047)*** -0.0007 -0.0017 -0.0019 -0.0016 -0.0022 -0.0013 Female (0.0007) (0.0006)** (0.0007)*** (0.0007)** (0.0010)*** (0.0006)*** -0.0337 -0.022 -0.0315 -0.0253 -0.0282 -0.0239 Black2
(0.0012)*** (0.0015)*** (0.0008)*** (0.0010)*** (0.0010)*** (0.0016)*** -0.0269 -0.0186 -0.0212 -0.0144 -0.0175 -0.0113 Hispanic2,3
(0.0023)*** (0.0014)*** (0.0014)*** (0.0015)*** (0.0016)*** (0.0013)*** 0.0125 0.0147 0.0156 0.0154 0.0155 0.0152 Other (0.0018)*** (0.0013)*** (0.0015)*** (0.0014)*** (0.0022)*** (0.0016)*** -0.0418 -0.011 -0.0273 -0.0219 -0.0081 -0.0282 Homeless2
(0.0093)*** (0.0118)* (0.0124)** (0.0133)** (0.0123) (0.0071) -0.0190 -0.0041 -0.0154 -0.0029 -0.0153 -0.0035 Title I2
(0.0012)*** (0.0011)*** (0.0008)*** (0.0009)*** (0.0007)*** (0.0014)*** 0.0052 0.0046 0.0042 0.0049 0.0035 0.0035 Title III (0.0014)*** (0.0009)*** (0.0009)*** (0.0011)*** (0.0018)* (0.0012)*** 0.0476 0.0471 0.0466 0.0551 0.0559 0.0463 Gifted2,3
(0.0015)*** (0.0014)*** (0.0007)*** (0.0013)*** (0.0015)*** (0.0014)*** -0.0548 -0.0559 -0.0409 -0.0334 -0.0329 -0.0408 IEP2,3
(0.0013)*** (0.0010)*** (0.0008)*** (0.0011)*** (0.0015)*** (0.0013)*** 0.0006 0.0081 0.0005 0.0063 0.0004 0.0061 Mean Teacher Experience (0.0001)*** (0.0001)*** (0.0001)*** -0.0004 -0.0069 0.0001 0.0017 0.0006 0.0091 Student-Teacher Ratio3
(0.0001)*** (0.0001) (0.0001)*** -0.0369 -0.0120 -0.0285 -0.0093 -0.0243 -0.0079 Free and Reduced Lunch Ratio3
(0.0014)*** (0.0020)*** (0.0022)*** -0.0001 -0.0000 0.0029 0.0022 0.0022 0.0017 White Student Ratio
(0.002) (0.0021) (0.0026) -1.0072 -0.0021 -0.7455 -0.0016 -0.8002 -0.0017 Weapons Violations Per Student (0.1632)*** (0.1705)*** (0.0986)*** 0.0165 0.0072 0.0137 0.0060 0.0129 0.0056 Ratio of Teachers with
Master’s Degree (0.0024)*** (0.0025)*** (0.0025)*** 1.0826 1.8230 1.8548 1.1601 1.8821 1.886 1.1641 1.8612 1.8993 Constant
(0.0132)*** (0.0287)*** (0.0251)*** (0.0237)*** (0.0130)*** (0.0182)*** (0.0232)*** (0.0177)*** (0.0183)*** Observations 118,391 118,391 118,391 118,391 118,391 118,391 118,391 118,391 118,391 * significant at 10%; ** significant at 5%; *** significant at 1%; 1,2,3 coefficients for the three quartiles are statistically different at the 5% level in columns (1), (2) or (3) respectively

48
Table 13: Individual-Level Quartile Regressions: Reading
(1) (2) (3) (3a) Elasticities (1) (2) (3) (3a)
Elasticities (1) (2) (3) (3a) Elasticities
Log of 2006 6th Grade Reading Scaled Score 25% Quantile 50% Quantile 75% Quantile
0.7672 0.6522 0.6449 0.7170 0.6277 0.6190 0.6641 0.5979 0.5915 Log of 2005 5th Grade Reading Scaled Score1,2,3 (0.0020)*** (0.0028)*** (0.0033)*** (0.0023)*** (0.0032)*** (0.0028)*** (0.0031)*** (0.0026)*** (0.0030)***
-0.0019 -0.0047 -0.0022 -0.0015 -0.0033 -0.0008 -0.0011 -0.0022 -0.0009 4Sight Reading (0.0008)** (0.0009)*** (0.0008)** (0.0004)*** (0.0008)*** (0.0007) (0.0008) (0.0011)** (0.0008)
-0.0056 -0.0042 -0.0042 -0.0053 -0.0034 -0.0031 Eligible for Tutoring (0.0021)*** (0.0025)* (0.0022)* (0.0018)* (0.0023) (0.0035) -0.0148 -0.0124 -0.0096 -0.0162 -0.0154 -0.0162 Receiving Tutoring (0.0048)*** (0.0035)*** (0.0026)*** (0.0041)*** (0.0039)*** (0.0075)** 0.0073 0.007 0.0070 0.0075 0.0070 0.0084 Female3
(0.0008)*** (0.0007)*** (0.0005)*** (0.0006)*** (0.0009)*** (0.0008)*** -0.0346 -0.0194 -0.0273 -0.0212 -0.0239 -0.0242 Black2
(0.0015)*** (0.0018)*** (0.0010)*** (0.0012)*** (0.0011)*** (0.0011)*** -0.0226 -0.0149 -0.0200 -0.0142 -0.0188 -0.0143 Hispanic2
(0.0017)*** (0.0018)*** (0.0016)*** (0.0015)*** (0.0022)*** (0.0016)*** 0.0094 0.0103 0.0066 0.0063 0.0071 0.0061 Other (0.0016)*** (0.0015)*** (0.0018)*** (0.0021)*** (0.0023)*** (0.0018)*** -0.0350 -0.0333 -0.0184 -0.0009 -0.0073 -0.0082 Homeless (0.0165)** (0.0150)** (0.0162) (0.0181) (0.0141) (0.0136) -0.0225 -0.0078 -0.0172 -0.0036 -0.0130 -0.005 Title I2,3
(0.0006)*** (0.0008)*** (0.0009)*** (0.0012)*** (0.0012)*** (0.0014)*** 0.0007 0.0011 0.0003 0.0022 0.0014 0.001 Title III (0.0014) (0.0014) (0.0012) (0.0019) (0.0011) (0.0013) 0.0435 0.0428 0.0444 0.0427 0.0430 0.0433 Gifted (0.0019)*** (0.0016)*** (0.0014)*** (0.0017)*** (0.0010)*** (0.0012)*** -0.0616 -0.0417 -0.0488 -0.0634 -0.0402 -0.05 IEP2,3
(0.0017)*** (0.0010)*** (0.0013)*** (0.0015)*** (0.0011)*** (0.0012)*** 0 0.0016 0 0.0007 0.0001 -0.0003 Mean Teacher Experience (0.0001) (0.0001) (0.0001) -0.0002 -0.0069 -0.0001 -0.0034 -0.0004 -0.0015 Student-Teacher Ratio3
(0.0001)** (0.0001) (0.0001)*** -0.022 -0.0083 -0.0172 -0.0072 -0.0256 -0.0056 Free and Reduced Lunch Ratio3
(0.0020)*** (0.0020)*** (0.0029)*** 0.0045 0.0055 0.0014 0.0034 0.0073 0.0011 White Student Ratio (0.0017)*** (0.0023) (0.0019)*** -1.2103 -0.0032 -1.1422 -0.0025 -1.5114 -0.0024 Weapons Violations Per Student3
(0.1338)*** (0.1089)*** (0.1676)*** 0.0195 0.0111 0.0205 0.0085 0.0255 0.0089 Ratio of Teachers with
Master’s Degree3 (0.0019)*** (0.0021)*** (0.0028)*** 1.6239 2.9618 2.7542 2.0434 2.4667 3.0035 2.4793 2.4793 2.5120 Constant
(0.0145)*** (0.0173)*** (0.0255)*** (0.0168)*** (0.0201)*** (0.0228)*** (0.0226)*** (0.0135)*** (0.0200)*** Observations 117,974 117,974 117,974 117,974 117,974 117,974 117,974 117,974 117,974 * significant at 10%; ** significant at 5%; *** significant at 1%; 1,2,3 coefficients for the three quartiles are statistically different at the 5% level in columns (1), (2) or (3) respectively

49
Table 14: Individual-level Probit Results†: Math (1) (2) (3) (4) (5) At or Above Proficiency: 2006 6th Grade Math
0.6706 0.6706 0.6689 0.5260 0.5195 At or Above Proficiency:
2005 5th Grade Math
(0.0043)*** (0.0043)*** (0.0044)*** (0.0052)*** (0.0052)***
0.0020 -0.0022 0.0018 4Sight Math (0.0077) (0.0063) (0.0061) -0.0133 -0.0154 -0.0126 Eligible for
Tutoring (0.0196) (0.0160) (0.0165) -0.09 -0.0559 -0.0685 Receiving
Tutoring (0.0261)*** (0.0199)*** (0.0203)*** -0.0108 -0.0114 Female (0.0020)*** (0.0020)*** -0.1213 -0.0969 Black (0.0066)*** (0.0054)*** -0.0804 -0.057 Hispanic (0.0081)*** (0.0076)*** 0.033 0.0359 Other (0.0069)*** (0.0066)*** -0.0851 -0.0736 Homeless (0.0418)** (0.0397)* -0.0627 -0.0248 Title I (0.0064)*** (0.0075)*** -0.0084 -0.0093 Title III (0.0099) (0.0100) 0.1794 0.176 Gifted (0.0058)*** (0.0057)*** -0.1957 -0.1978 IEP (0.0056)*** (0.0054)*** 0.0017 Mean Teacher
Experience (0.0009)** -0.0015 Student-
Teacher Ratio (0.0009)* -0.0814 Free and
Reduced Lunch Ratio (0.0131)***
-0.0087 White Student Ratio (0.0139)
-3.1355 Weapons Violations Per
Student (0.9268)***
0.0568 Ratio of Teachers with
Master’s Degree
(0.0156)***
Observations 118,569 118,569 118,569 118,569 118,569 Pseudo R-
squared 0.3577 0.3577 0.3583 0.4172 0.4218 †Average marginal effects are reported;
clustered (by school) standard errors in parentheses * significant at 10%; ** significant at 5%; *** significant at 1%

50
Table 15: Individual-level Probit Results†: Reading (1) (2) (3) (4) (5) At or Above Proficiency: 2006 6th Grade Reading
0.6511 0.651 0.6499 0.4993 0.4909 At or Above Proficiency:
2005 5th Grade
Reading
(0.0038)*** (0.0038)*** (0.0039)*** (0.0044)*** (0.0043)***
-0.0083 -0.0138 -0.0081 4Sight Reading (0.0065) (0.0054)** (0.0051)
-0.0104 -0.0174 -0.0145 Eligible for Tutoring (0.0175) (0.0131) (0.0128)
-0.0574 -0.0306 -0.0428 Receiving Tutoring (0.0264)** (0.0239) (0.0203)**
0.0244 0.0241 Female (0.0020)*** (0.0020)*** -0.1036 -0.0774 Black (0.0057)*** (0.0046)*** -0.0761 -0.0525 Hispanic (0.0074)*** (0.0068)*** 0.0132 0.0169 Other (0.0065)** (0.0064)*** -0.0413 -0.0286 Homeless (0.0356) (0.0336) -0.0748 -0.0325 Title I (0.0058)*** (0.0066)*** -0.0085 -0.0091 Title III (0.0080) (0.0075) 0.1859 0.1833 Gifted (0.0051)*** (0.0052)*** -0.1989 -0.2021 IEP (0.0049)*** (0.0047)*** 0.0005 Mean
Teacher Experience (0.0007)
-0.0013 Student-Teacher Ratio (0.0007)*
-0.0792 Free and Reduced
Lunch Ratio (0.0125)***
0.0072 White Student Ratio (0.0122)
-2.6844 Weapons Violations Per Student (0.8266)***
0.0710 Ratio of Teachers with
Master’s Degree
(0.0126)***
Observations 118,148 118,148 118,148 118,148 118,148 Pseudo R-
squared 0.3531 0.3532 0.3534 0.4070 0.4113 †Average marginal effects are reported;
clustered (by school) standard errors in parentheses * significant at 10%; ** significant at 5%; *** significant at 1%

51
Table 16: Individual-Level Tobit Regression Results:† Math Reporting Category without Controls
(1) (2) (3) (4) (5) Reporting
Category A Reporting
Category B Reporting
Category C Reporting
Category D Reporting
Category E 0.902 Reporting Category A
(0.0022)*** 0.5611 Reporting Category B (0.0026)*** 0.6562 Reporting Category C (0.0027)*** 0.6194 Reporting Category D (0.0026)*** 0.6468 Reporting Category E (0.0024)***
0.0033 0.3043 0.1779 0.1472 0.2041 Constant (0.0016)** (0.0018)*** (0.0020)*** (0.0020)*** (0.0019)***
Observations 119132 119132 119132 119132 119132 McFadden’s Adjusted R2 19.7888 0.9418 1.7412 -18.9595 3.3044
Robust standard errors in parentheses * significant at 10%; ** significant at 5%; *** significant at 1% †Tobit regression bounded at 0 and 1

52
Table 17: Individual-Level Tobit Regression Results:† Reading Reporting Category without Controls
(1) (2) 2006 6th Grade Reading
Percentage Correct: Reporting Category A
2006 6th Grade Reading Percentage Correct: Reporting
Category B 0.8099 2005 5th Grade Reading Percentage
Correct: Reporting Category A (0.0018)*** 0.6102 2005 5th Grade Reading Percentage
Correct: Reporting Category B (0.0019)*** 0.1237 0.1495 Constant
(0.0013)*** (0.0014)*** Observations 118707 118707
McFadden’s Adjusted R2 -1.8515 -1.1738 Robust standard errors in parentheses * significant at 10%; ** significant at 5%; *** significant at 1% †Tobit regression bounded at 0 and 1

53
Table 18: Individual-Level Tobit Regression Results:† Math Reporting Category with Controls
(1) (2) (3) (4) (5) Reporting
Category A Reporting
Category B Reporting
Category C Reporting
Category D Reporting
Category E 0.7769 Reporting Category A
(0.0025)*** 0.4038 Reporting Category B (0.0027)*** 0.5021 Reporting Category C (0.0029)*** 0.4769 Reporting Category D (0.0029)*** 0.4824 Reporting Category E (0.0026)***
0.0038 0.0021 -0.0001 0.0013 -0.0089 4Sight Math (0.0010)*** (0.0014) (0.0013) (0.0012) (0.0012)***
-0.0151 -0.0419 -0.0337 -0.0297 -0.0353 Eligible for Tutoring (0.0032)*** (0.0045)*** (0.0043)*** (0.0039)*** (0.0038)***
-0.0129 -0.0318 -0.0238 -0.0141 -0.0218 Receiving Tutoring (0.0059)** (0.0082)*** (0.0079)*** (0.0073)* (0.0070)***
0.0039 -0.0479 0.0047 -0.0014 -0.0058 Female (0.0008)*** (0.0012)*** (0.0011)*** (0.001) (0.0010)***
-0.0417 -0.0696 -0.0584 -0.0427 -0.0578 Black (0.0017)*** (0.0024)*** (0.0023)*** (0.0021)*** (0.0020)***
-0.0208 -0.0453 -0.0483 -0.0182 -0.0487 Hispanic (0.0020)*** (0.0029)*** (0.0027)*** (0.0025)*** (0.0024)***
0.0301 0.0535 0.0219 0.0469 0.0076 Other (0.0027)*** (0.0039)*** (0.0037)*** (0.0034)*** (0.0033)**
-0.0233 -0.0329 -0.0131 -0.0279 -0.0244 Homeless (0.0132)* (0.0185)* (0.0177) (0.0163)* (0.0157) -0.0106 -0.0325 -0.0078 -0.0187 -0.0211 Title I
(0.0015)*** (0.0022)*** (0.0021)*** (0.0019)*** (0.0018)*** 0.0085 -0.0112 -0.0059 -0.0032 -0.0029 Title III
(0.0016)*** (0.0022)*** (0.0021)*** (0.0019)* (0.0019) 0.0978 0.1693 0.1267 0.1258 0.1397 Gifted
(0.0019)*** (0.0027)*** (0.0025)*** (0.0023)*** (0.0023)*** -0.0621 -0.1334 -0.1245 -0.0982 -0.1067 IEP
(0.0013)*** (0.0017)*** (0.0017)*** (0.0016)*** (0.0015)*** 0.0004 0.0006 0.0017 0.001 0.0004 Mean Teacher Experience
(0.0001)** (0.0002)*** (0.0002)*** (0.0002)*** (0.0002)** -0.0003 -0.001 -0.0008 0.0003 -0.001 Student-Teacher Ratio
(0.0001)* (0.0002)*** (0.0002)*** (0.0002) (0.0002)*** -0.0372 -0.0646 -0.0476 -0.0499 -0.0563 Free and Reduced Lunch
Ratio (0.0024)*** (0.0034)*** (0.0033)*** (0.0030)*** (0.0029)*** 0.0045 -0.0076 -0.0003 -0.0031 -0.0065 White Student Ratio
(0.0029) (0.0041)* (0.0039) (0.0036) (0.0035)* -1.3403 -1.8192 -2.3229 -1.2917 -1.3112 Weapons Violations Per
Student (0.1544)*** (0.2170)*** (0.2081)*** (0.1915)*** (0.1839)*** 0.0206 0.0353 0.0313 0.0406 0.0428 Ratio of Teachers with
Master’s Degree (0.0028)*** (0.0039)*** (0.0037)*** (0.0034)*** (0.0033)*** 0.1061 0.4835 0.3113 0.2551 0.3797 Constant
(0.0046)*** (0.0061)*** (0.0060)*** (0.0056)*** (0.0053)*** Observations 118569 118569 118569 118569 118569
McFadden’s Adjusted R2 20.0500 1.3807 2.1677 -30.7020 4.0961 Standard errors in parentheses * significant at 10%; ** significant at 5%; *** significant at 1% †Tobit regression bounded at 0 and 1
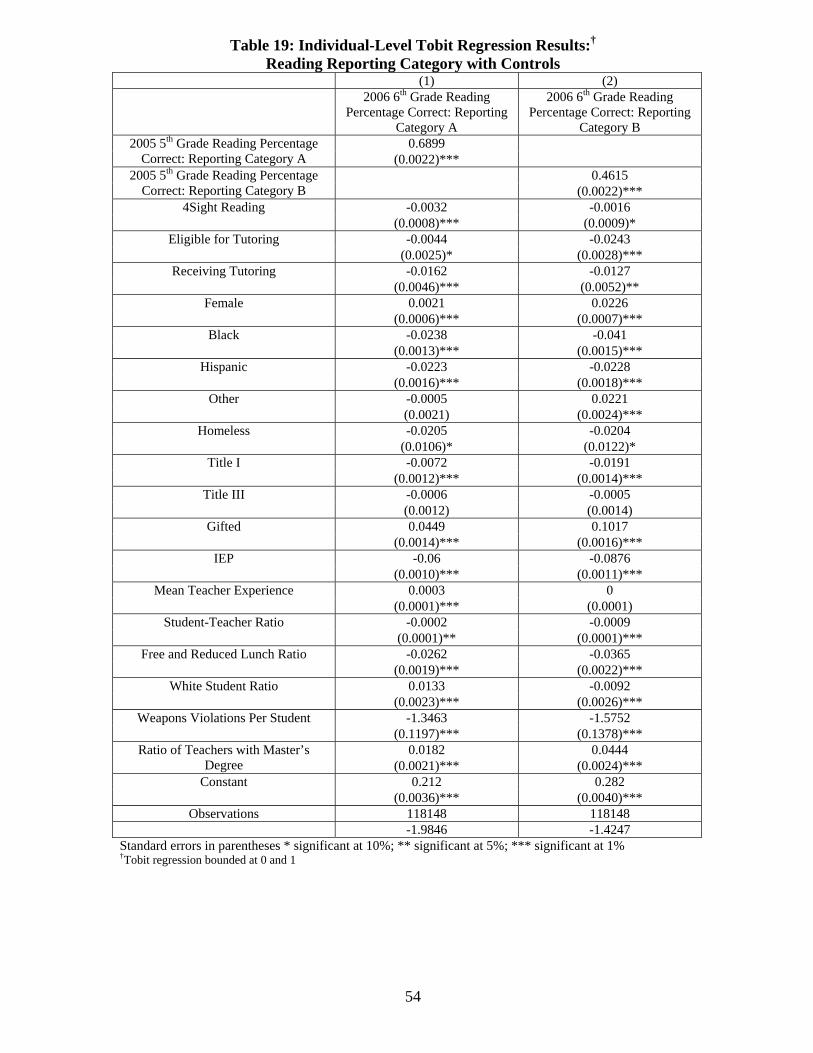
54
Table 19: Individual-Level Tobit Regression Results:† Reading Reporting Category with Controls
(1) (2) 2006 6th Grade Reading
Percentage Correct: Reporting Category A
2006 6th Grade Reading Percentage Correct: Reporting
Category B 0.6899 2005 5th Grade Reading Percentage
Correct: Reporting Category A (0.0022)*** 0.4615 2005 5th Grade Reading Percentage
Correct: Reporting Category B (0.0022)*** -0.0032 -0.0016 4Sight Reading
(0.0008)*** (0.0009)* -0.0044 -0.0243 Eligible for Tutoring
(0.0025)* (0.0028)*** -0.0162 -0.0127 Receiving Tutoring
(0.0046)*** (0.0052)** 0.0021 0.0226 Female
(0.0006)*** (0.0007)*** -0.0238 -0.041 Black
(0.0013)*** (0.0015)*** -0.0223 -0.0228 Hispanic
(0.0016)*** (0.0018)*** -0.0005 0.0221 Other (0.0021) (0.0024)*** -0.0205 -0.0204 Homeless
(0.0106)* (0.0122)* -0.0072 -0.0191 Title I
(0.0012)*** (0.0014)*** -0.0006 -0.0005 Title III (0.0012) (0.0014) 0.0449 0.1017 Gifted
(0.0014)*** (0.0016)*** -0.06 -0.0876 IEP
(0.0010)*** (0.0011)*** 0.0003 0 Mean Teacher Experience
(0.0001)*** (0.0001) -0.0002 -0.0009 Student-Teacher Ratio
(0.0001)** (0.0001)*** -0.0262 -0.0365 Free and Reduced Lunch Ratio
(0.0019)*** (0.0022)*** 0.0133 -0.0092 White Student Ratio
(0.0023)*** (0.0026)*** -1.3463 -1.5752 Weapons Violations Per Student
(0.1197)*** (0.1378)*** 0.0182 0.0444 Ratio of Teachers with Master’s
Degree (0.0021)*** (0.0024)*** 0.212 0.282 Constant
(0.0036)*** (0.0040)*** Observations 118148 118148
-1.9846 -1.4247 Standard errors in parentheses * significant at 10%; ** significant at 5%; *** significant at 1% †Tobit regression bounded at 0 and 1

55
Table 20: School-Level OLS Results: Math (1) (2) (3) (3a)
Elasticities (4) (5)
Log of Mean 2006 6th Grade Math Scaled Score 0.9704 0.9705 0.7215 0.7285 0.7125 Log of Mean 2005 5th
Grade Math Scaled Score (0.0152)*** (0.0152)*** (0.0219)*** (0.0230)*** (0.0233)*** 0.001 -0.002 -0.0019 -0.0021 4Sight Math (0.0029) (0.0027) (0.0028) (0.0028) 0.0121 0.0003 0.0084 0.0085 % of Students Eligible
for Tutoring (0.014) (0.0148) (0.0144) -0.0501 -0.0004 -0.0485 -0.0454 % of Students Receiving
Tutoring (0.0288)* (0.0294)* (0.0295) 0.0506 0.0248 0.0507 0.0572 % Female (0.0123)*** (0.0132)*** (0.0138)*** -0.0468 -0.0100 -0.0488 -0.0446 % Black (0.0064)*** (0.0067)*** (0.0069)*** -0.0459 -0.0024 -0.0471 -0.0477 % Hispanic (0.0108)*** (0.0110)*** (0.0117)*** 0.0501 0.0010 0.046 0.0558 % Other (0.0275)* (0.0274)* (0.0280)** 0.0094 0 -0.0100 0.1714 % Homeless (0.1624) (0.1600) (0.2078) 0.0032 0.0011 0.0074 0.0057 % Title I (0.0045) (0.0048) (0.0048) 0.0020 0.0002 0.0018 0.0036 % Title III (0.0046) (0.0050) (0.0050) 0.0784 0.0038 0.0753 0.0724 % Gifted (0.0232)*** (0.0239)*** (0.0249)*** -0.0372 -0.0062 -0.0544 -0.0345 % IEP (0.0128)*** (0.0140)*** (0.0141)** 0.0006 0.0088 0.0008 0.0005 Mean Teacher
Experience (0.0003)* (0.0004)** (0.0004) -0.0003 -0.0042 -0.0002 0 Student-Teacher Ratio (0.0003) (0.0003) (0.0004) -0.0212 -0.0081 -0.0195 -0.0239 Free and Reduced Lunch
Ratio (0.0059)*** (0.0061)*** (0.0065)*** -0.6036 -0.0013 -0.8745 -1.2814 Weapons Violations Per
Student (0.1799)*** (0.4042)** (0.4305)*** 0.0287 0.0118 0.0239 0.0337 Ratio of Teachers with
Master’s Degree (0.0074)*** (0.0079)*** (0.0079)*** 0.0101 Mean Praxis Reading
Percentile (0.0247) 0.0881 Mean Praxis Writing
Percentile (0.0316)*** -0.0396 Mean Praxis Math
Percentile (0.0192)** 0.0652 Mean NTE Common
Knowledge Percent Correct (0.0402)
-0.0596 Mean NTE General Knowledge Percent
Correct (0.0366) 0.0036 Mean NTE Professional
Knowledge Percent Correct (0.0210)
0.2027 0.202 1.9872 1.9013 2.0367 Constant (0.1099)* (0.1099)* (0.1606)*** (0.1677)*** (0.1716)***
Observations 1159 1159 1148 1057 1002 Adjusted R-squared 0.7794 0.7793 0.8198 0.8258 0.8192
Absolute value of t statistics in parentheses * significant at 5%; ** significant at 1%

56
Table 21: School-Level OLS Results: Reading (1) (2) (3) (3a)
Elasticities (4) (5)
Log of Mean 2006 6th Grade Reading Scaled Score 0.8661 0.8661 0.6893 0.7006 0.7045 Log of Mean 2005 5th
Grade Reading Scaled Score (0.0105)*** (0.0105)*** (0.0189)*** (0.0202)*** (0.0196)***
-0.0001 -0.0006 -0.0018 -0.0007 4Sight Reading (0.0023) (0.0023) (0.0023) (0.0023) 0.0184 0.0005 0.0248 0.0291 % of Students Eligible
for Tutoring (0.0118) (0.0121)** (0.0115)** -0.021 -0.0002 -0.0258 -0.0377 % of Students Receiving
Tutoring (0.0243) (0.0241) (0.0235) 0.0111 0.0054 0.0405 0.0303 % Female (0.0103) (0.0108)*** (0.0110)*** -0.0393 -0.0084 -0.0369 -0.0358 % Black (0.0055)*** (0.0057)*** (0.0056)*** -0.0336 -0.0017 -0.0318 -0.0326 % Hispanic (0.0093)*** (0.0092)*** (0.0095)*** 0.0546 0.0011 0.053 0.0579 % Other (0.0231)** (0.0223)** (0.0223)*** -0.171 -0.0002 -0.1766 0.124 % Homeless (0.1369) (0.131) (0.1657) 0.0075 0.0025 0.0065 0.0059 % Title I (0.0038)* (0.0039) (0.0038) 0.003 0.0003 0.002 0.0031 % Title III (0.0039) (0.0041) (0.004) 0.0487 0.0024 0.0547 0.057 % Gifted (0.0197)** (0.0199)*** (0.0201)*** -0.0618 -0.0103 -0.0611 -0.0702 % IEP (0.0112)*** (0.0117)*** (0.0115)*** -0.0002 -0.0024 -0.0001 -0.0004 Mean Teacher
Experience (0.0003) (0.0003) (0.0003) -0.0006 -0.0093 -0.0004 -0.0001 Student-Teacher Ratio (0.0003)** (0.0003) (0.0003) -0.0133 -0.0051 -0.0047 -0.0072 Free and Reduced Lunch
Ratio (0.0050)*** (0.0051) (0.0052) -0.4763 -0.0010 -1.3929 -1.4205 Weapons Violations Per
Student (0.1525)*** (0.3329)*** (0.3457)*** 0.0338 0.0138 0.0329 0.0346 Ratio of Teachers with
Master’s Degree (0.0062)*** (0.0065)*** (0.0063)*** 0.0053 Mean Praxis Reading
Percentile (0.0202) 0.0675 Mean Praxis Writing
Percentile (0.0259)*** -0.0262 Mean Praxis Math
Percentile (0.0158)* 0.0544 Mean NTE Common
Knowledge Percent Correct (0.0321)*
-0.0699 Mean NTE General Knowledge Percent
Correct (0.0292)** 0.0182 Mean NTE Professional
Knowledge Percent Correct (0.0167)
0.9655 0.9655 2.2468 2.1158 2.1185 Constant (0.0757)*** (0.0757)*** (0.1372)*** (0.1455)*** (0.1430)***
Observations 1159 1159 1148 1057 1002 Adjusted R-squared 0.8535 0.8534 0.8705 0.8798 0.8835
Absolute value of t statistics in parentheses * significant at 5%; ** significant at 1%

57
Figure 3: Propensity Scores for Math 4Sight Use†
01
23
45
67
Den
sity
0 .2 .4 .6 .8 1Propensity Score
Schools Not Using 4SightDistribution of Propensity Scores for Math 4Sight
01
23
45
67
Den
sity
0 .2 .4 .6 .8 1Propensity Score
Schools Using 4SightDistribution of Propensity Scores for Math 4Sight
†The distributions of propensity scores for schools using 4Sight and schools not using 4Sight are statistically different at the 1% level. A two-sample Kolmogorov-Smirnov test was performed.

58
Figure 4: Propensity Scores for Reading 4Sight Use†
01
23
45
6D
ensi
ty
0 .2 .4 .6 .8 1Propensity Score
Schools Not Using 4SightDistribution of Propensity Scores for Reading 4Sight
01
23
45
6D
ensi
ty
0 .2 .4 .6 .8 1Propensity Score
Schools Using 4SightDistribution of Propensity Scores for Reading 4Sight
†The distributions of propensity scores for schools using 4Sight and schools not using 4Sight are statistically different at the 1% level. A two-sample Kolmogorov-Smirnov test was performed.

59
Table 22: School-Level Nearest-Neighbor Matching Model Results: ATT of Math 4Sight on Mean Math PSSA Scaled Scores
ATT Standard
Error† Z-Statistic N
(Treatment) N‡
(Control) -12.432 9.997 -1.24 279 209
†Estimated using the Abadie and Imbens (2006) population variance estimator. ‡Actual nearest neighbor matches.

60
Table 23: School-Level Nearest-Neighbor Matching Model Results: ATT of Reading 4Sight on Mean Reading PSSA Scaled Scores
ATT Standard
Error† Z-Statistic N
(Treatment) N‡
(Control) -19.013** 9.472 -2.01 285 214
†Estimated using the Abadie and Imbens (2006) population variance estimator. ‡Actual nearest neighbor matches.
**Statistically significant at the 5%-level.

61
8. Appendix Table A.1: Table of Reporting Categories, Anchors, and Eligible Content Covered on
the 6th Grade Math PSSA*
Reporting Category
Assessment Anchor Eligible Content
% of Eligible Content in Reporting Category
Covered by 4sight
Represent common percents as fractions and/or decimals. (A.1.1.1) Convert between fractions and decimals and/or differentiate between a terminating decimal and a repeating decimal. (A.1.1.2) Represent a number in exponential form. (A.1.1.3) Represent a mixed number as an improper fraction. (A.1.1.4) Compare and/or order whole numbers, mixed numbers, fractions and/or decimals. (A.1.2.1) Find the Greatest Common Factor (GCF) of two numbers and/or use the GCF to simplify fractions (A.1.3.1) Find the Least Common Multiple (LCM) of two numbers and/or use the LCM to find the common denominator of two fractions. (A.1.3.2) Use divisibility rules for 2, 3, 5, and/or 10 to draw conclusions and/or solve problems. (A.1.3.3)
Demonstrate an understanding of numbers, ways of
representing numbers,
relationships among numbers and number
systems. (A.1)
Model percents using drawings, fraphs and/or sets. (A.1.4.1)
Understand the meanings of
operations, use operations and
understand how they relate to each other.
(A.2)
Complete equation by using the following properties: associative, commutative, distributive and identity. (A.2.1.1)
Use estimation to solve problems involving whole numbers and decimals. (A.3.1.1)
Numbers and Operations (A)
Compute accurately and fluently and make reasonable estimates. (A.3)
Solve problems involving operations with whole numbers, decimals and fractions. (A.3.2.1)
91.6%
Demonstrate an understanding of
measurable attributes of objects and
figures, and the units, systems and processes of
measurement. (B.1)
Determine and/or compare elapsed time to the minute. (B.1.1.1)
Use or read a ruler to measure to the nearest 1/16 inch or millimeter. (B.2.1.1) Choose the more precise measurement of a given object. (B.2.1.2) Find the perimeter of any polygon. (B.2.2.1)
Measurement (B)
Apply appropriate techniques, tools and
formulas to determine
measurements. (B.2) Define, label and/or identify right, straight, acute and obtuse angles. (B.2.3.1)
60%
Identify, classify and/or compare polygons. (C.1.1.1)
Geometry (C) Analyze characteristics and properties of two-
and three- Identify and/or describe properties of all types of triangles. (C.1.1.2)
57.1%

62
Identify and/or determine the measure of the diameter and/or radius of a circle. (C.1.1.3) Identify and/or use the total number of degrees in a triangle, quadrilateral and/or circle. (C.1.1.4) Identify, describe and/or label parallel, perpendicular or intersecting lines. (C.1.2.1)
dimensional geometric shames and demonstrate understanding of
geometric relationships. (C.1)
Identify, draw and/or label points, planes, lines, line segments, rays angles and vertices. (C.1.2.2)
Locate points or describe relationships using the coordinate
plane. (C.3)
Plot, locate or identify points in Quadrant I and/or on the x and y axes with intervals of 1, 2, 5 or 10 units. (C.3.1.1)
Create, extend or find a missing element in a pattern displayed in a table, chart or graph. (D.1.1.1)
Demonstrate an understanding of
patterns, relations and functions. (D.1) Determine a rule based on a pattern or illustrate a
pattern based on a given rule. (D.1.2.1) Identify the inverse operation needed to solve a one-step equation. (D.2.1.1) Solve a one-step equation. (D.2.1.2)
Algebraic Concepts (D)
Represent and/or analyze mathematical
situations using numbers, symbols,
words, tables and/or graphs. (D.2)
Match an equation or expression involving one variable, to a verbal math situation. (D.2.2.1)
100%
Analyze data and/or answer questions pertaining to data represented in frequency tables, circle graphs, double bar graphs, double line graphs or line plots. (E.1.1.1) Choose the appropriate representation for a specific set of data. (E.1.1.2)
Formulate or answer questions that can be addressed with data
and/or organize, display, interpret or analyze data. (E.1)
Display data in frequency tables, circle graphs, double-bar graphs, double line graphs or line plots using a title, appropriate scale, labels and a key when needed. (E.1.1.3)
Select and/or use appropriate statistical methods to analyze
data. (E.2)
Determine the mean, median, mode and/or range of displayed data. (E.2.1.1)
Define and/or find the probability of a simple event. (E.3.1.1)
Data Analysis and Probability (E)
Understand and/or apply basic concepts
of probability or outcomes. (E.3)
Determine/show all possible combinations involving no more than 20 total arrangements. (E.3.1.2)
83.3%
*Eligible content italicized are not covered by 4sight

63
Table A.2: Table of Reporting Categories, Anchors, and Eligible Content Covered on the 6th Grade Reading PSSA*
Reporting Category
Assessment Anchor Eligible Content
% of Eligible Content in Reporting Category
Covered by 4sight
Identify and/or apply meaning of multiple-meaning words used in text. (A.1.1.1) Identify and/or apply a synonym or antonym of a word used in text. (A.1.1.2) Identify how the meaning of a word is changed when an affix is added; identify the meaning of a word from the text with an affix. (A.1.2.1) Define and/or apply how the meaning of words or phrases changes when using context clues given in explanatory sentences. (A.1.2.2) Make inferences and/or draw conclusions based on information from text. (A.1.3.1) Cite evidence from text to support generalizations. (A.1.3.2) Identify and/or explain stated or implied main ideas and relevant supporting details from text. (A.1.4.1) Summarize the key details and events of a fictional text as a whole. (A.1.5.1) Identify the author’s intended purpose of text. (A.1.6.1)
Understand fiction appropriate to grade
level. (A.1)
Identify, explain, and/or describe examples of text that support the author’s intended purpose. (A.1.6.2) Identify and apply meaning of multiple-meaning words used in text. (A.2.1.1) Identify and apply meaning of content- specific words used in text. (A.2.1.2) Identify and apply how the meaning of a word is changed when an affix is added; identify and apply the meaning of a word from the text with an affix. (A.2.2.1) Define and/or apply how the meaning of words or phrases changes when using context clues given in explanatory sentences. (A.2.2.2) Make inferences and/or draw conclusions based on information from text. (A.2.3.1) Cite evidence from text to support generalizations. (A.2.3.2) Identify and/or explain stated or implied main ideas and relevant supporting details from text. (A.2.4.1) Summarize the major points, processes, and/or events of a nonfictional text as a whole. (A.2.5.1) Identify the author’s intended purpose of text. (A.2.6.1)
Comprehension and Reading Skills
(A)
Understand nonfiction
appropriate to grade level. (A.2)
Identify, explain, and/or describe examples of text that support the author’s intended purpose. (A.2.6.2)
35%

64
Identify, explain, interpret, compare, describe, and/or analyze components of fiction and literary nonfiction. (B.1.1.1)
Understand components within and between texts.
(B.1) Identify, explain, interpret, compare, describe, and/or analyze connections between texts. (B.1.2.1) Identify, explain, interpret, and/or describe examples of personification in text. (B.2.1.1) Identify, explain, interpret, and/or describe examples of similes in text. (B.2.1.2) Identify, explain, interpret, and/or describe examples of alliteration in text when its use is presumed intentional. (B.2.1.3) Identify, explain, interpret, and/or describe examples of metaphors in text. (B.2.1.4) Identify, explain, and/or describe the point of view of the narrator as first person or third person point of view. (B.2.2.1)
Understand literary devices in fictional
and nonfictional text. (B.2)
Explain, interpret, and/or describe the effectiveness of the point of view used by the author. (B.2.2.2) Identify, explain, and/or interpret statements of fact and opinion in nonfictional text. (B.3.1.1) Identify exaggeration (bias) in nonfictional text. (B.3.1.2) Identify, explain, and/or interpret how the author uses exaggeration (bias) in nonfictional text. (B.3.2.1) Identify, explain, and/or interpret text organization, including sequence, question/answer, comparison/contrast, cause/effect, or problem/solution. (B.3.3.1) Use headings to locate information in a passage, or identify content that would best fit in a specific section of text. (B.3.3.2) Interpret graphics and charts and/or make connections between text and content of graphics and charts. (B.3.3.3)
Interpretation and Analysis of
Fictional and Nonfictional Text
(B)
Understand concepts and organization of nonfictional text.
(B.3)
Identify, explain, compare, interpret, describe, and/or analyze the sequence of steps in a list of directions. (B.3.3.4)
46.7%
*Eligible content italicized are not covered by 4sight
Figure A.1: 4Sight Math Coverage vs. Regression Coefficient
4Sight Coverage vs. Regression Effect
-0.01
-0.005
0
0.005
0 20 40 60 80 100
Coverage
Reg
ress
ion
Coe
ffici
ent
Math Reading

65
9. Data Appendix
The data used in this paper was obtained from several sources. Final, student level PSSA test
scores for school years 2004-5 (5th grade) and 2005-6 (6th grade) were provided to the project by
the Data Recognition Corporation (DRC) of St. Paul, Minnesota under a signed confidentiality
agreement between Strauss and the Pennsylvania Department of Education (PDE). DRC is the
prime contractor for PSSA construction, distribution, scoring and reporting to PDE and local
education agencies.
School-level data, including teacher experience, education level, and performance on
standardized tests, student-teacher ratios, weapons violations per student, percent of students
qualifying for Free and Reduced Lunch, and percent of white students, are tabulations by this
project of confidential teacher level data and school level data obtained from PDE under a signed
confidentiality agreement between Strauss and PDE.
Data on the use of 4Sight by school, grade, and test type (math, reading) in 2005-6 was
available for a limited time from the PDE web site. It has been removed since the authors
downloaded the data, and subsequent requests to PDE and its contractor, Intermediate Unit 13,
and the Success for All Foundation for more recent data were declined by all parties with the
explanation that such school level participation in 4Sight was confidential.


