WM2014 Conference, March 2 – 6, 2014, Phoenix, Arizona, USA
Effect of Sulfate on Rhenium Partitioning during Melting of Low-Activity-Waste Glass Feeds – 14116
Tongan Jin *, Dong-Sang Kim *, Michael Schweiger * * Pacific Northwest National Laboratory
ABSTRACT
The volatile loss of technetium-99 (99Tc) is a major concern for low-activity waste (LAW) vitrification at Hanford. We investigated the incorporation and volatile loss of Re (a nonradioactive surrogate for 99Tc) during batch-to-glass conversion up to 1100°C. The AN-102 feed, which is one of the representative Hanford LAW feeds, containing 0.59 wt% SO3 (in glass if 100% retained) was used. The modified sulfate-free AN-102_0S feed was also tested to investigate the effect of sulfate. For each heat-treated sample, the salts (soluble components in room temperature leaching), early glass-forming melt (soluble components in 80°C leaching), and insoluble solids were separated by a two-step leaching and the chemical compositions of each phase were quantitatively analyzed. The final rhenium retention ratios of AN-102 and AN-102_0S in glass are 32% and 63%, respectively. The presence of sulfate in the salt phase between 600 and 800°C leads to a significantly higher Re loss via volatilization from the salt layer. At ≥800°C, for both samples, no more Re is incorporated into the insoluble phase because for AN-102_0S there is no salt left i.e., the split into the insoluble and gas phases is complete by 800°C, and for AN-102 all the Re contained in the remaining salt phase is lost through volatilization. The present results on the effect of sulfate, although not directly applicable to LAW vitrification in the melter, will be used to understand the mechanism of Re incorporation into glass to eventually develop methods that can increase 99Tc retention during LAW vitrification at Hanford.
INTRODUCTION
Vitrifying the low-activity waste (LAW) stored at the U.S. Department of Energy’s Hanford site is one of the primary missions of the Hanford Tank Waste Treatment and Immobilization Plant (WTP) currently under construction. To immobilize the hazardous waste into a stable glass waste form, the LAW, which is an aqueous solution of predominantly nitrates and nitrites with other salts/hydroxides and organics, will be mixed with additives consisting of silica, boric acid, and other chemicals/minerals, and vitrified in a Joule-heated ceramic melter [1]. One of the significant radionuclides in Hanford LAW is 99Tc, which is well-known for its long half-life and high environmental mobility in the form of soluble TcO4
– [2]. Volatilization of 99Tc during batch-to-glass conversion of the waste glass feed (waste plus additives) is a concern during vitrification of Hanford LAW. Maximizing the incorporation of 99Tc into glass is important for an efficient vitrification process.
Rhenium has been the preferred nonradioactive surrogate for 99Tc because of similarities in chemistry, ionic size, and speciation in glass [2]. Kim et al. [3] compared the partitioning, volatilization, and retention of 99Tc and Re during melting of the LAW glass feeds developed to demonstrate the bulk vitrification technology for Hanford LAWs [4]. For each composition treated under the same crucible melting conditions, Tc and Re showed the same trends in the
1
WM2014 Conference, March 2 – 6, 2014, Phoenix, Arizona, USA
“oxidizing” feeds containing nominal nitrates and nitrites [3], which supports Re being a suitable surrogate for 99Tc under the typical conditions that are expected during the LAW vitrification process. However, the “reducing” feeds that were modified to remove or reduce the nitrates and nitrites showed differences between 99Tc and Re in their partitioning into salt phases during melting as well as in the final retention in glass [3]. This result, which is consistent with other studies that reported dissimilarities largely due to the difference in the reduction potential of 99Tc7+ and Re7+ [2, 5], suggests that caution needs to be taken when using Re as a surrogate for 99Tc under reducing conditions.
Extensive small-scale Joule-heated melter tests have been performed by Matlack et al. [6, 7] for various simulated melter feeds formulated for seven representative Hanford LAWs. The feeds were spiked with 400–850 ppm Re and approximately 0.05–0.2 ppt 99mTc (both metal basis). The single-pass retention ratio of 99mTc and Re (concentration retained in glass divided by target concentration) varied widely from 18–66% for 99mTc and 25–57% for Re [6]. The retention ratio of 99mTc showed a trend reasonably similar to that of Re [6, 7]. However, there have been no clear explanations of the mechanisms that control the retention of Tc and Re during melting process.
Recently, we launched a series of studies to understand the mechanism of 99Tc retention in, or escape from, glass melt during early stages of glass batch melting, with the goal of eventually developing a method for increasing 99Tc retention. Using Re as a surrogate, the initial study was performed with two representative simulated LAW glass feeds, designed to vitrify AN-102 and AZ-102, which showed the lowest (AN-102) and the highest (AZ-102) retention ratios of 99mTc and Re from melter tests mentioned above [6]. The results are to be published elsewhere [8]. One of the key findings was that the Re incorporates into the glass melt by ≤800°C and the remaining Re volatilizes from the segregated salt, predominantly alkali sulfate, at ≥800°C [8].
Sulfate has been known to be a problematic component in waste glass melting because the segregated molten sulfate salt, which is highly corrosive, can shorten the useful life of the melter [9, 10]. Kim et al. [3] first investigated the role of sulfate on the retention of 99Tc and Re during melting of bulk vitrification glasses that are designed for processing at ~1350°C. The present study aims to further evaluate the effect of sulfate on Re partitioning and retention in LAW glass designed for processing at 1150°C in a Joule-heated melter using the two-step leaching procedures previously developed [8]. Two AN-102 feeds with SO3 target concentrations of 0.59 wt% and 0 wt% in glass were prepared and tested. Simulated AN-102 feed was modified by replacing Na2SO4 in the simulant with NaOH while keeping the concentration of Na2O constant to formulate a glass feed with 0 wt% SO3 (designated as AN-102_0S). The results for Re partitioning between various phases will be discussed in connection with the effect of SO3 on the formation of the segregated sulfate and on the volatilization of Re during early stages of melting.
METHODS
Experimental Procedures
The compositions of simulated AN-102 waste, additives, and the resulting glass with a waste loading of 16.22 wt%, expressed in terms of mass% of oxides and halides, which are the same
2
WM2014 Conference, March 2 – 6, 2014, Phoenix, Arizona, USA
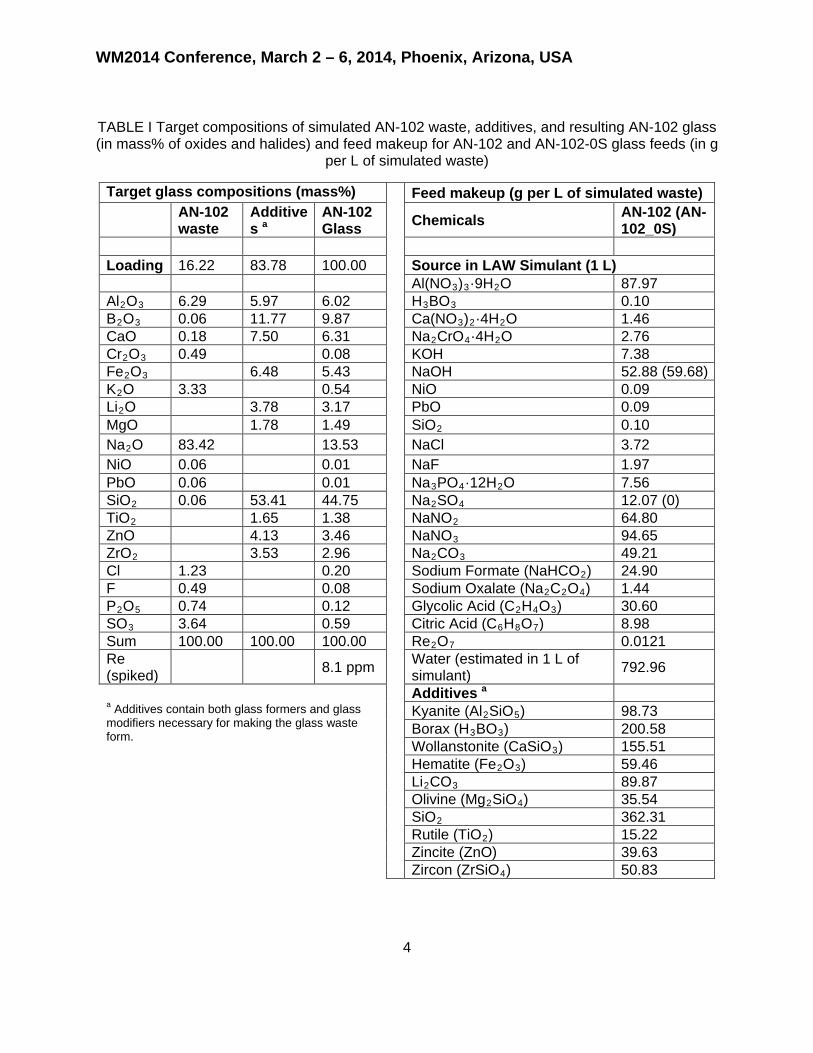
as used by Matlack et al. [6], are shown in TABLE I,. Note that the AN-102-0S glass has the same composition as the original AN-102. The target Re concentration was 8.1 ppm mass (as of rhenium metal) in both glasses, which is a typical projected concentration in Hanford LAW glasses [3, 4]. TABLE I also includes the melter feed makeup in mass of each chemical/mineral per liter of simulated waste for the original AN-102 feed; the masses of NaOH and Na2SO4 for AN-102_0S feed are given in parenthesis. The makeup of AN-102 feed was also from Matlack et al. [6], but was modified based on the composition and purity of the materials used in the present study.
The mass of each chemical given in TABLE I was added to deionized water, allowing each chemical to dissolve completely before adding the next chemical, to prepare 1 L of simulated waste. This was followed by mixing with additive chemicals/minerals to make the feed slurry. The slurry was then dried at 105°C for 12 h to obtain dried glass feeds.
The dried feeds were thermally treated in a Pt crucible, heating at 5°C/min to 600, 700, 800, 900, 1000, and 1100°C. The samples were quenched in air after reaching each temperature. The mass loss measurement was performed by weighing samples before and after the heat treatment.
3
WM2014 Conference, March 2 – 6, 2014, Phoenix, Arizona, USA
TABLE I Target compositions of simulated AN-102 waste, additives, and resulting AN-102 glass (in mass% of oxides and halides) and feed makeup for AN-102 and AN-102-0S glass feeds (in g
per L of simulated waste)
Target glass compositions (mass%) Feed makeup (g per L of simulated waste) AN-102
waste Additives a
AN-102 Glass Chemicals AN-102 (AN-
102_0S) Loading 16.22 83.78 100.00 Source in LAW Simulant (1 L) Al(NO3)3·9H2O 87.97 Al2O3 6.29 5.97 6.02 H3BO3 0.10 B2O3 0.06 11.77 9.87 Ca(NO3)2·4H2O 1.46 CaO 0.18 7.50 6.31 Na2CrO4·4H2O 2.76 Cr2O3 0.49 0.08 KOH 7.38 Fe2O3 6.48 5.43 NaOH 52.88 (59.68) K2O 3.33 0.54 NiO 0.09 Li2O 3.78 3.17 PbO 0.09 MgO 1.78 1.49 SiO2 0.10 Na2O 83.42 13.53 NaCl 3.72 NiO 0.06 0.01 NaF 1.97 PbO 0.06 0.01 Na3PO4·12H2O 7.56 SiO2 0.06 53.41 44.75 Na2SO4 12.07 (0) TiO2 1.65 1.38 NaNO2 64.80 ZnO 4.13 3.46 NaNO3 94.65 ZrO2 3.53 2.96 Na2CO3 49.21 Cl 1.23 0.20 Sodium Formate (NaHCO2) 24.90 F 0.49 0.08 Sodium Oxalate (Na2C2O4) 1.44 P2O5 0.74 0.12 Glycolic Acid (C2H4O3) 30.60 SO3 3.64 0.59 Citric Acid (C6H8O7) 8.98 Sum 100.00 100.00 100.00 Re2O7 0.0121 Re (spiked) 8.1 ppm Water (estimated in 1 L of
simulant) 792.96
Additives a a Additives contain both glass formers and glass modifiers necessary for making the glass waste form.
Kyanite (Al2SiO5) 98.73 Borax (H3BO3) 200.58 Wollanstonite (CaSiO3) 155.51 Hematite (Fe2O3) 59.46 Li2CO3 89.87 Olivine (Mg2SiO4) 35.54 SiO2 362.31 Rutile (TiO2) 15.22 Zincite (ZnO) 39.63 Zircon (ZrSiO4) 50.83
4
WM2014 Conference, March 2 – 6, 2014, Phoenix, Arizona, USA
A two-step leaching procedure was used to separate the soluble salts and early glass-forming melts1 formed during the melting process. The as-dried and heat-treated samples were crushed until most particles were <0.425 mm (sieved by a #40 stainless steel sieve). The leaching procedure is summarized in TABLE II.
TABLE II. Leaching test procedure
Intended phases Two-step leaching method Salts Leached at room temperature (RT) for 1 h. 5 g of solution was
taken for analysis and 5 g of deionized water was added. Most soluble salts were expected to dissolve.
Early glass-forming melt (Early melt for short)
Continued to leach at 80°C for 24 h. 5 g of solution was taken for analysis. A fraction of “non-durable” early glass-forming melts was expected to dissolve. The mass of each element removed by a RT sample was added to the total mass dissolved. The mass of each element dissolved by RT leach was subtracted from the total mass dissolved to obtain the mass dissolved by 80°C leach.
Insoluble The resulting sample was filtered after the 2-step leach, and the remaining solid was dried for chemical analysis.
Gases Calculated by mass balance. TABLE III summarizes the mass of dried feed or heat-treated samples and the volume of water used for the leach test. The ratio of the sample mass to the water volume was varied to achieve comparable concentrations of the soluble components and to avoid approaching the detection limits in the chemical analysis. For the dried feed, two separate samples were leached (2.5 g was leached at room temperature for 1 h and 5.0 g at 80°C for 24 h) instead of the continuous two-step leach that was used for all other samples; this was because the dried feed became a suspension (slurry) after RT leaching, which made it difficult to take a solution sample without filtering the suspension, resulting in the sample not being useable for the second step leach at 80°C.
TABLE III. Sample/water amount used in the leaching test
Sample Sample mass/water volume Dried Feed 2.5 g/100 ml (RT) or 5 g/200 ml (80°C) 600°C 5 g/200 ml 700°C 5 g/100 ml 800–1100°C 20 g/100 ml
The solution samples obtained by the RT and 80°C leaching were filtered through 8 µm filter paper (Whatman 40, Whatman Ltd., UK) and the remaining solids were dried for chemical analysis. Each sample was weighed before and after leaching to obtain the total masses of the soluble and insoluble components.
1 A qualitative and general term used to describe the initial glassy phases with lower chemical durability (e.g., alkali borate with low concentration of SiO2) compared to the final glass.
5
WM2014 Conference, March 2 – 6, 2014, Phoenix, Arizona, USA
Chemical analyses were performed by Southwest Research Institute2 according to its standard procedures. Two liquid samples from the RT and 80°C leaching and solution samples prepared from fusion and acid leaching of dried solids were analyzed by inductively coupled plasma-mass spectroscopy (ICP-MS) for Re and inductively coupled plasma-atomic emission spectroscopy (ICP-AES) for all other cationic elements. Ion chromatography (IC) was used to analyze NO3
−, NO2
−, F−, and Cl− and the total inorganic carbon (TIC) method was used for CO32−.
Mass Balance Calculation
In the AN-102 LAW glass, there are 20 elements (except oxygen): Al, B, Ca, Cr, Fe, K, Li, Mg, Na, Ni, Pb, Si, Ti, Zn, Zr, Cl, F, P, S, and Re (TABLE I). There are also NO3
−, NO2−, CO3
2−, and organics in the dried feed that will all be lost through evolved gases during melting. Furthermore, some lattice water is expected to be in the dried feed.
The ICP-AES, ICP-MS, and IC methods produced the raw data as element or anion concentrations. In order to achieve mass balance, the element or anion concentration was converted to the mass of oxides or halides in the analyzed sample. For example, components of the mixed salt containing NaNO3, NaNO2, Na2CO3, Li2CO3, Na2SO4, etc. can be recovered from the masses of Na2O, Li2O, N2O5, N2O3, CO2, SO3, etc., resulting in the 23 components tracked in this study: Al2O3, B2O3, CaO, Cr2O3, Fe2O3, K2O, Li2O, MgO, Na2O, NiO, PbO, SiO2, TiO2, ZnO, ZrO2, Cl, F, P2O5, SO3, N2O5, N2O3, CO2 and Re (Re is calculated by element).
Each dried feed or heat-treated sample can be profiled by the mass of each component for the 23 components listed above in each phase:
23 4
1 1Tot ij
i jm m
= =
= ∑∑ (Eq.1)
where mij is the mass of the ith component in the jth phase (j represents Salt, Early melt, Insoluble, and Gas), mTot is the total mass of each dried feed or heat-treated sample when expressed in terms of 23 components. The mTot is obtained from the analytical results of leached solutions and solid samples for the dried feed by:
23
0
1Tot i
im m
=
= ∑ (Eq.2)
where 0im is the initial mass of the ith component analyzed in the dried feed samples, i.e.,
3
0 0 0 0 0, , , lub
1i ij i Salt i Early melt i Inso le
jm m m m m
=
= = + +∑ (Eq.3)
where 0ijm is the initial mass of the ith component in the jth phase. The value of the mTot is
slightly different from the starting mass of dried feed because of the likely presence of lattice
2 Southwest Research Institute (SwRI), 6220 Culebra Rd., San Antonio, Texas 78238-5166 (http://www.swri.org/).
6
WM2014 Conference, March 2 – 6, 2014, Phoenix, Arizona, USA
water that cannot be analyzed and analytical uncertainty. The mass of evolved gases in each treated sample is calculated by:
0, , ,i Gas i i Salt i Early melt i,Insolublem m m m m = − − − (Eq.4)
We define three symbols to express the composition of each sample or phase:
0ij
iji
mf
m= (Eq.5)
ijij
Tot
mF
m= (Eq.6)
23
1
ijij
iji
mw
m=
=
∑ (Eq.7)
where fij is the mass fraction of the ith component in the jth phase normalized to the initial total
mass of each component in the dried feed (4
11ij
jf
=
=∑ ), Fij is the mass fraction of the ith
component in the jth phase normalized to the total mass of the dried feed (23 4
1 11ij
i jF
= =
=∑∑ ), and wij
is the mass fraction of the ith component in the jth phase normalized to the total mass of each
phase (i.e., composition of each phase, 23
11ij
iw
=
=∑ ).
RESULTS AND DISCUSSION
Overview of the Feed-to-Glass Conversion
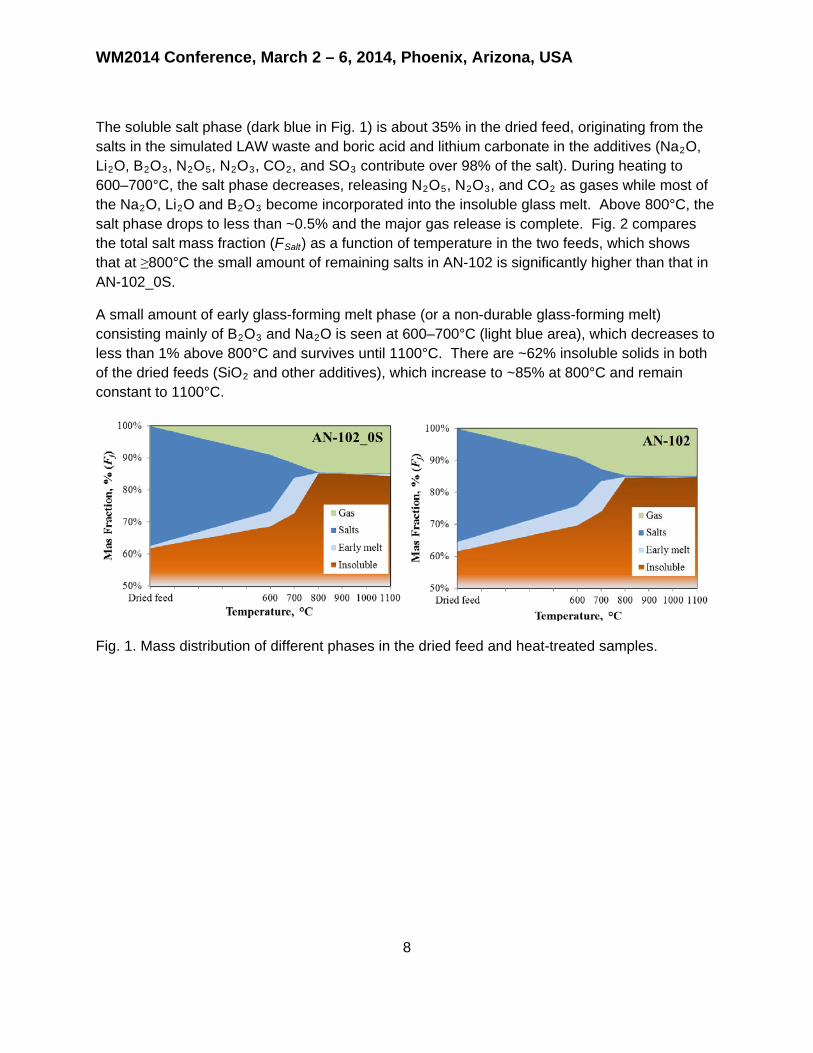
During melting of LAW glass feed, the salts from the waste decompose and/or react with the additives, releasing a considerable amount of gases, primarily NOx from nitrates/nitrites and
CO2 from carbonates. Fig. 1 shows the mass distribution of each phase (23
1j ij
iF F
=
= ∑ ) in the
dried feed and heat-treated samples up to 1100°C for AN-102 and AN-102_0S feeds. The two feeds show a very similar trend, as expected from the minor difference in their feed makeup.
Approximately 9% of the total mass is lost to the evolved gases after heating to 600°C and ~15% after heating to 800°C, after which the mass fraction remains constant up to 1100°C (light green area in Fig. 1).
7
WM2014 Conference, March 2 – 6, 2014, Phoenix, Arizona, USA
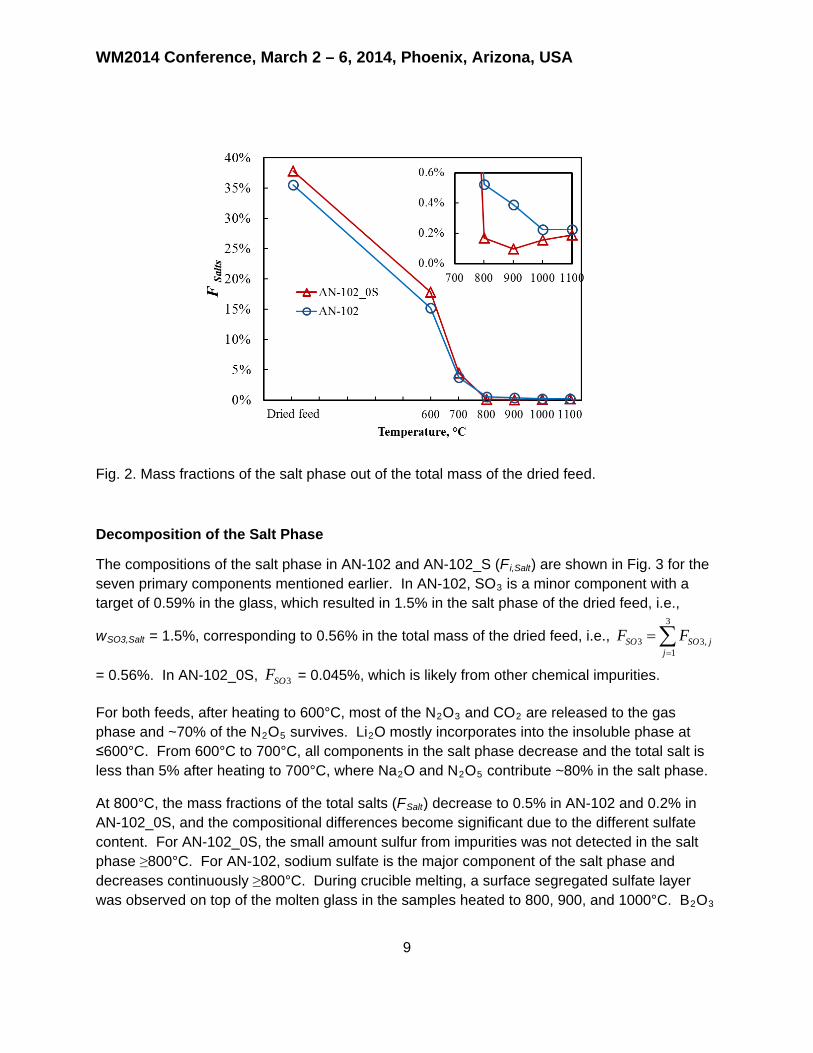
The soluble salt phase (dark blue in Fig. 1) is about 35% in the dried feed, originating from the salts in the simulated LAW waste and boric acid and lithium carbonate in the additives (Na2O, Li2O, B2O3, N2O5, N2O3, CO2, and SO3 contribute over 98% of the salt). During heating to 600–700°C, the salt phase decreases, releasing N2O5, N2O3, and CO2 as gases while most of the Na2O, Li2O and B2O3 become incorporated into the insoluble glass melt. Above 800°C, the salt phase drops to less than ~0.5% and the major gas release is complete. Fig. 2 compares the total salt mass fraction (FSalt) as a function of temperature in the two feeds, which shows that at ≥800°C the small amount of remaining salts in AN-102 is significantly higher than that in AN-102_0S.
A small amount of early glass-forming melt phase (or a non-durable glass-forming melt) consisting mainly of B2O3 and Na2O is seen at 600–700°C (light blue area), which decreases to less than 1% above 800°C and survives until 1100°C. There are ~62% insoluble solids in both of the dried feeds (SiO2 and other additives), which increase to ~85% at 800°C and remain constant to 1100°C.
Fig. 1. Mass distribution of different phases in the dried feed and heat-treated samples.
8
WM2014 Conference, March 2 – 6, 2014, Phoenix, Arizona, USA
Fig. 2. Mass fractions of the salt phase out of the total mass of the dried feed.
Decomposition of the Salt Phase
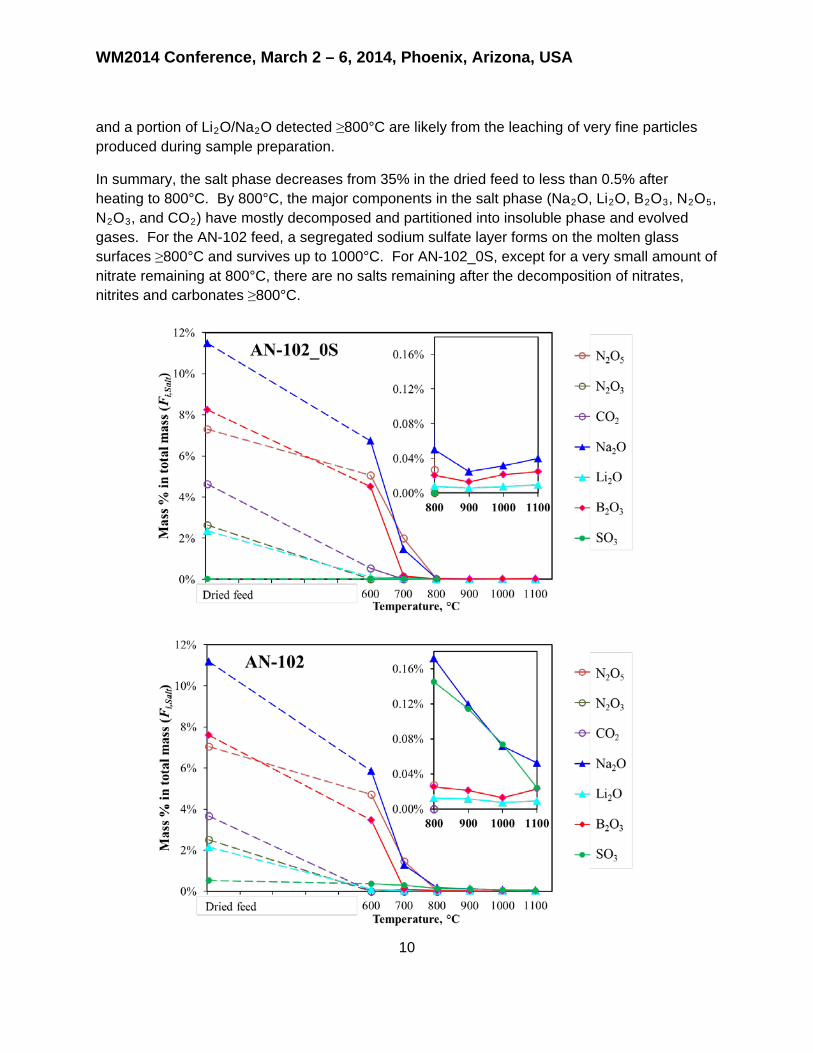
The compositions of the salt phase in AN-102 and AN-102_S (Fi,Salt) are shown in Fig. 3 for the seven primary components mentioned earlier. In AN-102, SO3 is a minor component with a target of 0.59% in the glass, which resulted in 1.5% in the salt phase of the dried feed, i.e.,
wSO3,Salt = 1.5%, corresponding to 0.56% in the total mass of the dried feed, i.e., 3
3 3,1
SO SO jj
F F=
= ∑
= 0.56%. In AN-102_0S, 3SOF = 0.045%, which is likely from other chemical impurities.
For both feeds, after heating to 600°C, most of the N2O3 and CO2 are released to the gas phase and ~70% of the N2O5 survives. Li2O mostly incorporates into the insoluble phase at ≤600°C. From 600°C to 700°C, all components in the salt phase decrease and the total salt is less than 5% after heating to 700°C, where Na2O and N2O5 contribute ~80% in the salt phase.
At 800°C, the mass fractions of the total salts (FSalt) decrease to 0.5% in AN-102 and 0.2% in AN-102_0S, and the compositional differences become significant due to the different sulfate content. For AN-102_0S, the small amount sulfur from impurities was not detected in the salt phase ≥800°C. For AN-102, sodium sulfate is the major component of the salt phase and decreases continuously ≥800°C. During crucible melting, a surface segregated sulfate layer was observed on top of the molten glass in the samples heated to 800, 900, and 1000°C. B2O3
9
WM2014 Conference, March 2 – 6, 2014, Phoenix, Arizona, USA
and a portion of Li2O/Na2O detected ≥800°C are likely from the leaching of very fine particles produced during sample preparation.
In summary, the salt phase decreases from 35% in the dried feed to less than 0.5% after heating to 800°C. By 800°C, the major components in the salt phase (Na2O, Li2O, B2O3, N2O5, N2O3, and CO2) have mostly decomposed and partitioned into insoluble phase and evolved gases. For the AN-102 feed, a segregated sodium sulfate layer forms on the molten glass surfaces ≥800°C and survives up to 1000°C. For AN-102_0S, except for a very small amount of nitrate remaining at 800°C, there are no salts remaining after the decomposition of nitrates, nitrites and carbonates ≥800°C.
10
WM2014 Conference, March 2 – 6, 2014, Phoenix, Arizona, USA
Fig. 3. Mass fractions (Fi,Salt) of the components in the salt phase out of the total mass of the dried feed.
Rhenium Incorporation and Volatilization
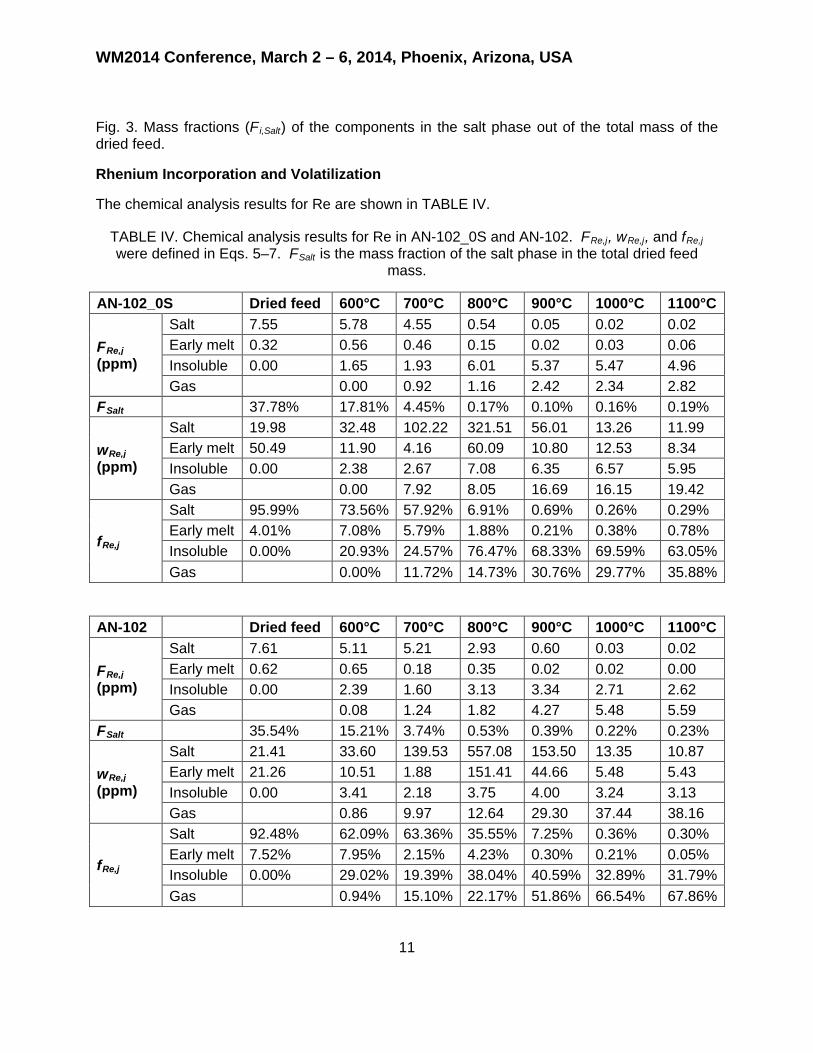
The chemical analysis results for Re are shown in TABLE IV.
TABLE IV. Chemical analysis results for Re in AN-102_0S and AN-102. FRe,j, wRe,j, and fRe,j were defined in Eqs. 5–7. FSalt is the mass fraction of the salt phase in the total dried feed
mass.
AN-102_0S Dried feed 600°C 700°C 800°C 900°C 1000°C 1100°C
FRe,j (ppm)
Salt 7.55 5.78 4.55 0.54 0.05 0.02 0.02 Early melt 0.32 0.56 0.46 0.15 0.02 0.03 0.06 Insoluble 0.00 1.65 1.93 6.01 5.37 5.47 4.96 Gas 0.00 0.92 1.16 2.42 2.34 2.82
FSalt 37.78% 17.81% 4.45% 0.17% 0.10% 0.16% 0.19%
wRe,j (ppm)
Salt 19.98 32.48 102.22 321.51 56.01 13.26 11.99 Early melt 50.49 11.90 4.16 60.09 10.80 12.53 8.34 Insoluble 0.00 2.38 2.67 7.08 6.35 6.57 5.95 Gas 0.00 7.92 8.05 16.69 16.15 19.42
fRe,j
Salt 95.99% 73.56% 57.92% 6.91% 0.69% 0.26% 0.29% Early melt 4.01% 7.08% 5.79% 1.88% 0.21% 0.38% 0.78% Insoluble 0.00% 20.93% 24.57% 76.47% 68.33% 69.59% 63.05% Gas 0.00% 11.72% 14.73% 30.76% 29.77% 35.88%
AN-102 Dried feed 600°C 700°C 800°C 900°C 1000°C 1100°C
FRe,j (ppm)
Salt 7.61 5.11 5.21 2.93 0.60 0.03 0.02 Early melt 0.62 0.65 0.18 0.35 0.02 0.02 0.00 Insoluble 0.00 2.39 1.60 3.13 3.34 2.71 2.62 Gas 0.08 1.24 1.82 4.27 5.48 5.59
FSalt 35.54% 15.21% 3.74% 0.53% 0.39% 0.22% 0.23%
wRe,j (ppm)
Salt 21.41 33.60 139.53 557.08 153.50 13.35 10.87 Early melt 21.26 10.51 1.88 151.41 44.66 5.48 5.43 Insoluble 0.00 3.41 2.18 3.75 4.00 3.24 3.13 Gas 0.86 9.97 12.64 29.30 37.44 38.16
fRe,j
Salt 92.48% 62.09% 63.36% 35.55% 7.25% 0.36% 0.30% Early melt 7.52% 7.95% 2.15% 4.23% 0.30% 0.21% 0.05% Insoluble 0.00% 29.02% 19.39% 38.04% 40.59% 32.89% 31.79% Gas 0.94% 15.10% 22.17% 51.86% 66.54% 67.86%
11
WM2014 Conference, March 2 – 6, 2014, Phoenix, Arizona, USA
The batched target concentration of Re in AN-102 glass (if 100% retained) is 8.1 ppm mass, which is ~6.6 ppm mass in the dried feed. By ICP-MS with a Re detection limit of ~0.0025 ppm we successfully tracked the changes of Re in each sample. The total Re recovered, from the analytical results for the tests with dried feed (FRe, no gas involved), is 7.87 ppm in AN-102_0S feed and 8.23 ppm in AN-102 feed. The corresponding target concentrations of Re in AN-102_0S and AN_102 glasses, if 100% retained, are 9.4 ppm and 9.9 ppm, respectively, which are 16% and 23% higher than the batched target. This difference was likely caused by the difficulty of batching such a small amount of Re (as Re2O7) in the feed and the analytical bias or uncertainty. Here we define the retention ratio of Re in glass, RRe, as the mass fraction of Re analyzed in the insoluble phase at 1100°C, FRe,Insoluble (1100°C), divided by the total target mass fraction in the dried feed, FRe, i.e.,
(1100 C)Re,Insoluble
ReRe
FR
F°
= (Eq.7)
From TABLE IV, the retention ratio (RRe) is 4.96/7.87 = 63% for AN-102_0S and 2.62/8.23 = 32% for AN-102. By the definition of fij in Eq. 5, RRe = fRe,Insoluble (1100°C), which is also given in TABLE IV.
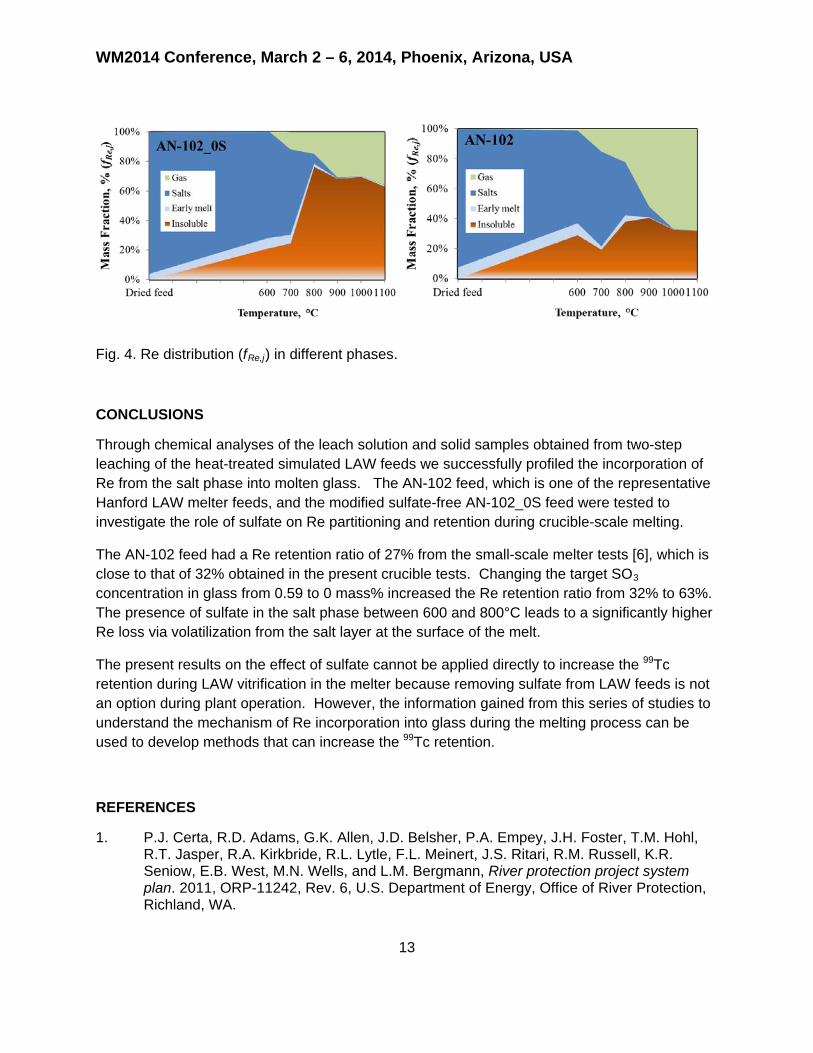
Re distribution in the different phases is shown in Fig. 4. In the dried feed, all the Re is in the soluble phases with the large amount of salts from the waste simulant. During early melting, it is clear that Re strongly favors the salt phase. After heating to 600°C, 20–30% Re incorporated into the insoluble phase in both samples. Between 600 and 800°C, a large amount of Re incorporates into the insoluble phase in AN-102_0S, during which the nitrate/boric acid salt decomposes or reacts (Fig. 3). However, this is not the case for AN-102, i.e., there is no noticeable Re incorporation into the insoluble phase between 600 and 800°C. Over 35% of the Re is still in the remaining salt phase at 800°C, which is only 0.53% of the initial total mass,(see FSalt in TABLE IV). In both feeds, the Re remaining in the salt phase becomes concentrated due to the loss of other salt components at 700−900°C (see wRe,Salt values in TABLE IV). Above 800°C, for both samples, there is no more incorporation of Re into the insoluble phase, probably within the overall experimental error: for AN-102_0S there is no salt left, i.e., the split into the insoluble and gas phases is complete by 800°C; for AN-102 all the Re contained in the remaining salt phase is lost through volatilization. The large amount of Re remaining in the salt phase leads to a ~30% volatile loss between 800 and 900°C for AN-102, compared to a ~6% loss for AN-102_0S.
12
WM2014 Conference, March 2 – 6, 2014, Phoenix, Arizona, USA
Fig. 4. Re distribution (fRe,j) in different phases.
CONCLUSIONS
Through chemical analyses of the leach solution and solid samples obtained from two-step leaching of the heat-treated simulated LAW feeds we successfully profiled the incorporation of Re from the salt phase into molten glass. The AN-102 feed, which is one of the representative Hanford LAW melter feeds, and the modified sulfate-free AN-102_0S feed were tested to investigate the role of sulfate on Re partitioning and retention during crucible-scale melting.
The AN-102 feed had a Re retention ratio of 27% from the small-scale melter tests [6], which is close to that of 32% obtained in the present crucible tests. Changing the target SO3 concentration in glass from 0.59 to 0 mass% increased the Re retention ratio from 32% to 63%. The presence of sulfate in the salt phase between 600 and 800°C leads to a significantly higher Re loss via volatilization from the salt layer at the surface of the melt.
The present results on the effect of sulfate cannot be applied directly to increase the 99Tc retention during LAW vitrification in the melter because removing sulfate from LAW feeds is not an option during plant operation. However, the information gained from this series of studies to understand the mechanism of Re incorporation into glass during the melting process can be used to develop methods that can increase the 99Tc retention.
REFERENCES
1. P.J. Certa, R.D. Adams, G.K. Allen, J.D. Belsher, P.A. Empey, J.H. Foster, T.M. Hohl, R.T. Jasper, R.A. Kirkbride, R.L. Lytle, F.L. Meinert, J.S. Ritari, R.M. Russell, K.R. Seniow, E.B. West, M.N. Wells, and L.M. Bergmann, River protection project system plan. 2011, ORP-11242, Rev. 6, U.S. Department of Energy, Office of River Protection, Richland, WA.
13
WM2014 Conference, March 2 – 6, 2014, Phoenix, Arizona, USA
2. J.G. Darab and P.A. Smith, Chemistry of technetium and rhenium species during low-level radioactive waste vitrification. Chemistry of Materials, 1996. 8(5), p. 1004-1021.
3. D.S. Kim, C.Z. Soderquist, J.P. Icenhower, B.P. McGrail, R.D. Scheele, B.K. McNamara, L.M. Bagaasen, M.J. Schweiger, J.V. Crum, J.D. Yeager, J. Matyas, L.P. Darnell, H.T. Schaef, A.T. Owen, A.E. Kozelisky, L.A. Snow, and M.J. Steele, Tc reductant chemistry and crucible melting studies with simulated Hanford low-activity waste. 2005, PNNL-15131, Pacific Northwest National Laboratory, Richland, WA.
4. D.S. Kim, J.D. Vienna, P.R. Hrma, M.J. Schweiger, J. Matyas, J.V. Crum, D.E. Smith, G.J. Sevigny, W.C. Buchmiller, J.S. Tixier, J.D. Yeager, and K.B. Belew, Development and testing of ICV glasses for Hanford LAW. 2003, PNNL-14351, Pacific Northwest National Laboratory, Richland, WA.
5. W.W. Lukens, D.A. McKeown, A.C. Buechele, I.S. Muller, D.K. Shuh, and I.L. Pegg, Dissimilar behavior of technetium and rhenium in borosilicate waste glass as determined by X-ray absorption spectroscopy. Chemistry of Materials, 2007. 19(3), p. 559-566.
6. K.S. Matlack, I.S. Muller, I.L. Pegg, and I. Joseph, Improved technetium retention in Hanford LAW Glass - Phase 1. 2010, VSL-10R1920-1, Vitreous State Laboratory, The Catholic University of America, Washington, DC.
7. K.S. Matlack, I.S. Muller, R.A. Callow, N. D'Angelo, T. Bardacki, I. Joseph, and I.L. Pegg, Improved technetium retention in Hanford LAW Glass-Phase 2. 2011, VSL-101R2260-1, Vitreous State Laboratory, The Catholic University of America, Washington, DC.
8. T. Jin, R.M. Covert, A.E. Winschell, M.J. Schweiger, D. Kim, and P.R. Hrma, Partitioning of rhenium during melting of low-activity waste glass feeds. In preparation.
9. H. Li, P.R. Hrma, and J.D. Vienna, Sulfate retention and segregation in simulated radioactive waste borosilicate glasses. 2000. in Environmental Issues and Waste Management Technologies in the Ceramic and Nuclear Industries VI: Ceramic Transactions, vol. 119, pp. 237-246. American Ceramic Society, Westerville, OH.
10. J.D. Vienna, P.R. Hrma, W.C. Buchmiller, and J.S. Ricklefs, Preliminary investigation of sulfur loading in Hanford LAW Glass. 2004. PNNL-14649, Pacific Northwest National Laboratory, Richland, WA.
ACKNOWLEDGEMENTS
This work was supported by the U.S. Department of Energy’s Waste Treatment and Immobilization Plant Federal Project Office under the direction of Dr. Albert A. Kruger. Pacific Northwest National Laboratory is operated by Battelle Memorial Institute for the U.S. Department of Energy under contract DE-AC05-76RL01830.
14


