
Special Eurobarometer 376
WOMEN IN DECISION-MAKING POSITIONS
REPORT
Fieldwork: September 2011
Publication: March 2012
This survey has been requested by Directorate-General Justice and co-ordinated by Directorate-
General for Communication (DG COMM “Research and Speechwriting” Unit).
http://ec.europa.eu/public_opinion/index_en.htm
This document does not represent the point of view of the European Commission. The interpretations and opinions contained in it are solely those of the authors.
Special Eurobarometer 376 / Wave EB76.1 – TNS Opinion & Social

Special Eurobarometer 376
Women in decision-making positions
Conducted by TNS Opinion & Social at the request of Directorate-General Justice
Survey co-ordinated by Directorate-General Communication

SPECIAL EUROBAROMETER 376 “Women in decision-making positions”
2
TABLE OF CONTENTS
INTRODUCTION AND METHODOLOGY .......................................................... 3
MAIN FINDINGS .......................................................................................... 7
1 GENERAL ASSOCIATIONS WITH GENDER EQUALITY ISSUES ................... 9
1.1 Women and positions of responsibility ................................................. 11
1.1.1 Women’s interest in positions of responsibility ............................ 11
1.1.2 Women’s skills to fill positions of responsibility ........................... 15
1.2 Women and their careers .................................................................. 19
1.3 Women and their family responsibilities............................................... 23
1.4 Women in the business community ..................................................... 28
2 EQUAL REPRESENTATION OF WOMEN AND MEN IN LEADERSHIP
POSITIONS IN PRIVATE COMPANIES .................................................... 32
2.1 Representation of women in leadership positions in private companies .... 32
2.2 Reasons for promoting equal representation between men and women in
positions of leadership in companies ................................................... 35
3 ACHIEVING A BALANCED REPRESENTATION OF WOMEN AND MEN ON
COMPANY BOARDS ............................................................................... 40
3.1 Best way to achieve balanced representation of women and men on
company boards .............................................................................. 40
3.2 Legislation to achieve balanced representation of women and men on
company boards .............................................................................. 45
3.3 Decision level for measures to improve gender balance on company boards50
4 LEGISLATION PROVIDING A MORE BALANCED REPRESENTATION OF
WOMEN AND MEN ON COMPANY BOARDS ............................................. 54
4.1 Realistic targets ............................................................................... 54
4.2 Appropriate implementation time ....................................................... 60
4.3 Appropriate sanctions in case of non-compliance .................................. 65
CONCLUSIONS ........................................................................................... 70
ANNEXES TECHNICAL SPECIFICATIONS
QUESTIONNAIRE
TABLES
SPECIAL EUROBAROMETER 376 “Women in decision-making positions”
3
INTRODUCTION AND METHODOLOGY
Equality between women and men is one of the founding principles of the European
Union. Since the 1970s, the European Commission has been actively promoting many
measures to promote gender equality in various fields1.
The European Commission adopted a Women’s Charter on 5 March 2010 and committed
to strengthening gender equality in all its policies. As pointed out in the Women’s
Charter, ‘gender balance in decision-making, in political and economic life and in the
public and private sectors, will help Europe shape more effective policies, develop a
gender-aware knowledge-based society, and create a stronger and more prosperous
democracy’.
To achieve the objectives of the Women’s Charter, an action plan was developed and
adopted by the European Commission on 21 September 2010: the Strategy for Equality
between Women and Men for the years 2010-2015. The Strategy covers the European
Commission’s programme in this area, setting out priorities in various fields: equal
economic independence; equal pay for equal work and work for equal value; equality in
decision-making; dignity, integrity and an end to gender-based violence, and gender
equality in external actions beyond the EU.
Considerable progress has been achieved over recent decades in terms of gender
equality. Nevertheless, the Strategy notes that gaps remain: as women are still under-
represented in decision-making positions and concentrated in the lower-paid sectors of
the labour market. Despite the fact that women make up nearly half the workforce and
more than half of new university graduates in the EU, they are still under-represented in
decision-making processes and positions, especially at the highest levels. This is true in
most EU Member States.
1 For more information on gender equality in the EU, please see: http://ec.europa.eu/justice/gender-equality

SPECIAL EUROBAROMETER 376 “Women in decision-making positions”
4
Gender imbalance in decision-making positions is observed in various domains: politics,
economics, science and research. However, the situation is worst in business
management with much fewer women than men at all levels of business management.
Many large companies still have no women on their boards and there are only few female
executives. In 2010, one in three (34%) large companies in the EU and at least half of
the companies surveyed in ten countries had men-only boards and another third (32%)
of companies had just one female representative; in Europe's largest publicly quoted
companies, on average, only one out of ten board members is a woman and so are only
3% of board chairpersons.2
The Commission Staff Working Document ‘The Gender Balance in Business Leadership’
(the 8th Report on Progress on Equality between Women and Men, 2010) addresses the
under-representation of women in management positions in companies. The European
Commission wants to ensure that women’s careers are not blocked by a "glass ceiling
effect" and thus works together with the private sector, either through self-regulation or
an EU initiative.
Governments have developed several instruments and supported various initiatives to
persuade the corporate sector to improve women’s career opportunities. These include
campaigns, monitoring, mentoring schemes, networks, recommendations, corporate
governance codes, voluntary charters, and legislation. The latter three may be used to
improve gender balance particularly in the board room.
Corporate governance codes encourage companies to strive for gender equality on their
boards, by making use of peer pressure within organisations and of the influence from
stakeholders and media. Corporate governance codes may help increase the number of
women on boards, as was observed in Finland and Sweden3. Other Member States with
corporate governance codes regarding gender balance on company boards are Spain, the
Netherlands, Belgium, Austria, Luxembourg, Germany, France, Denmark and the United
Kingdom.
Charters can be signed voluntarily by companies; they set goals regarding the number of
women within a set time and measure whether these objectives are achieved. Such
charters were set out in the Netherlands and Denmark.
2 Source: European Commission Database on women and men in decision-making 3 Report on Progress on Equality between Women and Men 2010; The Gender Balance in Business Leadership

SPECIAL EUROBAROMETER 376 “Women in decision-making positions”
5
On EU level, in March 2011, the Commission’s Vice-President Reding encouraged publicly
listed companies to sign the ‘Women on the Board Pledge for Europe’ and to develop self-
regulatory initiatives to get more women into top jobs, with a view to reaching the target
of 30% of women in boardrooms of listed companies by 2015 and 40% by 2020 4.
Gender quotas set by legislation for corporate boardrooms are already obligatory in some
countries; they involve penalties (as in Norway) or the withholding of subsidies or state
administration contracts (Spain) when the companies fail to reach the gender quota. All
European countries with gender quota for state-owned companies met their targets for
gender balance: Denmark, Norway, Finland and Iceland. Quota laws for public companies
have already been adopted in Norway, Spain, Iceland and France or are under discussion
in the Netherlands, Italy and Belgium.
This report addresses Europeans’ opinions on issues associated with gender equality and
focuses on gender balance in business leadership. A greater understanding of Europeans’
opinions about women in leadership positions in companies could be of help to
policymakers to develop gender balance policies that take into account the level of
support such legislation would receive from EU citizens, at EU level as well as national
level.
The outline of the report is as follows.
♦ General associations with gender equality
♦ Equal representation of women and men in positions of responsibility
♦ How to achieve gender balance on company boards
♦ Legislation for more balanced representation of women and men on company
boards
This survey was conducted by TNS Opinion & Social at the request of the Directorate-
General Justice. It was coordinated by the Directorate-General for Communication. It is
the result of the special Eurobarometer 376 (EB76.1) held from 3 to 18 September 2011
(fieldwork) and involved 26,856 interviews in all 27 Member States.5 The methodology
used is that of the Standard Eurobarometer surveys of the Directorate-General for
Communication (“Research and Speechwriting” Unit). A technical note explaining the
methodology used in carrying out the interviews is annexed to this report.
4 http://ec.europa.eu/commission_2010-2014/reding/womenpledge/index_en.htm 5 For precise details of the fieldwork dates in each country, please refer to the technical specifications.

SPECIAL EUROBAROMETER 376 “Women in decision-making positions”
6
The Eurobarometer web site can be consulted at the following address:
http://ec.europa.eu/public_opinion/index_en.htm
We would like to take the opportunity to thank all the respondents across the continent
who have given of their time to take part in this survey.
Without their active participation, this study would simply not have been possible.
In this report, the countries are represented by their official abbreviations. The
abbreviations used in this report correspond to:
ABREVIATIONS
EU27 European Union - 27 Member States
EU15 The fifteen Member States that were EU Members prior to
the accession of ten candidate countries on 1 May 2004
NMS12 The twelve Member States that joined the European Union
in the recent years (2004 and 2007)
BE Belgium
BG Bulgaria
CZ Czech Republic
DK Denmark
DE Germany
EE Estonia
IE Ireland
EL Greece
ES Spain
FR France
IT Italy
CY Republic of Cyprus
LV Latvia
LT Lithuania
LU Luxembourg
HU Hungary
MT Malta
NL The Netherlands
AT Austria
PL Poland
PT Portugal
RO Romania
SI Slovenia
SK Slovakia
FI Finland
SE Sweden
UK United Kingdom
SPECIAL EUROBAROMETER 376 “Women in decision-making positions”
7
MAIN FINDINGS
When asked about their thoughts on the under-representation of women in positions of
responsibility in the EU, the majority of Europeans agree that:
♦ The business community is dominated by men who do not have sufficient
confidence in women (76%)
♦ Women have less freedom because of their family responsibilities (68%)
Fewer Europeans agree with statements about women’s shortcomings:
♦ Women are less willing than men to fight to make a career for themselves (29%)
♦ Women are less interested than men in positions of responsibility (28%)
♦ Women do not always have the necessary qualities and skills to fill positions of
responsibility (21%)
Since 2009, things have improved as agreement with these statements has decreased,
although, with one exception: more Europeans now say that the business community is
male-dominated. There is a higher level of recognition of the barriers women are facing
in the world of work in 2011 than it was in 2009.
The great majority of Europeans share the view that women should be equally
represented in company leadership positions (88%).
About six in ten of the respondents having that view cite the following reasons:
♦ Because women are as qualified for these positions as men are (62%),
♦ Because it is about equal rights for women and men (58%).
When given the possibility to choose between three options to achieve gender balance on
company boards, Europeans’ opinion is divided with a slight preference for self-
regulation:
♦ Self-regulation by companies setting their own targets (31%),
♦ Binding legal measures (26%),
♦ Voluntary measures such as signing non-binding Corporate Governance Codes
and Charters (20%).

SPECIAL EUROBAROMETER 376 “Women in decision-making positions”
8
Nevertheless, when legislation on company board gender balance would be under the
condition that qualification is taken into account without automatically favouring one of
either gender, three-quarters (75%) of Europeans are in favour of such legislation.
Europeans are divided on the level of decision with regards to measures taken to improve
gender balance on boards of publicly listed companies. A slight relative majority is in
favour of the European level rather than the national level (35% vs. 34%). Nearly a
quarter of the respondents answer spontaneously that they would like measures to be
taken at both levels (23%).
A relative majority (43%) thinks that a realistic gender quota target on company
boards should be 50% women/50% men.
Regarding the amount of time companies should be given to reach those targets, about
four Europeans out of ten say less than 5 years (37%).
Around half of Europeans (49%) believe that a monetary fine would be the most
effective sanction for companies in case of non-compliance with gender balance. This is
followed by no public procurement grants (30%), annulment of nomination of members
of the over-represented gender (28%) and annulment of decisions taken by the board
(28%).
***********

SPECIAL EUROBAROMETER 376 “Women in decision-making positions”
9
1 GENERAL ASSOCIATIONS WITH GENDER EQUALITY ISSUES
- Europeans believe that the business community is dominated
by men who do not have sufficient confidence in women
and that women have less freedom because of their family responsibilities -
This report starts by examining Europeans’ general associations with gender equality
issues. Respondents were asked about their thoughts on why women are less likely than
men to hold positions of responsibility: whether they associate it with women having less
interest, qualities and skills regarding positions of responsibility; with women having less
willingness to fight for a career in general; with women’s family responsibilities; or with
the business community being dominated by men who have insufficient confidence in
women6. The interviewees were asked to which extent they agree or disagree with each
of five statements.
Base: Total sample
6 QE1 At the present time, in the EU, women are less likely than men to hold positions of responsibility. Please
tell me whether you agree or disagree with each of the following statements on this subject - Women are less interested than men in positions of responsibility - Women are less willing than men to fight to make a career for themselves - Women have less freedom because of their family responsibilities - The business community is dominated by men who do not have sufficient confidence in women - Women do not always have the necessary qualities and skills to fill positions of responsibility

SPECIAL EUROBAROMETER 376 “Women in decision-making positions”
10
Two statements stand out, because they are agreed with much more often than the
others. Firstly, over three-quarters of the Europeans interviewed think that ‘the business
community is dominated by men who do not have sufficient confidence in women’
(76%). Secondly, over two-thirds of the interviewees believe ‘women have less freedom
because of their family responsibilities’ (68%).
The three other statements the European respondents were presented with received
considerable less but still substantial agreement. Almost three out of ten respondents
believe ‘women are less willing to fight to make a career for themselves’ (29%) or that
‘women are less interested than men in positions of responsibility’ (28%). About one in
five respondents think that ‘women do not always have the necessary qualities and skills
to fill positions of responsibility’ (21%).
The remainder of this chapter will discuss these statements in more detail, in the
following order.
♦ Women and positions of responsibility:
- their interest,
- their qualities and skills;
♦ Women and their careers: their willingness to fight;
♦ Women and their family responsibilities;
♦ Women in the business community.
SPECIAL EUROBAROMETER 376 “Women in decision-making positions”
11
1.1 Women and positions of responsibility This section examines in greater detail Europeans’ thoughts on two statements that refer
to the way women relate to positions of responsibility: women’s interest, and women’s
level of qualities and skills.
1.1.1 Women’s interest in positions of responsibility
- Over two-thirds of Europeans believe that
women are just as interested as men in positions of responsibility -
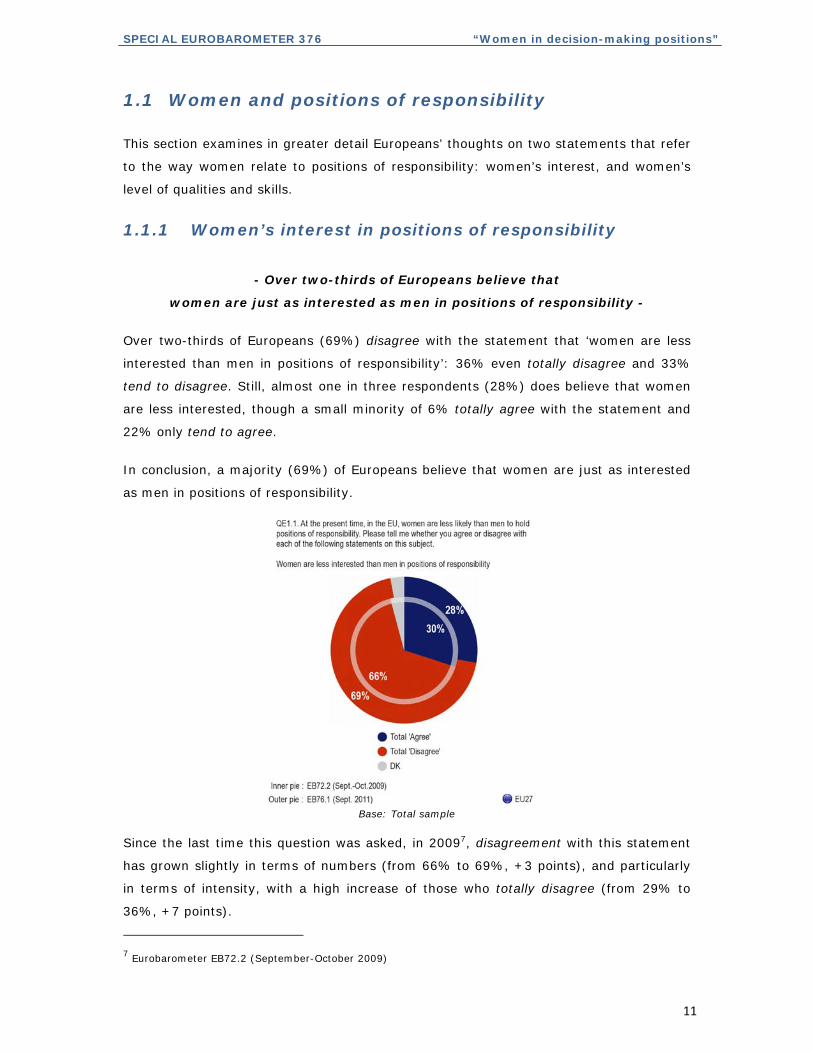
Over two-thirds of Europeans (69%) disagree with the statement that ‘women are less
interested than men in positions of responsibility’: 36% even totally disagree and 33%
tend to disagree. Still, almost one in three respondents (28%) does believe that women
are less interested, though a small minority of 6% totally agree with the statement and
22% only tend to agree.
In conclusion, a majority (69%) of Europeans believe that women are just as interested
as men in positions of responsibility.
Base: Total sample
Since the last time this question was asked, in 20097, disagreement with this statement
has grown slightly in terms of numbers (from 66% to 69%, +3 points), and particularly
in terms of intensity, with a high increase of those who totally disagree (from 29% to
36%, +7 points).
7 Eurobarometer EB72.2 (September-October 2009)
SPECIAL EUROBAROMETER 376 “Women in decision-making positions”
12
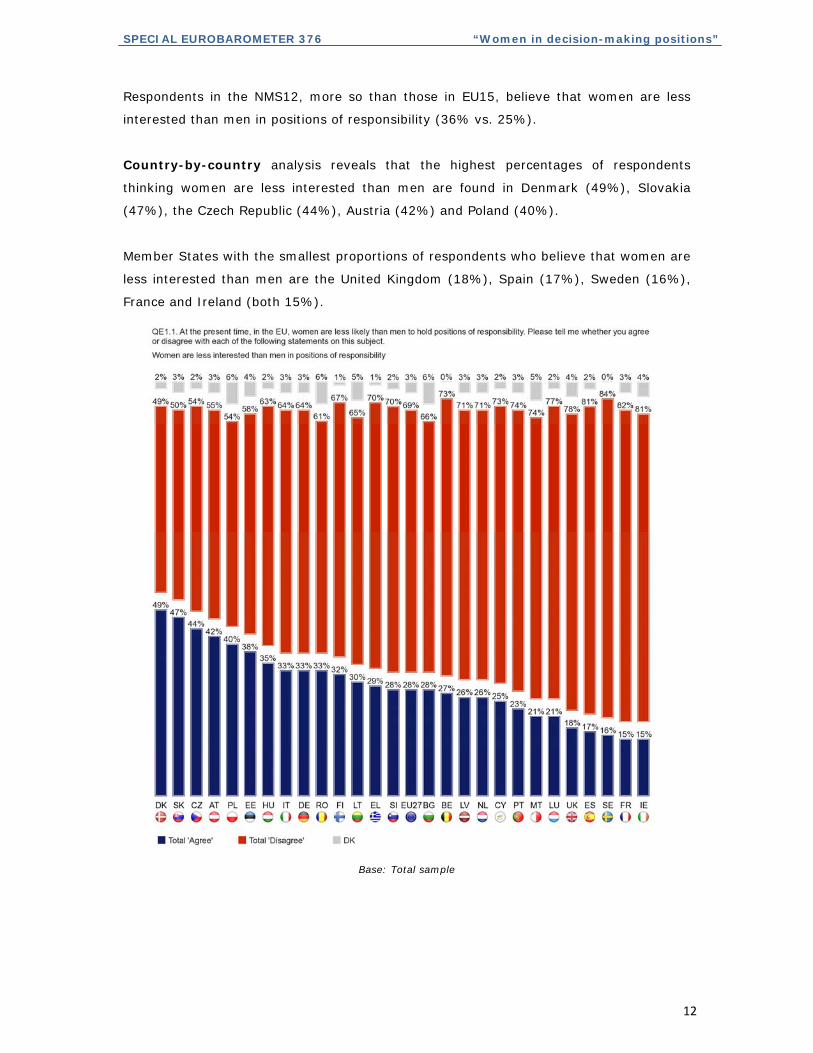
Respondents in the NMS12, more so than those in EU15, believe that women are less
interested than men in positions of responsibility (36% vs. 25%).
Country-by-country analysis reveals that the highest percentages of respondents
thinking women are less interested than men are found in Denmark (49%), Slovakia
(47%), the Czech Republic (44%), Austria (42%) and Poland (40%).
Member States with the smallest proportions of respondents who believe that women are
less interested than men are the United Kingdom (18%), Spain (17%), Sweden (16%),
France and Ireland (both 15%).
Base: Total sample

SPECIAL EUROBAROMETER 376 “Women in decision-making positions”
13
Two of the latter countries also are, when compared to 2009, the Member States with
the fastest growing number of interviewees disagreeing with the statement that women
are less interested than men: Sweden (from 68% to 84%, + 16 points) and Ireland
(from 69% to 81%, +12 points). This is true also in Portugal (from 64% to 74%, +10
points) and Cyprus (from 64% to 73%, +9 points).
Slovenia stands out as the Member State with the largest decrease of respondents who
disagree that women are less interested than men (from 78% to 70%, - 8 points).
Base: Total sample

SPECIAL EUROBAROMETER 376 “Women in decision-making positions”
14
Socio-demographic analysis reveals that gender, age and education are an influence in
this matter. More men than women (32% vs. 24%) say that women are less interested
than men in positions of responsibility. The older the interviewees, the more likely they
are to have this view: 31% of the oldest respondents (55+) compared to 24% of the
youngest (15-24). Turning to education, those who had finished school at the age of
fifteen or earlier are somewhat more likely (31%) to have this view than the longer
educated respondents (27%).
Base: Total sample

SPECIAL EUROBAROMETER 376 “Women in decision-making positions”
15
1.1.2 Women’s skills to fill positions of responsibility
- A large majority of Europeans believe that women have the necessary
qualities and skills to fill positions of responsibility -
While the previous section focussed on women’s motivation to fill positions of
responsibility, this section will discuss women’s capabilities. Respondents were asked
whether they agree or disagree with the statement that ‘women do not always have the
necessary qualities and skills to fill positions of responsibility’.
Base: Total sample
Over three-quarters of the Europeans interviewed (76%) disagree with this statement:
47% totally disagree and 29% tend to disagree. Conversely, about one in five (21%)
believes that women do not always have the necessary qualities and skills to fill positions
of responsibility: 16% tend to agree and 5% totally agree.
Since 2009, the proportion of respondents disagreeing with this statement has clearly
grown (from 71% to 76%, +5 points), with a marked increase of respondents who totally
disagree (from 38% to 47%, +9 points).
In conclusion, a large majority (76%) of Europeans believe that women do have the
qualities and skills that are necessary to fill positions of responsibility.

SPECIAL EUROBAROMETER 376 “Women in decision-making positions”
16
Interviewees in the EU15 are much more likely than those in the NMS12 to disagree with
the statement that women lack qualities and skills (79% vs. 64%) and this is particularly
true for those who totally disagree (52% vs. 28%).
Country-by-country analysis reveals important differences. Slovakia (47%) stands out
as the country with most interviewees saying women do not always have the necessary
qualities and skills to fill positions of responsibility. Austria, Poland (both 36%), Hungary
(34%), Lithuania (32%) and Italy (31%) follow at some distance.
This view is shared the least in France (9%), Luxembourg (7%) and Sweden (6%).
Base: Total sample

SPECIAL EUROBAROMETER 376 “Women in decision-making positions”
17
Compared to 2009, the most rapidly growing proportions of respondents who disagree
with the statement that woman do not always have the necessary qualities and skills to
fill positions of responsibility are found in Ireland (from 67% to 81%, +14 points),
Portugal (from 64% to 76%, +12 points), Latvia (from 63% to 73%, +10 points) and the
UK (from 71% to 81%, +10 points). Hungary is the only country where disagreement
significantly decreases (64%, -4 points).
Base: Total sample

SPECIAL EUROBAROMETER 376 “Women in decision-making positions”
18
Socio-demographic analysis shows differences regarding gender, education, occupation
and financial situation. Men (26%) are more likely than women (18%) to say that women
do not always have the necessary qualities and skills to fill positions of responsibility.
Respondents who finished their education at the age of fifteen or earlier (26%) are more
likely to believe women lack appropriate qualities and skills than those who finished their
education at the age of twenty or later (17%). This is also true for manual workers
(24%) and the unemployed (23%) compared to managers (18%) and students (17%);
and for respondents who have difficulties in paying their bills (25%) compared to those
without such financial difficulties (19%).
Base: Total sample

SPECIAL EUROBAROMETER 376 “Women in decision-making positions”
19
1.2 Women and their careers
–Two-thirds of Europeans believe that women are as willing as men
to fight to make a career for themselves –
The previous sections discussed how women relate to positions of responsibility. This
section deals with women’s attitude towards making a career in general. Respondents
were asked whether they agree or disagree with the statement that ‘women are less
willing than men to fight to make a career for themselves’.
Two-thirds (68%) of the Europeans surveyed disagree with this statement: 36% totally
disagree and 32% tend to disagree. Conversely, about one in three (29%) respondents
does agree: with 23% who tend to agree and 6% who totally agree.
In conclusion, a majority (68%) of Europeans believe that women are just as willing as
men to fight to make a career for themselves.
Base: Total sample

SPECIAL EUROBAROMETER 376 “Women in decision-making positions”
20
Since 2009, disagreement with the statement that women are less willing than men to
fight to make a career slightly grew in percentage terms (from 64% to 68%, +4 points).
More strikingly, disagreement intensified by a growing proportion of respondents who
totally disagree (from 29% to 36%, +7 points). Interviewees in the EU15 countries are
more likely to disagree with the statement than those in the NMS12 countries (71% vs.
58%).
Base: Total sample
Country-by-country analysis reveals that respondents in Slovakia (50%), Hungary and
Poland (both 46%) most often say that women are less willing than men to fight to make
a career.
The lowest percentages of agreement with this statement are found in Cyprus (20%),
Malta (19%), Ireland (18%), France (17%) and Spain (15%).

SPECIAL EUROBAROMETER 376 “Women in decision-making positions”
21
When comparing to 2009, Member States with the most salient rises in disagreement
with this statement are Portugal (from 61% to 75%, +14 points), Sweden (from 51% to
65%, +14 points), Cyprus (from 65% to 78%, +13 points) and Finland (from 48% to
61%, +13 points).
Conversely, Slovenia stands out with the largest fall in disagreement with this statement
(from 80% to 70%, -10 points).
Base: Total sample

SPECIAL EUROBAROMETER 376 “Women in decision-making positions”
22
From a socio-demographic view, there are differences with respect to gender and age.
Just slightly more men (32%) than women (28%) believe that women are less willing
than men to fight to make a career. This is also true for the older interviewees aged 55+
(34%) compared with the youngest respondents aged 15-24 (24%).
Base: Total sample

SPECIAL EUROBAROMETER 376 “Women in decision-making positions”
23
1.3 Women and their family responsibilities
- Over two-thirds of Europeans say
women have less freedom because of their family responsibilities -
Though family responsibilities belong to both men and women, in society they are
traditionally seen as a part of women’s domain. As described in the first part of this
chapter, women’s family responsibilities are mentioned second most often by European
interviewees as a reason for the fact that, at the present time, in the EU, women are less
likely than men to hold positions of responsibility. Interviewees were asked whether they
agree or disagree with the statement that ‘women have less freedom because of their
family responsibilities’.
Two-thirds of Europeans (68%) agree with the statement that women have less freedom
because of their family responsibilities: 24% totally agree and 44% tend to agree. By
contrast, one in three respondents (30%) disagrees: 19% tend to disagree and 11%
totally disagree.
Base: Total sample
Even though the majority of Europeans agrees with the statement that women have less
freedom than men because of their family responsibilities, the level of agreement has
declined when compared to 2009 (from 76% to 68%, -8 points). In particular, the
proportion of respondents who tend to agree has shrunk (from 50% to 44%), -6 points),
while the proportion of those who totally disagree has grown (from 6% to 11%, +5
points).

SPECIAL EUROBAROMETER 376 “Women in decision-making positions”
24
Interviewees in the NMS12 countries are more likely than those in EU15 countries to say
that women have less freedom because of their family responsibilities (76% vs. 66%).
A country-by-country breakdown shows that respondents in Slovakia (85%), Hungary
(83%) and Greece (79%) are most likely to believe that women’s family responsibilities
withhold them from other positions of responsibility.
Respondents are least likely to say so in France (51%), followed by Portugal (59%) and
Lithuania (60%).
Base: Total sample

SPECIAL EUROBAROMETER 376 “Women in decision-making positions”
25
Compared with 2009, the number of respondents who believe that women have less
freedom because of their family responsibilities has decreased in every single Member
State (the only exception being Romania, where the percentage of respondents agreeing
remained the same: 70%). The most notable decreases are found in France (from 69%
to 51%, -18 points) and Cyprus (from 83% to 65%, -18 points).
Base: Total sample

SPECIAL EUROBAROMETER 376 “Women in decision-making positions”
26
Socio-demographic breakdown reveals that gender has a slight influence, and age and
occupation more so. Slightly more women (69%) than men (66%) say that women have
less freedom because of their family responsibilities. The youngest respondents aged 15-
24 (58%) are least likely to have this view, compared with the age groups 25-34 and 35-
54 (both 67%) and in particular the oldest respondents aged 55+ (72%).
Similarly, students (56%) are least likely to agree with this statement, whereas retired
persons (74%) and house persons (73%) are the most likely to do so. It is interesting to
note that there are no differences when looking at the household composition of the
respondents. The same proportion of Europeans living alone and respondents living as a
couple with children (3 or 4+) agrees with the fact that women have less freedom
because of their family responsibilities (68% for all categories). However, differences
may be found when looking at the political positioning of the respondents: respondents
who tend to position themselves on the right scale tend more to agree more with the
statement that those who are on the left (72% vs. 66%).

SPECIAL EUROBAROMETER 376 “Women in decision-making positions”
27
Base: Total sample
SPECIAL EUROBAROMETER 376 “Women in decision-making positions”
28
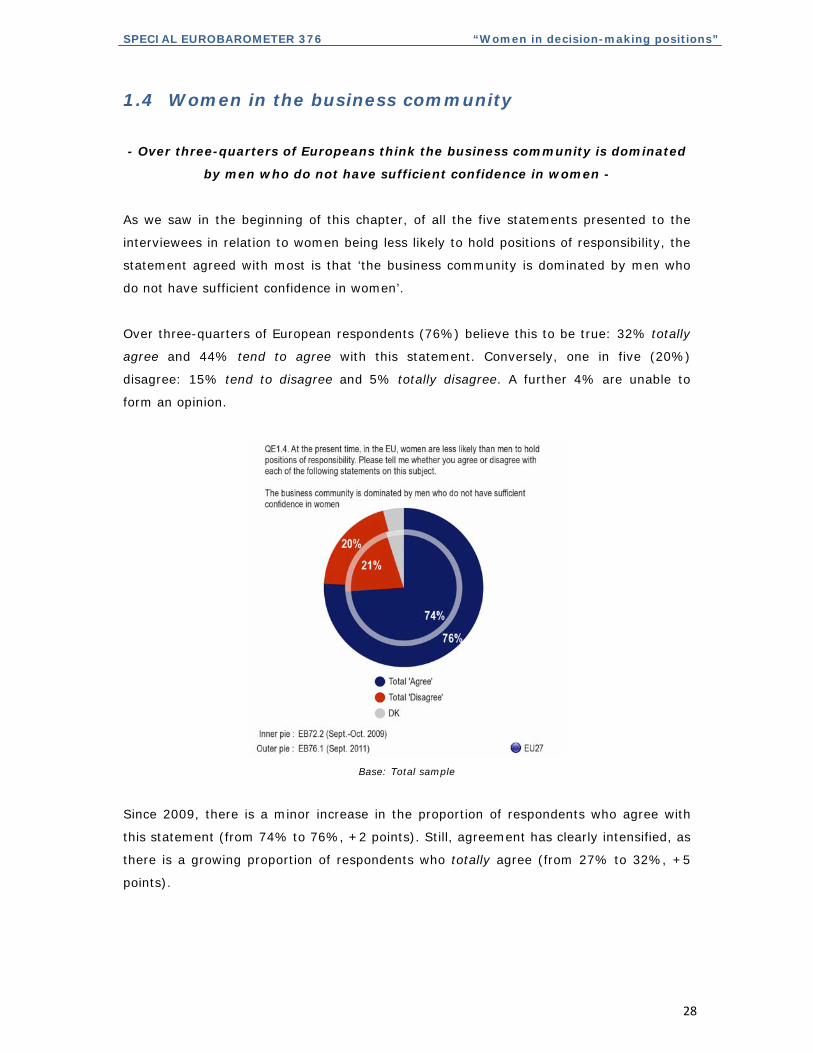
1.4 Women in the business community
- Over three-quarters of Europeans think the business community is dominated
by men who do not have sufficient confidence in women -
As we saw in the beginning of this chapter, of all the five statements presented to the
interviewees in relation to women being less likely to hold positions of responsibility, the
statement agreed with most is that ‘the business community is dominated by men who
do not have sufficient confidence in women’.
Over three-quarters of European respondents (76%) believe this to be true: 32% totally
agree and 44% tend to agree with this statement. Conversely, one in five (20%)
disagree: 15% tend to disagree and 5% totally disagree. A further 4% are unable to
form an opinion.
Base: Total sample
Since 2009, there is a minor increase in the proportion of respondents who agree with
this statement (from 74% to 76%, +2 points). Still, agreement has clearly intensified, as
there is a growing proportion of respondents who totally agree (from 27% to 32%, +5
points).

SPECIAL EUROBAROMETER 376 “Women in decision-making positions”
29
Country-by-country analysis shows that in every single Member State, over half of the
respondents agree with the statement that business is dominated by men with
insufficient confidence in women. The highest percentages are found in Hungary (85%),
France and Cyprus (both 83%), Sweden (81%), Greece and Italy (both 80%). The lowest
percentages are observed in Latvia (61%), Denmark (60%) and Malta (55%).
Base: Total sample
When comparing with 2009, the numbers of respondents saying that the business
community is dominated by men increased most in Greece (from 73% to 80%, +7
points), Poland (from 71% to 78%, +7 points), the Czech Republic (from 67% to 73%,
+6 points) and Italy (from 74% to 80%, +6 points).

SPECIAL EUROBAROMETER 376 “Women in decision-making positions”
30
In only four countries, the number of respondents who think so decreased: Denmark
(from 67% to 60%, -7 points), Malta (from 60% to 55%, -5 points), Finland (from 70%
to 66%, -4 points) and France (from 84% to 83%, -1 point).
Base: Total sample

SPECIAL EUROBAROMETER 376 “Women in decision-making positions”
31
Socio-demographic breakdown reveals differences for gender and occupation. Perhaps
unsurprisingly, more women (80%) than men (72%) say the business community is
dominated by men with insufficient confidence in women.
Similarly, house persons are more likely to say so (82%) compared with managers
(71%) and self-employed respondents (72%). Respondents who position themselves on
the left of the political scale tend more to think that business community is dominated by
who do not have confidence in women than those who position themselves on the right
(80% vs. 73%).
Base: Total sample

SPECIAL EUROBAROMETER 376 “Women in decision-making positions”
32
2 EQUAL REPRESENTATION OF WOMEN AND MEN IN LEADERSHIP POSITIONS IN PRIVATE COMPANIES
Having seen Europeans’ views associated with gender equality on positions of
responsibility in general, we now turn to their opinion on gender balance specifically in
business leadership: whether they are in favour of it and the reasons why.
2.1 Representation of women in leadership positions in
private companies
- Nearly nine Europeans out of ten agree that, given equal competence, women
should be equally represented in positions of leadership in companies -
The great majority (88%) of the Europeans agree with the statement that ‘given equal
competence, women should be equally represented in positions of leadership in
companies’8: 55% totally agree and 33% tend to agree. Only a small minority (9%)
disagree with the statement: 7% tend to disagree and 2% totally disagree.
Base: Total sample
8 QE2 Do you agree or disagree with the following statement: Given equal competence, women should be
equally represented in positions of leadership in companies?

SPECIAL EUROBAROMETER 376 “Women in decision-making positions”
33
Country-by-country analysis shows that in every single Member State there is a large
majority of interviewees in support of gender balance in business leadership, with the
largest proportions observed in Cyprus, Ireland (both 96%), Slovenia (95%), Sweden
(94%) and the UK (93%). The lowest percentages are in Slovakia (79%), Romania
(80%) and Austria (81%).
Member States with highest percentages of interviewees who totally agree are Sweden
(83%), Cyprus (78%) and Slovenia (75%). Countries where respondents are most
inclined to tend to agree are the Czech Republic (51%), Slovakia (49%), Italy, Portugal
(both 48%) and Austria (46%).
Base: Total sample

SPECIAL EUROBAROMETER 376 “Women in decision-making positions”
34
Socio-demographic breakdown reveals the clear influence of gender and small
differences regarding age and education. Women are more likely than men (92% vs.
84%) to agree that ‘given equal competence, women should be equally represented in
positions of leadership in companies’. Moreover, women more often than men totally
agree (64% vs. 46%).
Respondents who had left school at the age of 15 or younger are somewhat less likely
(85%) than their more educated counterparts to be in support of gender balance on
company boards. This is also true of self-employed respondents (85%) compared with
white collar workers (91%).
Base: Total sample

SPECIAL EUROBAROMETER 376 “Women in decision-making positions”
35
2.2 Reasons for promoting equal representation
between men and women in positions of leadership
in companies
- Europeans mention equal qualifications and equal rights most often
as reasons for gender balance in company leadership -
Having seen that the vast majority of Europeans agree that, given equal competence,
women should be equally represented in positions of leadership in companies, we now
turn to examine the reasons why Europeans think so. Those respondents who had agreed
that women should be equally represented were then asked to choose a maximum of
three out of six possible reasons9.
Base: Respondents who answered they ‘totally agree’ or ‘tend to agree’
that women should be equally represented (n= 23,700)
9 QE2 You said that women should be equally represented in positions of leadership in companies. Why do you think so? - Because it would ensure a better overall economic performance of companies - Because it would ensure a better risk management of companies - Because it would encourage other women to lead a professional career - Because women are as qualified for these positions as men are - Because it would make a difference in the way companies are run - Because it is about equal rights for women and men

SPECIAL EUROBAROMETER 376 “Women in decision-making positions”
36
Reasons more often quoted by Europeans are related to justice and equality rather than
economic efficiency. Of those Europeans who are in favour of gender balance in company
leaderships, majorities say ‘because women are as qualified for these positions as men
are’ (62%) or ‘it is about equal rights for women and men’ (58%); fewer than three in
ten mention that ‘it would encourage other women to lead a professional career’ (28%)
or ‘it would make a difference in the way companies are run’ (27%); smaller percentages
cite ‘it would ensure a better overall economic performance of companies’ (17%) or ‘it
would ensure a better risk management of companies’ (15%).
A country-by-country breakdown shows that Sweden (84%) and Denmark (82%)
stand out as the Member States with vast majorities saying ‘because women are as
qualified for these positions as men are’, followed on some distance by France and
Luxembourg (both 75%). Overall, this item ranked first in 21 out of 27 Member States.
Interviewees in Estonia (43%), Poland (48%) and Italy (49%) are least likely to cite this
reason.
France (77%) stands out as the country with highest percentage of respondents
mentioning ‘equal rights of women and men’, followed on some distance by Finland and
Belgium (both 66%). This reason ranked first in 7 of the 27 Member States (including a
shared first place with ‘equal qualifications’ in Austria, both 62%) Respondents in
Denmark and Poland (both 42%) are least likely to mention this reason.
The highest percentages of respondents citing ‘because it would encourage other women
to lead a professional career’ are found in Cyprus (45%) and Austria (42%). Conversely,
lowest percentages are found in Spain and Slovenia (both 21%).
Denmark, the Netherlands (both 55%) and Sweden (53%) stand out as the Member
States with over half of the interviewees saying ‘it would make a difference in the way
companies are run’. In contrast, respondents in Poland and Lithuania (both 10%) were
least likely to.
Ireland stands out as the country with largest proportions of respondents citing ‘because
it would ensure a better overall economic performance of companies’ (37%) and
‘because it would ensure a better risk management of companies’ (22%).

SPECIAL EUROBAROMETER 376 “Women in decision-making positions”
37
Base: Respondents who answered that they ‘totally agree’ or ‘tend to agree’
that women should be equally represented (n= 23,700)
A socio-demographic breakdown reveals that, unsurprisingly, women (64%) are more
likely than men (59%) to say women are as qualified as men for positions of company
leadership. This is also true of those who studied until the age of twenty or longer (66%)
compared to those who had finished their education at the age of fifteen or earlier
(58%). Managers (68%) are more likely to say that women and men are equally
qualified than self-employed respondents (57%).

SPECIAL EUROBAROMETER 376 “Women in decision-making positions”
38
So are interviewees who almost never have problems with paying their bills (65%)
compared to those who have these problems most of the time (56%).
There is no difference between men and women in mentioning equal rights as a reason
for equal representation. Age, education and occupation have a small influence. The
youngest respondents aged 15-24 (63%) differ by being slightly more likely to mention
equal rights compared to the older respondents. Interestingly, the longer educated
respondents (till the age of 20 or beyond, 55%) are less likely to mention equal rights
than their less educated counterparts. Students (62%) more often cite equal rights than
self-employed interviewees (52%).
A slightly higher percentage of women than men (29% vs. 26%) mention the
encouragement of other women as a reason for equal representation of women and men
in company leadership. House persons (32%) are more likely to cite this reason than
managers (25%).
Women are more likely than men (29% vs. 25%) to think that equal representation of
women and men in company leadership would make a difference in the way companies
are run. This is also true for the longer educated (20 or beyond, 33%) compared to those
who had left school at the age of 15 or younger (22%). Managers (36%) are more likely
to cite this reason than the unemployed (21%). So are respondents who find it easy to
pay their bills (30%) compared to those who struggle (22%).
Only slightly higher proportions of women than men think that equal representation of
women and men on company boards would ensure a better overall economic
performance of companies (19% vs. 16%) or that it would ensure a better risk
management of companies (15% vs. 14%).
Overall, it should be noted that there are only minor differences between women’s and
men’s views regarding reasons for equal representation of women and men in company
leadership positions.

SPECIAL EUROBAROMETER 376 “Women in decision-making positions”
39
Base: Respondents who answered that they ‘totally agree’ or ‘tend to agree’
that women should be equally represented (n= 23,700)

SPECIAL EUROBAROMETER 376 “Women in decision-making positions”
40
3 ACHIEVING A BALANCED REPRESENTATION OF WOMEN AND MEN ON COMPANY BOARDS
The first chapter of this report presented Europeans’ views on gender equality in general.
The second chapter focussed more specifically on gender balance in leadership positions
in private companies. This chapter will take one step further and discuss Europeans’
views on how to achieve a balanced representation of women and men on company
boards.
Europeans’ view on the following topics will be addresses here:
Ways to achieve balanced representation on company boards
Legislation on gender balance on company boards
Level of measures to improve gender balance: national or European
3.1 Best way to achieve balanced representation of
women and men on company boards
— Opinion is divided on how to achieve gender balance on company boards —
The interviewees were presented with the following information: ‘Women are under-
represented in positions of leadership and progress is slow. For example, they represent
only on average 12% of board members of the largest publicly listed companies in the EU
Member States.’ Then the respondents were asked to choose which they thought to be
the best of three options to achieve a more balanced representation of men and women
on company boards10.
10 QE4 What is, in your view, the best way to achieve a more balanced representation of men and women on
company boards? 1. Voluntary measures such as non-binding Corporate Governance Codes and Charters 2. Self-regulation by companies setting their own targets 3. Binding legal measures

SPECIAL EUROBAROMETER 376 “Women in decision-making positions”
41
Opinion is divided on the best way to achieve gender balance in company boards. Almost
one-third believes the best way is ‘self-regulation by companies setting their own targets’
(31%). Just over a quarter thinks it would demand ‘binding legal measures’ (26%). One-
fifth says ‘voluntary measures, such as non-binding Corporate Governance Codes and
Charters’ (20%).
Base: total sample
Interestingly, a considerable minority of 15% is unable to form an opinion on this matter
and a further 8% say spontaneously ‘there is no need to achieve a more balanced
representation of men and women on company boards’.
Respondents in NMS12 more often tend not to have an opinion on this topic than those in
EU15 (20% NMS12 vs. 14% EU15). Conversely, respondents in EU15 are somewhat
more likely than those in NMS12 to be in favour of self-regulation by companies (32%
EU15 vs. 27% NMS12).

SPECIAL EUROBAROMETER 376 “Women in decision-making positions”
42
A second analysis was performed, including only those respondents who did choose one
of the three options to achieve gender balance on company boards: a relative majority of
them are in favour of self-regulation (40%), whereas over one-third calls for binding
legal measures (34%), and about one-quarter believes the best way to be voluntary
measures (26%).
Base: Respondents who did choose a way to achieve gender balance
on company boards (n= 20,731)
Country-by-country analysis reveals that Denmark (54%) stands out as the country
with largest proportion of respondents being in favour of self-regulation by companies to
achieve gender balance in company boards, followed on some distance by Finland (40%).
Lowest percentages are found in Spain, Cyprus (both 18%) and Romania (20%).
Binding legal measures are most often mentioned in Cyprus, Greece (both 39%) and
Austria (37%). Fewest citing of binding legal measures is found in Denmark (10%),
Luxembourg (16%) and Sweden (17%).
Sweden (36%) has the highest percentage of interviewees who prefer voluntary
measures, followed on some distance by Cyprus (30%). By contrast, Malta and Portugal
(both 9%) have the lowest percentages.

SPECIAL EUROBAROMETER 376 “Women in decision-making positions”
43
The highest percentage of interviewees who spontaneously say that there is no need to
achieve more gender balance on company boards are found in the Netherlands (21%),
followed on some distance by Latvia (16%). Lowest percentages are found in Sweden
(2%) and Poland (3%).
Malta (31%), Portugal and Poland (25%) have the largest proportions of respondents
saying they don’t know.
Base: total sample
Overall, of the 27 Member States, the clear majority view regarding the best way to
achieve gender balance in company boards is by self-regulation in 14 countries; by
binding legal measures in 10 countries; and comparably equal relative majority support
for both ways is found in 2 countries (Poland and Lithuania, both 27% for each
measure). In Estonia, voluntary measures are the best way to achieve gender balance in
company boards for a relative majority of respondents (29%).

SPECIAL EUROBAROMETER 376 “Women in decision-making positions”
44
Socio-demographic analysis reveals that women (29%) are less likely than men (33%)
to choose self-regulation of companies as the best option. Furthermore, women are more
likely than men to support binding legal measures (29% vs. 23%). Unsurprisingly,
women are less likely than men to spontaneously say there is no need to achieve a more
balanced representation of men and women on company boards (6% vs. 10%).
The oldest respondents aged 55+ (28%) are less likely to choose self-regulation than the
younger respondents and they are most likely to have no opinion on this topic (19%).
Turning to education, respondents who had left school at the age of 15 or younger (24%)
stand out clearly as less likely than their more educated counterparts (33% and 34%
respectively) to be in favour of self-regulation of companies. This is also true of house
persons (24%) compared to other occupations, most notably managers (37%).
Base: total sample

SPECIAL EUROBAROMETER 376 “Women in decision-making positions”
45
3.2 Legislation to achieve balanced representation of
women and men on company boards
- Three-quarters of Europeans are in favour of
legislation on gender balance on company boards-
Whereas the former section described Europeans’ preferences regarding various ways to
achieve gender balance on company boards, this section focuses exclusively on
legislation.
The interviewees were first informed that ‘some European countries (e.g. France, Spain,
the Netherlands, Italy, Belgium and Norway) have already taken legal measures to
ensure a more balanced representation of men and women on company boards’. Then
they were asked whether they were in favour or opposed to legislation on this matter
under the condition that qualification is taken into account without automatically
favouring one of either gender.11
Three-quarters (75%) of the European interviewees are in favour of such legislation. A
minority (17%) oppose it. A further 8% had no opinion on this topic.
Base: total sample
11 QE5 Some European countries (e.g. France, Spain, the Netherlands, Italy, Belgium and Norway) have already taken legal measures to ensure a more balanced representation of men and women on company boards. Are you in favour or opposed to legislation on this matter under the condition that qualification is taken into account without automatically favouring one of either gender?

SPECIAL EUROBAROMETER 376 “Women in decision-making positions”
46
Country-by-country analysis shows that in every single Member State, there is an
absolute majority in favour of legislation on gender balance on company boards when
qualification is taken into account. Highest percentages of respondents who are in favour
are found in Cyprus (91%), France (86%), Belgium, Portugal, Slovakia (all 84%). Lowest
percentages are in Denmark (52%), Germany (58%) and Sweden (62%).
Base: total sample

SPECIAL EUROBAROMETER 376 “Women in decision-making positions”
47
Socio-demographic breakdown shows that women (79%) are more likely than men
(69%) to be in favour of legislation to achieve gender balance on company boards. The
younger the interviewees, the more likely they are to be in favour of legislation: the
youngest respondents aged 15-24 (78%) compared to the oldest respondents aged 55+
(71%). It is noteworthy that, of all occupations, managers (67%) are those who are least
likely to favour legislation whereas other white collar workers (79%) are the most likely.
Base: total sample
In the preceding section of this chapter, we learned about Europeans’ choices when they
have to pick one out of three options to improve gender balance in company boards: (1)
self-regulation by the companies setting their own targets, (2) voluntary measures such
as non-binding Corporate Governance Codes and Charters, or (3) binding legal
measures.

SPECIAL EUROBAROMETER 376 “Women in decision-making positions”
48
In the present section, interviewees are presented with just one option: legislation with
additionally further explanation that qualification is taken into account. It is interesting to
examine the relationship of this option with each of the three options of the preceding
section. Further analysis yielded two notable correlations.
Firstly, a clear positive correlation is found between support for legislation and preference
for binding legal measures. In other words, Member States with higher percentages of
respondents who favour legislation also tend to have higher percentages preferring
binding legal measures (over voluntary measures and self-regulation); vice versa, lower
percentages of support for legislation tend to coincide with lower percentages preferring
binding legal measures. A visual image is presented in the graph below.
Positive correlation between support for legislation (QE5 total ‘in favour’) and preference for binding legal measures (QE4.3)

SPECIAL EUROBAROMETER 376 “Women in decision-making positions”
49
Secondly, a negative correlation is found between support for legislation and preference
for self-regulation of companies setting their own targets (over voluntary measures and
binding legal measures). More specifically, countries with smaller proportions of
respondents in favour of legislation tend to have larger proportions preferring self-
regulation; vice versa, higher proportions supporting legislation tend to be accompanied
by lower percentages preferring self-regulation of companies.
Negative correlation between support for legislation (QE5 total ‘in favour’) and preference for self-regulation by companies (QE4.2)

SPECIAL EUROBAROMETER 376 “Women in decision-making positions”
50
3.3 Decision level for measures to improve gender
balance on company boards
- Europeans are divided on the level of decision-making with regards to
measures taken, with a slight preference for the European level rather than the
national level (35% vs. 34%)-
All interviewees were asked whether they would prefer European level or national level
decision making when it comes to measures to improve gender balance on boards of
publicly listed companies12.
Base: Total sample
12 QE9 With regards to measures taken to improve gender balance on boards of publicly listed companies, do
you think that decisions should be made by at national level or European level? - At national level - At European level
SPECIAL EUROBAROMETER 376 “Women in decision-making positions”
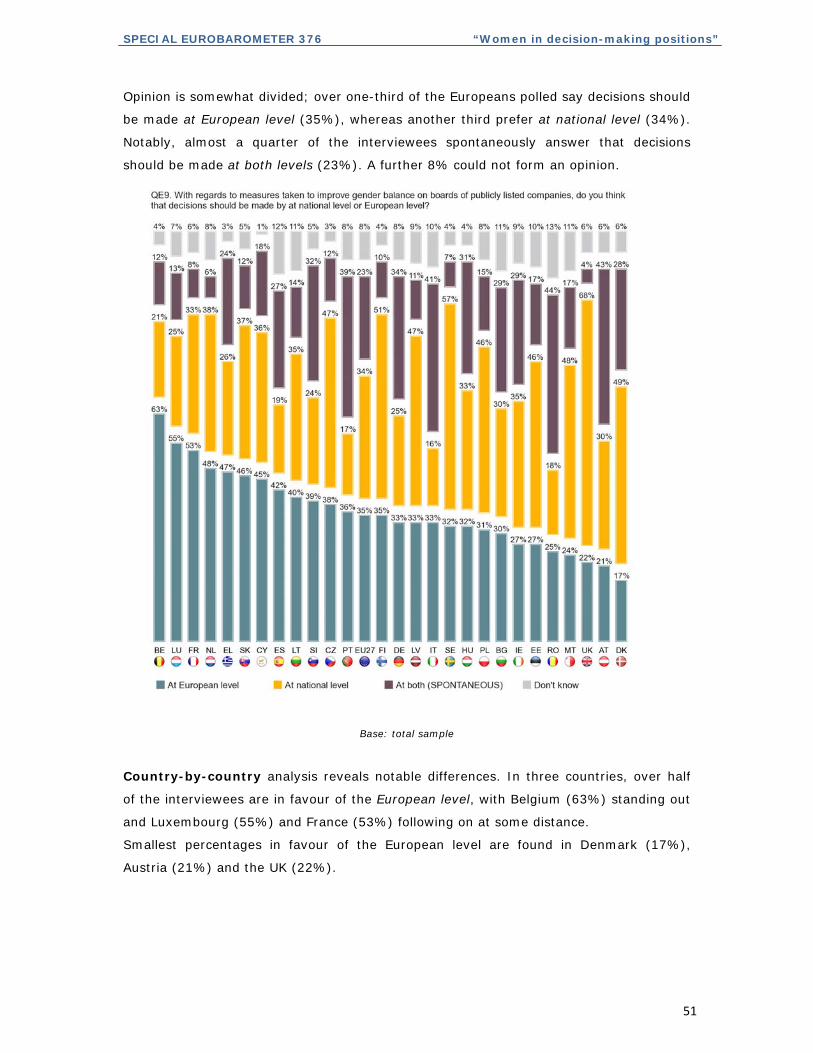
51
Opinion is somewhat divided; over one-third of the Europeans polled say decisions should
be made at European level (35%), whereas another third prefer at national level (34%).
Notably, almost a quarter of the interviewees spontaneously answer that decisions
should be made at both levels (23%). A further 8% could not form an opinion.
Base: total sample
Country-by-country analysis reveals notable differences. In three countries, over half
of the interviewees are in favour of the European level, with Belgium (63%) standing out
and Luxembourg (55%) and France (53%) following on at some distance.
Smallest percentages in favour of the European level are found in Denmark (17%),
Austria (21%) and the UK (22%).

SPECIAL EUROBAROMETER 376 “Women in decision-making positions”
52
A national level is preferred by absolute majorities in the UK (68%), Sweden (57%) and
Finland (51%). Moreover, large relative majorities preferring this option are found in
Denmark (49%), Malta (48%), the Czech Republic, Latvia (both 47%), Estonia, and
Poland (both 46%).
Interviewees are least likely to choose the national level in Italy (16%), Portugal (17%),
Romania (18%) and Spain (19%).
Respondents are most likely to spontaneously mention both European and national level
in Romania (44%), Austria (43%), Italy (41%) and Portugal (39%). This is least the case
in the UK (4%), the Netherlands (6%), Sweden (7%) and France (8%).
Socio-demographic breakdown reveals hardly any differences between men and
women; however, age and education are an influence. The younger the respondents are,
the more likely they prefer the European level: the youngest respondents aged 15-24
(41%) are more likely than the oldest respondents aged 55+ (32%). The respondents
who were educated until the age of 20 or beyond (39%) are more likely to choose the
European level compared to those who had left school at the age of 15 or younger
(31%). This is also true for students (43%) compared with retired interviewees (30%).
Respondents who position themselves on the left are more likely to advocate for the
European level rather than the national level (41% vs. 31%). On the contrary, those who
position themselves on the right tend to choose more the national level of decision-
making (36% vs. 35% for the European level).
Respondents who believe that binding legal measures is the best way to achieve a more
balanced representation of men and women in positions of leadership in companies are
more likely to advocate for the European level of decision-making (42% vs. 32% for the
national level). It is also the case for the respondents who are in favour of a legislation to
ensure a more balanced representation of men and women on company boards.

SPECIAL EUROBAROMETER 376 “Women in decision-making positions”
53
Base: total sample

SPECIAL EUROBAROMETER 376 “Women in decision-making positions”
54
4 LEGISLATION PROVIDING A MORE BALANCED REPRESENTATION OF WOMEN AND MEN ON COMPANY BOARDS
The preceding chapter described Europeans being in favour of, or opposed to legislation
to achieve gender balance on company boards. This chapter elaborates further on what
such legislation, in their view, should imply.
The following topics will be described here:
♦ Realistic gender quota targets
♦ Time granted to companies to comply with legislation
♦ Effective sanctions
4.1 Realistic targets
— More than four Europeans out of ten say that 50% of women would be a
realistic target to achieve —
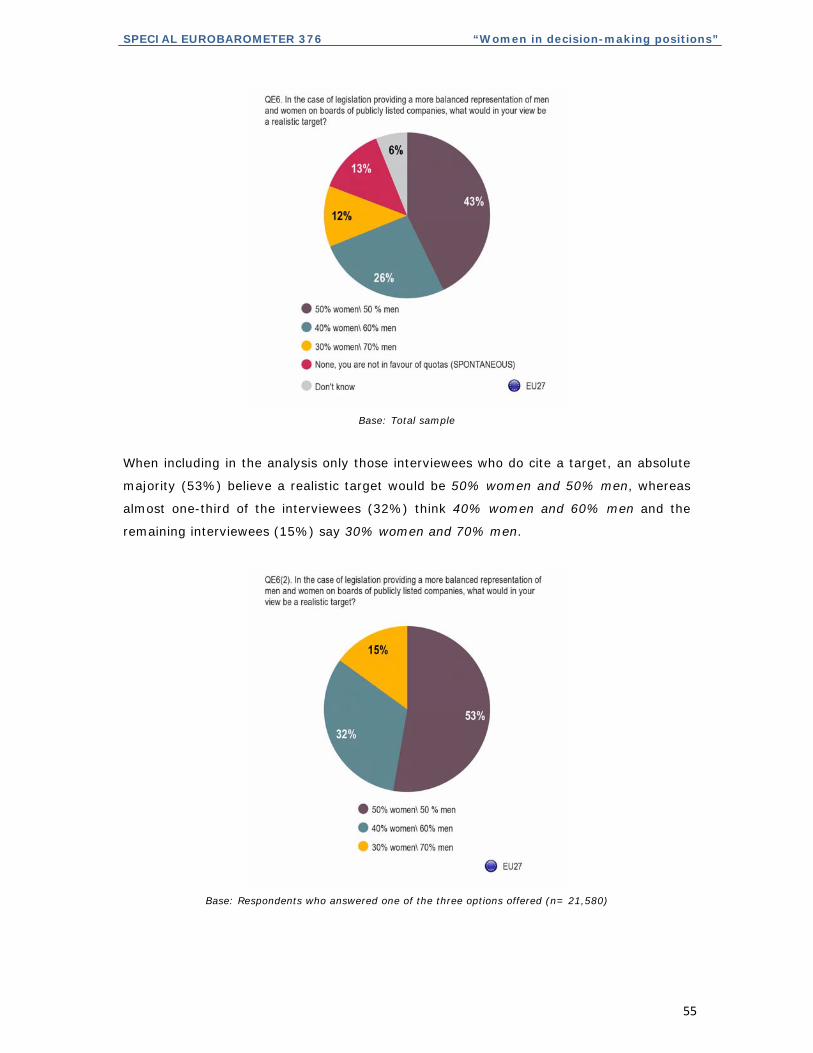
When asked what would be a realistic target in the case of legislation providing a more
balanced representation of men and women on boards of publicly listed companies,
opinion is somewhat divided13.
Though a relative majority of Europeans (43%) think 50% women and 50% men would
be a realistic target, over one-quarter (26%) say 40% women and 60% men and
sizeable minorities cite 30% women and 70% men (12%) or spontaneously say they are
not in favour of quota (13%). A further 6% did not form an opinion on this topic.
13 QE6 In the case of legislation providing a more balanced representation of men and women on boards of
publicly listed companies, what would in your view be a realistic target? - 50% women\ 50 % men - 40% women\ 60% men - 30% women\ 70% men
SPECIAL EUROBAROMETER 376 “Women in decision-making positions”
55
Base: Total sample
When including in the analysis only those interviewees who do cite a target, an absolute
majority (53%) believe a realistic target would be 50% women and 50% men, whereas
almost one-third of the interviewees (32%) think 40% women and 60% men and the
remaining interviewees (15%) say 30% women and 70% men.
Base: Respondents who answered one of the three options offered (n= 21,580)

SPECIAL EUROBAROMETER 376 “Women in decision-making positions”
56
Country-by-country analysis reveals that respondents in Spain (62%) and Portugal
(57%) are most likely to say 50% women and 50% men is a realistic target. By contrast,
interviewees in the Netherlands (28%), Denmark (29%) and Finland (31%) are least
likely to say so.
Member States with the largest proportions of respondents citing 40% women and 60%
men are the Czech Republic (37%), Slovakia (33%), Denmark and the Netherlands (both
32%). Conversely, the smallest proportions are found in Portugal (9%) and Spain (10%).
Interviewees are most likely to choose 30% women and 70% men as a realistic target in
the Netherlands (22%) and Denmark (21%). They are least likely to do so in Portugal
(2%), Spain (4%) and Ireland (5%).
Countries with the highest percentages of interviewees who refuse to mention a target
and spontaneously say they are not in favour of quotas are Finland (24%), Slovenia and
Latvia (22%) and Austria (21%); the lowest percentages are in Lithuania (5%), Cyprus
(6%) and the UK (7%).

SPECIAL EUROBAROMETER 376 “Women in decision-making positions”
57
Base: Total sample

SPECIAL EUROBAROMETER 376 “Women in decision-making positions”
58
Socio-demographic analysis reveals the clear influence of gender and occupation and
the slight influence of age and education.
Almost half (49%) of the female interviewees think a 50% women/50% men gender
quota is a realistic target, whereas only about one-third (36%) of the male respondents
think so. The youngest respondents aged 15-24 (46%) are slightly more likely to
consider this a realistic option compared to those aged 25-39 or 40-54 (both 43%) and
to the oldest respondents aged 55+ (42%). However, respondents educated for longer,
until the age of 20 or beyond (40%), are slightly less likely to think this option is a
realistic target than their less educated counterparts (44%). Managers (36%) and self-
employed respondents (34%) are markedly less likely to consider the 50%/50% option
realistic compared with house persons (49%) and unemployed respondents (51%).
Men (17%) are more likely than women (10%) to spontaneously say they are not in
favour of quotas. The youngest respondents aged 15-24 are less likely (9%) to be
against quotas than the older respondents: those aged 25-39 (13%), aged 40-54 and
aged 55+ (both 14%). Perhaps surprisingly, respondents who were educated until the
age of 20 or beyond (17%) are more likely to spontaneously say they are against gender
quotas than their less educated counterparts (12%). This is also true of managers (19%)
and self-employed interviewees (18%) compared to unemployed interviewees and
students (both 10%).
Nearly six out of ten respondents who believe that the best way to achieve a more
balanced representation of men and women in leadership positions of companies think a
50% women/50% men gender quota is a realistic target, whereas only 39% of those who
believe that self-regulation is the best way think so.
Half of the respondents who say that decisions to improve gender balance on boards
should be taken at European level think a 50% women/50% men gender quota is a
realistic target, whereas 40% of those who say that it should be taken at national level
think so.

SPECIAL EUROBAROMETER 376 “Women in decision-making positions”
59
Base: total sample

SPECIAL EUROBAROMETER 376 “Women in decision-making positions”
60
4.2 Appropriate implementation time
- Nearly four Europeans out of ten think that publicly listed companies should
be granted less than 5 years to comply with legislation -
The previous section dealt with Europeans’ opinion on what they think to be a realistic
target in the event of legislation to provide for a more balanced representation of men
and women on boards of publicly listed companies. This section elaborates further on this
aspect and examines Europeans’ view on the amount of time these companies should be
given to reach gender quota targets.
Opinion among Europeans is quite divided on the amount of time that publicly listed
companies should be granted to comply with legislation providing for a more balanced
representation of men and women as board members14. Over one-third (37%) of
respondents think this should be less than 5 years, while 26% say between 5 and 8
years, and 9% think 8 years or more. A further 12% spontaneously say that companies
should not be obliged to comply with quota legislation regarding their board members.
Interestingly, a sizeable minority of 16% could not form an opinion.
Base: total sample
14 QE7 And in that case, how long do you think should publicly listed companies be granted to comply with
legislation providing for a more balanced representation of men and women regarding their board members? - less than 5 years
- between 5 and 8 years - 8 years or more
SPECIAL EUROBAROMETER 376 “Women in decision-making positions”
61
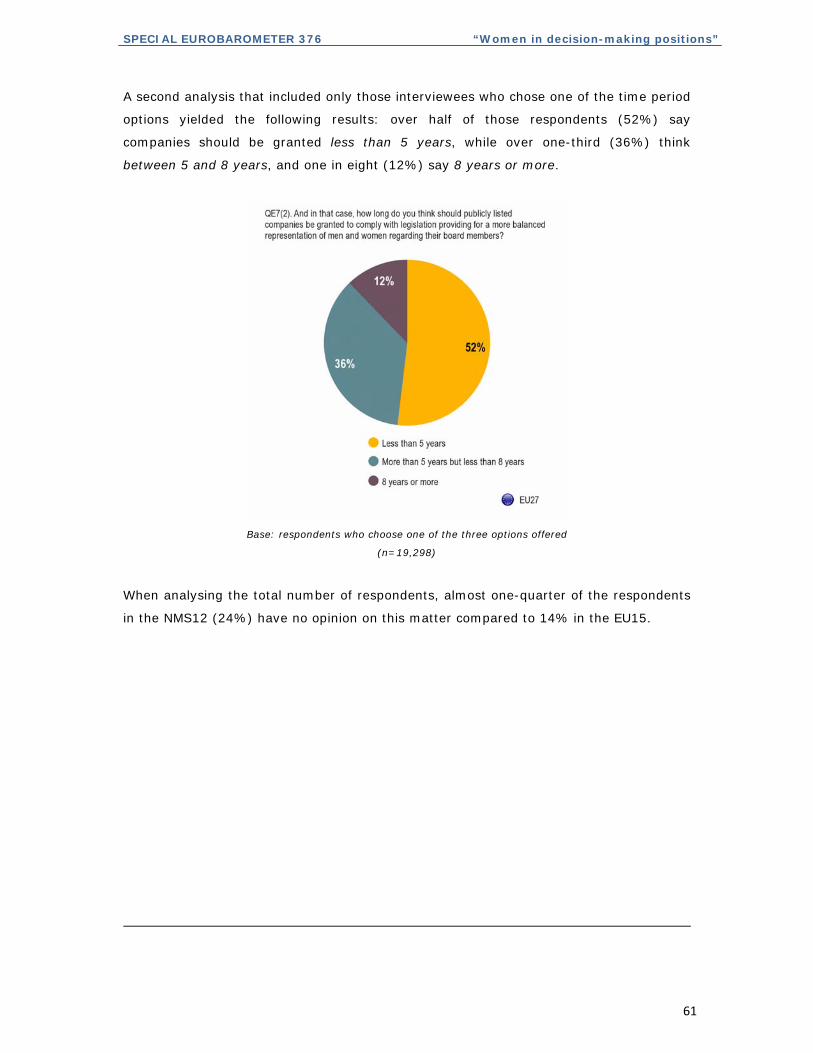
A second analysis that included only those interviewees who chose one of the time period
options yielded the following results: over half of those respondents (52%) say
companies should be granted less than 5 years, while over one-third (36%) think
between 5 and 8 years, and one in eight (12%) say 8 years or more.
Base: respondents who choose one of the three options offered
(n=19,298)
When analysing the total number of respondents, almost one-quarter of the respondents
in the NMS12 (24%) have no opinion on this matter compared to 14% in the EU15.

SPECIAL EUROBAROMETER 376 “Women in decision-making positions”
62
Base: total sample
Country-by-country analysis reveals that Cyprus (64%) stands out as the only country
with an absolute majority view in favour of companies being given less than 5 years to
reach gender balance targets on their boards. Other countries follow on at some
distance, with the highest percentages seen in the Czech Republic (47%) and France
(46%). The lowest percentages are in Estonia (22%) and Denmark (23%). In only six
countries, respondents think that they could be granted longer than 5 years: United
Kingdom, Sweden, Finland, the Netherlands, Denmark and Estonia.
Member States with the highest percentages of respondents thinking the companies
should be granted somewhat more time, i.e. between 5 and 8 years are the Netherlands
(40%), Sweden (38%), Denmark (37%), the UK, Finland (both 36%) and Estonia (32%).
Conversely, respondents in Romania (10%) and Spain (11%) are least likely to choose
this option.

SPECIAL EUROBAROMETER 376 “Women in decision-making positions”
63
Though relatively smaller proportions of interviewees say 8 years or more, Denmark
(21%) stands out, followed on at some distance by the Netherlands (16%) and Finland
(15%). This option is least likely to be chosen in Bulgaria (3%) and Malta (4%).
Member States with the largest proportions of interviewees who spontaneously say that
companies should not be obliged to comply with quota legislation regarding their board
members are Austria (24%), Germany (21%), Finland and Latvia (both 20%). The
smallest proportions are observed in Poland (3%) and Lithuania (4%).
The relative majority in Romania (39%) could not form an opinion on the appropriate
implementation time; this is also true of one-quarter or more of the interviewees in
Malta, Portugal (both 28%), Bulgaria, Poland (both 26%), and Spain (25%).
Socio-demographic analysis reveals the effects of gender, age and education. Women
are more likely than men (41% vs. 33%) to think 5 years or less is a realistic target.
Moreover, men are more inclined than women to say that companies should not be
obliged to comply with legislation on gender quotas (15% vs. 9%).
Respondents in the youngest age-group 15-24 (29%) are more likely than the oldest
respondents aged 55+ (23%) to think companies should be granted between 5 and 8
years. The youngest respondents aged 15-24 (8%) are less likely to say companies
should not be obliged to comply with legislation than respondents in the other age
groups.
Respondents who were educated until the age of 20 or beyond (29%) more often cite the
5 to 8 years option than interviewees who had left school at the age of 15 (21%). The
latter are most likely (23%) to have no opinion on this matter than their longer educated
counterparts.
Respondents who think that legal measures are the best way to achieve a more balanced
representation of men and women in positions of leadership in companies (52%) are
more likely than those who think that self-regulation is the best way (37%) to say that
companies should be granted less than 5 years.
Those who think that EU level should be the level of decision-making for those measures
(45%) are also more likely than those who think that it should be at national level (37%)
that companies should be granted less than 5 years.

SPECIAL EUROBAROMETER 376 “Women in decision-making positions”
64
Base: total sample
SPECIAL EUROBAROMETER 376 “Women in decision-making positions”
65
4.3 Appropriate sanctions in case of non-compliance
- Almost half of the Europeans mention monetary sanctions as the most
effective sanction in case of non-compliance -
The interviewees were then asked what they thought to be the most effective sanction in
case publicly listed companies do not comply with such legislation. Respondents were
presented with five options and asked for their first and then their second choice15.
The ranking of sanctions for the first choice appears to be the same as for the second
choice. Almost half (49%) of the interviewees pick a monetary fine as their first or
second choice (first 31% and second 18%).
About three in ten respondents mention no public procurement grants (30%: first 14%
and second 16%), annulment of the nomination of members of the over-represented
gender (28%: first 13% and second 15%), or annulment of the decisions taken by the
board (28%: first 12%, second 16%).
Almost two in ten interviewees spontaneously say there should be no sanctions (19%:
first 10%, second 9%). One in ten interviewees cites dissolution of company (10%: first
5%, second 5%). A further 2% spontaneously mentions another reason (1% first, 1%
second). A sizeable minority (14%) has no opinion on this topic.
Respondents in the EU15 are more likely than those in NMS12 to cite a monetary fine
(50% vs. 44%), or no public procurement grants (32% vs. 22%), or to say
spontaneously that no sanction should be applied (21% vs. 13%).
15 QE8a And in your opinion, what would be the most effective sanction in case publicly listed companies do not
comply with such legislation? (ROTATE) - Annulment of the decisions taken by the board - Annulment of the nomination of members of the over-represented gender - Dissolution of company - Monetary fine - No public procurement grants - Dissolution of company
QE8b And then?

SPECIAL EUROBAROMETER 376 “Women in decision-making positions”
66
Base: Total sample
Country-by-country analysis shows that a monetary fine is the sanction cited most
frequently in every single Member State. The highest percentages are in Cyprus (62%)
and Ireland (61%); conversely, the smallest proportions are in Denmark (35%),
Romania (36%), Estonia (37%) and Malta (38%).
Respondents in Austria (44%), Germany (42%) and Ireland (40%) are most likely to cite
no public procurement grants; on the other hand, those in Romania (11%) and Malta
(16%) are least likely to do so.
Countries with the largest proportions of respondents citing Annulment of the nomination
of members of the over-represented gender are Greece (45%), Belgium and Italy (both
39%). Again, this is least the case in Malta (13%).
Annulment of the decisions taken by the board is mentioned most often in Greece, Italy
and Cyprus (all 39%); and least often in Spain (17%).
Dissolution of company is cited most often in Italy (19%) and least often in the
Netherlands (4%).

SPECIAL EUROBAROMETER 376 “Women in decision-making positions”
67
Member States with the highest percentages of respondents who spontaneously say that
there should be no sanctions are Denmark (41%), the Netherlands (39%), Sweden
(35%) and Luxembourg (33%). The lowest percentages are found in Ireland (6%) and
Italy (7%).
Malta (34%) and Romania (32%) have the largest proportions of interviewees who could
not form an opinion on this matter. Conversely, Belgium (4%), Cyprus, Sweden and
Finland (all 5%) have the lowest percentages.
Monetary fineNo public
procurement grants
Annulment of the nomination of
members of the over-represented
gender
Annulment of the decisions taken by
the board
Dissolution of company
Don't know
EU27 49% 30% 28% 28% 10% 14%
BE 50% 33% 39% 34% 10% 4%
BG 46% 30% 25% 32% 10% 21%
CZ 55% 38% 32% 28% 15% 10%
DK 35% 32% 34% 24% 8% 7%
DE 49% 42% 22% 21% 6% 10%
EE 37% 26% 17% 28% 9% 17%
IE 61% 40% 28% 30% 13% 17%
EL 56% 31% 45% 39% 8% 7%
ES 55% 35% 21% 17% 10% 15%
FR 55% 27% 34% 37% 9% 9%
IT 46% 24% 39% 39% 19% 18%
CY 62% 28% 35% 39% 14% 5%
LV 46% 21% 21% 31% 8% 9%
LT 41% 25% 33% 32% 8% 18%
LU 41% 20% 24% 31% 5% 13%
HU 52% 28% 32% 38% 12% 9%
MT 38% 16% 13% 29% 11% 34%
NL 40% 39% 22% 19% 4% 7%
AT 57% 44% 30% 29% 12% 6%
PL 41% 20% 28% 30% 11% 23%
PT 42% 23% 26% 27% 11% 25%
RO 36% 11% 23% 23% 10% 32%
SI 47% 19% 38% 31% 11% 7%
SK 48% 34% 34% 28% 13% 10%
FI 47% 33% 29% 31% 10% 5%
SE 56% 24% 37% 27% 7% 5%
UK 50% 31% 18% 20% 9% 17%
QE8T And in your opinion, what would be the most effective sanction in case publicly listed companies do not comply with such legislation? And then?
Highest percentage per countryHighest percentage per item
Lowest percentage per countryLowest percentage per item
Base: Total sample

SPECIAL EUROBAROMETER 376 “Women in decision-making positions”
68
Socio-demographic analysis reveals influence of gender, age and education.
No gender differences were found with regard to mentioning a monetary fine as a
sanction. The youngest respondents aged 15-24 (56%) more often cited this option than
the oldest respondents aged 55+ (45%). Students (56%) are more likely to cite a
monetary fine than retired respondents (44%) and managers (46%).
No differences between men and women are found with respect to the sanction of no
public procurement grant. The oldest respondents aged 55+ (27%) are less likely to cite
this option than those aged 25-39 (33%). This is also true of the respondents who had
left school at the age of 15 or younger (27%) compared to the respondents who were
educated until the age of 20 or beyond (33%). Managers and other white collar workers
(both 34%) are more likely to cite this sanction than retired interviewees (27%).
Women are more inclined than men to mention annulment of the nomination of members
of the over-represented gender (30% vs. 26%). So are respondents who were educated
until the age of 20 or beyond (31%) compared to respondents who had left school at the
age of 15 or younger (22%). White collar workers (32%) are more likely to mention this
sanction than unemployed interviewees (24%).
Slightly more women than men mention annulment of the decisions taken by the board
(29% vs. 26%). Respondents who had left school at the age of 15 or younger (24%) are
somewhat less likely to mention this sanction than their more educated counterparts
(28%).
Markedly fewer women (15%) than men (23%) spontaneously say there should be no
sanctions. The youngest respondents aged 15-24 (16%) are less likely than the
interviewees in the other age groups to say so. By contrast, those respondents who were
educated until the age of 20 or beyond are more likely (23%) to say that sanctions are
not needed than their lesser educated counterparts (18%). Likewise, managers (27%)
are more likely than house persons (14%) to say there should be no sanctions.
No significant gender differences are found for dissolution of company as a sanction.
Managers are the least likely to cite this option (7%) compared to the unemployed and
students (both 13%).

SPECIAL EUROBAROMETER 376 “Women in decision-making positions”
69
Lastly, respondents who had left school at the age of 15 or younger (21%) are most
likely to be unable to form an opinion on this topic, compared to those educated beyond
age 20 (10%).
Base: Total sample
************

SPECIAL EUROBAROMETER 376 “Women in decision-making positions”
70
CONCLUSIONS
In the light of the EU Women’s Charter and the resulting EU Strategy for Equality
between Women and Men for the years 2010-2015, the purpose of this report was to
gain insight in Europeans’ opinion on equal representation of women and men on
positions of responsibility.
The majority of Europeans believe the under-representation of women in
positions of responsibility has more to do with women’s and men’s gender role
and position in society than with any shortcomings of women.
About three-quarters say the business community is dominated by men who don’t have
enough confidence in women, and about two-thirds acknowledge that family
responsibilities traditionally seen as women’s domain result in their limited freedom.
Conversely, the majority disagree with statements that refer to limited willingness of
women themselves to fight for their careers, or that refer to limited interest, qualities
and skills of women regarding positions of responsibility.
Compared to 2009, some optimism seems to be justified, as agreement decreased with
statements about women being less willing than men to fight to make a career, women
being less interested than men in positions of responsibility, or women not having the
necessary qualities and skills to fill positions of responsibility. Conversely, more
Europeans now say that the business community is male-dominated. In short, there is a
higher level of recognition of the barriers women are facing in the world of work in 2011
than it was in 2009.
Three-quarters (75%) of Europeans are in favour of legislation to ensure a
more balanced representation of men and women on company boards under the
condition that their qualifications are taken into account, that is without
automatically favouring one of either gender.
Opinion is divided when respondents have to choose between three ways to achieve
gender balance on company boards: binding legal measures; self-regulation by
companies setting their own targets; or voluntary measures such as signing non-binding
Corporate Governance Codes and Charters. However, if legislation ensures consideration
of candidates’ qualifications without automatically favouring one gender, three-quarters
of Europeans are in favour of it.

SPECIAL EUROBAROMETER 376 “Women in decision-making positions”
71
Europeans are divided regarding the administration level of measures to be
taken to improve gender balance on company boards. Over one-third (35%) thinks
measures should be taken at European level; an almost similar proportion (34%) thinks
it should be taken at national level; and one-quarter (24%) answers spontaneously that
it should be at both levels.
More than four out of ten Europeans (43%) consider a gender quota of 50%
women on company boards to be a realistic target; still, over one-quarter thinks
40% women is a realistic target and about one in eight interviewees say it should be
30% women.
Over one-third (37%) of Europeans think less than five years would be enough
time granted to companies to reach those targets, whereas over one-quarter think
between five and eight years would be appropriate, while others believe more than eight
years.
Almost half (49%) of Europeans consider a monetary fine to be an effective
sanction for a company in case of non-compliance with gender balance legislation.
Other sanctions, cited by about three in ten Europeans are the withholding of public
procurement grants; the annulment of the nomination of members of the over-
represented gender; and the annulment of the decisions taken by the board. Dissolution
of a company is cited by only one in ten respondents.
The great majority (88%) of Europeans share the view that women should be
equally represented in company leadership positions.
Of the respondents who share this opinion, about six in ten mention as a reason that
women and men are equally qualified for such positions; or that it is about equal rights
for women and men. Other reasons refer to role model functions and are cited by over
one-quarter: that woman in leadership positions may encourage other women to lead a
professional career; and that women on company boards would make a difference in the
way these companies are run. Fewer people, less than one in five, mention business
reasons: that it would lead to better overall economic performance or lead to better risk
management.
In conclusion, the view that women should be equally represented in company leadership
is widespread amongst Europeans.
**********

ANNEXES

TECHNICAL SPECIFICATIONS

SPECIAL EUROBAROMETER 376 “Women in decision-making positions”
SPECIAL EUROBAROMETER 376 “Women in decision-making positions”
TECHNICAL SPECIFICATIONS Between the 3rd and the 18th of September 2011, TNS Opinion & Social, a consortium created between TNS plc and TNS opinion, carried out the wave 76.1 of the EUROBAROMETER, on request of the EUROPEAN COMMISSION, Directorate-General for Communication, “Research and Speechwriting”. The SPECIAL EUROBAROMETER 376 is part of wave 76.1 and covers the population of the respective nationalities of the European Union Member States, resident in each of the Member States and aged 15 years and over. The basic sample design applied in all states is a multi-stage, random (probability) one. In each country, a number of sampling points was drawn with probability proportional to population size (for a total coverage of the country) and to population density.
In order to do so, the sampling points were drawn systematically from each of the "administrative regional units", after stratification by individual unit and type of area. They thus represent the whole territory of the countries surveyed according to the EUROSTAT NUTS II (or equivalent) and according to the distribution of the resident population of the respective nationalities in terms of metropolitan, urban and rural areas. In each of the selected sampling points, a starting address was drawn, at random. Further addresses (every Nth address) were selected by standard "random route" procedures, from the initial address. In each household, the respondent was drawn, at random (following the "closest birthday rule"). All interviews were conducted face-to-face in people's homes and in the appropriate national language. As far as the data capture is concerned, CAPI (Computer Assisted Personal Interview) was used in those countries where this technique was available.
1

SPECIAL EUROBAROMETER 376 “Women in decision-making positions”
For each country a comparison between the sample and the universe was carried out. The Universe description was derived from Eurostat population data or from national statistics offices. For all countries surveyed, a national weighting procedure, using marginal and intercellular weighting, was carried out based on this Universe description. In all countries, gender, age, region and size of locality were introduced in the iteration procedure. For international weighting (i.e. EU averages), TNS Opinion & Social applies the official population figures as provided by EUROSTAT or national statistic offices. The total population figures for input in this post-weighting procedure are listed above. Readers are reminded that survey results are estimations, the accuracy of which, everything being equal, rests upon the sample size and upon the observed percentage. With samples of about 1,000 interviews, the real percentages vary within the following confidence limits:
Observed percentages 10% or 90% 20% or 80% 30% or 70% 40% or 60% 50%
Confidence limits ± 1.9 points ± 2.5 points ± 2.7 points ± 3.0 points ± 3.1 points
ABBR. COUNTRIES INSTITUTES N° INTERVIEWS
FIELDWORK DATES
POPULATION 15+
BE Belgium TNS Dimarso 1028 03/09/2011 18/09/2011 8.939.546 BG Bulgaria TNS BBSS 1006 03/09/2011 12/09/2011 6.537.510 CZ Czech Rep. TNS Aisa 1069 03/09/2011 14/09/2011 9.012.443 DK Denmark TNS Gallup DK 1002 03/09/2011 18/09/2011 4.561.264 DE Germany TNS Infratest 1582 03/09/2011 18/09/2011 64.409.146 EE Estonia Emor 1000 03/09/2011 18/09/2011 945.733 IE Ireland Ipsos MRBI 1015 03/09/2011 16/09/2011 3.522.000 EL Greece TNS ICAP 1000 03/09/2011 16/09/2011 8.693.566 ES Spain TNS Demoscopia 1004 03/09/2011 18/09/2011 39.035.867 FR France TNS Sofres 1046 03/09/2011 18/09/2011 47.756.439 IT Italy TNS Infratest 1043 03/09/2011 17/09/2011 51.862.391 CY Rep. of Cyprus Synovate 506 03/09/2011 18/09/2011 660.400 LV Latvia TNS Latvia 1014 03/09/2011 18/09/2011 1.447.866 LT Lithuania TNS Gallup Lithuania 1031 03/09/2011 18/09/2011 2.829.740 LU Luxembourg TNS ILReS 502 03/09/2011 17/09/2011 404.907 HU Hungary TNS Hoffmann Kft 1015 03/09/2011 18/09/2011 8.320.614 MT Malta MISCO 500 03/09/2011 18/09/2011 335.476 NL Netherlands TNS NIPO 1002 03/09/2011 17/09/2011 13.371.980
AT Austria Österreichisches Gallup-Institut 1018
03/09/2011 18/09/2011 7.009.827
PL Poland TNS OBOP 1000 03/09/2011 18/09/2011 32.413.735 PT Portugal TNS EUROTESTE 1035 03/09/2011 18/09/2011 8.080.915 RO Romania TNS CSOP 1050 03/09/2011 12/09/2011 18.246.731 SI Slovenia RM PLUS 1024 03/09/2011 17/09/2011 1.759.701 SK Slovakia TNS Slovakia 1013 03/09/2011 18/09/2011 4.549.955 FI Finland TNS Gallup Oy 1003 03/09/2011 18/09/2011 4.440.004 SE Sweden TNS GALLUP 1020 03/09/2011 18/09/2011 7.791.240 UK United Kingdom TNS UK 1328 03/09/2011 18/09/2011 51.848.010
TOTAL EU27
26.856 03/09/2011 18/09/2011 408.787.006
2

QUESTIONNAIRE

SPECIAL EUROBAROMETER 376 “Women in decision-making positions”
QE1
1
2
3
4
5 Women do not always have the necessary qualities and skills to fill positions of responsibility
1 2 3
EB72.2 QC12
2 3
4 5
The business community is dominated by men who do not have sufficient confidence in women
1 2 3 4 5
4 5
Women are less willing than men to fight to make a career for themselves
1 2 3 4 5
Women have less freedom because of their family responsibilities
1
At the present time, in the European Union, women are less likely than men to hold positions of responsibility. Please tell me whether you agree or disagree with each of the following statements on this subject.
DK
Women are less interested than men in positions of responsibility
1 2 3 4 5
(SHOW CARD WITH SCALE – ONE ANSWER PER LINE)
(READ OUT – ROTATE) Totally agree
Tend to agree
Tend to disagree
Totally disagree
E. WOMEN IN DECISION-MAKING POSITIONS
1

SPECIAL EUROBAROMETER 376 “Women in decision-making positions”
QE2
12345
QE3
1,
2,
3,
4,5,
6,7,8,9,
Other (SPONTANEOUS)None (SPONTANEOUS)DK
NEW
You said that women should be equally represented in positions of leadership in companies. Why do you think so?
(SHOW CARD – READ OUT – ROTATE – MAX. 3 ANSWERS)
Because it would ensure a better overall economic performance of companiesBecause it would ensure a better risk management of companies
Because it would encourage other women to lead a professional career
Because women are as qualified for these positions as men are
Because it would make a difference in the way companies are runBecause it is about equal rights for women and men
Totally agreeTend to agreeTend to disagreeTotally disagreeDK
NEW
ASK QE3 IF "WOMEN SHOULD BE EQUALLY REPRESENTED IN POSITIONS OF LEADERSHIP IN COMPANIES", CODE 1 OR 2 IN QE2 – OTHERS GO TO QE4
Do you agree or disagree with the following statement: Given equal competence, women should be equally represented in positions of leadership in companies.
(READ OUT – ONE ANSWER ONLY)
2

SPECIAL EUROBAROMETER 376 “Women in decision-making positions”
QE4
123
45
QE5
12345
Strongly opposed DK
NEW
Binding legal measures There is no need to achieve a more balanced representation of men and women on company boards (SPONTANEOUS)
DK
NEW
(READ OUT – ONE ANSWER ONLY)
Strongly in favour Somewhat in favour Somewhat opposed
Some European countries (e.g. France, Spain, the Netherlands, Italy, Belgium and Norway) have already taken legal measures to ensure a more balanced representation of men and women on corporate boards. Are you in favour or opposed to a legislation on this matter under the condition that qualification is taken into account without automatically favouring one of either gender?
Women are underrepresented in positions of leadership and progress is slow. For example, they represent only on average 12% of board members of the largest publicly listed companies in the EU Member States.
What is, in your view, the best way to achieve a more balanced representation of men and women on company boards?
(SHOW CARD – READ OUT – ONE ANSWER ONLY)
Voluntary measures such as non-binding Corporate Governance Codes and ChartersSelf-regulation by companies setting their own targets
3

SPECIAL EUROBAROMETER 376 “Women in decision-making positions”
QE6
12345
QE7
123
45
More than 5 years but less than 8 years8 years or more
NEW
Companies should not be obliged to comply with quota legislation regarding their board members (SPONTANEOUS)
DK
50% women/ 50 % menNone, you are not in favour of quotas (SPONTANEOUS)DK
NEW
And in that case, how long do you think should publicly listed companies be granted to comply with legislation providing for a more balanced representation of men and women regarding their board members?
(READ OUT – ONE ANSWER ONLY)
Less than 5 years
In the case of legislation providing a more balanced representation of men and women on boards of publicly listed companies, what would in your view be a realistic target?
(SHOW CARD – READ OUT – ONE ANSWER ONLY)
30% women/ 70% men40% women/ 60% men
4

SPECIAL EUROBAROMETER 376 “Women in decision-making positions”
QE8a
12345678
QE8b
1,2,3,4,5,6,7,8,
QE9
1234
NEW
NEW
With regards to measures taken to improve gender balance on boards of publicly listed companies, do you think that decisions should be made by at national level or European level?
(READ OUT – ONE ANSWER ONLY)
At national levelAt European levelAt both (SPONTANEOUS)DK
Annulment of the nomination of members of the over-represented gender
Annulment of the decisions taken by the boardMonetary fineDissolution of companyNo public procurement grantsOther (SPONTANEOUS)
Monetary fineDissolution of companyNo public procurement grantsOther (SPONTANEOUS)
None (SPONTANEOUS)DK
NEW
And then?
(SHOW CARD – READ OUT – ROTATE – MULTIPLE ANSWERS POSSIBLE)
None (SPONTANEOUS)DK
And in your opinion, what would be the most effective sanction in case publicly listed companies do not comply with such legislation?
(SHOW CARD – READ OUT – ROTATE – ONE ANSWER ONLY)
Annulment of the nomination of members of the over-represented gender
Annulment of the decisions taken by the board
5

TABLES

SPECIAL EUROBAROMETER 376 “Women in decision-making positions”
% EB76.1
Diff.EB
72.2
EB76.1
Diff.EB
72.2
EB76.1
Diff.EB
72.2
EB76.1
Diff.EB
72.2
EB76.1
Diff.EB
72.2EU 27 6 1 22 -3 33 -4 36 7 3 -1
BE 6 2 21 -5 39 -3 34 7 0 -1
BG 5 -1 23 0 34 2 32 3 6 -4
CZ 8 2 36 -2 36 -2 18 3 2 -1
DK 10 3 39 -5 24 -4 25 6 2 0
D-W 9 0 26 -5 34 -1 28 5 3 1
DE 8 -1 25 -4 33 -4 31 8 3 1
D-E 6 -4 22 0 32 -11 38 16 2 -1
EE 8 0 30 -2 36 -2 22 3 4 1
IE 2 -2 13 -7 30 -5 51 17 4 -3
EL 6 0 23 3 39 -2 31 -2 1 1
ES 3 0 14 1 28 -6 53 6 2 -1
FR 2 0 13 -6 30 -4 52 11 3 -1
IT 8 2 25 0 33 -3 31 1 3 0
CY 8 -3 17 -7 24 -5 49 14 2 1
LV 5 -1 21 -2 42 -2 29 6 3 -1
LT 8 2 22 -9 40 -1 25 8 5 0
LU 4 -3 17 -2 35 -9 42 15 2 -1
HU 11 3 24 0 36 -1 27 -2 2 0
MT 5 0 16 -1 40 -6 34 5 5 2
NL 4 -1 22 -5 32 -3 39 9 3 0
AT 9 0 33 3 33 -4 22 0 3 1
PL 9 2 31 -1 37 -5 17 5 6 -1
PT 4 0 19 -8 36 -3 38 13 3 -2
RO 8 -2 25 -2 34 -2 27 7 6 -1
SI 4 1 24 6 37 0 33 -8 2 1
SK 10 2 37 1 34 -5 16 1 3 1
FI 3 -1 29 -5 38 -2 29 9 1 -1
SE 2 -2 14 -13 23 -3 61 19 0 -1
UK 3 0 15 -5 36 -7 42 12 4 0
Frauen interessieren sich weniger für Führungspositionen als Männer
QE1.1 Derzeit haben in der Europäischen Union weniger Frauen als Männer eine Führungsposition inne. Bitte sagen Sie mir, ob Sie den folgenden Aussagen zu diesem Thema zustimmen oder nicht zustimmen.
Women are less interested than men in positions of responsibility
QE1.1 At the present time, in the EU, women are less likely than men to hold positions of responsibility. Please tell me whether you agree or disagree with each of the following statements on this subject.
Les femmes sont moins intéressées par les postes à responsabilité que les hommes
QE1.1 Actuellement, dans l’UE, les femmes occupent moins souvent que les hommes des postes à responsabilité. Pouvez-vous me dire si vous êtes d'accord ou pas d'accord avec chacune des propositions suivantes à ce propos.
Tout à fait d’accord
Plutôt pas d’accord NSP
Tend to disagree
Stimme eher nicht zu
Pas du tout d’accord
Totally disagree
Stimme überhaupt nicht
zu
Totally agree
Stimme voll und ganz zu
Plutôt d’accord
Tend to agree
Stimme eher zu
DK
WN
1

SPECIAL EUROBAROMETER 376 “Women in decision-making positions”
% EB76.1
Diff.EB
72.2
EB76.1
Diff.EB
72.2EU 27 28 -2 69 3
BE 27 -3 73 4
BG 28 -1 66 5
CZ 44 0 54 1
DK 49 -2 49 2
D-W 35 -5 62 4
DE 33 -5 64 4
D-E 28 -4 70 5
EE 38 -2 58 1
IE 15 -9 81 12
EL 29 3 70 -4
ES 17 1 81 0
FR 15 -6 82 7
IT 33 2 64 -2
CY 25 -10 73 9
LV 26 -3 71 4
LT 30 -7 65 7
LU 21 -5 77 6
HU 35 3 63 -3
MT 21 -1 74 -1
NL 26 -6 71 6
AT 42 3 55 -4
PL 40 1 54 0
PT 23 -8 74 10
RO 33 -4 61 5
SI 28 7 70 -8
SK 47 3 50 -4
FI 32 -6 67 7
SE 16 -15 84 16
UK 18 -5 78 5
Les femmes sont moins intéressées par les postes à responsabilité que les hommes
QE1.1 Actuellement, dans l’UE, les femmes occupent moins souvent que les hommes des postes à responsabilité. Pouvez-vous me dire si vous êtes d'accord ou pas d'accord avec chacune des propositions suivantes à ce propos.
Total 'Disagree'
Gesamt 'Stimme zu'
Gesamt 'Stimme nicht
zu'
Total 'Agree'
Total 'D'accord' Total 'Pas d'accord'
Frauen interessieren sich weniger für Führungspositionen als Männer
QE1.1 Derzeit haben in der Europäischen Union weniger Frauen als Männer eine Führungsposition inne. Bitte sagen Sie mir, ob Sie den folgenden Aussagen zu diesem Thema zustimmen oder nicht zustimmen.
Women are less interested than men in positions of responsibility
QE1.1 At the present time, in the EU, women are less likely than men to hold positions of responsibility. Please tell me whether you agree or disagree with each of the following statements on this subject.
2

SPECIAL EUROBAROMETER 376 “Women in decision-making positions”
% EB76.1
Diff.EB
72.2
EB76.1
Diff.EB
72.2
EB76.1
Diff.EB
72.2
EB76.1
Diff.EB
72.2
EB76.1
Diff.EB
72.2EU 27 6 0 23 -4 32 -3 36 7 3 0
BE 6 1 23 -5 38 -4 33 9 0 -1
BG 3 -2 22 3 36 1 35 1 4 -3
CZ 9 1 34 -4 35 -3 20 5 2 1
DK 9 2 32 -8 28 -2 29 9 2 -1
D-W 10 0 26 -5 28 -4 33 9 3 0
DE 9 0 24 -6 31 -2 34 9 2 -1
D-E 4 -4 18 -11 38 1 39 14 1 0
EE 10 1 28 -2 37 -1 22 2 3 0
IE 2 -4 16 -4 29 -8 49 18 4 -2
EL 7 2 24 3 38 -3 30 -3 1 1
ES 3 1 12 -2 27 -7 55 8 3 0
FR 2 -1 15 -4 29 -4 52 11 2 -2
IT 8 1 29 2 33 -1 28 -1 2 -1
CY 7 -3 13 -11 27 -5 51 18 2 1
LV 5 -2 20 -3 41 1 31 5 3 -1
LT 9 -1 27 -8 35 -1 25 11 4 -1
LU 5 0 20 0 35 -11 39 12 1 -1
HU 13 1 33 3 31 -2 21 -2 2 0
MT 3 -2 16 -3 42 -2 35 7 4 0
NL 4 -3 30 -2 33 1 31 4 2 0
AT 7 -4 35 2 33 1 22 0 3 1
PL 10 0 36 1 32 -6 16 4 6 1
PT 4 0 19 -11 36 0 39 14 2 -3
RO 5 -2 19 -4 35 -1 35 9 6 -2
SI 5 3 23 6 33 -4 37 -6 2 1
SK 12 3 38 -1 32 -4 16 1 2 1
FI 4 -4 34 -8 36 1 25 12 1 -1
SE 4 -3 31 -10 20 -4 45 18 0 -1
UK 3 -1 19 -8 36 -4 39 14 3 -1
Frauen sind weniger als Männer bereit, für ihre eigene Karriere zu kämpfen
QE1.2 Derzeit haben in der Europäischen Union weniger Frauen als Männer eine Führungsposition inne. Bitte sagen Sie mir, ob Sie den folgenden Aussagen zu diesem Thema zustimmen oder nicht zustimmen.
Women are less willing than men to fight to make a career for themselves
QE1.2 At the present time, in the EU, women are less likely than men to hold positions of responsibility. Please tell me whether you agree or disagree with each of the following statements on this subject.
Les femmes sont moins prêtes que les hommes à se battre pour faire carrière
QE1.2 Actuellement, dans l’UE, les femmes occupent moins souvent que les hommes des postes à responsabilité. Pouvez-vous me dire si vous êtes d'accord ou pas d'accord avec chacune des propositions suivantes à ce propos.
Tout à fait d’accord
Plutôt pas d’accord NSP
Tend to disagree
Stimme eher nicht zu
Pas du tout d’accord
Totally disagree
Stimme überhaupt nicht
zu
Totally agree
Stimme voll und ganz zu
Plutôt d’accord
Tend to agree
Stimme eher zu
DK
WN
3

SPECIAL EUROBAROMETER 376 “Women in decision-making positions”
% EB76.1
Diff.EB
72.2
EB76.1
Diff.EB
72.2EU 27 29 -4 68 4
BE 29 -4 71 5
BG 25 1 71 2
CZ 43 -3 55 2
DK 41 -6 57 7
D-W 36 -5 61 5
DE 33 -6 65 7
D-E 22 -15 77 15
EE 38 -1 59 1
IE 18 -8 78 10
EL 31 5 68 -6
ES 15 -1 82 1
FR 17 -5 81 7
IT 37 3 61 -2
CY 20 -14 78 13
LV 25 -5 72 6
LT 36 -9 60 10
LU 25 0 74 1
HU 46 4 52 -4
MT 19 -5 77 5
NL 34 -5 64 5
AT 42 -2 55 1
PL 46 1 48 -2
PT 23 -11 75 14
RO 24 -6 70 8
SI 28 9 70 -10
SK 50 2 48 -3
FI 38 -12 61 13
SE 35 -13 65 14
UK 22 -9 75 10
Les femmes sont moins prêtes que les hommes à se battre pour faire carrière
QE1.2 Actuellement, dans l’UE, les femmes occupent moins souvent que les hommes des postes à responsabilité. Pouvez-vous me dire si vous êtes d'accord ou pas d'accord avec chacune des propositions suivantes à ce propos.
Total 'Disagree'
Gesamt 'Stimme zu'
Gesamt 'Stimme nicht
zu'
Total 'Agree'
Total 'D'accord' Total 'Pas d'accord'
Frauen sind weniger als Männer bereit, für ihre eigene Karriere zu kämpfen
QE1.2 Derzeit haben in der Europäischen Union weniger Frauen als Männer eine Führungsposition inne. Bitte sagen Sie mir, ob Sie den folgenden Aussagen zu diesem Thema zustimmen oder nicht zustimmen.
Women are less willing than men to fight to make a career for themselves
QE1.2 At the present time, in the EU, women are less likely than men to hold positions of responsibility. Please tell me whether you agree or disagree with each of the following statements on this subject.
4

SPECIAL EUROBAROMETER 376 “Women in decision-making positions”
% EB76.1
Diff.EB
72.2
EB76.1
Diff.EB
72.2
EB76.1
Diff.EB
72.2
EB76.1
Diff.EB
72.2
EB76.1
Diff.EB
72.2EU 27 24 -2 44 -6 19 3 11 5 2 0
BE 21 1 44 -10 24 4 11 6 0 -1
BG 22 -10 51 3 17 7 7 2 3 -2
CZ 27 -1 49 -5 17 2 6 3 1 1
DK 22 1 46 -4 17 -3 14 6 1 0
D-W 31 2 39 -7 19 2 10 3 1 0
DE 29 1 38 -9 21 3 11 5 1 0
D-E 22 -3 36 -15 26 5 16 14 0 -1
EE 30 -8 44 0 18 5 7 3 1 0
IE 24 -7 49 0 14 3 11 5 2 -1
EL 30 -9 49 3 14 5 7 1 0 0
ES 28 6 43 -8 15 -1 13 4 1 -1
FR 13 -7 38 -11 23 4 25 15 1 -1
IT 23 -6 50 1 18 4 7 1 2 0
CY 33 -14 32 -4 16 4 19 14 0 0
LV 27 -9 44 0 20 6 8 4 1 -1
LT 23 -3 37 -10 25 6 12 6 3 1
LU 25 -5 37 -8 22 6 16 10 0 -3
HU 43 -9 40 3 13 4 4 2 0 0
MT 25 -4 47 -6 18 7 8 2 2 1
NL 17 -3 45 -5 24 6 13 3 1 -1
AT 25 -2 49 -1 16 0 10 4 0 -1
PL 27 -2 51 -2 14 0 4 3 4 1
PT 12 -1 47 -11 26 5 13 8 2 -1
RO 22 -5 48 5 17 0 9 3 4 -3
SI 30 -8 45 -1 17 6 7 3 1 0
SK 36 5 49 -6 12 0 3 1 0 0
FI 19 0 53 -4 21 3 6 1 1 0
SE 22 -5 45 -3 18 4 15 5 0 -1
UK 22 -3 43 -10 21 6 12 7 2 0
Frauen haben aufgrund ihrer Verantwortung in der Familie weniger Freiheiten
QE1.3 Derzeit haben in der Europäischen Union weniger Frauen als Männer eine Führungsposition inne. Bitte sagen Sie mir, ob Sie den folgenden Aussagen zu diesem Thema zustimmen oder nicht zustimmen.
Women have less freedom because of their family responsibilities
QE1.3 At the present time, in the EU, women are less likely than men to hold positions of responsibility. Please tell me whether you agree or disagree with each of the following statements on this subject.
Les femmes sont moins disponibles en raison de leurs charges familiales
QE1.3 Actuellement, dans l’UE, les femmes occupent moins souvent que les hommes des postes à responsabilité. Pouvez-vous me dire si vous êtes d'accord ou pas d'accord avec chacune des propositions suivantes à ce propos.
Tout à fait d’accord
Plutôt pas d’accord NSP
Tend to disagree
Stimme eher nicht zu
Pas du tout d’accord
Totally disagree
Stimme überhaupt nicht
zu
Totally agree
Stimme voll und ganz zu
Plutôt d’accord
Tend to agree
Stimme eher zu
DK
WN
5

SPECIAL EUROBAROMETER 376 “Women in decision-making positions”
% EB76.1
Diff.EB
72.2
EB76.1
Diff.EB
72.2EU 27 68 -8 30 8
BE 65 -9 35 10
BG 73 -7 24 9
CZ 76 -6 23 5
DK 68 -3 31 3
D-W 70 -5 29 5
DE 67 -8 32 8
D-E 58 -18 42 19
EE 74 -8 25 8
IE 73 -7 25 8
EL 79 -6 21 6
ES 71 -2 28 3
FR 51 -18 48 19
IT 73 -5 25 5
CY 65 -18 35 18
LV 71 -9 28 10
LT 60 -13 37 12
LU 62 -13 38 16
HU 83 -6 17 6
MT 72 -10 26 9
NL 62 -8 37 9
AT 74 -3 26 4
PL 78 -4 18 3
PT 59 -12 39 13
RO 70 0 26 3
SI 75 -9 24 9
SK 85 -1 15 1
FI 72 -4 27 4
SE 67 -8 33 9
UK 65 -13 33 13
Les femmes sont moins disponibles en raison de leurs charges familiales
QE1.3 Actuellement, dans l’UE, les femmes occupent moins souvent que les hommes des postes à responsabilité. Pouvez-vous me dire si vous êtes d'accord ou pas d'accord avec chacune des propositions suivantes à ce propos.
Total 'Disagree'
Gesamt 'Stimme zu'
Gesamt 'Stimme nicht
zu'
Total 'Agree'
Total 'D'accord' Total 'Pas d'accord'
Frauen haben aufgrund ihrer Verantwortung in der Familie weniger Freiheiten
QE1.3 Derzeit haben in der Europäischen Union weniger Frauen als Männer eine Führungsposition inne. Bitte sagen Sie mir, ob Sie den folgenden Aussagen zu diesem Thema zustimmen oder nicht zustimmen.
Women have less freedom because of their family responsibilities
QE1.3 At the present time, in the EU, women are less likely than men to hold positions of responsibility. Please tell me whether you agree or disagree with each of the following statements on this subject.
6

SPECIAL EUROBAROMETER 376 “Women in decision-making positions”
% EB76.1
Diff.EB
72.2
EB76.1
Diff.EB
72.2
EB76.1
Diff.EB
72.2
EB76.1
Diff.EB
72.2
EB76.1
Diff.EB
72.2EU 27 32 5 44 -3 15 -2 5 1 4 -1
BE 31 5 43 -5 21 0 4 0 1 0
BG 24 4 47 1 11 -2 7 2 11 -5
CZ 23 6 50 0 21 -3 4 -2 2 -1
DK 21 -1 39 -6 25 3 12 3 3 1
D-W 33 6 40 -4 17 -3 7 1 3 0
DE 35 5 39 -5 17 -1 7 2 2 -1
D-E 39 0 36 -7 17 5 6 2 2 0
EE 29 2 43 -1 18 0 5 0 5 -1
IE 25 2 47 1 16 0 6 0 6 -3
EL 28 5 52 2 16 -3 2 -5 2 1
ES 42 11 34 -11 12 -4 7 3 5 1
FR 41 8 42 -9 10 0 5 2 2 -1
IT 32 7 48 -1 14 -4 3 -2 3 0
CY 46 7 37 -2 11 -3 4 0 2 -2
LV 19 0 42 1 27 3 8 1 4 -5
LT 29 7 43 -6 16 -1 6 2 6 -2
LU 33 6 35 -4 22 1 6 -1 4 -2
HU 41 3 44 0 10 -3 3 0 2 0
MT 16 -2 39 -3 25 3 13 6 7 -4
NL 20 -6 47 7 21 -3 9 3 3 -1
AT 35 8 43 -7 15 -2 6 1 1 0
PL 27 7 51 0 14 -4 2 0 6 -3
PT 26 14 50 -11 16 1 4 0 4 -4
RO 27 1 45 3 16 -1 5 0 7 -3
SI 37 3 42 0 14 -2 4 -1 3 0
SK 30 11 48 -8 15 -4 3 0 4 1
FI 20 2 46 -6 26 5 6 1 2 -2
SE 33 -1 48 2 12 -1 5 1 2 -1
UK 26 3 46 -1 16 -3 7 3 5 -2
Die Geschäftswelt wird von Männern dominiert, die zu Frauen nicht ausreichend Vertrauen haben
QE1.4 Derzeit haben in der Europäischen Union weniger Frauen als Männer eine Führungsposition inne. Bitte sagen Sie mir, ob Sie den folgenden Aussagen zu diesem Thema zustimmen oder nicht zustimmen.
The business community is dominated by men who do not have sufficient confidence in women
QE1.4 At the present time, in the EU, women are less likely than men to hold positions of responsibility. Please tell me whether you agree or disagree with each of the following statements on this subject.
Le milieu professionnel est dominé par des hommes qui ne font pas suffisamment confiance aux femmes
QE1.4 Actuellement, dans l’UE, les femmes occupent moins souvent que les hommes des postes à responsabilité. Pouvez-vous me dire si vous êtes d'accord ou pas d'accord avec chacune des propositions suivantes à ce propos.
Tout à fait d’accord
Plutôt pas d’accord NSP
Tend to disagree
Stimme eher nicht zu
Pas du tout d’accord
Totally disagree
Stimme überhaupt nicht
zu
Totally agree
Stimme voll und ganz zu
Plutôt d’accord
Tend to agree
Stimme eher zu
DK
WN
7

SPECIAL EUROBAROMETER 376 “Women in decision-making positions”
% EB76.1
Diff.EB
72.2
EB76.1
Diff.EB
72.2EU 27 76 2 20 -1
BE 74 0 25 0
BG 71 5 18 0
CZ 73 6 25 -5
DK 60 -7 37 6
D-W 73 2 24 -2
DE 74 0 24 1
D-E 75 -7 23 7
EE 72 1 23 0
IE 72 3 22 0
EL 80 7 18 -8
ES 76 0 19 -1
FR 83 -1 15 2
IT 80 6 17 -6
CY 83 5 15 -3
LV 61 1 35 4
LT 72 1 22 1
LU 68 2 28 0
HU 85 3 13 -3
MT 55 -5 38 9
NL 67 1 30 0
AT 78 1 21 -1
PL 78 7 16 -4
PT 76 3 20 1
RO 72 4 21 -1
SI 79 3 18 -3
SK 78 3 18 -4
FI 66 -4 32 6
SE 81 1 17 0
UK 72 2 23 0
Le milieu professionnel est dominé par des hommes qui ne font pas suffisamment confiance aux femmes
QE1.4 Actuellement, dans l’UE, les femmes occupent moins souvent que les hommes des postes à responsabilité. Pouvez-vous me dire si vous êtes d'accord ou pas d'accord avec chacune des propositions suivantes à ce propos.
Total 'Disagree'
Gesamt 'Stimme zu'
Gesamt 'Stimme nicht
zu'
Total 'Agree'
Total 'D'accord' Total 'Pas d'accord'
Die Geschäftswelt wird von Männern dominiert, die zu Frauen nicht ausreichend Vertrauen haben
QE1.4 Derzeit haben in der Europäischen Union weniger Frauen als Männer eine Führungsposition inne. Bitte sagen Sie mir, ob Sie den folgenden Aussagen zu diesem Thema zustimmen oder nicht zustimmen.
The business community is dominated by men who do not have sufficient confidence in women
QE1.4 At the present time, in the EU, women are less likely than men to hold positions of responsibility. Please tell me whether you agree or disagree with each of the following statements on this subject.
8

SPECIAL EUROBAROMETER 376 “Women in decision-making positions”
% EB76.1
Diff.EB
72.2
EB76.1
Diff.EB
72.2
EB76.1
Diff.EB
72.2
EB76.1
Diff.EB
72.2
EB76.1
Diff.EB
72.2EU 27 5 -1 16 -4 29 -4 47 9 3 0
BE 5 0 13 -3 32 -3 50 6 0 0
BG 3 -3 17 -2 34 4 39 5 7 -4
CZ 6 1 23 -4 39 0 31 3 1 0
DK 4 1 13 -4 26 -7 56 11 1 -1
D-W 6 0 14 -8 26 -6 51 13 3 1
DE 6 -1 14 -6 26 -7 52 14 2 0
D-E 5 -3 13 -2 26 -10 55 15 1 0
EE 6 -4 20 -2 37 -2 34 6 3 2
IE 1 -3 12 -9 29 -3 52 17 6 -2
EL 5 -1 14 -1 40 3 40 -1 1 0
ES 6 2 12 -2 23 -10 57 11 2 -1
FR 2 0 7 -4 24 -6 66 11 1 -1
IT 8 0 23 -1 31 -1 35 1 3 1
CY 5 -1 12 2 27 -15 55 15 1 -1
LV 7 -2 18 -5 41 2 32 8 2 -3
LT 8 0 24 -8 36 0 28 9 4 -1
LU 3 0 4 -7 30 -5 62 14 1 -2
HU 10 2 24 1 33 -1 31 -3 2 1
MT 1 -3 12 0 41 2 42 0 4 1
NL 3 -2 8 -6 25 -8 62 16 2 0
AT 9 1 27 0 34 -1 29 0 1 0
PL 9 3 27 -4 37 -3 22 3 5 1
PT 5 1 17 -10 35 -1 41 13 2 -3
RO 7 -2 21 -1 34 0 32 5 6 -2
SI 5 2 11 0 30 -1 53 0 1 -1
SK 11 2 36 -2 34 0 18 0 1 0
FI 2 0 13 1 33 -9 51 8 1 0
SE 1 -1 5 -4 11 -6 83 13 0 -2
UK 4 -1 12 -8 30 -5 51 15 3 -1
Frauen haben nicht immer die notwendigen Fähigkeiten und Qualifikationen, um Führungspositionen auszufüllen
QE1.5 Derzeit haben in der Europäischen Union weniger Frauen als Männer eine Führungsposition inne. Bitte sagen Sie mir, ob Sie den folgenden Aussagen zu diesem Thema zustimmen oder nicht zustimmen.
Women do not always have the necessary qualities and skills to fill positions of responsibility
QE1.5 At the present time, in the EU, women are less likely than men to hold positions of responsibility. Please tell me whether you agree or disagree with each of the following statements on this subject.
Les femmes n'ont pas toujours les qualités et compétences requises pour occuper des postes à responsabilité
QE1.5 Actuellement, dans l’UE, les femmes occupent moins souvent que les hommes des postes à responsabilité. Pouvez-vous me dire si vous êtes d'accord ou pas d'accord avec chacune des propositions suivantes à ce propos.
Tout à fait d’accord
Plutôt pas d’accord NSP
Tend to disagree
Stimme eher nicht zu
Pas du tout d’accord
Totally disagree
Stimme überhaupt nicht
zu
Totally agree
Stimme voll und ganz zu
Plutôt d’accord
Tend to agree
Stimme eher zu
DK
WN
9
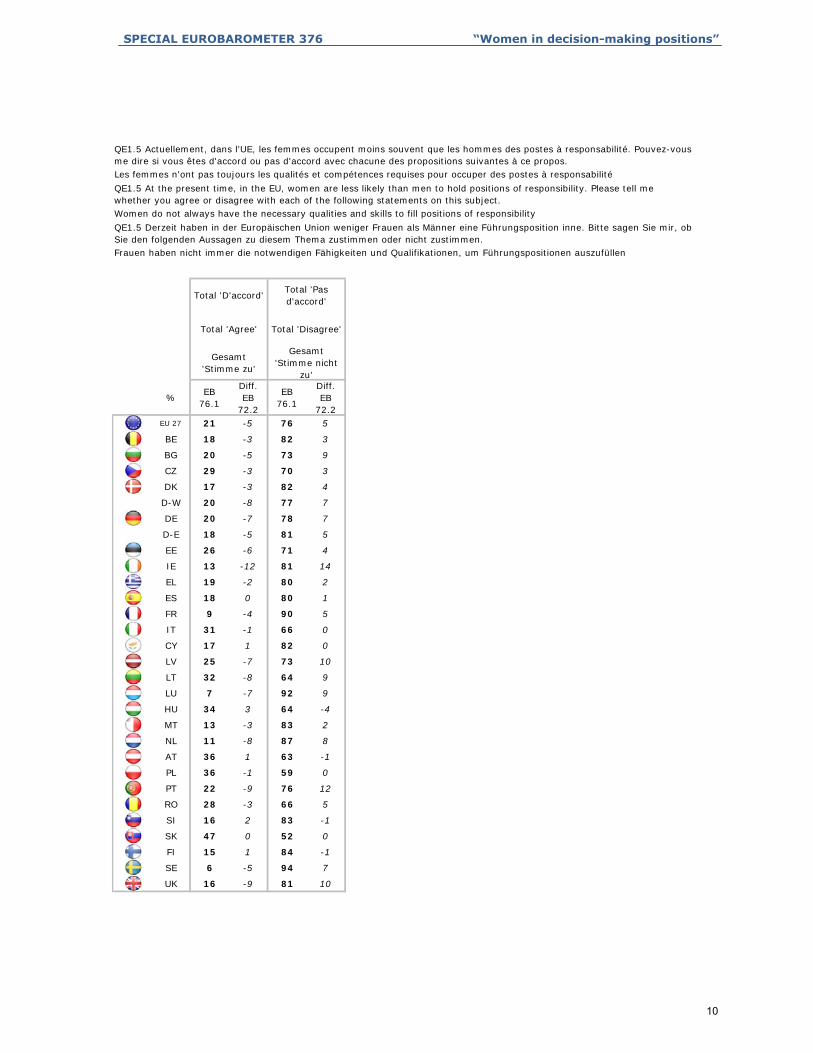
SPECIAL EUROBAROMETER 376 “Women in decision-making positions”
% EB76.1
Diff.EB
72.2
EB76.1
Diff.EB
72.2EU 27 21 -5 76 5
BE 18 -3 82 3
BG 20 -5 73 9
CZ 29 -3 70 3
DK 17 -3 82 4
D-W 20 -8 77 7
DE 20 -7 78 7
D-E 18 -5 81 5
EE 26 -6 71 4
IE 13 -12 81 14
EL 19 -2 80 2
ES 18 0 80 1
FR 9 -4 90 5
IT 31 -1 66 0
CY 17 1 82 0
LV 25 -7 73 10
LT 32 -8 64 9
LU 7 -7 92 9
HU 34 3 64 -4
MT 13 -3 83 2
NL 11 -8 87 8
AT 36 1 63 -1
PL 36 -1 59 0
PT 22 -9 76 12
RO 28 -3 66 5
SI 16 2 83 -1
SK 47 0 52 0
FI 15 1 84 -1
SE 6 -5 94 7
UK 16 -9 81 10
Les femmes n'ont pas toujours les qualités et compétences requises pour occuper des postes à responsabilité
QE1.5 Actuellement, dans l’UE, les femmes occupent moins souvent que les hommes des postes à responsabilité. Pouvez-vous me dire si vous êtes d'accord ou pas d'accord avec chacune des propositions suivantes à ce propos.
Total 'Disagree'
Gesamt 'Stimme zu'
Gesamt 'Stimme nicht
zu'
Total 'Agree'
Total 'D'accord' Total 'Pas d'accord'
Frauen haben nicht immer die notwendigen Fähigkeiten und Qualifikationen, um Führungspositionen auszufüllen
QE1.5 Derzeit haben in der Europäischen Union weniger Frauen als Männer eine Führungsposition inne. Bitte sagen Sie mir, ob Sie den folgenden Aussagen zu diesem Thema zustimmen oder nicht zustimmen.
Women do not always have the necessary qualities and skills to fill positions of responsibility
QE1.5 At the present time, in the EU, women are less likely than men to hold positions of responsibility. Please tell me whether you agree or disagree with each of the following statements on this subject.
10
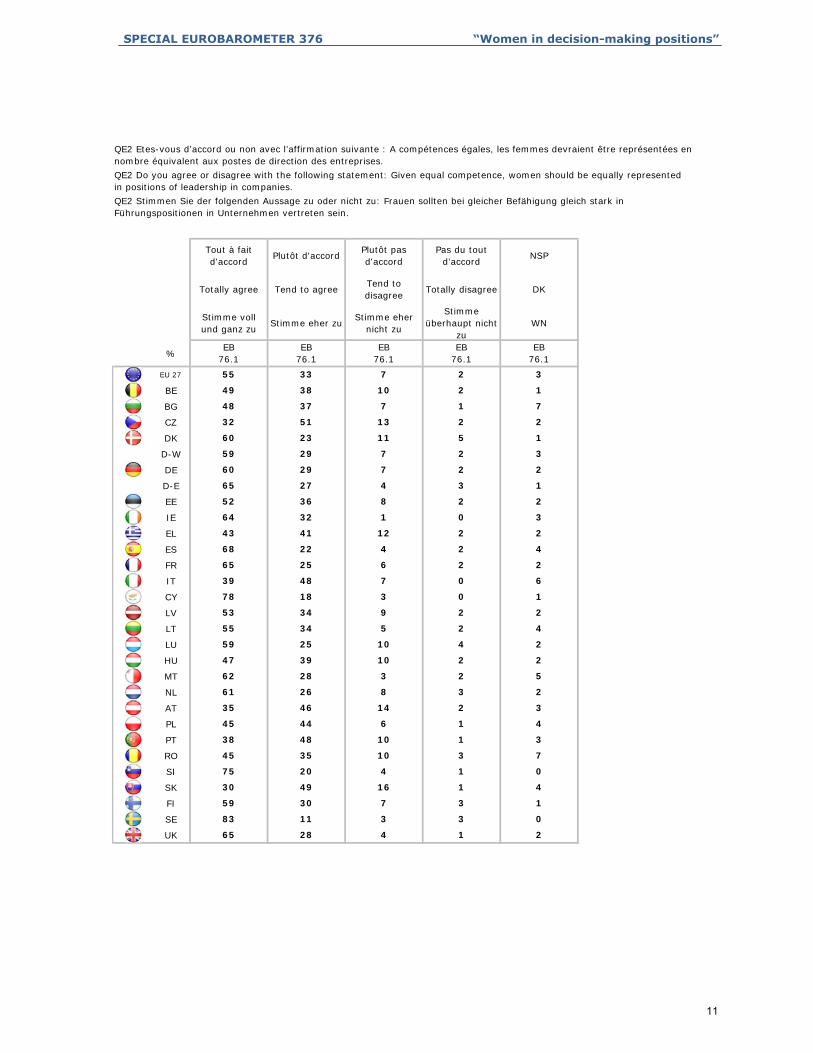
SPECIAL EUROBAROMETER 376 “Women in decision-making positions”
%
EU 27
BE
BG
CZ
DK
D-W
DE
D-E
EE
IE
EL
ES
FR
IT
CY
LV
LT
LU
HU
MT
NL
AT
PL
PT
RO
SI
SK
FI
SE
UK
QE2 Stimmen Sie der folgenden Aussage zu oder nicht zu: Frauen sollten bei gleicher Befähigung gleich stark in Führungspositionen in Unternehmen vertreten sein.
QE2 Do you agree or disagree with the following statement: Given equal competence, women should be equally represented in positions of leadership in companies.
QE2 Etes-vous d’accord ou non avec l’affirmation suivante : A compétences égales, les femmes devraient être représentées en nombre équivalent aux postes de direction des entreprises.
Plutôt d'accord
Tend to agree
Stimme eher zu
EB76.1
Tout à fait d'accord
Totally agree
Stimme voll und ganz zu
EB76.1
Pas du tout d’accord
Totally disagree
Stimme überhaupt nicht
zuEB
76.1
Plutôt pas d'accord
Tend to disagree
Stimme eher nicht zu
EB76.1
NSP
DK
WN
EB76.1
55 33 7 2 3
49 38 10 2 1
32 51 13 2 2
48 37
60 23 11 5
77 1
1
59 29 7 2 3
65 27 4 3 1
60 29
52 36 8 2
27 2
2
64 32 1 0 3
68 22 4 2 4
43 41
65 25 6 2
212 2
2
39 48 7 0 6
53 34 9 2 2
78 18
55 34 5 2
13 0
4
59 25 10 4 2
62 28 3 2 5
47 39
61 26 8 3
210 2
2
35 46 14 2 3
38 48 10 1 3
45 44
45 35 10 3
46 1
7
75 20 4 1 0
59 30 7 3 1
30 49
83 11 3 3
416 1
0
65 28 4 1 2
11

SPECIAL EUROBAROMETER 376 “Women in decision-making positions”
%
EU 27
BE
BG
CZ
DK
D-W
DE
D-E
EE
IE
EL
ES
FR
IT
CY
LV
LT
LU
HU
MT
NL
AT
PL
PT
RO
SI
SK
FI
SE
UK
QE2 Stimmen Sie der folgenden Aussage zu oder nicht zu: Frauen sollten bei gleicher Befähigung gleich stark in Führungspositionen in Unternehmen vertreten sein.
QE2 Do you agree or disagree with the following statement: Given equal competence, women should be equally represented in positions of leadership in companies.
QE2 Etes-vous d’accord ou non avec l’affirmation suivante : A compétences égales, les femmes devraient être représentées en nombre équivalent aux postes de direction des entreprises.
6
93 5
94
17
89 10
79
13
95 5
80
7
86 11
89
11
81 16
87
12
90 5
86
7
84 14
89
3
87 11
96
8
87 7
90
14
90 6
84
10
96 1
88
9
92 7
89
16
88 9
83
8
83 15
85
9
87 12
88
Gesamt 'Stimme nicht
zu'EB
76.1EB
76.1
Gesamt 'Stimme zu'
Total 'Pas d'accord'
Total 'Agree' Total 'Disagree'
Total 'D'accord'
12

SPECIAL EUROBAROMETER 376 “Women in decision-making positions”
%
EU 27
BE
BG
CZ
DK
D-W
DE
D-E
EE
IE
EL
ES
FR
IT
CY
LV
LT
LU
HU
MT
NL
AT
PL
PT
RO
SI
SK
FI
SE
UK
Parce que cela permettrait aux
entreprises d’obtenir de meilleurs résultats
économiques
Because it would ensure a better overall economic performance
of companies
Weil dadurch eine bessere wirtschaftliche
Gesamtleistung von Unternehmen
sichergestellt wäre
EB76.1
QE3 Vous avez affirmé que les femmes devraient être représentées en nombre équivalent aux postes de direction des entreprises. Pourquoi selon vous ? (ROTATION – MAX. 3 REPONSES)QE3 You said that women should be equally represented in positions of leadership in companies. Why do you think so? (ROTATE – MAX. 3 ANSWERS)QE3 Sie haben gesagt, dass Frauen in Führungspositionen in Unternehmen gleich stark vertreten sein sollten. Warum sind Sie dieser Meinung? (ROTIEREN - MAX. 3 ANTWORTEN)
Parce que cela encouragerait
d’autres femmes à mener une carrière
professionnelle
Because it would encourage other women to lead a
professional career
Weil es andere Frauen ermutigen
würde, eine berufliche Karriere
zu verfolgen
EB76.1
Parce que cela permettrait de mieux gérer les
risques au sein des entreprises
Because it would ensure a better risk
management of companies
Weil dadurch ein besseres
Risikomanagement von Unternehmen sichergestellt wäre
EB76.1
Parce que cela changerait la façon dont les entreprises
sont gérées
Because it would make a difference in the way companies
are run
Weil es die Art und Weise, wie
Unternehmen geführt werden, verändern würde
EB76.1
Parce que les femmes sont aussi qualifiées que les hommes pour ce genre de postes
Because women are as qualified for
these positions as men are
Weil Frauen für diese Positionen
genauso gut geeignet sind wie
Männer
EB76.1
2717 15 28 62
15 11 31 68 34
1926 14 29 57
19 17 30 54 18
5516 15 23 82
14 11 27 67 38
3814 12 28 68
14 14 34 74 40
3717 20 36 43
37 22 35 52 32
2627 18 32 58
13 8 21 57 19
3312 15 30 75
25 21 26 49 17
1929 16 45 71
15 9 22 62 16
1017 16 28 58
12 13 35 75 32
2919 14 32 61
12 10 33 68 16
5517 20 24 69
20 18 42 62 37
1016 16 23 48
19 16 23 52 18
1525 21 37 55
26 14 21 58 28
2817 17 31 59
12 16 36 69 40
5314 14 28 84
15 12 29 65 26
13

SPECIAL EUROBAROMETER 376 “Women in decision-making positions”
%
EU 27
BE
BG
CZ
DK
D-W
DE
D-E
EE
IE
EL
ES
FR
IT
CY
LV
LT
LU
HU
MT
NL
AT
PL
PT
RO
SI
SK
FI
SE
UK 0 1
QE3 Sie haben gesagt, dass Frauen in Führungspositionen in Unternehmen gleich stark vertreten sein sollten. Warum sind Sie dieser Meinung? (ROTIEREN - MAX. 3 ANTWORTEN)
QE3 You said that women should be equally represented in positions of leadership in companies. Why do you think so? (ROTATE – MAX. 3 ANSWERS)
QE3 Vous avez affirmé que les femmes devraient être représentées en nombre équivalent aux postes de direction des entreprises. Pourquoi selon vous ? (ROTATION – MAX. 3 REPONSES)
2 0 0
64 1
53
1
66 1 1 0
1 1
60 1 0
1 0 2
61 2
46
5
51 0 0 1
1 0
42 0 1
1 0 0
62 2
50
1
55 1 0 3
0 0
50 1 1
1 2 2
62 1
48
0
49 0 0 1
1 1
64 1 0
0 0 1
46 1
77
0
59 1 0 0
0 2
55 1 0
1 1 1
46 1
52
1
69 0 0 0
1 1
63 0 1
0 0 0
61 0
42
3
57 0 1 1
1 0
55 0 0
1 0 1
66 1
58
WN
EB76.1
EB76.1
EB76.1
EB76.1
None (SPONTANEOUS) DK
Weil es um gleiche Rechte für Frauen und Männer geht
Sonstige (SPONTAN)
Nichts davon (SPONTAN)
Autre (SPONTANE)
Aucun (SPONTANE) NSP
Because it is about equal rights for
women and men
Other (SPONTANEOUS)
Parce que les hommes et les femmes doivent bénéficier des mêmes droits
14

SPECIAL EUROBAROMETER 376 “Women in decision-making positions”
%
EU 27
BE
BG
CZ
DK
D-W
DE
D-E
EE
IE
EL
ES
FR
IT
CY
LV
LT
LU
HU
MT
NL
AT
PL
PT
RO
SI
SK
FI
SE
UK
QE4.1 Quel est, selon vous, le meilleur moyen d’obtenir une représentation équilibrée entre hommes et femmes au sein des conseils d'administration ?
Les mesures volontaires comme les codes de gouvernance des entreprises et les chartes non-
contraignants
Voluntary measures such as non-binding Corporate Governance
Codes and Charters
Freiwillige Maßnahmen, wie z.B. nicht verbindliche Grundsätze der
Unternehmensführung und Satzungen
EB76.1
QE4.1 Was ist Ihrer Meinung nach der beste Weg, um ein ausgewogeneres Verhältnis von Frauen und Männern in Aufsichtsräten von Unternehmen zu erreichen?
QE4.1 What is, in your view, the best way to achieve a more balanced representation of men and women on company boards?
Les mesures légalement
contraignantes
Binding legal measures
Verbindliche rechtliche Maßnahmen
EB76.1
L’autorégulation : les entreprises fixent leurs propres objectifs
Self-regulation by companies setting their own targets
Selbstregulierung, indem die Unternehmen sich ihre eigenen
Ziele setzen
EB76.1
23 31 30
20 31 26
20 31 32
19 29 24
28 36 24
26 54 10
19 34 36
26 36 27
19 28 29
29 26 18
17 18 30
20 23 39
13 36 22
26 32 23
19 34 21
30 18 39
27 35 16
22 27 27
9 24 26
14 35 32
16 32 37
20 35 18
9 26 33
18 27 27
21 29 32
15 20 29
29 40 21
20 33 28
17 35 26
36 37 17
15
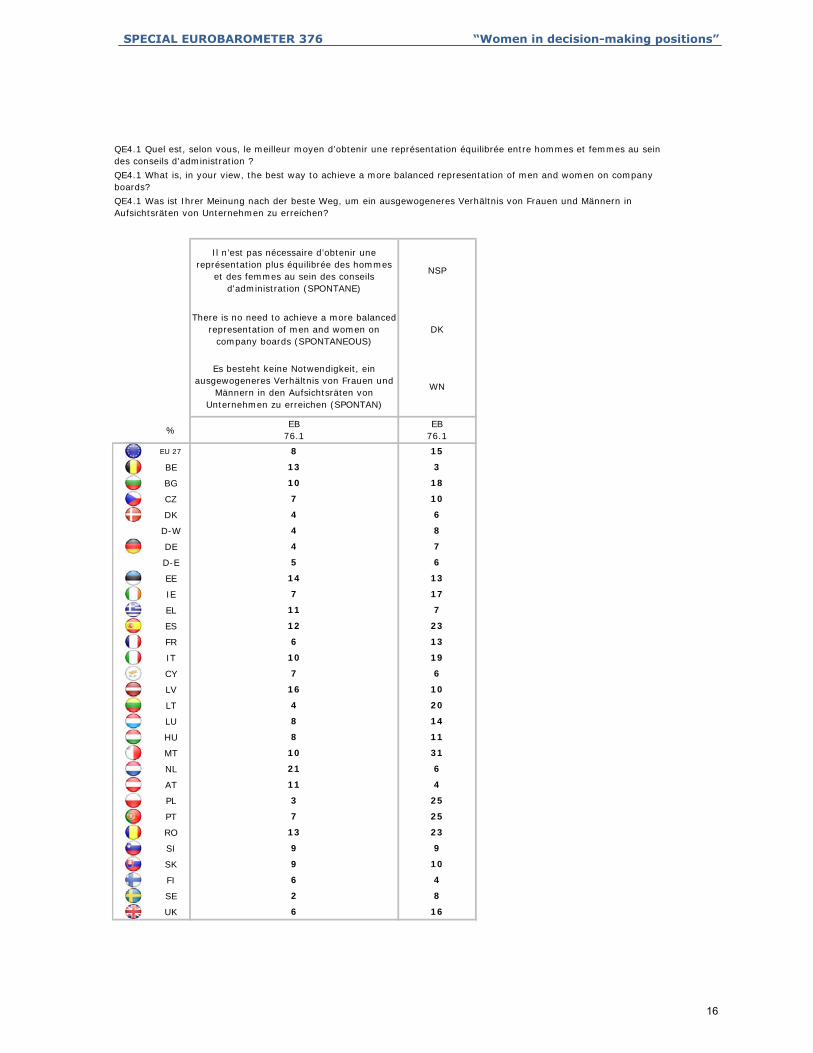
SPECIAL EUROBAROMETER 376 “Women in decision-making positions”
%
EU 27
BE
BG
CZ
DK
D-W
DE
D-E
EE
IE
EL
ES
FR
IT
CY
LV
LT
LU
HU
MT
NL
AT
PL
PT
RO
SI
SK
FI
SE
UK 6 16
QE4.1 Was ist Ihrer Meinung nach der beste Weg, um ein ausgewogeneres Verhältnis von Frauen und Männern in Aufsichtsräten von Unternehmen zu erreichen?
QE4.1 What is, in your view, the best way to achieve a more balanced representation of men and women on company boards?
QE4.1 Quel est, selon vous, le meilleur moyen d’obtenir une représentation équilibrée entre hommes et femmes au sein des conseils d'administration ?
6 4
2 8
9 9
9 10
7 25
13 23
11 4
3 25
10 31
21 6
8 14
8 11
16 10
4 20
10 19
7 6
12 23
6 13
7 17
11 7
5 6
14 13
4 8
4 7
7 10
4 6
13 3
10 18
EB76.1
EB76.1
8 15
There is no need to achieve a more balanced representation of men and women on
company boards (SPONTANEOUS)DK
Es besteht keine Notwendigkeit, ein ausgewogeneres Verhältnis von Frauen und
Männern in den Aufsichtsräten von Unternehmen zu erreichen (SPONTAN)
WN
Il n’est pas nécessaire d’obtenir une représentation plus équilibrée des hommes
et des femmes au sein des conseils d'administration (SPONTANE)
NSP
16

SPECIAL EUROBAROMETER 376 “Women in decision-making positions”
%
EU 27
BE
BG
CZ
DK
D-W
DE
D-E
EE
IE
EL
ES
FR
IT
CY
LV
LT
LU
HU
MT
NL
AT
PL
PT
RO
SI
SK
FI
SE
UK
QE4.2 Quel est, selon vous, le meilleur moyen d’obtenir une représentation équilibrée entre hommes et femmes au sein des conseils d'administration ?
Les mesures volontaires comme les codes de gouvernance des entreprises et les chartes non-
contraignants
Voluntary measures such as non-binding Corporate Governance
Codes and Charters
Freiwillige Maßnahmen, wie z.B. nicht verbindliche Grundsätze der
Unternehmensführung und Satzungen
EB76.1
QE4.2 Was ist Ihrer Meinung nach der beste Weg, um ein ausgewogeneres Verhältnis von Frauen und Männern in Aufsichtsräten von Unternehmen zu erreichen?
QE4.2 What is, in your view, the best way to achieve a more balanced representation of men and women on company boards?
Les mesures légalement
contraignantes
Binding legal measures
Verbindliche rechtliche Maßnahmen
EB76.1
L’autorégulation : les entreprises fixent leurs propres objectifs
Self-regulation by companies setting their own targets
Selbstregulierung, indem die Unternehmen sich ihre eigenen
Ziele setzen
EB76.1
26 40 34
27 37 36
26 40 34
24 38 38
29 60 11
31 41 28
29 40 31
21 38 41
40 35 25
25 37 38
25 28 47
25 28 47
31 40 29
19 50 31
34 21 45
25 46 29
29 35 36
35 45 20
17 43 40
16 40 44
28 47 25
19 38 43
25 37 38
13 39 48
23 31 46
26 35 39
25 41 34
32 45 23
39 42 19
22 44 34
17

SPECIAL EUROBAROMETER 376 “Women in decision-making positions”
%
EU 27
BE
BG
CZ
DK
D-W
DE
D-E
EE
IE
EL
ES
FR
IT
CY
LV
LT
LU
HU
MT
NL
AT
PL
PT
RO
SI
SK
FI
SE
UK
QE5 Einige europäische Länder (z.B. Frankreich, Spanien, die Niederlande, Italien, Belgien und Norwegen) haben bereits gesetzliche Maßnahmen ergriffen, um ein ausgewogeneres Verhältnis von Frauen und Männern in Aufsichtsräten von Unternehmen zu gewährleisten. Sind Sie für oder gegen ein solches Gesetz, unter der Voraussetzung, dass die Befähigung berücksichtigt wird und dass nicht automatisch das eine oder das andere Geschlecht bevorzugt wird?
QE5 Some European countries (e.g. France, Spain, the Netherlands, Italy, Belgium and Norway) have already taken legal measures to ensure a more balanced representation of men and women on company boards. Are you in favour or opposed to a legislation on this matter under the condition that qualification is taken into account without automatically favouring one of either gender?
QE5 Certains pays européens (par ex. la France, l’Espagne, les Pays-Bas, l’Italie, la Belgique et la Norvège) ont déjà adopté des mesures juridiques pour garantir la parité hommes-femmes au sein des conseils d'administration. Etes-vous favorable ou opposé(e) à une législation dans ce domaine, à la condition que les qualifications soient prises en compte sans favoriser automatiquement l'un des deux sexes ?
Plutôt favorable
Somewhat in favour
Eher dafür
EB76.1
Tout à fait favorable
Totally in favour
Voll und ganz dafürEB
76.1
Tout à fait opposé(e)
Totally opposed
Voll und ganz dagegen
EB76.1
Plutôt opposé(e)
Fairly opposed
Eher dagegen
EB76.1
NSP
DK
WN
EB76.1
37 38 12 5 8
40 44 12 3 1
29 49 14 4 4
37 38
27 25 20 26
1410 1
2
29 27 28 11 5
34 31 21 8 6
30 28
42 37 9 3
526 11
9
39 39 7 3 12
45 33 6 5 11
39 43
52 34 8 2
510 3
4
30 50 8 1 11
42 34 13 5 6
64 27
31 47 8 3
34 2
11
41 29 15 10 5
45 36 4 5 10
35 48
39 31 14 13
610 1
3
27 44 21 4 4
39 45 7 1 8
26 46
38 38 7 2
1510 3
15
50 30 12 5 3
41 35 9 13 2
40 44
34 28 19 17
69 1
2
38 35 12 8 7
18

SPECIAL EUROBAROMETER 376 “Women in decision-making positions”
%
EU 27
BE
BG
CZ
DK
D-W
DE
D-E
EE
IE
EL
ES
FR
IT
CY
LV
LT
LU
HU
MT
NL
AT
PL
PT
RO
SI
SK
FI
SE
UK
QE5 Einige europäische Länder (z.B. Frankreich, Spanien, die Niederlande, Italien, Belgien und Norwegen) haben bereits gesetzliche Maßnahmen ergriffen, um ein ausgewogeneres Verhältnis von Frauen und Männern in Aufsichtsräten von Unternehmen zu gewährleisten. Sind Sie für oder gegen ein solches Gesetz, unter der Voraussetzung, dass die Befähigung berücksichtigt wird und dass nicht automatisch das eine oder das andere Geschlecht bevorzugt wird?
QE5 Some European countries (e.g. France, Spain, the Netherlands, Italy, Belgium and Norway) have already taken legal measures to ensure a more balanced representation of men and women on company boards. Are you in favour or opposed to a legislation on this matter under the condition that qualification is taken into account without automatically favouring one of either gender?
QE5 Certains pays européens (par ex. la France, l’Espagne, les Pays-Bas, l’Italie, la Belgique et la Norvège) ont déjà adopté des mesures juridiques pour garantir la parité hommes-femmes au sein des conseils d'administration. Etes-vous favorable ou opposé(e) à une législation dans ce domaine, à la condition que les qualifications soient prises en compte sans favoriser automatiquement l'un des deux sexes ?
36
73 20
62
10
76 22
84
9
80 17
76
13
84 8
72
27
71 25
70
11
81 9
83
11
70 25
78
6
76 18
91
10
80 9
86
13
78 11
82
12
78 10
79
37
65 29
58
46
56 39
52
11
78 18
75
17
84 15
75
Gesamt 'Dagegen'
EB76.1
EB76.1
Gesamt 'Dafür'
Total 'Oppose(e)'
Total 'In favor' Total 'Opposed'
Total 'Favorable'
19

SPECIAL EUROBAROMETER 376 “Women in decision-making positions”
%
EU 27
BE
BG
CZ
DK
D-W
DE
D-E
EE
IE
EL
ES
FR
IT
CY
LV
LT
LU
HU
MT
NL
AT
PL
PT
RO
SI
SK
FI
SE
UK
QE6.1 En ce qui concerne une législation éventuelle visant à établir une représentation plus équilibrée des hommes et des femmes au sein des conseils d'administration des companies cotées en bourse, quel serait selon vous un objectif réaliste ?
30% de femmes\ 70%
d’hommes
30% women\ 70% men
30% Frauen / 70% Männer
EB76.1
QE6.1 Welches Ziel wäre Ihrer Meinung nach bei einer gesetzlichen Regelung zur Sicherstellung eines ausgewogeneren Verhältnisses von Frauen und Männern in den Aufsichtsräten börsennotierter Unternehmen realistisch?
QE6.1 In the case of legislation providing a more balanced representation of men and women on boards of publicly listed companies, what would in your view be a realistic target?
50% de femmes\ 50 %
d’hommes
50% women\ 50 % men
50% Frauen / 50% Männer
EB76.1
40% de femmes\ 60%
d’hommes
40% women\ 60% men
40% Frauen / 60% Männer
EB76.1
NSP
DK
WN
EB76.1
Aucun, vous n’êtes pas favorable aux
quotas (SPONTANE)
None, you are not in favour of quotas (SPONTANEOUS)Keines davon, Sie
lehnen Quotenregelungen
ab (SPONTAN)EB
76.16
10 25 46 18 1
12 26 43 13
9
17 37 34 9 3
10 24 45 12
1
18 28 33 16 5
21 32 29 17
5
15 23 40 19 3
17 27 34 17
11
5 25 48 15 7
13 29 36 11
3
4 10 62 16 8
15 23 44 15
3
10 27 41 11 11
11 27 49 10
1
7 18 48 22 5
13 28 52 6
11
12 25 41 17 5
11 23 50 5
4
7 20 44 15 14
16 29 38 13
3
11 28 35 21 5
22 32 28 15
10
2 9 57 19 13
11 24 39 16
12
10 23 43 22 2
10 20 46 12
4
13 30 31 24 2
14 33 36 13
2
14 30 43 7 6
11 31 46 10
20

SPECIAL EUROBAROMETER 376 “Women in decision-making positions”
%
EU 27
BE
BG
CZ
DK
D-W
DE
D-E
EE
IE
EL
ES
FR
IT
CY
LV
LT
LU
HU
MT
NL
AT
PL
PT
RO
SI
SK
FI
SE
UK
QE6.2 En ce qui concerne une législation éventuelle visant à établir une représentation plus équilibrée des hommes et des femmes au sein des conseils d'administration des companies cotées en bourse, quel serait selon vous un objectif réaliste ?
30% de femmes\ 70% d’hommes
30% women\ 70% men
30% Frauen / 70% Männer
EB76.1
QE6.2 Welches Ziel wäre Ihrer Meinung nach bei einer gesetzlichen Regelung zur Sicherstellung eines ausgewogeneren Verhältnisses von Frauen und Männern in den Aufsichtsräten börsennotierter Unternehmen realistisch?
QE6.2 In the case of legislation providing a more balanced representation of men and women on boards of publicly listed companies, what would in your view be a realistic target?
50% de femmes\ 50 % d’hommes
50% women\ 50 % men
50% Frauen / 50% Männer
EB76.1
40% de femmes\ 60% d’hommes
40% women\ 60% men
40% Frauen / 60% Männer
EB76.1
15 32 53
13 31 56
12 31 57
19 42 39
25 39 36
23 36 41
22 35 43
20 29 51
16 38 46
6 32 62
18 28 54
5 13 82
13 31 56
13 35 52
14 30 56
10 24 66
13 27 60
15 32 53
20 35 45
10 28 62
27 39 34
15 38 47
15 32 53
3 13 84
13 26 61
13 31 56
17 40 43
17 41 42
12 36 52
16 35 49
21

SPECIAL EUROBAROMETER 376 “Women in decision-making positions”
%
EU 27
BE
BG
CZ
DK
D-W
DE
D-E
EE
IE
EL
ES
FR
IT
CY
LV
LT
LU
HU
MT
NL
AT
PL
PT
RO
SI
SK
FI
SE
UK
QE7.1 Et, dans ce cas, quels délais devraient être accordés aux entreprises cotées en bourse pour se mettre en conformité avec une législation garantissant une représentation plus équilibrée des hommes et des femmes au sein de leurs conseils d'administration ?
Moins de 5 ans
Less than 5 years
Weniger als 5 Jahre
EB76.1
QE7.1 Und wie viel Zeit sollte börsennotierten Unternehmen in diesem Fall Ihrer Meinung nach eingeräumt werden, um die gesetzlichen Vorgaben zur Gewährleistung eines ausgewogeneren Verhältnisses zwischen Frauen und Männern in ihren Aufsichtsräten zu erfüllen?
QE7.1 And in that case, how long do you think should publicly listed companies be granted to comply with legislation providing for a more balanced representation of men and women regarding their board members?
8 ans ou plus
8 years or more
Acht Jahre oder mehr
EB76.1
Plus de 5 ans mais moins de
8 ans
More than 5 years but less than 8 years
Mehr als fünf, aber weniger als acht Jahre
EB76.1
NSP
DK
WN
EB76.1
Les entreprises ne devraient pas avoir à se mettre en conformité avec une
législation de quotas en ce qui concerne les membres de leurs conseils d'administration (SPONTANE)
Companies should not be obliged to comply with quota legislation regarding their board members (SPONTANEOUS)
Unternehmen sollten nicht verpflichtet werden, bestimmte gesetzliche Quoten bezüglich ihrer Aufsichtsratsmitglieder
zu erfüllen (SPONTAN)
EB76.1
16
40 31 9 16 4
37 26 9 12
26
47 28 7 9 9
37 17 3 17
4
27 31 9 21 12
23 37 21 15
12
39 23 5 23 10
30 29 8 21
17
44 23 6 10 17
22 32 12 17
8
43 11 6 15 25
43 27 12 10
10
44 19 6 9 22
46 27 9 8
4
33 28 10 20 9
64 19 6 7
20
36 26 12 17 9
39 24 13 4
12
33 19 4 16 28
39 27 10 12
4
33 28 8 24 7
25 40 16 15
26
38 16 5 13 28
33 28 10 3
39
44 22 8 17 9
33 10 6 12
9
25 36 15 20 4
43 30 6 12
4
32 36 13 8 11
36 38 13 9
22

SPECIAL EUROBAROMETER 376 “Women in decision-making positions”
%
EU 27
BE
BG
CZ
DK
D-W
DE
D-E
EE
IE
EL
ES
FR
IT
CY
LV
LT
LU
HU
MT
NL
AT
PL
PT
RO
SI
SK
FI
SE
UK
QE7.2 Et, dans ce cas, quels délais devraient être accordés aux entreprises cotées en bourse pour se mettre en conformité avec une législation garantissant une représentation plus équilibrée des hommes et des femmes au sein de leurs conseils d'administration ?
Moins de 5 ans
Less than 5 years
Weniger als 5 Jahre
EB76.1
QE7.2 Und wie viel Zeit sollte börsennotierten Unternehmen in diesem Fall Ihrer Meinung nach eingeräumt werden, um die gesetzlichen Vorgaben zur Gewährleistung eines ausgewogeneren Verhältnisses zwischen Frauen und Männern in ihren Aufsichtsräten zu erfüllen?
QE7.2 And in that case, how long do you think should publicly listed companies be granted to comply with legislation providing for a more balanced representation of men and women regarding their board members?
8 ans ou plus
8 years or more
Acht Jahre oder mehr
EB76.1
Plus de 5 ans mais moins de 8 ans
More than 5 years but less than 8 years
Mehr als fünf, aber weniger als acht Jahre
EB76.1
52 36 12
50 39 11
65 29 6
58 34 8
28 46 26
40 47 13
44 44 12
59 34 7
33 49 18
61 31 8
52 33 15
71 19 10
56 33 11
64 28 8
73 21 6
46 39 15
52 31 17
49 35 16
51 36 13
59 33 8
30 50 20
47 41 12
46 39 15
63 28 9
67 21 12
60 30 10
54 39 7
33 47 20
41 44 15
40 44 16
23

SPECIAL EUROBAROMETER 376 “Women in decision-making positions”
%
EU 27
BE
BG
CZ
DK
D-W
DE
D-E
EE
IE
EL
ES
FR
IT
CY
LV
LT
LU
HU
MT
NL
AT
PL
PT
RO
SI
SK
FI
SE
UK
QE8a Et selon vous, quelle serait la sanction la plus efficace en cas de non-conformité avec cette législation de la part des entreprises cotées en bourse ? (ROTATION)QE8a And in your opinion, what would be the most effective sanction in case publicly listed companies do not comply with such legislation? (ROTATE)QE8a Und was wäre Ihrer Meinung nach die wirksamste Sanktion gegen börsennotierte Unternehmen, die solche gesetzlichen Vorgaben nicht erfüllen? (ROTIEREN)
L'annulation des décisions prises par le
conseil d’administration
Annulment of the decisions taken by the
board
Aufhebung der vom Aufsichtsrat getroffenen
Entscheidungen
EB76.1
L'annulation de la nomination de
membres du sexe surreprésenté
Annulment of the nomination of
members of the over-represented gender
Aufhebung der Ernennung der Mitglieder des
überrepräsentierten Geschlechts
EB76.1
La dissolution de l’entreprise
Dissolution of company
Auflösung des Unternehmens
EB76.1
Des amendes
Monetary fine
Bußgeld
EB76.1
Pas de passation de marchés publics
No public procurement grants
Keine Erteilung von öffentlichen Aufträgen
EB76.11413 12 31 5
1621 13 28 5
1214 14 26 4
1715 10 32 7
1822 13 21 3
229 7 27 3
229 8 27 3
238 11 29 3
139 16 22 5
1312 11 38 4
1120 13 31 3
178 6 37 5
916 17 37 4
916 17 26 8
1017 12 41 7
1111 16 28 5
915 17 26 4
1115 14 29 2
1116 18 31 5
86 18 25 3
2012 10 26 2
1910 8 32 4
814 13 27 5
1113 12 28 4
516 12 24 4
721 12 28 4
1817 10 26 6
1713 15 27 5
1122 14 36 3
149 10 36 4
24

SPECIAL EUROBAROMETER 376 “Women in decision-making positions”
%
EU 27
BE
BG
CZ
DK
D-W
DE
D-E
EE
IE
EL
ES
FR
IT
CY
LV
LT
LU
HU
MT
NL
AT
PL
PT
RO
SI
SK
FI
SE
UK
QE8a Und was wäre Ihrer Meinung nach die wirksamste Sanktion gegen börsennotierte Unternehmen, die solche gesetzlichen Vorgaben nicht erfüllen? (ROTIEREN)
QE8a And in your opinion, what would be the most effective sanction in case publicly listed companies do not comply with such legislation? (ROTATE)
QE8a Et selon vous, quelle serait la sanction la plus efficace en cas de non-conformité avec cette législation de la part des entreprises cotées en bourse ? (ROTATION)
8 5
1 9 17
1
11 10
3 15 5
2
5 33
6 15 7
1
9 23
0 7 25
1
19 7
3 18 6
4
9 9
0 6 34
1
8 18
2 14 13
3
7 5
0 20 9
1
7 9
1 5 18
1
15 7
1 11 15
0
17 17
1 4 17
1
20 10
1 17 8
1
15 7
1 20 11
1
8 21
1 8 10
1
10 14
1 12 4
1
Nichts davon (SPONTAN) WN
EB76.1
EB76.1
EB76.1
Sonstige (SPONTAN)
Aucun (SPONTANE) NSP
Other (SPONTANEOUS)
None (SPONTANEOUS) DK
Autre (SPONTANE)
25

SPECIAL EUROBAROMETER 376 “Women in decision-making positions”
%
EU 27
BE
BG
CZ
DK
D-W
DE
D-E
EE
IE
EL
ES
FR
IT
CY
LV
LT
LU
HU
MT
NL
AT
PL
PT
RO
SI
SK
FI
SE
UK
QE8b Et ensuite ? (ROTATION – PLUSIEURS REPONSES POSSIBLES)
QE8b And then? (ROTATE – MULTIPLE ANSWERS POSSIBLE)
QE8b Und dann? (ROTIEREN - MEHRFACHNENNUNGEN MÖGLICH)
L'annulation des décisions prises par le
conseil d’administration
Annulment of the decisions taken by the
board
Aufhebung der vom Aufsichtsrat getroffenen
Entscheidungen
EB76.1
L'annulation de la nomination de
membres du sexe surreprésenté
Annulment of the nomination of
members of the over-represented gender
Aufhebung der Ernennung der Mitglieder des
überrepräsentierten Geschlechts
EB76.1
La dissolution de l’entreprise
Dissolution of company
Auflösung des Unternehmens
EB76.1
Des amendes
Monetary fine
Bußgeld
EB76.1
Pas de passation de marchés publics
No public procurement grants
Keine Erteilung von öffentlichen Aufträgen
EB76.12220 21 24 7
2021 24 26 6
2515 26 29 8
2521 23 28 10
1815 15 19 5
2816 19 32 4
2818 19 31 4
3025 21 27 6
2013 19 23 6
3420 25 29 11
2631 32 31 7
2617 15 25 7
2121 24 21 6
1930 28 26 13
2121 30 24 9
1514 22 25 5
2123 21 21 6
1312 23 16 4
2120 24 25 9
1413 18 21 13
2514 12 19 3
3326 28 32 10
1721 25 21 8
1719 22 20 9
1012 17 20 8
1623 24 24 10
2022 23 28 9
2020 20 25 6
1517 15 23 4
2312 13 19 7
26

SPECIAL EUROBAROMETER 376 “Women in decision-making positions”
%
EU 27
BE
BG
CZ
DK
D-W
DE
D-E
EE
IE
EL
ES
FR
IT
CY
LV
LT
LU
HU
MT
NL
AT
PL
PT
RO
SI
SK
FI
SE
UK
QE8b Und dann? (ROTIEREN - MEHRFACHNENNUNGEN MÖGLICH)
QE8b And then? (ROTATE – MULTIPLE ANSWERS POSSIBLE)
QE8b Et ensuite ? (ROTATION – PLUSIEURS REPONSES POSSIBLES)
31 3
2 30 6
1
8 4
2 9 5
1
8 26
5 13 7
0
5 9
0 5 15
0
27 6
5 7 4
2
8 8
0 11 19
0
7 9
4 26 7
4
17 6
0 11 13
0
9 11
2 3 5
0
6 3
3 11 12
0
10 16
1 3 10
0
7 4
2 6 3
1
34 3
1 8 4
1
1 13
0 5 4
1
11 8
2 10 1
1
Nichts davon (SPONTAN) WN
EB76.1
EB76.1
EB76.1
Sonstige (SPONTAN)
Aucun (SPONTANE) NSP
Other (SPONTANEOUS)
None (SPONTANEOUS) DK
Autre (SPONTANE)
27

SPECIAL EUROBAROMETER 376 “Women in decision-making positions”
%
EU 27
BE
BG
CZ
DK
D-W
DE
D-E
EE
IE
EL
ES
FR
IT
CY
LV
LT
LU
HU
MT
NL
AT
PL
PT
RO
SI
SK
FI
SE
UK
QE8T - Et selon vous, quelle serait la sanction la plus efficace en cas de non-conformité avec cette législation de la part des entreprises cotées en bourse ? Et ensuite ?QE8T - And in your opinion, what would be the most effective sanction in case publicly listed companies do not comply with such legislation? And then?QE8T - Und was wäre Ihrer Meinung nach die wirksamste Sanktion gegen börsennotierte Unternehmen, die solche gesetzlichen Vorgaben nicht erfüllen? Und dann?
L'annulation des décisions prises par le
conseil d’administration
Annulment of the decisions taken by the
board
Aufhebung der vom Aufsichtsrat getroffenen
Entscheidungen
EB76.1
L'annulation de la nomination de
membres du sexe surreprésenté
Annulment of the nomination of
members of the over-represented gender
Aufhebung der Ernennung der Mitglieder des
überrepräsentierten Geschlechts
EB76.1
La dissolution de l’entreprise
Dissolution of company
Auflösung des Unternehmens
EB76.1
Des amendes
Monetary fine
Bußgeld
EB76.1
Pas de passation de marchés publics
No public procurement grants
Keine Erteilung von öffentlichen Aufträgen
EB76.13028 28 49 10
3339 34 50 10
3025 32 46 10
3832 28 55 15
3234 24 35 8
4120 20 49 5
4222 21 49 6
4527 26 49 7
2617 28 37 9
4028 30 61 13
3145 39 56 8
3521 17 55 10
2734 37 55 9
2439 39 46 19
2835 39 62 14
2121 31 46 8
2533 32 41 8
2024 31 41 5
2832 38 52 12
1613 29 38 11
3922 19 40 4
4430 29 57 12
2028 30 41 11
2326 27 42 11
1123 23 36 10
1938 31 47 11
3434 28 48 13
3329 31 47 10
2437 27 56 7
3118 20 50 9
28

SPECIAL EUROBAROMETER 376 “Women in decision-making positions”
%
EU 27
BE
BG
CZ
DK
D-W
DE
D-E
EE
IE
EL
ES
FR
IT
CY
LV
LT
LU
HU
MT
NL
AT
PL
PT
RO
SI
SK
FI
SE
UK
QE8T - Und was wäre Ihrer Meinung nach die wirksamste Sanktion gegen börsennotierte Unternehmen, die solche gesetzlichen Vorgaben nicht erfüllen? Und dann?
QE8T - And in your opinion, what would be the most effective sanction in case publicly listed companies do not comply with such legislation? And then?
QE8T - Et selon vous, quelle serait la sanction la plus efficace en cas de non-conformité avec cette législation de la part des entreprises cotées en bourse ? Et ensuite ?
35 5
2 31 17
1
17 10
4 22 5
2
10 32
10 25 7
2
13 23
0 10 25
1
39 7
5 23 6
4
15 9
0 13 34
1
13 18
4 33 13
5
22 5
0 28 9
1
14 9
2 7 18
1
19 7
2 20 15
0
24 17
1 6 17
1
25 10
2 22 8
1
41 7
1 26 11
1
9 21
1 13 10
1
19 14
3 20 4
2
Nichts davon (SPONTAN) WN
EB76.1
EB76.1
EB76.1
Sonstige (SPONTAN)
Aucun (SPONTANE) NSP
Other (SPONTANEOUS)
None (SPONTANEOUS) DK
Autre (SPONTANE)
29

SPECIAL EUROBAROMETER 376 “Women in decision-making positions”
%
EU 27
BE
BG
CZ
DK
D-W
DE
D-E
EE
IE
EL
ES
FR
IT
CY
LV
LT
LU
HU
MT
NL
AT
PL
PT
RO
SI
SK
FI
SE
UK
QE9 Sind Sie im Hinblick auf Maßnahmen zur Verbesserung der Ausgewogenheit der Geschlechterverhältnisse in den Aufsichtsräten börsennotierter Unternehmen der Meinung, dass Entscheidungen auf nationaler oder auf europäischer Ebene getroffen werden sollten?
QE9 With regards to measures taken to improve gender balance on boards of publicly listed companies, do you think that decisions should be made by at national level or European level?
QE9 En ce qui concerne les mesures prises pour améliorer la parité hommes-femmes au sein des conseils d’administration des entreprises cotées en bourse, pensez-vous que les décisions devraient être adoptées au niveau national ou européen ?
Au niveau européen
European level
Auf europäischer Ebene
EB76.1
Au niveau national
National level
Auf nationaler Ebene
EB76.1
NSP
DK
WN
EB76.1
Aux deux (SPONTANE)
At both (SPONTANEOUS)
Auf beiden Ebenen (SPONTAN)
EB76.1
21 63 12 4
34 35 23 8
47 38 12 3
30 30 29 11
25 35 32 8
49 17 28 6
28 23 40 9
25 33 34 8
35 27 29 9
46 27 17 10
19 42 27 12
26 47 24 3
16 33 41 10
33 53 8 6
47 33 11 9
36 45 18 1
25 55 13 7
35 40 14 11
48 24 17 11
33 32 31 4
30 21 43 6
38 48 6 8
17 36 39 8
46 31 15 8
24 39 32 5
18 25 44 13
51 35 10 4
37 46 12 5
68 22 4 6
57 32 7 4
30


