downloaded from guannan li, ke huang, dejan nikolic,...
TRANSCRIPT

DMD # 65987
1
High-throughput Cytochrome P450 Cocktail Inhibition Assay for Assessing Drug-
Drug and Drug-Botanical Interactions
Guannan Li, Ke Huang, Dejan Nikolic, and Richard B. van Breemen
UIC/NIH Center for Botanical Dietary Supplements Research
Department of Medicinal Chemistry and Pharmacognosy
University of Illinois College of Pharmacy, Chicago, IL 60612
This article has not been copyedited and formatted. The final version may differ from this version.DMD Fast Forward. Published on August 18, 2015 as DOI: 10.1124/dmd.115.065987
at ASPE
T Journals on June 14, 2018
dmd.aspetjournals.org
Dow
nloaded from

DMD # 65987
2
CYP450 Cocktail Inhibition Assay Using UHPLC-MS/MS
Corresponding author: Richard B. van Breemen
Department of Medicinal Chemistry and Pharmacognosy
University of Illinois College of Pharmacy
833 S. Wood Street, Chicago, IL 60612-7231
Telephone: 312-996-9353
E-mail: [email protected]
Number of text pages: 29
Number of tables: 3
Number of figures: 4
Number of references: 42
Number of words in the Abstract: 174
Number of words in the Introduction: 489
Number of words in the Discussion: 1418
Nonstandard abbreviations:
CYP: cytochrome P450
FDA: United States Food and Drug Administration
Km: Michaelis constant
UHPLC-MS/MS: Ultrahigh pressure liquid chromatography-tandem mass spectrometry
This article has not been copyedited and formatted. The final version may differ from this version.DMD Fast Forward. Published on August 18, 2015 as DOI: 10.1124/dmd.115.065987
at ASPE
T Journals on June 14, 2018
dmd.aspetjournals.org
Dow
nloaded from

DMD # 65987
3
Abstract
Detection of drug-drug interactions is essential during the early stages of drug discovery
and development, and the understanding of drug-botanical interactions is important for
the safe use of botanical dietary supplements. Among the different forms of drug
interactions that are known, inhibition of cytochrome P450 (CYP) enzymes is the most
common cause of drug-drug or drug-botanical interactions. Therefore, a rapid and
comprehensive mass spectrometry-based in vitro high-throughput CYP cocktail
inhibition assay was developed that uses 10 substrates simultaneously against 9 CYP
isoforms. Including probe substrates for CYP1A2, CYP2A6, CYP2B6, CYP2C8,
CYP2C9, CYP2C19, CYP2D6, CYP2E1, and two probes targeting different binding
sites of CYP3A4/5, this cocktail simultaneously assesses at least as many CYP
enzymes as previous assays while remaining among the fastest due to short incubation
times and rapid analysis using UHPLC-MS/MS. The method was validated using known
inhibitors of each CYP enzyme and then shown to be useful not only for single
compound testing but also for the evaluation of potential drug-botanical interactions
using the botanical dietary supplement licorice (Glycyrrhiza glabra) as an example.
This article has not been copyedited and formatted. The final version may differ from this version.DMD Fast Forward. Published on August 18, 2015 as DOI: 10.1124/dmd.115.065987
at ASPE
T Journals on June 14, 2018
dmd.aspetjournals.org
Dow
nloaded from

DMD # 65987
4
1. Introduction
Drugs and botanical dietary supplements can interact with some therapeutic
agents by inhibiting or inducing drug metabolizing enzymes or drug transporters.
Inhibition of these enzymes and transporters can result in longer half-lives and higher
and possibly toxic concentrations of therapeutic agents whereas induction can have the
opposite effect. The most common form of drug-drug or drug-botanical interaction is
inhibition of cytochrome P450 (CYP) enzymes. Examples include inhibition of CYP2D6
by paroxetine (Bertelsen et al., 2003) and inhibition of CYP3A4 by goldenseal
(Hydrastis canadensis) (Chatterjee and Franklin, 2003; Gurley et al., 2005).
In vitro CYP inhibition assays are widely used to study potential drug-drug and
drug-botanical interactions. Although these assays typically evaluate inhibition of one
CYP isoform at a time, the U.S. Food and Drug Administration (FDA) recommends that
at least seven CYP isoforms should be investigated for possible inhibition by each new
drug entity under development (Food and Drug Administration, 2012). To expedite
these assays, several cocktail approaches, also known as n-in-one assays, have been
developed to test for inhibition of several CYP isoforms simultaneously. Most of these
assays test for inhibition of five to eight CYP isoforms and use a wide variety of
experimental conditions and probe substrates (Dierks et al., 2001; Testino and Patonay,
2003; Smith et al., 2007; Workman and Raynaud, 2007; He et al., 2007; Li et al., 2007;
Zientek et al., 2008; Alden et al., 2010; Otten et al., 2011; Yao et al., 2012; Kozakai et
al., 2012; Lee and Kim, 2013; Qiao et al., 2014; Qin et al., 2014; Liu et al., 2015).
Although a few approaches have claimed using 9 or 10 substrates to evaluate 9
isoforms, they actually carry out separate incubations of subsets of probe substrates to
This article has not been copyedited and formatted. The final version may differ from this version.DMD Fast Forward. Published on August 18, 2015 as DOI: 10.1124/dmd.115.065987
at ASPE
T Journals on June 14, 2018
dmd.aspetjournals.org
Dow
nloaded from

DMD # 65987
5
avoid CYP interactions before pooling the mixtures immediately prior to a quantitative
analysis step, utilize CYP substrates which are not recommended by the FDA, and/or
use long incubation times of up to 60 min (Kim et al., 2005; Turpeinen et al., 2005;
Tolonen et al., 2007; Dinger et al., 2014).
To address these assay limitations for the investigation of drug-drug interactions
while including drug-botanical interactions which are important to our laboratory, we
developed and validated a high-throughput CYP cocktail inhibition assay using 10
substrates against 9 CYP enzymes. Simultaneously assessing the inhibition of 9 CYP
isoforms can significantly reduce the cost and time needed for the evaluation of drug-
drug and drug-botanical interactions. Our in vitro high-throughput cocktail approach
optimized enzyme protein concentration, minimized probe substrate interactions,
minimized solvent effects, and utilized a fast and sensitive UHPLC-MS/MS quantitative
assay (Chauret et al., 1998; Busby et al., 1999; Yuan et al., 2002; Turpeinen et al., 2005;
Jia and Liu, 2007; Smith et al., 2007; Otten et al., 2011; Kozakai et al., 2012; Lee and
Kim, 2013; Spaggiari et al., 2014). After validating the new assay using nine known
CYP inhibitors, an extract of the botanical dietary supplement licorice (Glycyrrhiza
glabra) was evaluated for CYP inhibition.
This article has not been copyedited and formatted. The final version may differ from this version.DMD Fast Forward. Published on August 18, 2015 as DOI: 10.1124/dmd.115.065987
at ASPE
T Journals on June 14, 2018
dmd.aspetjournals.org
Dow
nloaded from
DMD # 65987
6
2. Materials and Methods
2.1 Materials and Chemicals
Phenacetin was purchased from Tokyo Chemical Industry (Tokyo, Japan).
Acetaminophen, coumarin, bupropion hydrochloride, tolbutamide, dextrorphan tartrate,
chlorzoxazone, 6β-hydroxytestosterone, furafylline, ticlopidine hydrochloride, quercetin,
sulfaphenazole, quinidine, ketoconazole, ammonium diethyldithiocarbamate, β-
nicotinamide adenine dinucleotide phosphate (NADPH), formic acid, potassium
phosphate monobasic, and potassium phosphate dibasic were purchased from Sigma-
Aldrich (St. Louis, MO). 1’-Hydroxymidazolam and 6-hydroxychlorzoxazone were
purchased from Cayman Chemical (Ann Arbor, MI). Dextromethorphan hydrobromide
was obtained from MP Biomedicals (Santa Ana, CA), and 7-hydroxycoumarin was
purchased from Indofine Chemical (Hillsborough, NJ). Hydroxybupropion and
hydroxybupropion-d6 were purchased from Santa Cruz Biotechnology (Dallas, TX), and
midazolam and testosterone were obtained from Cerilliant Corporation (Round Rock,
TX). [d5]-7-Hydroxycoumarin, [d7]-6β-hydroxytestosterone and [13C3]-1’-
hydroxymidazolam were purchased from BD Gentest (Woburn, MA). Amodiaquine, N-
desethylamodiaquine hydrochloride, [d5]-N-desethylamodiaquine, (S)-mephenytoin, [d4]-
acetaminophen, [d2]-6-hydroxychlorzoxazone, hydroxytolbutamide, [d9]-4-
hydroxytolbutamide, (±)-4’-hydroxymephenytoin, [d3]-(±)-4’-hydroxymephenytoin, and
[d3]-dextrorphan tartrate were obtained from Toronto Research Chemicals (Toronto,
Canada).
Pooled human liver microsomes from 200 donors were purchased from
XenoTech (Lenexa, KS). LC/MS-grade acetonitrile and methanol were purchased from
This article has not been copyedited and formatted. The final version may differ from this version.DMD Fast Forward. Published on August 18, 2015 as DOI: 10.1124/dmd.115.065987
at ASPE
T Journals on June 14, 2018
dmd.aspetjournals.org
Dow
nloaded from
DMD # 65987
7
Thermo Fisher (Fair Lawn, NJ). Water was prepared using an Elga Purelab Ultra
(Siemens Water Technologies, Woodridge, IL) water purification system. An extract of
licorice roots (Glycyrrhiza glabra) was prepared from botanically authenticated plant
material provided by the UIC/NIH Center for Botanical Dietary Supplements Research.
The licorice root was extracted with 90% ethanol, 5% isopropanol, 5% water (v/v/v)
(weight root powder (g)/volume solvent (mL): 1:15).
2.2 Microsomal Incubations
Potassium phosphate buffer (100 µL, 0.1 M, pH 7.4) containing 1.3 mM NADPH,
0.2 mg/mL human liver microsomes, and a cocktail of 10 probe substrates (phenacetin
for CYP1A2, coumarin for CYP2A6, bupropion for CYP2B6, amodiaquine for CYP2C8,
tolbutamide for CYP2C9, (S)-mephenytoin for CYP2C19, dextromethorphan for
CYP2D6, chlorzoxazone for CYP2E1, and midazolam and testosterone for CYP3A4/5)
(Table 1) or a single substrate (around Km) were incubated at 37 °C for 10 min.
Methanol was used to dissolve the substrate cocktail or individual substrate and
comprised <0.3% (v/v) of the total incubation mixture. The reactions were terminated by
adding 20 µL of a stop solution consisting of water/acetonitrile/formic acid, (92:5:3; v/v/v)
containing stable isotope-labeled surrogate standards (Table 1). The samples were
then centrifuged at 13000 x g at 4 °C for 15 min prior to analysis using UHPLC-MS/MS.
2.2.1 Michaelis constant (Km) determination
Human liver microsomes (0.05-0.20 mg/mL) were incubated at 37 °C for 5-20
min with each CYP substrate at 8-10 different concentrations. After quantitative analysis
using UHPLC-MS/MS, Km values were calculated.
This article has not been copyedited and formatted. The final version may differ from this version.DMD Fast Forward. Published on August 18, 2015 as DOI: 10.1124/dmd.115.065987
at ASPE
T Journals on June 14, 2018
dmd.aspetjournals.org
Dow
nloaded from

DMD # 65987
8
2.2.2 Linearity of metabolite formation in the cocktail assay
Each cocktail reaction mixture was incubated at 37 °C for 2.5, 5, 10, 15, or 20
min. After quenching and quantitative analysis, the linearity of metabolite formation was
evaluated.
2.2.3 Comparison of cocktail and single substrate assays using known CYP
inhibitors and licorice root extract
Known CYP inhibitors recommended by the FDA were used at 10 different
concentrations as follows: 0.01-200 µM furafylline for CYP1A2, 0.005-100 µM
methoxsalen for CYP2A6, 0.05-500 µM ticlopidine for CYP2B6 and CYP2C19, 0.01-200
µM quercetin for CYP2C8, 0.05-500 µM sulfaphenazole for CYP2C9, 0.005-100 µM
quinidine for CYP2D6, 0.1-2000 µM diethyldithiocarbamate for CYP2E1, and 0.005-100
µM ketoconazole for CYP3A4/5. Licorice root extract at 11 concentrations from 0.005-
250 µg/mL were also evaluated for inhibition. After incubation with probe substrates as
described above and quantitative analysis of metabolites as described below, IC50
values were calculated.
2.3 UHPLC-MS/MS
All metabolites and surrogate standards were analyzed in a single run using
UHPLC-MS/MS on a Shimadzu (Kyoto, Japan) Nexera UHPLC and LCMS-8050 triple
quadrupole mass spectrometer. The 10 metabolites of the probe substrates and their
corresponding isotope-labeled internal standards were separated on a Waters (Milford,
MA) ACQUITY UPLC BEH C18 column (2.1 x 100 mm, 1.7 μm) using a 3-min gradient
from 20% to 75% acetonitrile in water containing 0.1% formic acid. The flow rate was
This article has not been copyedited and formatted. The final version may differ from this version.DMD Fast Forward. Published on August 18, 2015 as DOI: 10.1124/dmd.115.065987
at ASPE
T Journals on June 14, 2018
dmd.aspetjournals.org
Dow
nloaded from

DMD # 65987
9
0.5 mL/min, and the column oven temperature was 40 °C. Detection was carried out
using electrospray with polarity switching, collision-induced dissociation, and selected
reaction monitoring (SRM) (Table 1).
2.4 Data analysis
Quantitative UHPLC-MS/MS data were analyzed using Shimadzu LabSolutions
software (Kyoto, Japan). The Km and IC50 values were determined using the Enzyme
Kinetics module of SigmaPlot (Systat Software, San Jose, CA). The percent of control
activity, linearity of metabolite formation and other calculations were carried out using
Microsoft Excel (Seattle, WA).
This article has not been copyedited and formatted. The final version may differ from this version.DMD Fast Forward. Published on August 18, 2015 as DOI: 10.1124/dmd.115.065987
at ASPE
T Journals on June 14, 2018
dmd.aspetjournals.org
Dow
nloaded from

DMD # 65987
10
3. Results
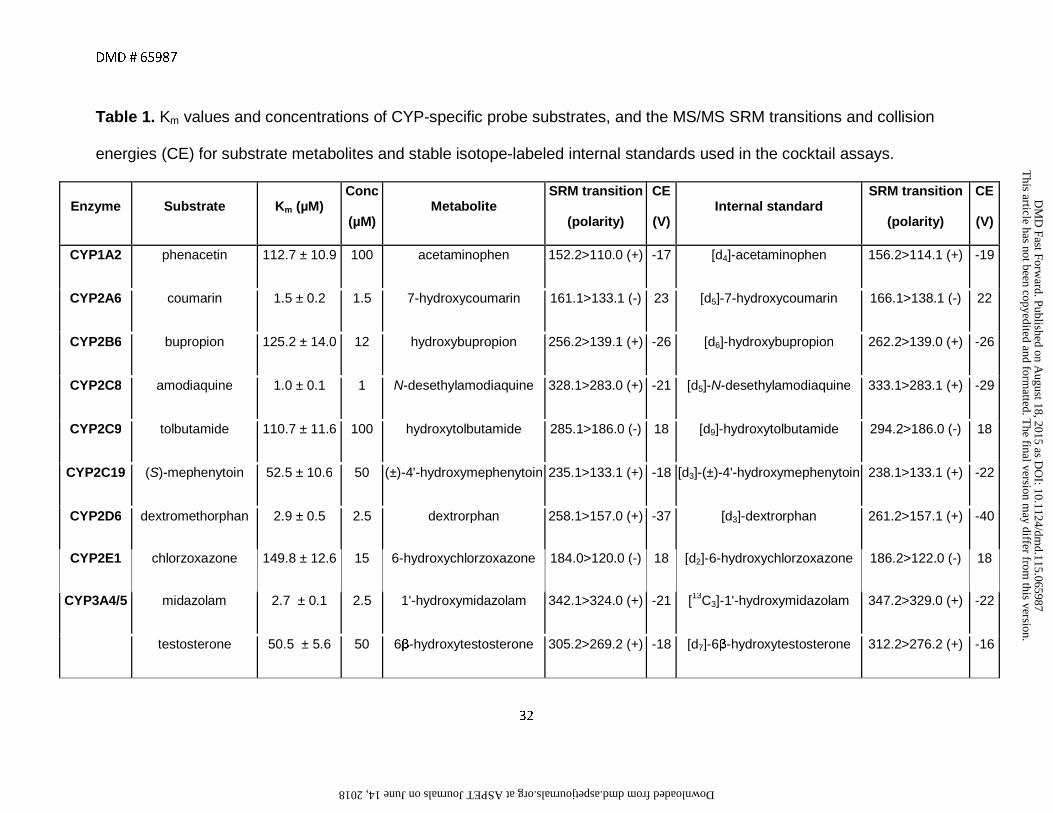
The ten probe substrates specific to 9 CYP isoforms (Table 1) were selected
based on U.S. FDA recommendation (Food and Drug Administration, 2006), specificity
of the enzymatic reaction, sensitivity of analytical detection, and availability of the stable
isotope-labeled surrogate standard of the corresponding metabolites. The initial
concentration of each substrate was determined based on its Km value (Table 1) and
systematic evaluation of probe interactions. The SRM transitions for all ten metabolites
and their corresponding isotope-labeled internal standards were selected based on the
most abundant fragment ions of each protonated or deprotonated molecule and are
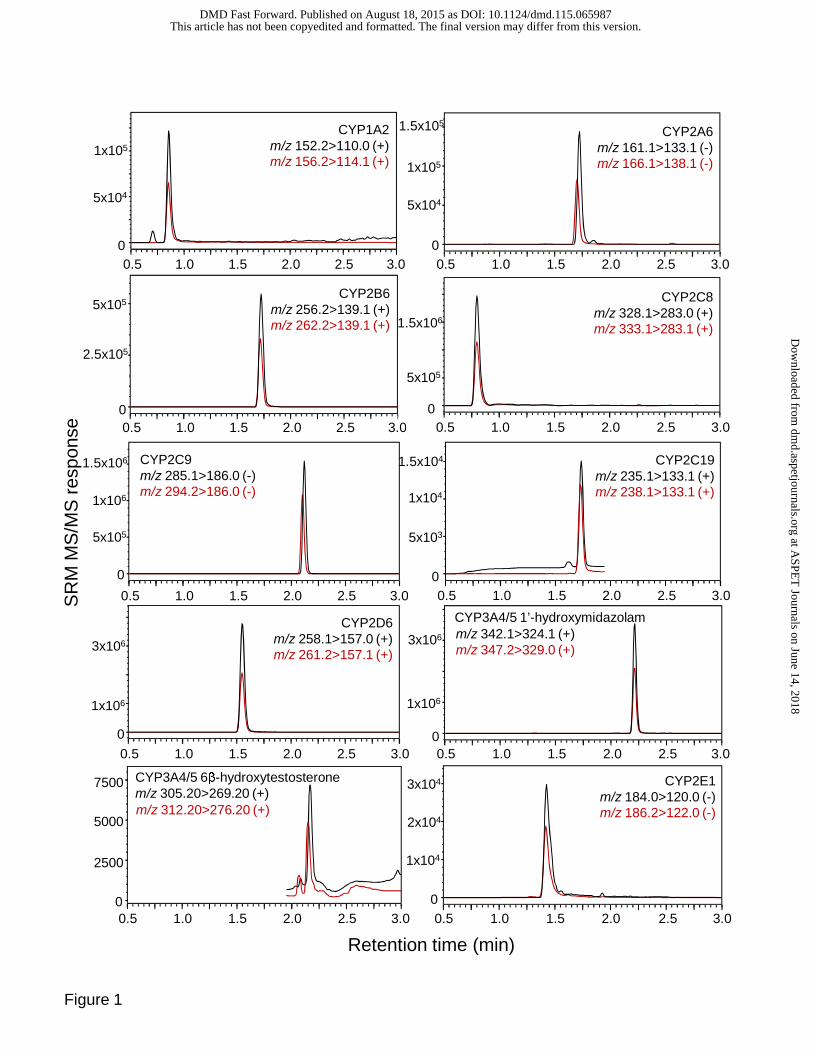
summarized in Table 1. The elution profiles of all metabolites and internal standards
detected during UHPLC-MS/MS are shown in Figure 1. Note that all compounds eluted
within 3 min.
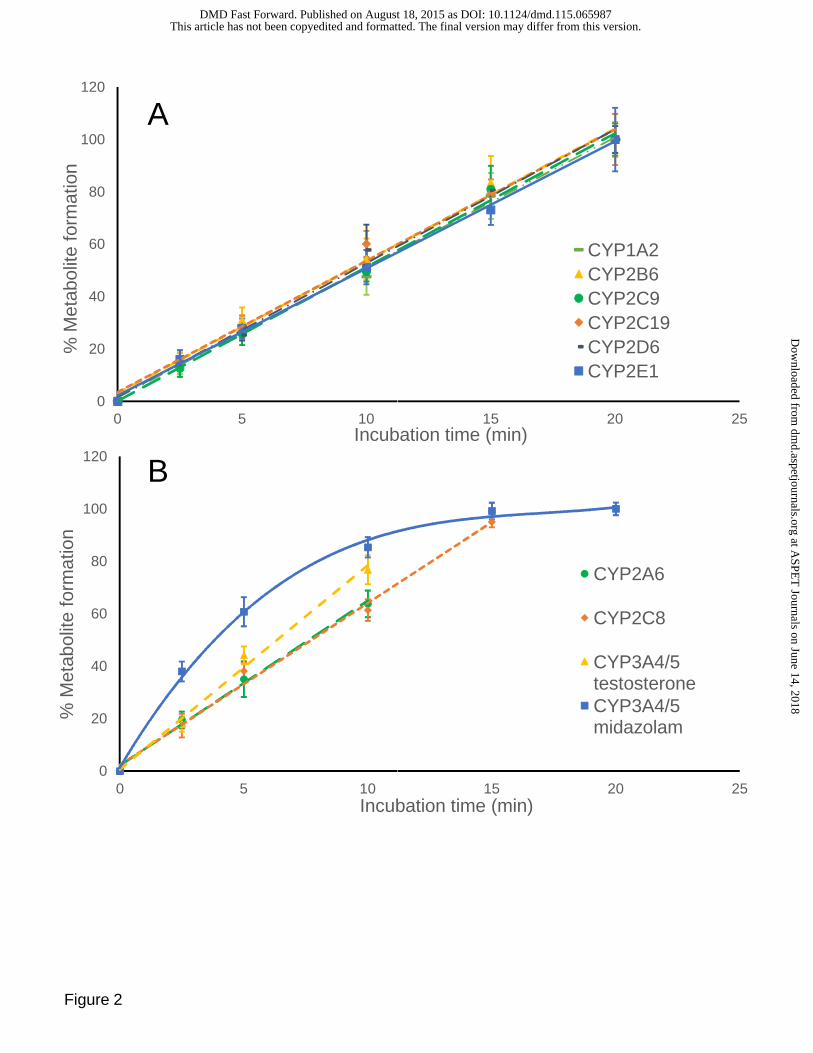
Although the metabolic transformation of most probe substrates in the cocktail
was linear for at least 20 min, the rates of metabolism of coumarin by CYP2A6, of
amodiaquine by CYP2C8 and of testosterone by CYP3A4/5 showed linearity for up to
only 10-15 min. The formation of 1’-hydroxymidazolam was not linear under any
incubation conditions but was most linear during the first 10 min (Figure 2). Therefore,
an incubation time of 10 min was selected for the entire cocktail assay based on the
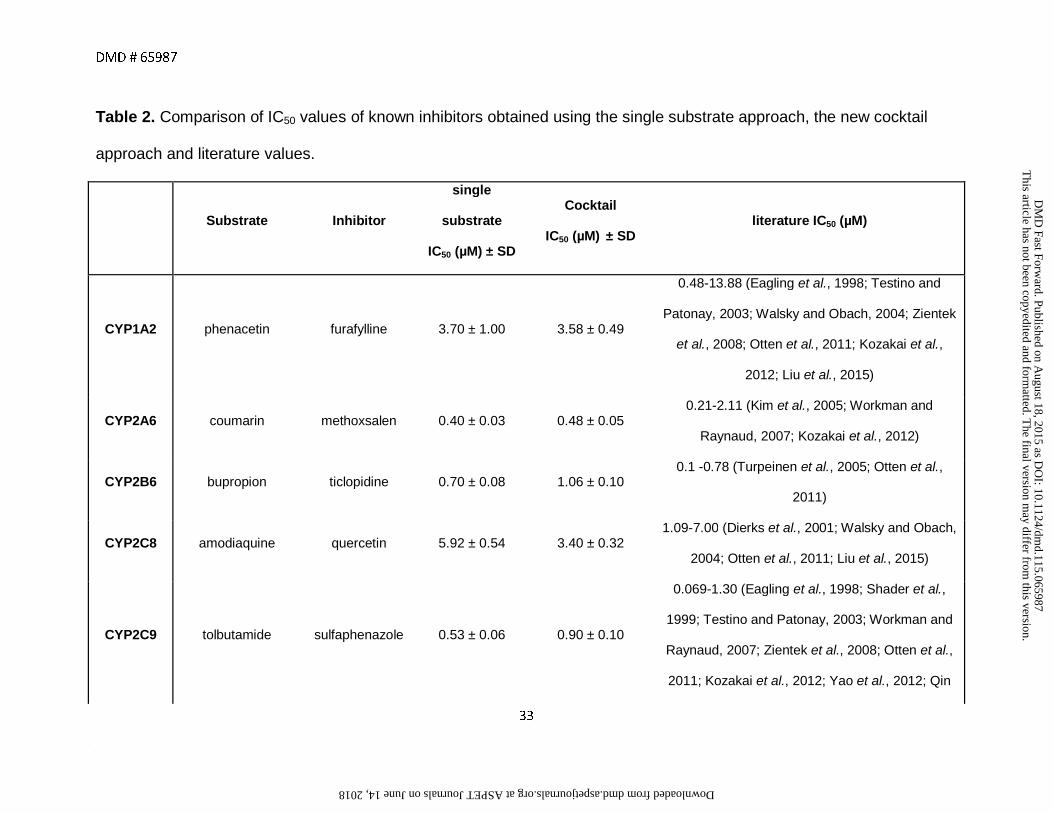
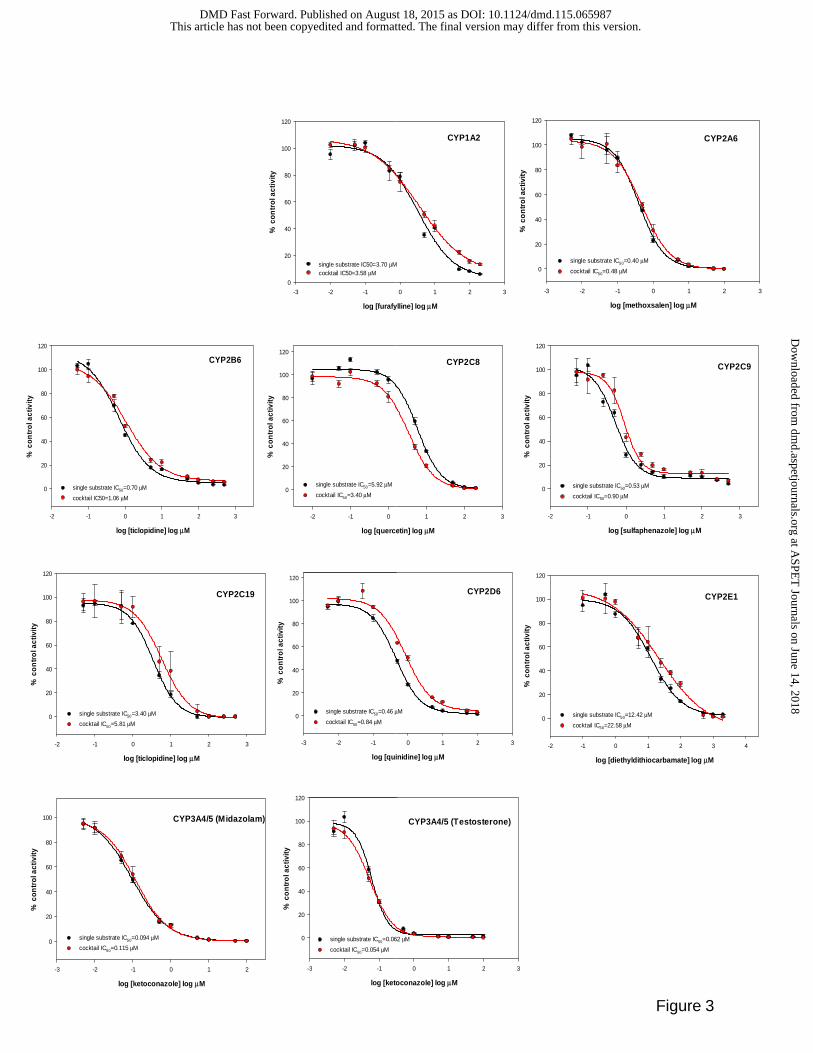
linearity of formation of most metabolites during this period. Using known inhibitors of
each enzymatic reaction, validation of the cocktail assay was carried out by comparing
the IC50 values obtained using the cocktail approach with those obtained using only
single substrates. Inhibition curves and IC50 values (Figure 3; Table 2) showed good
accordance between the cocktail assay and the single substrate method.
This article has not been copyedited and formatted. The final version may differ from this version.DMD Fast Forward. Published on August 18, 2015 as DOI: 10.1124/dmd.115.065987
at ASPE
T Journals on June 14, 2018
dmd.aspetjournals.org
Dow
nloaded from

DMD # 65987
11
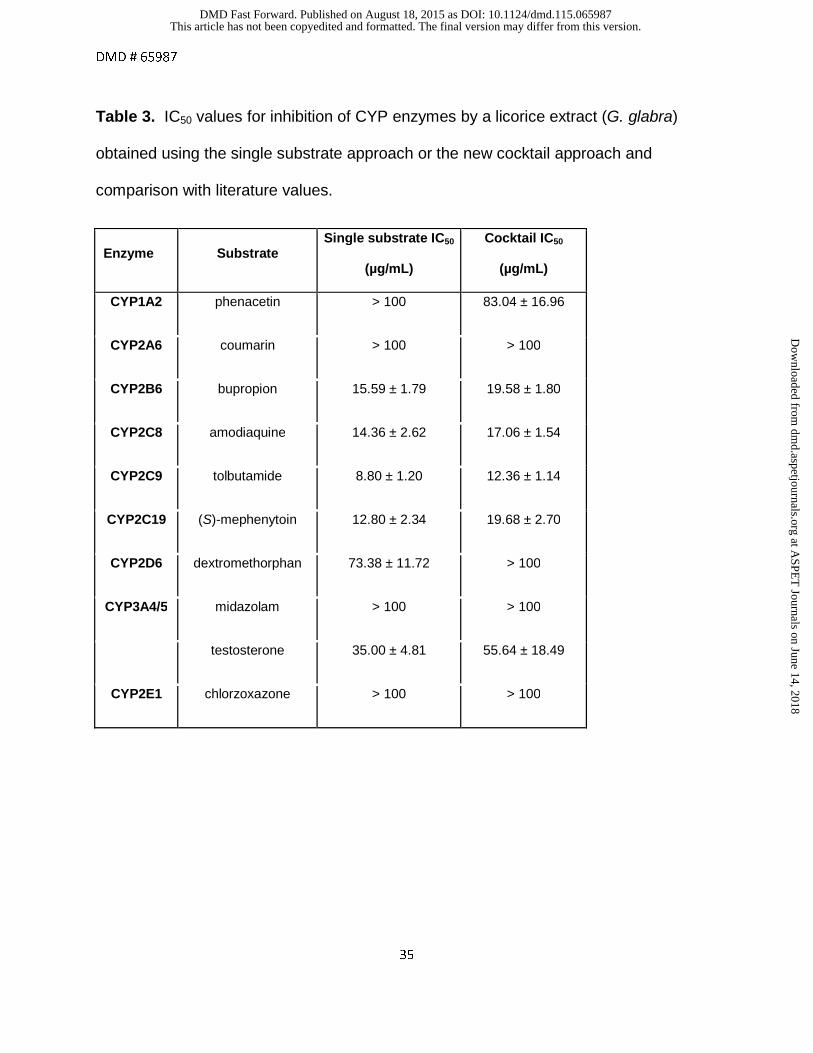
The new cocktail assay was then used to assess the potential for drug-botanical
interactions of a licorice root extract from G. glabra (Figure 4). The licorice root extract
inhibited CYP2B6 and the CYP2C family of enzymes (CYP2C8, CYP2C9 and CYP2C19)
with IC50 values <20 μg/mL. Note that good agreement was observed between the
cocktail and single substrate approaches as indicated by the data in Table 3.
This article has not been copyedited and formatted. The final version may differ from this version.DMD Fast Forward. Published on August 18, 2015 as DOI: 10.1124/dmd.115.065987
at ASPE
T Journals on June 14, 2018
dmd.aspetjournals.org
Dow
nloaded from
DMD # 65987
12
4. Discussion
4.1 Probe Substrate Selection and Mass Spectrometry
Phenacetin O-deethylation by CYP1A2 was selected for the cocktail assay and is
often used in other cocktails (Yuan et al., 2002; Spaggiari et al., 2014) because of its
superior specificity compared to other FDA-recommended substrates. Among several
possible probes for CYP2A6, CYP2B6 and CYP2E1, coumarin-7-hydroxyation,
bupropion-hydroxylation and chlorzoxazone 6-hydroxylation were selected based on the
commercial availability of the corresponding stable isotope-labeled metabolites for use
as surrogate standards during UHPLC-MS/MS (Figure 1). For CYP2C8, taxol and
amodiaquine are frequently used as probe substrates, however, the higher solubility of
amodiaquine makes it superior for cocktail applications (Spaggiari et al., 2014).
Therefore, amodiaquine N-deethylation by CYP2C8 was measured instead of taxol
hydroxylation.
Tolbutamide and diclofenac are frequently used as probe substrates for CYP2C9,
and bufuralol and dextromethorphan are often used as substrates of CYP2D6. Although
either probe substrate of each pair could have been used in our assay, tolbutamide
methyl-hydroxylation and dextromethorphan O-demethylation were used to measure
interactions with CYP2C9 and CYP2D6, respectively. As a probe for CYP2C19, S-
mephenytoin 4’-hydroxylation is highly specific, however, cocktail assays typically use
the less specific omeprazole due to the sensitivity limitations of most detection methods
(Yuan et al., 2002; Testino and Patonay, 2003; Spaggiari et al., 2014). Here, we were
able to use the preferred probe substrate, (S)-mephenytoin, due to the high sensitivity of
UHPLC-MS/MS (Figure 1). For evaluation of CYP3A4/5 inhibition, the use of two
This article has not been copyedited and formatted. The final version may differ from this version.DMD Fast Forward. Published on August 18, 2015 as DOI: 10.1124/dmd.115.065987
at ASPE
T Journals on June 14, 2018
dmd.aspetjournals.org
Dow
nloaded from

DMD # 65987
13
structurally unrelated substrates are recommended (Yuan et al., 2002; Food and Drug
Administration, 2006). Therefore, midazolam 1-hydroxlyation and testosterone 6β-
hydroxylation were used to probe inhibition of CYP3A4/5 as recommended by the FDA.
For [13C3]-1’-hydroxymidazolam, we monitored the second most abundant protonated
ion m/z 247 instead of the most abundant protonated ion m/z 245 due to the isotopic
interference from 1’-hydroxymidazolam.
7-Hydroxycoumarin, hydroxytolbutamide and 6-hydroxychlorzoxazone were
measured using negative electrospray while the other seven metabolites were
measured in positive ion mode (Figure 1). Poor ionization efficiency of 6-
hydroxychlorzoxazone during positive ion electrospray and the inability of some mass
spectrometers to carry out rapid polarity switching have been cited as reasons for
excluding CYP2E1 from some previous cocktail assays (He et al., 2007).
Chlorzoxazone was included in our cocktail assay as a probe for CYP2E1 (Figure 1),
because the fast polarity-switching and high sensitivity of this generation triple
quadrupole mass spectrometer enabled the measurement of all ten probes including 6-
hydroxychlorzoxazone and their surrogate standards in a single analysis.
4.2 Optimization of Probe Substrate Concentrations and Incubation Conditions
The probe substrate concentrations in cocktail assays should be ≤Km of the
corresponding cytochrome P450 enzymes. Although Km values from the literature have
been utilized in the design of most existing cocktail assays, the reported values can
span a wide range (Turpeinen et al., 2005; Liu et al., 2015). For example, the Km values
This article has not been copyedited and formatted. The final version may differ from this version.DMD Fast Forward. Published on August 18, 2015 as DOI: 10.1124/dmd.115.065987
at ASPE
T Journals on June 14, 2018
dmd.aspetjournals.org
Dow
nloaded from

DMD # 65987
14
reported for phenacetin O-deethylation range from 1.7-152 µM, and those for
tolbutamide methyl-hydroxylation range from 67-838 µM (Food and Drug Administration,
2006). The variability of Km values between laboratories is primarily caused by
differences in experimental procedures and genetic variations in the enzymes being
probed. To be certain that appropriate concentrations of each probe substrate were
utilized in our application, we determined the Km values for each probe substrate using
the same experimental procedures, and the same batch of pooled human liver
microsomes was used for all subsequent inhibition experiments (Table 1).
Possible interactions between the probe substrates of the CYP enzymes were
evaluated, and substrate concentrations for the cocktail assay were adjusted to
minimize these interactions. Phenacetin weakly inhibited CYP2B6 and CYP3A4/5
(midazolam); bupropion strongly inhibited the activities of CYP2C19 and CYP2D6 and
weakly inhibited CYP3A4/5 (midazolam). Chlorzoxazone inhibited CYP1A2, CYP2A6,
CYP2B6, CYP2C8, CYP2C9, and CYP3A4/5 (midazolam and testosterone), and
testosterone moderately inhibited CYP2B6 and CYP3A4/5 (midazolam) while weakly
inhibiting CYP2C9.
Lowering substrate concentrations was an effective strategy to decrease
interactions in the cocktail assay. For example, because bupropion and chlorzoxazone
strongly inhibited multiple CYP isoforms, 10 substrate mixtures containing varying
concentrations (0.05Km, 0.1Km, 0.2Km, 0.4Km, and 0.8Km) of bupropion and
chlorzoxazone were tested. (S)-Mephenytoin is a low-turnover substrate of CYP2C19
(Yao et al., 2012), and to ensure analytical detection of its metabolite 4'-
hydroxymephenytoin, both bupropion and chlorzoxazone concentrations needed to be
This article has not been copyedited and formatted. The final version may differ from this version.DMD Fast Forward. Published on August 18, 2015 as DOI: 10.1124/dmd.115.065987
at ASPE
T Journals on June 14, 2018
dmd.aspetjournals.org
Dow
nloaded from
DMD # 65987
15
≤0.1Km (data not shown). Therefore, the concentrations of bupropion and
chlorzoxazone were set to 0.1Km in the cocktail assay.
After optimizing the substrate concentrations for the cocktail assay (Table 1), the
linearity of metabolite formation was investigated. All 10 substrates were evaluated, 6 of
them showed linearity up to 20 min, while 4 substrates were linear for 15 min or less
(Figure 2). Although a 10-min incubation time was not optimal for midazolam, it was the
minimum required to ensure sufficient metabolite formation for the low-turnover
substrates. Under these conditions, the inhibition potency of moderate inhibitors for
midazolam 1-hydroxlyation might be underestimated (Ogilivie et al., 2008). Therefore,
further studies on any compounds/extracts that show moderate/weak inhibition of
CYP3A4/5 (midazolam) would be recommended.
4.3 Validation and Application of the Cocktail Assay
Ideally, the cocktail cytochrome P450 enzyme inhibition assay should yield the
same results as would be obtained if each substrate were assayed separately. As
quantitative measures of the potencies of enzyme inhibitors, the IC50 values for
inhibitors tested individually or in the cocktail assay should also be comparable
(Sittampalam GS, Gal-Edd N, Arkin M, 2004; Davis and Ward, 2014). The ratios of the
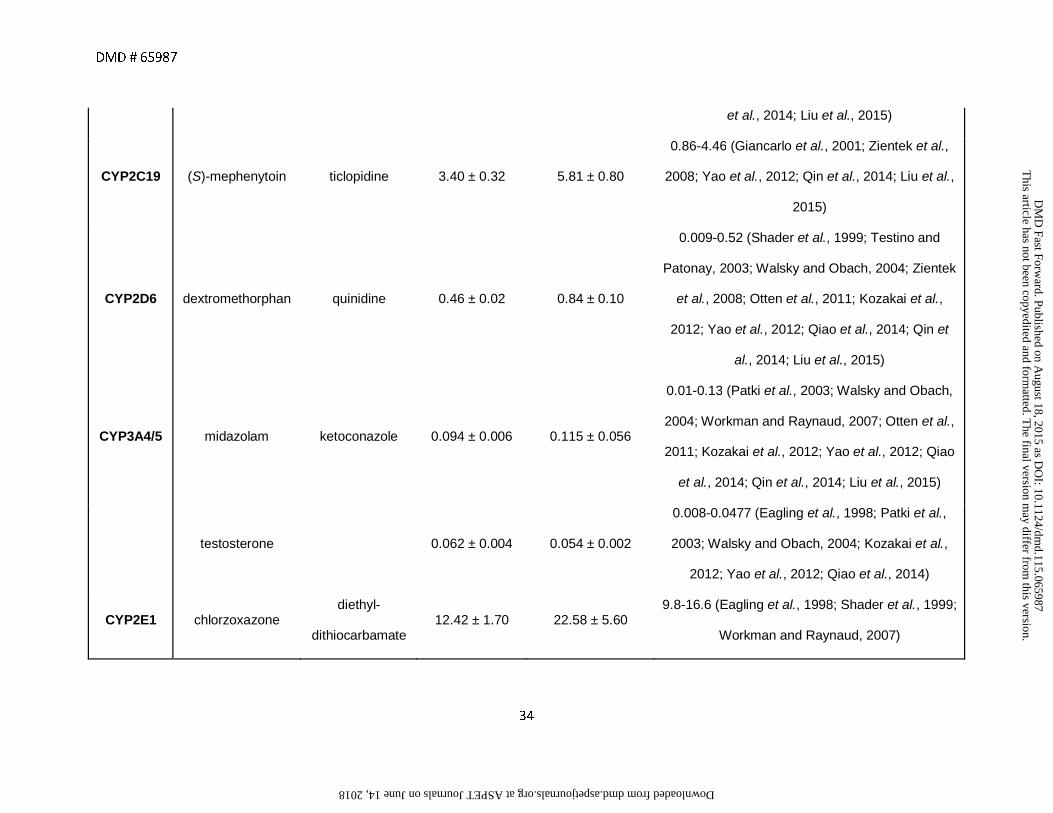
IC50 values obtained using both approaches (Table 2) were compared and had ratios
ranging from 1.03 to 1.82. Because these values were within a 2-fold range of each
other, they were in good agreement. As additional validation of the cocktail method, the
measured IC50 values were consistent with values in the literature (Table 2) (Eagling et
al., 1998; Shader et al., 1999; Dierks et al., 2001; Giancarlo et al., 2001; Testino and
This article has not been copyedited and formatted. The final version may differ from this version.DMD Fast Forward. Published on August 18, 2015 as DOI: 10.1124/dmd.115.065987
at ASPE
T Journals on June 14, 2018
dmd.aspetjournals.org
Dow
nloaded from
DMD # 65987
16
Patonay, 2003; Patki et al., 2003; Walsky and Obach, 2004; Turpeinen et al., 2005; Kim
et al., 2005; Workman and Raynaud, 2007; Zientek et al., 2008; Otten et al., 2011; Yao
et al., 2012; Kozakai et al., 2012; Qin et al., 2014; Qiao et al., 2014; Liu et al., 2015).
IC50 values are extrinsic constants and depend on experimental conditions, but Ki
values are intrinsic constants. Therefore, researchers sometimes estimate Ki from IC50
values (Otten et al., 2011). Assuming competitive inhibition, Ki values can be calculated
using the Cheng-Prusoff equation (Ki=IC50/2 when substrate concentration is ≈Km; and
Ki=IC50/1.1 when the substrate concentration is Km/10). Using the IC50 values in Table
2 and the Cheng-Prusoff equation, the calculated cocktail Ki values are in good
accordance with those obtained single substrate assays, except for ticlopidine (CYP2B6)
and diethyldithiocarbamate (CYP2E1) for which the calculated Ki values for the cocktail
assays (0.96 and 20.53 µM) were ~3-fold higher those for the single substrate assays
(0.35 and 6.21 µM). One possible explanation might be that ticlopidine and
diethyldithiocarbamate are mechanism-based inhibitors of CYP2B6 and CYP2E1,
respectively, and their IC50 values are susceptible to changes of microsomal conditions
(Turpeinen and Nieminen, 2004; Ogilvie et al., 2008; Pratt-Hyatt et al., 2010).
Kent et al. (2002) reported that an alcoholic extract of licorice root (G. glabra)
moderately inhibited CYP3A4 and its flavonoid glabridin inhibited the activities of
CYP2B6, CYP2C9 and CYP3A4. Our G. glabra extract showed moderate inhibition of
CYP2B6, CYP2C9, CYP2C8, and CYP2C19 (which were not tested by Kent, et al.) but
only weak inhibition of CYP3A4/5. The slight difference between inhibition potencies of
CYP3A4/5 for these two assays is probably due to the different preparations of licorice
extracts used or to minor assay variations.
This article has not been copyedited and formatted. The final version may differ from this version.DMD Fast Forward. Published on August 18, 2015 as DOI: 10.1124/dmd.115.065987
at ASPE
T Journals on June 14, 2018
dmd.aspetjournals.org
Dow
nloaded from

DMD # 65987
17
In conclusion, an in vitro high-throughput cytochrome P450 cocktail inhibition
assay containing 10 substrates for 9 CYP isoforms was developed using UHPLC-
MS/MS and validated using known inhibitors of each CYP enzyme. This assay includes
all 7 cytochrome P450 enzymes recommended for testing by the U.S. FDA as well as
two additional isoforms, CYP2A6 and CYP2E1, which are also important in the
metabolism of xenobiotic compounds such as nicotine (CYP2A6) and ethanol (CYP2E1)
(Pelkonen et al., 2000; Dey, 2013). Besides the obvious time efficiency and resource-
saving advantages of combining 10 substrates into a single assay, each incubation was
only 10 min compared with up to 60 min in some previous assays, and each UHPLC-
MS/MS analysis required less than 5 min per sample which is up to 5-fold faster than
comparable HPLC-MS/MS approaches. The assay was applied to the prediction of
drug-botanical interactions for a licorice root dietary supplement. As a complement to
drug-drug interaction studies, drug-botanical interactions are understudied and yet can
cause drug toxicity and therapeutic failure.
This article has not been copyedited and formatted. The final version may differ from this version.DMD Fast Forward. Published on August 18, 2015 as DOI: 10.1124/dmd.115.065987
at ASPE
T Journals on June 14, 2018
dmd.aspetjournals.org
Dow
nloaded from
DMD # 65987
18
5. Acknowledgments
The authors thank Dr. Charlotte Simmler and Dr. Guido F. Pauli of the UIC/NIH Center
for Botanical Dietary Supplements for kindly providing extracts of Glycyrrhiza glabra.
We also thank Shimadzu Instruments for providing the UHPLC-MS/MS system used
during this investigation.
This article has not been copyedited and formatted. The final version may differ from this version.DMD Fast Forward. Published on August 18, 2015 as DOI: 10.1124/dmd.115.065987
at ASPE
T Journals on June 14, 2018
dmd.aspetjournals.org
Dow
nloaded from

DMD # 65987
19
6. Authorship Contributions
Participated in research design: Li, Huang, Nikolic, van Breemen.
Conducted experiments: Li.
Performed data analysis: Li.
Wrote or contributed to the writing of the manuscript: Li, van Breemen.
This article has not been copyedited and formatted. The final version may differ from this version.DMD Fast Forward. Published on August 18, 2015 as DOI: 10.1124/dmd.115.065987
at ASPE
T Journals on June 14, 2018
dmd.aspetjournals.org
Dow
nloaded from

DMD # 65987
20
This article has not been copyedited and formatted. The final version may differ from this version.DMD Fast Forward. Published on August 18, 2015 as DOI: 10.1124/dmd.115.065987
at ASPE
T Journals on June 14, 2018
dmd.aspetjournals.org
Dow
nloaded from

DMD # 65987
21
7. References
Alden PG, Plumb RS, Jones MD, Rainville PD, and Shave D (2010) A rapid ultra-
performance liquid chromatography/tandem methodology for the in vitro analysis of
pooled and cocktail cytochrome P450 assays. Rapid communications in mass
spectrometry�: RCM 24:147–154.
Bertelsen KM, Venkatakrishnan K, Von Moltke LL, Obach RS, and Greenblatt DJ (2003)
Apparent mechanism-based inhibition of human CYP2D6 in vitro by paroxetine:
Comparison with fluoxetine and quinidine. Drug Metabolism and Disposition
31:289–293.
Busby WF, Ackermann JM, and Crespi CL (1999) Effect of methanol, ethanol, dimethyl
sulfoxide, and acetonitrile on in vitro activities of cDNA-expressed human
cytochromes P-450. Drug Metabolism and Disposition 27:246–249.
Chatterjee P, and Franklin MR (2003) Human cytochrome P450 inhibition and
metabolic-intermediate complex formation by goldenseal extract and its
methylenedioxyphenyl components. Drug Metabolism and Disposition 31:1391–
1397.
Chauret N, Gauthier a, and Nicoll-Griffith D a (1998) Effect of common organic solvents
on in vitro cytochrome P450-mediated metabolic activities in human liver
microsomes. Drug metabolism and disposition: the biological fate of chemicals
26:1–4.
This article has not been copyedited and formatted. The final version may differ from this version.DMD Fast Forward. Published on August 18, 2015 as DOI: 10.1124/dmd.115.065987
at ASPE
T Journals on June 14, 2018
dmd.aspetjournals.org
Dow
nloaded from
DMD # 65987
22
Davis A, and Ward SE (2014) The Handbook of Medicinal Chemistry: Principles and
Practice, Royal Society of Chemistry.
Dey A (2013) Cytochrome P450 2E1: Its Role in Disease and Drug Metabolism,
Springer Netherlands.
Dierks EA, Stams KR, Lim HK, Cornelius G, Zhang H, and Ball SE (2001) A method for
the simultaneous evaluation of the activities of seven major human drug-
metabolizing cytochrome P450s using an in vitro cocktail of probe substrates and
fast gradient liquid chromatography tandem mass spectrometry. Drug Metabolism
and Disposition 29:23–29.
Dinger J, Meyer MR, and Maurer HH (2014) Development of an in vitro cytochrome
P450 cocktail inhibition assay for assessing the inhibition risk of drugs of abuse.
Toxicology Letters 230:28–35, Elsevier Ireland Ltd.
Eagling V a., Tjia JF, and Back DJ (1998) Differential selectivity of cytochrome P450
inhibitors against probe substrates in human and rat liver microsomes. British
Journal of Clinical Pharmacology 45:107–114.
Food and Drug Administration (2006) Drug Development and Drug Interactions: Table
of Substrates, Inhibitors and Inducers. Available at:
http://www.fda.gov/Drugs/DevelopmentApprovalProcess/DevelopmentResources/D
rugInteractionsLabeling/ucm093664.htm, last accessed on March 9, 2015.
This article has not been copyedited and formatted. The final version may differ from this version.DMD Fast Forward. Published on August 18, 2015 as DOI: 10.1124/dmd.115.065987
at ASPE
T Journals on June 14, 2018
dmd.aspetjournals.org
Dow
nloaded from

DMD # 65987
23
Food and Drug Administration (2012) Guidance for industry. Drug interaction studies
study design, data analysis, implications for dosing, and labeling recommendations.
Giancarlo GM, Venkatakrishnan K, Granda BW, Von Moltke LL, and Greenblatt DJ
(2001) Relative contributions of CYP2C9 and 2C19 to phenytoin 4-hydroxylation in
vitro: Inhibition by sulfaphenazole, omeprazole, and ticlopidine. European Journal
of Clinical Pharmacology 57:31–36.
Gurley BJ, Gardner SF, Hubbard M a., Williams DK, Gentry WB, Khan I a., and Shah A
(2005) In vivo effects of goldenseal, kava kava, black cohosh, and valerian on
human cytochrome P450 1A2, 2D6, 2E1, and 3A4/5 phenotypes. Clinical
Pharmacology and Therapeutics 77:415–426.
He F, Bi H, Xie Z, Zuo Z, Li J, Li X, Zhao L, Chen X, and Huang M (2007) Rapid
determination of six metabolites from multiple cytochrome P450 probe substrates in
human liver microsome by liquid chromatography / mass spectrometry�:
application to high-throughput inhibition screening of terpenoids. Rapid
Communications in Mass Spectrometry 21:635–643.
Jia L, and Liu X (2007) The Conduct of Drug Metabolism Studies Considered Good
Practice (II): In Vitro Experiments. Current Drug Metabolism 8:822–829.
Kent UM, Aviram M, Rosenblat M, and Hollenberg PF (2002) The licorice root derived
isoflavan glabridin inhibits the activities of human cytochrome P450S 3A4, 2B6, and
2C9. Drug Metabolism and Disposition 30:709–715.
This article has not been copyedited and formatted. The final version may differ from this version.DMD Fast Forward. Published on August 18, 2015 as DOI: 10.1124/dmd.115.065987
at ASPE
T Journals on June 14, 2018
dmd.aspetjournals.org
Dow
nloaded from

DMD # 65987
24
Kim M-J, Kim H, Cha I-J, Park J-S, Shon J-H, Liu K-H, and Shin J-G (2005) High-
throughput screening of inhibitory potential of nine cytochrome P450 enzymes in
vitro using liquid chromatography/tandem mass spectrometry. Rapid
communications in mass spectrometry�: RCM 19:2651–8.
Kozakai K, Yamada Y, Oshikata M, Kawase T, Suzuki E, Haramaki Y, and Taniguchi H
(2012) Reliable High-throughput Method for Inhibition Assay of 8 Cytochrome P450
Isoforms Using Cocktail of Probe Substrates and Stable Isotope-labeled Internal
Standards. Drug Metabolism and Pharmacokinetics 27:520–529.
Lee KS, and Kim SK (2013) Direct and metabolism-dependent cytochrome P450
inhibition assays for evaluating drug-drug interactions. Journal of applied
toxicology�: JAT 33:100–8.
Li X, Chen X, Li Q, Wang L, and Zhong D (2007) Validated method for rapid inhibition
screening of six cytochrome P450 enzymes by liquid chromatography-tandem
mass spectrometry. Journal of Chromatography B: Analytical Technologies in the
Biomedical and Life Sciences 852:128–137.
Liu L, Han Y, Zhu J, Yu Q, and Yang Q (2015) A sensitive and high-throughput LC-MS /
MS method for inhibition assay of seven major cytochrome P450s in human liver
microsomes using an in vitro cocktail of probe substrates. Biomedical
chromatography�: BMC 437–444.
This article has not been copyedited and formatted. The final version may differ from this version.DMD Fast Forward. Published on August 18, 2015 as DOI: 10.1124/dmd.115.065987
at ASPE
T Journals on June 14, 2018
dmd.aspetjournals.org
Dow
nloaded from

DMD # 65987
25
Ogilvie BW, Usuki E, Yerino P, and Parkinson A (2008) In Vitro Approaches for
Studying the Inhibition of Drug-Metabolizing Enzymes and Identifying the Drug-
Metabolizing Enzymes Responsible for the Metabolism of Drugs (Reaction
Phenotyping) with Emphasis on Cytochrome P450, in Drug-drug interactions
(Rodrigues DA ed) p 242, New York: Informa Healthcare.
Otten JN, Hingorani GP, Hartley DP, Kragerud SD, and Franklin RB (2011) An in vitro,
high throughput, seven CYP cocktail inhibition assay for the evaluation of new
chemical entities using LC-MS/MS. Drug metabolism letters 5:17–24.
Patki KC, Von Moltke LL, and Greenblatt DJ (2003) In vitro metabolism of midazolam,
triazolam, nifedipine, and testosterone by human liver microsomes and
recombinant cytochromes P450: Role of CYP3A4 and CYP3A5. Drug Metabolism
and Disposition 31:938–944.
Pelkonen O, Rautio A, Raunio H, and Pasanen M (2000) CYP2A6: A human coumarin
7-hydroxylase. Toxicology 144:139–147.
Pratt-Hyatt M, Lin H, and Hollenberg P (2010) Mechanism-based inactivation of human
CYP2E1 by diethyldithocarbamate. Drug Metabolism and Disposition 38:2286–
2292.
Qiao X, Ji S, Yu S-W, Lin X-H, Jin H-W, Duan Y-K, Zhang L-R, Guo D-A, and Ye M
(2014) Identification of key licorice constituents which interact with cytochrome
This article has not been copyedited and formatted. The final version may differ from this version.DMD Fast Forward. Published on August 18, 2015 as DOI: 10.1124/dmd.115.065987
at ASPE
T Journals on June 14, 2018
dmd.aspetjournals.org
Dow
nloaded from
DMD # 65987
26
P450: evaluation by LC/MS/MS cocktail assay and metabolic profiling. The AAPS
journal 16:101–13.
Qin C-Z, Ren X, Tan Z-R, Chen Y, Yin J-Y, Yu J, Qu J, Zhou H-H, and Liu Z-Q (2014) A
high-throughput inhibition screening of major human cytochrome P450 enzymes
using an in vitro cocktail and liquid chromatography-tandem mass spectrometry.
Biomedical chromatography�: BMC 28:197–203.
Shader RI, Granda BW, Von Moltke LL, Giancarlo GM, and Greenblatt DJ (1999)
Inhibition of human cytochrome P450 isoforms in vitro by Zafirlukast.
Biopharmaceutics and Drug Disposition 20:385–388.
Sittampalam GS, Gal-Edd N, Arkin M et al. (2004) Assay Guidance Manual.
Smith D, Sadagopan N, Zientek M, Reddy A, and Cohen L (2007) Analytical
approaches to determine cytochrome P450 inhibitory potential of new chemical
entities in drug discovery. Journal of chromatography B, Analytical technologies in
the biomedical and life sciences 850:455–63.
Spaggiari D, Geiser L, Daali Y, and Rudaz S (2014) A cocktail approach for assessing
the in vitro activity of human cytochrome P450s: An overview of current
methodologies. Journal of Pharmaceutical and Biomedical Analysis, doi:
10.1016/j.jpba.2014.03.018, Elsevier B.V.
Testino S a., and Patonay G (2003) High-throughput inhibition screening of major
human cytochrome P450 enzymes using an in vitro cocktail and liquid
This article has not been copyedited and formatted. The final version may differ from this version.DMD Fast Forward. Published on August 18, 2015 as DOI: 10.1124/dmd.115.065987
at ASPE
T Journals on June 14, 2018
dmd.aspetjournals.org
Dow
nloaded from

DMD # 65987
27
chromatography-tandem mass spectrometry. Journal of Pharmaceutical and
Biomedical Analysis 30:1459–1467.
Tolonen A, Petsalo A, Turpeinen M, Uusitalo J, and Pelkonen O (2007) In vitro
interaction cocktail assay for nine major cytochrome P450 enzymes with 13 probe
reactions and a single LC/MSMS run: Analytical validation and testing with
monoclonal anti-CYP antibodies. Journal of Mass Spectrometry 42:960–966.
Turpeinen M, Jouko U, Jorma J, and Olavi P (2005) Multiple P450 substrates in a single
run: Rapid and comprehensive in vitro interaction assay. European Journal of
Pharmaceutical Sciences 24:123–132.
Turpeinen M, and Nieminen R (2004) Selective inhibition of CYP2B6-catalyzed
bupropion hydroxylation in human liver microsomes in vitro. Drug metabolism
and … 32:626–631.
Walsky RL, and Obach RS (2004) Validated assays for human cytochrome P450
activities. Drug metabolism and disposition: the biological fate of chemicals 32:647–
60.
Workman P, and Raynaud FI (2007) Analysis of Potential Drug-Drug Interactions for
Anticancer Agents in Human Liver Microsomes by High Throughput Liquid
Chromatography / Mass Spectrometry Assay. Austral - Asian Journal of Cancer
6:55–69.
This article has not been copyedited and formatted. The final version may differ from this version.DMD Fast Forward. Published on August 18, 2015 as DOI: 10.1124/dmd.115.065987
at ASPE
T Journals on June 14, 2018
dmd.aspetjournals.org
Dow
nloaded from
DMD # 65987
28
Yao M, Cai H, and Zhu M (2012) Fast and reliable cyp inhibition assays, in ADME-
Enabling Technologies in Drug Design and Development (Zhang D, and
Surapaneni S eds) pp 213–232, John Wiley & Sons, Inc.
Yuan R, Madani S, Wei X-X, Reynolds K, and Huang S-M (2002) Evaluation of
cytochrome P450 probe substrates commonly used by the pharmaceutical industry
to study in vitro drug interactions. Drug metabolism and disposition: the biological
fate of chemicals 30:1311–9.
Zientek M, Miller H, Smith D, Dunklee MB, Heinle L, Thurston A, Lee C, Hyland R,
Fahmi O, and Burdette D (2008) Development of an in vitro drug-drug interaction
assay to simultaneously monitor five cytochrome P450 isoforms and performance
assessment using drug library compounds. Journal of Pharmacological and
Toxicological Methods 58:206–214, Elsevier Inc.
This article has not been copyedited and formatted. The final version may differ from this version.DMD Fast Forward. Published on August 18, 2015 as DOI: 10.1124/dmd.115.065987
at ASPE
T Journals on June 14, 2018
dmd.aspetjournals.org
Dow
nloaded from

DMD # 65987
29
8. Footnotes
This work was supported by National Institutes of Health grants from the Office of
Dietary Supplements [P50 AT000155] and the National Center for Complementary and
Integrative Health [P50 AT000155, R01 AT007659].
This article has not been copyedited and formatted. The final version may differ from this version.DMD Fast Forward. Published on August 18, 2015 as DOI: 10.1124/dmd.115.065987
at ASPE
T Journals on June 14, 2018
dmd.aspetjournals.org
Dow
nloaded from
DMD # 65987
30
Figure Legends
Figure 1. UHPLC-MS/MS chromatograms of probe substrate metabolites (100 nM)
and their corresponding stable isotope–labeled internal standards (IS).
Figure 2. Linearity of substrate metabolite formation during the cocktail assay.
Metabolite formation is expressed as a percentage of the amount of metabolite at 20
min.
Figure 3. Inhibition curves of known inhibitors obtained using single substrates
and substrate cocktails. Each inhibitor was incubated in separate experiments with
single substrates or the substrate cocktail. The activity is expressed as a percentage of
remaining activity compared with the control containing no inhibitor. Experiments were
carried out three times.
Figure 4. Inhibition curves of a licorice root extract obtained using single
substrates or the substrate cocktail. Each inhibitor was incubated in separate
experiments with a single substrate or the substrate cocktail. The activity is shown as a
percentage of remaining activity compared with the control when no inhibitor was added.
Experiments were carried out three times.
This article has not been copyedited and formatted. The final version may differ from this version.DMD Fast Forward. Published on August 18, 2015 as DOI: 10.1124/dmd.115.065987
at ASPE
T Journals on June 14, 2018
dmd.aspetjournals.org
Dow
nloaded from

DMD # 65987
31
This article has not been copyedited and formatted. The final version may differ from this version.DMD Fast Forward. Published on August 18, 2015 as DOI: 10.1124/dmd.115.065987
at ASPE
T Journals on June 14, 2018
dmd.aspetjournals.org
Dow
nloaded from
DMD # 65987
32
Table 1. Km values and concentrations of CYP-specific probe substrates, and the MS/MS SRM transitions and collision
energies (CE) for substrate metabolites and stable isotope-labeled internal standards used in the cocktail assays.
Enzyme Substrate Km (µM) Conc
(µM) Metabolite
SRM transition
(polarity)
CE
(V) Internal standard
SRM transition
(polarity)
CE
(V)
CYP1A2 phenacetin 112.7 ± 10.9 100 acetaminophen 152.2>110.0 (+) -17 [d4]-acetaminophen 156.2>114.1 (+) -19
CYP2A6 coumarin 1.5 ± 0.2 1.5 7-hydroxycoumarin 161.1>133.1 (-) 23 [d5]-7-hydroxycoumarin 166.1>138.1 (-) 22
CYP2B6 bupropion 125.2 ± 14.0 12 hydroxybupropion 256.2>139.1 (+) -26 [d6]-hydroxybupropion 262.2>139.0 (+) -26
CYP2C8 amodiaquine 1.0 ± 0.1 1 N-desethylamodiaquine 328.1>283.0 (+) -21 [d5]-N-desethylamodiaquine 333.1>283.1 (+) -29
CYP2C9 tolbutamide 110.7 ± 11.6 100 hydroxytolbutamide 285.1>186.0 (-) 18 [d9]-hydroxytolbutamide 294.2>186.0 (-) 18
CYP2C19 (S)-mephenytoin 52.5 ± 10.6 50 (±)-4'-hydroxymephenytoin 235.1>133.1 (+) -18 [d3]-(±)-4'-hydroxymephenytoin 238.1>133.1 (+) -22
CYP2D6 dextromethorphan 2.9 ± 0.5 2.5 dextrorphan 258.1>157.0 (+) -37 [d3]-dextrorphan 261.2>157.1 (+) -40
CYP2E1 chlorzoxazone 149.8 ± 12.6 15 6-hydroxychlorzoxazone 184.0>120.0 (-) 18 [d2]-6-hydroxychlorzoxazone 186.2>122.0 (-) 18
CYP3A4/5 midazolam 2.7 ± 0.1 2.5 1'-hydroxymidazolam 342.1>324.0 (+) -21 [13C3]-1'-hydroxymidazolam 347.2>329.0 (+) -22
testosterone 50.5 ± 5.6 50 6β-hydroxytestosterone 305.2>269.2 (+) -18 [d7]-6β-hydroxytestosterone 312.2>276.2 (+) -16
This article has not been copyedited and form
atted. The final version m
ay differ from this version.
DM
D Fast Forw
ard. Published on August 18, 2015 as D
OI: 10.1124/dm
d.115.065987 at ASPET Journals on June 14, 2018 dmd.aspetjournals.org Downloaded from
DMD # 65987
33
Table 2. Comparison of IC50 values of known inhibitors obtained using the single substrate approach, the new cocktail
approach and literature values.
Substrate Inhibitor
single
substrate
IC50 (µM) ± SD
Cocktail
IC50 (µM) ± SD literature IC50 (µM)
CYP1A2 phenacetin furafylline 3.70 ± 1.00 3.58 ± 0.49
0.48-13.88 (Eagling et al., 1998; Testino and
Patonay, 2003; Walsky and Obach, 2004; Zientek
et al., 2008; Otten et al., 2011; Kozakai et al.,
2012; Liu et al., 2015)
CYP2A6 coumarin methoxsalen 0.40 ± 0.03 0.48 ± 0.05 0.21-2.11 (Kim et al., 2005; Workman and
Raynaud, 2007; Kozakai et al., 2012)
CYP2B6 bupropion ticlopidine 0.70 ± 0.08 1.06 ± 0.10 0.1 -0.78 (Turpeinen et al., 2005; Otten et al.,
2011)
CYP2C8 amodiaquine quercetin 5.92 ± 0.54 3.40 ± 0.32 1.09-7.00 (Dierks et al., 2001; Walsky and Obach,
2004; Otten et al., 2011; Liu et al., 2015)
CYP2C9 tolbutamide sulfaphenazole 0.53 ± 0.06 0.90 ± 0.10
0.069-1.30 (Eagling et al., 1998; Shader et al.,
1999; Testino and Patonay, 2003; Workman and
Raynaud, 2007; Zientek et al., 2008; Otten et al.,
2011; Kozakai et al., 2012; Yao et al., 2012; Qin
This article has not been copyedited and form
atted. The final version m
ay differ from this version.
DM
D Fast Forw
ard. Published on August 18, 2015 as D
OI: 10.1124/dm
d.115.065987 at ASPET Journals on June 14, 2018 dmd.aspetjournals.org Downloaded from
DMD # 65987
34
et al., 2014; Liu et al., 2015)
CYP2C19 (S)-mephenytoin ticlopidine 3.40 ± 0.32 5.81 ± 0.80
0.86-4.46 (Giancarlo et al., 2001; Zientek et al.,
2008; Yao et al., 2012; Qin et al., 2014; Liu et al.,
2015)
CYP2D6 dextromethorphan quinidine 0.46 ± 0.02 0.84 ± 0.10
0.009-0.52 (Shader et al., 1999; Testino and
Patonay, 2003; Walsky and Obach, 2004; Zientek
et al., 2008; Otten et al., 2011; Kozakai et al.,
2012; Yao et al., 2012; Qiao et al., 2014; Qin et
al., 2014; Liu et al., 2015)
CYP3A4/5 midazolam ketoconazole 0.094 ± 0.006 0.115 ± 0.056
0.01-0.13 (Patki et al., 2003; Walsky and Obach,
2004; Workman and Raynaud, 2007; Otten et al.,
2011; Kozakai et al., 2012; Yao et al., 2012; Qiao
et al., 2014; Qin et al., 2014; Liu et al., 2015)
testosterone
0.062 ± 0.004 0.054 ± 0.002
0.008-0.0477 (Eagling et al., 1998; Patki et al.,
2003; Walsky and Obach, 2004; Kozakai et al.,
2012; Yao et al., 2012; Qiao et al., 2014)
CYP2E1 chlorzoxazone diethyl-
dithiocarbamate 12.42 ± 1.70 22.58 ± 5.60
9.8-16.6 (Eagling et al., 1998; Shader et al., 1999;
Workman and Raynaud, 2007)
This article has not been copyedited and form
atted. The final version m
ay differ from this version.
DM
D Fast Forw
ard. Published on August 18, 2015 as D
OI: 10.1124/dm
d.115.065987 at ASPET Journals on June 14, 2018 dmd.aspetjournals.org Downloaded from
DMD # 65987
35
Table 3. IC50 values for inhibition of CYP enzymes by a licorice extract (G. glabra)
obtained using the single substrate approach or the new cocktail approach and
comparison with literature values.
Enzyme Substrate Single substrate IC50
(µg/mL)
Cocktail IC50
(µg/mL)
CYP1A2 phenacetin > 100 83.04 ± 16.96
CYP2A6 coumarin > 100 > 100
CYP2B6 bupropion 15.59 ± 1.79 19.58 ± 1.80
CYP2C8 amodiaquine 14.36 ± 2.62 17.06 ± 1.54
CYP2C9 tolbutamide 8.80 ± 1.20 12.36 ± 1.14
CYP2C19 (S)-mephenytoin 12.80 ± 2.34 19.68 ± 2.70
CYP2D6 dextromethorphan 73.38 ± 11.72 > 100
CYP3A4/5 midazolam > 100 > 100
testosterone 35.00 ± 4.81 55.64 ± 18.49
CYP2E1 chlorzoxazone > 100 > 100
This article has not been copyedited and formatted. The final version may differ from this version.DMD Fast Forward. Published on August 18, 2015 as DOI: 10.1124/dmd.115.065987
at ASPE
T Journals on June 14, 2018
dmd.aspetjournals.org
Dow
nloaded from
0.5 1.0 1.5 2.0 2.5 3.00
5x10⁴
1x10⁵
CYP1A2m/z 152.2>110.0 (+)m/z 156.2>114.1 (+)
0.5 1.0 1.5 2.0 2.5 3.00
2.5x10⁵
5x10⁵CYP2B6
m/z 256.2>139.1 (+)m/z 262.2>139.1 (+) 1
0.5 1.0 1.5 2.0 2.5 3.
0
5x10⁵
1x10⁶
1.5x10⁶ CYP2C9m/z 285.1>186.0 (-)m/z 294.2>186.0 (-)
0.5 1.0 1.5 2.0 2.5 3.
0
1x10⁶
3x10⁶
CYP2D6m/z 258.1>157.0 (+)m/z 261.2>157.1 (+)
0.5 1.0 1.5 2.0 2.5 3.0
2500
5000
7500 CYP3A4/5 6β-hydroxytestosteronem/z 305.20>269.20 (+)m/z 312.20>276.20 (+)
SR
M M
S/M
S r
espo
nse
Retent
Figure 1
3.0
3.0
0.5 1.0 1.5 2.0 2.5 3.00
5x10⁴
1x10⁵
1.5x10⁵CYP2A6
m/z 161.1>133.1 (-)m/z 166.1>138.1 (-)
0.5 1.0 1.5 2.0 2.5 3.00
5x10⁵
1.5x10⁶
CYP2C8m/z 328.1>283.0 (+)m/z 333.1>283.1 (+)
3.0 0.5 1.0 1.5 2.0 2.5 3.00
5x10³
1x10⁴
1.5x10⁴ CYP2C19m/z 235.1>133.1 (+)m/z 238.1>133.1 (+)
3.0 0.5 1.0 1.5 2.0 2.5 3.00
1x10⁶
3x10⁶ m/z 342.1>324.1 (+)m/z 347.2>329.0 (+)
CYP3A4/5 1’-hydroxymidazolam
3.0 0.5 1.0 1.5 2.0 2.5 3.00
1x10⁴
2x10⁴
3x10⁴ CYP2E1m/z 184.0>120.0 (-)m/z 186.2>122.0 (-)
ntion time (min)
This article has not been copyedited and formatted. The final version may differ from this version.DMD Fast Forward. Published on August 18, 2015 as DOI: 10.1124/dmd.115.065987
at ASPE
T Journals on June 14, 2018
dmd.aspetjournals.org
Dow
nloaded from
0
20
40
60
80
100
120
0 5 10
% M
etab
olite
form
atio
n
Incuba
A
0
20
40
60
80
100
120
0 5 10
% M
etab
olite
form
atio
n
Incub
B
Figure 2
15 20 25ubation time (min)
CYP1A2CYP2B6CYP2C9CYP2C19CYP2D6CYP2E1
15 20 25ubation time (min)
CYP2A6
CYP2C8
CYP3A4/5 testosteroneCYP3A4/5 midazolam
This article has not been copyedited and formatted. The final version may differ from this version.DMD Fast Forward. Published on August 18, 2015 as DOI: 10.1124/dmd.115.065987
at ASPE
T Journals on June 14, 2018
dmd.aspetjournals.org
Dow
nloaded from
log [furafyll
-3 -2 -1
% c
on
tro
l act
ivity
0
20
40
60
80
100
120
single substrate IC50=3.70 μMcocktail IC50=3.58 μM
CYP2B6
log [ticlopidine] log μM
-2 -1 0 1 2 3
% c
on
tro
l act
ivity
0
20
40
60
80
100
120
single substrate IC50=0.70 μM
cocktail IC50=1.06 μM
log [querce
-2 -1 0
% c
on
tro
l act
ivity
0
20
40
60
80
100
120
single substrate IC50=5.92 μM
cocktail IC50=3.40 μM
CYP2C19
log [ticlopidine] log μM
-2 -1 0 1 2 3
% c
on
tro
l act
ivity
0
20
40
60
80
100
120
single substrate IC50=3.40 μM
cocktail IC50=5.81 μM
log [quin
-3 -2 -1
% c
on
tro
l act
ivity
0
20
40
60
80
100
120
single substrate IC50=0.46 μ
cocktail IC50=0.84 μM
CYP3A4/5 (Midazolam)
log [ketoconazole] log μM
-3 -2 -1 0 1 2
% c
on
tro
l act
ivity
0
20
40
60
80
100
single substrate IC50=0.094 μM
cocktail IC50=0.115 μM
log [keto
-3 -2 -1
% c
on
tro
l act
ivity
0
20
40
60
80
100
120
single substrate IC50=0.062
cocktail IC50=0.054 μM
CYP2A6
log [methoxsalen] log μM
-3 -2 -1 0 1 2 3
% c
on
tro
l act
ivity
0
20
40
60
80
100
120
single substrate IC50=0.40 μM
cocktail IC50=0.48 μM
CYP1A2
fylline] log μM
0 1 2 3
CYP2C8
cetin] log μM
1 2 3
CYP2C9
log [sulfaphenazole] log μM
-2 -1 0 1 2 3
% c
on
tro
l act
ivity
0
20
40
60
80
100
120
single substrate IC50=0.53 μM
cocktail IC50=0.90 μM
CYP2D6
uinidine] log μM
0 1 2 3
μM
CYP3A4/5 (Testosterone)
toconazole] log μM
0 1 2 3
62 μM
CYP2E1
log [diethyldithiocarbamate] log μM
-2 -1 0 1 2 3 4
% c
on
tro
l act
ivity
0
20
40
60
80
100
120
single substrate IC50=12.42 μM
cocktail IC50=22.58 μM
Figure 3
This article has not been copyedited and formatted. The final version may differ from this version.DMD Fast Forward. Published on August 18, 2015 as DOI: 10.1124/dmd.115.065987
at ASPE
T Journals on June 14, 2018
dmd.aspetjournals.org
Dow
nloaded from

log [GG
-3 -2 -1
% c
on
tro
l act
ivity
0
20
40
60
80
100
120
single substrate IC50>100 μcocktail IC50=83.04 μg/mL
CYP2B6
log [GG] log μg/mL
-3 -2 -1 0 1 2 3
% c
on
tro
l act
ivity
0
20
40
60
80
100
120
single substrate IC50=15.59 μg/mL
cocktail IC50=19.58 μg/mL
log [GG
-3 -2 -1 0
% c
on
tro
l act
ivity
0
20
40
60
80
100
120
single substrate IC50=14.36 μ
cocktail IC50=17.06 μg/mL
CYP2C19
log [GG] log μg/mL
-3 -2 -1 0 1 2 3
% c
on
tro
l act
ivity
0
20
40
60
80
100
120
single substrate IC50=12.80 μg/mL
cocktail IC50=19.68 μg/mL
log [GG
-3 -2 -1
% c
on
tro
l act
ivity
0
20
40
60
80
100
120
single substrate IC50=73.38 μ
cocktail IC50>100 μg/mL
log [GG
-3 -2 -1 0
% c
on
tro
l act
ivity
0
20
40
60
80
100
120
single substrate IC50>100 μg/m
cocktail IC50>100 μg/mL
CYP3A4/5 (Testosterone)
log [GG] log μg/mL
-3 -2 -1 0 1 2 3
% c
on
tro
l act
ivity
0
20
40
60
80
100
120
single substrate IC50=35.00 μg/mL
cocktail IC50=55.64 μg/mL
CYP1A2
[GG] log μg/mL
0 1 2 3
μg/mL
CYP2A6
log [GG] log μg/mL
-3 -2 -1 0 1 2 3
% c
on
tro
l act
ivity
0
20
40
60
80
100
120
single substrate IC50>100 μg/mL
cocktail IC50>100 μg/mL
CYP2C8
G] log μg/mL
0 1 2 3
μg/mL
CYP2C9
log [GG] log μg/mL
-3 -2 -1 0 1 2 3
% c
on
tro
l act
ivity
0
20
40
60
80
100
120
single substrate IC50=8.80 μg/mL
cocktail IC50=12.36 μg/mL
CYP2D6
GG] log μg/mL
0 1 2 3
8 μg/mL
CYP3A4/5 (Midazolam)
G] log μg/mL
0 1 2 3
g/mL
CYP2E1
log [GG] log μg/mL
-3 -2 -1 0 1 2 3
% c
on
tro
l act
ivity
0
20
40
60
80
100
120
single substrate IC50>100 μg/mL
cocktail IC50>100 μg/mL
Figure 4
This article has not been copyedited and formatted. The final version may differ from this version.DMD Fast Forward. Published on August 18, 2015 as DOI: 10.1124/dmd.115.065987
at ASPE
T Journals on June 14, 2018
dmd.aspetjournals.org
Dow
nloaded from