downloaded from 1 alendronate vs. risedronate comparison trial
Post on 19-Dec-2015
216 views
TRANSCRIPT
1
Downloaded from www.fosamax.ae
Alendronate vs. RisedronateAlendronate vs. RisedronateComparison TrialComparison Trial
Alendronate vs. RisedronateAlendronate vs. RisedronateComparison TrialComparison Trial
2
Downloaded from www.fosamax.ae
Alendronate vs. Risedronate Comparison TrialAlendronate vs. Risedronate Comparison TrialAlendronate vs. Risedronate Comparison TrialAlendronate vs. Risedronate Comparison Trial
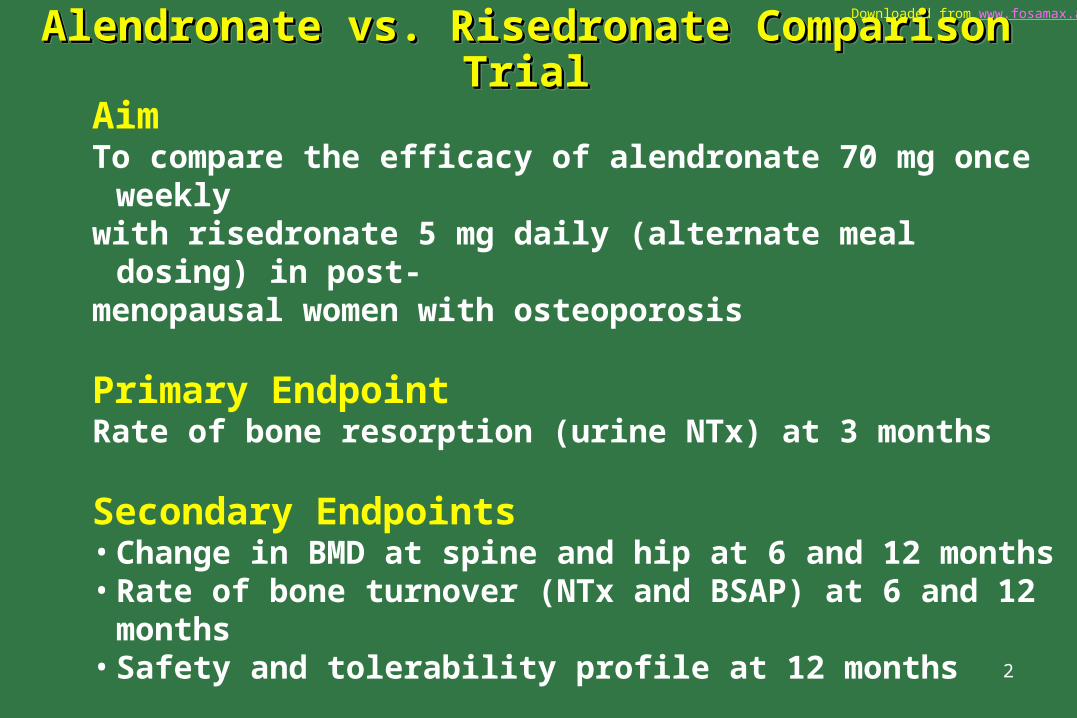
AimTo compare the efficacy of alendronate 70 mg once weekly with risedronate 5 mg daily (alternate meal dosing) in post- menopausal women with osteoporosis
Primary EndpointRate of bone resorption (urine NTx) at 3 months
Secondary Endpoints• Change in BMD at spine and hip at 6 and 12 months• Rate of bone turnover (NTx and BSAP) at 6 and 12 months• Safety and tolerability profile at 12 months
NTx = N-telopeptides of type 1 collagen BSAP = bone-specific alkaline phosphataseHosking et al Curr Med Res Opin 2003;19(5):383-394.
3
Downloaded from www.fosamax.ae
• First head-to-head study comparing alendronate and risedronate for treatment of osteoporosis
• Endpoints– Biochemical markers of bone turnover
– BMD at spine and hip
• First head-to-head study comparing alendronate and risedronate for treatment of osteoporosis
• Endpoints– Biochemical markers of bone turnover
– BMD at spine and hip
Alendronate vs. Risedronate Comparison TrialAlendronate vs. Risedronate Comparison Trial
OverviewOverview
Hosking et al Curr Med Res Opin 2003;19(5):383-394.
4
Downloaded from www.fosamax.ae
Alendronate vs. Risedronate Comparison TrialAlendronate vs. Risedronate Comparison Trial
ParticipantsParticipants
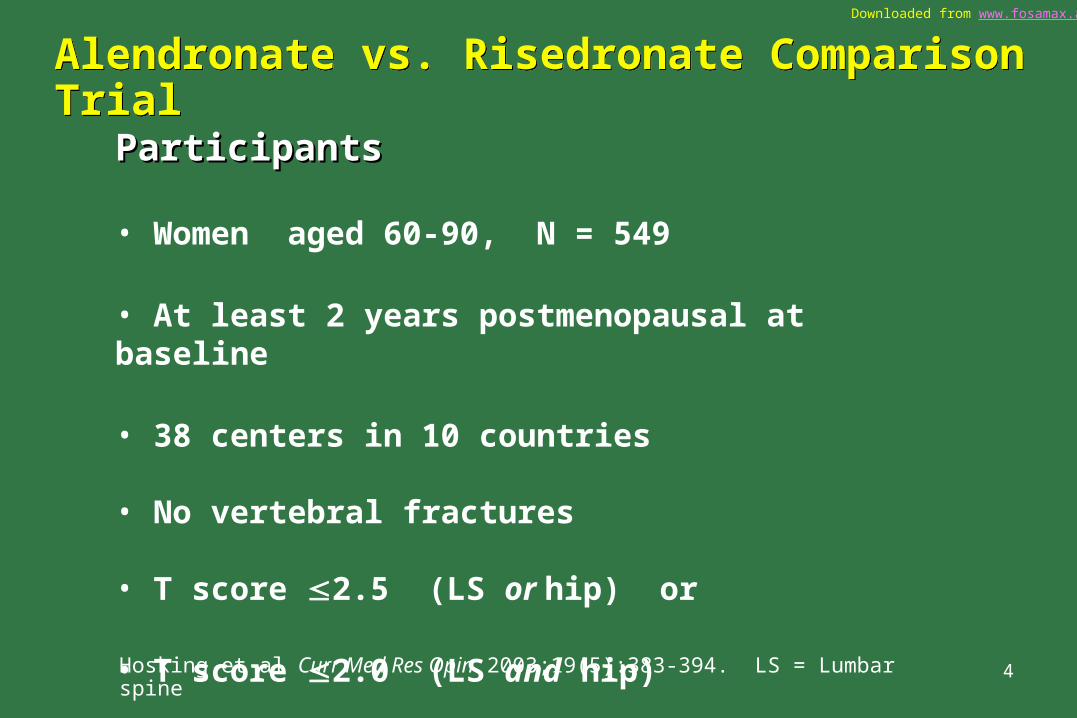
• Women aged 60-90, N = 549
• At least 2 years postmenopausal at baseline
• 38 centers in 10 countries
• No vertebral fractures
• T score 2.5 (LS or hip) or
• T score 2.0 (LS and hip)
Hosking et al Curr Med Res Opin 2003;19(5):383-394. LS = Lumbar spine
5
Downloaded from www.fosamax.ae
Alendronate vs. Risedronate Comparison TrialAlendronate vs. Risedronate Comparison Trial
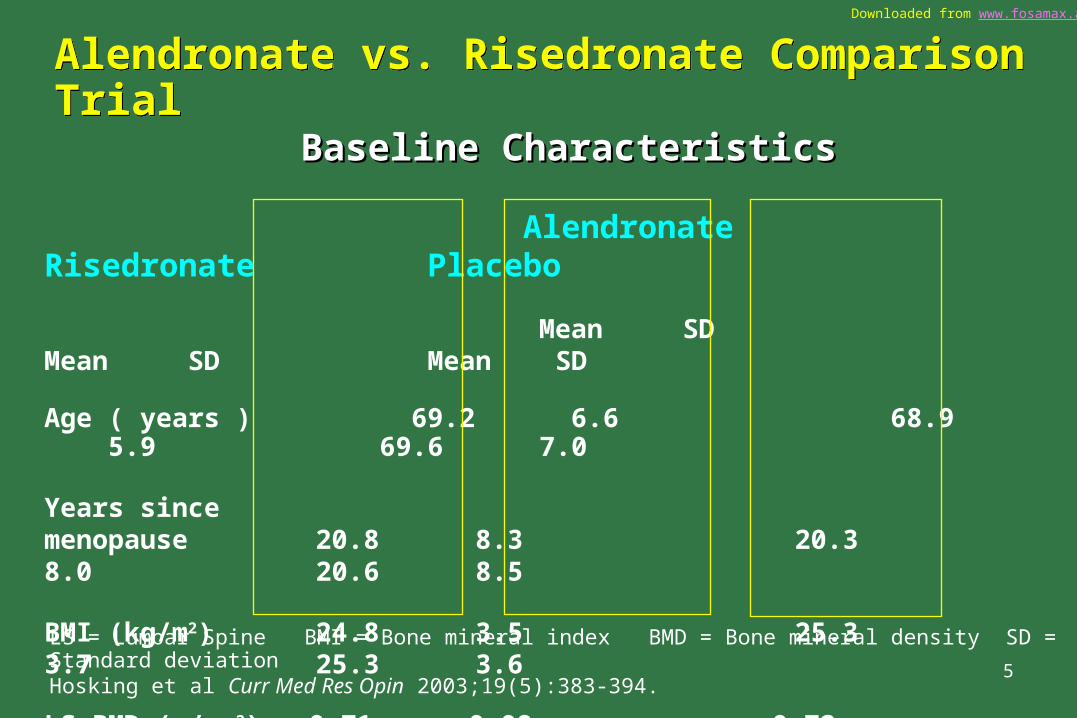
Alendronate Risedronate Placebo
Mean SD Mean SD Mean SD
Age ( years ) 69.2 6.6 68.9 5.9 69.6 7.0
Years sincemenopause 20.8 8.3 20.3 8.0 20.6 8.5 BMI (kg/m2) 24.8 3.5 25.3 3.7 25.3 3.6
LS BMD (g/cm2) 0.71 0.08 0.72 0.08 0.73 0.07(Hologic)
LS = Lumbar Spine BMI = Bone mineral index BMD = Bone mineral density SD = Standard deviationHosking et al Curr Med Res Opin 2003;19(5):383-394.
Baseline CharacteristicsBaseline Characteristics
6
Downloaded from www.fosamax.ae
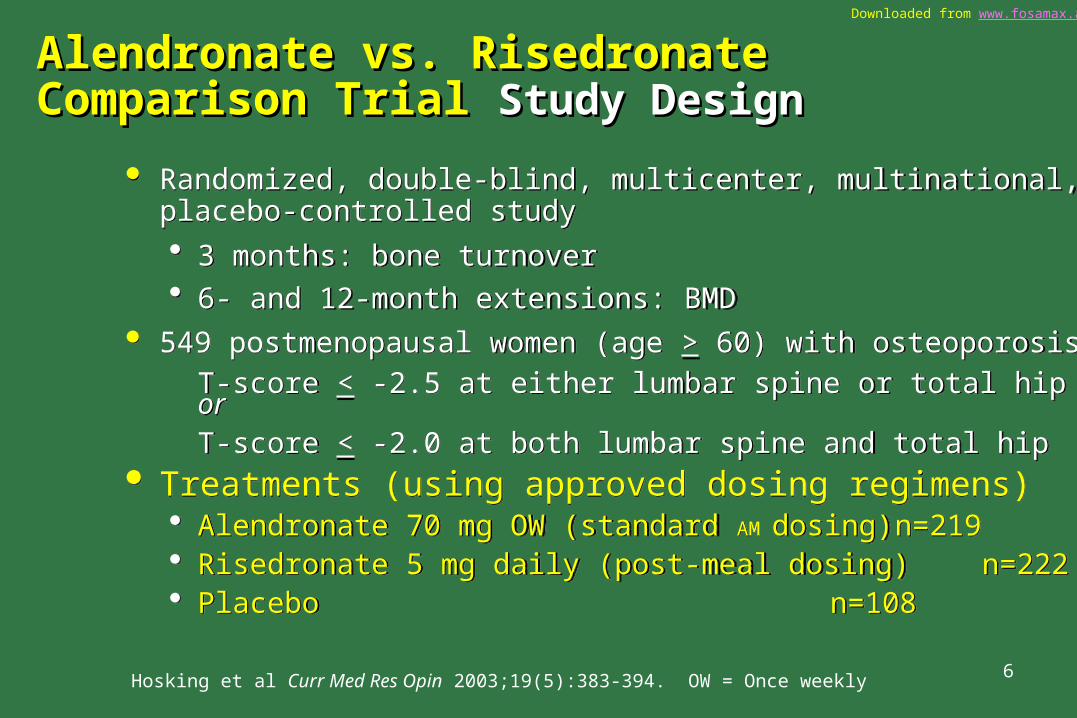
Randomized, double-blind, multicenter, multinational, placebo-controlled study 3 months: bone turnover 6- and 12-month extensions: BMD
549 postmenopausal women (age > 60) with osteoporosis
T-score < -2.5 at either lumbar spine or total hip orT-score < -2.0 at both lumbar spine and total hip
Treatments (using approved dosing regimens) Alendronate 70 mg OW (standard AM dosing) n=219 Risedronate 5 mg daily (post-meal dosing) n=222 Placebo n=108
Alendronate vs. Risedronate Comparison Trial Alendronate vs. Risedronate Comparison Trial Study DesignStudy Design
Hosking et al Curr Med Res Opin 2003;19(5):383-394. OW = Once weekly
7
Downloaded from www.fosamax.ae
Alendronate vs. Risedronate Comparison Trial Alendronate vs. Risedronate Comparison Trial Dosing RegimensDosing RegimensAlendronate vs. Risedronate Comparison Trial Alendronate vs. Risedronate Comparison Trial Dosing RegimensDosing Regimens
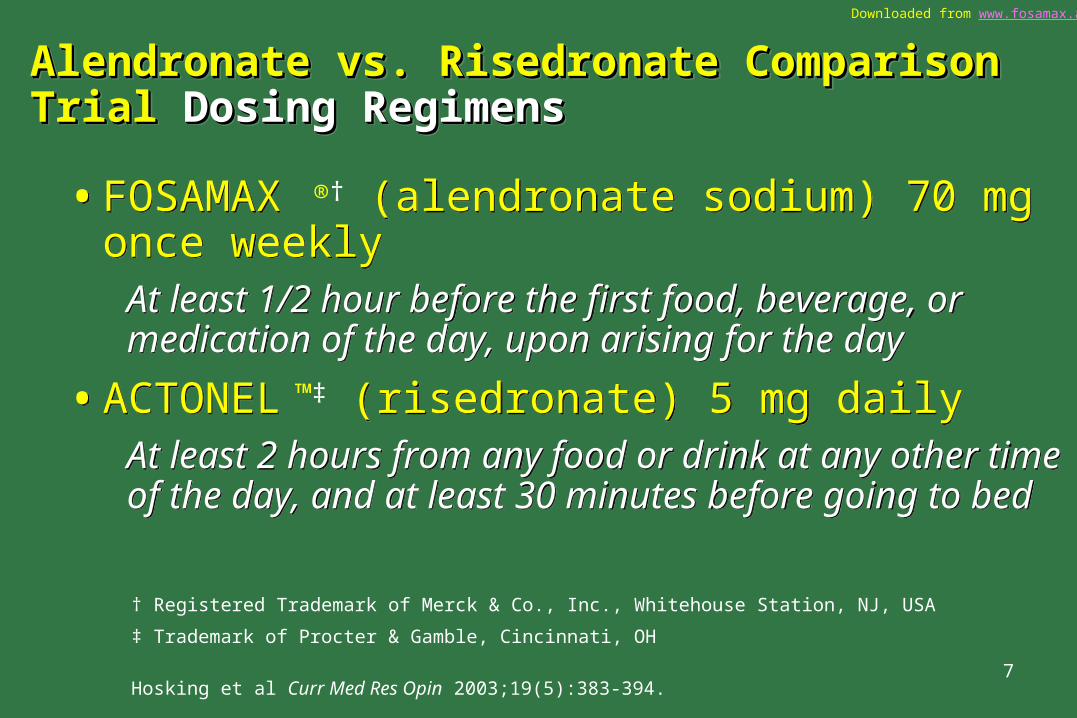
• FOSAMAX (alendronate sodium) 70 mg once weekly
At least 1/2 hour before the first food, beverage, or medication of the day, upon arising for the day
• ACTONEL (risedronate) 5 mg dailyAt least 2 hours from any food or drink at any other time of the day, and at least 30 minutes before going to bed
• FOSAMAX (alendronate sodium) 70 mg once weekly
At least 1/2 hour before the first food, beverage, or medication of the day, upon arising for the day
• ACTONEL (risedronate) 5 mg dailyAt least 2 hours from any food or drink at any other time of the day, and at least 30 minutes before going to bed
† Registered Trademark of Merck & Co., Inc., Whitehouse Station, NJ, USA
‡ Trademark of Procter & Gamble, Cincinnati, OH
Hosking et al Curr Med Res Opin 2003;19(5):383-394.
®†
™‡
8
Downloaded from www.fosamax.ae
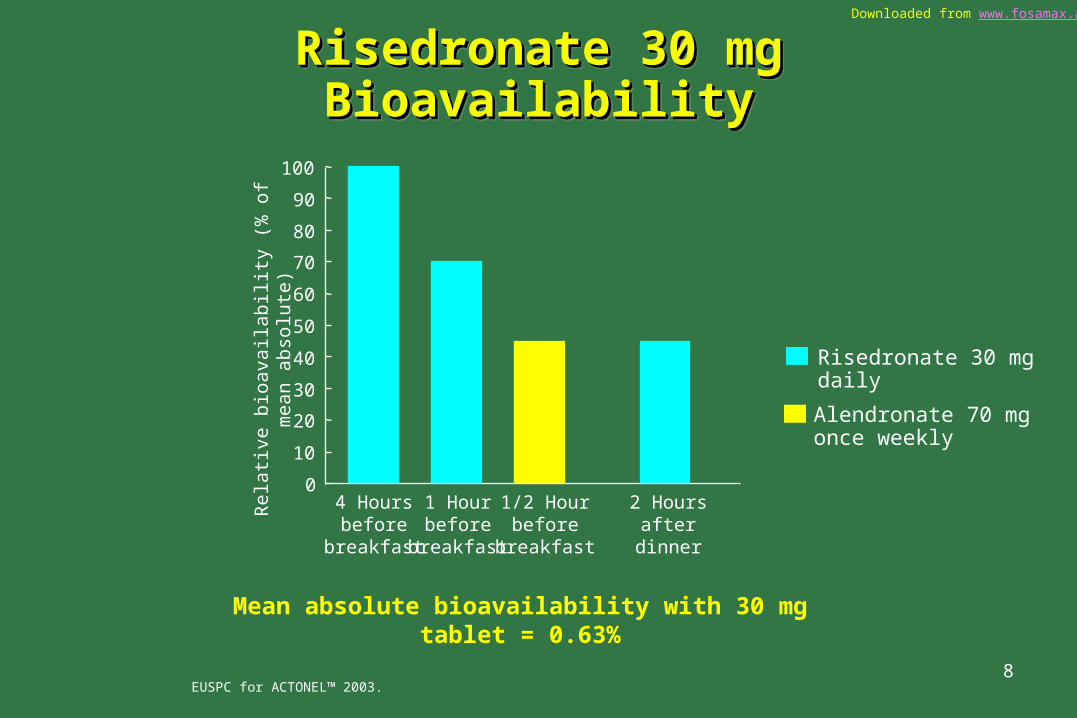
Risedronate 30 mg BioavailabilityRisedronate 30 mg BioavailabilityRisedronate 30 mg BioavailabilityRisedronate 30 mg Bioavailability
EUSPC for ACTONEL™ 2003.
0
10
20
30
40
50
60
70
80
90
100
4 Hoursbefore
breakfast
1 Hourbefore
breakfast
1/2 Hourbefore
breakfast
2 Hoursafter
dinner
Mean absolute bioavailability with 30 mg tablet = 0.63%
Rel
ativ
e b
ioav
aila
bilit
y (%
of
mea
n a
bso
lute
)
Risedronate 30 mg daily
Alendronate 70 mg once weekly
9
Downloaded from www.fosamax.ae
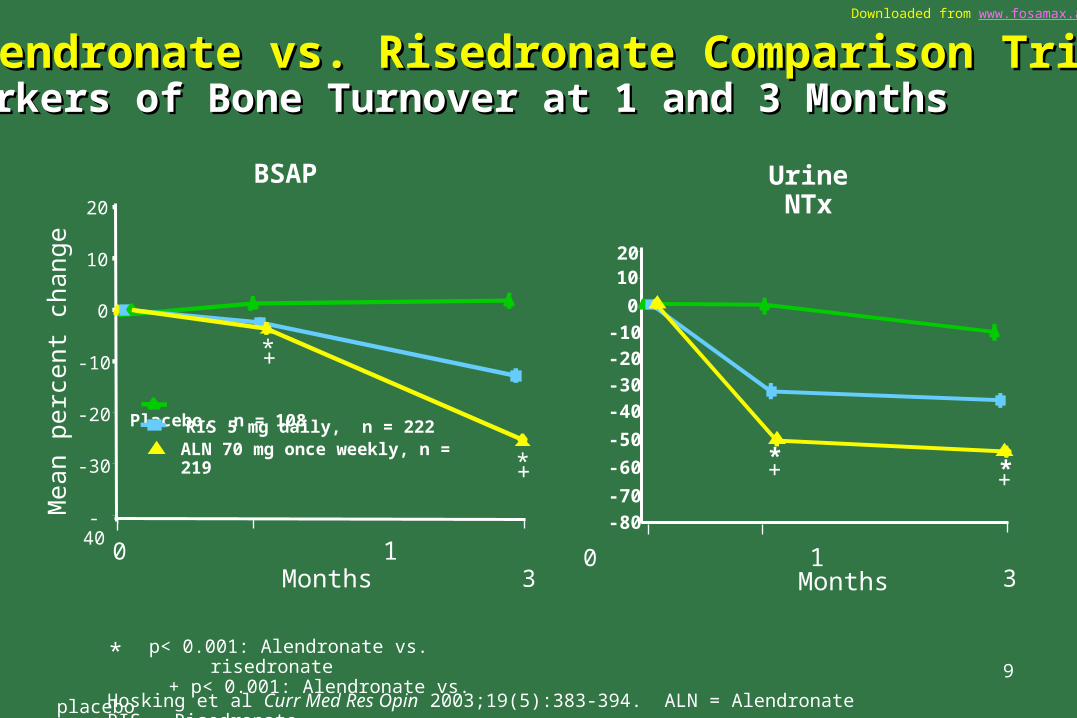
Alendronate vs. Risedronate Comparison TrialAlendronate vs. Risedronate Comparison TrialMarkers of Bone Turnover at 1 and 3 MonthsMarkers of Bone Turnover at 1 and 3 Months
p< 0.001: Alendronate vs. risedronate + p< 0.001: Alendronate vs. placebo
Mea
n pe
rcen
t cha
nge
Placebo, n = 108
RIS 5 mg daily, n = 222ALN 70 mg once weekly, n = 219
BSAP 20
10
0
-10
-20
-30
-40
Months0 1 3
*
Urine NTx
Months
20
0
-10
-20
-30
-40
-50
-60
-70
-80
0 1 3
* *+ +
*+
+
Hosking et al Curr Med Res Opin 2003;19(5):383-394. ALN = Alendronate RIS = Risedronate
10
*

10
Downloaded from www.fosamax.ae
Alendronate vs. Risedronate Comparison TrialAlendronate vs. Risedronate Comparison Trial BSAP at 3, 6, and 12 Monthsat 3, 6, and 12 MonthsAlendronate vs. Risedronate Comparison TrialAlendronate vs. Risedronate Comparison Trial BSAP at 3, 6, and 12 Monthsat 3, 6, and 12 Months
Placebo, n = 108 RIS 5 mg daily, n = 222 ALN 70 mg once weekly, n = 219
Months
-40
-60
-20
0
0 3 6 12
Mea
n p
erce
nt
chan
ge
p<0.001: Alendronate vs. risedronate
+ p<0.001: Alendronate vs. placebo
* *
+
+
+
Hosking et al Curr Med Res Opin 2003;19(5):383-394.
*
*
11
Downloaded from www.fosamax.ae
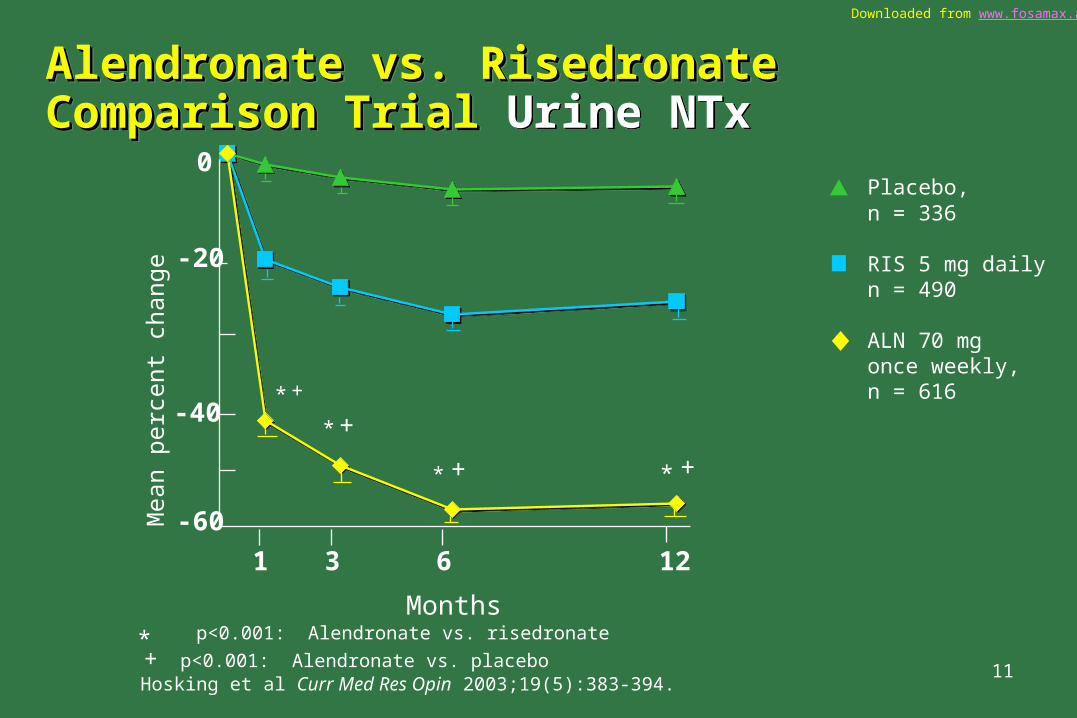
Alendronate vs. Risedronate Comparison TrialAlendronate vs. Risedronate Comparison Trial Urine NTxAlendronate vs. Risedronate Comparison TrialAlendronate vs. Risedronate Comparison Trial Urine NTx
0
-20
-40
-60
1 3 6 12
Mea
n pe
rcen
t ch
ange
p<0.001: Alendronate vs. risedronate
+ p<0.001: Alendronate vs. placebo Hosking et al Curr Med Res Opin 2003;19(5):383-394.
++
++
**
*
*
Placebo, n = 336
RIS 5 mg dailyn = 490
ALN 70 mg once weekly, n = 616
Months*
12
Downloaded from www.fosamax.ae
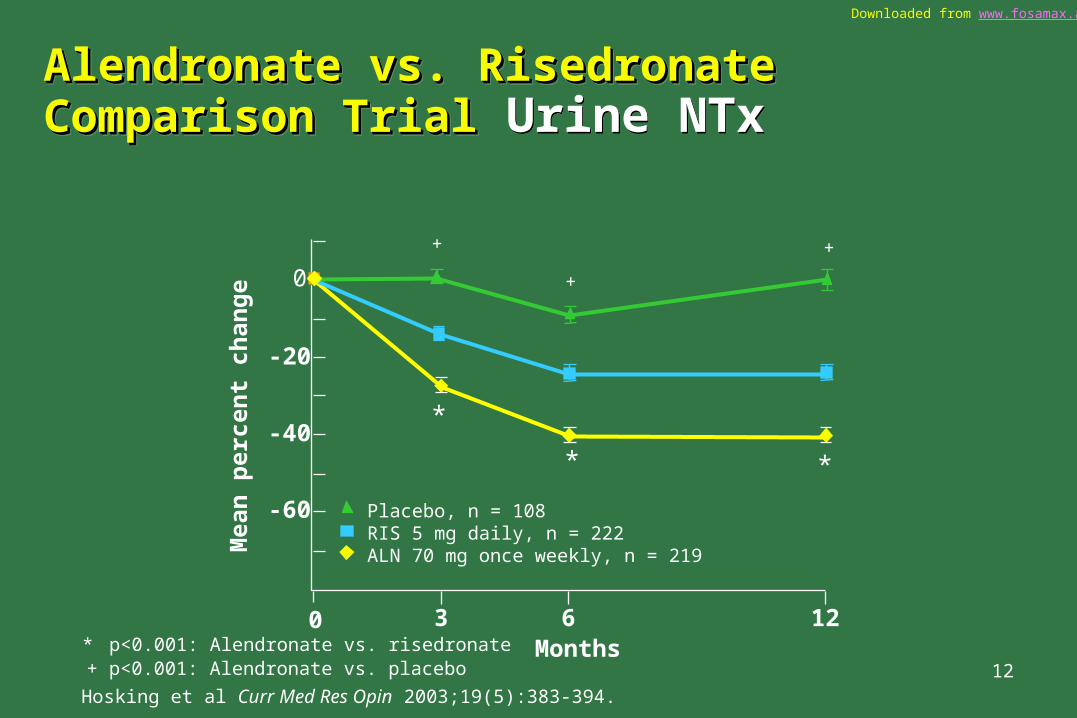
Alendronate vs. Risedronate Comparison TrialAlendronate vs. Risedronate Comparison Trial Urine NTx Alendronate vs. Risedronate Comparison TrialAlendronate vs. Risedronate Comparison Trial Urine NTx
Placebo, n = 108 RIS 5 mg daily, n = 222 ALN 70 mg once weekly, n = 219
Months
-40
-60
-20
0
0 3 6 12
Mea
n p
erce
nt
chan
ge
* p<0.001: Alendronate vs. risedronate + p<0.001: Alendronate vs. placebo
*
+
+
+
Hosking et al Curr Med Res Opin 2003;19(5):383-394.
*
*
Downloaded from www.fosamax.ae
13
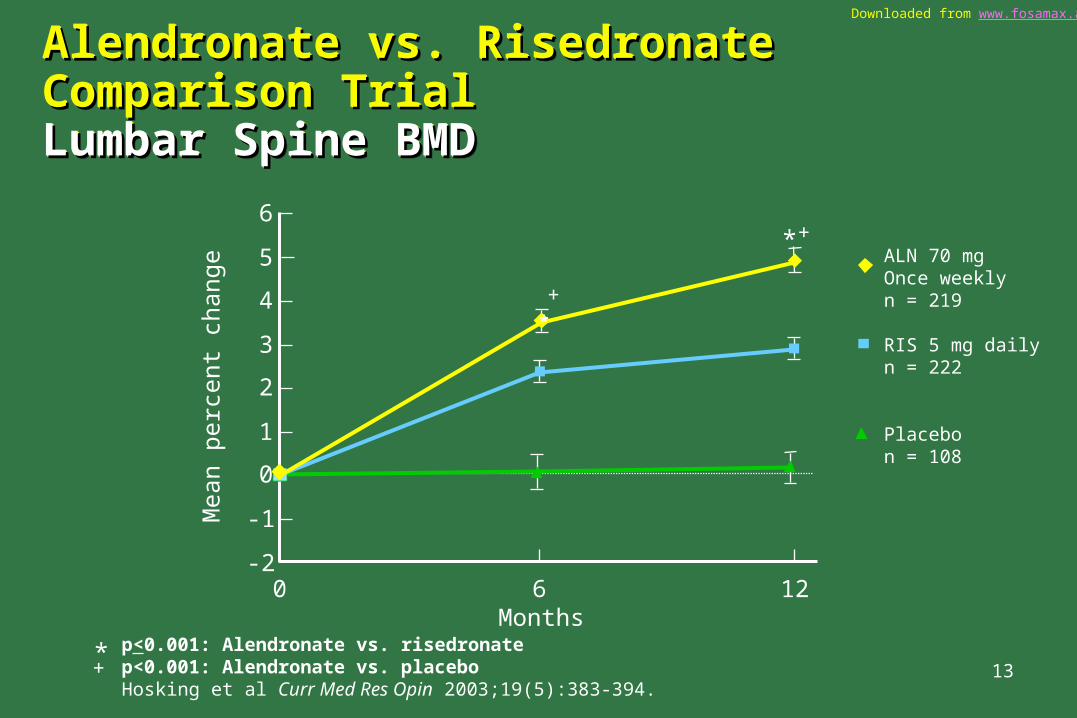
Alendronate vs. Risedronate Comparison TrialAlendronate vs. Risedronate Comparison TrialLumbar Spine BMDLumbar Spine BMDAlendronate vs. Risedronate Comparison TrialAlendronate vs. Risedronate Comparison TrialLumbar Spine BMDLumbar Spine BMD
Months p<0.001: Alendronate vs. risedronate p<0.001: Alendronate vs. placebo Hosking et al Curr Med Res Opin 2003;19(5):383-394.
Mea
n pe
rcen
t ch
ange
1
-1
2
0
3
4
5
6
-260 12
ALN 70 mgOnce weeklyn = 219
RIS 5 mg daily n = 222
Placebon = 108
*
+
*
+*
+

14
Downloaded from www.fosamax.ae
Months p<0.001: Alendronate vs. risedronate+ p<0.001: Alendronate vs. placebo
6
1
-1
2
0
3
4
5
6
-20 12
ALN 70 mgOnce weeklyn = 219
RIS 5 mg Dailyn = 222
Placebon = 108
Mea
n pe
rcen
t ch
ange *+
Alendronate vs. Risedronate Comparison TrialAlendronate vs. Risedronate Comparison TrialHip Trochanter BMDHip Trochanter BMDAlendronate vs. Risedronate Comparison TrialAlendronate vs. Risedronate Comparison TrialHip Trochanter BMDHip Trochanter BMD
*+
Hosking et al Curr Med Res Opin 2003;19(5):383-394.
*
15
Downloaded from www.fosamax.ae
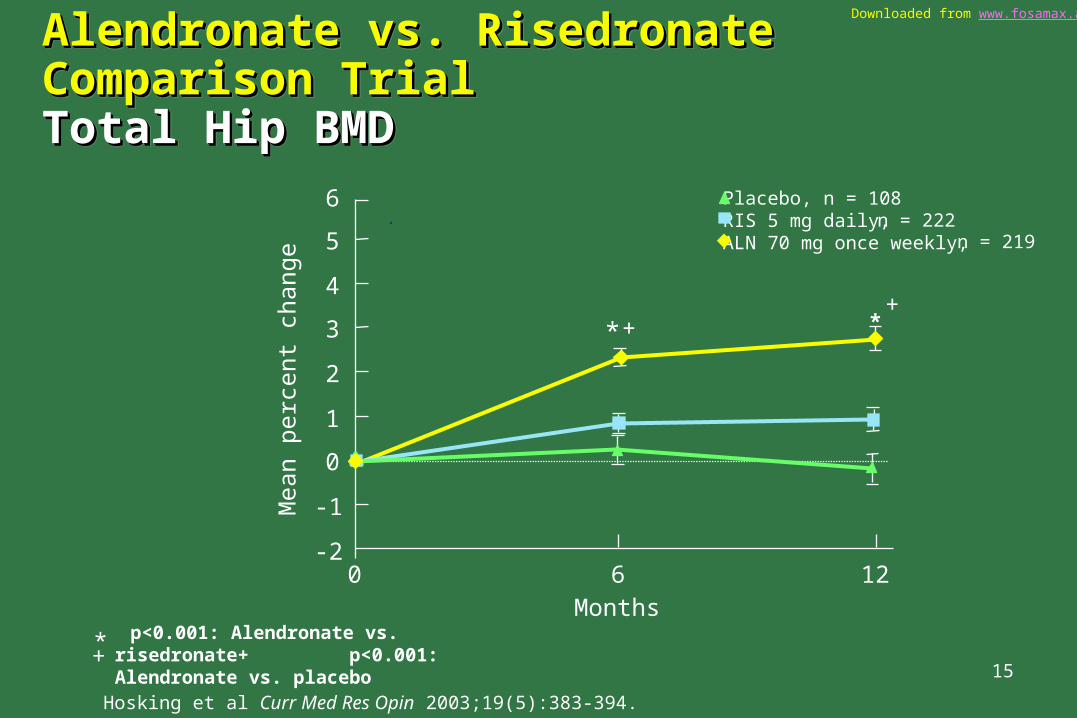
p<0.001: Alendronate vs. risedronate+ p<0.001: Alendronate vs. placebo
Alendronate vs. Risedronate Comparison TrialAlendronate vs. Risedronate Comparison TrialTotal Hip BMDTotal Hip BMDAlendronate vs. Risedronate Comparison TrialAlendronate vs. Risedronate Comparison TrialTotal Hip BMDTotal Hip BMD
Months6
1
-1
2
0
3
4
5
-20 12
Mea
n pe
rcen
t ch
ange
Placebo, n = 108RIS 5 mg daily,ALN 70 mg once weekly,
6
*
n = 222n = 219
++*
Hosking et al Curr Med Res Opin 2003;19(5):383-394.
*+
16
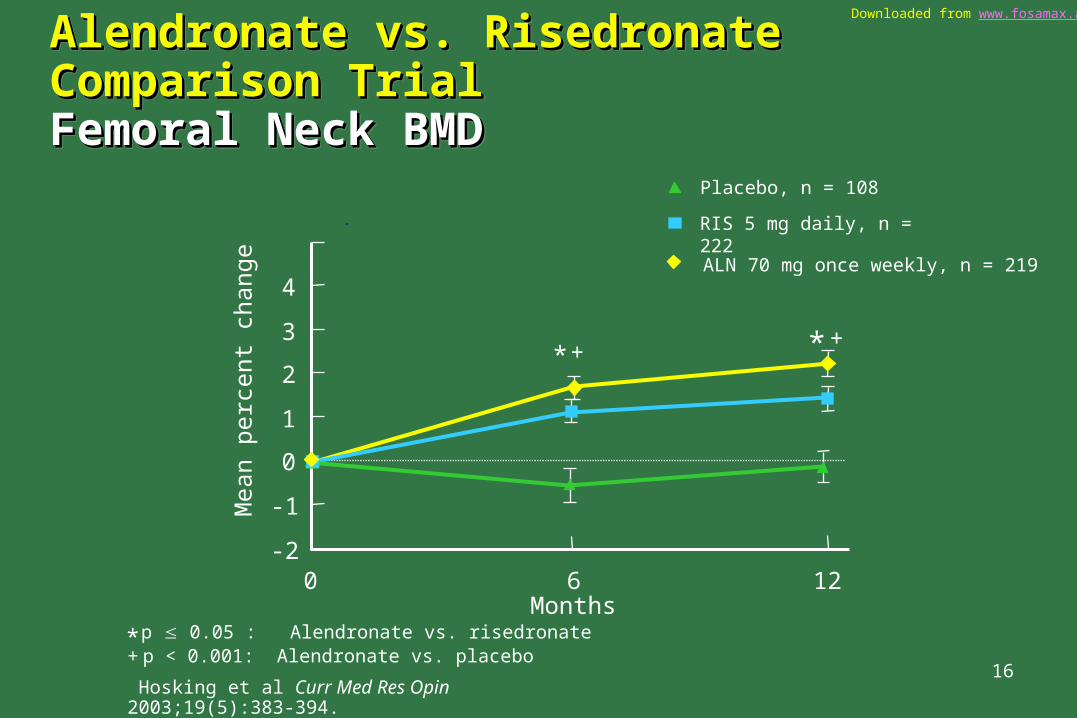
Downloaded from www.fosamax.ae
ALN 70 mg once weekly, n = 219
Months6
1
-1
2
0
3
4
-20 12
Mea
n pe
rcen
t ch
ange
Alendronate vs. Risedronate Comparison TrialAlendronate vs. Risedronate Comparison TrialFemoral Neck BMDFemoral Neck BMDAlendronate vs. Risedronate Comparison TrialAlendronate vs. Risedronate Comparison TrialFemoral Neck BMDFemoral Neck BMD
*
p 0.05 : Alendronate vs. risedronate+ p < 0.001: Alendronate vs. placebo
Hosking et al Curr Med Res Opin 2003;19(5):383-394.
Placebo, n = 108
RIS 5 mg daily, n = 222
++
*
*
17
Downloaded from www.fosamax.ae
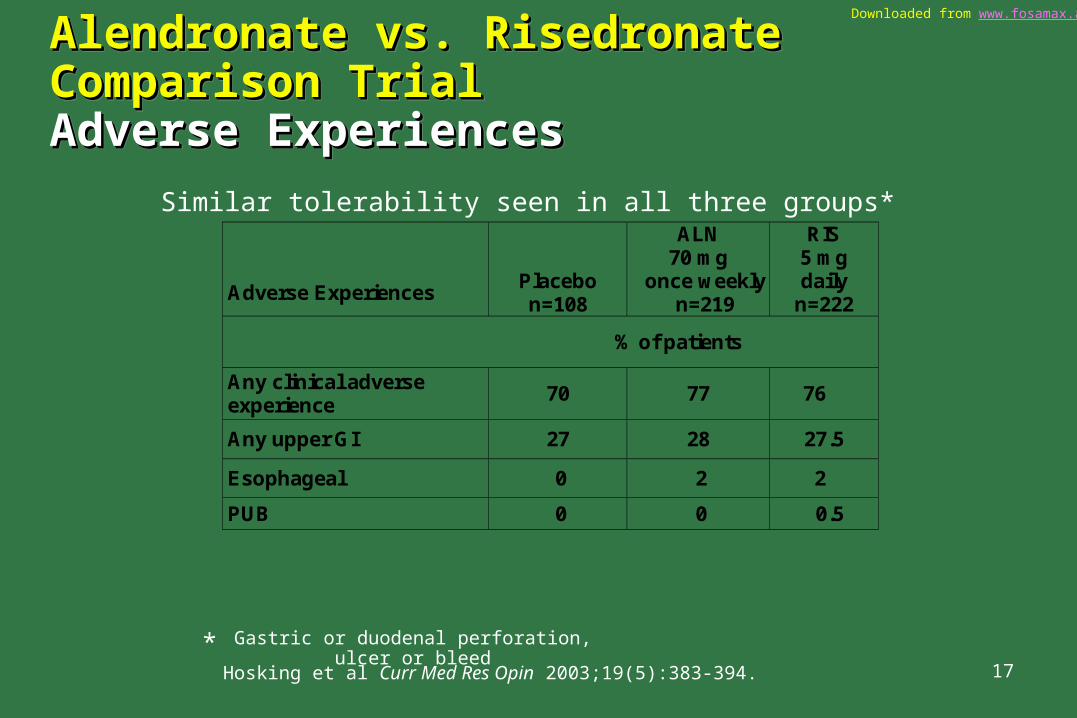
Alendronate vs. Risedronate Comparison TrialAlendronate vs. Risedronate Comparison TrialAdverse ExperiencesAdverse ExperiencesAlendronate vs. Risedronate Comparison TrialAlendronate vs. Risedronate Comparison TrialAdverse ExperiencesAdverse Experiences
Gastric or duodenal perforation, ulcer or bleed
Adverse Experiences
Placebo n=108
ALN 70 mg
once weekly n=219
RIS 5 mg daily
n=222
% of patients
Any clinical adverse experience
70 77 76
Any upper GI 27 28 27.5
Esophageal 0 2 2
PUB 0 0 0.5
Similar tolerability seen in all three groups*
Hosking et al Curr Med Res Opin 2003;19(5):383-394.
*
18
Downloaded from www.fosamax.ae
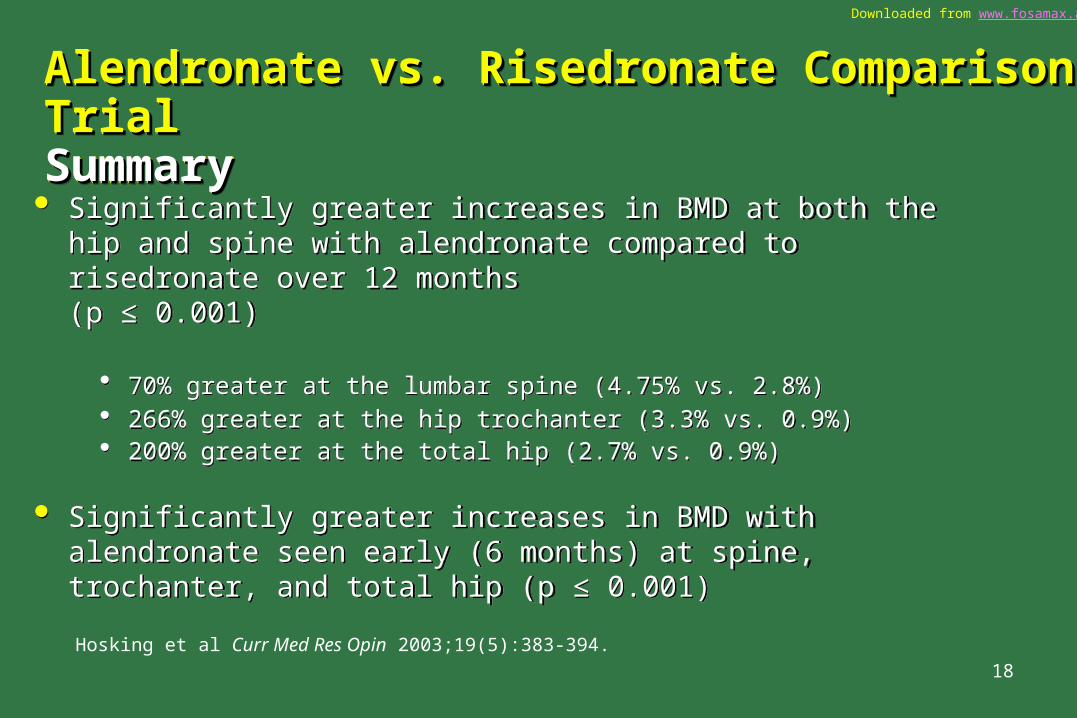
Significantly greater increases in BMD at both the hip and spine with alendronate compared to risedronate over 12 months(p ≤ 0.001)
70% greater at the lumbar spine (4.75% vs. 2.8%) 266% greater at the hip trochanter (3.3% vs. 0.9%) 200% greater at the total hip (2.7% vs. 0.9%)
Significantly greater increases in BMD with alendronate seen early (6 months) at spine, trochanter, and total hip (p ≤ 0.001)
Alendronate vs. Risedronate Comparison TrialAlendronate vs. Risedronate Comparison TrialSummarySummaryAlendronate vs. Risedronate Comparison TrialAlendronate vs. Risedronate Comparison TrialSummarySummary
Hosking et al Curr Med Res Opin 2003;19(5):383-394.
19
Downloaded from www.fosamax.ae
Alendronate vs. Risedronate Comparison TrialAlendronate vs. Risedronate Comparison Trial Summary Cont’dSummary Cont’dAlendronate vs. Risedronate Comparison TrialAlendronate vs. Risedronate Comparison Trial Summary Cont’dSummary Cont’d
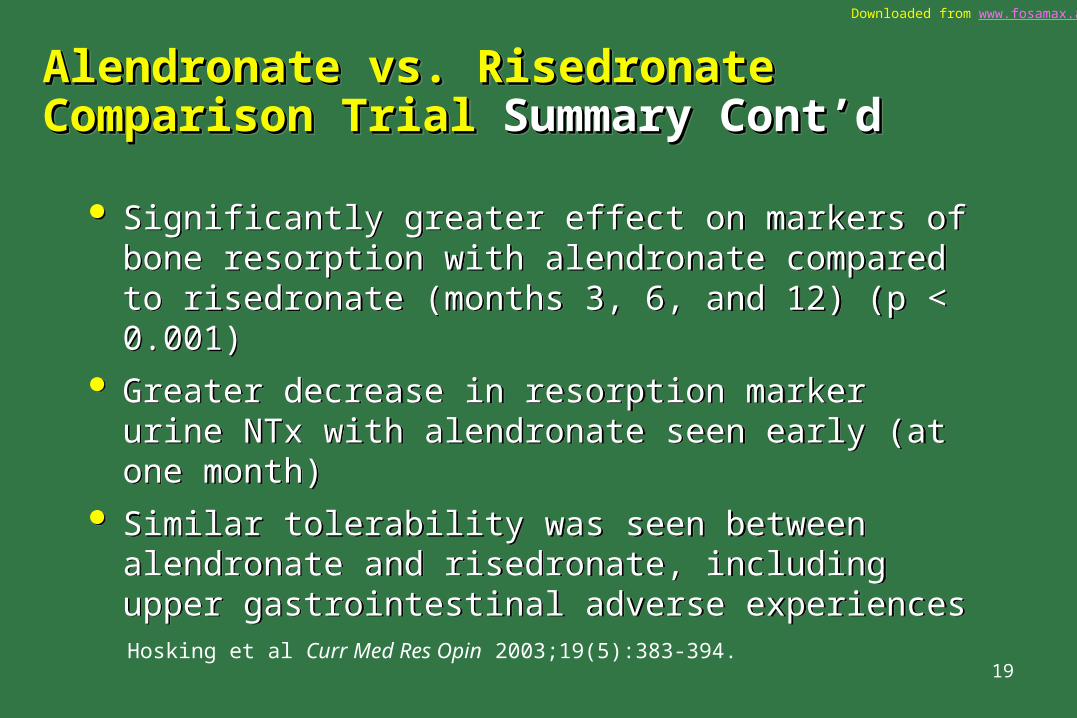
Significantly greater effect on markers of bone resorption with alendronate compared to risedronate (months 3, 6, and 12) (p < 0.001)
Greater decrease in resorption marker urine NTx with alendronate seen early (at one month)
Similar tolerability was seen between alendronate and risedronate, including upper gastrointestinal adverse experiences
Hosking et al Curr Med Res Opin 2003;19(5):383-394.
20
Downloaded from www.fosamax.ae
ConclusionsConclusionsConclusionsConclusionsIn this first head-to-head double-blind comparison of alendronate and risedronate for treatment of osteoporosis in postmenopausal women:
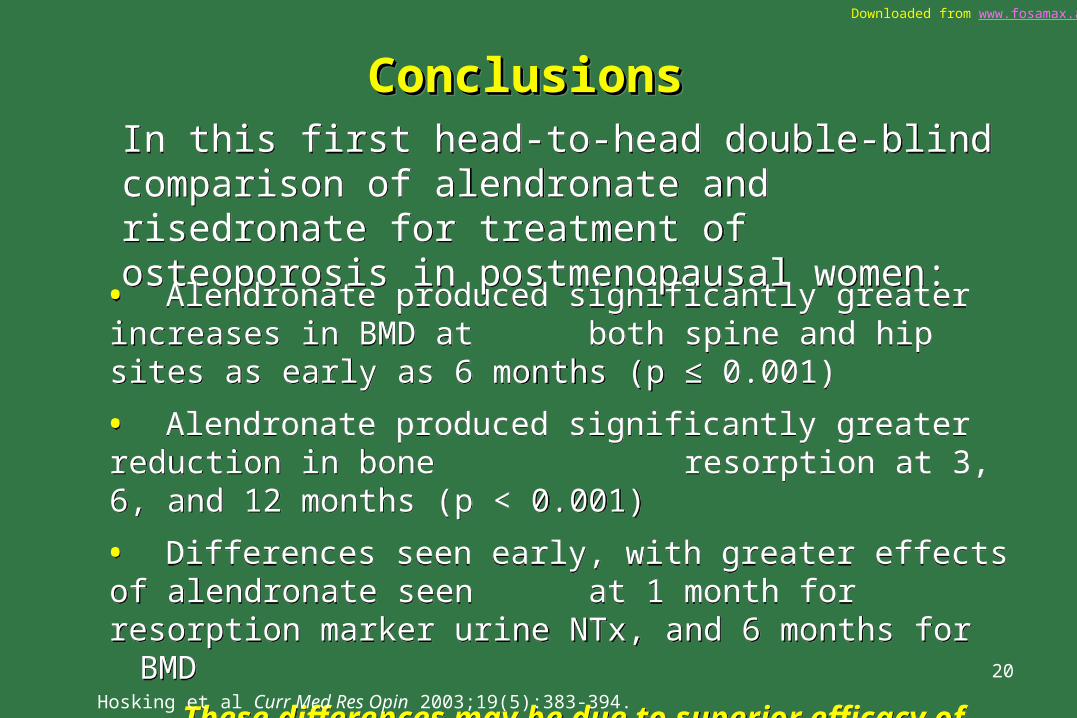
In this first head-to-head double-blind comparison of alendronate and risedronate for treatment of osteoporosis in postmenopausal women:
• Alendronate produced significantly greater increases in BMD at both spine and hip sites as early as 6 months (p ≤ 0.001)
• Alendronate produced significantly greater reduction in bone resorption at 3, 6, and 12 months (p < 0.001)
• Differences seen early, with greater effects of alendronate seen at 1 month for resorption marker urine NTx, and 6 months for
BMD
These differences may be due to superior efficacy of alendronate, reduced bioavailability of risedronate resulting
from post-meal dosing, or both.
• Alendronate produced significantly greater increases in BMD at both spine and hip sites as early as 6 months (p ≤ 0.001)
• Alendronate produced significantly greater reduction in bone resorption at 3, 6, and 12 months (p < 0.001)
• Differences seen early, with greater effects of alendronate seen at 1 month for resorption marker urine NTx, and 6 months for
BMD
These differences may be due to superior efficacy of alendronate, reduced bioavailability of risedronate resulting
from post-meal dosing, or both.Hosking et al Curr Med Res Opin 2003;19(5):383-394.

21
Downloaded from www.fosamax.ae
Protocol 159 InvestigatorsProtocol 159 InvestigatorsProtocol 159 InvestigatorsProtocol 159 InvestigatorsS. Adami – Italy J. Kaufman – BelgiumR. Bartl – Germany B. Lindergård – SwedenL. Benhamou – France O. Ljunggren – SwedenM. Billsten – Sweden D. Mellström – SwedenJ. Cannata Andia – Spain M. Muñoz Torres – SpainC. Cooper – UK B. Nyhäll-Wåhlin – SwedenP. Delmas – France K. Obrant – SwedenJ. Devogelaer – Belgium J. Olmos Martinez – SpainO. Di Munno – Italy S. Radominski – BrazilH. Dobnig – Austria J. Reginster – BelgiumD. Felsenberg – Germany M. Rödén – SwedenJ. Fraser – UK C. Roux – FranceB. Freyschuss – Sweden M. Sääf – SwedenJ. Garcia Vadillo – Spain H. Schatz – GermanyP. Gillberg – Sweden J. Semler – GermanyJ. Gross – Sweden H. Sinclair – SwedenN. Guañabens Gay – Spain K. Thorsen – SwedenF. Hawkins Carranza – Spain G. Toss – SwedenD. Hosking – UK M. Välimäki – Finland
Hosking et al Curr Med Res Opin 2003;19(5):383-394.

22
Downloaded from www.fosamax.ae
AddendumAddendumAddendumAddendum
23
Downloaded from www.fosamax.ae
““Agents that produce larger increases in BMD Agents that produce larger increases in BMD tend to provide greater reductions in both tend to provide greater reductions in both vertebral and nonvertebral fracture risk.” vertebral and nonvertebral fracture risk.”
M. HochbergM. Hochberg
““Agents that produce larger increases in BMD Agents that produce larger increases in BMD tend to provide greater reductions in both tend to provide greater reductions in both vertebral and nonvertebral fracture risk.” vertebral and nonvertebral fracture risk.”
M. HochbergM. Hochberg
Hochberg M et al J Clin Endocrin & Metab 2002;87(4):1586-1592.

24
Downloaded from www.fosamax.ae
Meta-analyses of Percent Change from Baseline BMDin Separate RCTs of Alendronate or Risedronate*
* These are not head-to-head data. Data shown together for ease of comparison; **p<0.01 vs. baseline; ***hip and femoral neck
ORAG=Osteoporosis Research Advisory Group
RCTs = Randomized Clinical Trials
Adapted from Cranney A et al Endocr Rev 2002;23(4):570–578.
7.5**
4.2**
2.1**2.7**
4.5**
2.7**
0.7 0.0
0
1
2
3
4
5
6
7
8
Spine Combined hip*** Forearm Total body
Mea
n %
cha
nge
Alendronate 10 to 40 mgRisedronate 5 mg
NS
n=16135 Trials
n=21386 Trials
n=14435 Trials
n=23977 Trials
n=5652 Trials
n=6481 Trial
n=4692 Trials
ORAG Meta-analyses:ORAG Meta-analyses:BMD Changes Reported for Alendronate BMD Changes Reported for Alendronate and Risedronateand Risedronate
ORAG Meta-analyses:ORAG Meta-analyses:BMD Changes Reported for Alendronate BMD Changes Reported for Alendronate and Risedronateand Risedronate

25
Downloaded from www.fosamax.ae
ORAG Meta-analyses:ORAG Meta-analyses: Fracture Risk Reductions Reported Fracture Risk Reductions Reported for Alendronate and Risedronate for Alendronate and Risedronate
ORAG Meta-analyses:ORAG Meta-analyses: Fracture Risk Reductions Reported Fracture Risk Reductions Reported for Alendronate and Risedronate for Alendronate and Risedronate
-48b -49b
-36c
–60
–50
–40
–30
–20
–10
0Vertebral Nonvertebral
Mea
n %
cha
nge
Meta-analyses of Relative Risk of Fracture versus Placebo at 3 yearsa
8 Trials(n=9360)
5 Trials(n=2604)
6 Trials(n=3723)
7 Trials(n=12,958)
Alendronated
Risedronate 5 mg
a These are not head-to-head data. Data shown together for ease of comparison; bp<0.01 vs. baseline; cp=0.01 vs. baseline; d Alendronate doses evaluated were 5–40 mg (vertebral fracture) and 10–40 mg (nonvertebral)
ORAG=Osteoporosis Research Advisory Group
Adapted from Cranney A et al Endocr Rev 2002;23(4):570–578.
-27b
26
Downloaded from www.fosamax.ae
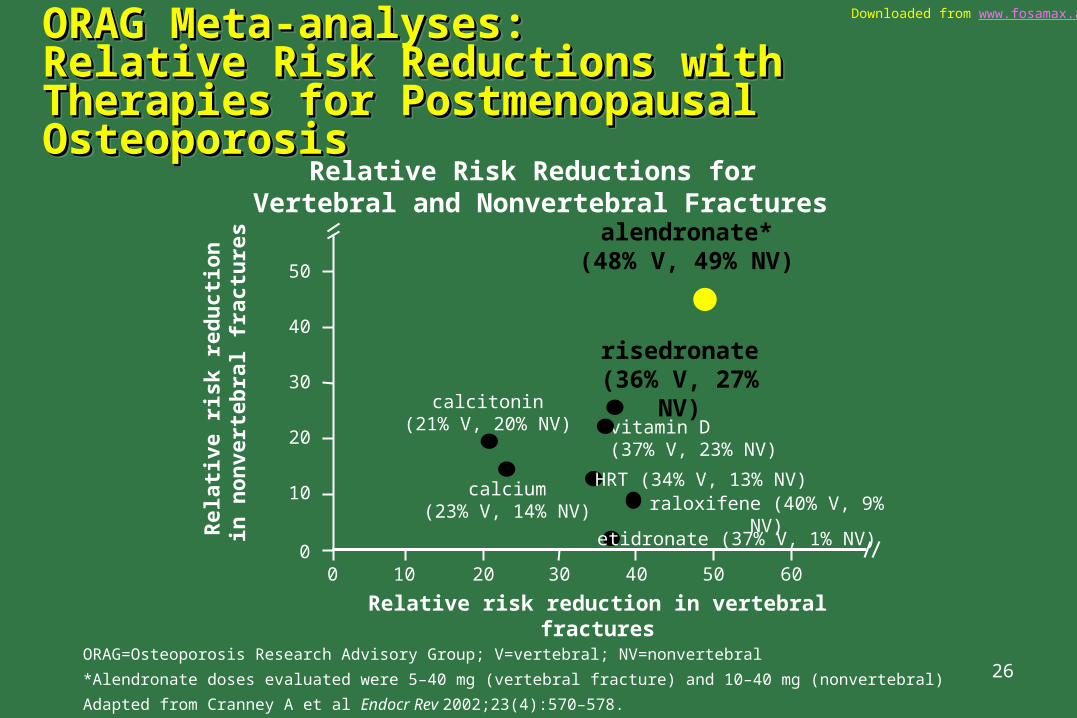
Relative Risk Reductions for Vertebral and Nonvertebral Fractures
ORAG Meta-analyses: ORAG Meta-analyses: Relative Risk Reductions with Therapies for Relative Risk Reductions with Therapies for Postmenopausal OsteoporosisPostmenopausal Osteoporosis
ORAG Meta-analyses: ORAG Meta-analyses: Relative Risk Reductions with Therapies for Relative Risk Reductions with Therapies for Postmenopausal OsteoporosisPostmenopausal Osteoporosis
ORAG=Osteoporosis Research Advisory Group; V=vertebral; NV=nonvertebral
*Alendronate doses evaluated were 5–40 mg (vertebral fracture) and 10–40 mg (nonvertebral)
Adapted from Cranney A et al Endocr Rev 2002;23(4):570–578.
alendronate*(48% V, 49% NV)
0
10
20
30
40
50
Rel
ativ
e ri
sk r
edu
ctio
n
in n
on
vert
ebra
l fra
ctu
res
vitamin D(37% V, 23% NV)
calcitonin(21% V, 20% NV)
calcium(23% V, 14% NV)
risedronate(36% V, 27% NV)
HRT (34% V, 13% NV)raloxifene (40% V, 9% NV)
etidronate (37% V, 1% NV)
0 10 20 30 40 50 60
Relative risk reduction in vertebral fractures
27
Downloaded from www.fosamax.ae
Alendronate vs. Alendronate vs. Risedronate Comparison TrialRisedronate Comparison Trial
Alendronate vs. Alendronate vs. Risedronate Comparison TrialRisedronate Comparison Trial
Before prescribing any of the products mentionedin this slide presentation, please consult the
manufacturers’ prescribing information.
Before prescribing any of the products mentionedin this slide presentation, please consult the
manufacturers’ prescribing information.
Copyright © 2003 Merck & Co., Inc., Whitehouse Station, NJ, USA.
All rights reserved. 11-04 FSM 2003-W-7006-SS
VISIT US ON THE WORLD WIDE WEB AT http://www.merck.com