downscaling report final pb approved 170918
TRANSCRIPT

Coral Bleaching Futures
UN environment 2017
Downscaled projections of bleaching conditions for the world’s coralreefs, implications of climate policy and management responses
Coral Bleaching Futures Downscaled projections of bleaching conditions for the world’s coral reefs, implications of climate policy and management responses 2017

Citation: UNEP 2017. Coral Bleaching Futures - Downscaled projections of bleaching conditions for the world’s coral reefs, implications of climate policy and management responses. United Nations Environment Programme, Nairobi, Kenya
Authors: Ruben van Hooidonk1, 2, Jeffrey Maynard3, 4, Jerker Tamelander5, Jamison Gove6, Gabby Ahmadia7,
Laurie Raymundo8, Gareth Williams9, Scott Heron10, 11, Dieter Tracey12, Britt Parker13, Serge Planes4
1 NOAA Atlantic Oceanographic and Meteorological Laboratory, Ocean Chemistry and Ecosystems Division, 4301
Rickenbacker Causeway, Miami, FL 33149, USA 2 Cooperative Institute for Marine and Atmospheric Studies, Rosenstiel School of Marine and Atmospheric
Science, University of Miami, 4600 Rickenbacker Causeway, Miami, FL 33149, USA 3 SymbioSeas and the Marine Applied Research Center, Wilmington NC, 28411, USA 4 Laboratoire d’Excellence «CORAIL» USR 3278 CNRS – EPHE, CRIOBE, Papetoai, Moorea, Polynésie Française 5 United Nations Environment Programme, Bangkok, Thailand 6 Ecosystems and Oceanography Program, Pacific Islands Fisheries Science Center, 1845 Wasp Blvd Building
176, Honolulu, HI 96818, USA 7 Oceans, World Wildlife Fund, 1250 24th St., Washington, D.C. 20037, USA 8 University of Guam Marine Laboratory, UOG Station, Mangilao, GU 96913, USA 9 School of Ocean Sciences, Bangor University, Menai Bridge, Anglesey LL59 5AB, UK 10 NOAA Coral Reef Watch, NESDIS Center for Satellite Applications and Research, 5830 University Research Ct.,
E/RA3, College Park, MD 20740, USA 11 Marine Geophysical Laboratory, Physics Department, College of Science, Technology and Engineering, James
Cook University, Townsville, Qld 4814, Australia 12 28 Dalziel Street, Stratford QLD 4870, Australia 13 The Baldwin Group, Inc. on Contract with NOAA Coral Reef Conservation Program, 1315 East-West Highway,
Silver Spring MD 20910 ISBN: 978-92-807-3649-6 Job No: DEP/2103/BA Copyright: United Nations Environment Programme 2017 Acknowledgements: Financial and in-kind support for this research was provided by: UNEP, NOAA Coral Reef Conservation Program, NOAA Atlantic Oceanographic and Meteorological Laboratory, NOAA National Marine Fisheries Service via the PIFSC, World Wildlife Fund, the US National Fish and Wildlife Foundation, USGS via the Pacific Islands Climate Science Center, the Pacific Islands Climate Change Cooperative, RSMAS at the University of Miami, and the European Research Council.
Comments on the draft report by the following reviewers is acknowledged: Kanako Hasegawa, UNEP; Alessandra Vanzella-Khouri, CEP; Pulakesh Mondal, SACEP; Reynaldo F Molina, COBSEA; Maher Amer, PERSGA; Abou Bamba, Abidjan Convention; Warren Lee Long, SPREP; as well as two anonymous reviewers.
Parts of this report are based on: van Hooidonk R, Maynard J, Tamelander J, Gove J, Ahmadia G, Raymundo L, Williams G, Heron S, Planes S (2016) Local-scale projections of coral reef futures and implications of the Paris Agreement. Scientific Reports. doi:10.1038/srep39666
Front cover photo: Paul Marshall; Inset: Projected onset of twice-per-decade severe bleaching under a business as usual emission scenario; Back cover photo: Jerker Tamelander. Reproduction: This publication may be reproduced in whole or in part and in any form for educational or non-profit services without special permission from the copyright holder, provided acknowledgement of the source is made. UN Environment would appreciate receiving a copy of any publication that uses this publication as a source. No use of this publication may be made for resale or any other commercial purpose without prior permission in writing from UN Environment. Applications for such permission, with a statement of the purpose and extent of the reproduction, should be addressed to the Director, Communication Division, UN Environment, P. O. Box 30552, Nairobi 00100, Kenya. Disclaimer: The contents in this publication are solely the opinions of the authors and do not constitute a statement of policy, decision or position on behalf of UN Environment, NOAA or the US Government. The designations employed and the presentation of material in this publication do not imply the expression of any opinion whatsoever on the part of UN Environment concerning the legal status of any country, territory or city or its authorities, or concerning the delimitation of its frontiers and boundaries. Mention of a commercial company or product in this document does not imply endorsement by UN Environment. Trademark names and symbols are used in an editorial fashion with no intention on infringement on trademark or copyright laws.

Table of Content
Executive Summary .............................................................................................................................. 5
1. Introduction ....................................................................................................................................... 9 Coral bleaching and climate modeling ............................................................................................................. 9 Downscaling approaches, advantages and limitations .................................................................................. 9 Coral bleaching implications of climate policy ............................................................................................. 10 Report purpose, scope and intended end-users ........................................................................................... 10
2. Methods ........................................................................................................................................... 11
3. Results and Discussion .................................................................................................................. 13 Projecting annual severe bleaching .............................................................................................................. 13 Variation within and among Regional Seas: Introduction to the Appendix ................................................ 17 Coral bleaching implications of climate policy ............................................................................................. 18
4. Applications .................................................................................................................................... 19 Management and conservation planning ..................................................................................................... 19 Vulnerability assessment and adaptation planning ..................................................................................... 21 Stakeholder consultation, education and outreach ..................................................................................... 21 Policy ............................................................................................................................................................... 22
5. Further development of downscaled projections ......................................................................... 23
6. Accessing the projections .............................................................................................................. 24
7. References ...................................................................................................................................... 25
Appendix 1. Regional Summaries ...................................................................................................... 27 Regional Seas and Coral Reefs ..................................................................................................................... 28 Introduction to Regional Seas Summaries ................................................................................................... 28 Table A1.1. Regions ........................................................................................................................................ 29 Table A1.2. Country and territory summaries ............................................................................................... 31 Wider Caribbean ............................................................................................................................................. 42 Western Africa ................................................................................................................................................ 46 Red Sea and Gulf of Aden .............................................................................................................................. 49 ROPME Sea Area ............................................................................................................................................ 51 Eastern Africa / Western Indian Ocean ......................................................................................................... 53 South Asian Seas ........................................................................................................................................... 55 East Asian Seas .............................................................................................................................................. 57 Pacific Islands ................................................................................................................................................ 60 South-East Pacific .......................................................................................................................................... 63 North-East Pacific ........................................................................................................................................... 65
Appendix 2. Years difference for projected bleaching (RCP4.5-8.5) ................................................ 67
Appendix 3. Glossary .......................................................................................................................... 68

5
Executive Summary Background and Objectives
Increasingly frequent severe coral bleaching is among the greatest threats to coral reefs posed by climate change. Global climate models (GCMs) project great spatial variation in the timing of annual severe bleaching (ASB) conditions; a point at which reefs are certain to change and recovery will be limited. However, previous model-resolution projections (approximately 1x1°) are too coarse to inform reef management planning (recognized, for example, in SAMOA Pathways, paragraph 44b). To meet the need for higher-resolution projections, the first objective of this report is to present statistically downscaled projections (4-km resolution) for all the world’s coral reefs using the newest generation of IPCC climate models (CMIP5). Results are reported by country and territory, grouped in bioregions based on the 10 UNEP Regional Seas programmes with coral reefs (also including countries or territories in or near the Regional Sea area but not participating in the Regional Sea). Among the goals of the Paris Agreement adopted at the UNFCCC Conference of Parties (COP) in 2015 is to hold temperature “well below” 2°C while also pursuing efforts to stay below 1.5°C. This legally binding agreement entered into force 4 November 2016. The second objective of this report is to evaluate the implications of the Paris Agreement for coral reef futures by comparing projections of ASB timing between successful mitigation in line with or exceeding the 1.5 °C ‘aspiration (i.e. greenhouse gas concentration trajectory RCP4.5) and a business as usual scenario (RCP8.5). The third objective of this report is to make the projection data and main findings publicly accessible to inform management and policy planning as well as to support education and outreach. Projections of annual severe bleaching
Under a business as usual scenario, ASB is projected to occur within this century for 99% of the world’s coral reefs. The average projected year of ASB is 2043. 5% of reef pixels (i.e. 4-km pixels that contain coral reef) are projected to experience ASB a decade or more earlier than the global average of 2043. These are relative climate losers. 11% of reef pixels are projected to experience ASB a decade or more later than 2043. These are relative climate winners or ‘temporary refugia’. Coral reef futures vary greatly among and within countries. Coral reef climate losers and winners occur in all of the ocean basins; however, some countries have more climate winners than others. Five of the 20 countries with the greatest total reef area have more than 20% climate winners (i.e. projected ASB after 2053), including: Egypt (37%), Australia (29%), Cuba (22%), Bahamas (21%), and India (20%).
Example of spatial variation in the
downscaled projections for the onset of
ASB. Reef areas in turquoise and blue are
relative climate winners, areas in red are
relative climate losers.

6
Five of the 20 countries with the greatest reef area have less than 5% of pixels that are relative climate losers (i.e., projected ASB before 2033), including: Saudi Arabia (33%), Egypt (33%), Papua New Guinea (8%), Madagascar (7%), and Bahamas (5%). Exposure to bleaching conditions is sufficiently different where variation is more than 10 years to potentially be a driver of differences in relative climate change vulnerability. Therefore, the downscaled projections can inform management decision-making where variation in projected ASB timing is more than 10 years between locations. Reefs projected to experience ASB 10 or more years later than other reefs in the same jurisdiction are relative refugia and are conservation priorities. The range in projected ASB timing is more than 10 years in 82% (71 of 87) of the countries and territories with at least 500 km2 of coral reef. Regional Summaries
There is significant variation between reef regions. This report provides regional summaries of projected timing of ASB under a business as usual scenario (RCP8.5), based on the 10 Regional Seas with tropical coral ecosystems. Coral reef area of countries and territories located near but not participating in the Regional Seas governance mechanisms have been included in regional summaries, in keeping with an ecosystem approach. The earliest average projected ASB timing is in the Red Sea and Gulf of Aden (2039) and the Pacific Islands (2042), the latest in the ROPME Sea Area (2069) and South-East Pacific (2050). Countries and territories with the earliest and latest average projected ASB timing within or near each Regional Sea are shown within the following table (further detail is provided in Appendix 1). Region Earliest average projected ASB Latest average projected ASB Wider Caribbean Turks and Caicos (2036) Bermuda (2050) Western Africa St. Helena and Ascension Island (2043) Cameroon (2055) Red Sea and Gulf of Aden Israel (2012) Eritrea (2053) ROPME Sea Area Oman (2055) Bahrain (2084) East Africa Mozambique (2040) South Africa (2051) South Asian Seas Chagos (2041) Sri Lanka (2050) East Asian Seas Taiwan (2037) PRC China (2057) Pacific Islands Federated States of Micronesia (2038) Pitcairn Island (2058) South-East Pacific Ecuador (2042) Chile (2069) North-East Pacific Nicaragua (2038) El Salvador (2050) Implications of the Paris Agreement
The average year for the projected timing of ASB under a successful mitigation scenario is 2054, 11 years later than the average projected under business as usual. ASB under a successful mitigation scenario is projected to be more than 25 years later than under business as usual for very few reefs (7%), and less than 10 years later for many reefs (32%). There is great spatial variation across the globe in the differences in projected ASB timing under successful mitigation and under business as usual. Many high-latitude reefs in Australia, the south Pacific, Northwestern Hawaiian Islands, India, and the Florida Reef Tract have at least 25 more years before ASB occurs under successful mitigation. Low latitude locations in South-East Asia, the Coral Triangle, and the
7
eastern Pacific also have at least 25 more years before ASB occurs under successful mitigation. In contrast, there is less than 10 years difference between scenarios for reefs near the equator that are projected to experience ASB relatively early. In summary, these projections suggest that full implementation of the Paris Agreement will buy some time for some reefs to adapt and acclimate prior to severe bleaching conditions occurring annually, and for putting in place better management. However, Intended Nationally Determined Contributions (INDCs) submitted as of September, 2016 will do little to provide reefs with more time. Delayed ratification and implementation of the Paris agreement will have severe implications for coral reefs. Applications
These downscaled projections can (1) guide coral reef management and conservation planning, (2) be used in stakeholder consultation, education and outreach, and (3) inform policy. (1) The downscaled projections support identification of relative climate refugia at multiple levels where management planning and prioritization is carried out, from sub-national to regional scale. The projections can be used as a data layer (among other layers such as biodiversity, cultural values and ecosystem service use) in marine protected area planning and marine spatial planning, to identify where particular stress reduction measures or restrictions on use of ecosystem services should be applied. Management will have the greatest impact by reducing stress to relative refugia where anthropogenic pressure is relatively high and most amenable to management influence. This strategy maximizes the likelihood that at least some reefs will be healthy in the future and continue to provide ecosystem goods and services. The projections can also identify locations where reef dependent people and industries are vulnerable to early reef loss, and thus support prioritization of adaptation interventions. Reef pixels with projected ASB timing that extends beyond 2055 are ‘global relative climate winners’ and as such global conservation priorities. However, most countries and territories have few or none of these global relative climate winners. Prioritization of management efforts thus need to identify reef areas that are climate winners relative to other reef areas within a given management jurisdiction or planning area (e.g. territory, country or region). Reef areas projected to experience ASB later than the average + 1 standard deviation (for a given area) are relative climate winners. Relative climate winners typically represent <20% of the reef pixels in a given country or territory. Priority areas are easily identified by querying the spatial data made publicly accessible in the coral reef theme on Environment Live (see ‘Accessing the Projections’ below). (2) Maps of the projected timing of the onset of annual severe bleaching conditions can be powerful education, awareness raising and outreach tools. By helping to visualize the spatial patterns of increasingly frequent coral bleaching and what this means for the future provision of ecosystem gods and services from reefs, the projections serve to both engage and inform stakeholders. The projections can thus support stakeholder consultation in the context of management and adaptation planning, catalyze in-depth discussions about climate change vulnerability and resilience, and, in turn, facilitate stewardship actions among reef dependent communities as well as business sectors, including in particular tourism. The projections can also support public outreach at multiple scales. (3) The downscaled projections have a number of policy applications, including in planning for implementation of the 2030 Development Agenda and especially Sustainable Development. In particular,
8
the projections can be used in prioritization of actions towards Goal 14, target 2 “sustainably manage and protect marine and coastal ecosystems to avoid significant adverse impacts, including by strengthening their resilience”; and target 5 “conserve at least 10 per cent of coastal and marine areas”. The projections can also be used to inform climate policy, e.g. the formulation of Nationally Determined Contributions (NDCs) as well as National Adaptation Plans. By illustrating implications of two mitigation scenarios for reef health and ecosystem service provision, the projections can help make a case for ambitious NDCs, as well as support assessment of vulnerability and adaptation needs in key coastal sectors. Lastly, the projections can inform policies related to fisheries, coastal development, and land-use planning, all of which influence reef climate change vulnerability. For example, the projections can make a case for moderating land use change and agricultural impacts in the watershed of relative climate winner reefs, or to restrict fishing impacts on species that promote reef resilience. While the projections provide key information for the long-term planning of coral reef management and protection, it is important to note that the projections should not be interpreted as predictions of exactly when bleaching will occur in a given location, and do not imply that an area is safe from bleaching. Furthermore, recent bleaching does not mean an area is no longer a relative refugia or priority – areas that are expected to face frequent bleaching conditions relatively later may face episodic bleaching events in the coming decades. Accessing the projections
The projections have been made publicly accessible via the Coral Reef Theme on Environment Live and under Research Activities on the NOAA Coral Reef Watch website. On both portals the projections are available as large image files, as *.kmz files viewable through Google Earth, and as a spatial data layer package that can be opened in ArcGIS versions 10 and above. ‘About’ pages on the websites describe the project background, methods and main findings, and provide an overview of applications.

9
1. Introduction
Coral bleaching and climate modeling
Stony corals bleach when warm sea temperatures disrupt their mutualistic relationship with the algal symbionts, called zooxanthellae, that reside within their tissues (Douglas 2003). Corals can either regain their zooxanthellae (Baker 2001) and survive or die if temperature stress persists. The third global coral bleaching event, which started in 2014 extended well into 2017, is the longest coral bleaching event on record. The length of the event means corals in some parts of the world had no time to recover in 2014 or 2015 during the cool/winter season, prior to experiencing bleaching the following year. van Hooidonk et al. (2013 and 2014) found that a majority of coral reefs globally are projected, at climate model-resolution, to experience annual severe bleaching (ASB) by the mid-2050’s under a business as usual emissions scenario (RCP8.5). This bleaching event represents what climate models suggest may become the norm over the coming five decades. Importantly, though, great spatial variation exists in the projected timing of the onset of ASB conditions among the world’s coral reefs. This variation will be a major driver of differences in the relative (on various spatial scales) vulnerability of coral reef ecosystems to climate change. In the IPCC’s widely adopted vulnerability assessment framework, vulnerability is a function of exposure to climate and non-climate threats and sensitivity to these threats, which yields potential impacts that are moderated by adaptive capacity (Turner et al. 2003). Sensitivity and adaptive capacity can be collectively seen as resilience (Marshall and Marshall 2007), i.e. the ability of a system to maintain key functions, processes and services in the face of acute disturbances and chronic stress (Mumby et al. 2007). Managing coral reefs for resilience entails reducing coral reef vulnerability to climate change by reducing exposure to non-climate threats (i.e. local-scale anthropogenic stress) (Anthony et al. 2014). A key challenge for reef management lies in deciding where to target actions to reduce anthropogenic stress, ensuring efficacy as well as cost effectiveness of actions taken. Ecosystem Based Management (EBM) is becoming increasingly sophisticated (Mills et al. 2015), and software that combines and analyzes spatial data is increasingly accessible and used in planning to strike a balance between what can be competing conservation and development objectives (Watts et al. 2009). For example, protecting biodiversity, providing for sustainable fisheries, and minimizing user conflicts are among the highest priorities during marine spatial planning (MSP) efforts in reef areas (Agardy et al. 2011). Incorporating spatial variation in coral reef vulnerability to climate change is frequently discussed during MSP but, as yet, is rarely operationalized (Anthony et al. 2014). This will require assessing spatial variation in the key vulnerability components – exposure and resilience - at a locally relevant scale (one km to 10s of km). Small Island Developing States (SIDS) recognized this at the highest level in the adoption of the SIDS Accelerated Modalities of Action (SAMOA) Pathways, which in paragraph 44b calls for “downscaling of climate model projections which enable better projection of future impacts on small islands”. �
Downscaling approaches, advantages and limitations
Climate model projections can be downscaled statistically or dynamically. In dynamical downscaling, General Circulation Model (GCM) outputs are used to drive a higher-resolution regional numerical model, enabling simulation of local oceanic conditions in greater detail. Features that affect warming patterns, such as eddies and upwelling, can be resolved with this approach (Liu et al. 2012, Sun et al. 2012). The limitation of dynamical downscaling is that it has a very high
10
computational and financial cost. Presently, parameterized regional models do not exist for most of the world’s coral reefs (see van Hooidonk et al. 2015 for regional model results for the Caribbean). Statistical downscaling is far less resource-intensive than dynamical downscaling, and can be done for all the world’s coral reefs. In the statistical downscaling undertaken here, high-resolution observations of sea surface temperature (SST) are used to adjust model baselines, annual cycles and bleaching thresholds to present-day values at a 4-km scale prior to running projections. The limitation of statistical downscaling is that, unlike dynamical downscaling, it does not resolve what can be important local and regional processes that affect warming patterns, such as eddies and upwelling (see also Wilby and Wigley 1997 for a review of downscaling approaches and limitations). A proof-of-concept study comparing dynamical and statistical downscaling projections of ASB in the Caribbean (van Hooidonk et al. 2015) found that ASB projected using statistical downscaling closely approximates (i.e. within 10 years) projections from dynamical downscaling for the great majority of locations (>90%).
Coral bleaching implications of climate policy
The UN Framework Convention on Climate Change (UNFCCC) is aimed at stabilizing atmospheric concentrations of greenhouse gases to avoid “dangerous anthropogenic interference with the climate system” (Article 2). The 21st Conference of Parties to the Convention (COP21), held in Paris in 2015, adopted a legally binding agreement (the ‘Paris Agreement’) with the goal of keeping global warming well below 2°C, while pursuing efforts to stay below 1.5°C. The Agreement enters info force when at least 55 Parties accounting for at least 55 % of the total global greenhouse gas emissions have ratified it. The agreement requires that countries prepare Nationally Determined Contributions (NDCs) in pursuit of its goal. New NDCs are expected in 2020 and then every five years thereafter with global stock-take to review progress planned for 2023. If the Paris Agreement is not implemented, i.e. a ‘business as usual’ scenario, 58-61 Giga tons of carbon dioxide equivalents per year (Gtons CO2-eq/yr) are projected to be emitted in 2030 (http://climateactiontracker.org/global.html), which is closely approximated by emissions scenario RCP8.5. Assuming pledges do become reality would result in emission of 52-55 Gtons CO2-eq/yr in 2030, which is below RCP8.5 and above the emissions concentrations associated with RCP4.5. Pledges made under recent INDCs (as of September 2016) would have to be 150% greater on average for emissions in 2030 to be 49 Gtons CO2-eq/yr, which is the prescribed amount under the RCP4.5 scenario. In effect, RCP4.5 represents a better future for coral reefs than would be projected using the emissions trajectory associated with the Paris Agreement.
Report purpose, scope and intended end-users
The purpose of this report is threefold: 1. to present downscaled projections of coral bleaching conditions (i.e. exposure to the primary climate threat to coral reefs) at a spatial scale that enables use of the data in management planning, conservation planning and in support of other decisions influencing coral reefs and reef use; 2. to evaluate the implications of the Paris Agreement as well as failure to achieve its goal, by comparing the projected timing of annual severe bleaching between emission scenarios RCP4.5 and 8.5; and 3. provide public access to data as well as main findings in order to enable their application in management planning, policy formulation, and as education and outreach tools.
End-users of the downscaled projections include coastal/marine planners and managers, conservationists and the coral reef scientific community, as well as a coral reef stakeholders including businesses dependent on reef resources. The report has been prepared with

11
coastal/marine planners and managers and conservationists as the primary target audience. This report first presents Methods for developing the downscaled projections, followed by a Results
and Discussion section that presents the main findings (with additional detailed information in Appendix 1). The Applications section describes how the downscaled projections can be used in coral reef management and conservation planning, as education and outreach tools, and in informing climate change policy. Further development of downscaled projections provides recommendations for further research building on the downscaled climate model that address critical coral reef management needs. Information on Accessing and using the projections is provided at the end of the report. Appendix 1 contains country and territory summaries of the projection results for RCP8.5, grouped based on the 10 Regional Seas (http://unep.org/oceans40/) that contain tropical coral reefs.
2. Methods Sea surface temperature (SST) data from GCMs was obtained from the CMIP5 for the RCP8.5 and RCP4.5 experiments (Moss et al. 2010). RCP8.5 is a ‘no climate policy’ scenario that assumes emissions increase unabated. At time of writing, emissions concentrations are greater than what RCP8.5 projected for 2016. RCP4.5 assumes emissions peak around 2040 and then decline as a result of successful implementation of climate policies. For the statistical downscaling, model outputs from 33 GCMs for RCP8.5 and 35 GCMs for RCP4.5 (see van Hooidonk et al. 2014 for models list) were adjusted as follows: The annual cycle in the models was substituted with a bi-linear interpolation of the observed mean and annual cycle from 1982-2008 from the NOAA Pathfinder v5.0 climatology, which has a 4-km resolution (Casey et al. 2010). Where model outputs were missing due to a land mask, SSTs were interpolated in the zonal direction. The Pathfinder SST archive was used for climate model adjustment (reasons reviewed in van Hooidonk et al. (2015). The 1982-2008 period is slightly cooler than the 2006-2011 period. This makes our projections slightly conservative or ‘optimistic’; i.e., the bleaching condition frequencies we project could occur slightly earlier than the projected date. After interpolating the model data to the 4km Pathfinder grid, the mean for 2006-2011 was replaced for each 4-km pixel with the mean of the climatology at that location. These steps ensure: 1) the climate models are adjusted to observed data (as in van Hooidonk et al. 2013, 2014, Maynard et al. 2015), and 2) that these downscaled 4-km projections have a locally relevant SST starting point from which the climate models then project future SST. Degree heating months were calculated for each year between 2006 and 2099 as anomalies above the warmest monthly temperature (the maximum monthly mean or MMM) from the Pathfinder climatology (Casey et al. 2010) and were summed for each 3-month period. A review of climatological thresholds from which bleaching stress can be calculated can be found in van Hooidonk et al. 2015, which includes defense of the use of MMM. Degree heating months are converted into Degree Heating Weeks (DHW) by multiplying by 4.35 (van Hooidonk et al. 2014) (i.e. one DHW is equal to 1°C above the maximum monthly mean (bleaching threshold) for one week). Projections were developed for twice-per-decade and annual (10x per decade) bleaching conditions. Reefs are likely to change dramatically once bleaching events occur at least twice per decade. However, such bleaching event frequencies have already occurred in most reef regions during this last decade. The focus here and in using the projections to inform management and conservation, should be on the annual severe bleaching projections under RCP8.5, which emissions are currently tracking just above. The onset of annual severe coral bleaching (ASB) is defined as the annual

12
exceedance of >8 DHW accumulating during any 3-month period (as in van Hooidonk et al. 2014; 2015). 8 DHWs is higher than the mean optimum bleaching predictor of 6.1 DHWs for the globe (van Hooidonk and Huber 2009); i.e. at 8 DHWs we can have confidence thermal stress will be sufficiently great for bleaching to occur (van Hooidonk et al. 2014). The focus here in describing the results is on spatiotemporal variability in the projections. Hypothetical adaptation rates are not applied here (see Donner et al. 2005, Baker et al. 2004). Applying the same adaptation rates everywhere is not well founded as spatial variation in adaptive capacity is certainly great, and is largely unknown. Adding in the same adaptation rate everywhere shifts projected bleaching timing later in the century yet the projected spatial patterns would not change and these should be the focus for local management planning. In comparing the projected timing of the onset of ASB between RCP8.5 and 4.5, the dates projected for 8.5 were subtracted from 4.5. This yielded the amount of additional time coral reefs will have (in most cases) or not (in rare cases) to adapt or acclimate to increasing temperatures if emissions cuts that are in keeping with RCP4.5 are made (e.g. under the Paris Agreement). We calculate the range within climate model pixels for ASB under RCP8.5 (latest year minus earliest year). We present the standard deviation of the projections for ASB timing from among the models used for RCP8.5 to examine model agreement. The reef locations dataset was classified into countries and territories using www.marineregions.org (methodology described at: http://www.marineregions.org/eezmethodology.php). The onset of annual bleaching conditions is defined as the annual exceedance of >8 DHW accumulating during any 3-month period. All downscaled projections of ASB from the models were averaged to create a multi model ensemble. This is a common approach and was done to reduce unknown, sometimes time dependent errors in the models (Knutti et al. 2010). Further, it is not possible to robustly examine model performance (regionally or globally) in hindcasting DHWs to predict past bleaching events due to the paucity of bleaching and non-bleaching observations data. For that reason, we have not selected some models or attached different weights to models before creating an ensemble (see also van Hooidonk et al. 2013, 2014). All model outputs were reduced to a subset of only reef locations obtained by combining three published global reef-locations datasets ReefBase, Millennium Coral Reef Mapping Project, and Reefs at Risk-Revisited. This was further augmented by other coral reef locations documented by this author group and colleagues, especially in the US-affiliated Pacific islands. It should, however, be noted that coral communities may be found in some locations not included here, and global coral reef spatial datasets may in the future be further improved. The reef locations dataset (4-km resolution) is available on Environment Live under the Coral reefs theme. The numbers of 4-km pixels containing reefs within each climate model pixel is shown in Figure 1 and varies from 1-391.
Figure 1. Number of 4-km reef-containing pixels within the GCM data grid from which the downscaled projections were produced (varies from 1-391; 100 in the scale is >100). This GCM data grid is used to visualize global-scale patterns in Figure 2.

13
All interpolation was performed using Climate Data Operators, a software package available from: https://code.zmaw.de/projects/cdo/. All model output adjustment, projections, data visualization and analysis were conducted using the NCAR Command Language (NCL; http://www.ncl.ucar.edu/).
3. Results and Discussion
Projecting annual severe bleaching
Under RCP8.5, ASB is projected to occur within this century for 99% of the world’s coral reefs (Figures 2 and 3). The average projected year of ASB is 2043 (as in van Hooidonk et al. 2014). The global range in ASB projections stretches the entire 83-year modeled period (2089-2006). The large global range in ASB timing is driven by the 5% of reef-containing 4-km pixels (hereafter pixels) projected to experience ASB a decade or more earlier than the global average of 2043 (the relative climate losers) and the 11% projected to experience ASB a decade or more later than 2043 (the relative climate winners or ‘temporary refugia’ (van Hooidonk et al. (2013)).
Figure 2. Range for statistically downscaled projections of annual severe bleaching (ASB) timing (years) within GCM pixels (a), and the average difference within GCM pixels between RCP4.5 and RCP8.5 in projected ASB timing (b). Figure from van Hooidonk et al. (2016). Coral reef futures vary greatly among and within countries. Coral reef climate losers and winners occur in all of the ocean basins; however, some countries have more climate winners than others. Five of the 20 countries with the greatest reef area (Table S1) have >20% climate winners (i.e. projected ASB after 2053), including: Egypt (37%), Australia (29%), Cuba (22%), Bahamas (21%), and India (20%, Fig. 3). Five of the 20 countries with the greatest reef area have >5% of pixels that are relative climate losers (i.e., projected ASB before 2033), including: Saudi Arabia (33%), Egypt (33%), Papua New Guinea (8%), Madagascar (7%), and the Bahamas (5%). The range in projected ASB timing also varies greatly among countries. Among the top 20 countries in terms of reef area, the
14
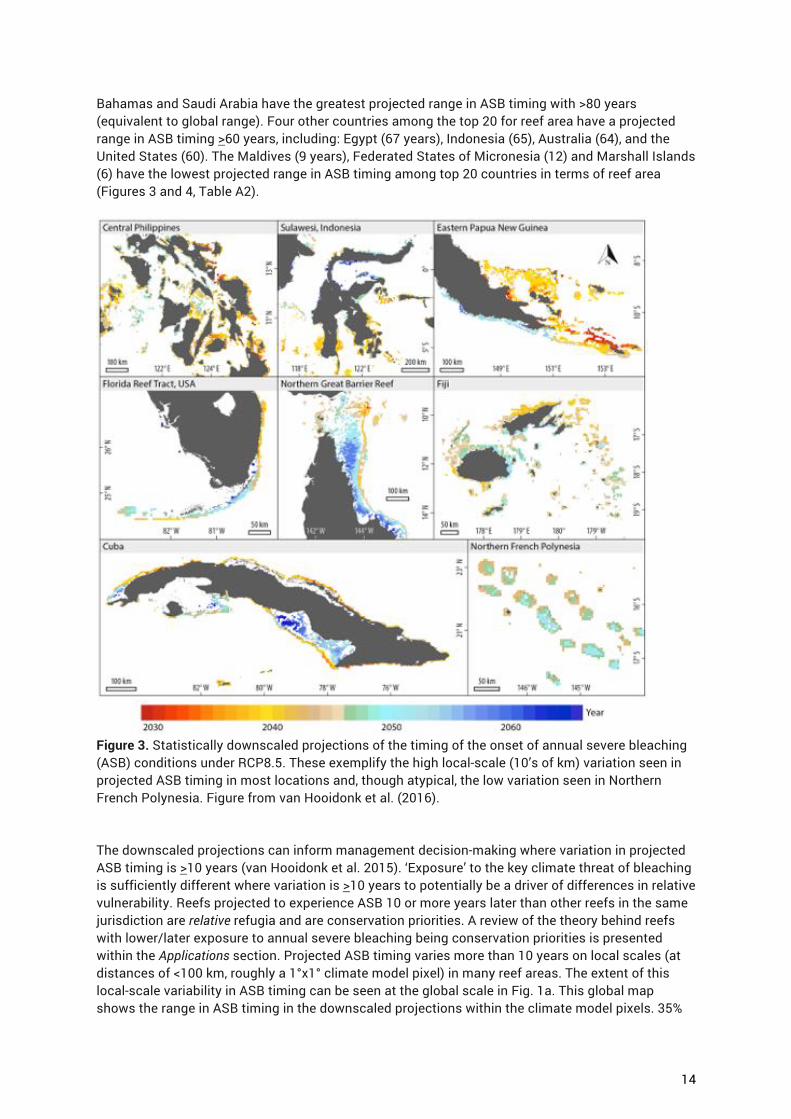
Bahamas and Saudi Arabia have the greatest projected range in ASB timing with >80 years (equivalent to global range). Four other countries among the top 20 for reef area have a projected range in ASB timing >60 years, including: Egypt (67 years), Indonesia (65), Australia (64), and the United States (60). The Maldives (9 years), Federated States of Micronesia (12) and Marshall Islands (6) have the lowest projected range in ASB timing among top 20 countries in terms of reef area (Figures 3 and 4, Table A2).
Figure 3. Statistically downscaled projections of the timing of the onset of annual severe bleaching (ASB) conditions under RCP8.5. These exemplify the high local-scale (10’s of km) variation seen in projected ASB timing in most locations and, though atypical, the low variation seen in Northern French Polynesia. Figure from van Hooidonk et al. (2016). The downscaled projections can inform management decision-making where variation in projected ASB timing is >10 years (van Hooidonk et al. 2015). ‘Exposure’ to the key climate threat of bleaching is sufficiently different where variation is >10 years to potentially be a driver of differences in relative vulnerability. Reefs projected to experience ASB 10 or more years later than other reefs in the same jurisdiction are relative refugia and are conservation priorities. A review of the theory behind reefs with lower/later exposure to annual severe bleaching being conservation priorities is presented within the Applications section. Projected ASB timing varies more than 10 years on local scales (at distances of <100 km, roughly a 1°x1° climate model pixel) in many reef areas. The extent of this local-scale variability in ASB timing can be seen at the global scale in Fig. 1a. This global map shows the range in ASB timing in the downscaled projections within the climate model pixels. 35%

15
of the 1990 reef-containing climate model pixels have a range in ASB timing in the downscaled projections >10 years.
Model pixels are not management units. Management of coral reefs primarily takes place within national jurisdiction. The range in projected ASB timing is >10 years in 82% (71 of 87) of the countries and territories with at least 500 km2 of coral reef (Table S1). In many areas there will be variation among relative refugia in exposure to anthropogenic stress. Management will have the greatest impact by targeting actions to reduce stress to relative refugia where anthropogenic stress is relatively high and most amenable to management influence (recommended in Mumby and Anthony (2015)). This strategy maximizes the likelihood that at least some reefs will be healthy in the future (Game et al. 2008) and continue to provide ecosystem goods and services. In some locations, projected ASB timing varies >20 years on scales <20 km (Figures 3 and 4). There is an inshore-offshore gradient in the northern Great Barrier Reef, Australia, with offshore locations projected to experience ASB 15-25 years earlier than inshore locations (Figure 3). This increases the impetus to reduce anthropogenic stress at inshore locations where, for example, efforts to reduce land-based sources of pollution and improve water quality will have greater impact anyway (De’ath and Fabricius 2010). There is an east-west gradient in eastern Papua New Guinea (PNG); islands to the east are projected to experience ASB >25 years earlier than reefs to the west on the southern side of PNG. A similar gradient is seen in the Philippines with eastern sides of the eastern islands projected to experience ASB >20 years earlier than central islands. The Philippines and eastern PNG results are likely explained by the eastern sides of these areas having greater exposure to the western Pacific warm pool, which has higher warming rates than SE Asia. Though atypical, there are also countries/territories (with >400 km2 of reef area) where variation in the projected ASB timing is <10 years. These are in the south Pacific (French Polynesia) and within the western Pacific warm pool (Tuvalu [ASB average and range – 2039, 9], Tokelau [2039, 4], and the Marshall Islands [2040, 6]). The high local-scale variation in projected ASB timing is due to variation in the difference between typical warm season temperatures and the maximum monthly mean (MMM). The MMM is the warmest month in the climatology (1982-2008) and is the threshold used to determine when temperatures become stressful to corals and cause bleaching (Gleeson and Strong 1995, van Hooidonk et al. 2015). Typical warm season temperatures in some locations are closer to MMM than typical temperatures at locations only 10’s of km away and these locations are projected to experience ASB sooner (and vice versa). Statistically downscaling the model-resolution projections ensures local-scale variation in differences between typical warm season temperatures and MMM are accounted for; i.e. rather than smoothed over through averaging, as is the case in the numerous studies that present model-resolution projections (Donner et al. 2007, Donner et al. 2009, van Hooidonk et al. 2013, 2014). However, these results should be interpreted with caution where currents are expected to shift under climate change (e.g. Pacific equatorial undercurrent, PEU (Blanke and Raynaud (1997)) or the Loop current (LC) in the Gulf of Mexico and western Caribbean (Liue et al. (2015)). In these locations, warm water residence times over reefs may decrease (PEU) or increase (LC) during warm seasons as the currents shift. Future research can include further development of dynamically downscaled projections of coral bleaching conditions, as regional ocean models become available and are parameterized.

16
Figure 4. Histograms showing the distribution in projected timing of annual severe bleaching conditions under RCP8.5 for the 10 countries and territories with the greatest reef area (see Table A2 for average years, standard deviation and range). Shading of bars: dark grey indicates relative climate losers, projected ASB before 2034, medium grey indicates global average of 2043 + 10 years (2034-2053), and light grey indicates relative climate winners (projected ASB after 2053). Figure from van Hooidonk et al. (2016).

17
Variation within and among Regional Seas: Introduction to the Appendix
The Regional Seas Programme was launched in 1974 and aims to address degradation of the world’s oceans and coastal areas through sustainable management and use of the marine and coastal environment, by engaging neighbouring countries in comprehensive and specific actions to protect their shared marine environment. It has accomplished this by stimulating the creation of Regional Seas programmes among countries sharing a common body of water. The Regional Seas programmes function through an Action Plan, in most cases underpinned with a strong legal framework in the form of a regional Convention and associated Protocols on specific problems.” (adapted from http://www.unep.org/regionalseas/about/) There is great regional variation in coral reef futures. The Appendix summarizes findings by region based on the 10 Regional Seas programmes with tropical coral ecosystems. We also include countries and territories within or adjacent to Regional Seas that are not party to Regional Seas conventions or do not participate in Action Plans, in keeping with the principles of an ecosystem approach. This includes projected timing of ASB under RCP8.5 for all countries and territories, regional averages, and identification of countries and territories with the earliest and latest projected ASB timing. Regionally important climate refugia are also identified, i.e. the ten areas within (or near) each Regional Sea area projected to experience ASB latest (relative climate refugia) that also meet the global criterion set for refugia of projected ASB conditions after 2052. The regions with the earliest average projected ASB timing are the Red Sea and Gulf of Aden (2039) and the Pacific Islands (2042). The regions with the latest projected ASB timing are the ROPME Sea
Area1 (2069) and South-East Pacific (2050). Countries/territories with the earliest and latest projected
ASB timing within each region area are shown in Table 1. The distribution of projected timing of ASB under RCP8.5 is presented for all countries and territories within tables and histograms in Appendix 1. Countries and territories are grouped based on Regional Seas programmes, but also including non-parties and reef areas near but not in the area covered by Regional Seas Conventions and Action Plans. For each region, the summaries in Appendix 1 present: the countries and territories with the greatest and least reef area; the average among countries and territories for projected timing of annual severe bleaching (ASB) conditions under RCP8.5; the countries/territories with the earliest and latest averages for projected timing of ASB under RCP8.5; and he countries/territories with the greatest numbers of relative climate losers and relative climate winners.
1 Includes coastal areas of Bahrain, I.R. Iran, Iraq, Kuwait, Oman, Qatar, Saudi Arabia, and the United Arab Emirates.

18
Table 1. Countries or territories with the earliest and latest average projected timing of ASB conditions within each region (based on the Regional Seas, also including countries and territories that do not participate in conventions or action plans and that fall outside the area covered by the Regional Seas. See Table A1 for classification).
Region Earliest Latest Wider Caribbean Turks and Caicos (2036) Bermuda (2050)
Western Africa St. Helena and Ascension Islands (2043) Cameroon (2055)
Red Sea and Gulf of Aden Israel (2012) Eritrea (2053) ROPME Sea Area Oman (2055) Bahrain (2084) East Africa Mozambique (2040) South Africa (2051)
South Asian Seas Chagos (2041) Sri Lanka (2050) East Asian Seas Taiwan (2037) China (2057)
Pacific Islands Federated States of Micronesia (2038) Pitcairn Island (2058)
South-East Pacific Ecuador (2042) Chile (2069) North-East Pacific Nicaragua (2038) El Salvador (2050)
Coral bleaching implications of climate policy
The average year for the projected timing of ASB under RCP4.5 is 2054, 11 years later than the average projected under RCP8.5 (Figure 5). ASB under RCP4.5 is projected to be >25 years later than under RCP8.5 for very few reefs (7%), and <10 years later for many reefs (32%). Spatial patterns in the projections are the same or very similar for business as usual and successful mitigation scenarios; i.e. meeting mitigation targets does not change which areas are relative climate refugia and thus conservation priorities. There is great spatial variation across the globe in the differences in projected ASB timing between RCP4.5 and 8.5 and a latitudinal gradient can be seen (Figure 2). Many high-latitude reefs in Australia, the south Pacific, Northwestern Hawaiian Islands, India, and the Florida Reef Tract have >25 more years before ASB occurs under RCP4.5 than 8.5. Low latitude locations in SE Asia, the Coral Triangle, and the eastern Pacific also have >25 more years before ASB occurs under RCP4.5 (Figure 2b). In contrast, there is <10 years difference between RCP4.5 and 8.5 for reefs near the equator that are projected to experience ASB relatively early. In summary, these projections suggest that
- successful mitigation in line with the Paris Agreement would buy some time for some reefs, but would not significantly change priority areas for reef management;
- the INDCs submitted as of September, 2016 will do little to provide reefs with more time to adapt and acclimate prior to severe bleaching conditions occurring annually;
- coral reef adaptation to the changing climate, continued ecosystem service provision, and recovery of areas that have already been or will inevitably be lost, requires redoubled efforts to reduce direct stress on reefs, as well as more ambitious climate change mitigation than the Paris Agreement.

19
Figure 5. Histograms showing the distribution in projected timing of annual severe bleaching conditions under two emissions scenarios, RCP 8.5 (a) and RCP 4.5 (b). The difference between these scenarios is shown in (c) for the 86% of reefs for which ASB is projected this century under both RCP8.5 and RCP4.5. Figure from van Hooidonk et al. (2016). The data table for these histograms is provided in Appendix 2.
4. Applications These downscaled projections can guide management and conservation planning, be used in education and outreach programs, and inform policy. The utility of the projections stems from how they describe and quantify climate change exposure of coral reefs and thus contribute to our understanding coral reef vulnerability. The projections can be used everywhere tropical coral reefs occur, but have most utility where there is a range in projected onset of ASB exceeding ten years. The level of urgency in applying the projections also varies to some extent between countries and territories depending on the current state of management and extent to which identified climate refugia are being sustainably managed. It is important to note that these projections should not be interpreted as predictions of exactly when bleaching will occur and do not imply that an area is safe from bleaching. Furthermore, recent bleaching does not mean an area is no longer a relative refugia or priority for management interventions Technical capacity required to apply the downscaled projections varies depending on location and the intended use. Additional, outside expertise may, for example, be required for using the projections in marine spatial planning processes.
Management and conservation planning
As the climate changes, environmental managers are increasingly akin to emergency room doctors undertaking triage (Anthony and Maynard 2011). Many areas are under threat, the likelihood areas will benefit from management varies, and financial resources for management are limited and often insufficient (CBD 2013), so strategic choices must be made to maximise benefits (Bellwood et al. 2004). This can be done through a variety of processes, including marine protected area (MPA) planning, Marine Spatial Planning (MSP) and Integrated Coastal Management (ICM) planning. The downscaled projections presented here can be included as data layers within such planning processes, to support spatial prioritization of management based on projected climate change exposure of coral reefs. Specific management actions can then be devised focusing on priority areas, in order to limit or shape human activities to reduce direct stress and promote reef resilience

20
(i.e. supporting and protecting the capacity of a reef to resist or recover from degradation and maintain provision of ecosystem goods and services (Mumby et al. 2007)). A very immediate application of the projections is in analysis of the extent to which existing MPAs and MPA networks protect relative climate winners, and to what extent their conservation outcomes may be jeopardized by inclusion of a disproportionate area of relative climate losers. Such analysis can support MPA network development and reducing vulnerability to climate change. There are two general guiding principles for use of the downscaled projections within management and spatial planning processes. These principles assume the goal is to maximize the number of healthy sites as the climate changes and hence the long-term provision of ecosystem goods and services from coral reefs. That goal is common in coral reef management and conservation but there are often other goals (i.e. minimizing user conflict) requiring trade-offs be made. Guiding principle 1 - Relative climate winners, i.e. identified relative refugia, are conservation priorities and
should be among the highest priorities for the targeting of stress reduction or other management actions. Relative climate winners are priorities because benefits of management actions have more time to manifest at these locations and are likely to last longer (relative to locations that are relative losers). Guiding principle 2 - Relative climate losers are not conservation priorities and are mostly low priorities in
the targeting of management actions. Relative climate losers are not conservation priorities because management efforts in these locations may either not have time to manifest or will not last as long (relative to locations that are relative winners). It is important to note that both principles are subject to the requirements of the planning process, planning objectives and other site/area features, and ultimately management decisions are likely to require consideration of many other factors, and are likely to entail some trade-offs. Guiding principle 1 is arguably more important than 2 and a precautionary approach implies emphasizing it more in planning processes. For example, there is some uncertainty associated with climate modeling and in some locations climate losers may not fare worse than winners (especially where differences in projected timing of ASB are comparatively small). Further, climate losers may already be under management interventions, removal or reduction of which could have detrimental impacts. Given the current emissions trajectory, planning processes may use the spatial data on the projected timing of the onset of ASB conditions, focusing on business-as-usual RCP8.5 (see Accessing the projections section). GIS programs such as ArcGIS can be used to identify relative climate losers and winners within any geographic area the user sets (i.e. country or other management jurisdiction). Countries and territories with a range for projected ASB timing that extends beyond 2052 can consider ‘global relative climate winners’ as primary conservation priorities. However, most countries and territories have few or none of these global relative climate winners, and should instead focus on identification of reef areas that are climate winners relative to other reef areas within the country, territory or management jurisdiction. The average projected timing of ASB is shown for all countries and territories within Table A1.2, along with the standard deviation around this average. Reef areas projected to experience ASB later than the average + 1 standard deviation are relative climate winners and typically represent <20% of the reef pixels in the country or territory. GIS technicians can easily identify these reef areas using logic functions that query the raster data grid for locations with values in the desired date range (i.e. after country avg+1SD). Importantly, the guiding principles we present serve as a caution to strict implementation of a representation and replication approach. Representation and replication remains a valuable method

21
to protecting biodiversity and spreading risk. However, representation and replication will result in greater long-term management gains if relative climate winners are prioritized and losers are avoided to the extent possible.
Vulnerability assessment and adaptation planning
Long-term coral reef health depends on climate change vulnerability, which is driven by exposure to climate stress (modeled here for bleaching driven by climate change here), and by reef resilience (GBRMPA 2007, Marshall and Marshall 2007). Vulnerability of coral reefs in turn affects communities and businesses dependent on their ecosystem services. Reducing vulnerability is thus one of the primary goals in coral reef planning and management, and needs to be informed by vulnerability assessments. The downscaled projections presented here can, for example, support vulnerability assessment in coral reef areas and among coral reef dependent people (e.g. reef fishers) as well as economic sectors (e.g. reef and beach tourism). The projections enable identification of areas that are likely to be exposed to severe climate change impacts relatively soon, and thus stand to lose ecosystem services sooner than other areas. This can contribute to adaptation planning in the fisheries and tourism sector, e.g. by helping to identify where introduction of different livelihood strategies may be needed, or how and where to invest in tourism development. However, management actions are likely to result in the greatest long-term benefits if focused on coral reefs that are relative climate winners and have high relative resilience. By combining the downscaled projections of bleaching conditions (exposure) with information on spatial variation in relative resilience potential (sensitivity and adaptive capacity) of coral reefs, coral reef vulnerability can be assessed. Key resilience indicators were identified by McClanahan et al. 2012 and that study, along with Maynard et al. (2015), describe a method for calculating and comparing relative resilience potential among reef areas, as well as anthropogenic stress on these areas. Maynard et al. (2015) also present a decision-support framework where relative resilience classes and anthropogenic stress data can be examined together to identify concrete management actions. For example, high resilience sites where fishing pressure is also high represent priorities for fishery regulations and enforcement. The downscaled projections of bleaching conditions add another information layer by enabling identification of sites with high relative resilience potential that are also relative climate winners. Many resilience indicators are included as part of standard coral reef monitoring programs, although such programmes cover only a relatively small part (<10%) of the world’s coral reefs. Resilience can also be assessed semi-quantitatively, usually over relatively limited areas or with uneven spatial distribution. However, reef resilience assessments are increasingly being undertaken e.g. as a part of MPA planning efforts, meaning the opportunities to combine the downscaled projections presented here with resilience information are growing. To further support this, process guidance on resilience assessment of coral reefs for decision support is currently being prepared, expected to be published in 2017.
Stakeholder consultation, education and outreach
Maps of the projected timing of the onset of annual severe bleaching conditions can be powerful consultation, education and outreach tools. All projections results have been made available as images, files viewable through Google Earth, and as spatial data to facilitate use for these purposes

22
(see the Accessing the projections section below). Visualizing the future threat of bleaching in locations relevant to stakeholders helps them see the climate change threat to reefs and its implications. Many reef stakeholders are aware of the threat posed by bleaching and know that coral bleaching events will increase in frequency and severity under climate change. However, often reef stakeholders do not fully understand what this means for the reefs they use or depend on. Through collective viewing of the projections as maps, stakeholders become engaged in understanding the spatial patterns and what increasingly frequent bleaching means for the future provision of ecosystem gods and services from local reefs. Because of this the projections are well suited for stakeholder consultation in relation to coastal management planning, MPA and marine spatial planning as well as climate change adaptation planning. The projections are also useful for educational purposes, perhaps in particular in training related to coral reef planning and management as well as vulnerability assessment and adaptation planning in reef areas. The projections can also be used with students of coral reef biology, marine environmental planning and management and climate change, at multiple levels of formal education. Lastly, the projections can be used for a variety of awareness and outreach raising purposes, in particular on the threats of climate change, the vulnerability of coral reefs, the possible costs of inaction and opportunities for action in relation to climate change mitigation, adaptation and environmental management. The findings are applicable in all coral reef areas of the world, and can be used to target a range of audiences. In all utilization of the projections, whether for stakeholder consultation, education or outreach, it should be noted that many are likely to find the projections concerning. Indeed, many may not fully appreciate that all coral reefs are projected to experience bleaching conditions annually this century, large reef tracts even in the coming couple of decades. While it is important to be realistic about the future of reefs during climate change, it is recommended that consultation, education and awareness raising activities also emphasize how the projections can be used to support management and conservation efforts that reduce vulnerability to climate change.
Policy
The downscaled projections have a number of policy applications, spanning development, natural resource use, environmental management and climate change policy. Adoption of the 2030 development agenda and Sustainable Development Goals (SDGs) provides an opportunity to change the course for coral reefs and dependent people, and full implementation of the SDGs would address many of the root causes of coral reef degradation. By providing a holistic and comprehensive programme that cuts across the three dimensions of sustainable development, and by committing all countries to delivering all the Goals, the barriers to sustainable coral reef management have been lowered. The projections can be directly used in national planning processes for SDG implementation, including in particular planning for Sustainable Development Goal 14, target 2 “sustainably manage and protect marine and coastal ecosystems to avoid significant adverse impacts, including by strengthening their resilience”; and target 5 “conserve at least 10 per cent of coastal and marine areas”, but also target 1 “prevent and significantly reduce marine pollution”.

23
Furthermore, the projections may be applicable in planning related to other SDGs, implementation of which is essential to safeguard coral reefs and which require some consideration of the vulnerability of and ecosystem services provided by coral reefs. This includes e.g. Goal 1 on poverty; 2 on food security; 6 on water and sanitation; 12 on sustainable consumption and production; and 13 on climate change. In this regard, the projections can inform policies related to fisheries, coastal development, and land-use planning, all of which influence climate change vulnerability of reefs. For example, the projections can make a case for moderating land use change and agricultural impacts in the watershed of relative climate winner reefs, or placing restrictions on fishing gear that disproportionately targets species that maintain resilience at high priority sites. In relation to climate change policy, the projections can be used to inform decisions both relating to mitigation and adaptation. It is clear that the success of the Paris Agreement depends on progressively more ambitious national mitigation actions, through preparation of Nationally Determined Contributions (NDCs). These are expected to reflect the highest possible ambition. By illustrating implications of two mitigation scenarios for reef health and ecosystem service provision, the projections can help make a case for ambitious NDCs. The Paris Agreement also establishes a qualitative adaptation goal, to enhance adaptive capacity, strengthen resilience, and reduce vulnerability in the context of the temperature goal. In this regard, the projections can be applied towards assessment of vulnerability and adaptation needs in key coastal sectors, and directly used in the preparation of National Adaptation Plans as well as in sub-national or sectoral adaptation plans.
5. Further development of downscaled projections Rising sea temperatures are likely to increase the frequency of epizootic diseases affecting reef-building corals through impacts on coral hosts as well as pathogens. Maynard et al. (2015b) presents and compares climate model projections (at the coarse model resolution of 1°x1°) of temperature conditions that will increase 1) coral susceptibility to disease, 2) pathogen abundance, and 3) pathogen virulence, under RCP8.5 and RCP4.5. Under both scenarios, >95% of reef locations are projected to experience at least 2 of the 3 temperature conditions favoring disease development in the next 20 years. Notably, these thresholds are exceeded before annual severe bleaching conditions occur. This study also examined spatial variation in ‘Integrated Local Threat’ from Reefs at Risk Revisited, which combines watershed-based pollution, marine-based pollution, coastal development and overfishing. At ~20% of reef locations, high or very high anthropogenic stress will further enhance disease likelihood. These results indicate that disease is as likely to cause coral mortality as bleaching is in the coming decades. The projections identify priority locations to reduce anthropogenic stress and test management interventions to reduce disease impacts. The model-resolution projections of disease-promoting conditions can be downscaled to 4-km, as part of a research effort that builds on the work presented here. Consequently, confidence in the identification of relative climate winners and losers, as is presented here, would increase as would the impetus to avoid identified losers and prioritize identified winners for management actions.

24
6. Accessing the projections To facilitate use of the projections, the results for RCP8.5 and RCP4.5 have been made publicly accessible via the Environment Live and NOAA Coral Reef Watch (CRW) websites. Environment Live (http://environmentlive.unep.org/theme/index/19): The projections can be accessed by selecting ‘Coral reefs’ from the Themes drop-down menu. This provides a map that shows coral reef locations in blue. Above this map there are tabs, including ‘Maps’, ‘Data’, and ‘About’. By selecting ‘Maps’ a drop-down appears and maps of the four projection scenarios can be accessed: bleaching conditions twice per decade and annually under RCP8.5 and RCP4.5. Under ‘Data’, users can download a layer package (*.lpk) viewable in ArcGIS (versions 10 and above). Upon opening the package, all four global data layers will be accessible and color ramps that we suggest will be applied automatically. The ‘About’ page provides background on coral bleaching and thermal stress, describes the projections methods and main findings, and reviews management, conservation and policy applications. NOAA CRW (http://coralreefwatch.noaa.gov/satellite/index.php): The projections can be accessed by selecting Research Activities from among the options on the left side of the homepage. A list will appear below the Research Activities heading. Users then need to select ‘Projections: Bleaching 4-km’ to open a page that contains a description of the projections as well as links to Google Earth files, images and the layer package described above also made available through Environment Live. For a rapid overview of the projections results, users should view the images made available on both the Environment Live and NOAA CRW websites. Users that want to view the results interactively should download the KMZ files and open these with the newest version of Google Earth. Users interested in combining the projections data layers with other data, producing custom maps, and including these data layers within planning exercises should download and view the layer package in ArcGIS.

25
7. References
Agardy, T., di Sciara, G. N. & Christie, P. Mind the gap Addressing the shortcomings of marine protected areas through large scale marine spatial planning. Marine Policy 35, 226–232 (2011).
Anthony, K. R. N. et al. Operationalizing resilience for adaptive coral reef management under global environmental change. Glob. Change Biol. n/a–n/a (2014). doi:10.1111/gcb.12700
Anthony, K. R. N., & Maynard, J. A. Coral reefs in the emergency room: continued carbon emissions will increase the need for intensive care. Carbon Management, 2, 215-218 (2011).
Baker, A. C. Ecosystems: reef corals bleach to survive change. Nature 411, 765–766 (2001). Baker, A. C., Starger, C. J., McClanahan, T. R. & Glynn, P. W. Coral reefs: Corals' adaptive response to
climate change. Nature 430, 741–741 (2004). Bellwood, D. R., Hughes, T. P., Folke, C., & Nyström, M. Confronting the coral reef crisis. Nature, 429,
827-833 (2004). Blanke, B. & Raynaud, S. Kinematics of the Pacific Equatorial Undercurrent: an Eulerian and
Lagrangian approach from GCM results. Journal of Physical Oceanography 27, 1038–1053 (1997).
Casey, K. S., Casey, Brandon, T. B., Cornillon, P. & Evans, R. in Oceanography from Space: Revisited (Springer, 2010). doi:10.1007/978-90-481-8681-5_16
CBD, 2013. Resourcing the Aichi biodiversity targets: a first assessment of the resources required for implementing the strategic plan for biodiversity 2011-2020. Report of the high-level panel on global assessment of resources for implementing the strategic plan for biodiversity 2011-2020.
De'ath, G. & Fabricius, K. Water quality as a regional driver of coral biodiversity and macroalgae on the Great Barrier Reef. Ecological Applications 20, 840–850 (2010).
Donner, S. Coping with Commitment: Projected Thermal Stress on Coral Reefs under Different Future Scenarios. PLoS ONE 4, e5712 (2009).
Donner, S., Knutson, T. & Oppenheimer, M. Model-based assessment of the role of human-induced climate change in the 2005 Caribbean coral bleaching event. Proc. Natl Acad. Sci. 104, 5483–5488 (2007).
Donner, S., Skirving, W., Little, C., Oppenheimer, M. & Hoegh-Guldberg, O. Global assessment of coral bleaching and required rates of adaptation under climate change. Glob. Change Biol. 11, 2251–2265 (2005).
Douglas, A. E. Coral bleaching--how and why? Marine Pollution Bulletin 46, 385–392 (2003). Game, E. T., McDonald-Madden, E., Puotinen, M. L. & Possingham, H. P. Should we protect the strong
or the weak? Risk, resilience, and the selection of marine protected areas. Conservation Biology 22, 1619–1629 (2008).
GBRMPA. Climate change and the great barrier reef; a vulnerability assessment. Great Barrier Reef Marine Park Authority, Townsville, QLD, Australia (2007).
Gleeson, M. W., and A. E. Strong. "Applying MCSST to coral reef bleaching. "Advances in Space
Research 16.10 (1995): 151-154. Knutti, R., Furrer, R., Tebaldi, C., Cermak, J. & Meehl, G. A. Challenges in Combining Projections from
Multiple Climate Models. Journal of Climate 23, 2739–2758 (2010). Liu Y., Lee S-K., Muhling B.A., Lamkin J.T., Enfield D.B. Significant reduction of the Loop Current in
the 21st century and its impact on the Gulf of Mexico. Journal of Geophysical Research, 117, C05039 (2012).

26
Liu, Y. et al. Potential impact of climate change on the Intra-Americas Sea: Part-1. A dynamic downscaling of the CMIP5 model projections. Journal of Marine Systems 148, 56–69 (2015).
Marshall, N. A. & Marshall, P. A. Conceptualizing and operationalizing social resilience within commercial fisheries in northern Australia. Ecology and Society 12, 1–14 (2007).
Maynard, J. et al. Projections of climate conditions that increase coral disease susceptibility and pathogen abundance and virulence. Nature Climate Change 5, 688–694 (2015).
Mills, M. et al. Real-world progress in overcoming the challenges of adaptive spatial planning in marine protected areas. Biological Conservation 181, 54–63 (2015).
Moss, R. H., Edmonds, J. A., Hibbard, K. A., Manning, M. R., Rose, S. K., Van Vuuren, D. P., ... & Meehl, G. A. The next generation of scenarios for climate change research and assessment. Nature, 463(7282), 747-756 (2010).
Mumby, P. J. & Anthony, K. R. N. Resilience metrics to inform ecosystem management under global change with application to coral reefs. Methods Ecol Evol 6, 1088–1096 (2015).
Mumby, P., Hastings, A. & Edwards, H. Thresholds and the resilience of Caribbean coral reefs. Nature 450, 98–101 (2007).
Sun C., Feng M., Matear R.J., Chamberlain M.A., Craig P., Ridgway K.R., Schiller A. Marine downscaling of a future climate scenario for Australian boundary currents. Journal of Climate, 25, 2947–2962 (2012).
Turner, B. L. et al. A framework for vulnerability analysis in sustainability science. Proc. Natl Acad.
Sci. 100, 8074–8079 (2003). van Hooidonk, R. & Huber, M. Quantifying the quality of coral bleaching predictions. 28, 579–587
(2009). van Hooidonk, R. J., Maynard, J. A., Manzello, D. & Planes, S. Opposite latitudinal gradients in
projected ocean acidification and bleaching impacts on coral reefs. Glob. Change Biol. 20, 103–112 (2014).
van Hooidonk, R., Maynard, J. A. & Planes, S. Temporary refugia for coral reefs in a warming world. Nature Climate Change 3, 1–4 (2013).
van Hooidonk, R., Maynard, J. A., Liu, Y. & Lee, S.-K. Downscaled projections of Caribbean coral bleaching that can inform conservation planning. Glob. Change Biol. 21, 3389–3401 (2015).
Watts, M. E. et al. Marxan with Zones: Software for optimal conservation based land- and sea-use zoning. Environmental Modelling & Software 24, 1513–1521 (2009).
Wilby, R. L., & Wigley, T. M. L. Downscaling general circulation model output: a review of methods and limitations. Progress in physical geography, 21(4), 530-548 (1997).

27
Appendix 1. Regional Summaries Contents:
Regional Seas and Coral Reefs .......................................................................................................................... 28Introduction to Regional Seas Summaries ........................................................................................................ 28Table A1.1. Regions ............................................................................................................................................ 29Table A1.2. Country and territory summaries ................................................................................................... 31Wider Caribbean .................................................................................................................................................. 42Western Africa ..................................................................................................................................................... 46Red Sea and Gulf of Aden ................................................................................................................................... 49ROPME Sea Area ................................................................................................................................................. 51Eastern Africa / Western Indian Ocean ............................................................................................................. 53South Asian Seas ................................................................................................................................................ 55East Asian Seas .................................................................................................................................................. 57Pacific Islands ..................................................................................................................................................... 60South-East Pacific .............................................................................................................................................. 63North-East Pacific ............................................................................................................................................... 65

28
Regional Seas and Coral Reefs Today, more than 143 countries participate in 14 Regional Seas programmes established under the auspices of UNEP. The 10 Regional Seas that contain coral reefs (listed starting with the Wider Caribbean and moving east), include: Wider Caribbean, Western Africa, Red Sea and Gulf of Aden, ROPME Sea Area, Eastern Africa, South Asian Seas, East Asian Seas, Pacific, South-East Pacific, and North-East Pacific. These Regional Seas governance mechanisms are the basis for presentation of findings in this report. However, coral reef ecosystems often span political boundaries and jurisdictions. Because of this, and in keeping with an ecosystem approach, countries and territories with tropical coral reefs in or near the geographic area of a Regional Sea but not parties to Regional Seas Conventions and/or not participating in Action Plans have also been included.
Table A1.1 Lists the regions, relevant Regional Seas Conventions and/or Action Plans, and countries and territories with coral reefs. Table A1.2 presents summary data for each country and territory with coral reefs, for the projected timing of the onset of annual severe bleaching (ASB) conditions under RCP8.5, including: the number of reef pixels, the average projected timing of ASB, the range in projected timing of ASB (earliest to latest timing of ASB among reef pixels), and standard deviation among climate models in ASB timing. This table also shows the number and percent of reef pixels in seven 5-year bins, which is the basis for the histograms in the individual Regional Seas Summaries.
Introduction to Regional Seas Summaries Each of the Regional Seas summaries lists: 1. The countries and/or territories with the greatest and least reef area. 2. The average among countries and territories for projected timing of ASB conditions under
RCP8.5; 3. The countries/territories with the earliest and latest averages for projected timing of ASB under
RCP8.5; 4. The countries/territories with the greatest numbers of relative climate losers and relative
climate winners. 5. The locations projected to experience ASB conditions latest: these are regionally important
relative climate refugia that also meet the global criterion for refugia of projected ASB after 2052.
The summaries also provide histograms that present the distribution in the data (among reef-containing 4-km pixels) of the projected timing of the onset of annual severe bleaching (ASB) under RCP8.5. Within these histograms, the data bars are in grey scale with three tones. Projected timing of the onset of ASB before 2030 represent relative climate losers (more than 12 years prior to the global average of 2043); these are in dark grey. ASB within 12 years of the global average (2030-2055) are in the medium grey tone. Projected ASB timing more than 12 years after the global average of 2043 (i.e. after 2055) represent relative climate winners; these are in light grey.

29
Table A1.1. Regions
Regions are defined based on the UNEP Regional Seas programmes, related Conventions and Action Plans. Countries and territories are listed in alphabetical order, only including those that have coral reefs. *Asterisks indicate country, territory or reef tract in or near the geographic area of the Regional Sea but not party to the relevant Convention or not participating in the Action Plan. Regions, based on Regional Seas programmes
Full Title of the relevant Regional Seas Convention or Action Plan
Countries, territories and reef tracts
Wider Caribbean including the Western Atlantic
Cartagena Convention for the Protection and Development of the Marine Environment of the Wider Caribbean (Cartagena Convention)
Anguila, Antigua and Barbuda, Aruba, the Bahamas, Barbados, Belize, Bonaire and Sint Eustasius and Saba, British Virgin Islands, Cayman Islands, Colombia, Costa Rica, Cuba, Curacao, Dominica, Dominican Republic, French Guiana, Grenada, Guadeloupe, *Haiti, *Honduras, Jamaica, Martinique, Mexico, Montserrat, Netherlands Antilles, Nicaragua, Panama, Puerto Rico, St. Kitts and Nevis, Saint Lucia, Saint Martin, Sint Maarten, St. Vincent and the Grenadines, Trinidad and Tobago, Turks and Caicos Islands, United States of America (Florida and Texas), United States Virgin Islands, Venezuela as well as *Bermuda and *Brazil
Western Africa including the eastern Atlantic
Abidjan Convention for Cooperation in the Protection and Development of the Marine and Coastal Environment of the West and Central African Region (Abidjan Convention)
Cameroon, Equitorial Guinea, *Cape Verde, *Saint Helena and Ascension Island, *Sao Tome and Principe
Red Sea and Gulf of Aden
Regional Convention for the Conservation of the Red Sea and Gulf of Aden Environment (Jeddah Convention)
Djibouti, Egypt, *Eritrea, *Israel, Jordan, Saudi Arabia, Somalia, Sudan, Yemen
ROPME Sea Area Kuwait Regional Convention for Cooperation on the Protection of the Marine Environment from Pollution (Kuwait Convention)
Bahrain, I.R. Iran, Kuwait, Oman, Qatar Saudi Arabia, United Arab Emirates

30
Eastern Africa (Western Indian Ocean)
Nairobi Convention for the Protection, Management and Development of the Marine and Coastal Environment of the Eastern African Region (Nairobi Convention)
Comoros, Kenya, Madagascar, Mauritius, Mayotte, Mozambique, Reunion Island (France), Seychelles, Somalia, South Africa, and Tanzania
South Asian Seas including the central Indian Ocean
South Asian Seas Action Plan (SASAP)
Bangladesh, *Chagos, India, Maldives, Sri Lanka
East Asian Seas including the coral triangle and Japan
East Asian Seas Action Plan *Australia, *Brunei, Cambodia, People's Republic of China, *Christmas Island, Indonesia, *Japan, Malaysia, *Myanmar, *Paracel Islands, Philippines, Singapore, *Spratly Islands, *Taiwan, Thailand, *Timor-Leste, Vietnam
Pacific Islands Noumea Convention for the Protection of the Natural Resources and Environment of the South Pacific Region (Noumea Convention)
American Samoa, Australia, Cook Islands, Federated States of Micronesia, Fiji, French Polynesia, Kiribati, Marshall Islands, Nauru, New Caledonia, New Zealand, Niue, Northern Mariana Islands and Guam, Palau, Papua New Guinea, *Pitcairn Islands, Samoa, Solomon Islands, Tokelau, Tong , Tuvalu, *United States (Hawaii), *US Minor Outlying Islands, Vanuatu, Wallis and Futuna
South-East Pacific Convenio para la Protección del Medio Marino y la Zona Costera del Pacífico Sudeste (Lima Convention)
Chile, Colombia, Ecuador, Panama (not a member of CPPS but party to the Lima Convention)
North-East Pacific Convention for Cooperation in the Protection and Sustainable Development of the Marine and Coastal Environment of the Northeast Pacific (not yet in force)
*Clipperton Island, *Cocos Island, Colombia, Costa Rica, El Salvador, Honduras, Mexico, Nicaragua and Panama
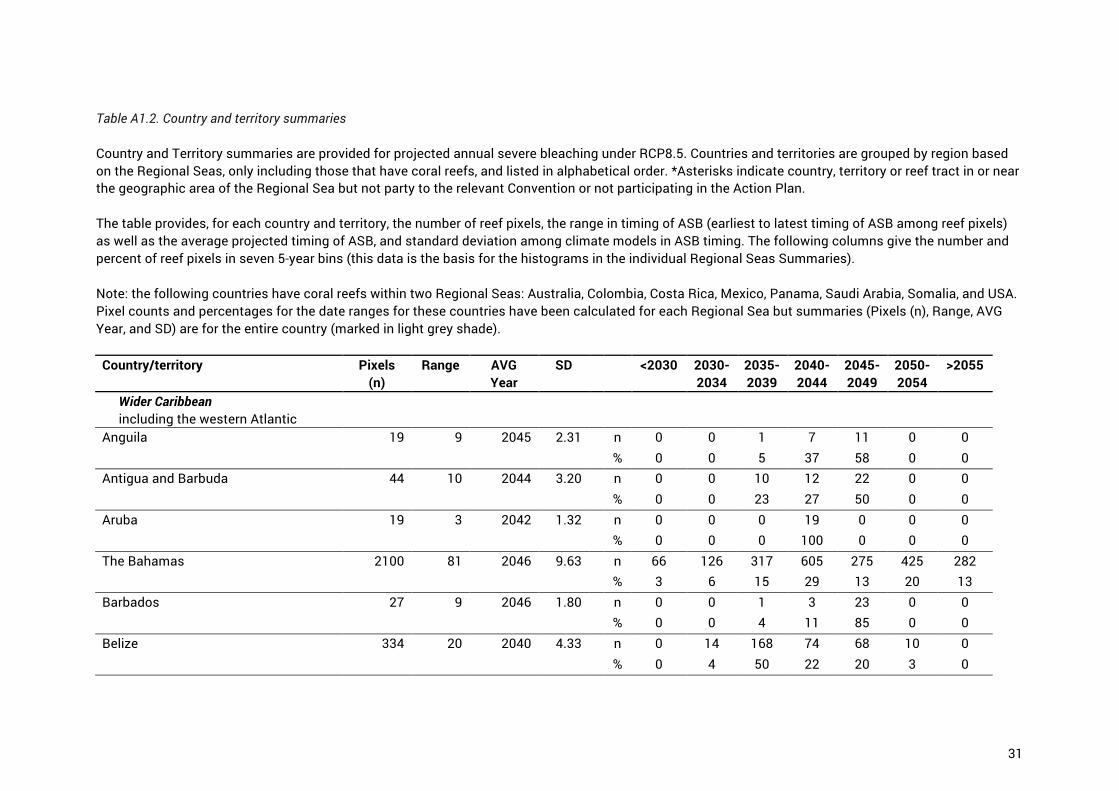
31
Table A1.2. Country and territory summaries
Country and Territory summaries are provided for projected annual severe bleaching under RCP8.5. Countries and territories are grouped by region based on the Regional Seas, only including those that have coral reefs, and listed in alphabetical order. *Asterisks indicate country, territory or reef tract in or near the geographic area of the Regional Sea but not party to the relevant Convention or not participating in the Action Plan. The table provides, for each country and territory, the number of reef pixels, the range in timing of ASB (earliest to latest timing of ASB among reef pixels) as well as the average projected timing of ASB, and standard deviation among climate models in ASB timing. The following columns give the number and percent of reef pixels in seven 5-year bins (this data is the basis for the histograms in the individual Regional Seas Summaries). Note: the following countries have coral reefs within two Regional Seas: Australia, Colombia, Costa Rica, Mexico, Panama, Saudi Arabia, Somalia, and USA. Pixel counts and percentages for the date ranges for these countries have been calculated for each Regional Sea but summaries (Pixels (n), Range, AVG Year, and SD) are for the entire country (marked in light grey shade). Country/territory Pixels
(n) Range AVG
Year SD <2030 2030-
2034 2035-2039
2040-2044
2045-2049
2050-2054
>2055
Wider Caribbean
including the western Atlantic
Anguila 19 9 2045 2.31 n 0 0 1 7 11 0 0 % 0 0 5 37 58 0 0
Antigua and Barbuda 44 10 2044 3.20 n 0 0 10 12 22 0 0 % 0 0 23 27 50 0 0
Aruba 19 3 2042 1.32 n 0 0 0 19 0 0 0 % 0 0 0 100 0 0 0
The Bahamas 2100 81 2046 9.63 n 66 126 317 605 275 425 282 % 3 6 15 29 13 20 13
Barbados 27 9 2046 1.80 n 0 0 1 3 23 0 0 % 0 0 4 11 85 0 0
Belize 334 20 2040 4.33 n 0 14 168 74 68 10 0 % 0 4 50 22 20 3 0

32
Country/territory Pixels (n)
Range AVG Year
SD <2030 2030-2034
2035-2039
2040-2044
2045-2049
2050-2054
>2055
Bermuda* 70 16 2050 3.77 n 0 0 0 4 39 18 9 % 0 0 0 6 56 26 13
Bonaire, Sint Eustasius, Saba 55 7 2044 2.12 n 0 0 2 28 25 0 0 % 0 0 4 51 45 0 0
Brazil* 349 24 2043 4.82 n 0 0 126 129 60 20 14 % 0 0 36 37 17 6 4
British Virgin Islands 59 9 2044 2.87 n 0 0 13 19 27 0 0 % 0 0 22 32 46 0 0
Cayman Islands 43 7 2039 1.85 n 0 0 27 16 0 0 0 % 0 0 63 37 0 0 0
Colombia 189 43 2043 5.28 n 0 0 0 0 2 9 0 % 0 0 0 0 18 82 0
Costa Rica 77 28 2049 5.90 n 0 2 7 9 9 37 13 % 0 3 9 12 12 48 17
Cuba 1385 48 2045 8.85 n 8 142 318 311 142 206 258 % 1 10 23 22 10 15 19
Curacao 39 4 2041 1.32 n 0 0 6 33 0 0 0 % 0 0 15 85 0 0 0
Dominica 27 6 2045 1.80 n 0 0 0 7 20 0 0 % 0 0 0 26 74 0 0
Dominican Republic 273 28 2041 3.67 n 1 3 115 102 50 2 0 % 0 1 42 37 18 1 0
French Guiana 1 0 2038 0 n 0 0 1 0 0 0 0 % 0 0 100 0 0 0 0
Grenada 38 12 2045 2.37 n 0 0 1 14 20 3 0 % 0 0 3 37 53 8 0
Guadeloupe 78 9 2046 1.73 n 0 0 1 13 64 0 0

33
Country/territory Pixels (n)
Range AVG Year
SD <2030 2030-2034
2035-2039
2040-2044
2045-2049
2050-2054
>2055
% 0 0 1 17 82 0 0 Haiti* 313 23 2040 3.41 n 0 15 199 69 26 4 0
% 0 5 64 22 8 1 0 Honduras* 226 20 2042 3.45 n 0 0 112 60 47 6 1
% 0 0 50 27 21 3 0 Jamaica 223 14 2040 2.42 n 0 3 133 81 6 0 0
% 0 1 60 36 3 0 0 Martinique 52 6 2046 1.29 n 0 0 0 6 46 0 0
% 0 0 0 12 88 0 0 Mexico 371 62 2039 8.44 n 18 105 124 21 39 21 21
% 5 30 36 6 11 6 6 Montserrat 8 7 2042 2.27 n 0 0 2 5 1 0 0
% 0 0 25 63 13 0 0 Nicaragua 278 14 2038 2.52 n 0 9 222 45 2 0 0
% 0 3 80 16 1 0 0 Panama 348 42 2045 6.96 n 0 7 100 48 18 68 14
% 0 3 39 19 7 27 5 Puerto Rico 182 17 2042 3.06 n 0 0 83 61 37 1 0
% 0 0 46 34 20 1 0 St. Kitts and Nevis 27 8 2043 2.95 n 0 0 6 9 12 0 0
% 0 0 22 33 44 0 0 St. Lucia 28 9 2045 2.30 n 0 0 2 7 19 0 0
% 0 0 7 25 68 0 0 Saint Martin 17 11 2041 3.19 n 0 0 11 4 1 1 0
% 0 0 65 24 6 6 0 Sint Maarten 3 3 2045 1.73 n 0 0 0 1 2 0 0
% 0 0 0 33 67 0 0

34
Country/territory Pixels (n)
Range AVG Year
SD <2030 2030-2034
2035-2039
2040-2044
2045-2049
2050-2054
>2055
St. Vincent and The Grenadines 29 3 2046 1.05 n 0 0 0 4 25 0 0 % 0 0 0 14 86 0 0
Trinidad and Tobago 34 19 2047 3.52 n 0 0 1 5 21 5 2 % 0 0 3 15 62 15 6
Turks and Caicos Islands 117 18 2036 3.68 n 1 58 39 19 0 0 0 % 1 50 33 16 0 0 0
United States (Florida and Texas) 1417 60 2042 4.80 n 0 0 24 92 43 73 24 % 0 0 9 36 17 29 9
US Virgin Islands 62 7 2044 2.66 n 0 0 11 22 29 0 0 % 0 0 18 35 47 0 0
Venezuela 193 33 2047 6.79 n 0 0 12 81 34 43 23 % 0 0 6 42 18 22 12
Western Africa
including the eastern Atlantic
Cameroon 1 0 2055 0 n 0 0 0 0 0 0 1 % 0 0 0 0 0 0 100
Equatorial Guinea 3 8 2044 4.36 n 0 0 1 0 2 0 0 % 0 0 33 0 67 0 0
Cape Verde* 1 0 2045 0 n 0 0 0 0 1 0 0 % 0 0 0 0 100 0 0
St. Helena and Ascension Islands* 1 0 2043 0 n 0 0 0 1 0 0 0 % 0 0 0 100 0 0 0
Sao Tome and Principe* 1 0 2043 0 n 0 0 0 1 0 0 0 % 0 0 0 100 0 0 0
Red Sea and Gulf of Aden Djibouti 84 15 2046 3.87 n 0 0 0 41 13 26 4
% 0 0 0 49 15 31 5

35
Country/territory Pixels (n)
Range AVG Year
SD <2030 2030-2034
2035-2039
2040-2044
2045-2049
2050-2054
>2055
Egypt 843 67 2041 18.50 n 243 44 53 60 71 64 308 % 29 5 6 7 8 8 37
Eritrea* 503 53 2053 10.86 n 0 1 5 113 88 146 150 % 0 0 1 22 17 29 30
Israel* 4 22 2017 9.95 n 3 1 0 0 0 0 0 % 75 25 0 0 0 0 0
Jordan 4 4 2012 2.00 n 4 0 0 0 0 0 0 % 100 0 0 0 0 0 0
Saudi Arabia 1311 82 2037 10.82 n 195 314 437 240 40 9 45 % 15 25 34 19 3 1 4
Somalia 153 25 2048 4.17 n 0 0 0 6 14 11 2 % 0 0 0 18 42 33 6
Sudan 257 23 2049 3.81 n 0 0 0 16 129 84 28 % 0 0 0 6 50 33 11
Yemen 312 28 2045 5.94 n 0 1 45 160 19 56 31 % 0 0 14 51 6 18 10
ROPME Sea Area Bahrain 73 25 2084 4.45 n 0 0 0 0 0 0 33
% 0 0 0 0 0 0 100 Iran 107 21 2068 5.27 n 0 0 0 0 0 0 107
% 0 0 0 0 0 0 100 Kuwait 5 5 2086 2.12 n 0 0 0 0 0 0 2
% 0 0 0 0 0 0 100 Oman 192 37 2055 8.17 n 0 1 11 21 19 34 106
% 0 1 6 11 10 18 55 Qatar 45 21 2077 8.24 n 0 0 0 0 0 0 34
% 0 0 0 0 0 0 100

36
Country/territory Pixels (n)
Range AVG Year
SD <2030 2030-2034
2035-2039
2040-2044
2045-2049
2050-2054
>2055
Saudi Arabia 1311 82 2037 10.82 n 0 0 0 0 0 0 31 % 0 0 0 0 0 0 100
United Arab Emirates 98 79 2079 11.64 n 1 0 0 0 0 0 61 % 2 0 0 0 0 0 98
Eastern Africa
Western Indian Ocean
Comoros 104 14 2042 2.42 n 0 1 36 62 5 0 0 % 0 1 35 60 5 0 0
Kenya 159 24 2047 3.28 n 0 0 3 21 92 38 5 % 0 0 2 13 58 24 3
Madagascar 1006 42 2044 6.72 n 15 126 171 205 316 115 58 % 1 13 17 20 31 11 6
Mauritius 150 21 2046 3.93 n 0 1 10 21 93 21 4 % 0 1 7 14 62 14 3
Mayotte 106 12 2041 2.32 n 0 1 35 70 0 0 0 % 0 1 33 66 0 0 0
Mozambique 461 35 2040 5.91 n 4 98 193 95 36 23 12 % 1 21 42 21 8 5 3
Reunion 13 11 2045 3.01 n 0 0 0 6 6 1 0 % 0 0 0 46 46 8 0
Seychelles 308 19 2042 3.46 n 0 4 93 161 47 3 0 % 0 1 30 52 15 1 0
Somalia 153 25 2048 4.17 n 0 0 0 24 51 38 7 % 0 0 0 20 42 32 6
South Africa 18 36 2051 7.75 n 0 0 0 4 3 10 1 % 0 0 0 22 17 56 6
Tanzania 635 45 2041 4.04 n 1 43 198 310 73 9 1

37
Country/territory Pixels (n)
Range AVG Year
SD <2030 2030-2034
2035-2039
2040-2044
2045-2049
2050-2054
>2055
% 0 7 31 49 11 1 0
South Asian Seas
including the central Indian Ocean
Bangladesh 5 6 2049 2.19 n 0 0 0 0 4 1 0 % 0 0 0 0 80 20 0
Chagos* 569 7 2041 1.97 n 0 0 236 332 1 0 0 % 0 0 41 58 0 0 0
India 936 56 2049 8.60 n 1 3 92 269 140 242 189 % 0 0 10 29 15 26 20
Maldives 1207 9 2041 1.93 n 0 0 310 895 2 0 0 % 0 0 26 74 0 0 0
Sri Lanka 131 29 2050 5.91 n 0 0 7 24 16 44 40 % 0 0 5 18 12 34 31
East Asian Seas
including the coral triangle and Japan
Australia* 7334 64 2050 8.82 n 2 46 279 331 224 383 226 % 0 3 19 22 15 26 15
Brunei* 37 14 2048 3.19 n 0 0 1 3 16 17 0 % 0 0 3 8 43 46 0
Cambodia 59 23 2051 5.42 n 0 0 0 13 5 28 13 % 0 0 0 22 8 47 22
China 180 81 2057 17.67 n 7 10 31 14 4 6 102 % 4 6 17 8 2 3 59
Christmas Island* 11 10 2041 3.22 n 0 1 3 7 0 0 0 % 0 9 27 64 0 0 0
Indonesia 12340 65 2044 7.61 n 115 910 3561 3094 2157 1372 1131 % 1 7 29 25 17 11 9
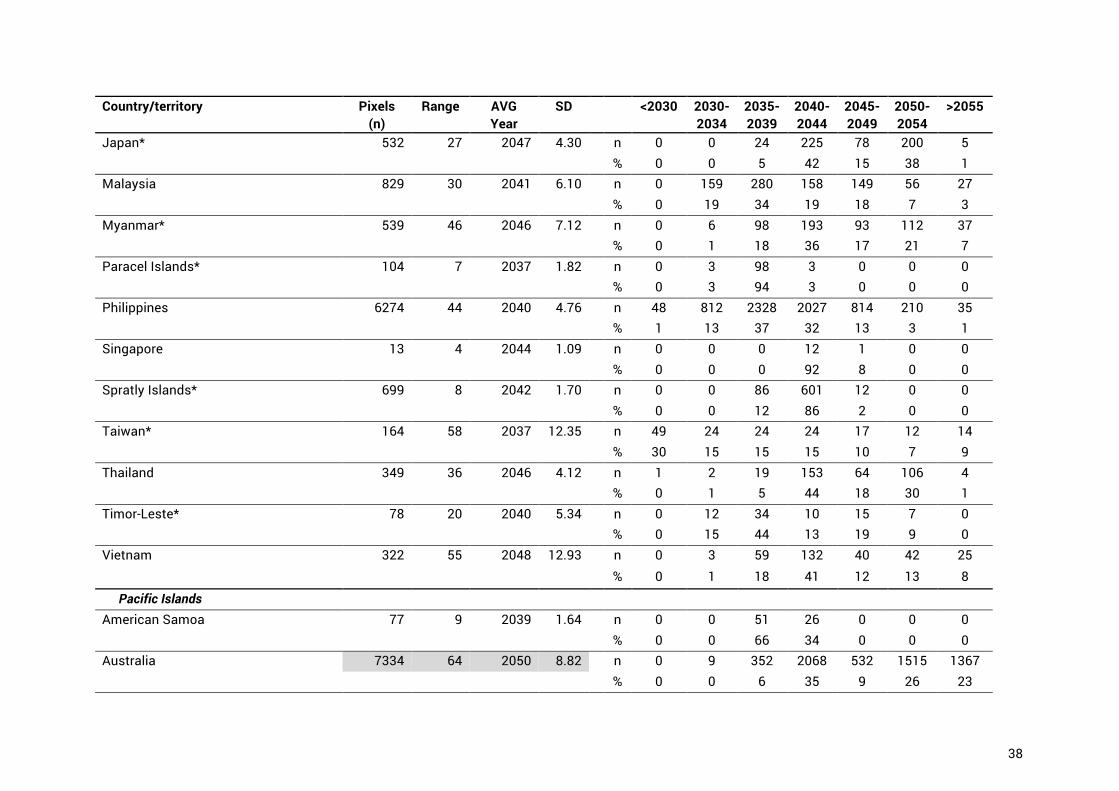
38
Country/territory Pixels (n)
Range AVG Year
SD <2030 2030-2034
2035-2039
2040-2044
2045-2049
2050-2054
>2055
Japan* 532 27 2047 4.30 n 0 0 24 225 78 200 5 % 0 0 5 42 15 38 1
Malaysia 829 30 2041 6.10 n 0 159 280 158 149 56 27 % 0 19 34 19 18 7 3
Myanmar* 539 46 2046 7.12 n 0 6 98 193 93 112 37 % 0 1 18 36 17 21 7
Paracel Islands* 104 7 2037 1.82 n 0 3 98 3 0 0 0 % 0 3 94 3 0 0 0
Philippines 6274 44 2040 4.76 n 48 812 2328 2027 814 210 35 % 1 13 37 32 13 3 1
Singapore 13 4 2044 1.09 n 0 0 0 12 1 0 0 % 0 0 0 92 8 0 0
Spratly Islands* 699 8 2042 1.70 n 0 0 86 601 12 0 0 % 0 0 12 86 2 0 0
Taiwan* 164 58 2037 12.35 n 49 24 24 24 17 12 14 % 30 15 15 15 10 7 9
Thailand 349 36 2046 4.12 n 1 2 19 153 64 106 4 % 0 1 5 44 18 30 1
Timor-Leste* 78 20 2040 5.34 n 0 12 34 10 15 7 0 % 0 15 44 13 19 9 0
Vietnam 322 55 2048 12.93 n 0 3 59 132 40 42 25 % 0 1 18 41 12 13 8
Pacific Islands American Samoa 77 9 2039 1.64 n 0 0 51 26 0 0 0
% 0 0 66 34 0 0 0 Australia 7334 64 2050 8.82 n 0 9 352 2068 532 1515 1367
% 0 0 6 35 9 26 23

39
Country/territory Pixels (n)
Range AVG Year
SD <2030 2030-2034
2035-2039
2040-2044
2045-2049
2050-2054
>2055
Cook Islands 128 15 2044 3.99 n 0 0 33 26 66 3 0 % 0 0 26 20 52 2 0
Federated States of Micronesia 1096 12 2038 1.46 n 0 0 1062 33 1 0 0 % 0 0 97 3 0 0 0
Fiji 1685 41 2044 4.04 n 1 6 161 751 662 80 24 % 0 0 10 45 39 5 1
French Polynesia 1504 25 2047 4.44 n 0 0 0 535 657 209 103 % 0 0 0 36 44 14 7
Kiribati 93 14 2041 3.50 n 0 4 22 57 10 0 0 % 0 4 24 61 11 0 0
Marshall Islands 952 6 2040 1.50 n 0 0 685 267 0 0 0 % 0 0 72 28 0 0 0
Nauru 6 0 2035 0.00 n 0 0 6 0 0 0 0 % 0 0 100 0 0 0 0
New Caledonia 1694 22 2044 3.39 n 0 2 63 848 698 74 9 % 0 0 4 50 41 4 1
New Zealand 4 10 2047 4.72 n 0 0 0 2 1 1 0 % 0 0 0 50 25 25 0
Niue 16 19 2047 6.36 n 0 0 3 0 7 3 3 % 0 0 19 0 44 19 19
Northern Mariana Islands and Guam 271 12 2037 2.20 n 1 4 224 42 0 0 0 % 0 1 83 15 0 0 0
Palau 188 11 2038 2.41 n 0 0 162 23 3 0 0 % 0 0 86 12 2 0 0
Papua New Guinea 4197 50 2040 5.90 n 107 376 1885 1253 234 294 48 % 3 9 45 30 6 7 1
Pitcairn Island* 18 13 2059 2.99 n 0 0 0 0 0 3 15

40
Country/territory Pixels (n)
Range AVG Year
SD <2030 2030-2034
2035-2039
2040-2044
2045-2049
2050-2054
>2055
% 0 0 0 0 0 17 83 Samoa 116 9 2038 1.80 n 0 0 87 29 0 0 0
% 0 0 75 25 0 0 0 Solomon Islands 1798 44 2040 2.81 n 4 55 660 1066 10 3 0
% 0 3 37 59 1 0 0 Tokelau 26 4 2039 0.82 n 0 0 24 2 0 0 0
% 0 0 92 8 0 0 0 Tonga 396 22 2045 2.51 n 0 0 14 19 349 9 5
% 0 0 4 5 88 2 1 Tuvalu 217 9 2039 1.87 n 0 2 165 50 0 0 0
% 0 1 76 23 0 0 0 United States (Hawaii)* 1417 60 2042 4.80 n 0 2 499 444 215 0 0
% 0 0 43 38 19 0 0 US Minor Outlying Islands* 461 21 2039 2.94 n 0 2 311 142 1 5 0
% 0 0 67 31 0 1 0 Vanuatu 601 21 2043 2.97 n 0 12 34 462 85 8 0
% 0 2 6 77 14 1 0 Wallis and Futuna 133 10 2038 1.45 n 0 0 118 14 1 0 0
% 0 0 89 11 1 0 0
South-East Pacific Chile 1 0 2069 0 n 0 0 0 0 0 0 1
% 0 0 0 0 0 0 100 Colombia 189 43 2043 5.28 n 0 0 0 0 3 9 0
% 0 0 0 0 25 75 0 Ecuador 86 21 2042 4.14 n 3 3 19 45 16 0 0
% 3 3 22 52 19 0 0 Panama 348 42 2045 6.96 n 0 0 5 8 16 53 11

41
Country/territory Pixels (n)
Range AVG Year
SD <2030 2030-2034
2035-2039
2040-2044
2045-2049
2050-2054
>2055
% 0 0 5 9 17 57 12
North-East Pacific Clipperton Island* 4 4 2041 2.31 n 0 0 2 2 0 0 0
% 0 0 50 50 0 0 0 Cocos Islands* 23 5 2043 1.60 n 0 0 0 21 2 0 0
% 0 0 0 91 9 0 0 Costa Rica 77 28 2049 5.90 n 0 2 7 9 7 28 13
% 0 3 11 14 11 42 20 El Salvador 2 0 2050 0 n 0 0 0 0 0 2 0
% 0 0 0 0 0 100 0 Mexico 371 62 2039 8.44 n 0 0 0 4 0 3 16
% 0 0 0 17 0 13 70 Nicaragua 278 14 2038 2.52 n 0 9 222 45 2 0 0
% 0 3 80 16 1 0 0 Panama 348 42 2045 6.96 n 0 0 5 8 16 53 11
% 0 0 5 9 17 57 12

42
Wider Caribbean including the Western Atlantic Reef Area
Within this Regional Sea area, the Bahamas has the greatest reef area (2100 four-km pixels containing reefs), and then the USA (1479 pixels in Florida, Texas, US Virgin Islands) and then Cuba (1385 pixels). Montserrat, Sint Maarten and French Guiana all have less than 10 four-km reef pixels.
Average projected timing of annual severe bleaching (ASB) under RCP8.5
2043 (same as global average) Earliest and latest average projected timing of ASB under RCP8.5
Earliest – Turks and Caicos Islands (2036) Latest – Bermuda (2087)
Most Relative climate losers and winners
The Bahamas has the greatest number of reef pixels projected to experience ASB before 2030 (relative climate losers) with 66, representing 3% of the reef pixels in the Bahamas. Mexico has the highest percentage with 5% projected to experience ASB before 2030 (n=18 pixels). The Bahamas has the greatest number of reef pixels projected to experience ASB after 2055 (relative climate winners) with 282, representing 13% of the reef pixels in the Bahamas. Cuba also has a high number of reef pixels that are relative climate winners with 258, which represents 19% of the reef area in Cuba. Cuba has a higher percentage of reef pixels projected to be relative climate winners than any other country or territory in the world. 17% (n=13) of the reef pixels of Costa Rica (within this Sea) are projected to be relative climate winners.
Top refugia
The ten locations within this region projected to experience ASB conditions latest are all in the Bahamas, 20-60 km north west of Grand Bahama Island. At these locations ASB conditions are projected for 2081-2087.
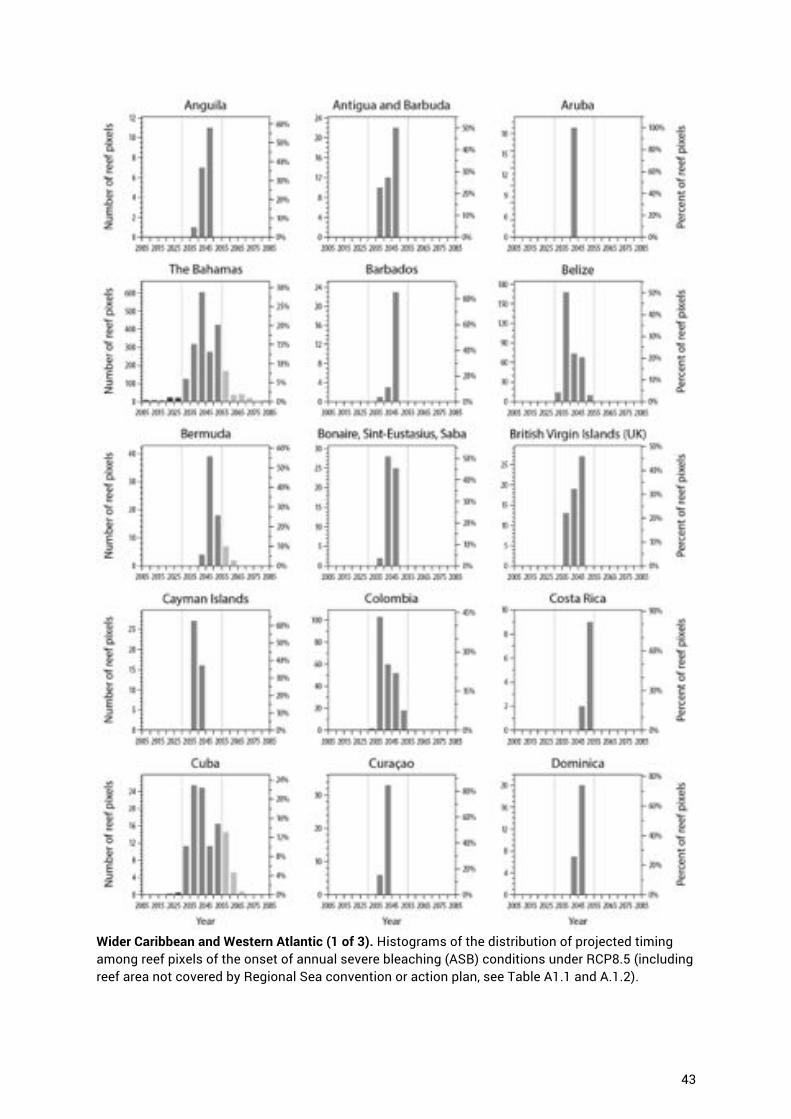
43
Wider Caribbean and Western Atlantic (1 of 3). Histograms of the distribution of projected timing among reef pixels of the onset of annual severe bleaching (ASB) conditions under RCP8.5 (including reef area not covered by Regional Sea convention or action plan, see Table A1.1 and A.1.2).

44
Wider Caribbean and Western Atlantic (2 of 3). Histograms of the distribution of projected timing among reef pixels of the onset of annual severe bleaching (ASB) conditions under RCP8.5 (including reef area not covered by Regional Sea convention or action plan, see Table A1.1 and A.1.2).

45
Wider Caribbean and Western Atlantic (3 of 3). Histograms of the distribution of projected timing among reef pixels of the onset of annual severe bleaching (ASB) conditions under RCP8.5 (including reef area not covered by Regional Sea convention or action plan, see Table A1.1 and A.1.2).
Brazil. Histograms of the distribution of projected timing among reef pixels of the onset of annual severe bleaching (ASB) conditions under RCP8.5 (reef area not covered by Regional Sea convention or action plan, see Table A1.1 and A.1.2).

46
Western Africa and the Eastern Atlantic Reef Area
Countries and territories within this Regional Sea have very low reef area. Equatorial Guinea has three 4-km reef pixels. The other four countries/territories have only one 4-km reef pixel. Some coral species and coral communities have also been reported e.g. in Ghana, Guinea Bissau and Senegal but not yet included in the global coral spatial data layer used for this report. This will be addressed in the future as the data layer is further developed.
Average projected timing of annual severe bleaching (ASB) under RCP8.5
2046 (later than the global average of 2043) Earliest and latest average projected timing of ASB under RCP8.5
Earliest – St. Helena and Ascension Islands, and Sao Tome and Principe (2043) Latest – Cameroon (2055)
Most Relative climate losers and winners
There are no reef pixels in this Regional Sea projected to experience ASB before 2030 (relative climate losers). The single 4-km reef pixel of Cameroon is projected to experience ASB in 2055; a relative climate winner and the only of these in this Regional Sea.
Top refugia
The location within this region projected to experience ASB conditions latest is in Cameroon. This location is projected to experience ASB conditions in 2055. Note: there are less than 10 reef pixels in this region. Data on coral occurrence in the region is limited.

47
West Africa and the Eastern Atlantic. Histograms of the distribution of projected timing among reef pixels of the onset of annual severe bleaching (ASB) conditions under RCP8.5 (including reef area not covered by Regional Sea convention or action plan, see Table A1.1 and A.1.2).

48

49
Red Sea and Gulf of Aden Reef Area
Saudi Arabia and Egypt have the greatest reef area with 1311 and 843 4-km reef pixels, respectively. Israel and Jordan both have only four 4-km reef pixels.
Average projected timing of annual severe bleaching (ASB) under RCP8.5
2039 (earlier than the global average of 2043 and earlier than any other Regional Sea) Earliest and latest average projected timing of ASB under RCP8.5
Earliest – Israel (2012) and Jordan (2017) Latest – Eritrea (2085)
Most Relative climate losers and winners
Egypt has the greatest number of reef pixels projected to experience ASB before 2030 (relative climate losers) with 243, representing 29% of the reef pixels in Egypt. Egypt has a greater number of relative climate losers than any other country or territory and a greater number of relative climate winners than any other country or territory. Saudi Arabia also has a high number of relative climate losers with 195, representing 15% of the reef pixels in Saudi Arabia. Israel and Jordan have high percentages of relative climate losers with 75 and 100%, respectively (these countries have four 4-km pixels). Egypt has the greatest number of reef pixels projected to experience ASB after 2055 (relative climate winners) with 308, representing 37% of the reef pixels in Egypt. Eritrea also has a high number of reef pixels that are relative climate winners with 150, which represents 30% of the reef area in Cuba. >10% of reef pixels in Sudan (11%) and Yemen (10%) are relative climate winners.
Top refugia
The ten locations within this region projected to experience ASB conditions latest are along the south eastern coast of Eritrea. At these locations ASB conditions are projected for 2077-2085.

50
Red Sea and Gulf of Aden. Histograms of the distribution of projected timing among reef pixels of the onset of annual severe bleaching (ASB) conditions under RCP8.5 (including reef area not covered by Regional Sea convention or action plan, see Table A1.1 and A.1.2).

51
ROPME Sea Area Reef Area
Oman and Iran have the greatest reef area with 192 and 107 4-km reef pixels, respectively. Kuwait has the least reef area in this Regional Sea with five 4-km reef pixels.
Average projected timing of annual severe bleaching (ASB) under RCP8.5
2069 (later than the global average of 2043 and later than any other Regional Sea) Earliest and latest average projected timing of ASB under RCP8.5
Earliest – Oman (2055) Latest – Kuwait, Saudi Arabia, Bahrain, Qatar and the United Arab Emirates (all 2088) *Bahrain has the latest average ASB timing projected for any country with more than ten 4-km reef pixels.
Most Relative climate losers and winners
There are almost now reef pixels projected to experience ASB before 2030 (relative climate losers) in this Regional Sea; only one pixel in the United Arab Emirates. In contrast, the great majority of reef pixels in this Regional Sea are projected to experience ASB after 2055 (relative climate winners). There are >100 reef pixels in Iran and Oman that are relative climate winners, representing 100 and 55% of the reef pixels in these countries, respectively. Iran, Qatar and Bahrain have the highest perecentage of relative climate winners (100% for all three) of all countries and territories in the world (among those with greater than 20 reef pixels). The portion of Saudi Arabia’s reef pixels (31 of 1311) that fall in this Regional Sea are also 100% relative climate winners.
Top refugia
The latest date projected for ASB in this region is 2088. There are 64 reef pixels (in the countries listed) projected to experience ASB conditions in 2088 and they are in Kuwait, Saudi Arabia, Bahrain, Qatar and the UAE

52
ROPME Sea Area. Histograms of the distribution of projected timing among reef pixels of the onset of annual severe bleaching (ASB) conditions under RCP8.5.

53
Eastern Africa / Western Indian Ocean Reef Area
Madagascar has the greatest reef area with 1000 reef pixels. South Africa and Reunion Island have the least reef area with 18 and 13 reef pixels, respectively.
Average projected timing of annual severe bleaching (ASB) under
RCP8.5
2044 (nearly the same as the global average of 2043) Earliest and latest average projected timing of ASB under RCP8.5
Earliest – Mozambique (2040) Latest – Madagascar (2067)
Most Relative climate losers and winners
Very few of the reef pixels in this Regional Sea are projected to experience ASB before 2030 (relative climate losers) in this Regional Sea. There are 15 pixels in Madagascar that are relative climate losers, representing ~1% of the reef area there. The are also very few reef pixels in this Regional Sea are projected to experience ASB after 2055 (relative climate winners). There are 58 reef pixels in Madagascar that are relative climate winners, representing 3% of reef pixels in Madagascar. There are also 12 reef pixels that are relative climate winners in Mozambique, representing 6% of the reef pixels in Mozambique.
Top refugia
The ten locations within this region projected to experience ASB conditions latest are on the northern coast of Antongil Bay, Madagascar (6 pixels), the west coast of Madagascar near the Mangoky River (1 pixel), in Kenya near the Somalia border (1 pixel), and in Mozambique near Maputo Bay. At these locations ASB conditions are projected for 2058-2067.

54
Eastern Africa (Western Indian Ocean). Histograms of the distribution of projected timing among reef pixels of the onset of annual severe bleaching (ASB) conditions under RCP8.5.

55
South Asian Seas including the central Indian Ocean Reef Area
Maldives has the greatest reef area with 1207 reef pixels. Bangladesh has the least reef area with 5 reef pixels.
Average projected timing of annual severe bleaching (ASB) under
RCP8.5
2046 (later than the global average of 2043) Earliest and latest average projected timing of ASB under RCP8.5
Earliest – British Indian Ocean Territory (Chagos Islands) (2041) Latest – India (2085)
Most Relative climate losers and winners
Very few of the reef pixels in this Regional Sea are projected to experience ASB before 2030 (relative climate losers) in this Regional Sea (only 1 in India, representing <1% of reef pixels there). There are reef pixels in this Regional Sea projected to experience ASB after 2055 (relative climate winners) in India and Sri Lanka. 189 reef pixels in India are relative climate winners, representing 20% of reef pixels in India. 40 reef pixels in Sri Lanka are relative climate winners, representing 31% of reef pixels there.
Top refugia
The ten locations within this region projected to experience ASB conditions latest are in India in the Gulf of Kutch and in Maharashtra near Mumbai and Wadhaven Village. At these locations ASB conditions are projected for 2073-2085.

56
South Asian Seas and central Indian Ocean. Histograms of the distribution of projected timing among reef pixels of the onset of annual severe bleaching (ASB) conditions under RCP8.5 (including reef area not covered by Regional Sea action plan, see Table A1.1 and A.1.2).

57
East Asian Seas including the Coral Triangle and Japan Reef Area
Indonesia has the greatest reef area of any country or territory in the world with 12340 reef pixels. Australia has 7334 reef pixels and Philippines has 6274 reef pixels. Singapore and Christmas Island have the least reef area with 13 and 11 reef pixels, respectively.
Average projected timing of annual severe bleaching (ASB) under
RCP8.5
2045 (roughly the same as the global average of 2043) Earliest and latest average projected timing of ASB under RCP8.5
Earliest – Taiwan (2037) Latest – Vietnam (2088)
Most Relative climate losers and winners
Indonesia has the greatest number of reef pixels projected to experience ASB before 2030 (relative climate losers) in this Regional Sea with 115, but this represents ~1% of reef area in Indonesia. Taiwan has the greatest percentage of relative climate losers with 30% (n=49 pixels). Indonesia has the greatest number of reef pixels projected to experience ASB after 2055 (relative climate winners) with 1131, representing ~10% of reef pixels in Indonesia. 102 reef pixels in China are relative climate winners, representing 59% of reef pixels there.
Top refugia
The ten locations within this region projected to experience ASB conditions latest are in northern Vietnam near Ha Long Bay, Lan Ha Bay, and near Hon Me Island, and in west Australia in the Pilbara Region. At these locations ASB conditions are projected for 2087-2088.

58
East Asian Seas (1 of 2). Histograms of the distribution of projected timing among reef pixels of the onset of annual severe bleaching (ASB) conditions under RCP8.5 (including reef area not covered by Regional Sea action plan, see Table A1.1 and A.1.2).

59
East Asian Seas (2 of 2). Histograms of the distribution of projected timing among reef pixels of the onset of annual severe bleaching (ASB) conditions under RCP8.5 (including reef area not covered by Regional Sea action plan, see Table A1.1 and A.1.2).

60
Pacific Islands Reef Area
Australia has the greatest reef area in the Pacific Islands Regional Sea with 7334 reef pixels. Papua New Guinea has 4197 reef pixels. Nauru and New Zealand (Niue and Kermadec Islands) have the least reef area with 6 and 4 reef pixels, respectively.
Average projected timing of annual severe bleaching (ASB) under RCP8.5
2042 (roughly the same as the global average of 2043) Earliest and latest average projected timing of ASB under RCP8.5
Earliest – Wallis and Futuna, Tuvalu, Federated States of Micronesia, Nauru, Palau, Samoa, Tokelau (2037-2039) Latest – Fiji (2068), Australia (2082)
Most Relative climate losers and winners
Papua New Guinea has the greatest number of reef pixels projected to experience ASB before 2030 (relative climate losers) in this Regional Sea with 107, which represents ~3% of reef area in Papua New Guinea. Australia has the greatest number of reef pixels projected to experience ASB after 2055 (relative climate winners) with 1367, representing 23% of reef pixels in Australia. 15 reef pixels in Pitcairn Island are relative climate winners, representing 83% of reef pixels there.
Top refugia
The ten locations within this region projected to experience ASB conditions latest are in Australia, south of the Great Barrier Reef in Long Island Broad Sound, Hervey Bay and Moreton Bay. At these locations ASB conditions are projected for 2077-2082.

61
Pacific Islands (1 of 2). Histograms of the distribution of projected timing among reef pixels of the onset of annual severe bleaching (ASB) conditions under RCP8.5 (including reef area not covered by Regional Sea convention or action plan, see Table A1.1 and A.1.2).

62
Pacific Islands 2 of 2. Histograms of the distribution of projected timing among reef pixels of the onset of annual severe bleaching (ASB) conditions under RCP8.5 (including reef area not covered by Regional Sea convention or action plan, see Table A1.1 and A.1.2).

63
South-East Pacific Reef Area
Panama has the greatest reef area in the South-East Pacific Regional Sea with 93 reef pixels. Chile has the least reef area with just 1 reef pixel.
Average projected timing of annual severe bleaching (ASB) under RCP8.5
2050 (later than the global average of 2043) Earliest and latest average projected timing of ASB under RCP8.5
Earliest – Ecuador (2042) Latest – Panama (2056)
Most Relative climate losers and winners
Ecuador is the only country in this Regional Sea with reef pixels projected to experience ASB before 2030 (relative climate losers). There are 3 relative climate losers in Ecuador, which represents ~3% of reef area in Ecuador. Panama has the greatest number of reef pixels projected to experience ASB after 2055 (relative climate winners) with 11, representing 12% of reef pixels in Panama. Panama is in this Regional Sea and also in the geographic area of the North-East Pacific Regional Sea. Panama has the greatest percentage of relative climate winners in both the South-East and North-East Pacific Regional Seas.
Top refugia
The ten locations within this region projected to experience ASB conditions latest are in Panama near the Isla Pedro Gonzalez and near Gonzalo Vasquez. These locations are projected to experience ASB conditions in 2055 and 2056.

64
South-East Pacific. Histograms of the distribution of projected timing among reef pixels of the onset of annual severe bleaching (ASB) conditions under RCP8.5.

65
North-East Pacific Nicaragua has the greatest reef area in the North-East Pacific Regional Sea with 278 reef pixels. El Salvador has the least reef area with just 2 reef pixel.
Average projected timing of annual severe bleaching (ASB)
under RCP8.5
2044 (roughly the same as the global average of 2043) Earliest and latest average projected timing of ASB under RCP8.5
Earliest – Nicaragua (2038) Latest – Mexico, Gulf of California (2083)
Most Relative climate losers and winners
There are no countries or territories in this Regional Sea with reef pixels projected to experience ASB before 2030 (relative climate losers). Mexico has the greatest number of reef pixels projected to experience ASB after 2055 (relative climate winners) with 16, representing 70% of the reef pixels of Mexico that are in this Regional Sea. There are 13 relative climate winners in Costa Rica, representing 20% of the reef pixels of Costa Rica that are in this Regional Sea.
Top refugia
The ten locations within this region projected to experience ASB conditions latest are in Panama in the Bahia de los Muertos and near Isla de Coiba, in Costa Rica, north west of Marina Balleno National Park and in Ballena Bay, and in Mexico in the Gulf of California. These locations are projected to experience ASB conditions from 2059-2083.

66
North-East Pacific. Histograms of the distribution of projected timing among reef pixels of the onset of annual severe bleaching (ASB) conditions under RCP8.5 (including reef area not covered by Regional Sea convention or action plan, see Table A1.1 and A.1.2).

67
Appendix 2. Years difference for projected bleaching (RCP4.5-8.5) Table A2.1. Numbers of reef pixels and percentages for the histograms shown within Figure 5: distribution in projected timing of annual severe bleaching conditions under the two emissions scenarios (figure 5 a and b), and the difference between these scenarios (figure 5 c) for the 86% of reefs for which ASB is projected this century under both RCP8.5 and RCP4.5.
Year RCP8.5 (N
pixels)
RCP8.5 (%) RCP4.5 (N
pixels)
RCP4.5 (%) Years Difference
RCP4.5-RCP8.5 (N
pixels)
RCP4.5-RCP8.5 (%)
2005 73 0.11 66 0.12 -2 175 0.31
2010 107 0.17 117 0.21 0 520 0.94
2015 82 0.13 76 0.14 2 976 1.76
2020 125 0.19 142 0.26 4 3749 6.74
2025 515 0.80 223 0.40 6 6328 11.38
2030 3599 5.56 590 1.06 8 5873 10.56
2035 17829 27.53 1922 3.45 10 8882 15.98
2040 20533 31.71 6459 11.60 12 6326 11.38
2045 9865 15.23 10146 18.23 14 4415 7.94
2050 6762 10.44 11098 19.94 16 6675 12.01
2055 2501 3.86 7921 14.23 18 2463 4.43
2060 1300 2.01 8043 14.45 20 2510 4.51
2065 742 1.15 2966 5.33 22 1914 3.44
2070 269 0.42 2715 4.88 24 846 1.52
2075 164 0.25 2085 3.75 26 1664 2.99
2080 79 0.12 510 0.92 28 952 1.71
2085 210 0.32 579 1.04 30 331 0.60
2090 0 0.00 0 0.00 32 355 0.64
34 467 0.84
36 76 0.14
38 99 0.18
68
Appendix 3. Glossary ASB – Annual Severe Bleaching. This report presents the projected year by which sea temperature stress on coral reefs is expected to be severe enough to cause bleaching annually. At this point, reefs are certain to change and recovery will be very limited.
CMIP5 – Coupled Model Intercomparison Project, phase 5; a framework project for global coupled ocean-atmosphere general circulation models.
DHW – Degree Heating Week; one DHW is equal to 1°C above the maximum monthly mean (i.e. the coral bleaching threshold) for one week.
GCM – General Circulation Model or Global Climate Model; numerical models representing physical processes in the atmosphere, ocean, cryosphere and land surface to simulate the response of the global climate system to increasing greenhouse gas concentrations.
GIS – Geographic Information System; a system designed to present and analyze geographical data, used e.g. in marine spatial planning and marine protected area design.
INDC – Intended Nationally Determined Contributions; planned greenhouse gas emissions reductions that all parties to UNFCCC were asked to publish in the lead up to the 21st Conference of Parties in Paris in late 2015.
MMM – Maximum Monthly Mean; the warmest monthly mean sea surface temperature experienced by corals, based on satellite measurements.
MPA – Marine Protected Area: areas of seas and oceans protected to conserve biodiversity, natural or cultural resources; they typically limit (but not necessarily prohibit) human activity and are often managed for multiple use.
MSP – Marine Spatial Planning; a process for allocating human activities and use in marine areas to achieve ecological, economic, and social objectives.
NDC – Nationally Determined Contributions; The Paris Agreement requires that countries prepare NDCs in pursuit of its goal. New NDCs are expected in 2020 and then every five years thereafter with global stock-take to review progress planned for 2023.
Paris Agreement – the legally binding agreement adopted by the 21st Conference of Parties to UNFCCC in Paris in 2015, with the goal of keeping global warming well below 2°C, while pursuing efforts to stay below 1.5°C. The Agreement enters info force when at least 55 Parties accounting for at least 55 % of the total global greenhouse gas emissions have ratified it.
RCP – Representative Concentration Pathway: four greenhouse gas concentration trajectories adopted by the Intergovernmental Panel on Climate Change (IPCC) for its Fifth Assessment Report in 2014. These supersede the Special Report on Emissions Scenarios (SRES) published in 2000. Among these RCP8.5 represents a business-as-usual scenario in that it assumes emissions will continue to grow largely unabated. RCP4.5 represents a successful mitigation pathway and assumes emissions peak around 2040 and then decline.
RSCAP – Regional Seas Conventions and Action Plans; the world's only legal framework for protecting the oceans and seas at the regional level. Individual Conventions and Action Plans reflect a similar approach but are tailored to suit their particular environmental challenges.
SST - Sea Surface Temperature; the temperature of water at or very close to the ocean's surface.
UNFCCC – United Nations Framework Convention on Climate Change: an international environmental treaty negotiated at the Earth Summit in Rio de Janeiro in 1992 with the objective “to stabilize greenhouse gas concentrations in the atmosphere at a level that will prevent dangerous human interference with the climate system.” The convention entered into force in 1994. As of September 2016, 197 countries have ratified the Convention.

69
