downtown flushing queens - welcome to … disposal, graffiti, litter, and sidewalk oil stains...
TRANSCRIPT
Downtown Flushing Transit Hub BIDGreater Flushing Chamber of Commerce
in partnership
with
Commercial District Needs Assessment
DOWNTOWN FLUSHINGQUEENS

Background
Downtown Flushing is a one-of-a-kind destination where residents and visitors alike can experience an international blend of cultures, cuisines, and shops within a bustling central business district. Situated off the Flushing Creek in northeast Queens, Downtown Flushing’s location gives it several competitive advantages that have fueled its rapid growth as a commercial hub. The district is served by the Downtown Flushing Transit Hub Business Improvement District (BID) and is made accessible by several modes of transportation including the 7 subway line, the Long Island Rail Road, NYC Select Bus Service, and the Whitestone, Van Wyck, and Long Island Expressways. Once a rural Dutch farming settlement, modern day Downtown Flushing is an active, 24/7 district. The neighborhood consists of a mix of mid-rise and new high-rise buildings that house a rich variety of Asian restaurants, professional services, offices, apartments, and light industrial uses. The volume of pedestrians, vehicles, and businesses contributes to a crowded network of streets and sidewalks that are trademark characteristics of the neighborhood. On any given trip to Downtown Flushing, visitors can conveniently shop, dine, and access professional services from unique businesses and entrepreneurs from around the world. Main Street and Roosevelt Avenue form the district’s commercial crossroads, with a dense and eclectic mix of Chinese small businesses, national retailers, and financial institutions. Closer to Flushing Creek, College Point Boulevard is characterized by home furnishing wholesalers and warehouses despite the recent introduction of new mixed-use shopping centers. Union Street is ever-evolving and has traditionally been identified as a center of the Korean American community in Queens which has extended eastward over time along Northern Boulevard. These streets are also home to many of the neighborhood’s historical, entertainment, and cultural venues like the Quaker Meeting House, the Flushing Armory, Flushing Town Hall, and the former RKO Keith’s Theater.
Neighborhood Demographics
Greater Flushing is a densely inhabited neighborhood with a diverse and growing population of more than 68,000 residents that reflects its cosmopolitan mix of merchants, businesses, and cultural attractions. While historically home to a wide array of immigrant communities, the neighborhood is currently comprised of 67% Asian residents. The Chinese and Korean communities represent approximately 70% and 12% of the Asian population respectively. Flushing remains a popular destination for many Asian immigrant families, making the neighborhood’s foreign population (71%) one of the highest in New York City.
Future Opportunities
With the heaviest foot traffic outside of Manhattan, Downtown Flushing is already a regional destination with 20+ public transportation options, and multicultural dining and services. Its proximity to the USTA Billie Jean King National Tennis Center, Citi Field, Flushing Meadows Corona Park, and both LaGuardia and JFK International Airports make Downtown Flushing a renowned center of entertainment and commerce. Signs of ongoing development and the subsequent congestion and competition associated with rapid growth are visible across the district. Dedicated support of the needs of Downtown Flushing’s burgeoning small business community can help harness this momentum and improve the overall quality of life of the neighborhood.
ABOUT DOWNTOWN FLUSHING
4–56
7–1011
121314
See more on page 13
See more on page 5
The Neighborhood 360° program was created by the NYC Department of Small Business Services to identify, develop, and launch commercial revitalization projects in partnership with local stakeholders. Through proactive planning and targeted investments, Neighborhood 360° supports projects that strengthen and revitalize the streets, small businesses, and community-based organizations that anchor New York City neighborhoods.
The Neighborhood 360° Commercial District Needs Assessment (CDNA) highlights a neighborhood’s existing business landscape and consumer characteristics. This CDNA features Main Street, Roosevelt Avenue, Northern Boulevard, Union Street, 39th Avenue, and College Point Boulevard commercial corridors in Downtown Flushing, and was conducted in partnership with the Greater Flushing Chamber of Commerce and the Downtown Flushing Transit Hub Business Improvement District between January and June 2016.
Key issues and opportunities identified through this assessment will help prioritize SBS-supported local investments, and serve as an informational and marketing resource for the neighborhood.
In This Report
Existing conditions, business data, and qualitative depictions of the neighborhood were gathered from more than 315 surveys and numerous interviews and workshops with neighborhood merchants, shoppers, workers, community leaders, property owners, and residents.
Jump to...
Key FindingsBusiness InventoryWhat Merchants SayBusiness Outlook What Shoppers SayPhysical EnvironmentData Appendix
4-56
7-89
1011
12-15
2 Neighborhood 360° Commercial District Needs Assessment

7
35 AV
MAIN ST
38 AV
45 AV
KISSENA BLVD
CO
LLEGE PO
INT B
LVD
41 AV
PAR
SON
S BLVD
146 ST
SANFORD AV
ROOSEVELT AV
39 AV
FRANKLIN AV
41 RD
BARCLAY AV
WHI
TEST
ONE
EXP
Y
FARRINGTO
N ST
PRIN
CE
ST
34 AV
37 AV
UNION ST
BOW
NE ST
Long Island Rail Road
VAN
WYC
K E
XPY
NORTHERN BLVD
The Shops at SkyView
Center
LeavittsPark
Flushing Creek
Flushing Town Hall
3
2
New World Mall 4
Macedonia AME Church
6
5
St. George’sEpiscopal Church
1 Flushing Public LibraryWorkforce1 Career Center
2
The Shops at SkyView Center
Macedonia AME Church
NEIGHBORHOOD CONTEXT
Flushing Lunar New Year Parade Flushing Night Out
Holiday Lighting Ceremony
Downtown Flushing
Merchant & Business Groups
Asian Americans for Equality (AAFE)
Downtown Flushing Transit Hub Business Improvement District (BID)
Flushing Chinese Business Association
Flushing Willets Point Corona Local Development Corporation
Greater Flushing Chamber of Commerce
Renaissance Economic Development Corporation
Union Street Business Association
Neighborhood Events
Points of Interest
Assessed Commercial Corridors
Public Facilities
Shopping Centers
Arts & Cultural Destinations
Notable Places
Flushing Public Library
Flushing Town Hall
4
New World Mall
St. George’s Church
40th Road Street Festival
10 minutes by car to LaGuardia International Airport
5 minutes by subway to Citi Field, USTA National Tennis Center, & Flushing Meadows Corona Park
3
5
6
1
0 0.25 Miles0.125
Business Improvement District (BID)
3Downtown Flushing

Strengths Accessible transportation hub that attracts visitors from all
over NYC, the region, and the world
High concentration of national commercial banks and other financial institutions
Cluster of arts and cultural institutions that are active in the community
Premier destination for authentic Asian cuisines and goods
Rich history of multicultural diversity and religious tolerance tracing back to the Flushing Remonstrance of 1657
Limited affordable commercial spaces due to high occupancy rates
Small businesses face competition from national retail chains
High levels of pedestrian and vehicular traffic congestion coupled with limited open space amplify quality of life concerns (air quality, noise pollution)
Challenges Overextended infrastructure needs upgrades to better
support the growing central business district
High volume of street garbage and litter requires additional maintenance
Perception of limited affordable parking options
Merchants experience language and cultural barriers to accessing business support programs and navigating government regulations
Dedicated community-based organizations delivering high quality maintenance, marketing, events, and business support district-wide
Active upper floor uses with a wealth of healthcare and professional services that complement local shops and restaurants
Nearly 100% commercial storefront occupancy rate
Safe, 24/7 central business district with high foot traffic throughout the day and night
Main Street & Roosevelt Avenue College Point Boulevard
Union Street 39th Avenue Storefronts
KEY FINDINGS & OPPORTUNITIES
44 Neighborhood 360° Commercial District Needs Assessment
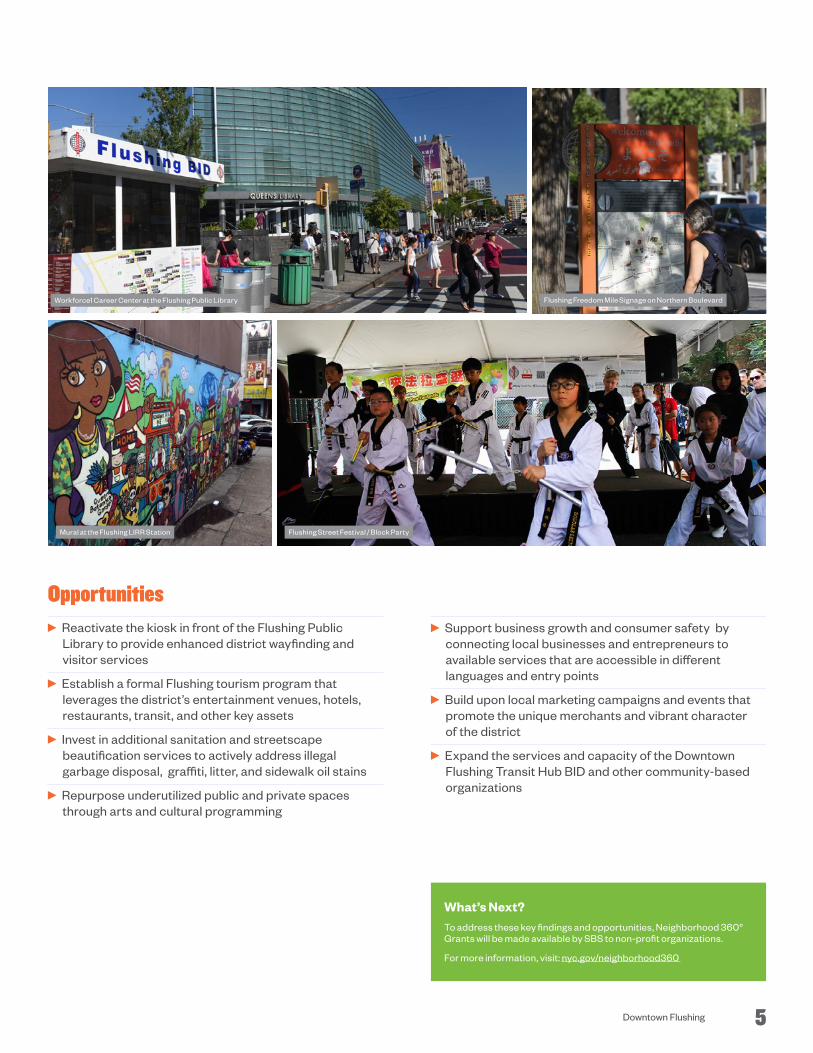
Opportunities Reactivate the kiosk in front of the Flushing Public
Library to provide enhanced district wayfinding and visitor services
Establish a formal Flushing tourism program that leverages the district’s entertainment venues, hotels, restaurants, transit, and other key assets
Invest in additional sanitation and streetscape beautification services to actively address illegal garbage disposal, graffiti, litter, and sidewalk oil stains
Repurpose underutilized public and private spaces through arts and cultural programming
Support business growth and consumer safety by connecting local businesses and entrepreneurs to available services that are accessible in different languages and entry points
Build upon local marketing campaigns and events that promote the unique merchants and vibrant character of the district
Expand the services and capacity of the Downtown Flushing Transit Hub BID and other community-based organizations
Workforce1 Career Center at the Flushing Public Library Flushing Freedom Mile Signage on Northern Boulevard
Mural at the Flushing LIRR Station Flushing Street Festival / Block Party
What’s Next?To address these key findings and opportunities, Neighborhood 360° Grants will be made available by SBS to non-profit organizations.
For more information, visit: nyc.gov/neighborhood360
5Downtown Flushing

BUSINESS LANDSCAPE: DOWNTOWN FLUSHING
1.1%Storefront Vacancy*
371Total Number of Storefronts
Business Inventory
Storefront & Retail Mix
Supermarkets on Main Street Roosevelt AvenueUnion Street
5
6
4
4
4
3
2
7
10
12
13
13
14
18
19
21
21
22
22
27
33
24
Educational Services & Public Administration
Automotive Rental & Gas Stations
Religious Organizations & Houses of Worship
Department Stores
Delis / Bodegas & Convenience Stores
Nonprofit & Civic Organizations
Supermarkets & Liquor Stores
Hotels
Furniture Stores
Cosmetics Stores
Other Miscellaneous Store Retailers
Jewelry Stores
Electronics & Appliance Stores
Hair, Nail, & Beauty Salons
Commercial Banks
Other Wholesalers
19Other Stores & Services
General Merchandise Stores
Home Furnishings & Merchant Wholesalers
Pharmacies & Health Stores
Clothing & Shoes Stores
Snack & Non-Alcoholic Beverage Shops
44Restaurants & Bars
Professional Business Services
4Vacant
*Note: In 2015, New York City’s 69 Business Improvement Districts reported an average ground floor vacancy rate of 8.3% and median ground floor vacancy rate of 5.6% (SBS BIDs Trends Report, 2015).
Business inventory and retail mix data were gathered by the Downtown Flushing BID and Greater Flushing Chamber of Commerce through a comprehensive inventory of ground floor and street-facing storefronts located along Main Street, Roosevelt Avenue, Northern Boulevard, Union Street, 39th Avenue, and College Point Boulevard, excluding colocated, basement, and/or above ground-floor businesses(January–June 2016).
Downtown Flushing is a bustling central business district that attracts merchants, workers, and shoppers from NYC and beyond. While known for its authentic Asian dining, Flushing is also a center of professional services and home to 60+ commercial banks district-wide.
6 Neighborhood 360° Commercial District Needs Assessment
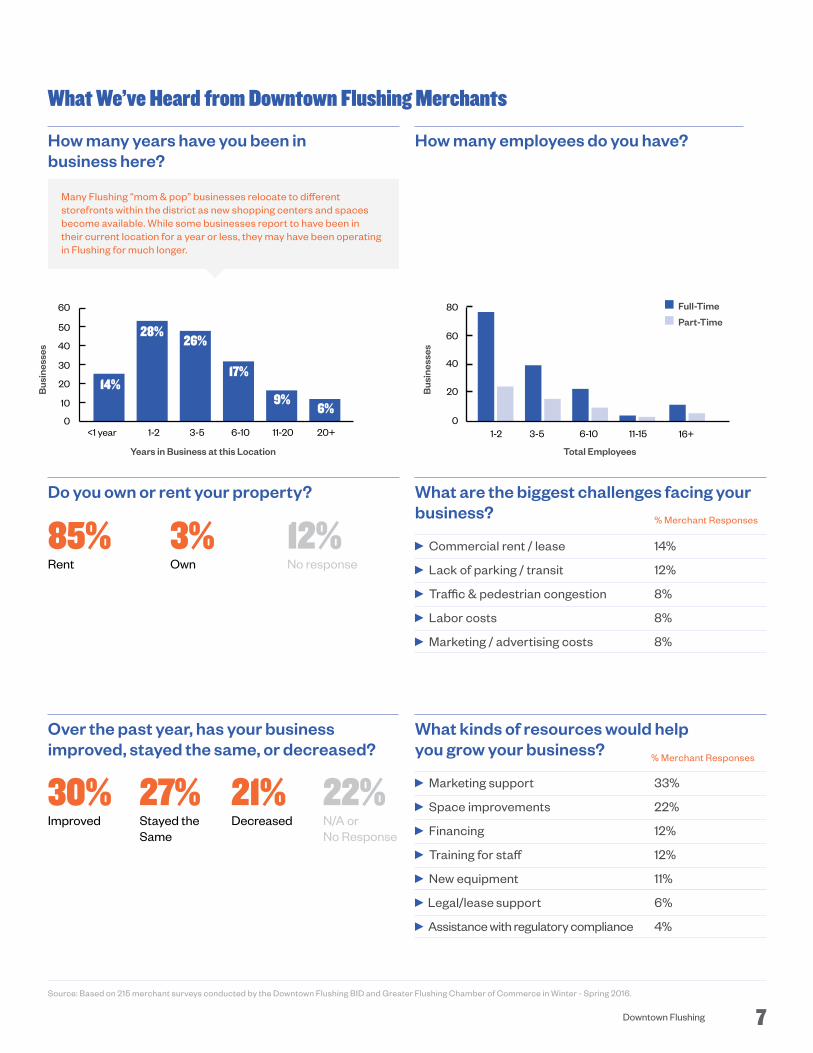
Source: Based on 215 merchant surveys conducted by the Downtown Flushing BID and Greater Flushing Chamber of Commerce in Winter - Spring 2016.
What We’ve Heard from Downtown Flushing Merchants
How many years have you been in business here?
Do you own or rent your property?
85%Rent
3%Own
12%No response
Over the past year, has your business improved, stayed the same, or decreased?
30%Improved
27%Stayed the Same
21%Decreased
22%N/A or No Responsese
How many employees do you have?
0
10
20
30
40
50
60
11-20 20+6-103-51-2<1 year
14%
28%
17%
9%6%
26%
Years in Business at this Location
Bus
ines
ses
Bus
ines
ses
Total Employees
0
20
40
60
80
16+11-156-101-2 3-5
Many Flushing “mom & pop” businesses relocate to different storefronts within the district as new shopping centers and spaces become available. While some businesses report to have been in their current location for a year or less, they may have been operating in Flushing for much longer.
What kinds of resources would help you grow your business?
Marketing support 33%
Space improvements 22%
Financing 12%
Training for staff 12%
New equipment 11%
Legal/lease support 6%
Assistance with regulatory compliance 4%
% Merchant Responses
What are the biggest challenges facing your business?
Commercial rent / lease 14%
Lack of parking / transit 12%
Traffic & pedestrian congestion 8%
Labor costs 8%
Marketing / advertising costs 8%
% Merchant Responses
Full-Time
Part-Time
7Downtown Flushing

What can we change to improve Flushing?
Parking
Sanitation
Transit improvements
Safety
Storefront improvements
Better streetscape
More community events
More open space
Other
What languages do you speak?
Where are your clients / shoppers from?
24%
20%
15%
14%
11%
5%
4%
4%
2%
8 Neighborhood 360° Commercial District Needs Assessment
BUSINESS LANDSCAPE: DOWNTOWN FLUSHING
What We’ve Heard from Downtown Flushing Merchants
Mandarin 40%
English 36%
Korean 9%
Cantonese 7%Spanish 2%Fujianese 2%
Vietnamese 1%
Taiwanese 1%Shanghainese 1%Whenzhounese 1%
53% 27% 20%
Local Queens Outside of Queens
Full-Service Restaurants
Health & Personal Care Stores
Building Material & Supplies Dealers
Grocery Stores
Other General Merchandise Stores
Furniture Stores
Home Furnishings Stores
Limited-Service Eating Places
Book, Periodical, & Music Stores
Used Merchandise Stores
Jewelry, Luggage, & Leather Goods Stores
Drinking Places (Alcoholic Beverages)
Specialty Food Stores
Florists
Auto Parts, Accessories, & Tire Stores
Department Stores (Excluding Leased Departments)
Special Food Services
Office Supplies, Stationery, & Gift Stores
Lawn / Garden Equipment & Supply Stores
Shoe Stores
Other Miscellaneous Store Retailers
Beer, Wine, & Liquor Stores
Clothing Stores
Sporting Goods, Hobby, & Musical Instrument Stores
Electronics & Appliance Stores
Gasoline Stations
-$8.9M
-$6.3M
-$4.5M
-$27.8M
-$18.3M
-$13.3M
-$54.9M
-$68.6M
-$64.9M
-$3.6M
-$2.5M
-$360,000
$2.6M
$2.6M
$1.5M
$610,000
$3.2M
$5.5M
$4.4M
$3.8M
$8.1M
$6.4M
$12.0M
$17.4M
$17.9M
$40.2M
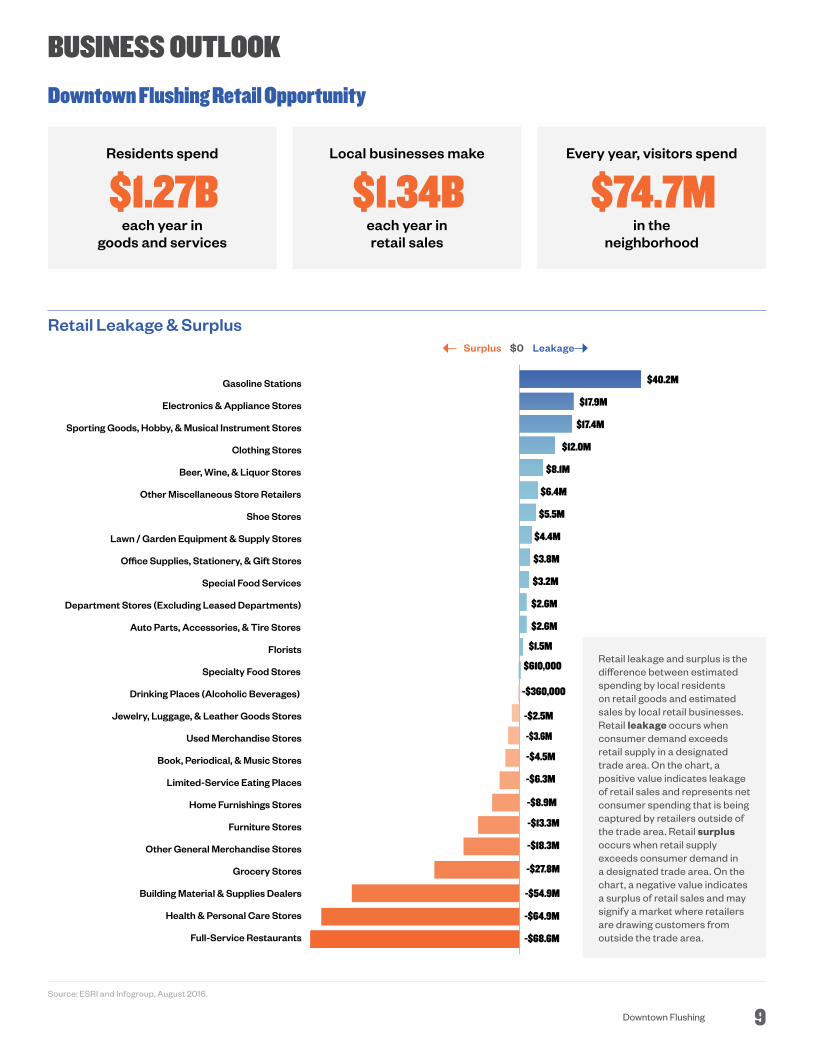
BUSINESS OUTLOOK
Retail Leakage & Surplus
Local businesses make
$1.34Beach year in retail sales
Every year, visitors spend
$74.7Min the
neighborhood
Residents spend
$1.27Beach year in
goods and services
LeakageSurplus $0
Downtown Flushing Retail Opportunity
Source: ESRI and Infogroup, August 2016.
Retail leakage and surplus is the difference between estimated spending by local residents on retail goods and estimated sales by local retail businesses. Retail leakage occurs when consumer demand exceeds retail supply in a designated trade area. On the chart, a positive value indicates leakage of retail sales and represents net consumer spending that is being captured by retailers outside of the trade area. Retail surplus occurs when retail supply exceeds consumer demand in a designated trade area. On the chart, a negative value indicates a surplus of retail sales and may signify a market where retailers are drawing customers from outside the trade area.
9Downtown Flushing

Downtown Flushing Queens NYC
19% 38% 29%Downtown Flushing Queens NYC
73% 141% 105%
Very clean
Somewhat clean
Not very clean
Not clean at all
Car
Bus
Walk
Subway
Bike
Long Island Rail Road
Taxi
39%
21%
18%
17%
4%
1%
0%
How do you usually travel to get to Flushing?
What additional businesses would you like to see in Flushing?
Healthy food options
Theater, music, or entertainment venues
Art galleries
Book stores
Gyms
Business Trends
How would you rate the cleanliness of Downtown Flushing?
How often do you visit Flushing?
What We’ve Heard from Shoppers
1%
18%
43%
38%
Source: Based on 100 consumer surveys conducted by the Downtown Flushing BID and Greater Flushing Chamber of Commerce in Winter - Spring 2016.
Source: Division of Tax Policy, NYC Department of Finance.
BUSINESS OUTLOOK
Change in Total Business Sales, 2008-2015 Change in Median Sales by Business, 2008-2015
0
$100M
$200M
$300M
$400M
$500M
$338
,804
,544
$344
.946
,497
$330
,712
,890
$347
,394
,312
$376
,380
,073
$372
,296
,703
$404
,008
,157
$386
,838
,644
2009 2010 2011 2012 2013 2014 201520080
$10K
$20K
$3OK
$40K
$50K
2009 2010 2011 2012 2013 2014 20152008
$26,
842
$26,
999
$28,
642
$31,5
62
$32,
734 $3
8,01
8 $46,
565
$45,
438
Downtown Flushing Median Sales by BusinessDowntown Flushing Total Business Sales
Year Year
Sal
es V
olum
e
Sal
es V
olum
e
Daily
2 to 4 times a week
Once a week
Twice a month
Once a month
Not regularly
15%
25%
18%
11%
11%
0%
10 Neighborhood 360° Commercial District Needs Assessment

Streetscape Observations
Queens Crossing
Storefront conditions vary from store to store. New businesses generally have better quality signage.
Illegal disposal of residential and commercial garbage coupled with high volumes of pedestrians cause litter to pile up on nearly every street.
Many broken curbs due to heavy pedestrian traffic and truck loading.
Traffic markers are worn down and require new paint and renovation.
Graffiti is frequently seen tagged on construction sites and storefront gates.
Existing street furniture is not well-maintained and adds to the unsightliness of certain sidewalks.
PHYSICAL ENVIRONMENT
Commercial Density
One Fulton Square
New York Food Court
Golden Shopping Mall
Graffiti
Flus
hing
Cre
ek
KISSENA BLVD
37 AV
35 AV
UNION ST
CO
LLEGE PO
INT B
LVD
ROOSEVELT AV
MAIN ST
39 AV
NORTHERN BLVD
BOW
NE ST
SANFORD AV41 AV
41 RD
77
Long Island Rail Road
Margaret I. CarmenGreen
BlandPlayground
BownePlayground
The Shops at SkyView Center
New World Mall
Flushing Commons
One FultonSquare
Queens Crossing
Two FultonSquare
New York Food Court
Golden Shopping Mall
< 2 Floors
2 - 7 Floors
7+ Floors
Multi-Level Shopping Centers
Current & Planned Developments
0 0.2 Miles0.1
Sidewalk Garbage
Shopping Centers
11Downtown Flushing

Average Household Size
2.6 Downtown Flushing
Queens
New York City
Population Density (per square mile)
50,663 Downtown Flushing
Queens
New York City
2,256,400
8,268,999
CitiField
FlushingMeadows
Corona Park
Queens Botanical
Garden
ROOSEVELT AV
MAIN ST
UNION ST
Leavitts Park
CollegePoint
MurrayHill
WilletsPoint
Flushing Bay
39 AV
CO
LLEGE PO
INT B
LVD
WHITESTONE EXPY
NORTHERN BLVD
UN
ION
ST
PARSONS BLVD
KISSENA BLVDCOLDEN ST
45 AV
KissenaPark
USTA Billie Jean KingNational Tennis Center
Flus
hing
Cre
ek
Study Area Boundaries
DATA APPENDIX
Assessed Commercial Corridors
Primary data on Downtown Flushing storefront businesses presented on pg. 6-8 was gathered along Main Street, Roosevelt Avenue, Northern Boulevard, Union Street, 39th Avenue, and College Point Boulevard commercial corridors.
Downtown Flushing Context Area
Demographic and employment data on pg. 12-13 correspond to the Downtown Flushing neighborhood context area.
Trade Area
Retail opportunity, leakage, and surplus data on pg. 9 corresponds to the 0.75 mile trade area.
20,701
27,027
Total Population
68,902 Downtown Flushing
Queens
New York City
2.9
2.6
Area Demographics
Car Ownership
43% Downtown Flushing
Queens
New York City
Commuting Patterns
63%
45%
21,557 Work in Downtown Flushing , live elsewhere
2,561 Live & Work in Downtown Flushing
18,762 Live in Downtown Flushing, work elsewhere
21,557 18,7622,561
Work Live
0 0.25 Miles0.125
12 Neighborhood 360° Commercial District Needs Assessment

Population Age Foreign-Born Population
71% Downtown Flushing
Queens
New York City
Race / Background
48%
37%
Median Age
43.3 Downtown Flushing
Queens
New York City
37.4
35.6
Downtown Flushing QN NYC
Downtown Flushing QN NYC
Under 5 Years
5–14 Years
15–24 Years
25–44 Years
45–64 Years
65+ Years
6%
11%
13%
30%
26%
13%
7%
11%
14%
31%
25%
12%
Educational Attainment Downtown Flushing QN NYC
12th Grade or Less, No Diploma
High School Graduate
Some College, No Degree
Associate’s Degree
Bachelor’s Degree
Graduate or Professional Degree
25%
28%
10%
10%
19%
8%
20%
27%
15%
8%
19%
11%
20%
25%
15%
6%
20%
14%
Income Employment
Local Jobs and Employment
Area Demographics
*Note: The unemployment rate for Queens is at 4.4% and New York City is at 5.1%, as of June 2016 (NYSDOL); updated neighborhood-level data for Downtown Flushing is not available.
Sources: US Census Bureau, 2009-2013 American Community Survey and 2014 OntheMap Application.
Educational Services, Health Care, Social Assistance
Retail Trade
Accommodation, Food Services, Arts, Entertainment
Other Services
Finance, Insurance, Real Estate
Information
Professional, Scientific, & Technical Services
Construction
Manufacturing
Transportation, Warehousing, Utilities
Public Administration
Local Residents’ Employment
Educational Services, Health Care, Social Assistance
Accommodation, Food Services, Arts, Entertainment
Other Services
Retail Trade
Professional, Scientific, & Technical Services
Finance, Insurance, Real Estate
Transportation, Warehousing, Utilities
Construction
Manufacturing
Public Administration
Information
Jobs Located in Downtown Flushing
19%
16%
15%
11%
10%
7%
7%
6%
5%
3%
2%
32%
18%
11%
10%
8%
7%
6%
3%
3%
1%
0.2%
DATA APPENDIX
4%
8%
11%
29%
31%
17%
Median Household Income
$39,565 Downtown Flushing
Queens
New York City
$57,001
$52,259
Pop. Below Poverty Line
23% Downtown Flushing
Queens
New York City
15%
20%
Unemployment Rate
8.9% Downtown Flushing
Queens
New York City
9.9%
10.6%
Population in Labor Force
59% Downtown Flushing
Queens
New York City
65%
63%
Hispanic or Latino (of any race)
White alone
Black or African American alone
Asian alone
Native Hawaiian and Other Pacific Islander
American Indian and Alaska Native alone
Some other race alone
Two or more races
16%
9%
4%
67%
0%
1%
1%
2%
28%
27%
18%
24%
0%
0%
2%
2%
29%
33%
23%
13%
0%
0%
1%
1%
13Downtown Flushing

Downtown Flushing Transportation
Average Weekday Subway Ridership (2015)
60,226 Flushing Main Street station
Pedestrian Counts Weekday Morning (7-9 a.m.)
3,485 Main Street between 37th Avenue and 38th Avenue
2,005 Prince Street between 37th Avenue and 38th Avenue
330 Roosevelt Avenue between Main Street and Union Street
Vehicular Traffic
48,757 Average daily vehicles on Northern Boulevard between College Point Boulevard and Parsons Boulevard (2014)
25,373 Average daily vehicles on Main Street between Roosevelt Avenue and Dahlia Avenue (2014)
22,882 Average daily vehicles on College Point Boulevard between Roosevelt Avenue and Fowler Avenue (2014)
Bus Routes
Downtown Flushing Transportation
NYC Subway Bicycle Lanes Long Island Rail Road
Bus Routes
20 MTA Bus Routes
1 Select Bus Service (SBS) Route Q44
1 Express Bus Route QM3
DATA APPENDIX
!
Q44SBS
N
20G
Q 44SBS
QM
3
17 25 27 34
20A20B
48
12 15 26
6558
13 16 2819 66
65
13 28QM
3
12
15
QM2
QM20
2534
50
1620
A20
B
15A
7
32 AV
35 AV
MAIN ST
38 AV
45 AV
31 RD
KISSENA BLVD
CO
LLEGE PO
INT B
LVD
57 RD
126 ST
VAN WYCK EXPY
41 AV
COLDEN ST
PAR
SON
S BLVD
146 ST
SANFORD AV
ROOSEVELT AV
39 AV
FRANKLIN AV
56 AV
41 RD
BARCLAY AV
31 AV
WHI
TEST
ONE
EXP
Y
57 AV127 ST
FARRINGTO
N ST
BOOTH MEMORIAL AV
138
ST
WIL
LETS
PT
BLVD
136
ST
PRIN
CE
ST
ELDER AV
FOWLER AV
DAHLIA AV
CHERRY AV
UN
ION
ST
34 AV
138 ST
37 AV
PARSONS BLVD
NORTHERN BLVD
147 ST
UNION ST
BOW
NE ST
Long Island Rail Road
Flushing Meadows
Corona Park
Citi Field
Queens Botanical
Garden
LeavittsPark
Flushing Bay
USTA Billie Jean KingNational Tennis Center
Annual MTA Bus Ridership (2015)
9.6M Q58
8.9M Q44
7.6M Q27
5.5M Q17
4.2M Q20
7
0 0.25 Miles0.125
14 Neighborhood 360° Commercial District Needs Assessment

Neighborhood 360° Fellowship Host Organization, awarded to the Greater Flushing Chamber of Commerce, 2016.
BID Expansion Planning & Outreach, Avenue NYC merchant organizing grant of $20,000 awarded to Downtown Flushing Transit Hub Business Improvement
District, 2015.
The Destination of Choice Food/Cuisine Marketing Campaign, Avenue NYC placemaking grant of $25,000 awarded to Downtown Flushing Transit Hub
Business Improvement District, 2012.
Recent SBS Investments in the Neighborhood
Existing Plans & Studies Flushing 2050 Community Building Initiative, Asian Americans For Equality, 2016 (in progress).
Flushing Waterfront Brownfield Opportunity Area (BOA) Study, Flushing Willets Point Corona Local Development Corporation and NYC Department of City Planning (in progress).
Flushing’s Economy: Challenges and Opportunities, Asian Americans For Equality, 2013.
An Economic Snapshot of Flushing, Queens, New York State Comptroller, 2011.
Economic Development and the Economy of Flushing, Queens, NYS Comptroller, 2006.
Development Framework for Downtown Flushing, NYC Economic Development Corporation and NYC Department of City Planning, 2004.
Downtown Flushing Rezoning and Waterfront Access Plan, NYC Department of City Planning, 1998.
SourcesESRI and Infogroup, Inc. August 2016 ESRI Retail MarketPlace Profile.
Infogroup, Inc. 2016. From ReferenceUSA database.
Metropolitan Transportation Authority. 2015. Average Weekday Subway Ridership and Annual Bus Ridership.
NYS Department of Labor. June 2016. Unemployment Rate Rankings by County.
NYS Department of Transportation. 2014 Annual Average Daily Traffic, using Traffic Data Viewer.
NYC Department of Finance, Division of Tax Policy, using data from NYS Department of Taxation and Finance. Business sales are reported by tax year, which runs from March 1st to February 28th. Sales data are compiled from sales tax returns, which are rolled up by tax filer within a year, excluding returns with negative sales amounts. For each year, each tax filer is reported according to the address listed on their latest return. Large outliers were removed.
NYC Department of Small Business Services. Fiscal Year 2015. Business Improvement Districts Trends Report.
NYC Department of Transportation. May 2016. Bi-Annual Pedestrian Counts.
U.S. Census Bureau. 2014. OnTheMap Application. Longitudinal-Employer Household Dynamics Program (LEHD). Commuting Pattern data is representative of LEHD Origin-Destination Employment Statistics for the second quarter of 2014. LEHD data is based on different administrative sources, primarily Unemployment Insurance (UI) earnings data and the Quarterly Census of Employment and Wages (QCEW), and other censuses/surveys. In this context, only the highest paying job that is held over two consecutive quarters by an individual worker is counted toward worker flows into, out of, and within the context area.
U.S. Census Bureau. American Community Survey, 2013 American Community Survey 4-Year Estimates, using NYC Census FactFinder. Flushing Neighborhood Tabulation Area.
Photo Credits: © Downtown Flushing Transit Hub Business Improvement District; Greater Flushing Chamber of Commerce; Ed Reed for the Office of Mayor Bill de Blasio; NYC & Company: Will Steacy; Ed / CC BY; Nick Normal / CC BY; NYC SBS: Andrew Marcus.
15Downtown Flushing

We would like to recognize and thank the following individuals and organizations for their contributions to the development of the Downtown Flushing Commercial District Needs Assessment:
Queens Borough President Melinda Katz NYC Council Member Peter KooQueens Community Board 7Downtown Flushing Transit Hub Business Improvement District (BID)Greater Flushing Chamber of CommerceAsian Americans for Equality (AAFE)Flushing Town HallRenaissance Economic Development CorporationQueens Borough Public LibraryFlushing Chinese Business AssociationUnion Street Business AssociationLocal Initiatives Support Corporation (LISC)Downtown Flushing MerchantsDowntown Flushing Shoppers and Residents
The NYC Department of Small Business Services helps unlock economic potential and create economic security for all New Yorkers by connecting New Yorkers to good jobs, creating stronger businesses, and building a fairer economy in neighborhoods across the five boroughs.
ACKNOWLEDGMENTS
ABOUT SBS
nyc.gov/neighborhood360