d.pdf | us epa archive document · desulfurization (i.e., scrubbers), and sncr is selective...
TRANSCRIPT

The information presented here reflects EPA's modeling of the Clear Skies Act of 2002. The Agency is in the process of updating this information to reflect modifications included in the Clear Skies Act of 2003. The revised information will be posted on the Agency's Clear Skies Web site (www.epa.gov/clearskies) as soon as possible.
Page D54
Section D:Projected Impacts on Generation and Fuel Use
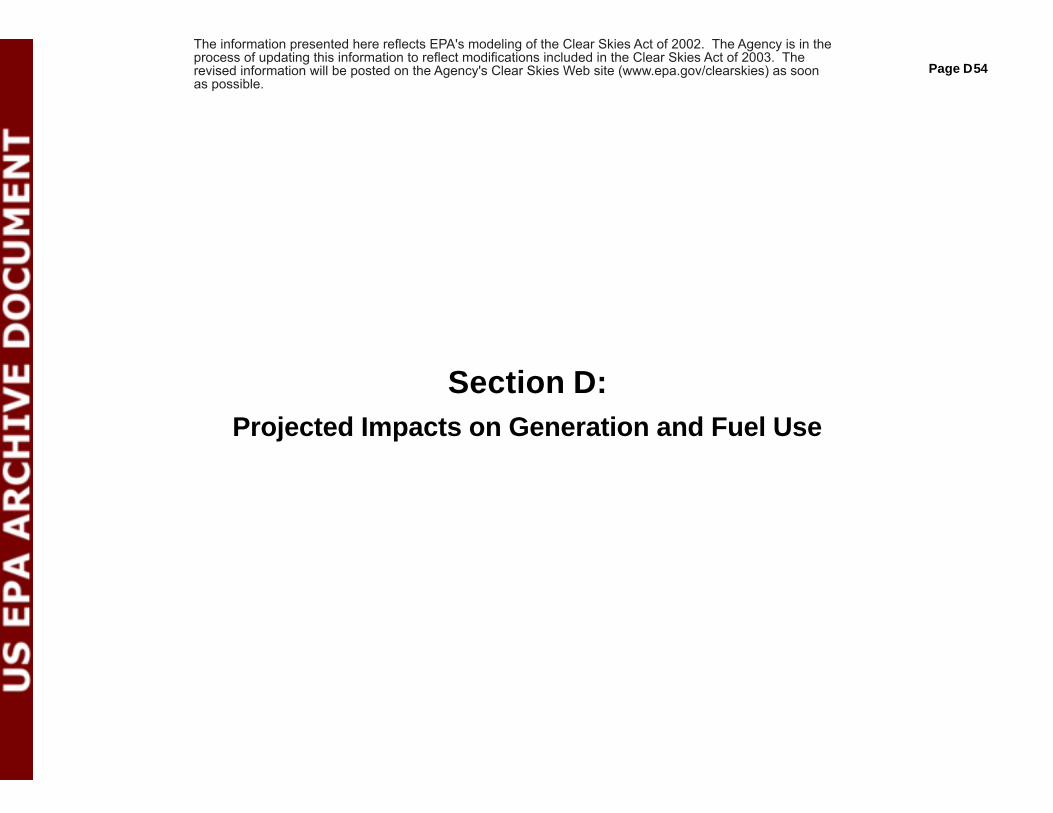
Page D55National Coal Production in 1990 and 2000, andProjected Production under Clear Skies in 2020
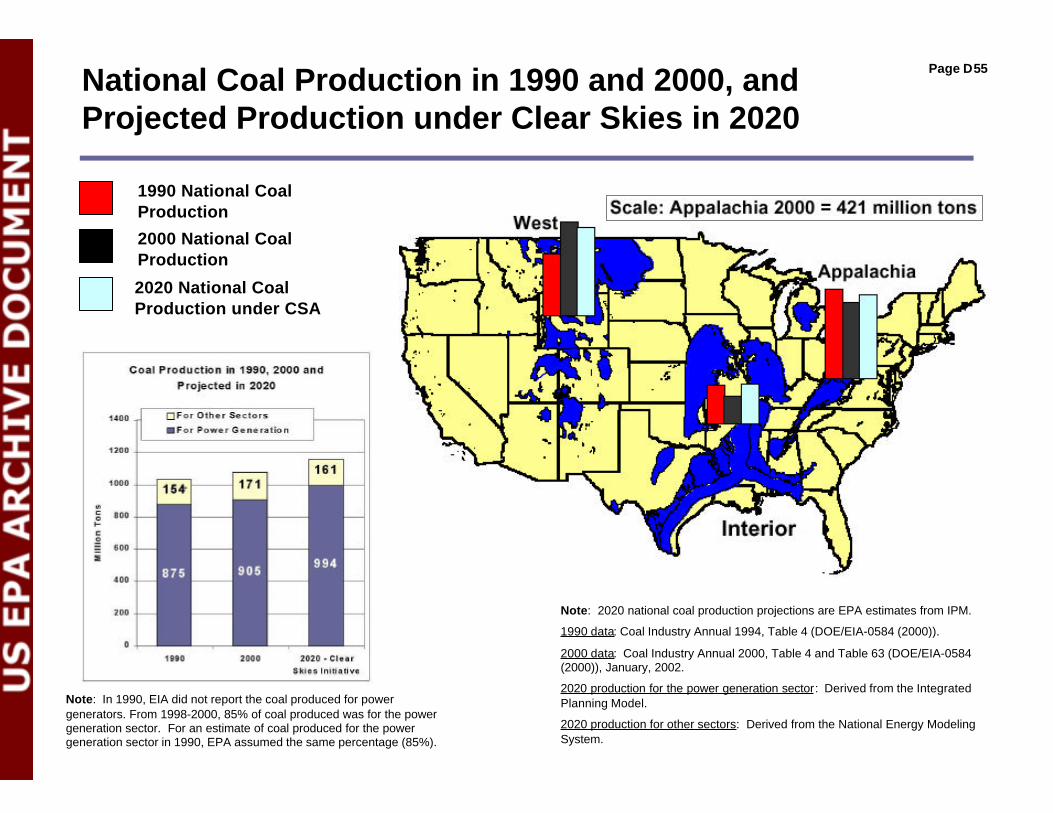
Note: 2020 national coal production projections are EPA estimates from IPM.
1990 data: Coal Industry Annual 1994, Table 4 (DOE/EIA-0584 (2000)).
2000 data: Coal Industry Annual 2000, Table 4 and Table 63 (DOE/EIA-0584(2000)), January, 2002.
2020 production for the power generation sector: Derived from the IntegratedPlanning Model.
2020 production for other sectors: Derived from the National Energy ModelingSystem.
2000 National CoalProduction
2020 National CoalProduction under CSA
Note: In 1990, EIA did not report the coal produced for powergenerators. From 1998-2000, 85% of coal produced was for the powergeneration sector. For an estimate of coal produced for the powergeneration sector in 1990, EPA assumed the same percentage (85%).
1990 National CoalProduction
Page D56
Coal Production and Employment Impacts
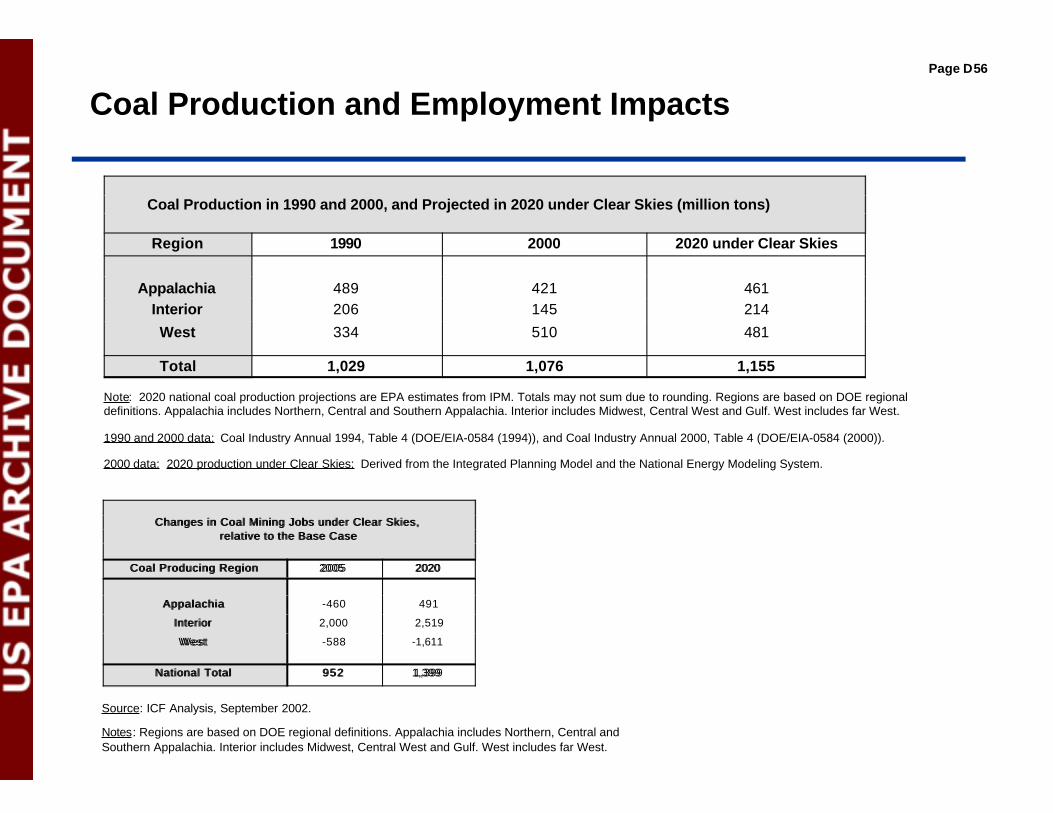
Note: 2020 national coal production projections are EPA estimates from IPM. Totals may not sum due to rounding. Regions are based on DOE regionaldefinitions. Appalachia includes Northern, Central and Southern Appalachia. Interior includes Midwest, Central West and Gulf. West includes far West.
1990 and 2000 data: Coal Industry Annual 1994, Table 4 (DOE/EIA-0584 (1994)), and Coal Industry Annual 2000, Table 4 (DOE/EIA-0584 (2000)).
2000 data: 2020 production under Clear Skies: Derived from the Integrated Planning Model and the National Energy Modeling System.
Coal Production in 1990 and 2000, and Projected in 2020 under Clear Skies (million tons)
Region 1990 2000 2020 under Clear Skies
Appalachia 489 421 461Interior 206 145 214West 334 510 481
Total 1,029 1,076 1,155
Source: ICF Analysis, September 2002.
Notes: Regions are based on DOE regional definitions. Appalachia includes Northern, Central andSouthern Appalachia. Interior includes Midwest, Central West and Gulf. West includes far West.
Changes in Coal Mining Jobs under Clear Skies, Changes in Coal Mining Jobs under Clear Skies, relative to the Base Caserelative to the Base Case
Coal Producing RegionCoal Producing Region 20052005 20202020
AppalachiaAppalachia -460 491
InteriorInterior 2,000 2,519
WestWest -588 -1,611
National TotalNational Total 952952 1,3991,399
Page D57
Projected Generation Mix in 2020
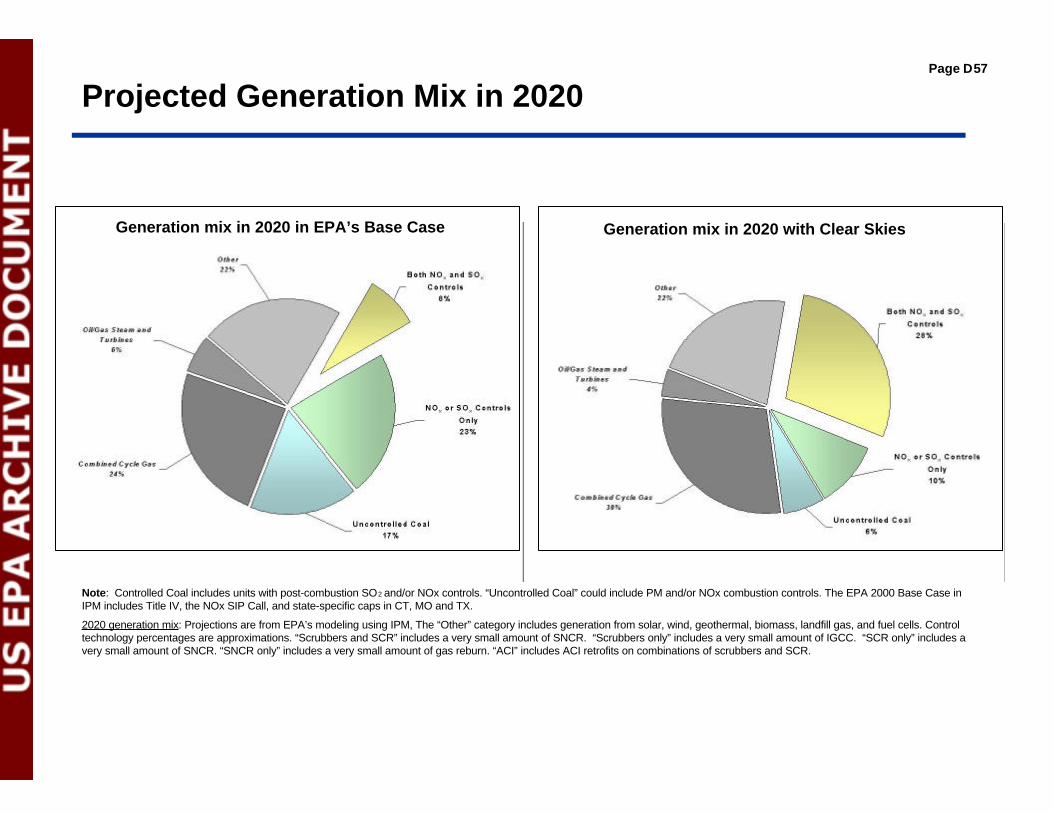
Note: Controlled Coal includes units with post-combustion SO2 and/or NOx controls. “Uncontrolled Coal” could include PM and/or NOx combustion controls. The EPA 2000 Base Case inIPM includes Title IV, the NOx SIP Call, and state-specific caps in CT, MO and TX.
2020 generation mix: Projections are from EPA’s modeling using IPM, The “Other” category includes generation from solar, wind, geothermal, biomass, landfill gas, and fuel cells. Controltechnology percentages are approximations. “Scrubbers and SCR” includes a very small amount of SNCR. “Scrubbers only” includes a very small amount of IGCC. “SCR only” includes avery small amount of SNCR. “SNCR only” includes a very small amount of gas reburn. “ACI” includes ACI retrofits on combinations of scrubbers and SCR.
Generation mix in 2020 in EPA’s Base Case Generation mix in 2020 with Clear Skies
Page D58
Technology Response to Varying Cap Levels
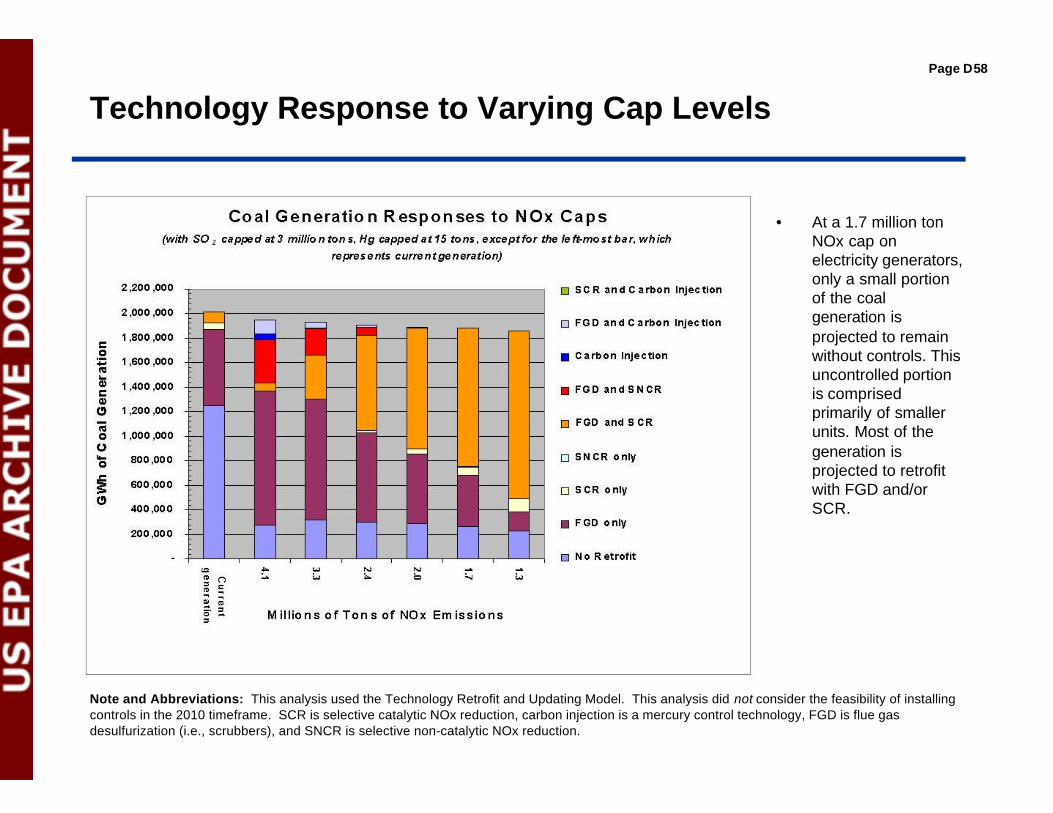
• At a 1.7 million tonNOx cap onelectricity generators,only a small portionof the coalgeneration isprojected to remainwithout controls. Thisuncontrolled portionis comprisedprimarily of smallerunits. Most of thegeneration isprojected to retrofitwith FGD and/orSCR.
Note and Abbreviations: This analysis used the Technology Retrofit and Updating Model. This analysis did not consider the feasibility of installingcontrols in the 2010 timeframe. SCR is selective catalytic NOx reduction, carbon injection is a mercury control technology, FGD is flue gasdesulfurization (i.e., scrubbers), and SNCR is selective non-catalytic NOx reduction.

Page D59
• At a 15 ton Hg cap oncoal-fired electricitygenerators, only asmall portion of the coalgeneration is projectedto remain withoutcontrols. Thisuncontrolled portion iscomprised primarily ofsmaller units. Most ofthe generation isprojected to retrofit withscrubbers (FGD) and/orselective catalyticreductions (SCR).
Technology Response to Varying Cap Levels
Note and Abbreviations: This analysis used the Technology Retrofit and Updating Model. This analysis did not consider the feasibility of installingcontrols in the 2010 timeframe. SCR is selective catalytic NOx reduction, carbon injection is a mercury control technology, FGD is flue gasdesulfurization (i.e., scrubbers), and SNCR is selective non-catalytic NOx reduction.
Page D60
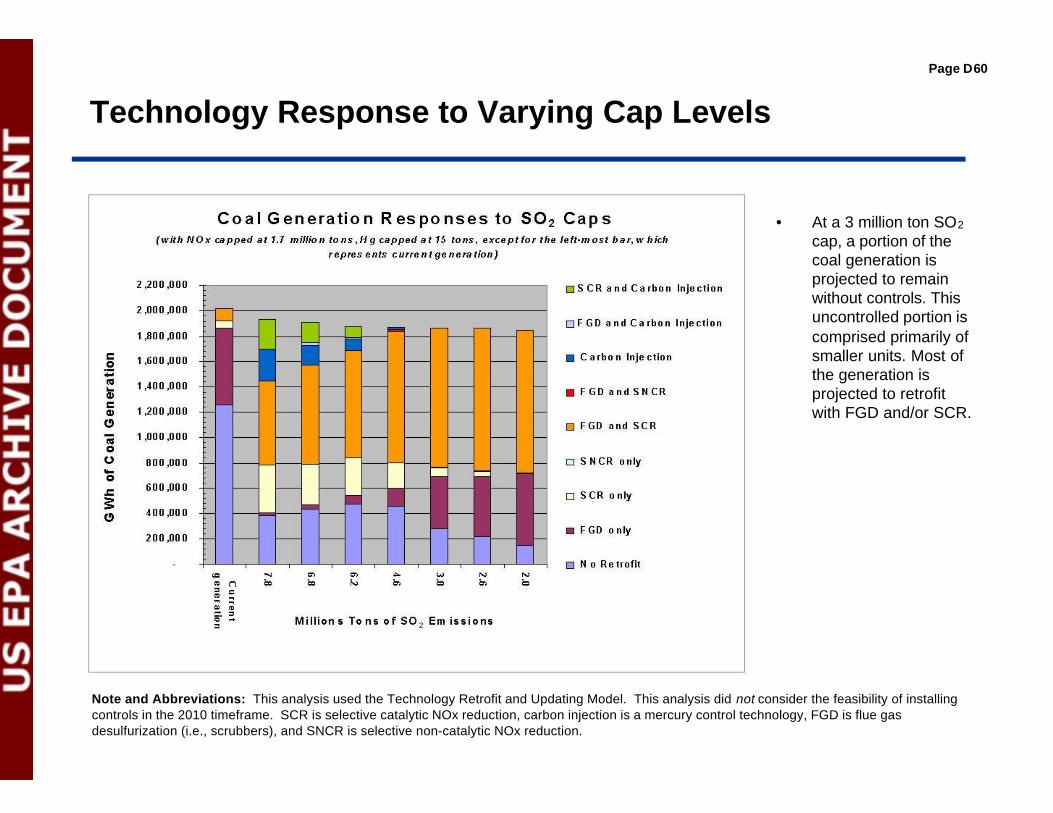
• At a 3 million ton SO2
cap, a portion of thecoal generation isprojected to remainwithout controls. Thisuncontrolled portion iscomprised primarily ofsmaller units. Most ofthe generation isprojected to retrofitwith FGD and/or SCR.
Technology Response to Varying Cap Levels
Note and Abbreviations: This analysis used the Technology Retrofit and Updating Model. This analysis did not consider the feasibility of installingcontrols in the 2010 timeframe. SCR is selective catalytic NOx reduction, carbon injection is a mercury control technology, FGD is flue gasdesulfurization (i.e., scrubbers), and SNCR is selective non-catalytic NOx reduction.
Page D61
Coal Capacity With Scrubbers Installed (GW
e)
0
50
100
150
200
250
2002 2010 2015 2020
Coal Capacity With Selective Catalytic Reduction (SCR) Installed (GW
e)
0
50
100
150
200
250
2002 2010 2015 2020
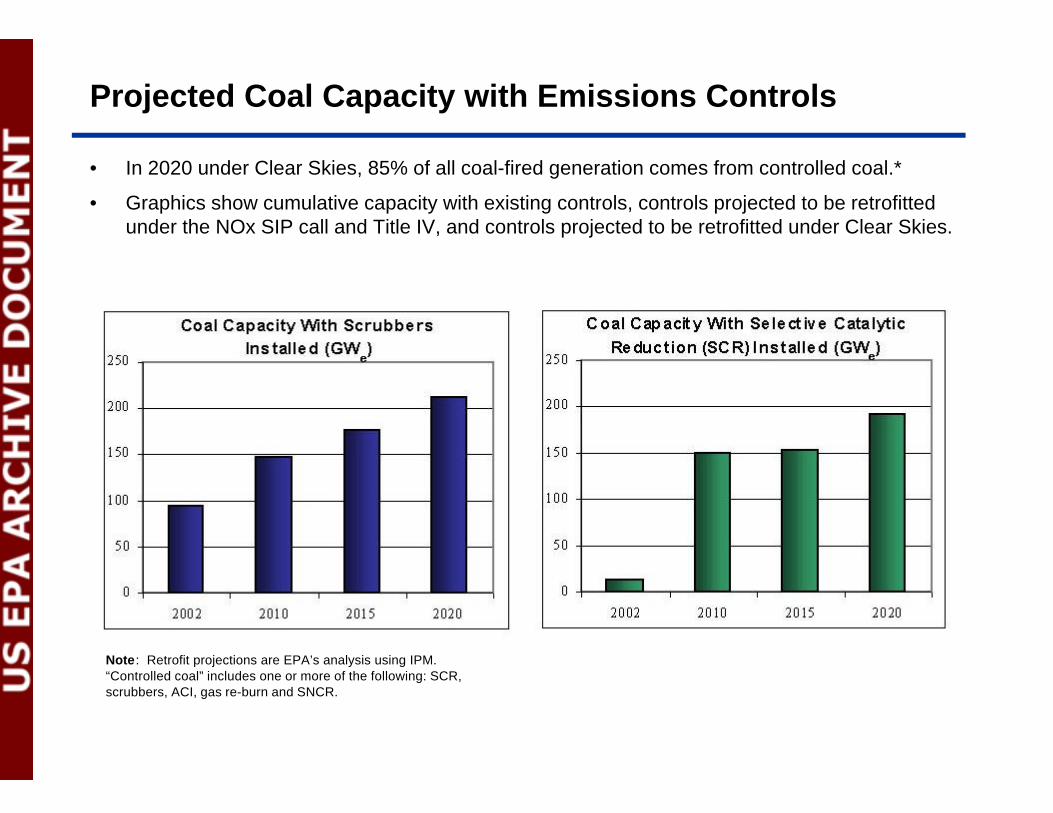
• In 2020 under Clear Skies, 85% of all coal-fired generation comes from controlled coal.*
• Graphics show cumulative capacity with existing controls, controls projected to be retrofittedunder the NOx SIP call and Title IV, and controls projected to be retrofitted under Clear Skies.
Projected Coal Capacity with Emissions Controls
Note: Retrofit projections are EPA’s analysis using IPM.“Controlled coal” includes one or more of the following: SCR,scrubbers, ACI, gas re-burn and SNCR.
Page D62
Impact of Changes in Natural Gas Prices and MercuryControl Efficiency
• Several key modeling assumptions in IPM that underlie the analysis of Clear Skieshave been challenged by stakeholders. These include:
– The natural gas prices in the model.– The mercury removal efficiency of a combination of scrubbers and SCR.
• EPA has run a number of sensitivities that explore the impact of changes in thesemodeling assumptions. Specifically:
– EPA shifted the natural gas supply curve in IPM up $0.80/MMBtu, or approximately 30%, toanalyze concerns about low natural gas prices in the model.
– EPA reduced the mercury removal efficiency of the combination of scrubbers and SCR from95% to 80.
Page D63
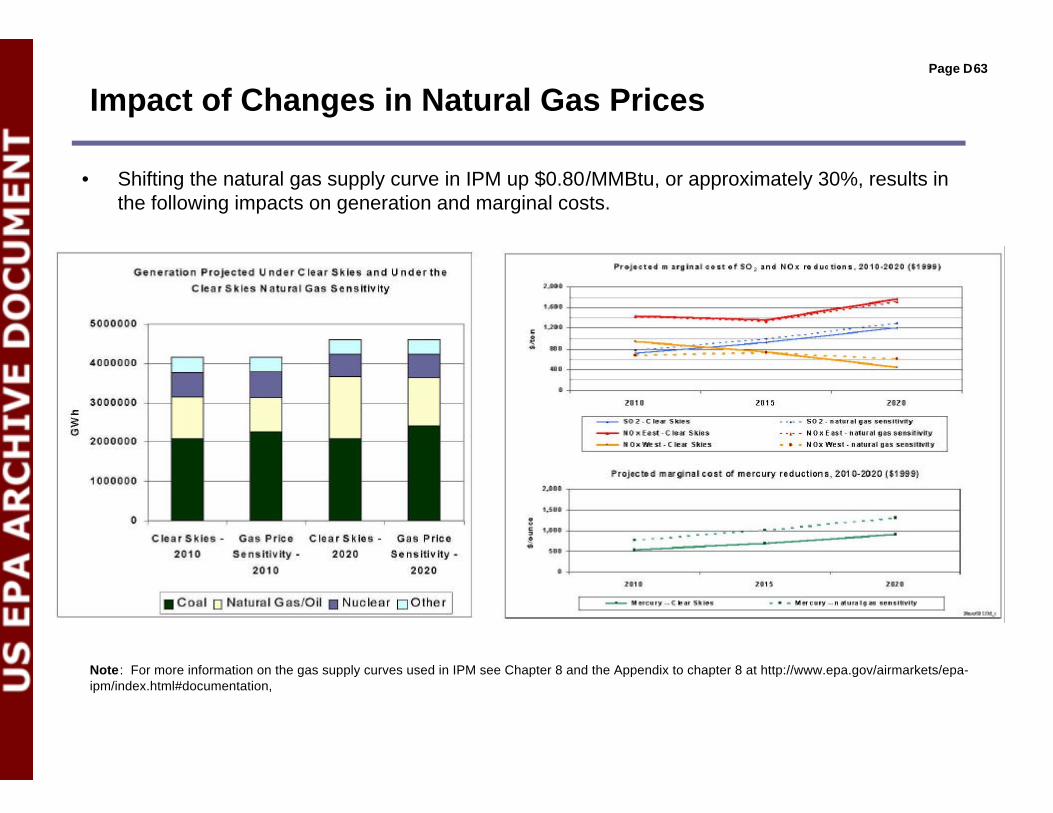
Impact of Changes in Natural Gas Prices
Note: For more information on the gas supply curves used in IPM see Chapter 8 and the Appendix to chapter 8 at http://www.epa.gov/airmarkets/epa-ipm/index.html#documentation,
• Shifting the natural gas supply curve in IPM up $0.80/MMBtu, or approximately 30%, results inthe following impacts on generation and marginal costs.
Page D64
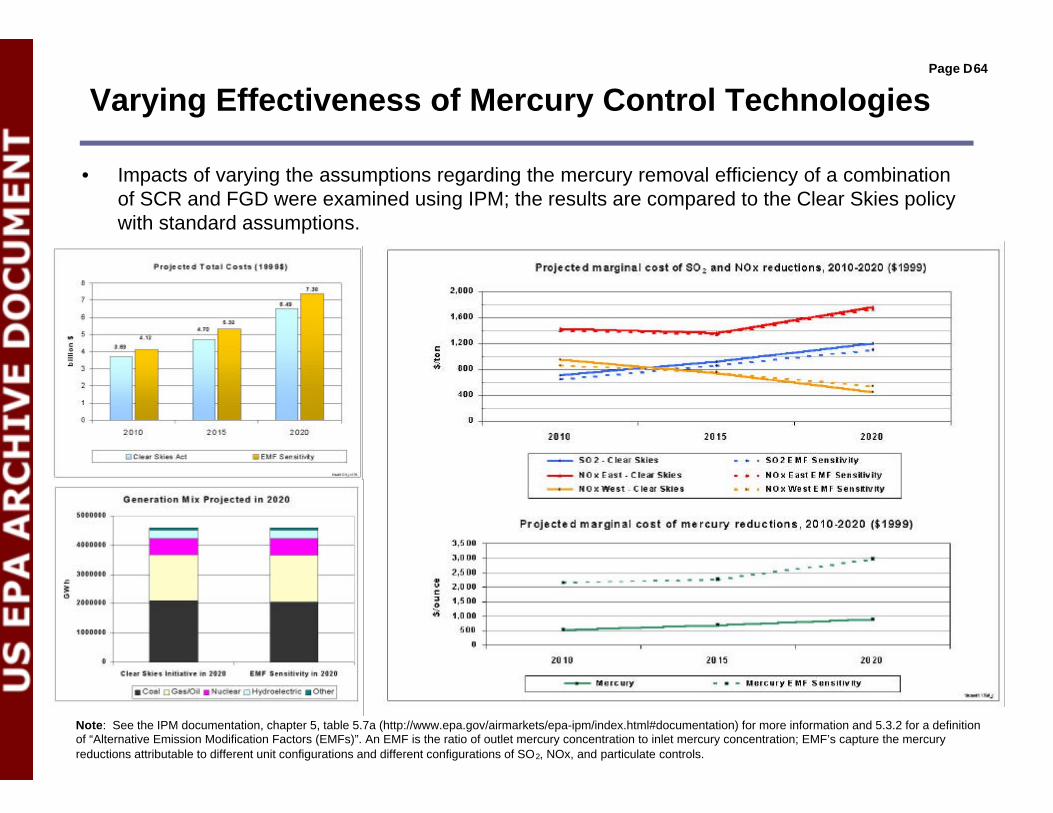
Varying Effectiveness of Mercury Control Technologies
• Impacts of varying the assumptions regarding the mercury removal efficiency of a combinationof SCR and FGD were examined using IPM; the results are compared to the Clear Skies policywith standard assumptions.
Note: See the IPM documentation, chapter 5, table 5.7a (http://www.epa.gov/airmarkets/epa-ipm/index.html#documentation) for more information and 5.3.2 for a definitionof “Alternative Emission Modification Factors (EMFs)”. An EMF is the ratio of outlet mercury concentration to inlet mercury concentration; EMF’s capture the mercuryreductions attributable to different unit configurations and different configurations of SO2, NOx, and particulate controls.
Page D65
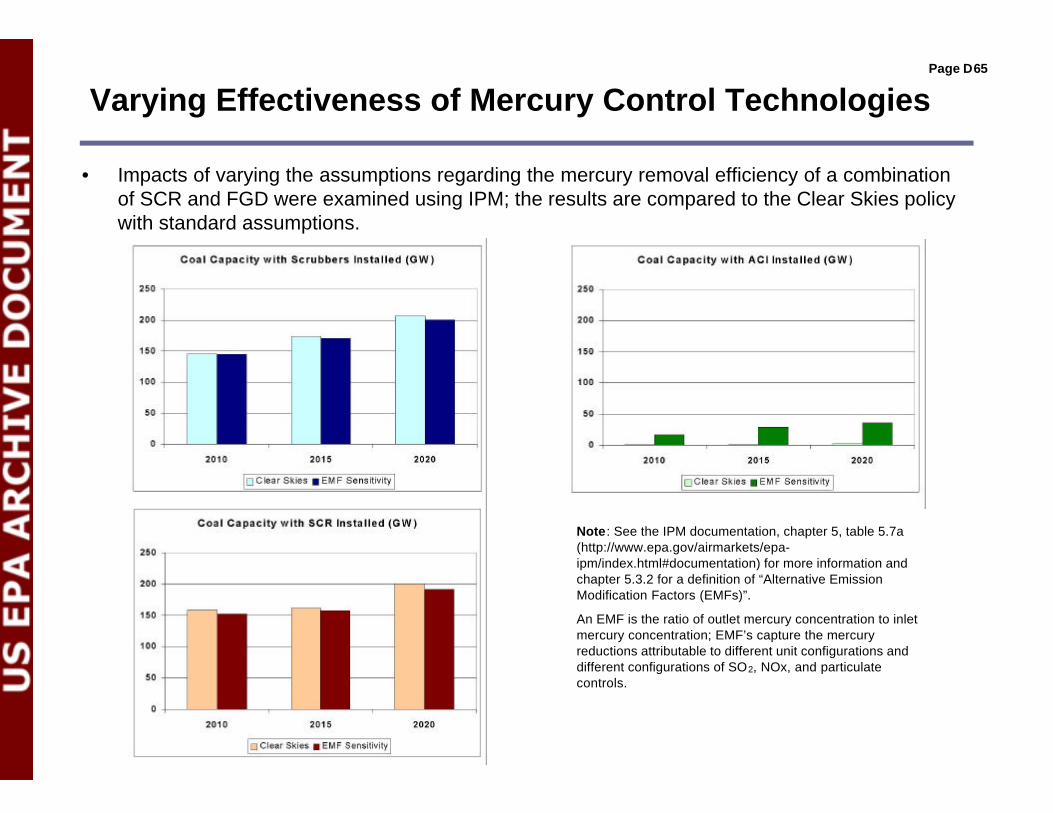
Varying Effectiveness of Mercury Control Technologies
Note: See the IPM documentation, chapter 5, table 5.7a(http://www.epa.gov/airmarkets/epa-ipm/index.html#documentation) for more information andchapter 5.3.2 for a definition of “Alternative EmissionModification Factors (EMFs)”.
An EMF is the ratio of outlet mercury concentration to inletmercury concentration; EMF’s capture the mercuryreductions attributable to different unit configurations anddifferent configurations of SO2, NOx, and particulatecontrols.
• Impacts of varying the assumptions regarding the mercury removal efficiency of a combinationof SCR and FGD were examined using IPM; the results are compared to the Clear Skies policywith standard assumptions.
Page D66
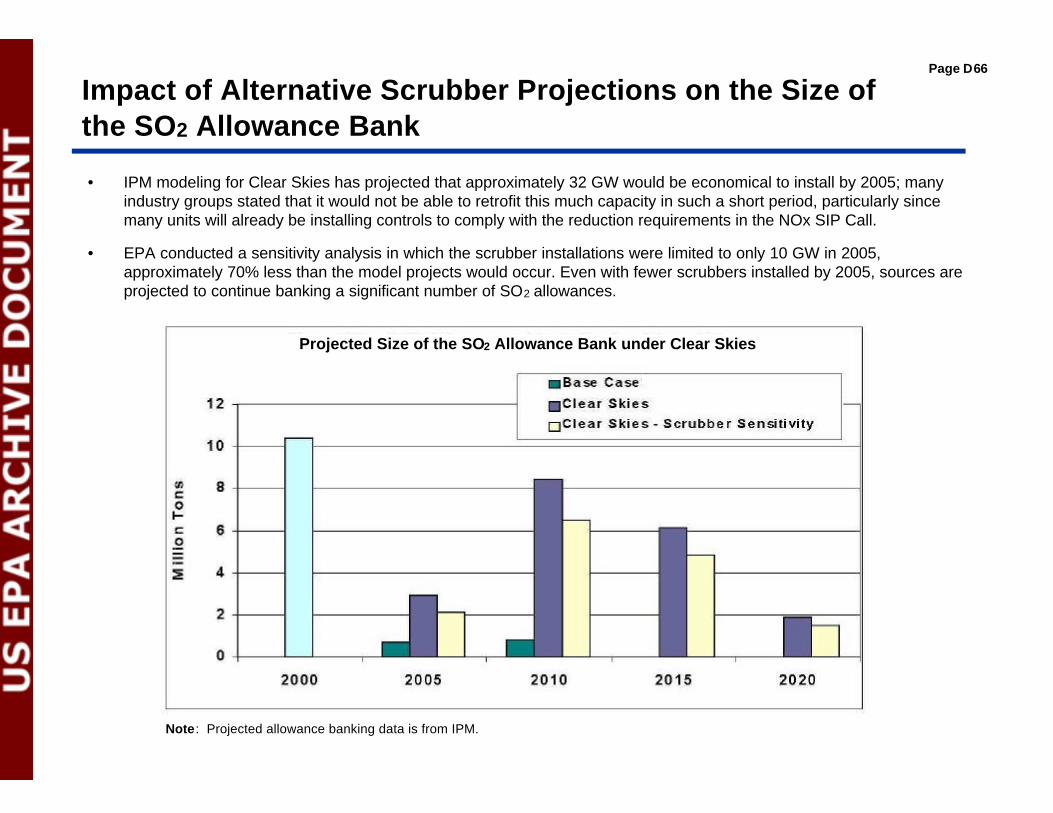
• IPM modeling for Clear Skies has projected that approximately 32 GW would be economical to install by 2005; manyindustry groups stated that it would not be able to retrofit this much capacity in such a short period, particularly sincemany units will already be installing controls to comply with the reduction requirements in the NOx SIP Call.
• EPA conducted a sensitivity analysis in which the scrubber installations were limited to only 10 GW in 2005,approximately 70% less than the model projects would occur. Even with fewer scrubbers installed by 2005, sources areprojected to continue banking a significant number of SO2 allowances.
Impact of Alternative Scrubber Projections on the Size ofthe SO2 Allowance Bank
Note: Projected allowance banking data is from IPM.
Projected Size of the SO2 Allowance Bank under Clear Skies