dr. chandra prakash presentation
TRANSCRIPT
Metabolite Identification and Characterization
Chandra Prakash, Ph. D.Pfizer Global Research and Development, Groton, CT

Outlines• Introduction• Metabolism Reactions• LC-MS strategies for metabolite
identificationTriple Stage Quadrupole (TSQ) LC/MS/MSIon Traps (LCQ, LTQ and Orbitrap) QTOF/FT-MS
• LC-NMR
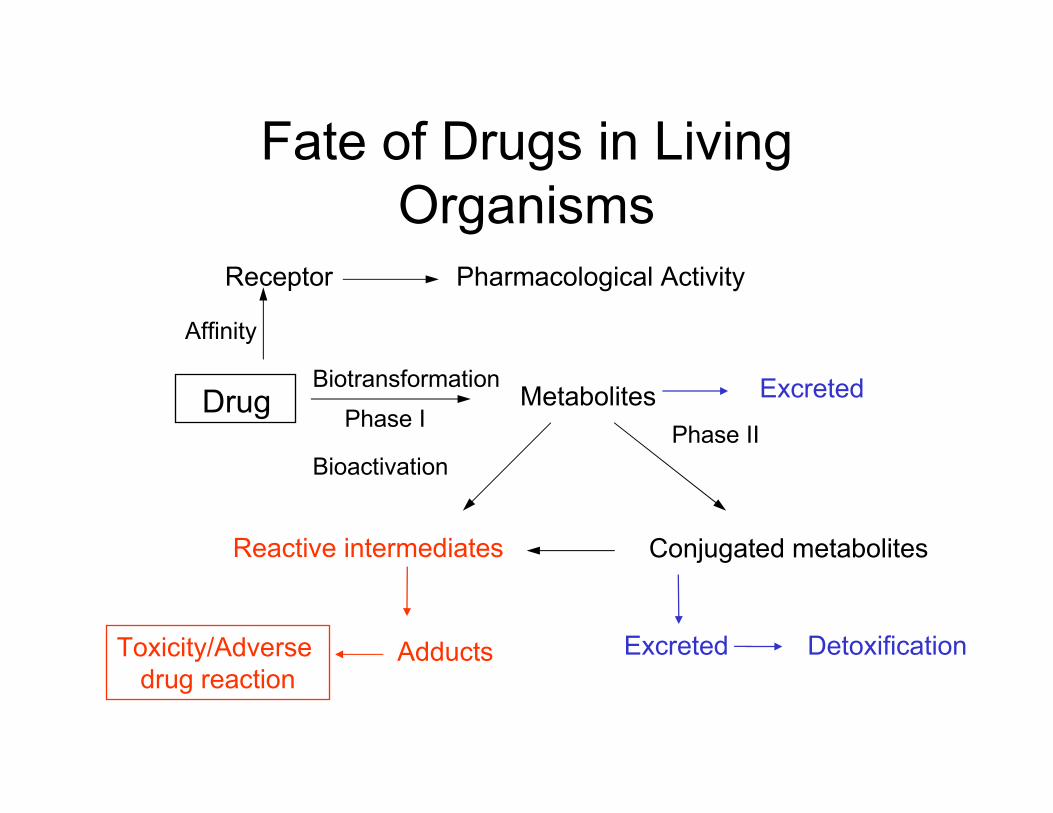
Fate of Drugs in Living Organisms
Affinity
Receptor Pharmacological Activity
Biotransformation
Phase IMetabolites Excreted
Reactive intermediates Conjugated metabolites
Phase IIBioactivation
Adducts ExcretedToxicity/Adverse drug reaction
Detoxification
DrugDrug
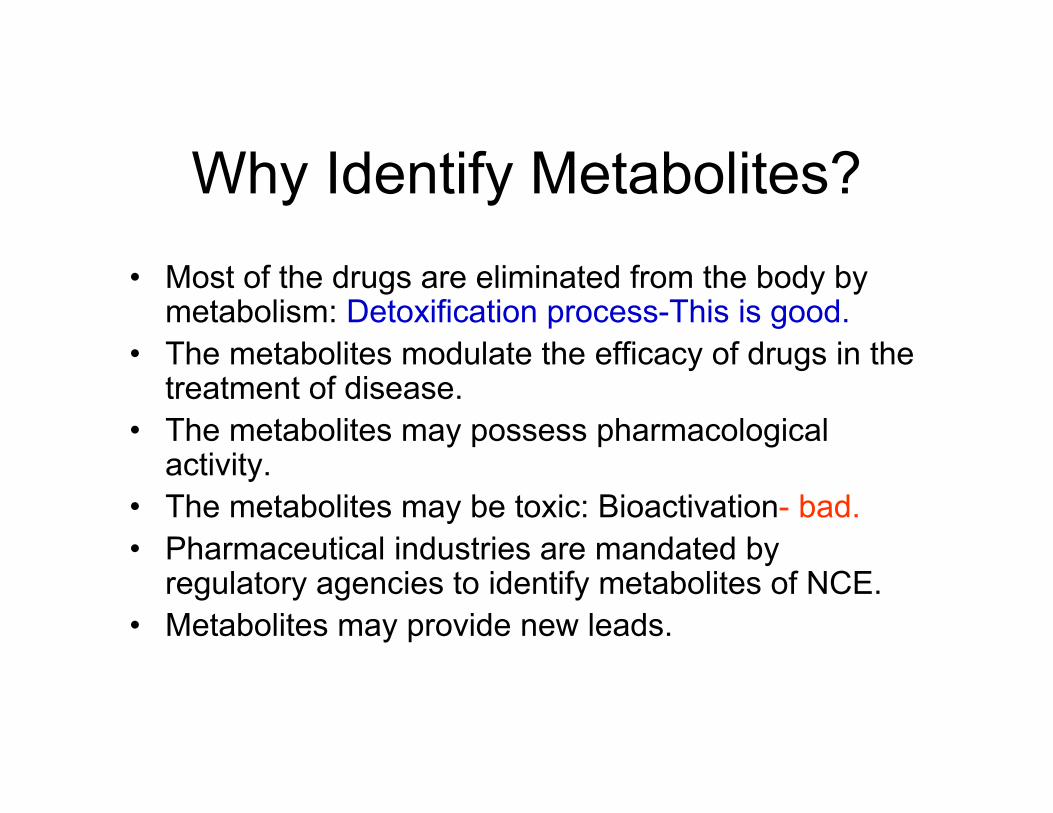
Why Identify Metabolites?• Most of the drugs are eliminated from the body by
metabolism: Detoxification process-This is good.• The metabolites modulate the efficacy of drugs in the
treatment of disease.• The metabolites may possess pharmacological
activity.• The metabolites may be toxic: Bioactivation- bad.• Pharmaceutical industries are mandated by
regulatory agencies to identify metabolites of NCE.• Metabolites may provide new leads.

Xenobiotic Metabolism
• Phase I (Activation/Detoxification) – Polar reactive groups introduced– products most often more polar and less lipophilic– more water soluble
• Phase II (Detoxification)– Covalent "conjugation" to endogenous substances– reactions most often abolish biological activity and
add to polarity– very water soluble
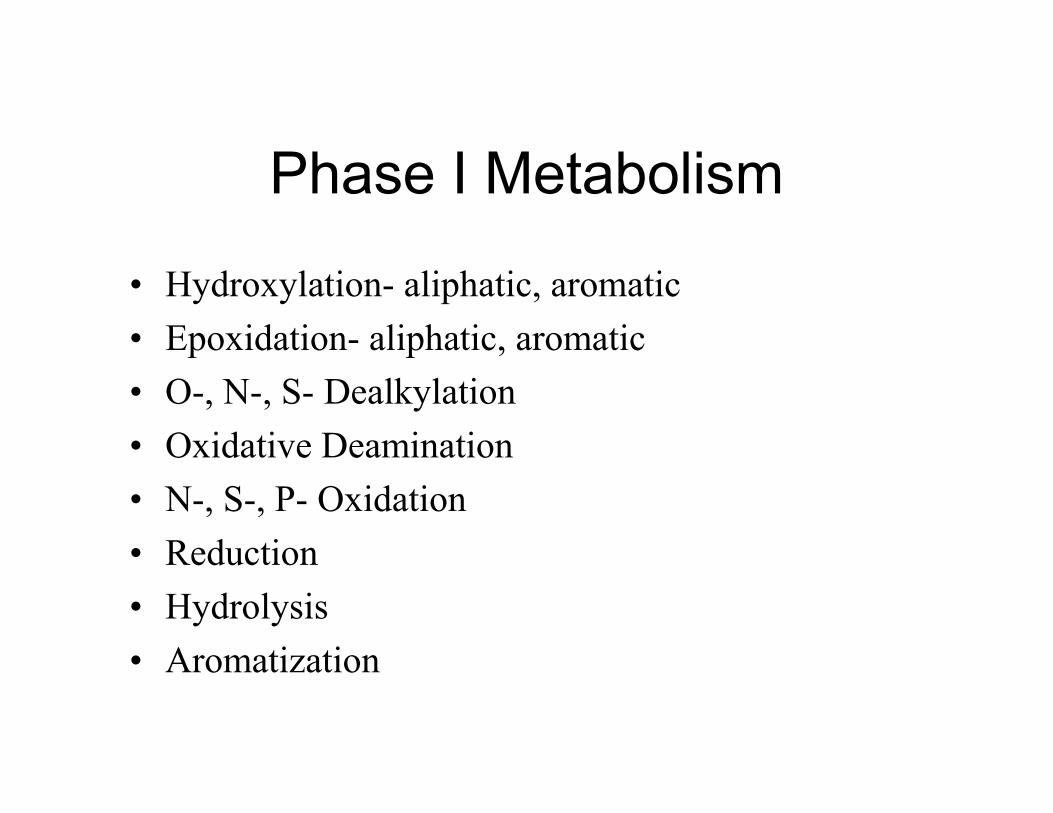
Phase I Metabolism
• Hydroxylation- aliphatic, aromatic• Epoxidation- aliphatic, aromatic• O-, N-, S- Dealkylation• Oxidative Deamination• N-, S-, P- Oxidation• Reduction• Hydrolysis• Aromatization
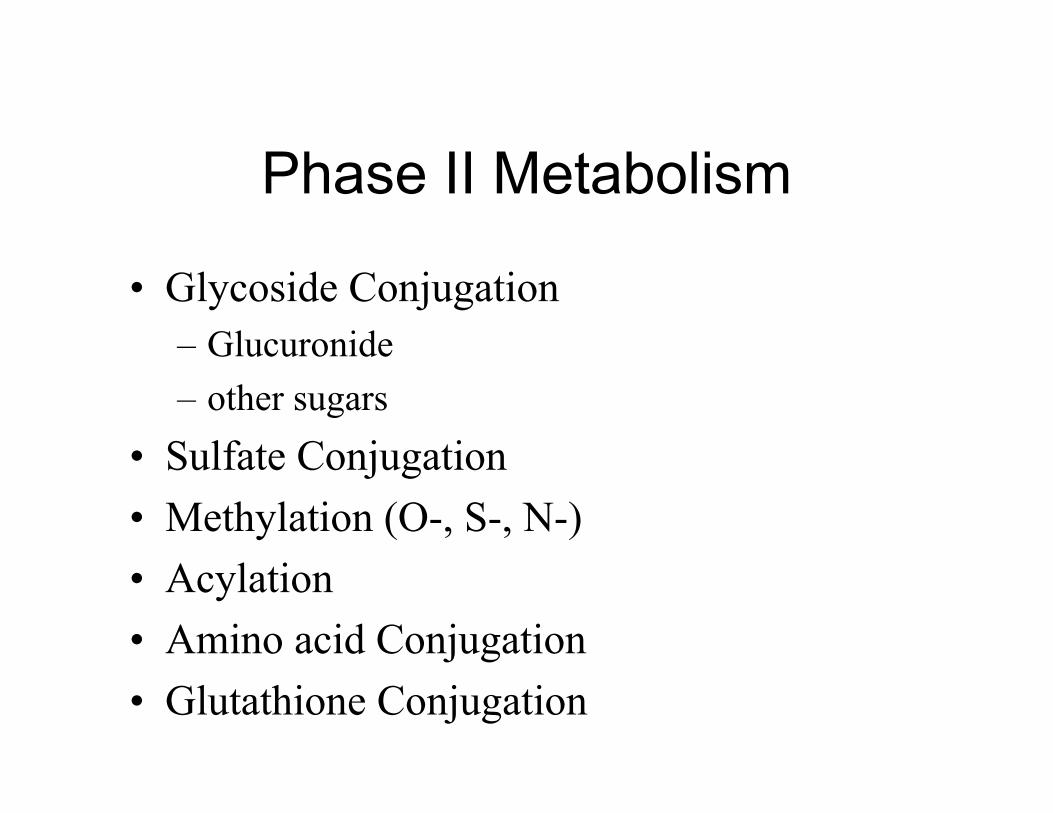
Phase II Metabolism
• Glycoside Conjugation– Glucuronide– other sugars
• Sulfate Conjugation• Methylation (O-, S-, N-) • Acylation• Amino acid Conjugation• Glutathione Conjugation

Knowledge of Basic Organic ChemistryKnowledge of Drug Metabolism and Basic Metabolic ReactionsKnowledge of Concepts of Mass SpectrometryInterpretation of Mass Spectra for Structural ElucidationInterpretation of NMR Spectra for Structural Elucidation
Identifying Metabolites-Prerequisite
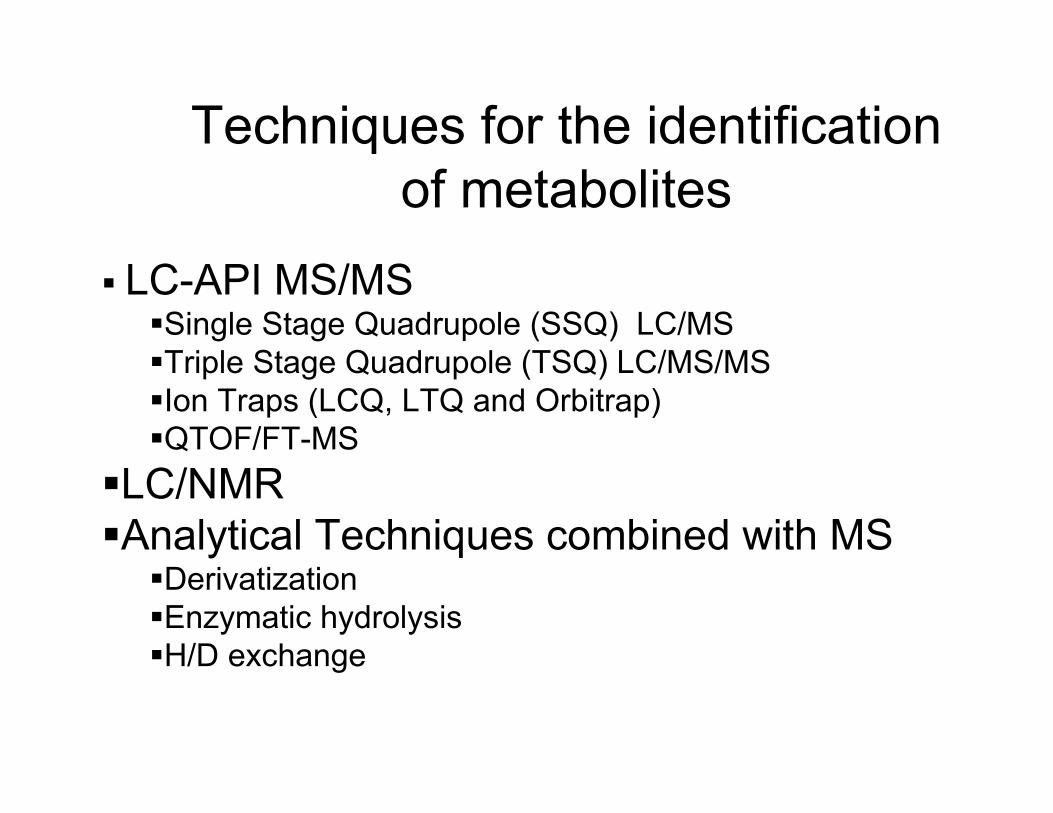
Techniques for the identification of metabolites
LC-API MS/MSSingle Stage Quadrupole (SSQ) LC/MSTriple Stage Quadrupole (TSQ) LC/MS/MSIon Traps (LCQ, LTQ and Orbitrap) QTOF/FT-MS
LC/NMRAnalytical Techniques combined with MS
DerivatizationEnzymatic hydrolysisH/D exchange

LC/MS
LC Ion Source Mass Analyzer
Atomospheric Pressure
Chemical Ionization(APCI)
Electrospray(ESI)
Single QuadrupoleTriple QuadrupoleIon TrapQ-TOF

General Rules for Choosing Polarity of Ion Detection and pH
• Positive ion Detection– Basic samples– Decrease pH
• Acetic acid pH (3-5)• Formic acid pH (2-3)• TFA pH (1-2)
– pH at least 2 units below pKa of samples

General Rules for Choosing Polarity of Ion Detection and pH
• Negative ion Detection– Acidic samples– Increase pH
• Ammonium hydroxide– pH at least 2 units above pKa of samples

Quadrupole
IonSource
Q0 Q1 Detector
IonSource
Q0 Q1 Q2 Q3Ar
Detector
Single stage quadrupole (SSQ)
Triple stage quadrupole (TSQ)

Advantages of a TSQ MS
• Renders selectivity due to mass separation at two stages.
• Helps to rapidly identify metabolites in matrices without purification.

MASS SPECTRUM• Mass Spectrometers Do Not Measure Mass. It is
plot of the mass-to-charge ratios (m/z) vs. the % relative intensities of the ions, where base peak is the most abundant ion in the spectrum
• If single charge, z=1 and m/z = m• Three types of ions in a mass spectrum;
– Intact molecule± one or more charges⇒Molecular mass
– Fragment ions⇒Structure information– Background ions⇒from non-analyte species

Natural Isotopic Abundance of Common Elements
Element
Carbon
Hydrogen
Oxygen
Nitrogen
Chlorine
Sulfur
Isotope Mass12C13C1H2H
16O18O14N15N35Cl37Cl32S33S34S
%98.91.1
99.980.0299.80.299.60.475.824.295.30.764.20

Mass
Element Nominal Mass Exact Mass
C 12 12.0000H 1 1.0078O 16 15.9949
N 14 14.0031
Average Mass
12.0111.0079715.9994
14.003
Cl 35 34.968935.45
S 32 31.97232.06

Average vs. Exact Mass
• Average mass results from occurrence of isotopes. – This is what we weigh
• Exact mass results from non-integer masses of sub-atomic particles.– This is what the Mass Spec sees– Deviation of exact from nominal is the
“Mass Defect”

Examples (C,H,O,N compounds)
XanomelineC14H23N3OS
CaffeineC8H10N4O2
ZiprasidoneC21H21N4OSCl
194.1785 194.0802
281.4057 281.1556
412.9197 412.1120
194
281
412
Compound Integer Avg. Mass Exact Mass

Nitrogen Rule
oddEvenoddOdd number of nitrogens (1, 3, 5)
EvenoddEvenEven number of nitrogens (0, 2, 4)
M+ (EI)[M+H]+ or [M-H]-M .W.Compound
Mass value
.
F, W. McLafferty and F. Turecek, Interpretation of Mass Spectra, Fourth Edition (1993)

LC/MS/MS Techniques for the Identification of Metabolites

Q1 or Full Scan
Q1 Q2 Q3OR
N2
M1M2
M3
Similar to an LC/MS total ion chromatogram.
Fromcolumn
All ions Scanned
m/z
Only Q1 operational (LC/MS mode)
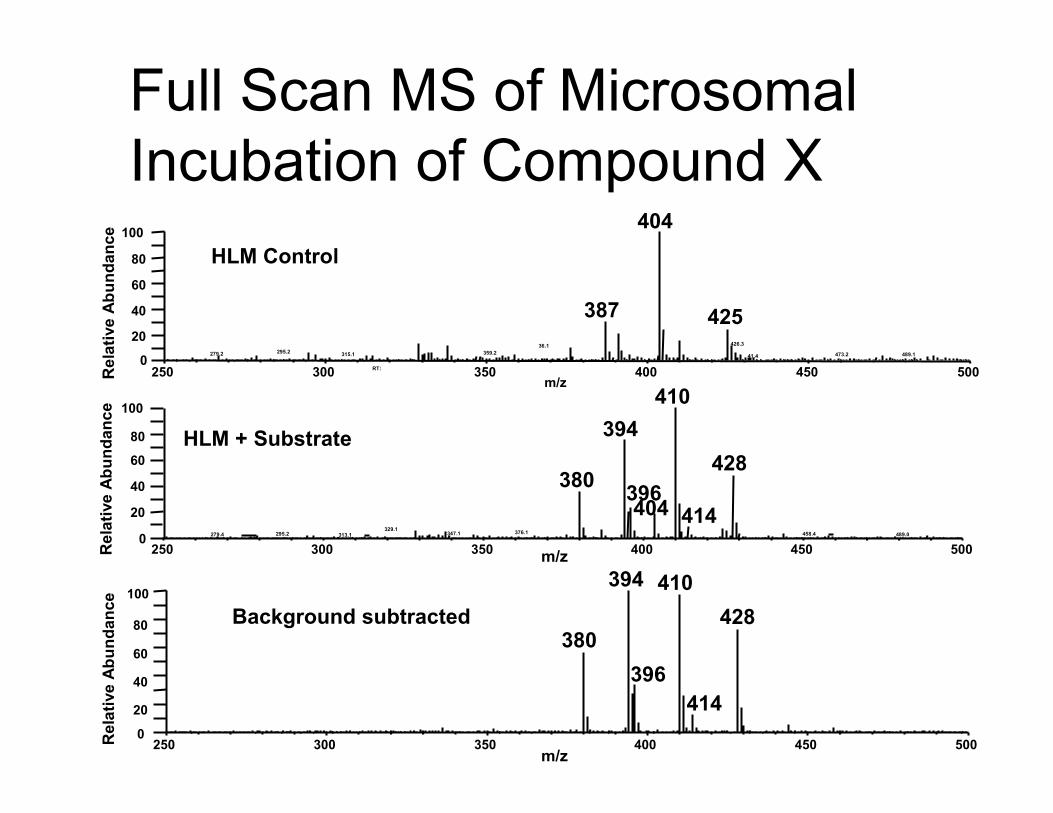
Full Scan MS of MicrosomalIncubation of Compound X
m/z250 300 350 400 450 500
0
20
40
60
80
100
Rel
ativ
e A
bund
ance
404
387 425426.336.1
295.2 359.2279.2 315.1 489.1473.241.4
RT:
HLM Control
250 300 350 400 450 500m/z
0
20
40
60
80
100
Rel
ativ
e A
bund
ance
394 410428
380Background subtracted
396414
250 300 350 400 450 500m/z0
20
40
60
100
Rel
ativ
e A
bund
ance
410394
428380
329.1 376.1347.1295.2 458.4279.4 489.0313.1
HLM + Substrate
396414404
80

Problem Set:Full Scan MS of Metabolites of Compound X (MW 394)Determine possible additions of functionality of metabolites
250 300 350 400 450 500m/z
0
20
40
60
80
100
Rel
ativ
e A
bund
ance
394410
428
380
396
414
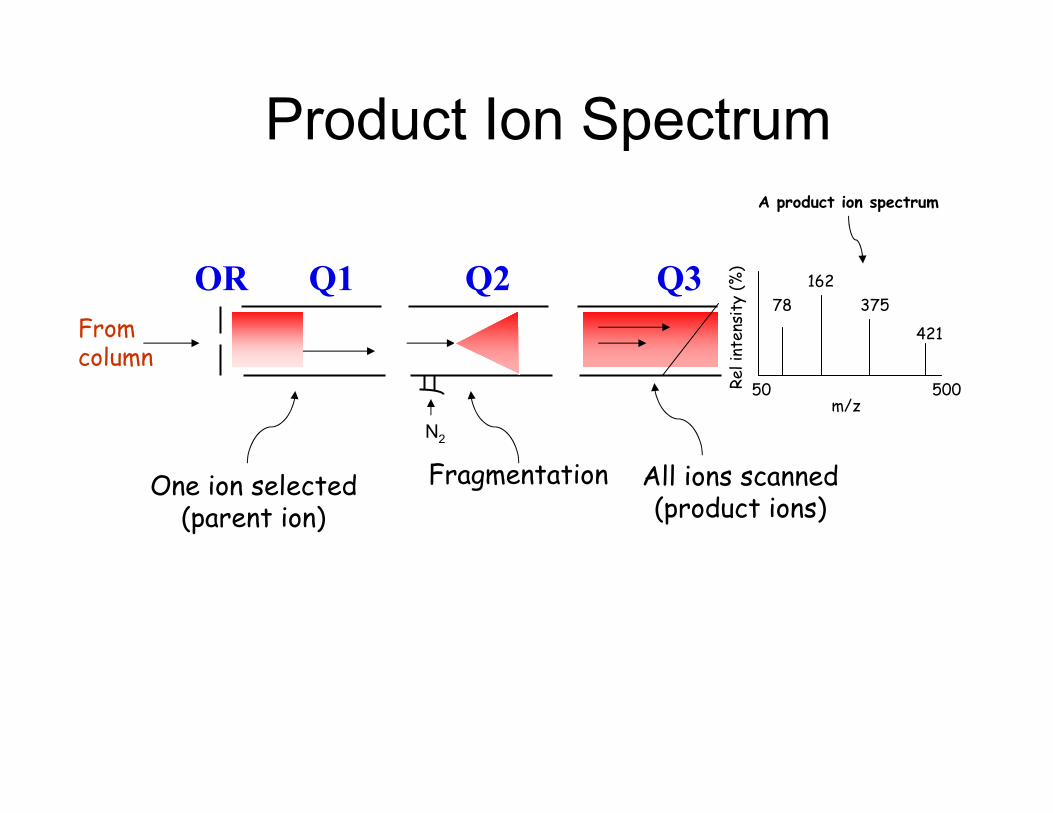
Q1 Q2 Q3ORFromcolumn
Product Ion Spectrum
One ion selected(parent ion)
N2
Fragmentation All ions scanned(product ions)
50 500
421
375162
78
m/z
Reli
nten
sity
(%)
A product ion spectrum

CID Product Ion Spectrum of Compound Y
100 200 300 400m/z
100
75
50
25
0
Rel
ativ
e In
tens
ity (%
)
121
147 167
177
469
N
N O
MH+
177
167
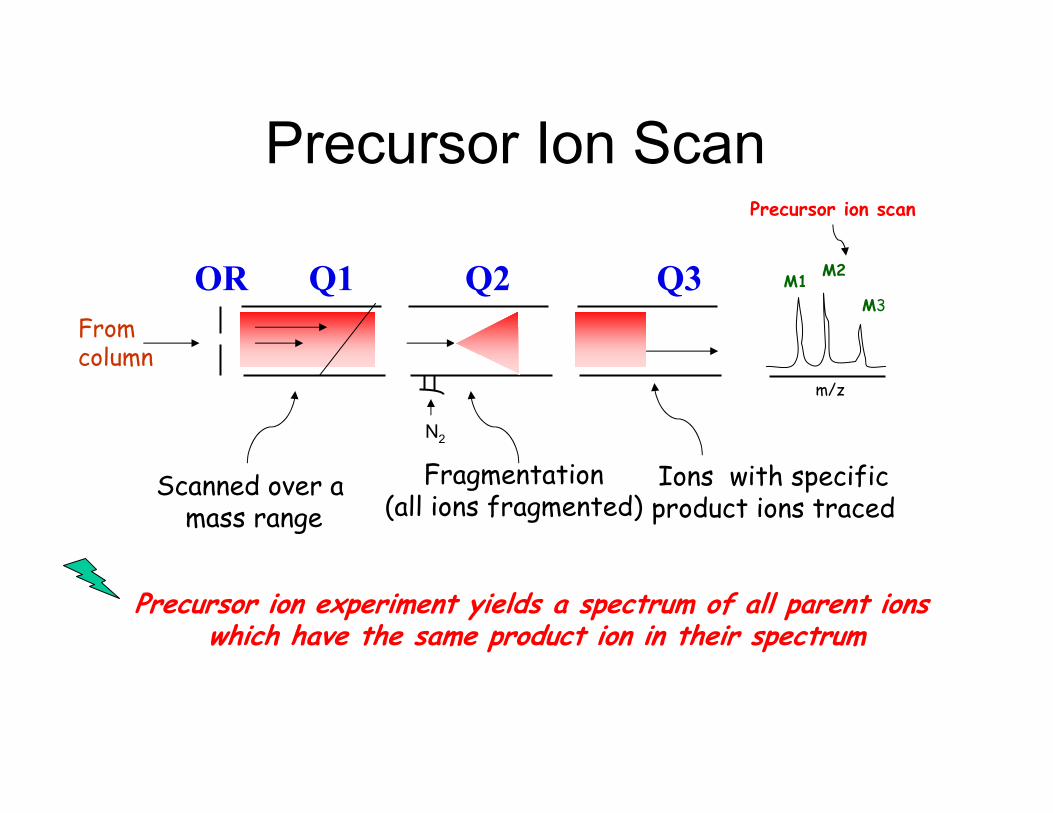
Q1 Q2 Q3ORFromcolumn
Precursor Ion Scan
Scanned over a mass range
N2
Fragmentation(all ions fragmented)
Ions with specificproduct ions traced
M1M2
M3
m/z
Precursor ion scan
Precursor ion experiment yields a spectrum of all parent ions which have the same product ion in their spectrum

Q1 Q2 Q3ORFromcolumn
Neutral Loss Scan
N2
M1M2
M3
m/z
Neutral loss scan
All ions selected Fragmented scanned at the same rate as Q1but with a mass offset
Mass offset corresponds to the mass of neutral fragment loss during fragmentation
Neutral loss experiment yields a spectrum of all parent ions which lose a selected neutral loss fragment

O
N
S
OO
NH2
-81
M+H = 213
132+
81
132
REL
. IN
TEN
SITY
(%)
m/z
213
136
REL
. IN
TEN
SITY
(%)
m/z
213
230
77 149
Full Scan MS
Product ion MS/MS
O
N
S
OO
NH2
MW=212
Interpreting Product Ion MS/MS Spectrum
Identify precursor ion and NL

Systematic Approach for the Identification of Metabolites by LC/MS/MS
1. Get a Q1 (full) scan of the compound in question
2. Obtain a product ion spectrum of the compound: interpret the spectrum
3. Identify major fragment ion and neutral loss4. Run precursor ions and neutral loss scans of
biological samples5. Run product ion scans for all possible
metabolites identified from step 4 plus expected metabolites
6. Interpret the spectra and assign structures of metabolites

Example
N
NH
CH3O
*

CID Product Ion Spectrum of a Parent Drug
100 200 300 400m/z
100
75
50
25
0
Rel
ativ
e In
tens
ity (%
)
121
147 167
177
469
N
N O
177
167
147-OMe
+H
MH+
Identify parent scan ions?

HPLC-RAD and TIC Chromatograms for Biliary Metabolites of CJ-11,972
100
75
50
25
0
Rel
. Int
. (%
)
RAD Chromatogram
Time (min)10.0 20.0 30.0 40.0
100
75
50
25
0
Rel
. Int
. (%
)
Par167 Chromatogram
III III
IV+VVI
VIII
VII
IX
XX! XII
(Parents of m/z 167)

CID Product Ion Spectra of Metabolites 485-A and 485-B
50 100 150 200 250 300 350 400 450 5m/z
100
75
50
25
0
Rel
ativ
e In
tens
ity (%
)
73105
121
133163167
175
193
485
485-ARet. Time 29.9 min
O
OH
N
N
167
73193
163-HCHO
50 100 150 200 250 300 350 400 450 5m/z
100
75
50
25
0
Rel
ativ
e In
tens
ity (%
)
57105119132
147
165
177
183
485
485-BRet. Time 36.6 min
N
N O
OH
183
177
147
-HCHO 57

CID Product Ion Spectra of Metabolites 455-A and 455-B
NN OH
163
293
276-NH3
167
-tert-butyl 106
50 100 150 200 250 300 350 400 450m/z
100
75
50
25
0Rel
ativ
e In
tens
ity (%
)
82
96
106
163
167
181 276
293
455
455-ARet. Time 28.1 min
O
N
N
43163
167
133
121
50 100 150 200 250 300 350 400 450m/z
100
75
50
25
04356
82
96
121133152
163
167
181 455
455-BRet. Time 37.7 min
Rel
ativ
e In
tens
ity (%
) -CH2O
-C3H6

ION TRAP MS

ION TRAP MS
• Sensitivity– Ion accumulation
(10-1000 times better sensitivity than quadrupole MS)• Specificity
– Multistage MS capabilities (MSn)• Speed
– Can complete an entire scan in 100 ms• Data Dependent Acquisition
– Acquire MW information and MSn spectra in the same run
• High value/Cost Ratio
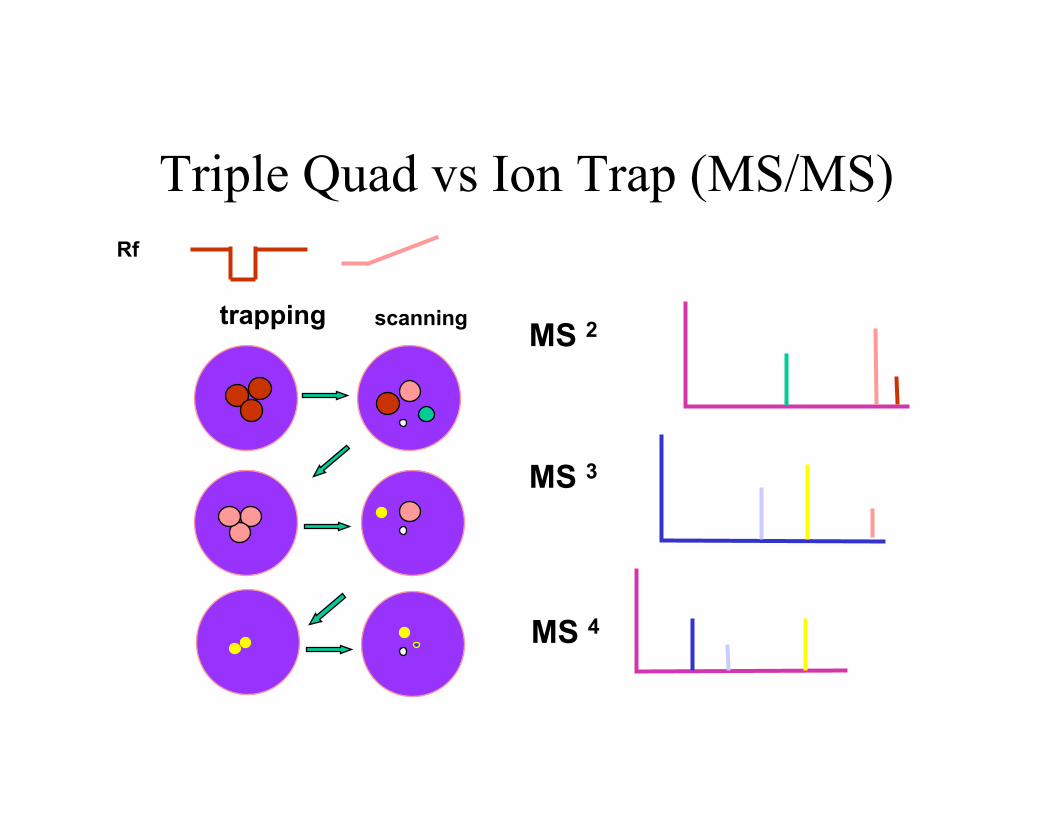
MS 2
MS 3
Rf
trapping scanning
MS 4
Triple Quad vs Ion Trap (MS/MS)


Q-TOF

Why use a Q-TOF ?Sensitivity
- detection of low level metabolites in complex matrices in vivo
Exact mass (high resolution mass measurement)- added confidence in confirming expected
metabolites (confirm elemental composition for metabolites with the same nominal mass)
LC/MS/MS
- confirmation of metabolites (compare MS/MS spectra)
- data dependent MS -- MS/MS (time saving, High throughput)

MS operation : Quadrupole MS transmits – TOF detects all ions transmitted : full scan mass spectrum
MS/MS operation: Precursor ion selection in quadrupole, collision induced dissociation (CID) in hexapole collision cell – product ion detection in TOF: MS/MS spectrum
Operating principle of the Q-TOF mass analyzer

Instrument Capabilities
• High Resolution MS and MSMS– 20,000 resolution – Peak Width of 0.025 at 500 amu
• High Resolution= High Selectivity– Able to easily separate masses that differ in 0.1 amu
easily
• TOF allows fast scan speeds without sacrificing sensitivity or scan ranges in MS or MS/MS modes
• High Resolution MS and MSMS– 20,000 resolution – Peak Width of 0.025 at 500 amu
• High Resolution= High Selectivity– Able to easily separate masses that differ in 0.1 amu
easily
• TOF allows fast scan speeds without sacrificing sensitivity or scan ranges in MS or MS/MS modes

Mass
Element Nominal Mass Exact Mass
C 12 12.0000H 1 1.0078O 16 15.9949
N 14 14.0031
Average Mass
12.0111.0079715.9994
14.003
Cl 35 34.968935.45
S 32 31.97232.06
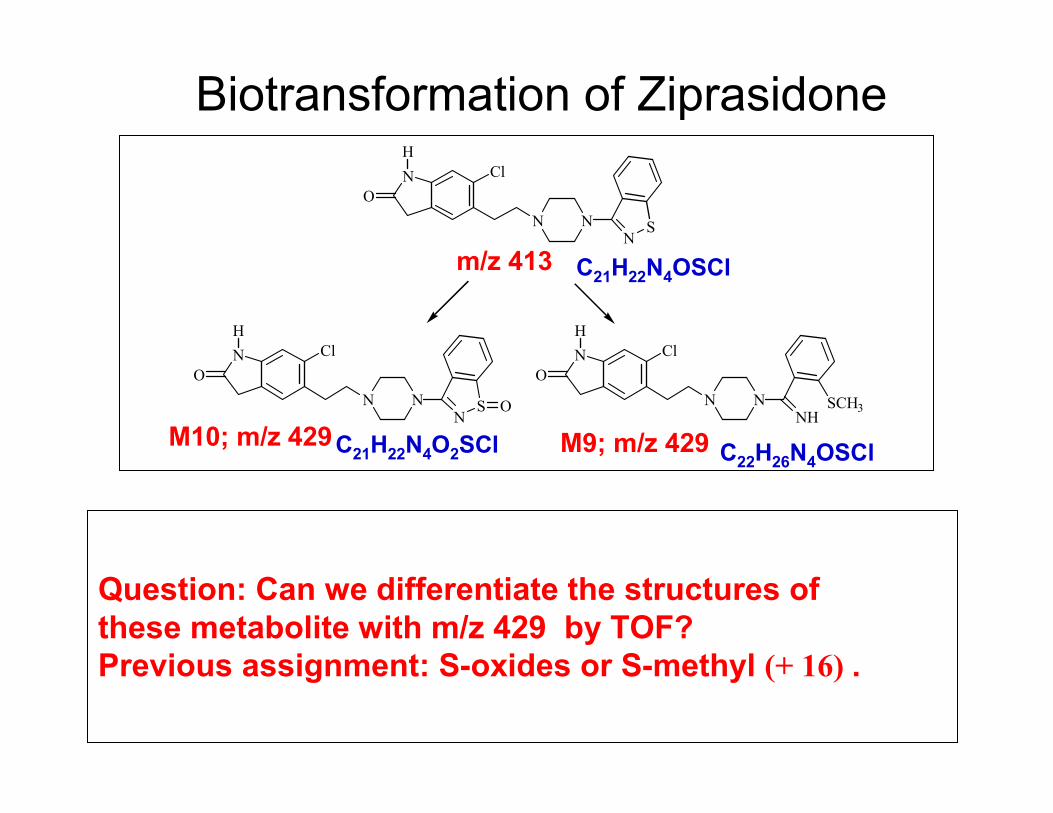
Biotransformation of Ziprasidone
Question: Can we differentiate the structures of these metabolite with m/z 429 by TOF?Previous assignment: S-oxides or S-methyl (+ 16) .
m/z 413
M10; m/z 429 M9; m/z 429C21H22N4O2SCl C22H26N4OSCl
NO
HCl
N NN
S
NO
HCl
N NN
S
NO
HCl
N NNH
O SCH3
C21H22N4OSCl

425 426 427 428 429 430 431 432 433 434 m/z0
100 429.1520
431.1516430.1529
432.1510
M9
425 426 427 428 429 430 431 432 433 434 m/z0
100 429.1151
431.1140430.1193
432.1145
M10
27.50 28.00 28.50 29.00 29.50 30.00 30.50 31.00 Time0
100M9 M10
Selected Ion Chromatogram and Full ScanMS of M9 and M10
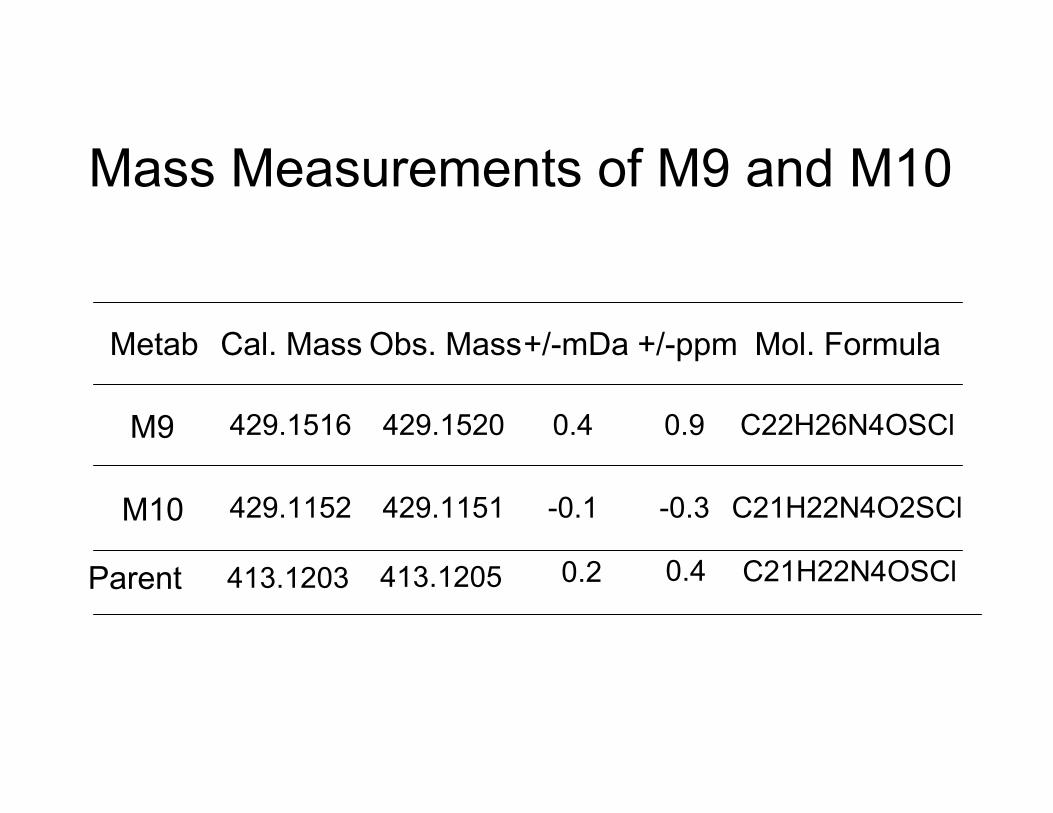
Mass Measurements of M9 and M10
Metab Cal. Mass Obs. Mass+/-mDa +/-ppm Mol. Formula
M9 429.1516 429.1520 0.4 0.9 C22H26N4OSCl
M10 429.1152 429.1151 -0.1 -0.3 C21H22N4O2SCl
Parent 413.1203 413.1205 0.2 0.4 C21H22N4OSCl

N OH N OH
O
N
N
Two Isobaric metabolites of Compound X
R2
BA

• Mass corrected and centroid• Exact mass: 242.0793• ∆ -1.0 mda; ppm error= -3.9 • Formula= C12H11NOF3
TOF MS Spectrum of Structure ATOF MS Spectrum of Structure A
241 242 243 244 245 246 247 248 249 250 251 252 253 254 255 256 257 258 259m/z0
100
%
242.0783
243.0818249.1486
Mass corrected and centroidExact mass: 242.0793∆ -1.0 mda; ppm error= -3.9 Formula= C12H11NOF3
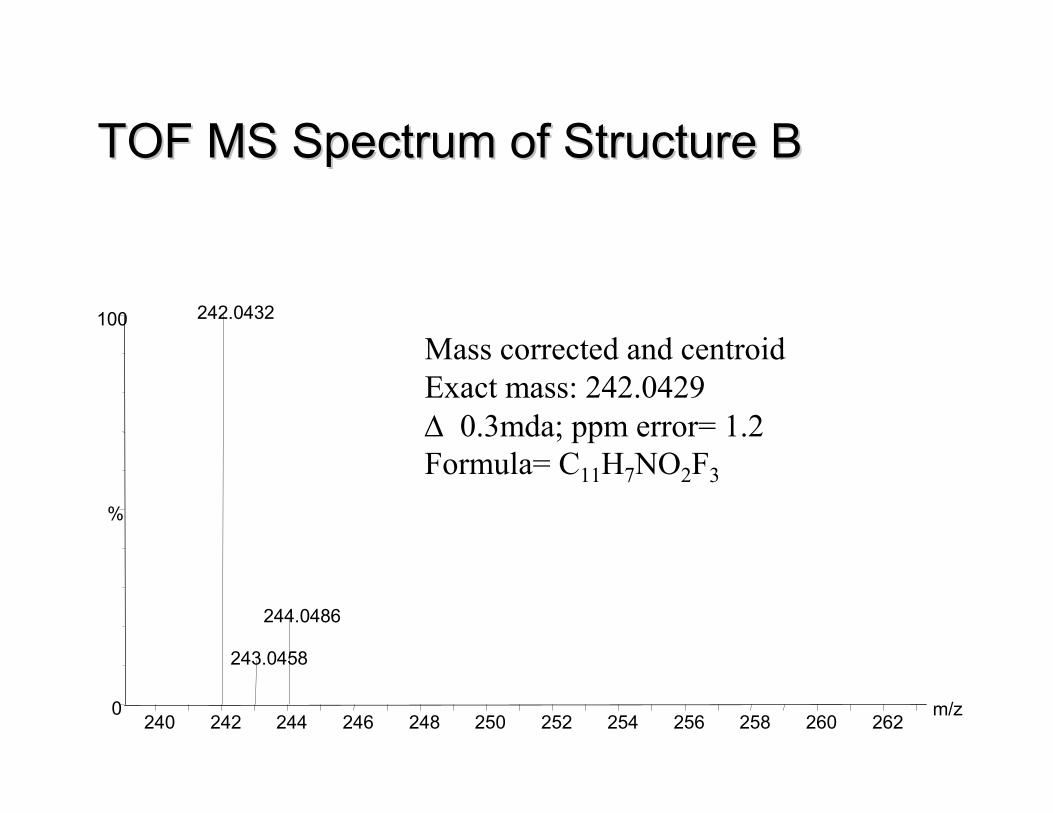
• Mass corrected and centroid• Exact mass: 242.0429• ∆ 0.3mda; ppm error= 1.2 • Formula= C11H7NO2F3
TOF MS Spectrum of Structure BTOF MS Spectrum of Structure B
240 242 244 246 248 250 252 254 256 258 260 262m/z0
100
%
242.0432
244.0486
243.0458
Mass corrected and centroidExact mass: 242.0429∆ 0.3mda; ppm error= 1.2 Formula= C11H7NO2F3

Identification of Drug MetabolitesLC-NMR

• LC-NMR (Continuous flow or stopped flow)• Fast• Reportedly sensitive (50 - 200 ng)• Amenable to automation• Negate the need for isolation• Sample Stability• Cleaner Spectra
ADVANTAGES

Disadvantages and Limitation of LC-NMR
• Sensitivity– Nearly eliminates quantitative application
• The Chromatograph• Solvent Suppression• Expensive deuterated mobile phase and
buffers• Shimming problems introduced by LC-
gradient methods

What information does NMR provide• Each proton (or carbon atom) in a molecule
typically has a different resonant frequency (chemical shift)– Thus, NMR spectrum is a fingerprint of a molecule– Chemical shifts are governed by nuclear environment,
e.g. CH3O, CH3CN, CH3 NH2
• Adjacent NMR-active nuclei (1-4 bonds apart) in a molecule may couple to one another– Coupling constants can be identified by inspection of 1D
spectra

Activation of Acetaminophen by Cytochrome P450 to N-acetyl-p-benzoquinonimine (NAPQI) and subsequent conjugation with Glutathione
N
O
O
CH3 HN
O
O
CH3 HN
OH
O
CH3
N
O
O
CH3 N
OH
O
CH3 HN
OH
O
CH3
H
SG
H
SG
SG
SG
GSH
NAPQI
GSH
NAPQI
H+
H+
H+
3' ADDUCT
2' ADDUCT
H+
NH
CH3
O
OH
P450

Proposed Reaction Product of N-acetyl-p benzoquinone imine(NAPQI) with Glutathione
N
O
O
CH3
GSH
ONAPQI
H+
GSHN
O
CH3
IPSO ADDUCT

CID Product Ion Mass Spectra of Reaction Mixture

1H NMR Data Obtained on The Reaction Mixture

Characterization of Metabolites of Compound X
R1NOR
CH 3
C H 3
C H 3

HPLC Radiochromatograms of Compound X Metabolites
0 2 4 6 8 10 12 14 16 18 20 22 24
Time (min)
0.0
0.2
0.4
0.6
Inte
nsity
ParentM22
M23
M3/M4
M24
M26

CID Product Ion Spectrum of compound X
MH+
100
0
50
75
25
100 200 300 400 480
165
326147
469192 335270 41357 367 423
m/z
NOR
147
165
326
MH+=469
R1

9 8 7 6 5 4 3 2 1 ppm
6.87.07.27.47.67.88.08.28.48.68.8 ppm
Proton double presat 278K d1=10sec CP-533,536 LC peak at 57.41 minutes (m/z=471) injection # 636
<--- HOD
ACN-d3
Expansion of Aromatic Region
1H NMR of Compound X
N
11
12
1516
1819
20
22
2324
26
27
28
O
3 Methylgroups
-OCH2
-NCH2
R
R1

CID mass and NMR spectra of M4
100 200 300 400 500m/z
0
100165
145
467324
192
335
342
421485
NO
OH
-H2O
-H2O
145
165
324342
MH+
MH+=485MD+=488
12345678 pp
<---HOD
ACN-d3
Proton double presat 283K CP-533,536 metabolite LC peak at 18.27 minutes (m/z=488) injection 605
-CH2OH
2 Methylgroups
-NCH2-OCH2
RR1
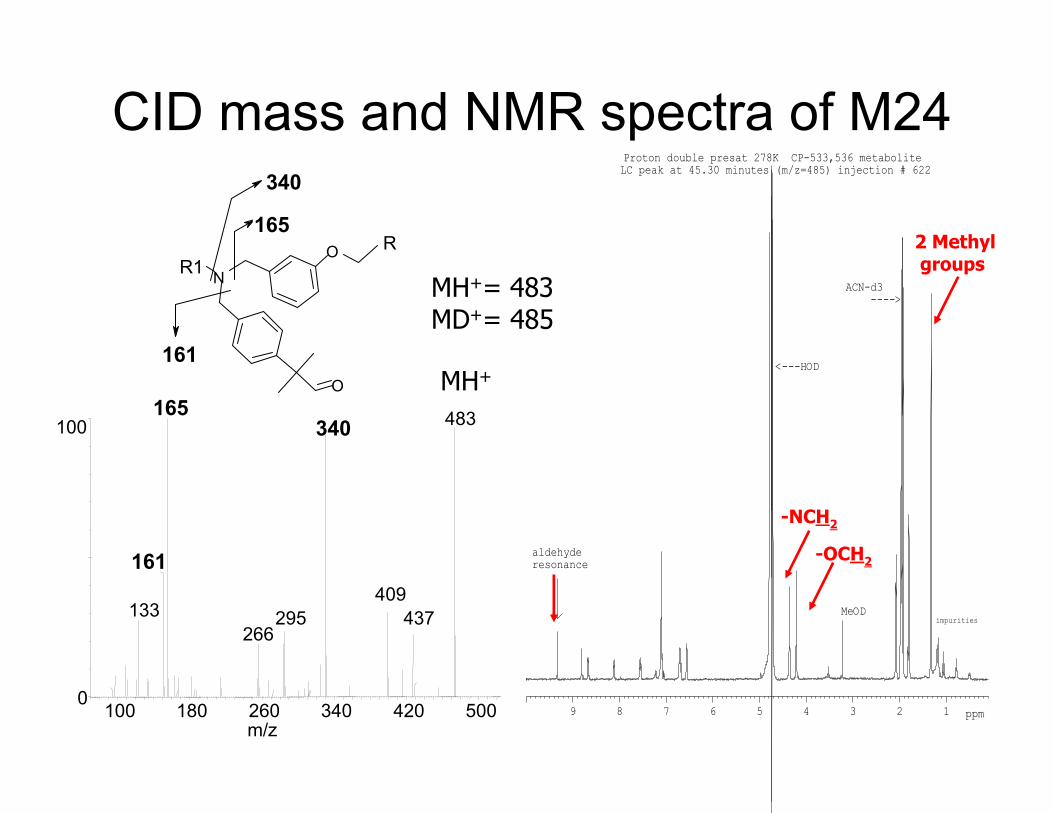
100 180 260 340 420 500m/z
0
100165
161
133
483340
295266
409437
NO
O
161
165
340
MH+
CID mass and NMR spectra of M24
123456789 ppm
<---HOD
ACN-d3� ---->
MeODimpurities
Proton double presat 278K CP-533,536 metabolite LC peak at 45.30 minutes (m/z=485) injection # 622
aldehyderesonance
2 Methylgroups
-NCH2
-OCH2
MH+= 483MD+= 485
RR1

Conclusions
• Combination of LC/MS/MS with other analytical approaches is a powerful tool for solving difficult problems encountered in the analysis of drug metabolites.

SOME REFERENCES
• Biochemistry of reactions by Bernard Testa.• Biotransformation of Xenobiotics - Andrew Parkinson
- in Casarett and Doull’s Toxicology, 5th edition.• Drug Biotransformations - Neal Castagnoli - in
Burgers medicinal chemistry 4th edition.• Drug Metabolism -Bernard Testa- in Burgers
Medicinal Chemistry, 5th edition.• Metabolism of Heterocycles by L. A. Damani in
Comprehensive Heterocyclic Chemistry

Questions?