dr. dustin boler - pork quality - high quality pork increases positive consumer eating experiences
TRANSCRIPT

D.D. Boler, A.C. Dilger & E.K. ArkfeldUniversity of Illinois
S.D. Shackelford, D.A. King & T.L. WheelerUSDA-MARC
Consistent, high quality pork will increase positive eating experiences for consumers
Correlating pork quality from the ham, loin, and belly
NPB 14-221

Objectives
• Correlate fresh loin quality with fresh ham quality, processed ham quality, and fresh belly characteristics
• Characterize variation in loin, ham, and belly of pigs selected for – High growth potential / adequate meat quality– High meat quality / adequate growth potential
• Evaluate effects of seasonality on variation in loin, ham, and belly quality

Winter Marketing Program
Barn A (Lean) Barn B (Quality) Barn C (Lean) Barn D (Quality)
February 10 Cut 1 Cut 1 -- --
February 23 Cut 2 Cut 2 Cut 1 Cut 1
March 9 Cut 3 Cut 3 Cut 2 Cut 2
March 23 -- -- Cut 3 Cut 3
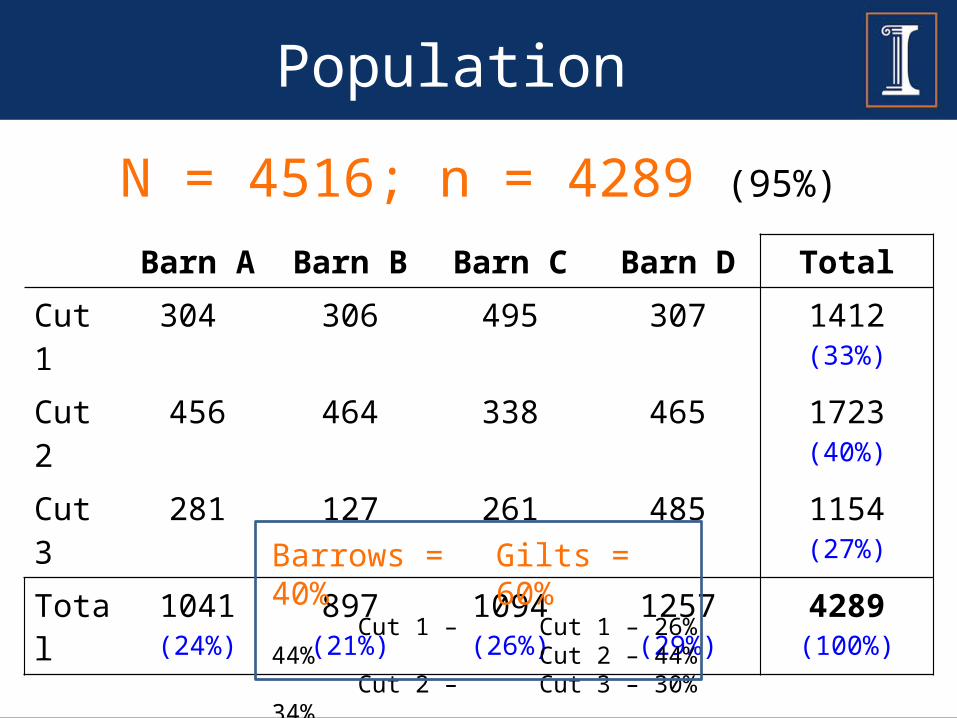
Population
Barn A Barn B Barn C Barn D TotalCut 1 304 306 495 307 1412 (33%)
Cut 2 456 464 338 465 1723 (40%)
Cut 3 281 127 261 485 1154 (27%)
Total 1041 (24%) 897 (21%) 1094 (26%) 1257 (29%) 4289 (100%)
N = 4516; n = 4289 (95%)
Gilts = 60% Cut 1 – 26% Cut 2 – 44% Cut 3 – 30%
Barrows = 40% Cut 1 – 44% Cut 2 – 34% Cut 3 – 22%
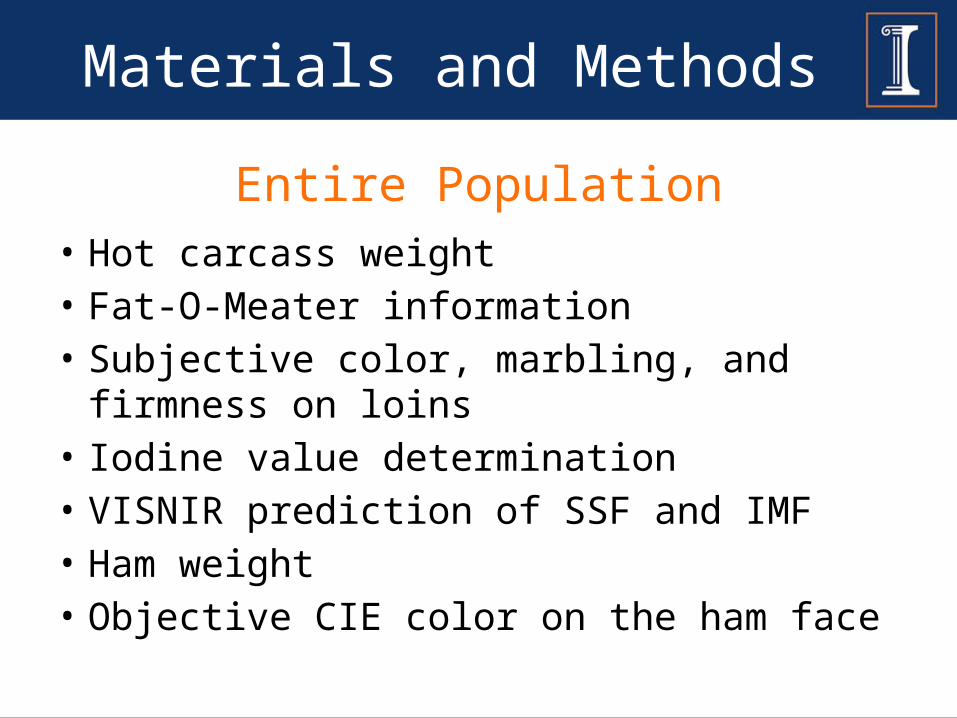
Materials and Methods
• Hot carcass weight• Fat-O-Meater information• Subjective color, marbling, and firmness on loins• Iodine value determination• VISNIR prediction of SSF and IMF• Ham weight• Objective CIE color on the ham face
Entire Population
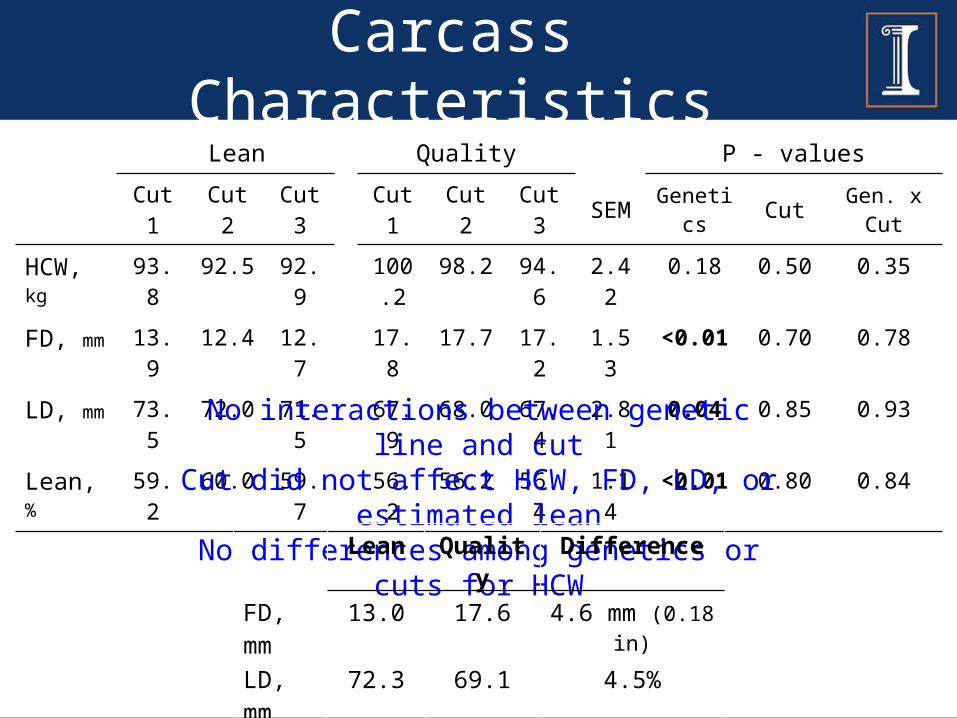
Carcass CharacteristicsLean Quality P - values
Cut 1 Cut 2 Cut 3 Cut 1 Cut 2 Cut 3 SEM Genetics Cut Gen. x Cut
HCW, kg 93.8 92.5 92.9 100.2 98.2 94.6 2.42 0.18 0.50 0.35
FD, mm 13.9 12.4 12.7 17.8 17.7 17.2 1.53 <0.01 0.70 0.78
LD, mm 73.5 72.0 71.5 67.9 68.0 67.4 2.81 0.04 0.85 0.93
Lean, % 59.2 60.0 59.7 56.2 56.2 56.4 1.14 <0.01 0.80 0.84
No interactions between genetic line and cutCut did not affect HCW, FD, LD, or estimated leanNo differences among genetics or cuts for HCW
Lean Quality Difference
FD, mm 13.0 17.6 4.6 mm (0.18 in)
LD, mm 72.3 69.1 4.5%
Lean, % 59.6 56.3 3.3 perc. unit
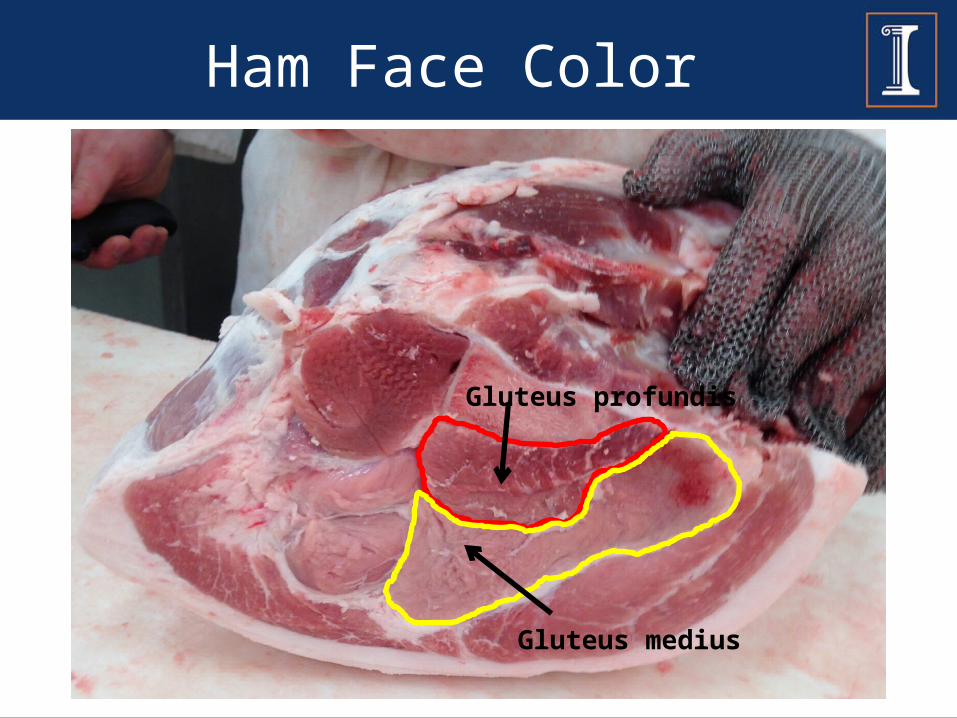
Ham Face Color
Gluteus profundis
Gluteus medius

Correlations (r) of Carcass Characteristics with Ham Quality
HCW BF LD LeanHam wt 0.86 0.29 0.23 -0.18Gluteus medius
L* -0.03 -0.15 0.07 0.15a* 0.02 0.05 0.04 -0.03
b* 0.07 0.08 -0.03 -0.08Gluteus profundis
L* -0.11 -0.17 0.01 0.15a* 0.09 0.09 0.03 -0.07b* 0.03 0.03 -0.03 -0.04
Bold indicates P < 0.05
Correlations with HCW, BF, LD, and lean were significant but weak

Strong relationship (r = 0.86)
100 120 140 160 180 200 220 240 260 280 30010
15
20
25
30
35
40
Weak relationship (r = 0.01)
10 20 30 40 50 60 70 80 90 10020
25
30
35
40
45
50
55
60
65
70
CorrelationsH
am w
t
HCW Loin depth
Glu
teus
pro
fund
is L
*

Materials and Methods
• 30 min loin pH• Temperature decline (LD & SM)• Loin ultimate pH (~50% of the population)
• Loin purge loss• Fresh belly dimensions (~50% of the population)
• Fatty acid profiles• Ham processing characteristics
Selected 10% of the Population
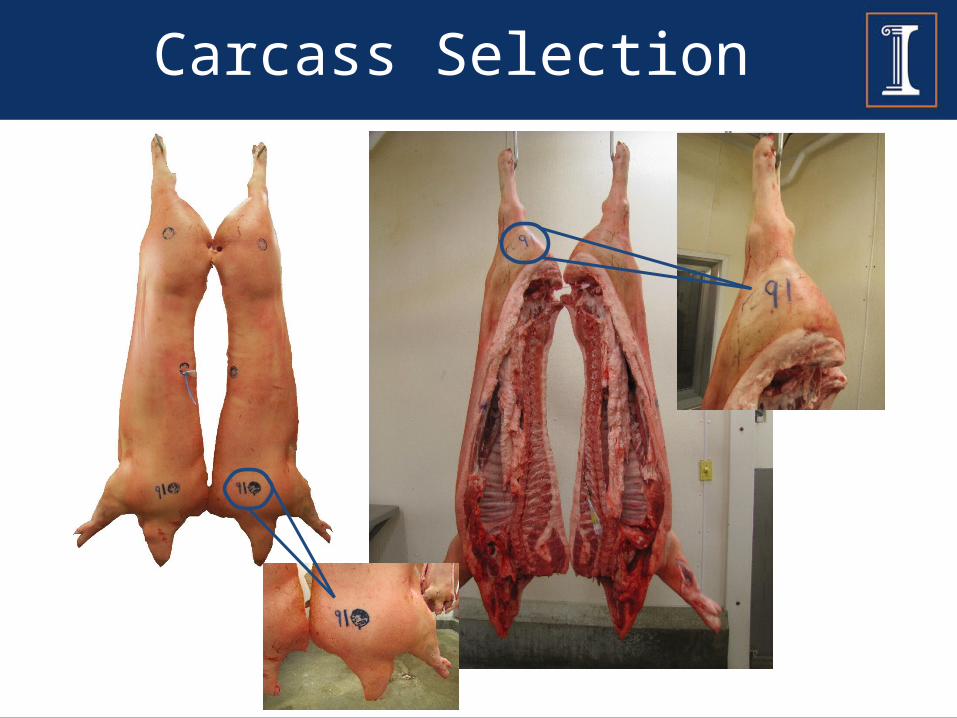
Carcass Selection

Subpopulation
Barn A Barn B Barn C Barn D TotalCut 1 34 32 56 34 156 (34%)
Cut 2 46 50 35 47 178 (39%)
Cut 3 30 15 27 54 126 (27%)
Total 110 (24%) 97 (21%) 118 (26%) 135 (29%) 460 (100%)
N = 460 (10.7%)
Barrows = 43%, Gilts = 57%
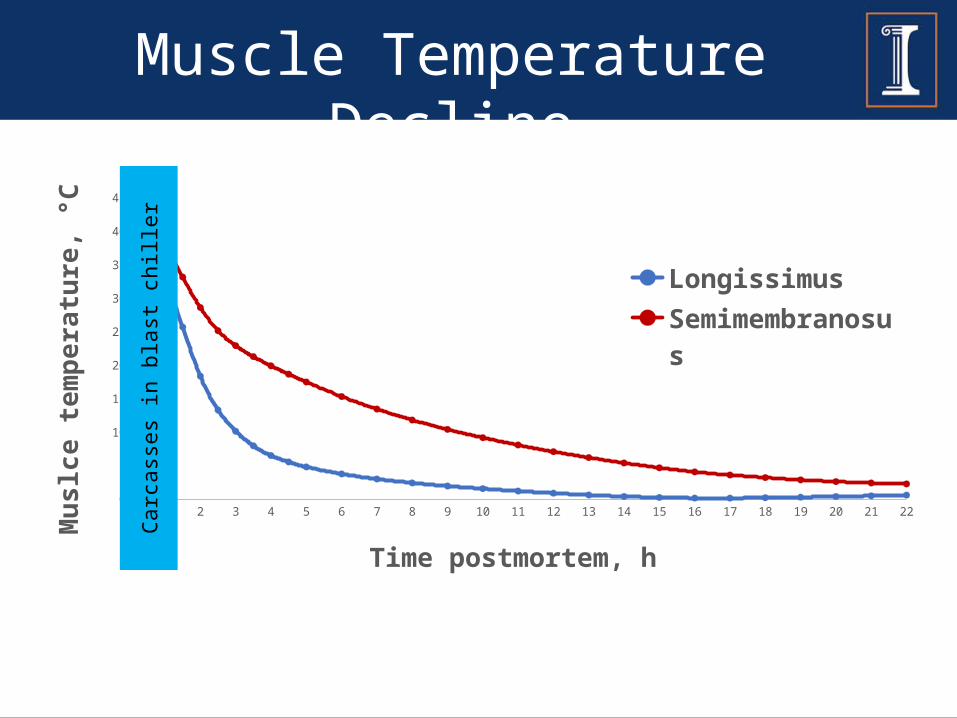
Muscle Temperature Decline
0 1 2 3 4 5 6 7 8 9 10 11 12 13 14 15 16 17 18 19 20 21 220
5
10
15
20
25
30
35
40
45
Longissimus
Semimembranosus
Time postmortem, h
Mu
slce
tem
per
atu
re, °
C
Carc
ass
es
in b
last
chill
er
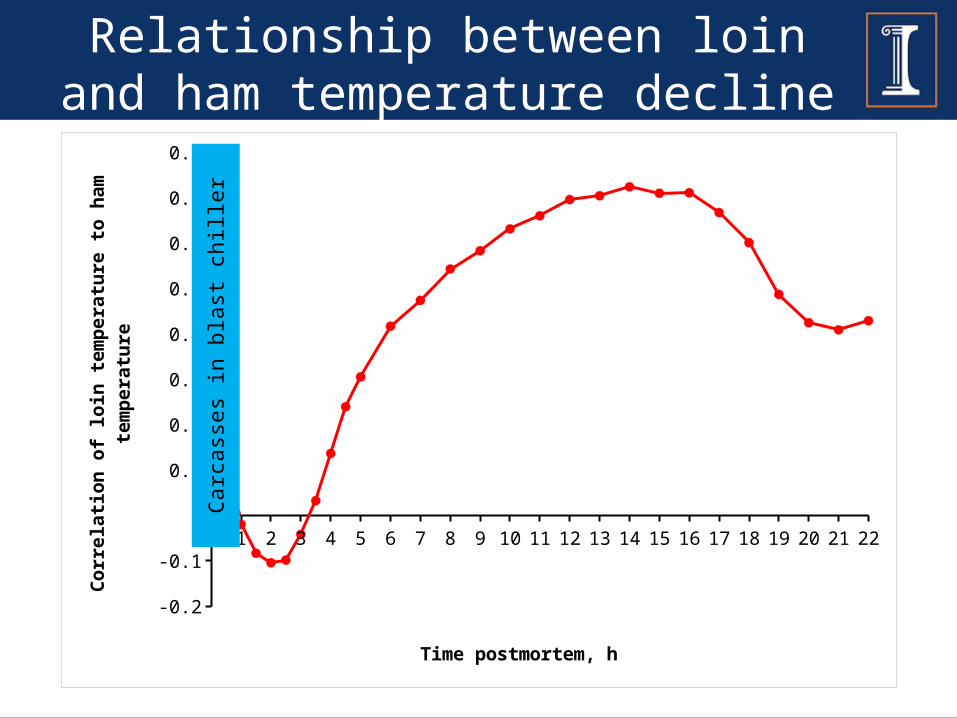
Relationship between loin and ham temperature decline
0 1 2 3 4 5 6 7 8 9 10 11 12 13 14 15 16 17 18 19 20 21 22
-0.2
-0.1
0
0.1
0.2
0.3
0.4
0.5
0.6
0.7
0.8
Time postmortem, h
Co
rre
lati
on
of
loin
te
mp
era
ture
to
ha
m
tem
pe
ratu
re
Carc
ass
es
in b
last
chill
er
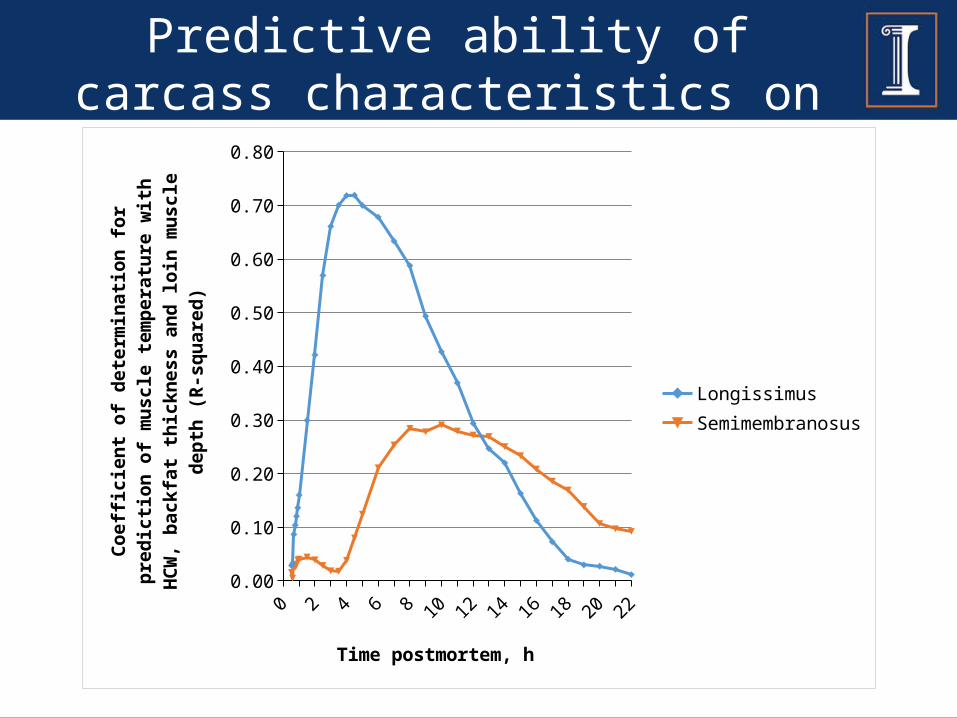
Predictive ability of carcass characteristics on temperature decline
0 2 4 6 8 10 12 14 16 18 20 220.00
0.10
0.20
0.30
0.40
0.50
0.60
0.70
0.80
LongissimusSemimembranosus
Time postmortem, h
Co
effi
cie
nt
of
de
term
ina
tio
n f
or
pre
dic
-ti
on
of
mu
scle
te
mp
era
ture
wit
h H
CW
, b
ack
fat
thic
kn
ess a
nd
lo
in m
uscle
de
pth
(R
-sq
ua
red
)
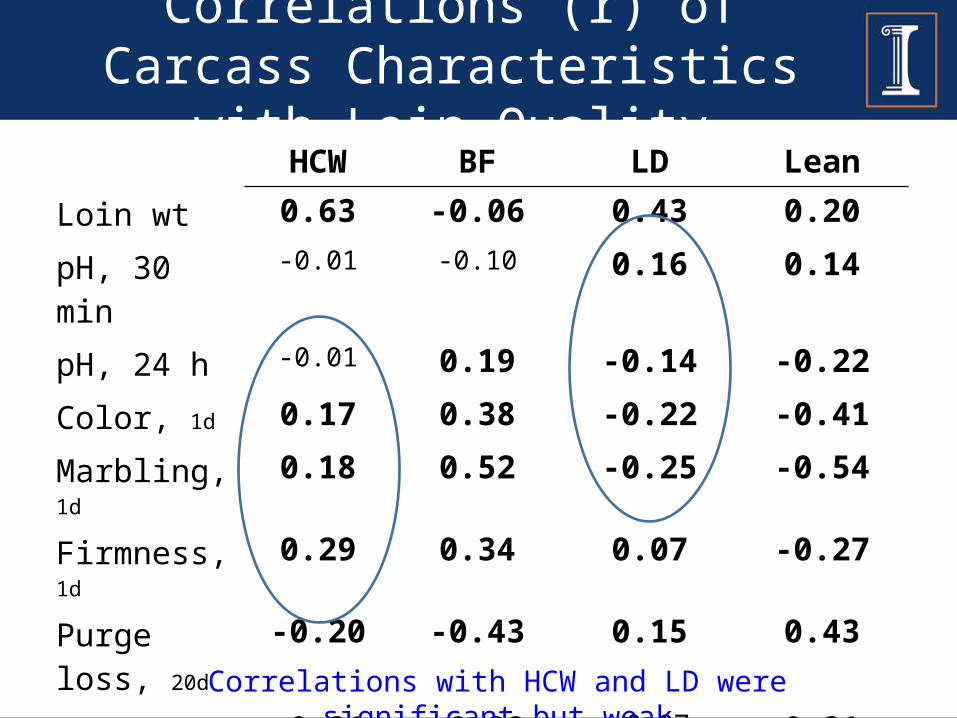
Correlations (r) of Carcass Characteristics with Loin Quality
HCW BF LD LeanLoin wt 0.63 -0.06 0.43 0.20pH, 30 min -0.01 -0.10 0.16 0.14pH, 24 h -0.01 0.19 -0.14 -0.22Color, 1d 0.17 0.38 -0.22 -0.41Marbling, 1d 0.18 0.52 -0.25 -0.54Firmness, 1d 0.29 0.34 0.07 -0.27Purge loss, 20d -0.20 -0.43 0.15 0.43Cook loss, 20d -0.31 -0.38 -0.07 0.31SSF, 20d -0.28 -0.48 0.01 0.42Bold indicates P < 0.05
Correlations with HCW and LD were significant but weak

Correlations (r) of Carcass Characteristics with Loin Quality
HCW BF LD LeanLoin wt 0.63 -0.06 0.43 0.20pH, 30 min -0.01 -0.10 0.16 0.14pH, 24 h -0.01 0.19 -0.14 -0.22Color, 1d 0.17 0.38 -0.22 -0.41Marbling, 1d 0.18 0.52 -0.25 -0.54Firmness, 1d 0.29 0.34 0.07 -0.27Purge loss, 20d -0.20 -0.43 0.15 0.43Cook loss, 20d -0.31 -0.38 -0.07 0.31SSF, 20d -0.28 -0.48 0.01 0.42Bold indicates P < 0.05
As BF increased marbling increased, purge loss decreased, and loins became more tender
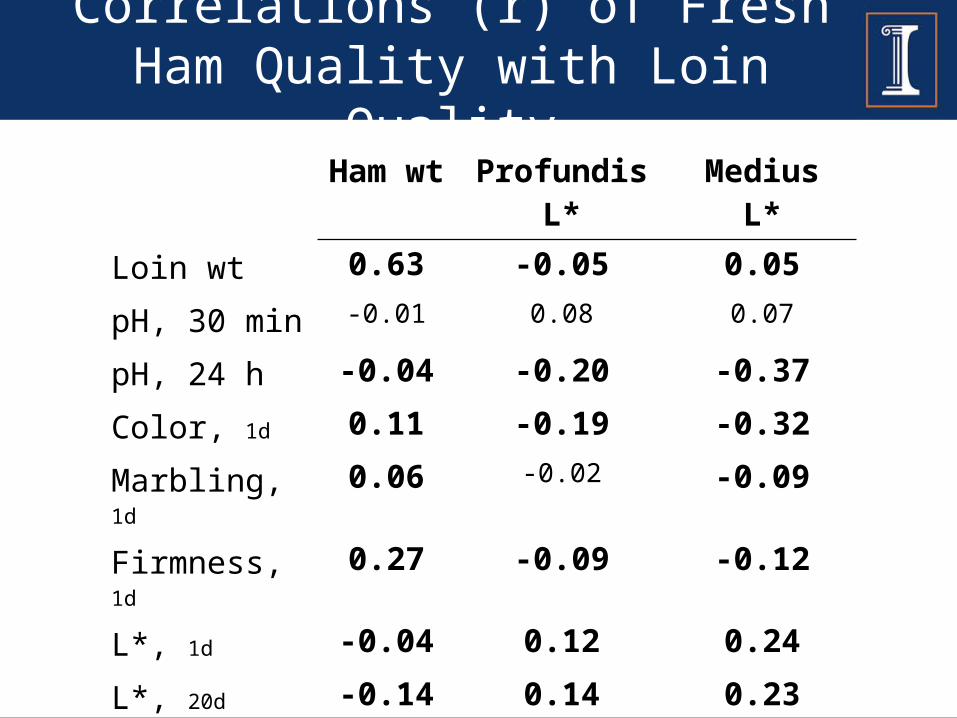
Correlations (r) of Fresh Ham Quality with Loin Quality
Ham wt Profundis L* Medius L*Loin wt 0.63 -0.05 0.05pH, 30 min -0.01 0.08 0.07
pH, 24 h -0.04 -0.20 -0.37Color, 1d 0.11 -0.19 -0.32Marbling, 1d 0.06 -0.02 -0.09Firmness, 1d 0.27 -0.09 -0.12L*, 1d -0.04 0.12 0.24L*, 20d -0.14 0.14 0.23SSF, 20d -0.16 0.11 0.13Bold indicates P < 0.05

Fresh loin color (r = 0.24)
25 30 35 40 45 50 55 60 65 7010
20
30
40
50
60
70
Aged loin color (r = 0.23)
25 30 35 40 45 50 55 6020
25
30
35
40
45
50
55
60
65
70
Ham and Loin ColorLo
in L
*, 1
d
Gluteus medius L* Gluteus medius L*
Loin
L*,
20d

Correlations (r) of Fresh Ham Quality with Belly Quality
Ham wt Profundis L* Medius L*Belly wt 0.61 -0.07 0.00
Length 0.33 -0.11 -0.13Width 0.35 0.13 0.22Thickness 0.35 -0.05 -0.01
Flop score 0.29 -0.09 -0.06Bold indicates P < 0.05
As hams became heavier, bellies became longer, wider, thicker, and firmer

Ham wt & Thickness(r = 0.35)
0.00 0.25 0.50 0.75 1.00 1.25 1.50 1.75 2.0010
15
20
25
30
35
40
Ham wt & Flop (r = 0.29)
0.0 1.0 2.0 3.0 4.0 5.0 6.010
15
20
25
30
35
40
Ham and BellyH
am w
t
Belly thickness
Ham
wt
Belly flop
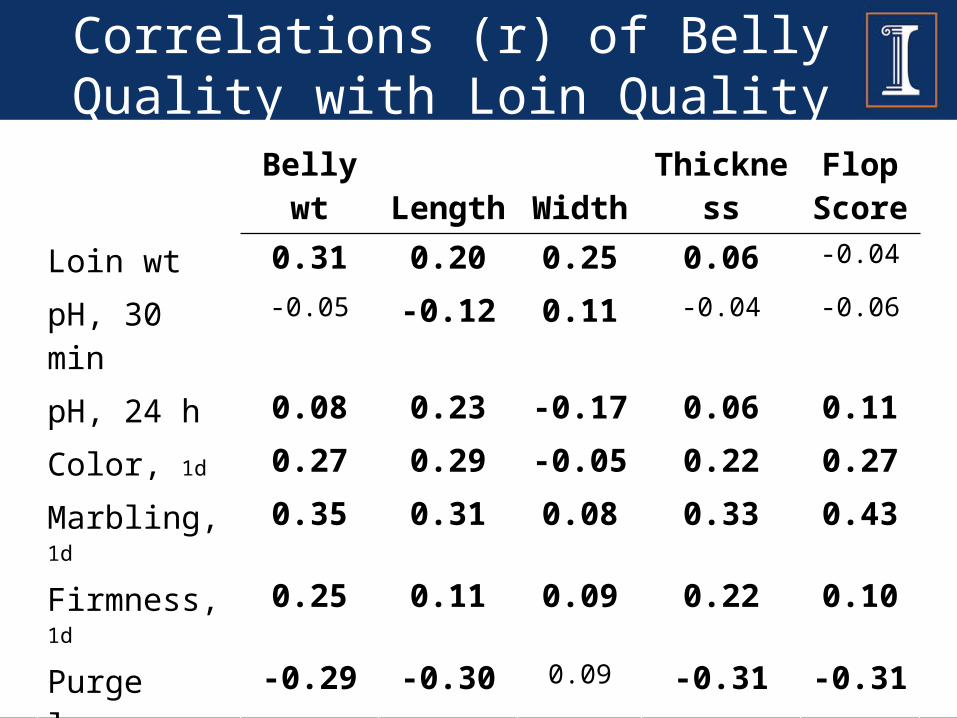
Correlations (r) of Belly Quality with Loin Quality
Belly wt Length Width ThicknessFlop
ScoreLoin wt 0.31 0.20 0.25 0.06 -0.04
pH, 30 min -0.05 -0.12 0.11 -0.04 -0.06
pH, 24 h 0.08 0.23 -0.17 0.06 0.11Color, 1d 0.27 0.29 -0.05 0.22 0.27Marbling, 1d 0.35 0.31 0.08 0.33 0.43Firmness, 1d 0.25 0.11 0.09 0.22 0.10Purge loss, 20d -0.29 -0.30 0.09 -0.31 -0.31Cook loss, 20d -0.33 -0.20 -0.03 -0.31 -0.26SSF, 20d -0.36 -0.26 -0.04 -0.42 -0.43Bold indicates P < 0.05

Summary
• For pigs raised during the cold season:– Cut did not affect carcass characteristics– No interactions with cut and genetics for carcass
characteristics– Primal weights were positively correlated with
each other– Ham and loin color were only moderately related– As hams became heavier bellies became thicker
and firmer
