dr. heinrich hiesinger, ceo guido kerkhoff, cfo · (mx ex vdm/ast) • 1. st. positive net ......
TRANSCRIPT

Developing the future.
Charts on Financial Year 2013/14 November 20, 2014
Dr. Heinrich Hiesinger, CEO Guido Kerkhoff, CFO

Charts on Financial Year 2013/14 November 20, 2014
1 Developing the future.
Targets achieved and further performance upside in FY 2014/15
Strategic Way Forward (SWF) – Progress in Profit and Cash
€1.3 bn
2013/14
EBIT adj.
€(254) m
2013/14
FCF before divest
€195 m
2013/14
Net Income/ Loss*
* Full Group
12/13 13/14 14/15E
~0.6
~0.85
>1.0
∑~2.5
EBIT adj. > doubled Cash loss further reduced Positive Net Income (€bn)
** proposal to AGM
SWF
Dividend of €0.11/share** marks milestone in transformation journey
Order Backlog
Growth / Markets

Charts on Financial Year 2013/14 November 20, 2014
2 Developing the future.
** Full Group
Financial Highlights FY 2013/14
Order Intake
€41.4 bn
EBIT adj.
€1,333 m
• Capital Goods: FY +7% (+10%*) • Materials: FY +7% (+4%*)
Net Income**
€195 m
NFD
€3.5 bn
• yoy more than doubled • Improvements yoy by all Business Areas (MX ex VDM/AST)
• 1st positive Net Income in 3 years • EPS: €0.38 (attributable to ThyssenKrupp AG’s stockholders)
• FCF again significantly positive; yoy improvements in FCF before divest • BCF positive at almost all BAs (except MX and AM)
• NFD yoy down by >€1.5 bn • Gearing 109% down by 92%-pts
* adjusted for F/X and portfolio changes
Order Backlog
€23.9 bn
• +5% yoy • New record of Elevator Technology (€4.1 bn) • High level of Industrial Solutions (~€14.0 bn)
Dividend***
€0.11/share • Marks milestone in transformation
*** proposal to AGM

Charts on Financial Year 2013/14 November 20, 2014
3 Developing the future.
Germany
Declining GDP Forecasts – Mainly in Europe – Since Mid 2014 Expectations for GDP Growth YoY (%)
2014 2015
Eurozone
USA
Brazil
India
China
World
1.8 1.4 -0.4 1.8 1.4 -0.4
Low visibility – “driving by sight”
June November ∆%p June November ∆%p
1.2 0.8 -0.4 1.6 1.2 -0.4
2.2 2.2 +/-0 3.1 2.7 -0.4
1.5 0.3 -1.2 2.5 1.1 -1.4
5.4 5.5 0.1 6.2 6.2 +/-0
7.5 7.4 -0.1 7.4 7.2 -0.2
3.1 3.0 -0.1 3.5 3.4 -0.1
Sources: IHS; internal forecasts

Charts on Financial Year 2013/14 November 20, 2014
4 Developing the future.
Higher sales with slightly increased earnings by ramp-up new plants and efficiency/restructuring
CT
Higher sales with increased earnings & margin improvement by 0.5-0.7%-pts from efficiency/restructuring
ET
Higher sales with slightly increased earnings and stable margin at 6-7%**
IS
MX
Significant increase in earnings by BiC Reloaded: differentiation & efficiency
SE
Significant improvement towards EBIT break-even driven by continued ramp-up
AM
Slight cost increase due to IT projects and efficiency programs
Corp.
** excl. notional interest credit from net prepayment surplus Net Income/ Loss (Full Group)
12/13 14/15E
€195 m
13/14
EBIT adj.
12/13 14/15E
€1.3 bn
13/14
FCF before divest
12/13 14/15E
€(254) m
13/14
* adjusted for F/X and portfolio changes
Slightly increased earnings by efficiency/ restructuring and marketing initiatives
FY 2014/15E: EBIT adj. at least €1.5 bn, Sales Growing at 1-Digit % Rate*
12/13 13/14 14/15E
~0.6
~0.85
>1.0
∑~2.5
(€bn)
14/15E ?
Order Backlog
Growth / Markets
at least €1.5 bn
at least break-even
further improvement

Charts on Financial Year 2013/14 November 20, 2014
5 Developing the future.
• EBIT adj. doubled yoy
• 1st positive NI since 3 years
• Dividend payment
• EBIT adj.: at least €1.5 bn
• NI: further improvement
• FCF before divest: at least break-even
• Establishing EBIT adj. floor with ~€2 bn as minimum requirement
• Sustainable cash generation
• Rational capital allocation
• Performance and benchmarking
• Continuous dividend payment
Restructuring / Cost Cutting / Change
Structural Growth
Entering the Next Phase in the Transformation Journey: More Structural Growth and Less Cyclical Volatility
FY 11/12 FY 12/13 FY 13/14 FY 14/15E FY 15/16E et seqq.
FCF
FCF before divest
2006/07 2010/11 2013/14
(€bn)
• Burning platforms
• Financial stability
• Compliance
SWF

Charts on Financial Year 2013/14 November 20, 2014
6 Developing the future.
5,715 6,157
6,520 6,819
5,283 5,732
11,663 13,682
9,515 8,919
2,056 2,215
41,416
Strong Demand at Capital Goods Driving Group Orders
38,636
Group cont. ops.
Order intake – continuing operations (million €)
• CT: +8% yoy (+10%*)
stronger auto but challenging truck markets;
recovery of wind energy (bearings)
• ET: +5% yoy (+8%*)
mainly from new installation in the US
and Asia Pacific
• IS: +8% yoy (+13%*)
strong demand for cement plants
and major submarine order in Q1 13/14
FY 2012/13 FY 2013/14
Industrial Solutions
Elevator Technology
Components Technology
Materials Services
Steel Europe
Steel Americas
+7% yoy
+7%*
* adjusted for F/X and portfolio changes
AST/VDM
Book-to-Bill >1
Order backlog yoy +5% to €23.9 bn:
• ET: +14% yoy to €4.1 bn; new record level
• IS: €14.0 bn; >80% of 14/15E sales covered

Charts on Financial Year 2013/14 November 20, 2014
7 Developing the future.
All BAs with Increased Earnings YoY (MX ex VDM/AST)
1,333 586
FY 2013/14
>doubling
Industrial Solutions
Elevator Techn.
Comp Techn.
Materials Services
Steel Europe
• CT: stronger auto markets and recovery of wind energy • ET: record sales driven by NI in China and Americas • IS: record sales confirming sustaining growth strategy • Materials: weaker prices and portfolio effects
• ET: increase in all quarters yoy; FY margin +0.7%-pts to 11.7% • IS: increase in all quarters yoy; FY margin +0.5%-pts to 11.8% • SE: increase by 51% driven by BiC Reloaded • AM: significant improvement to positive EBITDA
Sales – continuing operations (million €)
41,304 38,559
FY 2013/14
Industrial Solutions
Elevator Techn.
Comp Techn.
Materials Services
Steel Europe
EBIT adj. – continuing operations (million €)
Steel Americas
Steel Americas
5,641
6,155
5,712
1,867
2,014
9,620
11,700
738
751
269
+7% yoy
+7%*
* adjusted for F/X and portfolio changes
Group cont. ops. Group cont. ops.
6,271
6,416
6,172
2,060
8,857
13,660
640
675
240
(495)
236 143
(60) 213
216
FY 2012/13
FY 2012/13

Charts on Financial Year 2013/14 November 20, 2014
8 Developing the future.
Q3
Steel Europe
Materials Services
Elevator Techn.
Comp. Techn.
EBIT adjusted (million €); EBIT adjusted margin (%)
Steel
Americas (excl. D&A for TK Steel USA
until Q2 13/14)
Industrial Solutions
Q1
61
Q2 Q4
Positive Contribution From Almost All Business Areas in Q4
Negative contributions from VDM/AST yoy
BF#2 reline, maintenance & repair
Improved ops/prices yoy, FX/tax assets qoq
Efficiency gains yoy/seasonality qoq
Efficiency gains and growth
Confirming growth trends yoy
AST/VDM: (19)
3.8
57
3.8
220
12.3
188 11.2
176 9.8
164
10.2
65 1.7
76
2.6
32
1.5 42
1.8
Q3 Q1 Q2 Q4
2012/13
(33)
(136) (6.0)
2013/14
63 75 70
175 163 193
173 199 190
34 56 58
19 62
103
4.4 4.8 4.4
11.3 11.0 12.0
13.4 12.5 12.0
1.2 1.7 1.5
0.9
2.6 4.6
(3.2) (4.9)
3.6
(17) (26) 16

Charts on Financial Year 2013/14 November 20, 2014
9 Developing the future.
Net Income reconciliation – continuing operations (million €)
1st Positive Net Income in 3 Years Marking Milestone in Transformation
EBIT adj.
1,333
965
Income cont. ops.
9
(723)
Financial line
Special items
(368)
(233)
Taxes EBIT rep.
thereof: ThyssenKrupp AG’s stockholders: €24 m
EPS* €0.04/sh
* attributable to ThyssenKrupp AG’s stockholders
FY 2013/14
• €(294) m for restructuring and impairments across all BAs
• €49 m disposal/deconsolidation (mainly TK Steel USA, OTK stake, Budd)
• €(124) m others
Net Income
195
EPS* €0.38/sh
thereof: ThyssenKrupp AG’s stockholders: €210 m
incl. pro-rata losses from OTK stake of €52 m in Q1
Q4 2013/14 (million €)
Q4
9M

Charts on Financial Year 2013/14 November 20, 2014
10 Developing the future.
Divestments
NFD Sep 2014 1,053
Capex
FY 2013/14 (million €)
Capex for property, plant & equipment, financial & intangible assets & financial investments
NFD and Gearing YoY Down Significantly
OCF
887 (1,141)
Gearing 109.0%
FCF before divest (254)
(131)
Others
FCF 799
(3,488)
NFD Sep 2013
(5,038)
Gearing 200.6%
Capex: ~€1.5 bn
Gearing: <100%
FCF before divest: at least break-even
14/15E Targets
882 Cash-in c/i
(gross)
Equity reconciliation (million €)
2,512 195
Equity Sep 2013
(514)
Actuarial losses from pensions &
similar obligations
Net income
Equity Sep 2014
3,199
Others F/X
141
865
thereof: capital increase (gross) in Dec 2013: €882 m
Charts on Financial Year 2013/14 November 20, 2014
11 Developing the future.
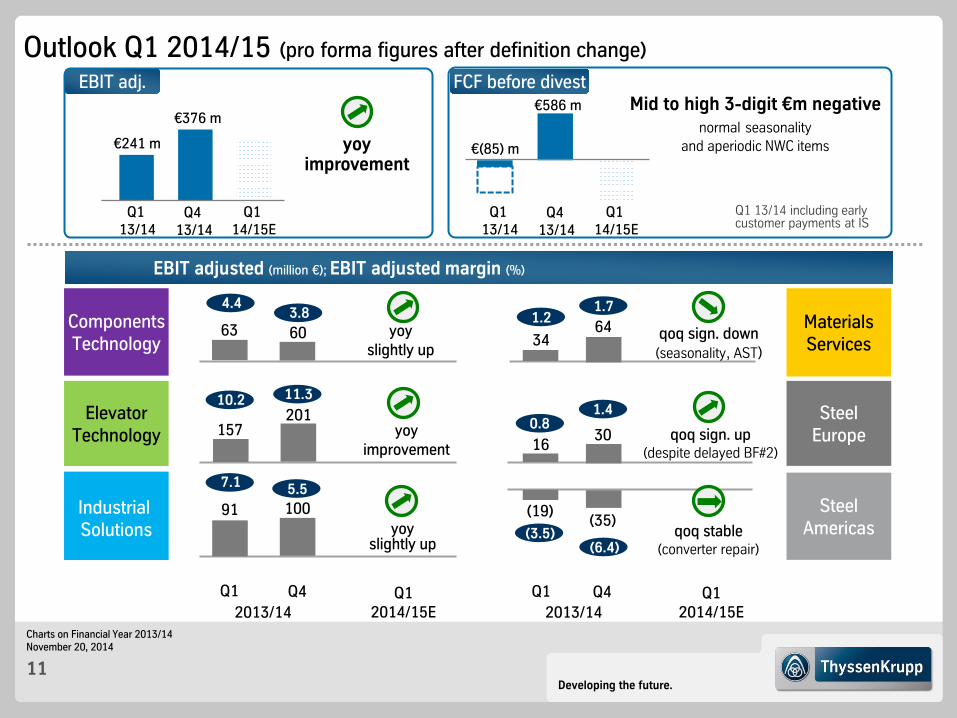
Outlook Q1 2014/15 (pro forma figures after definition change)
Q1 14/15E
€241 m
Q1 13/14
EBIT adj.
yoy improvement
€(85) m
FCF before divest Mid to high 3-digit €m negative
normal seasonality and aperiodic NWC items
Q1 13/14 including early customer payments at IS
€376 m
Q4 13/14
Q1 14/15E
Q1 13/14
Q4 13/14
€586 m
Q4
Steel Europe
Materials Services
Industrial Solutions
Components Technology
Q1 2014/15E
EBIT adjusted (million €); EBIT adjusted margin (%)
Elevator Technology
60 3.8
201 11.3
64 1.7
30
1.4
100 5.5
yoy improvement
Steel Americas (35)
Q1
63
4.4
157
10.2
91
7.1
2013/14 Q4 Q1
2014/15E Q1
2013/14
34
1.2
16 0.8
(19) yoy
slightly up
qoq sign. up (despite delayed BF#2)
qoq stable (converter repair)
qoq sign. down (seasonality, AST)
yoy slightly up
(3.5) (6.4)
Charts on Financial Year 2013/14 November 20, 2014
12 Developing the future.
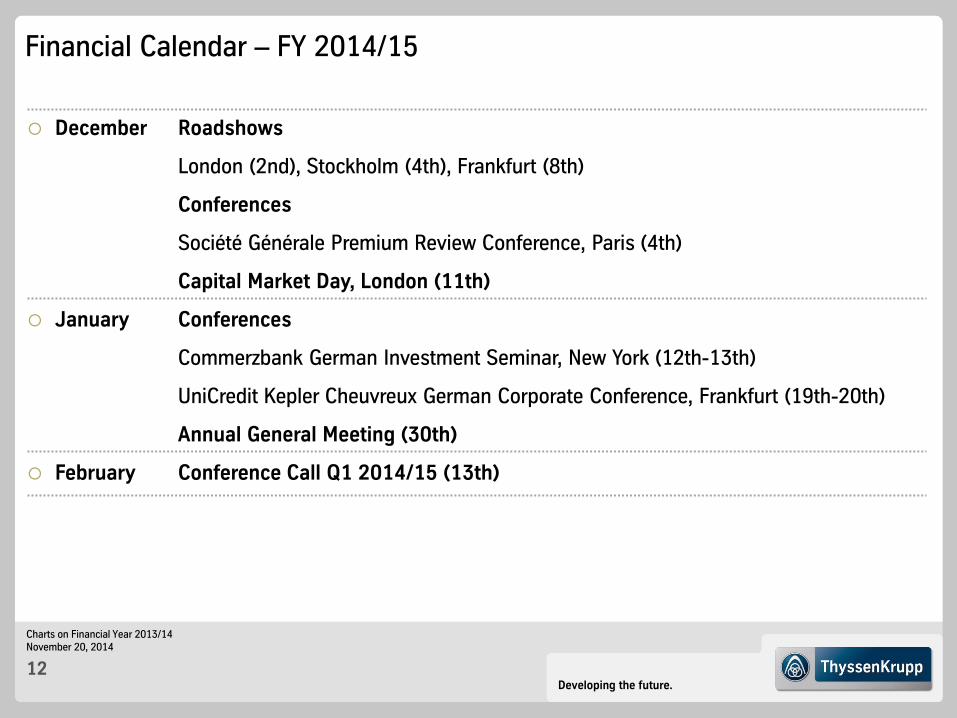
Financial Calendar – FY 2014/15
December Roadshows
London (2nd), Stockholm (4th), Frankfurt (8th)
Conferences
Société Générale Premium Review Conference, Paris (4th)
Capital Market Day, London (11th)
January Conferences
Commerzbank German Investment Seminar, New York (12th-13th)
UniCredit Kepler Cheuvreux German Corporate Conference, Frankfurt (19th-20th)
Annual General Meeting (30th)
February Conference Call Q1 2014/15 (13th)

Charts on Financial Year 2013/14 November 20, 2014
13 Developing the future.
Contact Details ThyssenKrupp Investor Relations
Phone numbers +49 201-844-
Dr. Claus Ehrenbeck -536464 Head of Investor Relations
Christian Schulte -536966 IR Manager (Deputy Head)
Rainer Hecker -538830 IR Manager
Sabine Sawazki -536420 IR Manager
Klaudia Kelch -538371 IR Manager
To be added to the
IR mailing list, send us a brief e-mail
with your details! E-mail:

Charts on Financial Year 2013/14 November 20, 2014
14 Developing the future.
Share and ADR Data
Ticker Symbol TKA German Security Identification Number (WKN) 750 000 ISIN Number DE0007500001 Exchange Frankfurt, Dusseldorf
Share Data
ADR Data
Ratio (ordinary share: ADR) 1:1 ADR Structure Sponsored-Level-I Ticker Symbol TKAMY Cusip 88629Q 207 ISIN Number US88629Q2075 Exchange Over-the-Counter (OTC)
Shares outstanding as per September 30, 2014 565,937,947 Type of share No-par-value bearer shares Voting One share, one vote

Charts on Financial Year 2013/14 November 20, 2014
15 Developing the future.
Appendix
Agenda

Charts on Financial Year 2013/14 November 20, 2014
16 Developing the future.
Cultural change and leadership
Performance and benchmarking ambition
Rational capital allocation
Value Upside
Mid- to Long-Term Perspective From Strategic Way Forward return to previous margin levels (6-8%)
• performance measures • ramp-up new plants
CT
efficient corporate structure central projects and initiatives
preparing next level of efficiency gains
close margin gap to peers • while leverage growth opportunities • target: 15%* I €1 bn (EBIT adj.)
ET
sales growth by Ø 5% to €8 bn • while maintain
stable EBIT margin* of 6-7%
IS
return to previous margin levels • performance measures • specialization & processing
VDM/AST: perform./attract. concept
MX
return to > wacc across the cycle • BiC Reloaded: efficiency & differentiation
SE
AM
* excl. notional interest credit from net prepayment surplus
continuous EBIT improvement BCF ~break-even during FY 14/15 sustainable slab marketing concept
Corp.
Profitability
Profitability
Profitability
Profitability before growth
Profitability before growth
Growth before profitability

Charts on Financial Year 2013/14 November 20, 2014
17 Developing the future.
KPI (in million €)
FY 2013/14 old definition
Definition change (net prepayment surplus, correction factor,
capitalized interest)
FY 2013/14 pro forma
Δ proportionate consolidation HKM
as of Oct 1st, 2014
Sales 41,304 41,304 ~ +0.1 bn / qtr
EBIT adjusted thereof
CT ET IS MX SE AM
Corporate Cons
1,333
269 751 738 213 216 -60
-424 -370
• incl. depreciation on capitalized interest
• incl. depreciation on capitalized interest • excl. interest from net prepayment surplus • excl. interest from net prepayment surplus • incl. depreciation on capitalized interest • incl. depreciation on capitalized interest • incl. depreciation on capitalized interest • incl. depreciation on capitalized interest • excl. reversal of interest from net prep. surplus
1,314
268 674 420 212 206 -68
-426 28
~ +€5 m / qtr
~ +€5 m / qtr
Ø Capital Employed 12,727
• incl. correction factor • incl. capitalized interest
~15,000 ~ +€0.2 bn
TKVA 5 • more ambitious threshold for value generation (213) ~ neutral
NFD 3,488 3,488 ~ +€0.1 bn
Impact on KPIs from Definition Change and Proportionate Consolidation HKM
New definition leads to more transparency and better comparability and reflects a more ambitious threshold for value generation

Charts on Financial Year 2013/14 November 20, 2014
18 Developing the future.
Entering the Next Phase in the Transformation Journey: Return to Dividend
299
412*
489
635 603
139
209 232
62**
0.60
0.80*
1.00
1.30 1.30
0.30
0.45 0.45
0.11** 0
0.2
0.4
0.6
0.8
1
1.2
1.4
1.6
1.8
2
0
100
200
300
400
500
600
700
2003/04 2004/05 2005/06 2006/07 2007/08 2008/09 2009/10 2010/11 2011/12 2012/13 2013/14
* including extra dividend of €0.10 ** proposal to AGM
Dividend payment (€m)
Dividend (€/share)

Charts on Financial Year 2013/14 November 20, 2014
19 Developing the future.
Key Financials (I)
** attributable to ThyssenKrupp AG’s stockholders
Cont. Ops. (incl. Steel Americas with
Steel USA until Feb 26, 2014)
Q1 Q2 Q3 Q4 FY Q1 Q2 Q3 Q4 FY
Order intake €m 10,063 10,113 9,401 9,059 38,636 10,671 10,220 10,161 10,364 41,416
Sales €m 9,189 9,540 9,920 9,910 38,559 9,109 10,295 10,742 11,158 41,304
EBITDA €m 369 226 355 204 1,154 468 598 628 394 2,088
EBITDA adjusted €m 380 465 408 416 1,669 505 580 678 644 2,407
EBIT €m 94 (52) 33 (684) (608) 210 327 349 79 965
EBIT adjusted €m 104 193 136 153 586 246 309 398 380 1,333 EBIT adjusted* €m 241 304 393 376 1,314
EBT €m (76) (243) (205) (1,182) (1,706) (230) 369 162 (59) 242
EBT adjusted €m (66) 2 (102) (346) (512) (194) 351 210 243 610
Income from cont. ops. €m (77) (129) (428) (995) (1,629) (257) 272 43 (49) 9
attrib. to TK AG stockh. €m (63) (131) (398) (898) (1,490) (252) 271 40 (35) 24
Earnings per share** € (0.13) (0.25) (0.77) (1.75) (2.90) (0.47) 0.48 0.07 (0.06) 0.04
2013/142012/13
* pro forma after definition change
Charts on Financial Year 2013/14 November 20, 2014
20 Developing the future.
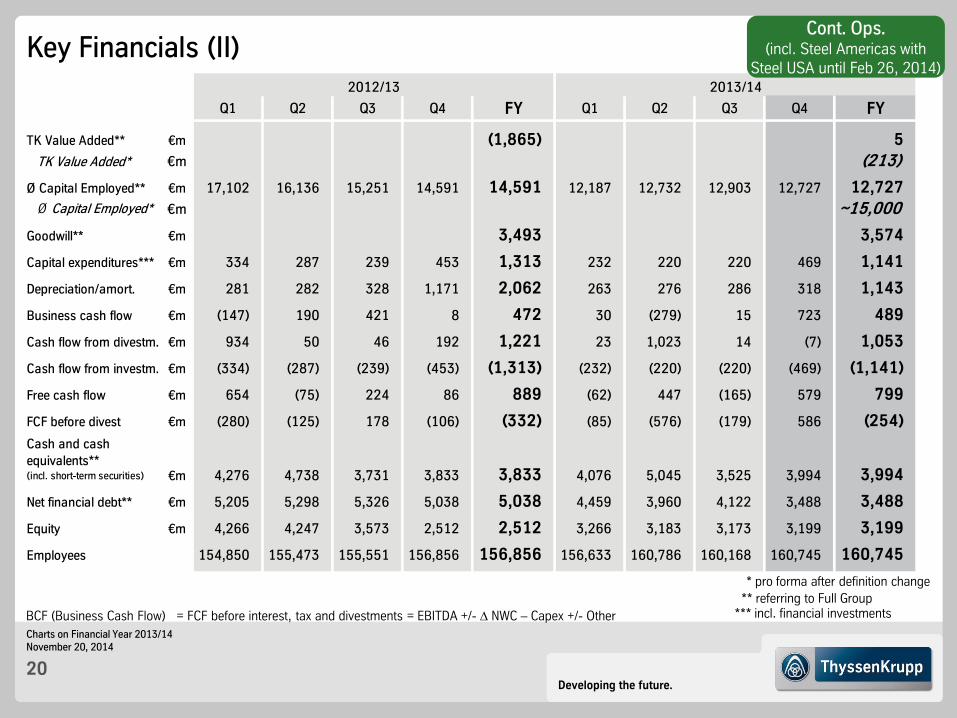
Key Financials (II)
*** incl. financial investments ** referring to Full Group
BCF (Business Cash Flow) = FCF before interest, tax and divestments = EBITDA +/- ∆ NWC – Capex +/- Other
Q1 Q2 Q3 Q4 FY Q1 Q2 Q3 Q4 FY
TK Value Added** €m (1,865) 5 TK Value Added* €m (213)
Ø Capital Employed** €m 17,102 16,136 15,251 14,591 14,591 12,187 12,732 12,903 12,727 12,727 Ø Capital Employed* €m ~15,000
Goodwill** €m 3,493 3,574
Capital expenditures*** €m 334 287 239 453 1,313 232 220 220 469 1,141
Depreciation/amort. €m 281 282 328 1,171 2,062 263 276 286 318 1,143
Business cash flow €m (147) 190 421 8 472 30 (279) 15 723 489
Cash flow from divestm. €m 934 50 46 192 1,221 23 1,023 14 (7) 1,053
Cash flow from investm. €m (334) (287) (239) (453) (1,313) (232) (220) (220) (469) (1,141)
Free cash flow €m 654 (75) 224 86 889 (62) 447 (165) 579 799
FCF before divest €m (280) (125) 178 (106) (332) (85) (576) (179) 586 (254)Cash and cash equivalents** (incl. short-term securities) €m 4,276 4,738 3,731 3,833 3,833 4,076 5,045 3,525 3,994 3,994
Net financial debt** €m 5,205 5,298 5,326 5,038 5,038 4,459 3,960 4,122 3,488 3,488
Equity €m 4,266 4,247 3,573 2,512 2,512 3,266 3,183 3,173 3,199 3,199
Employees 154,850 155,473 155,551 156,856 156,856 156,633 160,786 160,168 160,745 160,745
2013/142012/13
Cont. Ops. (incl. Steel Americas with
Steel USA until Feb 26, 2014)
* pro forma after definition change

Charts on Financial Year 2013/14 November 20, 2014
21 Developing the future.
Key Financials (III) Full Group (Cont. ops. +
Inoxum effects until Q2 13/14)
Q1 Q2 Q3 Q4 FY Q1 Q2 Q3 Q4 FY
Order intake €m 11,202 10,113 9,401 9,059 39,774 10,671 10,220 10,161 10,364 41,416
Sales €m 10,412 9,540 9,920 9,910 39,782 9,109 10,295 10,742 11,158 41,304
EBITDA €m 443 223 356 190 1,212 655 596 628 395 2,274
EBITDA adjusted €m 310 463 411 415 1,600 505 580 678 644 2,407
EBIT €m 166 (53) 33 (698) (552) 397 325 348 81 1,151
EBIT adjusted €m 35 191 139 152 517 246 309 398 380 1,333 EBIT adjusted* €m 241 304 393 376 1,314
EBT €m (12) (242) (201) (1,193) (1,648) (43) 367 161 (57) 428
EBT adjusted €m (143) 3 (96) (343) (579) (194) 351 210 243 610
Net income €m (18) (127) (425) (1,006) (1,576) (70) 270 42 (47) 195
attrib. to TK AG stockh. €m (3) (129) (395) (909) (1,436) (65) 269 39 (33) 210
Earnings per share** € (0.01) (0.25) (0.76) (1.77) (2.79) (0.12) 0.48 0.07 (0.06) 0.38
Capital expenditures €m 433 286 239 453 1,411 232 220 220 469 1,141
2013/142012/13
** attributable to ThyssenKrupp AG’s stockholders * pro forma after definition change

Charts on Financial Year 2013/14 November 20, 2014
22 Developing the future.
~2,500
FY 2014/15E FY 2013/14 FY 2012/13
Ramp-up Efficiency Gains 2015
Sustainable Efficiency Gains to Support EBIT Target FY 2014/15E
50% contribution to efficiency target from synergize+ especially by tapping unaddressed bundling potentials and pulling cross-functional levers
Efficiency Gains 2015 by Business Area
Efficiency Gains 2015 by Categories
2015
Energy & Other ~10%
~20%
Operations
~20%
~50% Personnel
Corporate
~6% Industrial Solutions ~15%
Components Technology ~14%
Steel Europe
Elevator Technology ~14%
Materials Services
~12%
~27%
million €
(Procurement) 500
100
~600
>1,000
~850
~13% Steel Americas

Charts on Financial Year 2013/14 November 20, 2014
23 Developing the future.
Capex Allocation
CapGoods (CT, ET, IS)
2012/13
Materials (MX, SE, AM)
€1.3 bn ~34
~8
~33
CT ET IS MX SE AM
~33 ~67 in %
thereof: CT: ~60% SE: ~20% IS: ~10%
thereof: SE: ~45% MX: ~15% CT: ~15%
Maint. Growth
2013/14
in %
~29
~8
~13 ~7
~35
~7
2014/15E
Cash flows from investing activities – continuing operations
CT
ET IS MX
SE
AM
31%
11% 5% 6%
33%
14%
32%
8% 5% 9%
37%
8%
Business Area shares referring to capex excl. Corporate
€1.1 bn
~€1.5 bn
Group cont. ops.

Charts on Financial Year 2013/14 November 20, 2014
24 Developing the future.
Solid Financial Situation
Liquidity analysis and maturity profile of gross financial debt as of September 30, 2014 (million €)
2015/16 2016/17 2017/18 after 2018/19
Available committed credit facilities
Cash and cash equivalents
1,005
1,679 1,373
97
1,536
3,775
1,792
* incl. securities of €5 m
7,769
13% 23% 18% 24% 1% 21%
3,994*
2018/19 2014/15
€1 bn / 8.5% bond matures in Feb 2016 (all other outstanding bonds with coupon <5%)
Total: 7,482

Charts on Financial Year 2013/14 November 20, 2014
25 Developing the future.
Accrued Pension and Similar Obligations
Accrued pension liability Germany
Accrued postretirement obligation other than pensions
Other accrued pension-related obligation
Sep 30, 2014
Accrued pension liability outside GER
Discount rate Germany
3.50
Reclassification liabilities associated with assets held for sale
7,348*
6,427
Sep 30, 2013
7,153
2.60
7,354 191 10
6,717
436 252 698
(29)
6,039
388
7,354
13/14 14/15 15/16 16/17 …
Assumption: unchanged discount rate
“Patient” long-term debt, no immediate redemption in one go
Interest cost independent of ratings, covenants etc.
German discount rate aligned to interest rate for AA-rated corporate bonds and discounts rate of other German companies
Yoy increase in accrued pension liability mainly driven by decrease in German discount rate
Yoy decrease in postretirement obligation due to deconsolidation of Budd company
Number of plan participants steadily decreasing
64% of obligations owed to retired employees, average age ~74 years
17/18 18/19
2.60
7,354 191 8
6,717
436
6,932
2.80
7,118 198
6,474
458
* Figures adjusted due to the adoption of IAS 19R
Sep 30, 2014 Jun 30, 2014
- 100- 200 p.a.
Post- retirem. 10
Accrued pension and similar obligations (in €m) Accrued pension & similar obligations expected to decrease over time (in €m)
(20)
7,153

Charts on Financial Year 2013/14 November 20, 2014
26 Developing the future.
Components Technology – Q4 2013/14 Highlights Order intake in €m Quarterly order intake auto components EBIT in €m; EBIT adj. margin in %
Q4 2013/14: yoy increase in order intake mainly driven by continuing strong demand
for LV in the US and China
EBIT EBIT adjusted
2012/13 2013/14 2012/13 2013/14
Order activity in Q4 remains on good level (+3% yoy)
• Light vehicles: ongoing positive development in China and the US; further recovery in Western Europe (at low level)
• Trucks: ongoing difficult market conditions (except for the US)
• Industrial components: improved business environment for wind turbines (especially in China); construction equipment market still challenging
EBIT adj. with increase of 7% yoy (mainly efficiency)
• qoq seasonality; ongoing repair/maintenance costs at Powertrain cushioned by insurance reimbursement
1,439
1,534
Q3 Q4
1,492 1,573
4.4
55
4.8
Q4 Q4 Q3
63
75
67
61
48
3.8
57
20
3.8
Q4
1,611
4.4
70
65
Q4 Q2
2008/09
Q2
2010/11
Q4
2012/13
Q2 Q4
Inventories and Months of Supply - Europe Current trading conditions
CT
Sales by region – FY 2013/14
Germany
Rest of EU NAFTA
South America
Asia
32%
20% 26%
6%
15%
€6.2 bn
Rest of World 1%
Charts on Financial Year 2013/14 November 20, 2014
27 Developing the future.
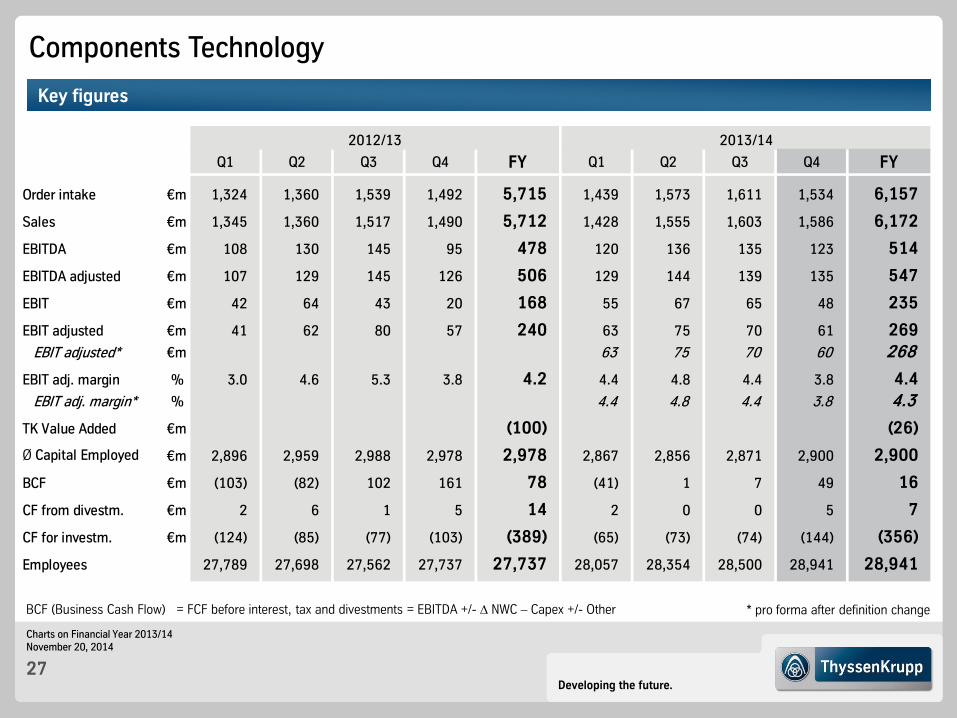
Components Technology
BCF (Business Cash Flow) = FCF before interest, tax and divestments = EBITDA +/- ∆ NWC – Capex +/- Other
Key figures
* pro forma after definition change
Q1 Q2 Q3 Q4 FY Q1 Q2 Q3 Q4 FY
Order intake €m 1,324 1,360 1,539 1,492 5,715 1,439 1,573 1,611 1,534 6,157
Sales €m 1,345 1,360 1,517 1,490 5,712 1,428 1,555 1,603 1,586 6,172
EBITDA €m 108 130 145 95 478 120 136 135 123 514
EBITDA adjusted €m 107 129 145 126 506 129 144 139 135 547
EBIT €m 42 64 43 20 168 55 67 65 48 235
EBIT adjusted €m 41 62 80 57 240 63 75 70 61 269 EBIT adjusted* €m 63 75 70 60 268
EBIT adj. margin % 3.0 4.6 5.3 3.8 4.2 4.4 4.8 4.4 3.8 4.4 EBIT adj. margin* % 4.4 4.8 4.4 3.8 4.3
TK Value Added €m (100) (26)
Ø Capital Employed €m 2,896 2,959 2,988 2,978 2,978 2,867 2,856 2,871 2,900 2,900
BCF €m (103) (82) 102 161 78 (41) 1 7 49 16
CF from divestm. €m 2 6 1 5 14 2 0 0 5 7
CF for investm. €m (124) (85) (77) (103) (389) (65) (73) (74) (144) (356)
27,789 27,698 27,562 27,737 27,737 28,057 28,354 28,500 28,941 28,941
2013/14
Employees
2012/13

Charts on Financial Year 2013/14 November 20, 2014
28 Developing the future.
Elevator Technology – Q4 2013/14 Highlights Units under Maintenance EBIT in €m; EBIT adj. margin in %
80
220
12.3 11.3
133
175
11.0
163
159
Q4 2012/13 2013/14
Q3
153
188
11.2
Q4
12.0
193
184
ET
EBIT EBIT adjusted
Order intake in €m
1,746 1,575
1,801 1,580
Q4 Q4 Q3 2012/13 2013/14
Americas Asia/Pacific
FY: 6,520 FY: 6,819
2004/05 2013/14
CAGR +4.6%
~0.8 m
~ 1.2 m
1,692
Units under Maintenance
Europe/Africa/Middle East
Current trading conditions Current trading conditions New product: ACCEL – Accelerating moving walkway
Order backlog €4.1 bn again at record level Order intake in Q4 yoy up +11% driven by new installation
(FY: adj. for F/X +8% yoy) New installation: ongoing strong demand from A/P (China, Korea)
and US; Southern Europe and France weak • Modernization: driven by Europe and Americas • Maintenance: esp. in Southern Europe and USA very competitive;
promising growth pattern in China Q4 margin improvement by more than 1%-pt yoy reflects both
efficiency gains and operational progress Ongoing restructuring in France in field and manufacturing operations
High speed: max. 2 m/s (7.2 km/h) High capacity: 7,300 people per
hour/direction
Product scope: greater distances up to 1,500 m
Target market: Metro systems, airports (e.g. substitute for automated people mover)
Unique technology: Linear motor technology based on Transrapid

Charts on Financial Year 2013/14 November 20, 2014
29 Developing the future.
Elevator Technology
Key figures
BCF (Business Cash Flow) = FCF before interest, tax and divestments = EBITDA +/- ∆ NWC – Capex +/- Other * pro forma after definition change
Q1 Q2 Q3 Q4 FY Q1 Q2 Q3 Q4 FY
Order intake €m 1,616 1,633 1,696 1,575 6,520 1,801 1,580 1,692 1,746 6,819
Sales €m 1,532 1,388 1,562 1,673 6,155 1,544 1,481 1,609 1,782 6,416
EBITDA €m 190 159 179 176 703 152 177 204 109 642
EBITDA adjusted €m 188 166 197 201 753 194 181 212 238 824
EBIT €m 171 133 155 153 611 133 159 184 80 556
EBIT adjusted €m 169 146 172 188 675 175 163 193 220 751 EBIT adjusted* €m 157 143 173 201 674
EBIT adj. margin % 11.0 10.5 11.0 11.2 11.0 11.3 11.0 12.0 12.3 11.7 EBIT adj. margin* % 10.2 9.7 10.8 11.3 10.5
TK Value Added €m 423 378
Ø Capital Employed €m 2,359 2,371 2,372 2,353 2,353 2,271 2,271 2,262 2,231 2,231
BCF €m 74 257 203 118 652 51 230 159 201 641
CF from divestm. €m 3 3 1 2 9 1 0 0 3 4
CF for investm. €m (23) (20) (25) (76) (143) (14) (19) (21) (33) (87)
47,897 48,150 48,488 49,112 49,112 49,348 49,316 49,707 50,282 50,282
2013/14
Employees
2012/13

Charts on Financial Year 2013/14 November 20, 2014
30 Developing the future.
Industrial Solutions – Q4 2013/14 Highlights Order intake in €m Order backlog in €bn EBIT* in €m; EBIT* adj. margin in %
176
9.8
162
13.4
173
1,213
15.5 14.0
New EBIT definition Current trading conditions
2,295
182
FY: 5,283
Q1 13/14 big ticket MS
Plan
t Te
chno
logy
* incl. notional interest credit from net prepayment surplus
907
Q4 Q3 Q4 2012/13 2013/14
14.6
164
10.2
195
Q4 Q3 2012/13 2013/14
Q4 2012/13
Q3 2013/14
Q4
Mar
ine
Sys
tem
s
Plan
t Te
chno
logy
M
arin
e S
yste
ms
1,188
FY: 5,732 15.1 199
12.5
Q4
1,035
199 190
12.0
14.6
FY orders +13% yoy (adj. for F/X) well in line with sales growth target of +5% and securing good visibility & high backlog • chemicals: ongoing interest for fertilizer and polymer plants • cement: sustained high demand for cement plants driven by
infrastructure growth in emerging markets • mining: ongoing lower customer new installation demand cushioned by
components & service and stable oil sands business • good conditions in the auto plant market (esp. in US and Europe)
but lower activity in Brazil and Russia • big ticket for Marine Systems in Q1
EBIT adj. with yoy increase in all quarters driven by efficiency improvements in all businesses and billing of fertilizer and naval projects
IS
New definition leads to more transparency and better comparability
EBIT and EBIT % excl. notional interest credit from net prepayment surplus
Capital Employed excl. net prepayment surplus
KPI (in €m) 2013/14 old 2013/14 new (pro forma)
EBIT (%) 740 (11.8%) 422 (6.7%)
EBIT adj. (%) 738 (11.8%) 420 (6.7%)
Ø CE 1,399 ~(2,100)
173 190
EBIT EBIT adjusted
Charts on Financial Year 2013/14 November 20, 2014
31 Developing the future.
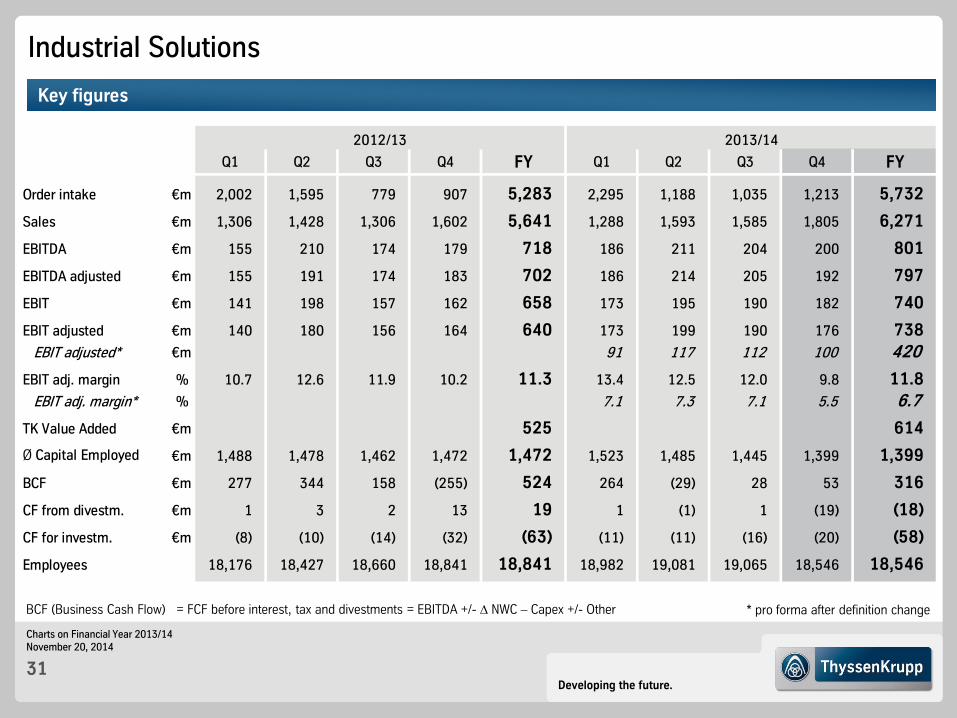
Industrial Solutions
Key figures
BCF (Business Cash Flow) = FCF before interest, tax and divestments = EBITDA +/- ∆ NWC – Capex +/- Other * pro forma after definition change
Q1 Q2 Q3 Q4 FY Q1 Q2 Q3 Q4 FY
Order intake €m 2,002 1,595 779 907 5,283 2,295 1,188 1,035 1,213 5,732
Sales €m 1,306 1,428 1,306 1,602 5,641 1,288 1,593 1,585 1,805 6,271
EBITDA €m 155 210 174 179 718 186 211 204 200 801
EBITDA adjusted €m 155 191 174 183 702 186 214 205 192 797
EBIT €m 141 198 157 162 658 173 195 190 182 740
EBIT adjusted €m 140 180 156 164 640 173 199 190 176 738 EBIT adjusted* €m 91 117 112 100 420
EBIT adj. margin % 10.7 12.6 11.9 10.2 11.3 13.4 12.5 12.0 9.8 11.8 EBIT adj. margin* % 7.1 7.3 7.1 5.5 6.7
TK Value Added €m 525 614
Ø Capital Employed €m 1,488 1,478 1,462 1,472 1,472 1,523 1,485 1,445 1,399 1,399
BCF €m 277 344 158 (255) 524 264 (29) 28 53 316
CF from divestm. €m 1 3 2 13 19 1 (1) 1 (19) (18)
CF for investm. €m (8) (10) (14) (32) (63) (11) (11) (16) (20) (58)
18,176 18,427 18,660 18,841 18,841 18,982 19,081 19,065 18,546 18,546
2013/14
Employees
2012/13

Charts on Financial Year 2013/14 November 20, 2014
32 Developing the future.
Materials Services – Q4 2013/14 Highlights EBIT in €m; EBIT adj. margin in %
1.2 1.7
34
(24) 64 43
56
1.7
37
2.6
76
Q4 2012/13
Q3 2013/14
Q4
58
1.5
44
MX
65
EBIT EBIT adjusted
Order intake* in €m
* thereof materials warehousing business ~60%
3,725
2,842
3,414
2,863
Q4 Q3 Q4 2012/13 2013/14
Materials warehousing shipments in 1,000 t
1,328 1,463 1,445
Q4 Q3 Q4 2012/13 2013/14
3,700
1,391
VDM/ AST
1,394
Current trading conditions Sales by customer group (FY 2013/14)
Shipments of materials and raw materials increased in FY by 20% yoy to 12.8 mt, however compensated by lower prices
Order intake in Q4 +10% yoy on comparable basis (ex VDM/AST) due to pricing and product mix; qoq seasonally flat; VDM/AST contribute ~€600 m to order intake and ~€700 m to sales
Pricing environment still unsatisfying; prices for nearly all relevant materials on average below prior year
Broadly stable earnings yoy excluding VDM/AST • Sales initiatives and performance programs pay off • VDM/AST with EBIT adj. contribution of €(24) m
Optimization program at VDM and AST under negotiation
Steel and related processing 24
Energy 5
% Trading 17 Other
industries 11
Engineering 10
Construction 7
Other 13
Automotive 13
excl. VDM/AST shipments

Charts on Financial Year 2013/14 November 20, 2014
33 Developing the future.
Materials Services
Key figures
BCF (Business Cash Flow) = FCF before interest, tax and divestm. = EBITDA +/- ∆ NWC – Capex +/- Other
* pro forma after definition change
Q1 Q2 Q3 Q4 FY Q1 Q2 Q3 Q4 FY
Order intake €m 2,765 2,988 3,047 2,863 11,663 2,842 3,414 3,700 3,725 13,682thereof Special Materials 288 731 599 1,618
Sales €m 2,815 2,923 3,056 2,906 11,700 2,739 3,320 3,780 3,821 13,660thereof Special Materials 266 763 689 1,718
EBITDA €m 59 (134) 87 85 96 62 66 88 24 239
EBITDA adjusted €m 63 80 84 99 326 54 85 102 84 325thereof Special Materials 4 21 (4) 22
EBIT €m 36 (157) 51 64 (6) 43 37 44 (24) 100
EBIT adjusted €m 40 58 62 76 236 34 56 58 65 213thereof Special Materials (3) (2) (19) (24)
EBIT adjusted* €m 34 56 58 64 212
EBIT adj. margin % 1.4 2.0 2.0 2.6 2.0 1.2 1.7 1.5 1.7 1.6thereof Special Materials (1.1) (0.3) (2.8) (1.4)
EBIT adj. margin* % 1.2 1.7 1.5 1.7 1.6
TK Value Added €m (258) (198)
Ø Capital Employed €m 2,913 2,925 2,881 2,808 2,808 2,562 3,017 3,312 3,305 3,305thereof Special Materials 357 583 592 592
BCF €m (175) (29) 136 258 190 (236) (67) (87) 350 (40)thereof Special Materials (1) (43) 15 (30)
CF from divestm. €m 2 8 34 5 49 19 1 4 5 29
CF for investm. €m (19) (13) (8) (36) (76) (13) (16) (26) (49) (104)
26,280 26,230 25,994 26,978 26,978 25,128 30,653 30,467 30,289 30,289
2013/14
Employees
2012/13

Charts on Financial Year 2013/14 November 20, 2014
34 Developing the future.
Steel Europe – Q4 2013/14 Highlights Shipments in 1,000 t
indexed (Q1 2004/05=100) Ø rev/t
Order intake in €m EBIT in €m; EBIT adj. margin in %
2,036 2,177
2,274 2,430
Q4 Q3 2013/14 2012/13
2,839
123
Q4 Q3 Q4 2012/13 2013/14 2012/13 2013/14
Q3
20 28
42
1.8 0.9
19
62
2.6
52
121
2,580
Q4
117
3,109
119
Q4 Q4
1.5
32
28
2,178
103
4.6
92
2,858
SE
118
2,847
Current trading conditions Inventories and Months of Supply - Europe Strengthening differentiation: Leveraging ThyssenKrupp Group synergies
Qoq lower EBIT adj. reflecting mainly lower production volumes, less fixed cost dilution, higher maintenance & repair costs related to BF#2 reline and further/complementary Capex/maintenance & repair projects
Following delayed completion of modernization of continuous caster #1, BF#2 was relit mid October
Expectation fiscal Q1 2014/15: qoq higher EBIT adj. as reline-related effects should largely fall away
Against background of inadequate selling prices and earnings, focus remains on "Best-in-Class Reloaded“; reduced weekly working hours for pay-scale employees has become effective Oct 1, 2014
Status Quo A-Pillar
1 of >40 solutions for sustainable automobile construction cost-efficient weight reduction potentials of up to 10% reduces the A-pillar “blind spot” by an incredible 34% !
EBIT EBIT adjusted

Charts on Financial Year 2013/14 November 20, 2014
35 Developing the future.
Steel Europe
Key figures
BCF (Business Cash Flow) = FCF before interest, tax and divestments = EBITDA +/- ∆ NWC – Capex +/- Other * pro forma after definition change
Q1 Q2 Q3 Q4 FY Q1 Q2 Q3 Q4 FY
Order intake €m 2,403 2,620 2,315 2,177 9,515 2,274 2,430 2,178 2,036 8,919
Sales €m 2,253 2,512 2,562 2,293 9,620 2,074 2,389 2,228 2,166 8,857
EBITDA €m 142 98 119 154 512 126 158 192 117 592
EBITDA adjusted €m 142 118 166 146 572 126 168 205 121 620
EBIT €m 29 (10) 14 28 62 20 52 92 28 192
EBIT adjusted €m 30 9 62 42 143 19 62 103 32 216 EBIT adjusted* €m 16 60 100 30 206
EBIT adj. margin % 1.3 0.4 2.4 1.8 1.5 0.9 2.6 4.6 1.5 2.4 EBIT adj. margin* % 0.8 2.5 4.5 1.4 2.3
TK Value Added €m (432) (245)
Ø Capital Employed €m 5,387 5,351 5,291 5,198 5,198 4,669 4,605 4,595 4,594 4,594
BCF €m 15 97 173 (5) 280 182 59 (41) 140 340
CF from divestm. €m 2 1 5 159 167 0 (3) (4) (20) (27)
CF for investm. €m (94) (105) (74) (136) (408) (91) (63) (95) (155) (404)
27,629 27,773 27,609 26,961 26,961 26,658 26,397 26,047 26,231 26,231
2013/14
Employees
2012/13

Charts on Financial Year 2013/14 November 20, 2014
36 Developing the future.
133 156
122 130 147
135 121
136 153
116 135 136
126 117 138 139
120 140 138
127 119
150
120 129 146
136 123 118
HKM share
Steel Europe: Output, Shipments and Revenues per Metric Ton
Cold-rolled Hot-rolled; incl. slabs
2007/08 2008/09 2009/10
* shipments and average revenues per ton until FY 2007/08 relate to former Steel segment
2010/11 2011/12 2012/13
Q1 Q1 Q2 Q3 Q4 Q1 Q2 Q3 Q4 Q1 Q2 Q3 Q4 Q1 Q2 Q3 Q4 Q1 Q2 Q3 Q4
696 828 863
Fiscal year
2009/10 2010/11 Q1
2013/14
2,628
3,324
Q1
2013/14 Fiscal year
2009/10 2010/11 Q1
2012/13
2,580
947
1,633
Q2 Q3 Q4
3,256
1,130
2,126
2,485
3,312
786 863 822
843
2,360
3,146 3,002
1,026
1,977
Q2 Q3 Q4
957
2,046
3,002
2011/12
2,529
845
1,684
3,058
1,116
1,942
3,093
1,116
1,977
2,839
1,004
1,834
2011/12
2,965
2,102
Q1
2012/13
611 833 857 859
2,010
2,622
Q2
2,153
2,986
Q3
3,097
2,241 2,082
Q4
2,941
2013/14
Q1
Q2
3,109
1,205
1,904
2,555
3,418
Q2
Q2
Q3 Q3
2,858
1,041
1,817
Q3
2,296
3,119
Q4
1,725
2,567 2,847
1,064
1,783
Q4
Q4
Crude steel output (incl. share in HKM) 1,000 t/quarter
Average revenues per ton*, indexed Q1 2004/2005 = 100
Shipments*: Hot-rolled and cold-rolled products 1,000 t/quarter
SE

Charts on Financial Year 2013/14 November 20, 2014
37 Developing the future.
Steel Americas – Q4 2013/14 Highlights Production & shipments in 1,000 t
Slab production CSA
Slab shipments CSA
Q4 Q3 Q4
Q4 Q3 Q4 2013/14
Order intake in €m EBIT in €m
620
491
609 574
(17)
1
(26)
(136)
(821)
986
Q4 Q3 Q4 2012/13 2013/14
Q4 2012/13
Q3 2013/14
Q4 2012/13
2013/14 2012/13
998
117
987
936 923 1,034 412
16
8
1,071
1,046
AM
(33)
1,130 (54)
Current trading conditions
Qoq EBIT adj. down reflecting esp. a reimbursement payment in Q3 (BF#2 damage in May 2013) and negative translation effects related to R$-based sales tax assets in Q4 which could not be compensated by higher shipments and efficiency gains
Special items in Q4: €(12) m from updated valuation of a long-term freight contract and €(9) m impairment charge
BRL/USD
1,054
3.0
2.5
2.0
1.5
1.0
3.0
2.5
2.0
1.5
1.0 05/06 07/08 09/10 11/12 13/14
Similar to Q3 last FY, EBIT Q4’13/14 influenced by negative translation effects related to R$-based sales tax assets
Sig. depreciation of BRL vs. USD
EBIT EBIT adjusted
Charts on Financial Year 2013/14 November 20, 2014
38 Developing the future.
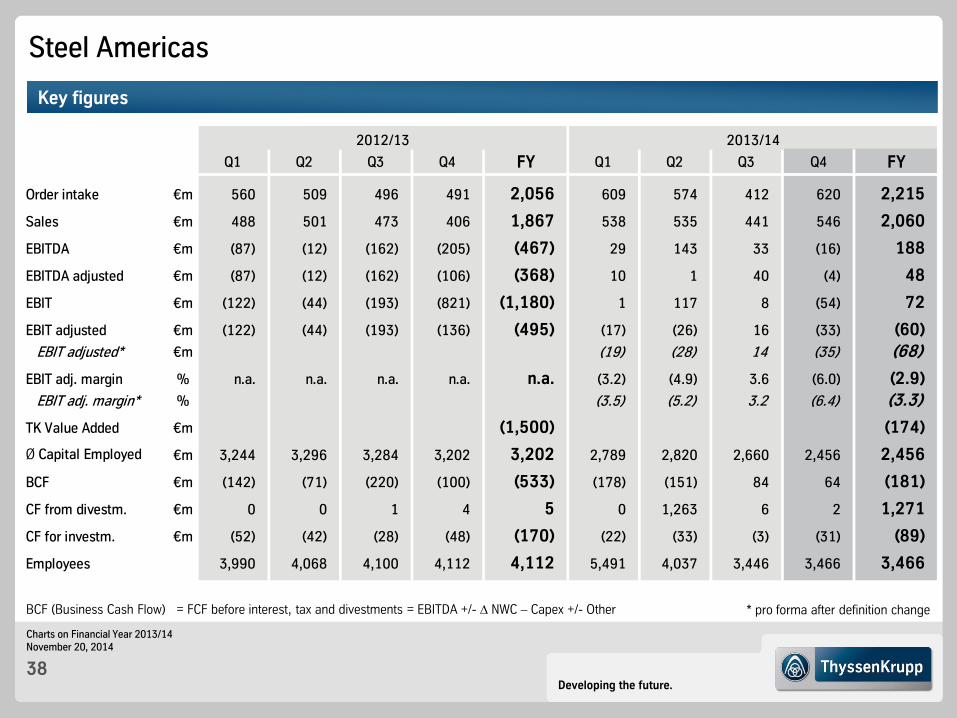
Steel Americas
Key figures
BCF (Business Cash Flow) = FCF before interest, tax and divestments = EBITDA +/- ∆ NWC – Capex +/- Other * pro forma after definition change
Q1 Q2 Q3 Q4 FY Q1 Q2 Q3 Q4 FY
Order intake €m 560 509 496 491 2,056 609 574 412 620 2,215
Sales €m 488 501 473 406 1,867 538 535 441 546 2,060
EBITDA €m (87) (12) (162) (205) (467) 29 143 33 (16) 188
EBITDA adjusted €m (87) (12) (162) (106) (368) 10 1 40 (4) 48
EBIT €m (122) (44) (193) (821) (1,180) 1 117 8 (54) 72
EBIT adjusted €m (122) (44) (193) (136) (495) (17) (26) 16 (33) (60) EBIT adjusted* €m (19) (28) 14 (35) (68)
EBIT adj. margin % n.a. n.a. n.a. n.a. n.a. (3.2) (4.9) 3.6 (6.0) (2.9) EBIT adj. margin* % (3.5) (5.2) 3.2 (6.4) (3.3)
TK Value Added €m (1,500) (174)
Ø Capital Employed €m 3,244 3,296 3,284 3,202 3,202 2,789 2,820 2,660 2,456 2,456
BCF €m (142) (71) (220) (100) (533) (178) (151) 84 64 (181)
CF from divestm. €m 0 0 1 4 5 0 1,263 6 2 1,271
CF for investm. €m (52) (42) (28) (48) (170) (22) (33) (3) (31) (89)
3,990 4,068 4,100 4,112 4,112 5,491 4,037 3,446 3,466 3,466
2013/14
Employees
2012/13
Charts on Financial Year 2013/14 November 20, 2014
39 Developing the future.
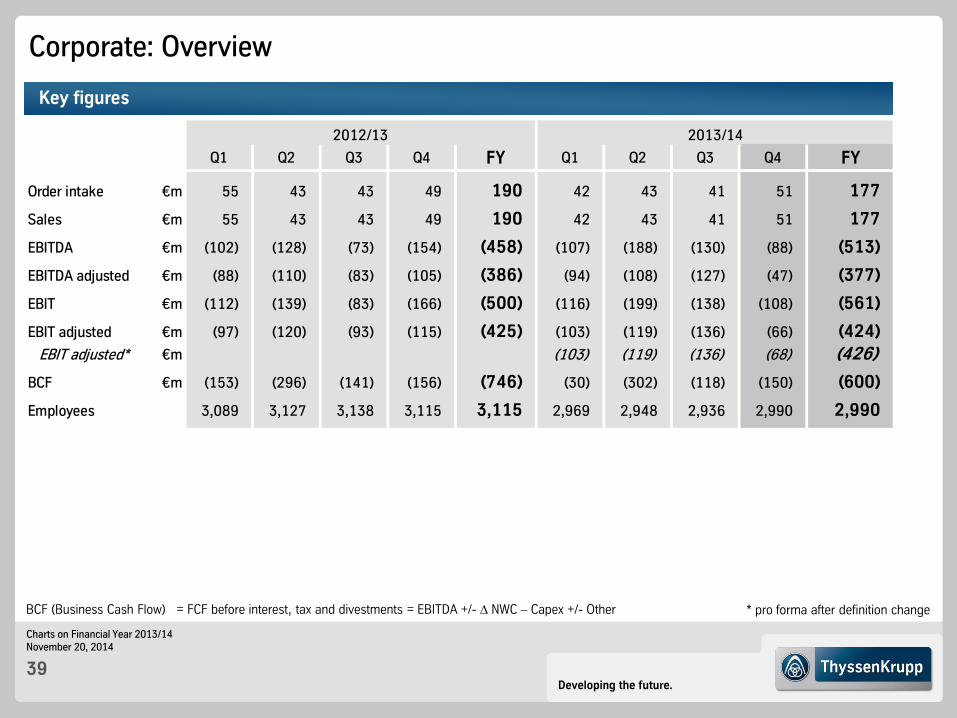
Corporate: Overview
Key figures
Q1 Q2 Q3 Q4 FY Q1 Q2 Q3 Q4 FY
Order intake €m 55 43 43 49 190 42 43 41 51 177
Sales €m 55 43 43 49 190 42 43 41 51 177
EBITDA €m (102) (128) (73) (154) (458) (107) (188) (130) (88) (513)
EBITDA adjusted €m (88) (110) (83) (105) (386) (94) (108) (127) (47) (377)
EBIT €m (112) (139) (83) (166) (500) (116) (199) (138) (108) (561)
EBIT adjusted €m (97) (120) (93) (115) (425) (103) (119) (136) (66) (424) EBIT adjusted* €m (103) (119) (136) (68) (426)
BCF €m (153) (296) (141) (156) (746) (30) (302) (118) (150) (600)
3,089 3,127 3,138 3,115 3,115 2,969 2,948 2,936 2,990 2,990
2013/14
Employees
2012/13
BCF (Business Cash Flow) = FCF before interest, tax and divestments = EBITDA +/- ∆ NWC – Capex +/- Other * pro forma after definition change

Charts on Financial Year 2013/14 November 20, 2014
40 Developing the future.
Business Area Overview – Quarterly Order Intake
million € Q1 Q2 Q3 Q4 FY Q1 Q2 Q3 Q4 FY
Components Technology 1,324 1,360 1,539 1,492 5,715 1,439 1,573 1,611 1,534 6,157
Elevator Technology 1,616 1,633 1,696 1,575 6,520 1,801 1,580 1,692 1,746 6,819
Industrial Solutions 2,002 1,595 779 907 5,283 2,295 1,188 1,035 1,213 5,732
Materials Services 2,765 2,988 3,047 2,863 11,663 2,842 3,414 3,700 3,725 13,682
Steel Europe 2,403 2,620 2,315 2,177 9,515 2,274 2,430 2,178 2,036 8,919
Steel Americas 560 509 496 491 2,056 609 574 412 620 2,215
Corporate 55 43 43 49 190 42 43 41 51 177
Consolidation (662) (635) (514) (495) (2,306) (631) (583) (508) (560) (2,285)
Continuing operations 10,063 10,113 9,401 9,059 38,636 10,671 10,220 10,161 10,364 41,416
Discontinued operations 1,138 0 0 0 1,138 0 0 0 0 0
Group (incl. disc. operations) 11,202 10,113 9,401 9,059 39,774 10,671 10,220 10,161 10,364 41,416
2012/13 2013/14

Charts on Financial Year 2013/14 November 20, 2014
41 Developing the future.
Business Area Overview – Quarterly Sales
million € Q1 Q2 Q3 Q4 FY Q1 Q2 Q3 Q4 FY
Components Technology 1,345 1,360 1,517 1,490 5,712 1,428 1,555 1,603 1,586 6,172
Elevator Technology 1,532 1,388 1,562 1,673 6,155 1,544 1,481 1,609 1,782 6,416
Industrial Solutions 1,306 1,428 1,306 1,602 5,641 1,288 1,593 1,585 1,805 6,271
Materials Services 2,815 2,923 3,056 2,906 11,700 2,739 3,320 3,780 3,821 13,660
Steel Europe 2,253 2,512 2,562 2,293 9,620 2,074 2,389 2,228 2,166 8,857
Steel Americas 488 501 473 406 1,867 538 535 441 546 2,060
Corporate 55 43 43 49 190 42 43 41 51 177
Consolidation (605) (615) (599) (509) (2,326) (544) (621) (545) (599) (2,309)
Continuing operations 9,189 9,540 9,920 9,910 38,559 9,109 10,295 10,742 11,158 41,304
Discontinued operations 1,223 0 0 0 1,223 0 0 0 0 0
Group (incl. disc. operations) 10,412 9,540 9,920 9,910 39,782 9,109 10,295 10,742 11,158 41,304
2012/13 2013/14

Charts on Financial Year 2013/14 November 20, 2014
42 Developing the future.
Business Area Overview – Quarterly EBITDA and Margin
million € Q1 Q2 Q3 Q4 FY Q1 Q2 Q3 Q4 FY
Components Technology 108 130 145 95 478 120 136 135 123 514% 8.0 9.6 9.6 6.4 8.4 8.4 8.7 8.4 7.8 8.3Elevator Technology 190 159 179 176 703 152 177 204 109 642% 12.4 11.5 11.5 10.5 11.4 9.8 11.9 12.7 6.1 10.0Industrial Solutions 155 210 174 179 718 186 211 204 200 801% 11.9 14.7 13.3 11.2 12.7 14.4 13.2 12.9 11.1 12.8Materials Services 59 (134) 87 85 96 62 66 88 24 239% 2.1 (4.6) 2.8 2.9 0.8 2.3 2.0 2.3 0.6 1.7Steel Europe 142 98 119 154 512 126 158 192 117 592% 6.3 3.9 4.6 6.7 5.3 6.1 6.6 8.6 5.4 6.7Steel Americas (87) (12) (162) (205) (467) 29 143 33 (16) 188% n.a. n.a. n.a. n.a. n.a. 5.4 26.7 7.4 (2.9) 9.1Corporate (102) (128) (73) (154) (458) (107) (188) (130) (88) (513)Consolidation (96) (97) (114) (126) (428) (100) (105) (98) (75) (375)
Continuing operations 369 226 355 204 1,154 468 598 628 394 2,088% 4.0 2.4 3.6 2.1 3.0 5.1 5.8 5.8 3.5 5.1Discontinued operations 73 (2) 1 (14) 58 187 (2) 0 1 186
Group (incl. disc. operations) 443 223 356 190 1,212 655 596 628 395 2,274% 4.3 2.3 3.6 1.9 3.0 7.2 5.8 5.8 3.5 5.5
2012/13 2013/14
Charts on Financial Year 2013/14 November 20, 2014
43 Developing the future.
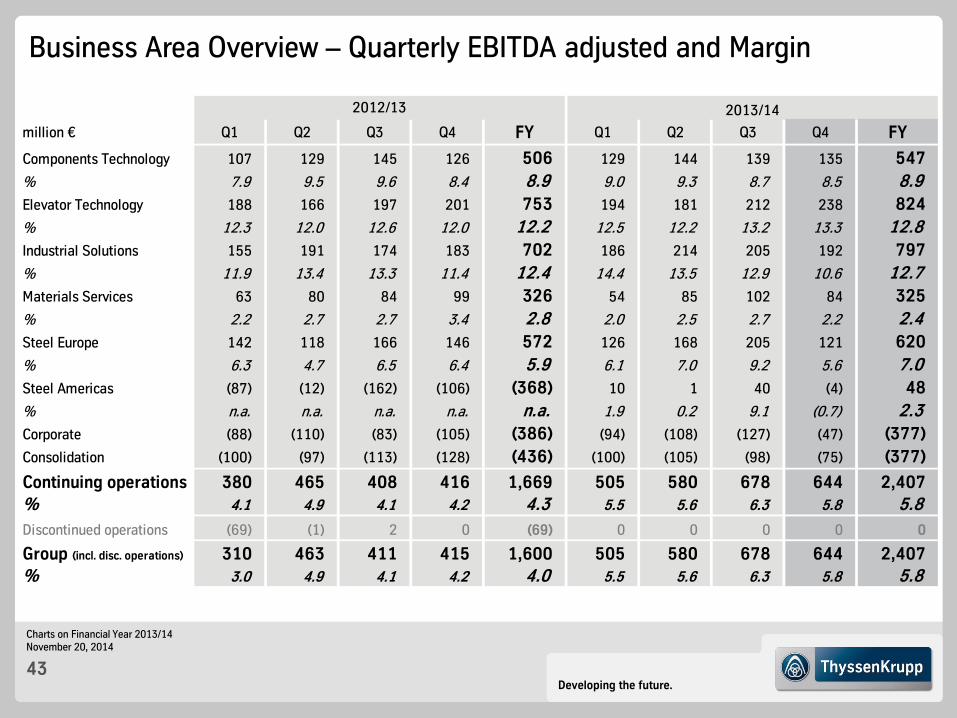
Business Area Overview – Quarterly EBITDA adjusted and Margin
million € Q1 Q2 Q3 Q4 FY Q1 Q2 Q3 Q4 FY
Components Technology 107 129 145 126 506 129 144 139 135 547% 7.9 9.5 9.6 8.4 8.9 9.0 9.3 8.7 8.5 8.9Elevator Technology 188 166 197 201 753 194 181 212 238 824% 12.3 12.0 12.6 12.0 12.2 12.5 12.2 13.2 13.3 12.8Industrial Solutions 155 191 174 183 702 186 214 205 192 797% 11.9 13.4 13.3 11.4 12.4 14.4 13.5 12.9 10.6 12.7Materials Services 63 80 84 99 326 54 85 102 84 325% 2.2 2.7 2.7 3.4 2.8 2.0 2.5 2.7 2.2 2.4Steel Europe 142 118 166 146 572 126 168 205 121 620% 6.3 4.7 6.5 6.4 5.9 6.1 7.0 9.2 5.6 7.0Steel Americas (87) (12) (162) (106) (368) 10 1 40 (4) 48% n.a. n.a. n.a. n.a. n.a. 1.9 0.2 9.1 (0.7) 2.3Corporate (88) (110) (83) (105) (386) (94) (108) (127) (47) (377)Consolidation (100) (97) (113) (128) (436) (100) (105) (98) (75) (377)
Continuing operations 380 465 408 416 1,669 505 580 678 644 2,407% 4.1 4.9 4.1 4.2 4.3 5.5 5.6 6.3 5.8 5.8Discontinued operations (69) (1) 2 0 (69) 0 0 0 0 0
Group (incl. disc. operations) 310 463 411 415 1,600 505 580 678 644 2,407% 3.0 4.9 4.1 4.2 4.0 5.5 5.6 6.3 5.8 5.8
2012/13 2013/14

Charts on Financial Year 2013/14 November 20, 2014
44 Developing the future.
Business Area Overview – Quarterly EBIT and Margin
* From Q1 2012/13 excluding regular depreciation for Steel USA (closing Feb 26, 2014)
million € Q1 Q2 Q3 Q4 FY Q1 Q2 Q3 Q4 FY
Components Technology 42 64 43 20 168 55 67 65 48 235% 3.1 4.7 2.8 1.3 2.9 3.8 4.3 4.1 3.0 3.8Elevator Technology 171 133 155 153 611 133 159 184 80 556% 11.2 9.6 9.9 9.1 9.9 8.6 10.7 11.4 4.5 8.7Industrial Solutions 141 198 157 162 658 173 195 190 182 740% 10.8 13.9 12.0 10.1 11.7 13.4 12.2 12.0 10.1 11.8Materials Services 36 (157) 51 64 (6) 43 37 44 (24) 100% 1.3 (5.4) 1.7 2.2 (0.1) 1.6 1.1 1.2 (0.6) 0.7Steel Europe 29 (10) 14 28 62 20 52 92 28 192% 1.3 (0.4) 0.5 1.2 0.6 1.0 2.2 4.1 1.3 2.2Steel Americas* (122) (44) (193) (821) (1,180) 1 117 8 (54) 72% n.a. n.a. n.a. n.a. n.a. 0.2 21.8 1.8 (9.9) 3.5Corporate (112) (139) (83) (166) (500) (116) (199) (138) (108) (561)Consolidation (91) (97) (111) (124) (421) (99) (101) (96) (73) (369)
Continuing operations* 94 (52) 33 (684) (608) 210 327 349 79 965% 1.0 (0.5) 0.3 (6.9) (1.6) 2.3 3.2 3.2 0.7 2.3Discontinued operations 72 (2) 0 (13) 56 187 (3) (1) 2 186
Group* (incl. disc. operations) 166 (53) 33 (698) (552) 397 325 348 81 1,151% 1.6 (0.6) 0.3 (7.0) (1.4) 4.4 3.2 3.2 0.7 2.8
2012/13 2013/14

Charts on Financial Year 2013/14 November 20, 2014
45 Developing the future.
Business Area Overview – Quarterly EBIT adjusted and Margin
* From Q1 2012/13 excluding regular depreciation for Steel USA (closing Feb 26, 2014)
million € Q1 Q2 Q3 Q4 FY Q1 Q2 Q3 Q4 FY
Components Technology 41 62 80 57 240 63 75 70 61 269% 3.0 4.6 5.3 3.8 4.2 4.4 4.8 4.4 3.8 4.4Elevator Technology 169 146 172 188 675 175 163 193 220 751% 11.0 10.5 11.0 11.2 11.0 11.3 11.0 12.0 12.3 11.7Industrial Solutions 140 180 156 164 640 173 199 190 176 738% 10.7 12.6 11.9 10.2 11.3 13.4 12.5 12.0 9.8 11.8Materials Services 40 58 62 76 236 34 56 58 65 213% 1.4 2.0 2.0 2.6 2.0 1.2 1.7 1.5 1.7 1.6Steel Europe 30 9 62 42 143 19 62 103 32 216% 1.3 0.4 2.4 1.8 1.5 0.9 2.6 4.6 1.5 2.4Steel Americas* (122) (44) (193) (136) (495) (17) (26) 16 (33) (60)% n.a. n.a. n.a. n.a. n.a. (3.2) (4.9) 3.6 (6.0) (2.9)Corporate (97) (120) (93) (115) (425) (103) (119) (136) (66) (424)Consolidation (97) (98) (110) (123) (428) (98) (101) (96) (75) (370)
Continuing operations* 104 193 136 153 586 246 309 398 380 1,333% 1.1 2.0 1.4 1.5 1.5 2.7 3.0 3.7 3.4 3.2Discontinued operations (69) (1) 2 0 (69) 0 0 0 0 0
Group* (incl. disc. operations) 35 191 139 152 517 246 309 398 380 1,333% 0.3 2.0 1.4 1.5 1.3 2.7 3.0 3.7 3.4 3.2
2012/13 2013/14

Charts on Financial Year 2013/14 November 20, 2014
46 Developing the future.
Business Area Overview (I)
FY 2012/13
FY2013/14
FY2012/13
FY2013/14
FY2012/13
FY2013/14
Components Technology 5,715 6,157 5,712 6,172 27,737 28,941
Elevator Technology 6,520 6,819 6,155 6,416 49,112 50,282
Industrial Solutions 5,283 5,732 5,641 6,271 18,841 18,546
Materials Services 11,663 13,682 11,700 13,660 26,978 30,289
Steel Europe 9,515 8,919 9,620 8,857 26,961 26,231
Steel Americas 2,056 2,215 1,867 2,060 4,112 3,466
Corporate 190 177 190 177 3,115 2,990
Consolidation (2,306) (2,285) (2,326) (2,309) 0 0
Continued operations 38,636 41,416 38,559 41,304 156,856 160,745
Stainless Global (disc. operation) 1,138 0 1,223 0 0 0
Group (incl. disc. operations) 39,774 41,416 39,782 41,304 156,856 160,745
Order Intake (€m) Sales (€m) Employees

Charts on Financial Year 2013/14 November 20, 2014
47 Developing the future.
Business Area Overview (II)
FY2012/13
FY2013/14
FY2012/13
FY2013/14
FY2012/13
FY2013/14
FY2013/14*
Components Technology 478 514 168 235 240 269 268
Elevator Technology 703 642 611 556 675 751 674
Industrial Solutions 718 801 658 740 640 738 420
Materials Services 96 239 (6) 100 236 213 212
Steel Europe 512 592 62 192 143 216 206
Steel Americas (467) 188 (1,180) 72 (495) (60) (68)
Corporate (458) (513) (500) (561) (425) (424) (426)
Consolidation (428) (375) (421) (369) (428) (370) 28
Continued operations 1,154 2,088 (608) 965 586 1,333 1,314
Stainless Global (disc. operation) 58 186 56 186 (69) 0 0
Group (incl. disc. operations) 1,212 2,274 (552) 1,151 517 1,333 1,314
EBITDA (€m) EBIT (€m) EBIT adjusted (€m)
* pro forma after definition change

Charts on Financial Year 2013/14 November 20, 2014
48 Developing the future.
Special Items Business Area(million €) Q1 Q2 Q3 Q4 FY Q1 Q2 Q3 Q4 FY
Disposal effect 3 1 4 2 2Impairment (37) (7) (44)Restructuring 1 (1) (2) (30) (32) (7) (4) (14) (25)Others (1) (8) (1) (1) (11)Disposal effect (1) 1Impairment 1 (4) (11) (14) (11) (11)Restructuring (9) (17) (23) (49) (41) (4) (9) (57) (111)Others 1 (2) (1) (73) (73)Disposal effect 17 17Impairment 2 2 (2) (2)Restructuring 1 (10) (9) (4) (6) (10)Others 18 1 6 25 (3) (3)Disposal effect (4) 8 (3) 1 10 1 11Impairment (14) 2 (12) (28) (28)Restructuring (3) (3) (8) (14) (17) 2 (46) (61)Others (1) (211) (2) (3) (217) (1) (2) (16) (16) (35)Disposal effect (1) 110 110Impairment (22) (22) 1 1 1 3Restructuring (20) (37) (71) (128) (14) (9) (4) (27)Others (10) (31) (41) 3 (3) 0Disposal effect (5) (5) 141 141Impairment (586) (586) (9) (9)Others (94) (94) 18 2 (8) (12) 0Disposal effect (1) (7) (8) (11) (77) 2 (35) (122)Impairment (1) (2) (3) (1) (1)Restructuring (1) (37) (38) (2) (3) (4) (4) (12)Others (15) (19) 12 (5) (27) (1) (2) (2)
Consolidation 6 (1) 1 7 1 1
Continuing operations (10) (245) (103) (836) (1,194) (36) 18 (49) (301) (368)
Discontinued operations 141 0 (2) (14) 125 187 (2) (1) 2 186
Group (incl. discontinued operations) 131 (244) (105) (850) (1,069) 151 16 (50) (299) (182)
SE
AM
Cor
p.C
TM
XIS
ET
2012/13 2013/14

Charts on Financial Year 2013/14 November 20, 2014
49 Developing the future.
ThyssenKrupp-specific Key Figures (I): Reconciliation of EBIT Q4 2013/14
P&L Structure Net sales 11,158
- Cost of sales 1) (9,626)
- SG&A 1), R&D (1,401)
+/- Other income/expense 6
+/- Other gains/losses (67)
= Income from operations 70
+/- Income from companies using equity method 12
+/- Finance income/expense (141) incl. capitalized interest exp. of €(4) m
= EBT (59)
EBIT definition Net sales 11,158
- Cost of sales 1) (9,626)
- SG&A 1), R&D (1,401)
+/- Other income/expense 6
+/- Other gains/losses (67)
+/- Income from companies using equity method 12
+ Adjustm. for depreciation on cap. interest 5
+/- Adjustm. for oper. items in fin. income/expense (8)
= EBIT 79
+/- Finance income/expense (141) incl. capitalized interest exp. of €(4) m
- Depreciation on capitalized interest (5)
+/- Operating items in fin. income/expense 8
= EBT (59)
1) incl. depreciation on capitalized interest expenses of €(5) m

Charts on Financial Year 2013/14 November 20, 2014
50 Developing the future.
ThyssenKrupp-specific Key Figures (II): Reconciliation of EBIT FY 2013/14
P&L Structure Net sales 41,304
- Cost of sales 1) (35,138)
- SG&A 1), R&D (5,325)
+/- Other income/expense 34
+/- Other gains/losses 242
= Income from operations 1,117
+/- Income from companies using equity method 4
+/- Finance income/expense (879) incl. capitalized interest exp. of €(15) m
= EBT 242
EBIT definition Net sales 41,304
- Cost of sales 1) (35,138)
- SG&A 1), R&D (5,325)
+/- Other income/expense 34
+/- Other gains/losses 242
+/- Income from companies using equity method 4
+ Adjustm. for depreciation on cap. interest 20
+/- Adjustm. for oper. items in fin. income/expense (176)
= EBIT 965
+/- Finance income/expense (879) incl. capitalized interest exp. of €(15) m
- Depreciation on capitalized interest (20)
+/- Operating items in fin. income/expense 176
= EBT 242
1) incl. depreciation on capitalized interest expenses of €(20) m

Charts on Financial Year 2013/14 November 20, 2014
51 Developing the future.
Disclaimer ThyssenKrupp AG
“The information set forth and included in this presentation is not provided in connection with an offer or solicitation for the purchase or sale of a security and is intended for informational purposes only.
This presentation contains forward-looking statements that are subject to risks and uncertainties. Statements contained herein that are not statements of historical fact may be deemed to be forward-looking information. When we use words such as “plan,” “believe,” “expect,” “anticipate,” “intend,” “estimate,” “may” or similar expressions, we are making forward-looking statements. You should not rely on forward-looking statements because they are subject to a number of assumptions concerning future events, and are subject to a number of uncertainties and other factors, many of which are outside of our control, that could cause actual results to differ materially from those indicated. These factors include, but are not limited to, the following: (i) market risks: principally economic price and volume developments, (ii) dependence on performance of major customers and industries, (iii) our level of debt, management of interest rate risk and hedging against commodity price risks; (iv) costs associated with, and regulation relating to, our pension liabilities and healthcare measures, (v) environmental protection and remediation of real estate and associated with rising standards for real estate environmental protection, (vi) volatility of steel prices and dependence on the automotive industry, (vii) availability of raw materials; (viii) inflation, interest rate levels and fluctuations in exchange rates; (ix) general economic, political and business conditions and existing and future governmental regulation; and (x) the effects of competition. Please note that we disclaim any intention or obligation to update or revise any forward-looking statements whether as a result of new information, future events or otherwise.”