dr. jerry shurson department of animal science … fat content ranges from 5 to 13% most reduced oil...
TRANSCRIPT

Dr. Jerry Shurson
Department of Animal Science
University of Minnesota
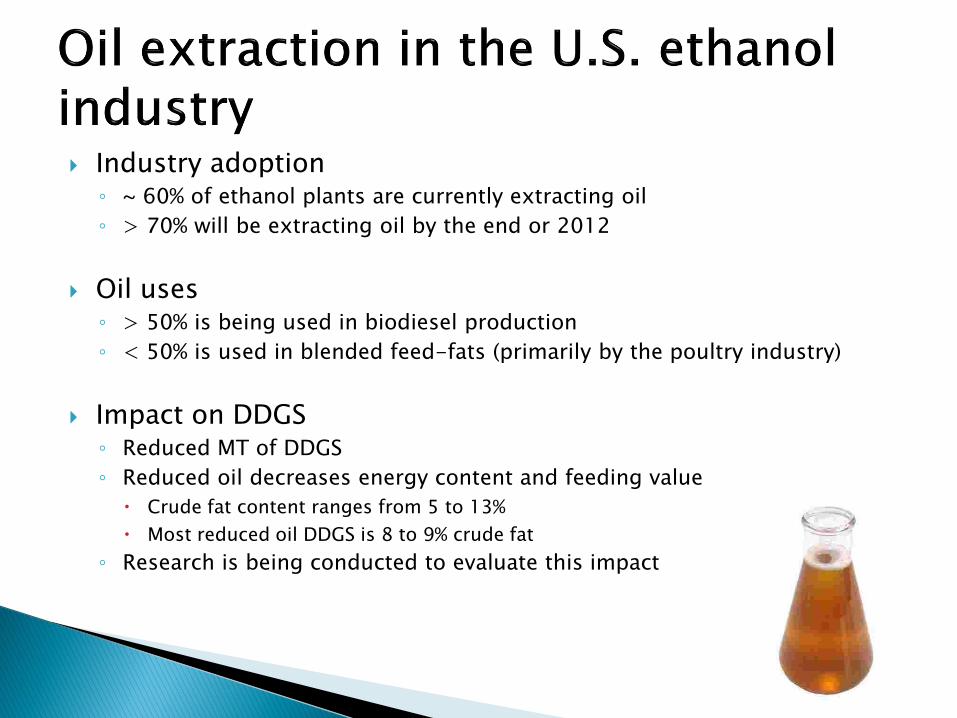
Industry adoption ◦ ~ 60% of ethanol plants are currently extracting oil
◦ > 70% will be extracting oil by the end or 2012
Oil uses ◦ > 50% is being used in biodiesel production
◦ < 50% is used in blended feed-fats (primarily by the poultry industry)
Impact on DDGS ◦ Reduced MT of DDGS
◦ Reduced oil decreases energy content and feeding value
Crude fat content ranges from 5 to 13%
Most reduced oil DDGS is 8 to 9% crude fat
◦ Research is being conducted to evaluate this impact
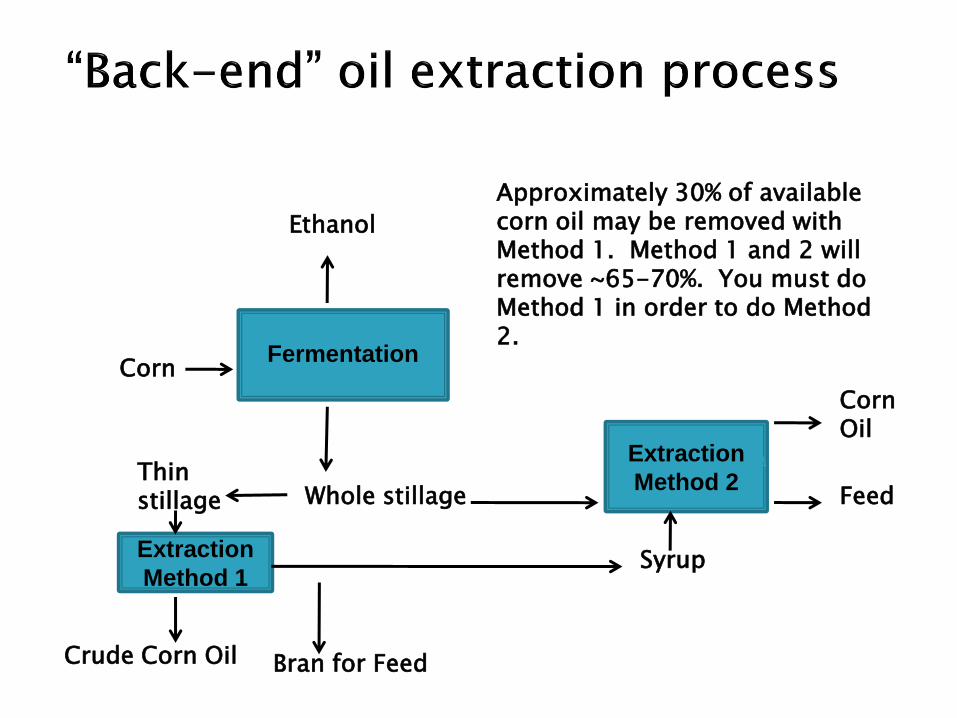
Corn Fermentation
Extraction
Method 1
Extraction
Method 2
Ethanol
Thin stillage
Bran for Feed
Corn Oil
Syrup
Crude Corn Oil
Feed Whole stillage
Approximately 30% of available corn oil may be removed with Method 1. Method 1 and 2 will remove ~65-70%. You must do Method 1 in order to do Method 2.

Spiehs et al. (2002)

0
1000
2000
3000
4000
5000
6000
1 2 3 4 5 6 7 8 9 10 11 12 13 14 15 16 17 18 19 20 21 22 23 24 25 26 27 28 29 30
kcal/
kg D
M
Sample Number
GE adjDE adjME
Note: DE and ME of DDGS within experiment were ‘adjusted’ relative to the DE and ME content of the corn basal diet Source: Stein et al. (2006) [10], Pedersen et al. (2007) [10], Stein et al. (2009) [4], Anderson et al. (2012) [6]

Different processes used in DDGS production
Variable fat levels among sources
Variable carbohydrate composition and digestibility
Particle size varies from 200 to >1200 microns
Experimental and analytical methods used

%NDF = 48.12 - (1.035 x %EE)
R² = 0.05
%CP = 32.08 - (0.116 x %EE)
R² = 0.01
%Ash = 3.64 + (0.080 x %EE)
R² = 0.01
0.01GE = 52.89 + (0.129 x %EE)
R² = 0.03
0
10
20
30
40
50
60
0 2 4 6 8 10 12 14 16
Perc
ent
or
1/1
00
GE, D
M b
asis
%EE in DDGS, DM basis
NDF CP Ash 1/100 GE
Summary of published DDGS composition data from the scientific literature

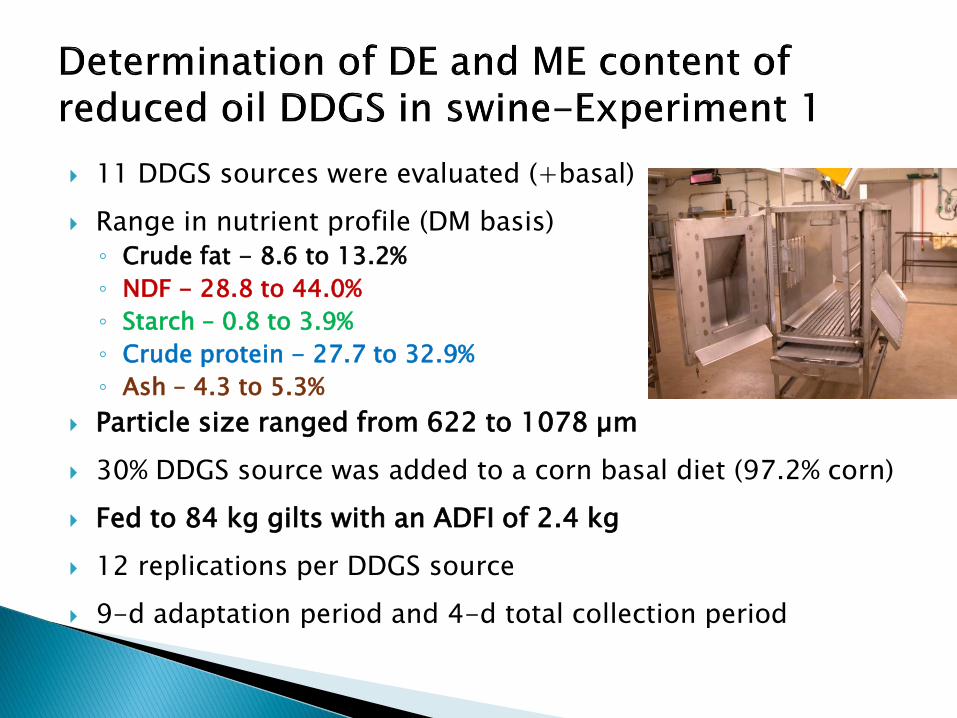
11 DDGS sources were evaluated (+basal)
Range in nutrient profile (DM basis)
◦ Crude fat - 8.6 to 13.2%
◦ NDF - 28.8 to 44.0%
◦ Starch – 0.8 to 3.9%
◦ Crude protein - 27.7 to 32.9%
◦ Ash – 4.3 to 5.3%
Particle size ranged from 622 to 1078 µm
30% DDGS source was added to a corn basal diet (97.2% corn)
Fed to 84 kg gilts with an ADFI of 2.4 kg
12 replications per DDGS source
9-d adaptation period and 4-d total collection period
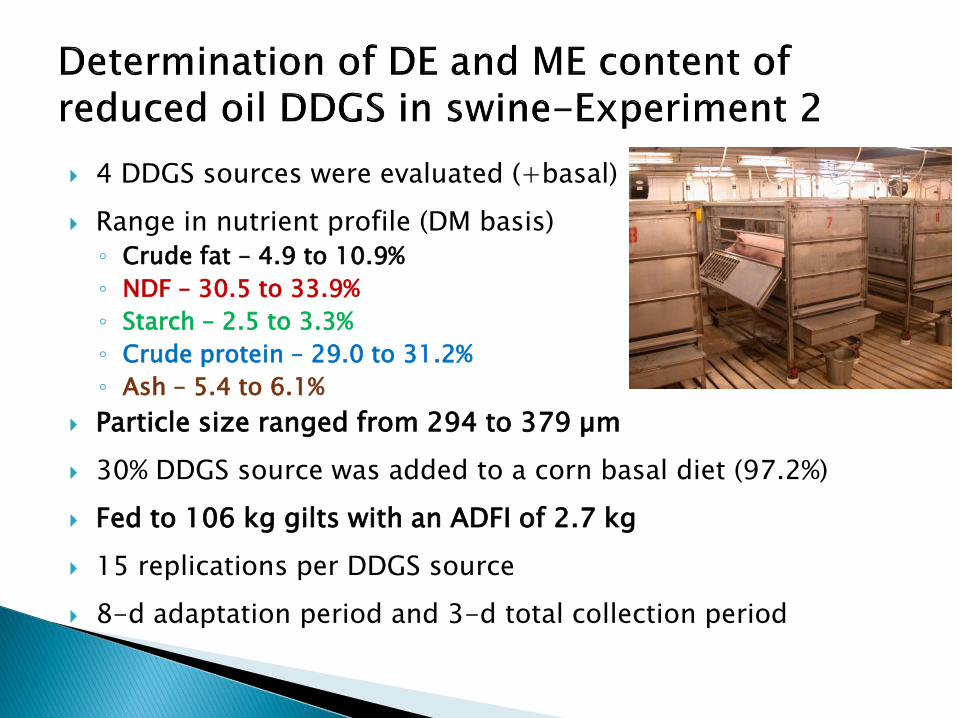
4 DDGS sources were evaluated (+basal)
Range in nutrient profile (DM basis)
◦ Crude fat – 4.9 to 10.9%
◦ NDF – 30.5 to 33.9%
◦ Starch – 2.5 to 3.3%
◦ Crude protein – 29.0 to 31.2%
◦ Ash – 5.4 to 6.1%
Particle size ranged from 294 to 379 µm
30% DDGS source was added to a corn basal diet (97.2%)
Fed to 106 kg gilts with an ADFI of 2.7 kg
15 replications per DDGS source
8-d adaptation period and 3-d total collection period

GE, 0.01 kcal/kg = 45.53 + (0.4563 x %EE)
R² = 0.87
%CP = 31.92 - (0.14 x %EE)
R² = 0.06
%TDF = 36.39 - (0.23 x %EE)
R² = 0.07
%NDF = 26.70 + (0.89 x %EE)
R² = 0.26
%Ash = 6.65 - (0.16 x %EE)
R² = 0.50 0
10
20
30
40
50
60
0 2 4 6 8 10 12 14
Perc
enta
ge o
r 1
/1
00
GE
%EE in DDGS, DM basis
GE CP-M TDF NDF-M Ash

DDGS Source
ME, kcal/kg
Crude fat, %
NDF, % Crude protein, %
Starch, %
Ash, %
8 3,603 13.2 34.0 30.6 1.3 5.3
11 3,553 11.8 38.9 32.1 1.1 4.9
9 3,550 9.7 28.8 29.8 2.8 5.0
6 3,513 9.6 33.0 30.1 3.4 4.9
7 3,423 10.1 38.2 30.3 2.2 5.0
2 3,400 11.1 36.5 29.7 3.9 4.3
4 3,362 8.6 35.7 32.9 0.8 5.1
3 3,360 10.8 38.6 29.7 1.6 4.6
10 3,327 10.0 35.9 32.7 1.0 5.3
1 3,302 11.2 44.0 27.7 1.8 4.4
5 3,277 11.1 39.7 31.6 0.9 5.0
Green = highest value
Red = lowest value

DDGS Source DDGS Source 11
DDGS Source 9
DDGS Source 8
DDGS Source 5
ME, kcal/kg 3,553 3,550 3,603 3,277
Crude fat, % 11.8 9.7 13.2 11.1
Starch, % 1.1 2.8 1.3 0.9
NDF, % 38.9 28.8 34.0 39.7
Crude protein, % 32.1 29.8 30.6 31.6
Ash, % 4.9 5.0 5.3 5.0
Comparing DDGS Source 11 vs. 9:
2.1 percentage unit decrease in fat reduced ME by 3 kcal/kg
Comparing DDGS Source 8 vs. 5:
2.1 percentage unit decrease in fat reduced ME by 326 kcal/kg

DE, kcal/kg DM = 3414 + (20.72 x %EE)
R² = 0.05
ME, kcal/kg DM = 3103 + (30.28 x %EE)
R² = 0.11
2000
2500
3000
3500
4000
4500
5000
0 2 4 6 8 10 12 14
DE o
r M
E, kcal/
kg D
M
%EE in DDGS, DM basis
DE ME
DE, kcal/kg DM = 3461 + (31.832 x %EE)
R² = 0.22
ME, kcal/kg DM = 3130 + (46.23 x %EE)
R² = 0.32
2000
2500
3000
3500
4000
4500
5000
0 2 4 6 8 10 12 14
DE o
r M
E, kcal/
kg D
M
%EE in DDGS, DM basis
DE ME
Experiment 1
Experiment 2

DDGS ME Prediction Equations from Anderson et al. (2012)
(1) ME kcal/kg DM = (0.90 × GE, kcal/kg) − (29.95 × % TDF)
r2 = 0.72 (2) ME kcal/kg DM = (0.94 × GE, kcal/kg) − (23.45 × % NDF) − (70.23 × % Ash) r2 = 0.68
◦ Dehulled, degermed corn ◦ Dried solubles ◦ Oil ◦ Starch ◦ Germ meal (2) ◦ DDGS (7) ◦ Gluten meal ◦ HP-DDG (3) ◦ Bran (2) ◦ Gluten feed


Equation 1 r = 0.60
Equation 2 r = 0.60

A percentage unit reduction in crude fat DOES NOT accurately estimate the change in DE and ME in reduced oil-DDGS
Accurate assessment of fiber content continues to be a challenge in DDGS
There is considerable variation in chemical composition measurements among laboratories which affects ME prediction
Recommended swine ME prediction equations for reduced-oil DDGS:
◦ ME kcal/kg DM = (0.90 × GE, kcal/kg) − (29.95 × % TDF)
◦ ME kcal/kg DM = (0.94 × GE, kcal/kg) − (23.45 × % NDF) − (70.23 × % Ash)
◦ ME kcal/kg DM = 4,548 – (49.7 x % TDF) + (52.1 x % EE)
◦ ME kcal/kg DM = 3,711 – (21.9 x % NDF) + (48.7 x % EE)
◦ ME kcal/kg DM = 4,132 – (57.0 x % ADF)

Equations containing GE and TDF are most predictive
◦ GE and TDF values are more difficult to obtain from commercial laboratories
If GE cannot be directly determined, the following GE prediction equations can be used:
◦ GE kcal/kg DM = 4,195 + (21.26 × crude protein) + (48.27 × crude fat)
◦ GE kcal/kg DM = 4,597 + (64.45 × % crude fat) – (52.65 × % Ash)
◦ GE kcal/kg DM = 4,529 + (54.21 × % crude fat)

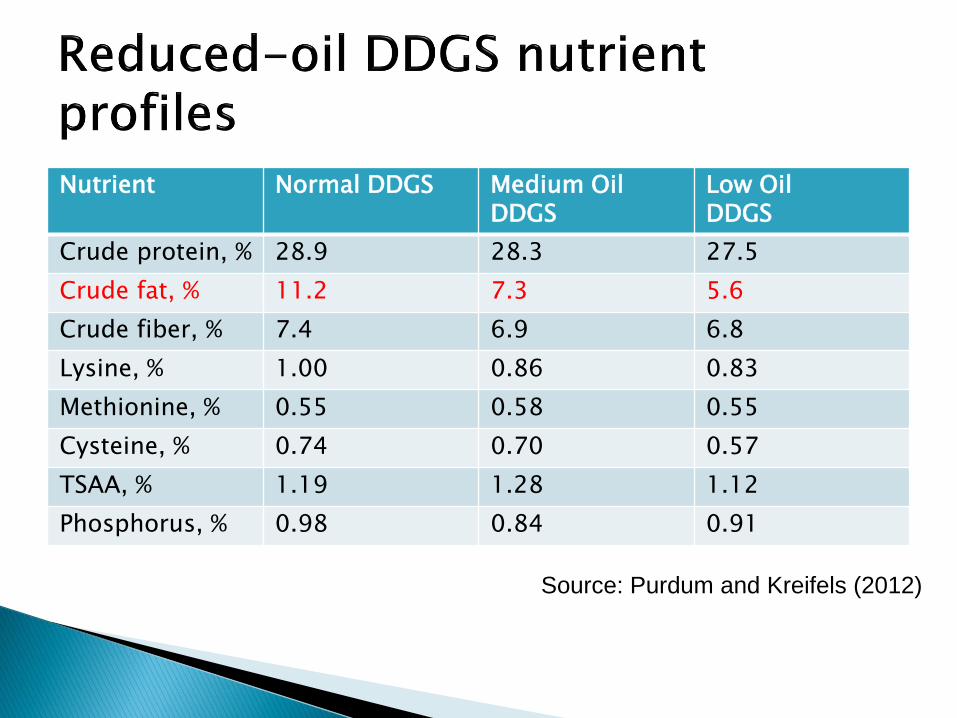
Nutrient Normal DDGS Medium Oil DDGS
Low Oil DDGS
Crude protein, % 28.9 28.3 27.5
Crude fat, % 11.2 7.3 5.6
Crude fiber, % 7.4 6.9 6.8
Lysine, % 1.00 0.86 0.83
Methionine, % 0.55 0.58 0.55
Cysteine, % 0.74 0.70 0.57
TSAA, % 1.19 1.28 1.12
Phosphorus, % 0.98 0.84 0.91
Source: Purdum and Kreifels (2012)

Ingredient Control (0% DDGS) Reduced-oil DDGS Diets
Corn 55.7 45.9
Soybean meal (47%) 29.5 19.1
DDGS 0.0 20.0
Corn oil 2.83 3.02
Limestone 9.62 9.92
Dicalcium phosphate 1.58 1.21
Salt 0.42 0.32
L-lysine 0.03 0.21
dl-methionine 0.17 0.16
VTM premix 0.20 0.20
Calculated M.E. (kcal/kg) 2,860 2,860
Protein, % 18.0 18.0
No ME adjustments were made for medium
and low oil DDGS diets.
Source: Purdum and Kreifels (2012)

Diet Dietary GE, kcal/kg GE intake, kcal/hen/d
Control 3,780 392
Normal DDGS 3,958 410
Medium Oil DDGS 3,917 414
Low Oil DDGS 3,806 404
Source: Purdum and Kreifels (2012)

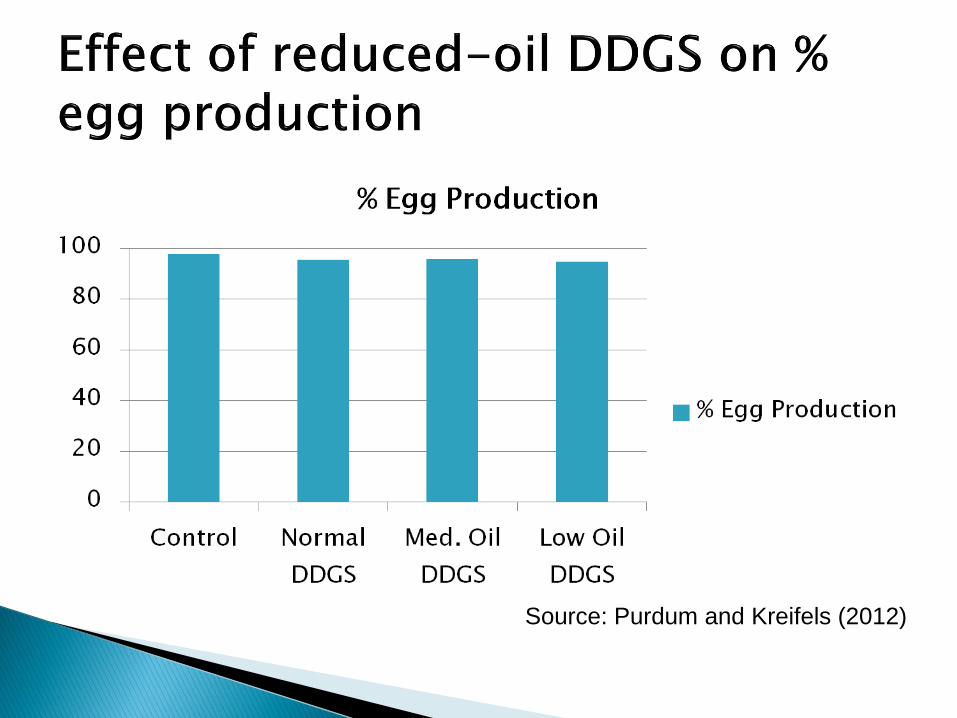
Source: Purdum and Kreifels (2012)
Source: Purdum and Kreifels (2012)
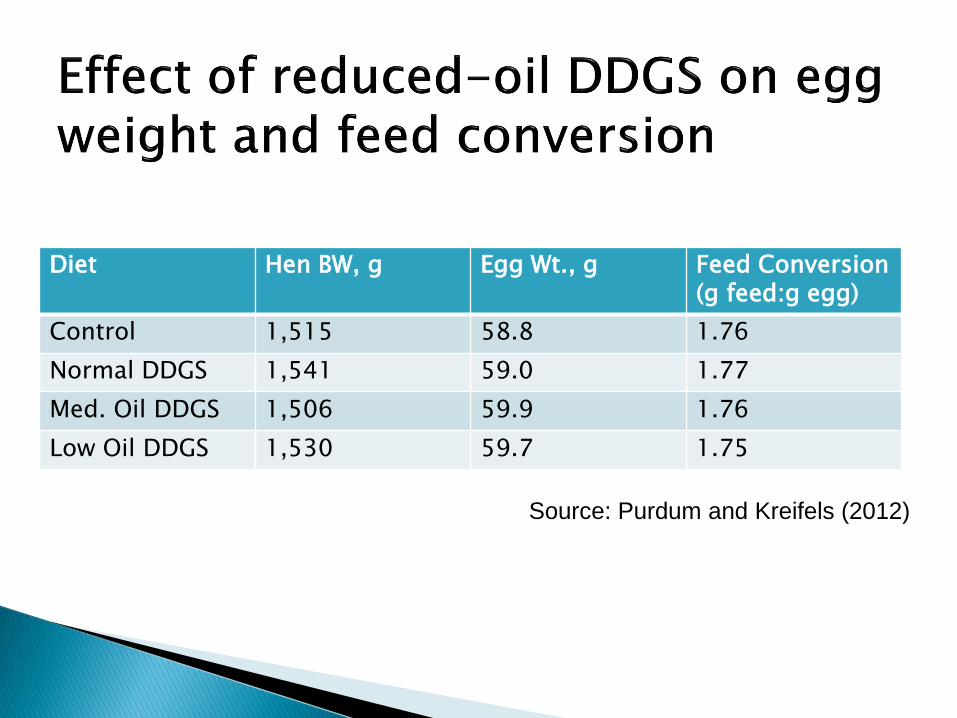
Diet Hen BW, g Egg Wt., g Feed Conversion (g feed:g egg)
Control 1,515 58.8 1.76
Normal DDGS 1,541 59.0 1.77
Med. Oil DDGS 1,506 59.9 1.76
Low Oil DDGS 1,530 59.7 1.75
Source: Purdum and Kreifels (2012)

Source: Purdum and Kreifels (2012)

Reduced-oil DDGS provides equivalent layer performance to “typical” DDGS.
Hens slightly increase feed intake (2 to 2.4 g/d) when fed reduced-oil DDGS diets.
Layers will be impacted less than broilers when fed reduced-oil DDGS because of lower diet ME requirements.
AMEn of reduced-oil DDGS can be estimated by using the following equation:
◦ AMEn (kcal/kg DM) = 3,517 – (33.27 x % hemicellulose) +
(46.02 x % crude fat) – (82.47 x % ash) Rochelle et al. (2011)
◦ Hemicellulose can be calculated by % NDF - % ADF

No differences among treatments
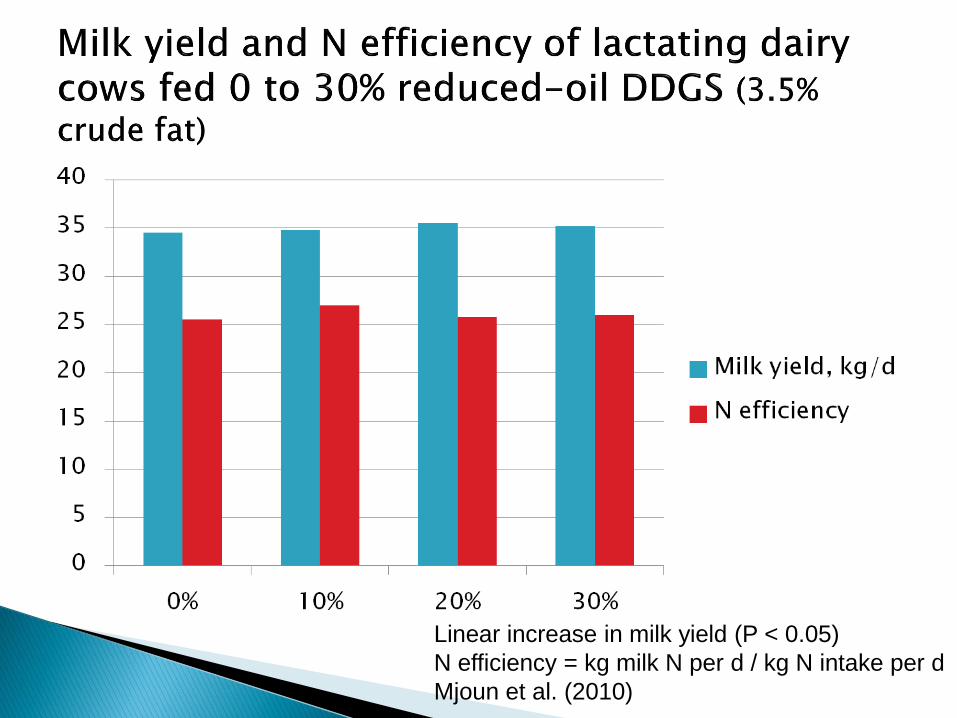
Linear increase in milk yield (P < 0.05)
N efficiency = kg milk N per d / kg N intake per d
Mjoun et al. (2010)

Linear increase (P < 0.06)
Milk prod. efficiency = energy-corrected milk / DMI
Mjoun et al. (2010)

Linear increase in milk fat % and fat yield (P < 0.05)
Mjoun et al. (2010)

Quadratic effect on milk protein % (P < 0.02)
Mjoun et al. (2010)

Linear increase in milk total solids % and yield (P < 0.05)
Mjoun et al. (2010)

Feeding diets containing up to 30% reduced-oil DDGS (3.5% crude fat): ◦ Had no effect on: Dry matter intake
Crude protein intake
Nitrogen efficiency
Milk yield
◦ Increased: Milk production efficiency
Milk fat % and milk fat yield
Milk protein % (quadratically)
Milk total solids %


Corn DDGS (6.7% crude fat)
DDGS (12.9% crude fat)
Initial BW, kg 403 402 402
Final BW, kg 587a 587a 604b
DMI, kg/day 11.1 11.1 11.1
ADG, kg 1.55a 1.55a 1.68b
Feed:Gain 7.19 7.19 6.58
HCW, kg 370a 370a 380a
12th rib fat, mm 11.9 13.2 13.5
Loin muscle area, cm2 864 832 845
Marbling score 614 591 617
a,bMeans with different superscripts are different (P < 0.05).
Source: University of Nebraska (Gigax et al., 2011).
For each one percentage point decrease in DDGS oil content, NEg decreases 1.3%

Feeding reduced-oil DDGS (6.7% crude fat): ◦ Provides equal growth performance and carcass
quality compared to corn
◦ Reduces growth performance compared to “typical” DDGS (12.9% crude fat)
◦ NEg content of reduced-oil DDGS can be estimated for beef cattle based on:
Each one percentage point decrease in DDGS oil content decreases NEg by 1.3%
