dr. matthew wall. political campaigns, week 3. the functions of outcome estimates in electoral...
TRANSCRIPT
Forecasts, polls, and betting markets
Dr. Matthew Wall. Political Campaigns, week 3
The functions of outcome estimates in electoral democracies and political campaigns.
The evolution of polling and forecasting. New developments and sources of
information. The reliability of our predictions. The effects of polls on political campaigns.
Topics address in today’s talk
The human predicament: ‘It’s tough to make predictions, especially about the future.’ (Niels Bohr)
The political/human world is fundamentally uncertain.
Formally, the election is ‘the only poll that matters’.
However, many political decisions involve looking forward to potential election results, and forecasts, polls and markets can inform such decisions.
Why is forecasting data important?
Representative politics can be viewed as a collective action problem.
Cox (1990) describes the ‘winnowing out’ process that takes place in most elections.
This involves proceeding from a large number of potential candidates to a smaller number of viable candidates.
Coordination ‘failure’ occurs when support is distributed sub-optimally – either too fragmented or directed at the wrong candidate.
Why is forecasting data important?
The rules of the game impact on the nature of this process.
‘Winner-take-all’ structures make coordination a higher stakes game – presidential elections and majoritarian electoral systems increase pressure to coordinate.
Consensual systems and PR structures reduce this pressure, but even in such systems failures are possible.
Why is forecasting data important?
All of the actors involved in this process – candidates, parties, donors, interest organizations, media and voters require information that allows them to make informed decisions.
Donors require information about where to provide support (assuming they have an interest in supporting the winner).
Why is forecasting data important?
Forecasting/polling data provides the media with context in the treatment of a campaign.
Naturally, perceived favorites are scrutinized far more closely and given far more attention than perceived outsiders.
Also, these data provide the media with an evolving campaign narrative that they can report on.
Why is forecasting data important?
Interest organizations will often target candidates during a campaign.
Often they will attempt to elicit pledges on behaviour in office, which can, at least, be used to embarrass office holders seeking to renege.
Such organizations have to decide where to direct their attention/resources, and likely winners are a far more attractive than no-hopers.
Why is forecasting data important?
Candidates/parties have to decide whether to run and what strategy to adopt.
In terms of whether to run, parties and candidates have limited resources, and campaigns are costly – though not running can be demoralizing too!
Fianna Fail in Ireland, for instance ran no candidate in the 2011 Presidential election, while Sinn Fein ran a candidate based on projections of a ‘respectable’ performance.
In terms of strategy – forecasting data can determine when it’s best to ‘play safe’ (when forecasts have you ahead) versus go on the attack or seek to develop a novel issue (when trailing or facing an emergent rival).
Also, can signal the likelihood of a coalition being necessary, or the type of
likely coalition dynamics – which also affects optimal strategy.
Why is forecasting data important?
Voters have to decide: 1) Where to focus their attention during the
campaign 2) Where best to direct their votes – often
this can be for a second-favorite candidate, either if forecasting data indicates that their preferred candidate is a no-hoper, or that their preferred coalition partner is close to an electoral threshold (this most notably occurs in German elections where CDU/CSU supporters will direct some support to FDP).
Why is forecasting data important?
Because election results are also important.
Many sorts of decisions are made on the forecast outcomes of elections – decisions to buy or sell shares, to invest in certain commodities or industries etc.
Why is forecasting data important?
Forecasting data also allows scholars, commentators and citizens to interpret ‘what happened’ during a given election campaign.
Long-term forecasting models can provide a ‘par’ against which to evaluate candidates’ performances.
Did an outsider come from behind via a brilliant campaign strategy, an error made by their opponent etc. or was the campaign simply a coronation of a solid favourite?
Why is forecasting data important?
Public Vote Intention:
Ask people how they are going to vote.
Most polls are implicitly forecasts, they typically ask: ‘If the election were held today, who/which of the following would you vote for?’
Unscientific straw polls date to at least the 1824 presidential election, when informal trial heat tallies were taken in scattered taverns, militia offices, and public meetings.
Obviously, a complete census of the population would be ideal, however, this requires extraordinary resources and is unfeasible.
What information do we use?

Public vote intention:
Gallup’s quota-selected polls in 1936 marked the beginning of scientific election polling.
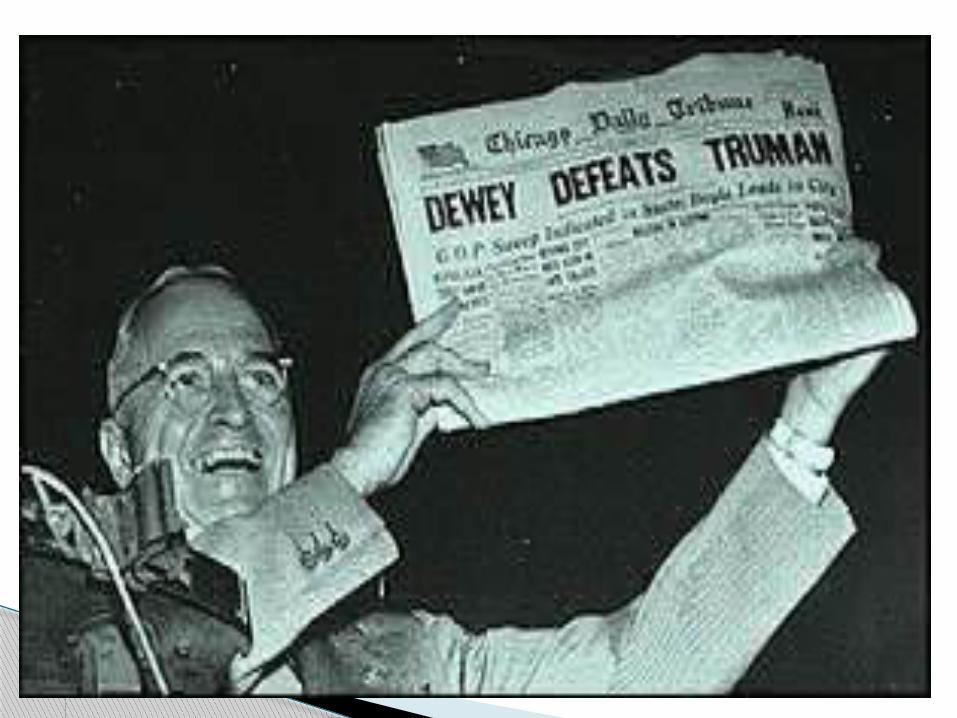
An early victory for Gallup’s approach saw it matched against the Literary Digest’s poll in the 1936 US Presidential election.
LD had correctly predicted the previous 4 presidential victors.
In this case LD predicted Alf Landon (Republican nominee) to defeat Democrat Franklin D. Roosevelt, while Gallup favored Roosevelt.
In the event, Roosevelt won one of the largest landslide victories in US Presidential history.
What information do we use?
Public Vote Intention:
LD had an enormous sample – over 2 million voters. Drawn from its readership, as well as registries of phone numbers and car owners.
Gallup had a far smaller sample of about 5,000 but this
was selected using randomized quota-based methodology.
The LD sample was biased in nature – LD subscriptions, telephone and car ownership were more predominant among wealthier Americans, who were more likely to support the GOP.
What information do we use?
Public Vote Intention:
Evolution of survey modes: Direct mail (e.g. Literary Digest). Face-to-face. Telephone/Random-Digit-Dialling. CATI. Online.
Tradoffs: cost, time, social desirability effects, representativeness (coverage problems).
What information do we use?
Public Vote Intention:
Problems: this can be ‘noisy’ data. Tends to fluctuate around stable trends.
Respondent bias: ‘Social desirability bias’ leads to consistent over-reporting of turnout.
Lack of transparency in the polling industry: methods, and especially adjustments to data to ‘reshape’ are not typically disclosed by private firms.
Elements of modernity are making some methods increasingly unreliable: for instance, high numbers of individuals cannot be contacted via landline.
What information do we use?
In the USA, polls are a continuous part of politics, even in ‘peace time’.
For example, the earliest poll concerning the current 2012 campaign was conducted on November 5th, 2008 – just one day after the Obama election!
(for posterity, that poll predicted Sarah Palin as the Republican Party most likely nominee in 2012).
975 nationwide election polls were conducted in the 2008 US election campign.
A never-ending cycle?
On significant hypothesis is that coverage of the electoral ‘horse-race’ distracts from coverage of candidate’s stances on the major issues/track records in previous office.
As such, it is argued that the information received by voters is primarily to do with momentum and support, rather than the information they need to evaluate competing candidates.
Do polls distort campaign coverage?
While in the past polls were typically reported as stand alone data by the media outlets that commissioned them, more recent elections have seen the emergence of blogs and websites that comment on and aggregate polls.
Nate Silver’s fivethiryeight.com site is particularly influential and interesting.
More generally, the explosion of expert blogging has spread to the evaluation of opinion polls and their use to generate election forecasts: particularly in countries with complex electoral systems such as the UK and Ireland.
New ‘gatekeepers’ of polling data
Forecasting models: This tradition has evolved from Tufte’s pathbreaking
work in 1975.
Forecasting models use a few variables to predict either election outcome or the vote share of one of the parties.
Note that such modeling takes place nearly exclusively in ‘winner-take-all’ elections.
Very rarely applied to multiparty parliamentary elections.
What information do we use?
Forecasting models: Seeks to predict election outcome on the basis of
the ‘fundamentals’ of incumbent performance: Political measures – typically a measure of
Presidential/Prime Ministerial job approval about 6 months before the election.
Other political measures: incumbency, ‘pendulum’ effects.
Economic measures: GDP growth, GNP growth, unemployment rate (and trends), citizens’ evaluation of their economic prospects.
What information do we use?
Forecasting models: They use regression analysis to model how these
variables related to incumbent/opposition vote share in previous elections, and use these relationships to predict future elections.
Thus they rely on patterns in previous elections, supplemented with available data to predict future elections.
Theoretically, they are based on the notion of retrospective voting, which sees the act of voting as being motivated by voters’ opinions of the performance of incumbents.
What information do we use?
Forecasting models: Advantages: typically they can be used to generate
forecasts well in advance of the election, whereas poll-based forecasts fluctuate far more.
They are theoretically-driven and can be developed and refined with experience.
They give us a sense of ‘par’ for incumbent and challenger candidates.
They have shown the importance of economic performance, especially trends (rather than absolute levels) in GDP and employment.
Have generally performed impressively, especially in terms of overall outcome.
What information do we use?
Forecasting models: Disadvantages: Only applicable for certain types of
elections Rely on relatively few observations (i.e. the
number of elections for which data on model vars is available)
Struggle with elections where changes occur late in campaigns.
Fail to account for qualities of non-incmubent candidate.
What information do we use?
- Market data: The cross-section of gambling and politics. Brings the ‘horse race’ analogy to another
level.
Various forums allow individuals to gamble on the likelihood of candidates/parties winning and on their vote shares.
What information do we use?
Market data –
The ‘Iowa Electronic Markets’ were the first instance of such markets in the 1988 .
Allow users to buy and sell shares in candidate success or in predicted candidate vote shares.
Shares will pay out a fixed amount if the candidate wins (say 10 dollars) and zero if they do not.
Shares can be traded throughout the campaign. Data from these markets can be used to generate
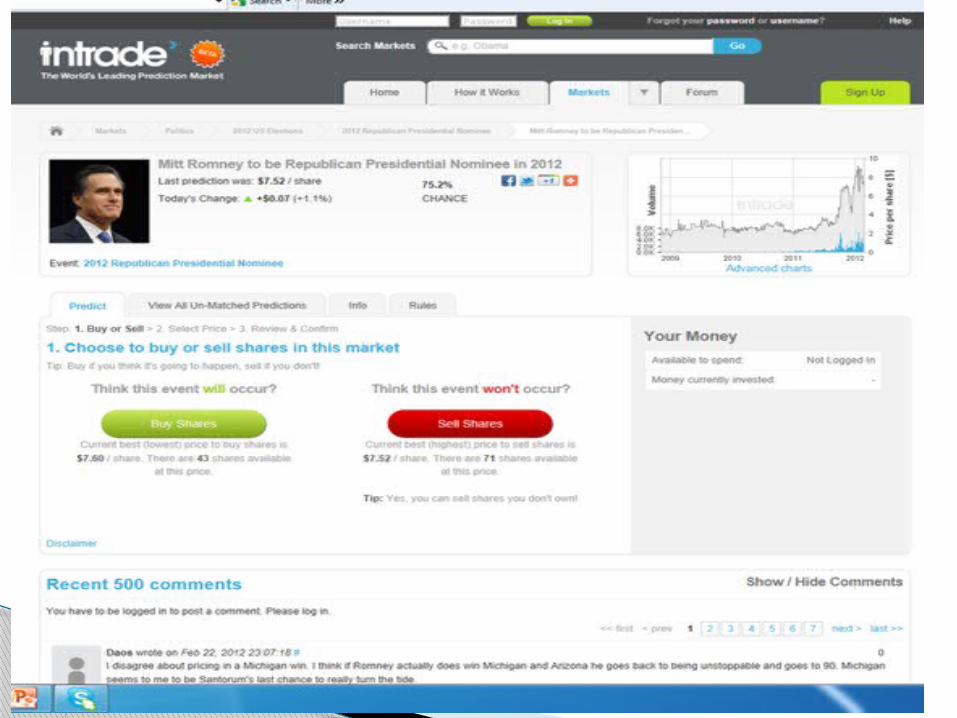
implied probabilities. Intrade.com and Betfair.com provide a similar service.
What information do we use?
Market data- Such sites effectively act as ‘middle men’
facilitating trades between gamblers. They always display the ‘best price’ that is
offered to buy or sell shares. These data can be turned into forecasts of
the likelihood of each candidate winning. Expensive shares indicate high likelihood
and vice versa.
What information do we use?
Market data – ‘Traditional’ bookmakers also offer market
driven data. These actors set a price that they will pay
per euro bet in the event of a given outcome (usually based on past experience and expert opinion)
This price can fluctuate as betting progresses.
What information do we use?

Market data – Advantages: the providers of the data have an
incentive to provide useful information – their money. Respondents to polls do not have such incentives and
may not give as much consideration. The data are incredibly cheap (i.e. free) compared to
polls. The data are more time sensitive, and continuously
updated. The data can take account of medium and long term
factors. In some cases (e.g. the UK, Ireland) data are given on
a constituency-by-constituency basis.
What information do we use?
Market data – Disadvantages Traders are not representative of likely voters
—they tend to be young, male, well educated, and high income—and they do not even need to be eligible to vote!
Emotional gambling? Do people gamble on candidates/parties that they want to win out of a sense of loyalty?
Human perceptual biases come into play – the ‘favourite-longshot’ bias in my research.
What information do we use?
Expert opinion: The opinions of commentators and political
‘insiders’. The earliest source of political information –
typically local party insiders were relied on to estimate likely results.
Expert surveys are still occassionally used.
What information do we use?
We live in an uncertain world, but must try to guess what will happen.
There is a wide range of data available each with various tradeoffs in terms of usefullness and reliability.
We can never discount the importance of unforseen ‘events’ that occur during campaigns.
Conclusions