dr. michael flicek education consultant october 8, 2013 wyoming school performance rating model...
TRANSCRIPT
Dr. Michael FlicekEducation Consultant
October 8, 2013
Wyoming School Performance Rating ModelReport to:
Wyoming State Board of Education
Wyoming WDE and SBE
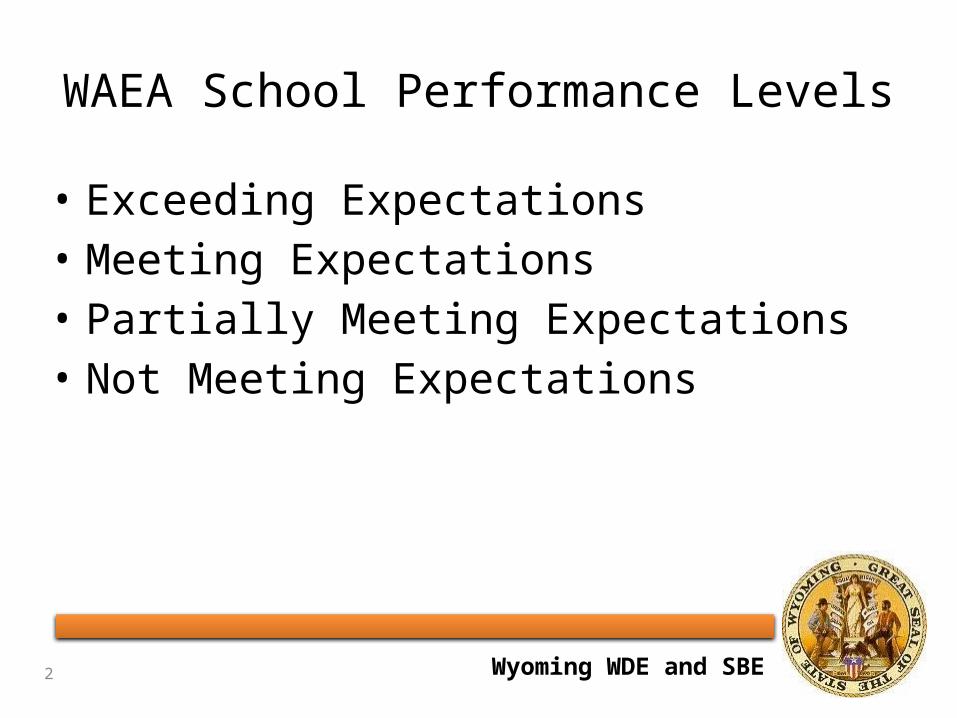
WAEA School Performance Levels
• Exceeding Expectations• Meeting Expectations• Partially Meeting Expectations• Not Meeting Expectations
2
Wyoming WDE and SBE
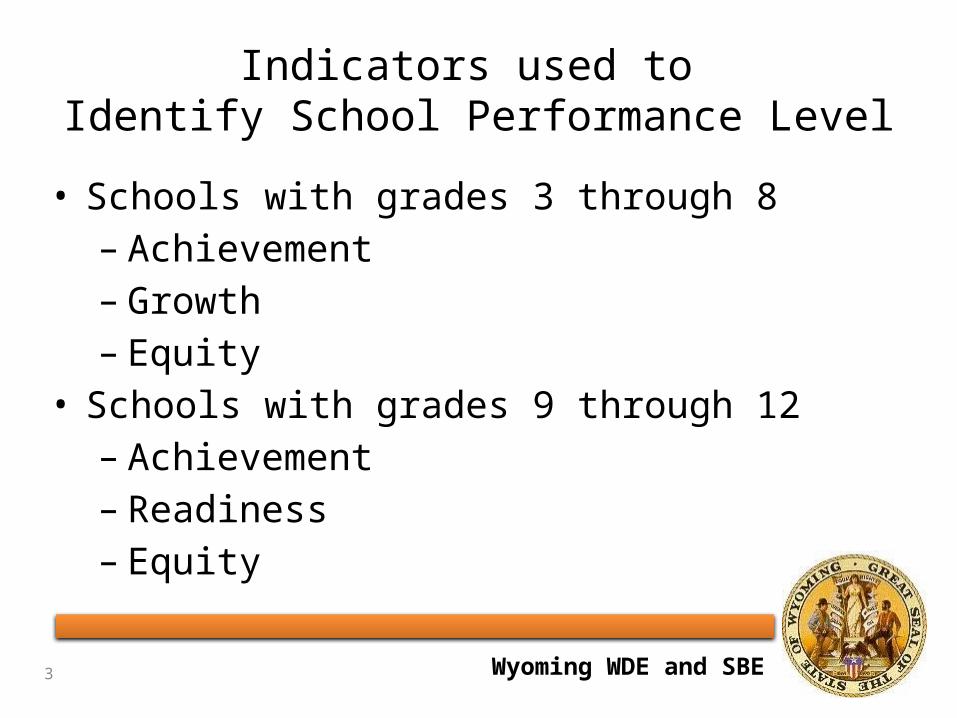
Indicators used to Identify School Performance Level
• Schools with grades 3 through 8– Achievement– Growth– Equity
• Schools with grades 9 through 12– Achievement – Readiness– Equity
3
Wyoming WDE and SBE
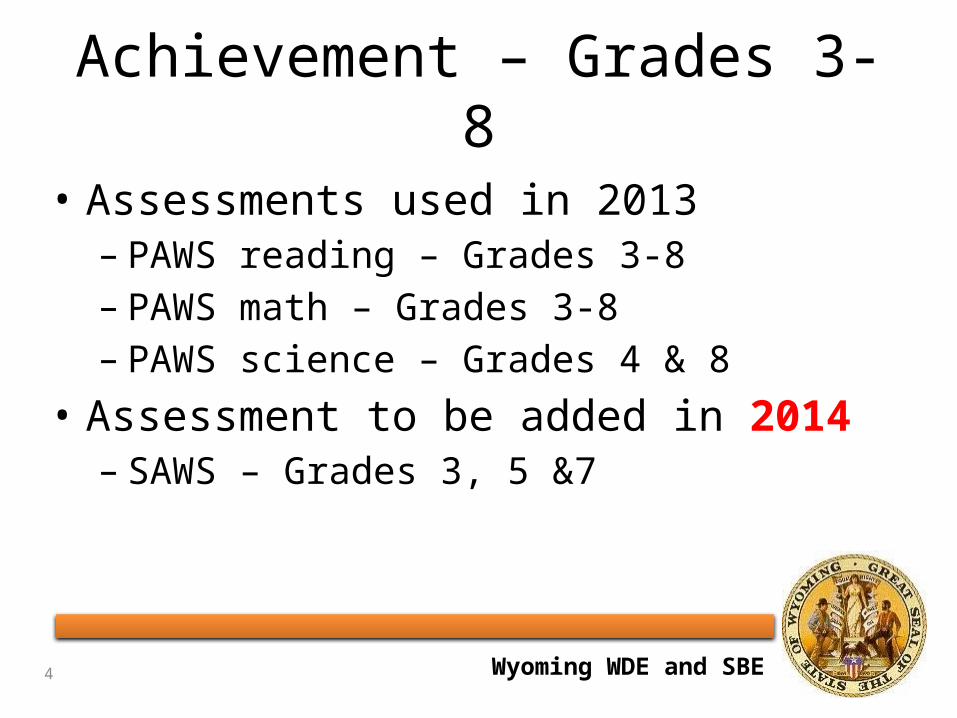
Achievement – Grades 3-8
• Assessments used in 2013– PAWS reading – Grades 3-8– PAWS math – Grades 3-8– PAWS science – Grades 4 & 8
• Assessment to be added in 2014– SAWS – Grades 3, 5 &7
4
Wyoming WDE and SBE
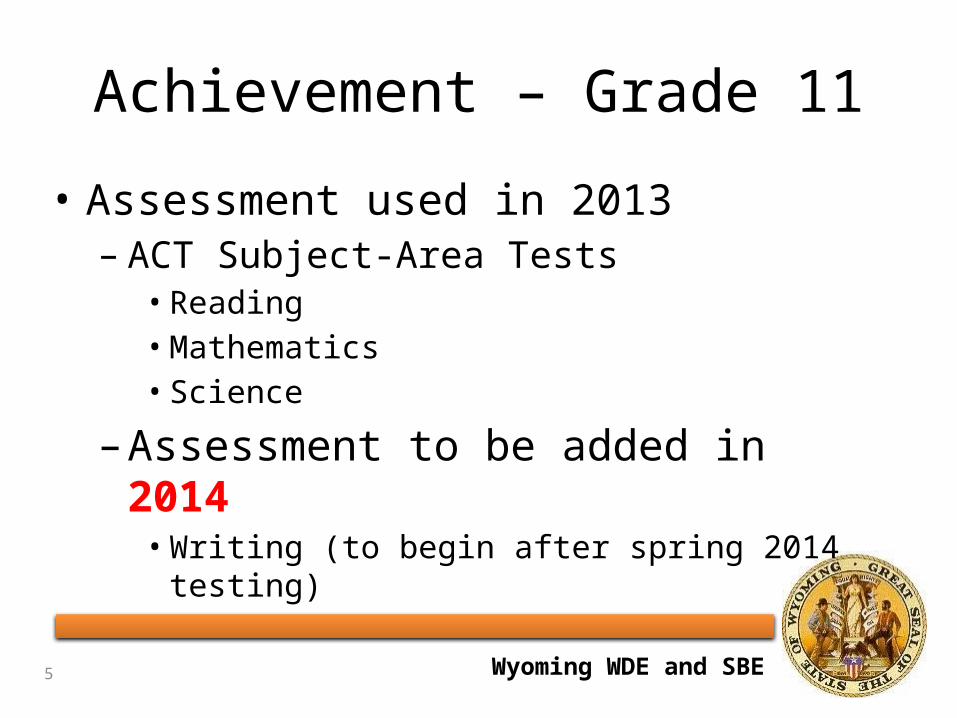
Achievement – Grade 11
• Assessment used in 2013– ACT Subject-Area Tests• Reading• Mathematics• Science
–Assessment to be added in 2014• Writing (to begin after spring 2014 testing)
5
Wyoming WDE and SBE
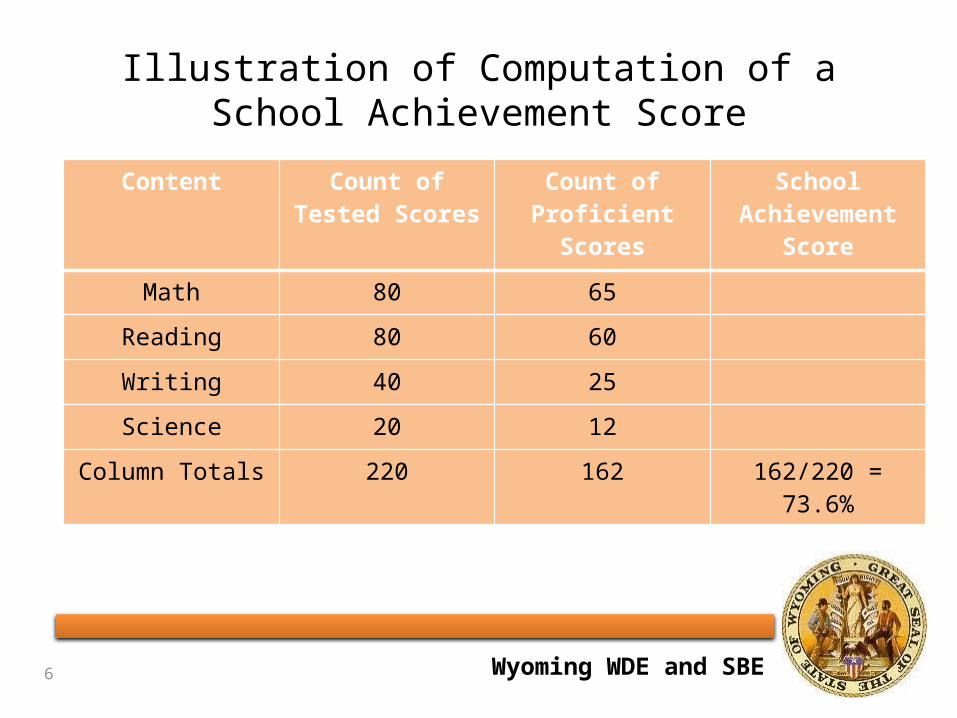
Illustration of Computation of a School Achievement Score
6
Content Count of Tested Scores
Count of Proficient
Scores
School Achievement
Score
Math 80 65
Reading 80 60
Writing 40 25
Science 20 12
Column Totals 220 162 162/220 = 73.6%
Wyoming WDE and SBE
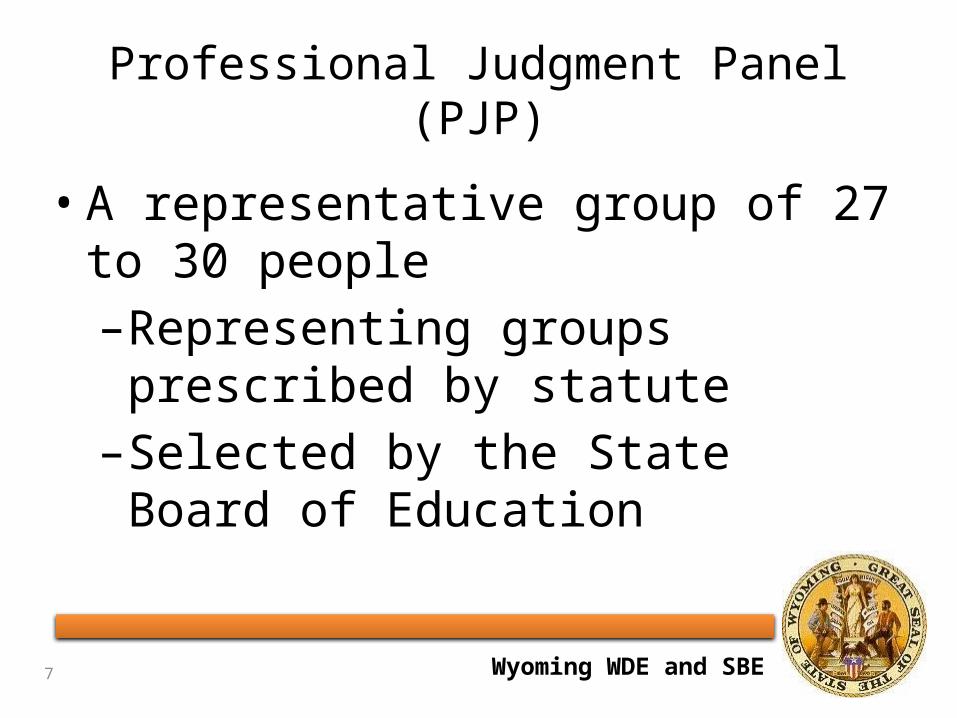
Professional Judgment Panel (PJP)
• A representative group of 27 to 30 people –Representing groups prescribed by statute–Selected by the State Board of Education
7
Wyoming WDE and SBE
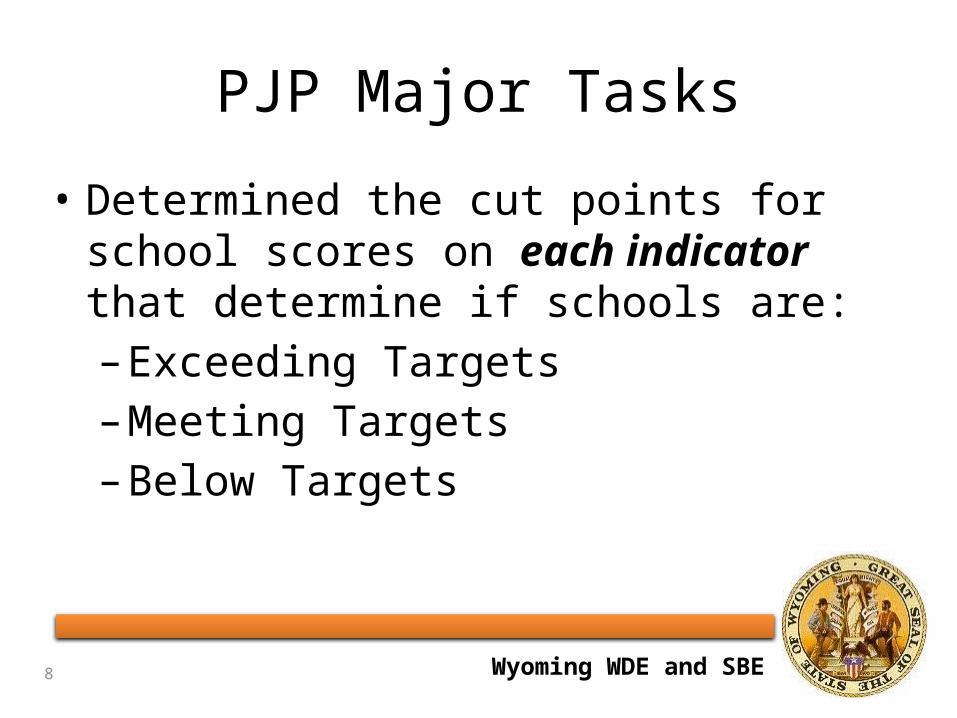
PJP Major Tasks
• Determined the cut points for school scores on each indicator that determine if schools are:–Exceeding Targets–Meeting Targets–Below Targets
8
Wyoming WDE and SBE
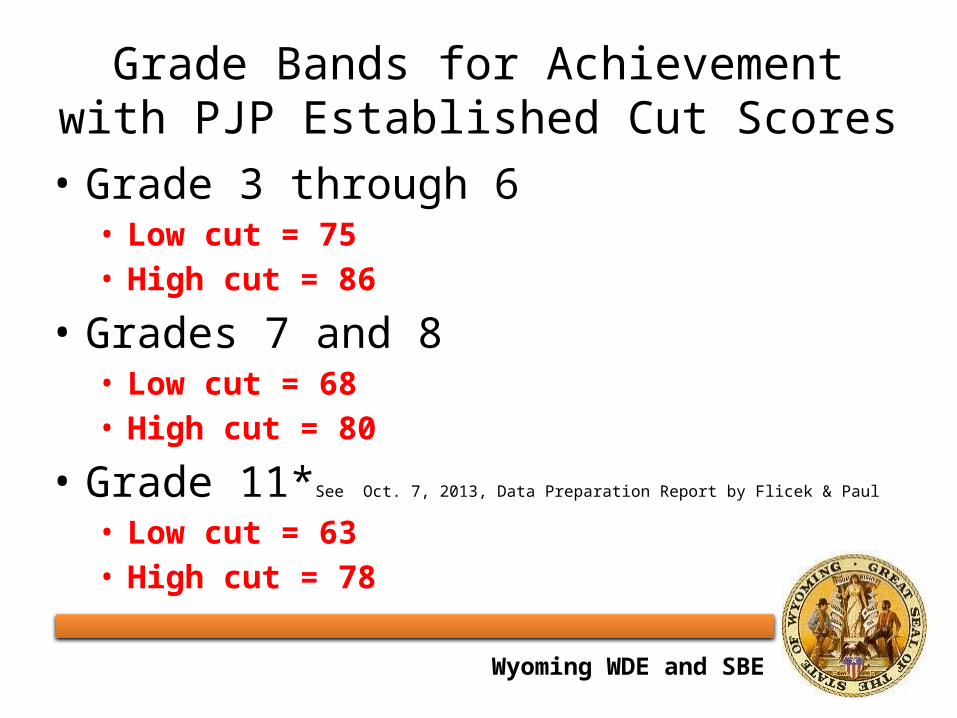
Grade Bands for Achievement with PJP Established Cut Scores
• Grade 3 through 6• Low cut = 75• High cut = 86
• Grades 7 and 8• Low cut = 68• High cut = 80
• Grade 11*See Oct. 7, 2013, Data Preparation Report by Flicek & Paul
• Low cut = 63• High cut = 78
Wyoming WDE and SBE
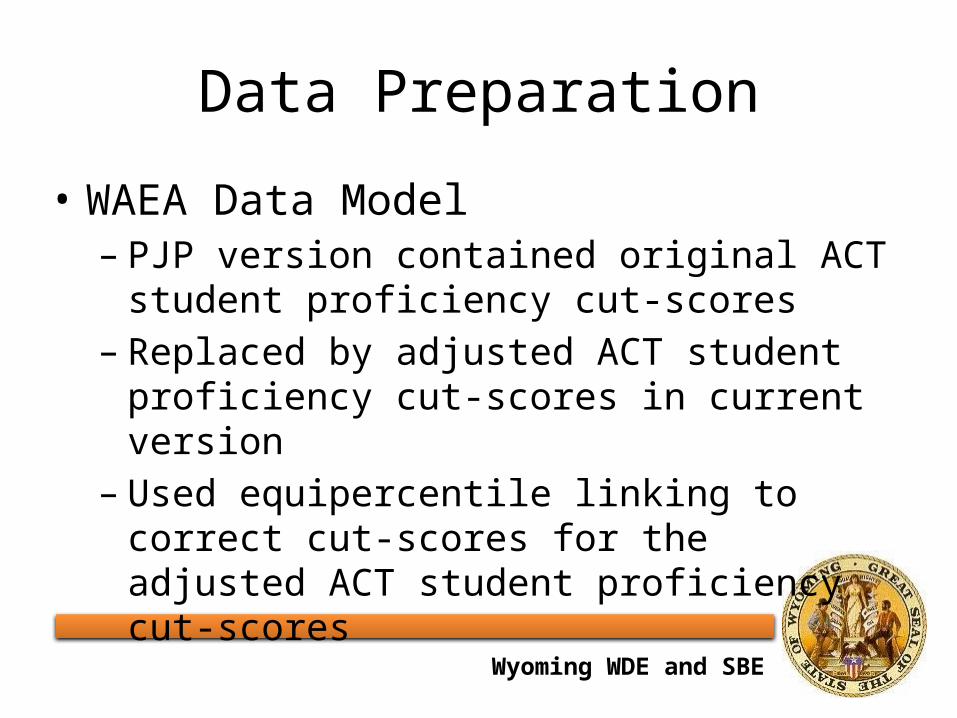
Data Preparation
• WAEA Data Model– PJP version contained original ACT
student proficiency cut-scores– Replaced by adjusted ACT student
proficiency cut-scores in current version
–Used equipercentile linking to correct cut-scores for the adjusted ACT student proficiency cut-scores
Wyoming WDE and SBE
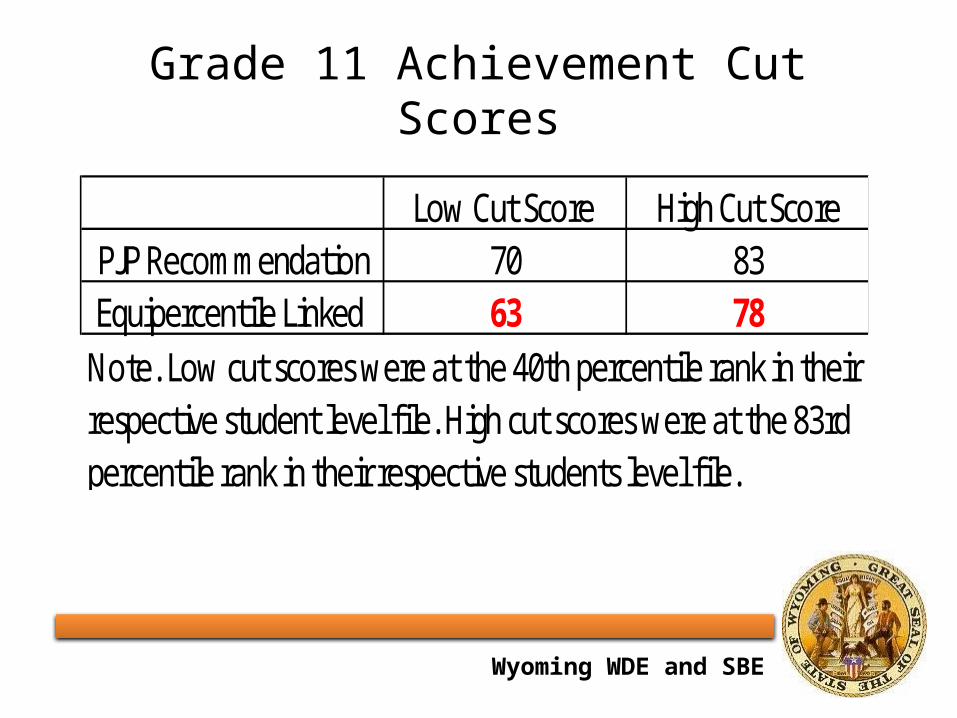
Grade 11 Achievement Cut Scores
Low Cut Score High Cut ScorePJP Recommendation 70 83Equipercentile Linked 63 78
Note. Low cut scores were at the 40th percentile rank in their respective student level file. High cut scores were at the 83rd percentile rank in their respective students level file.
Wyoming WDE and SBE
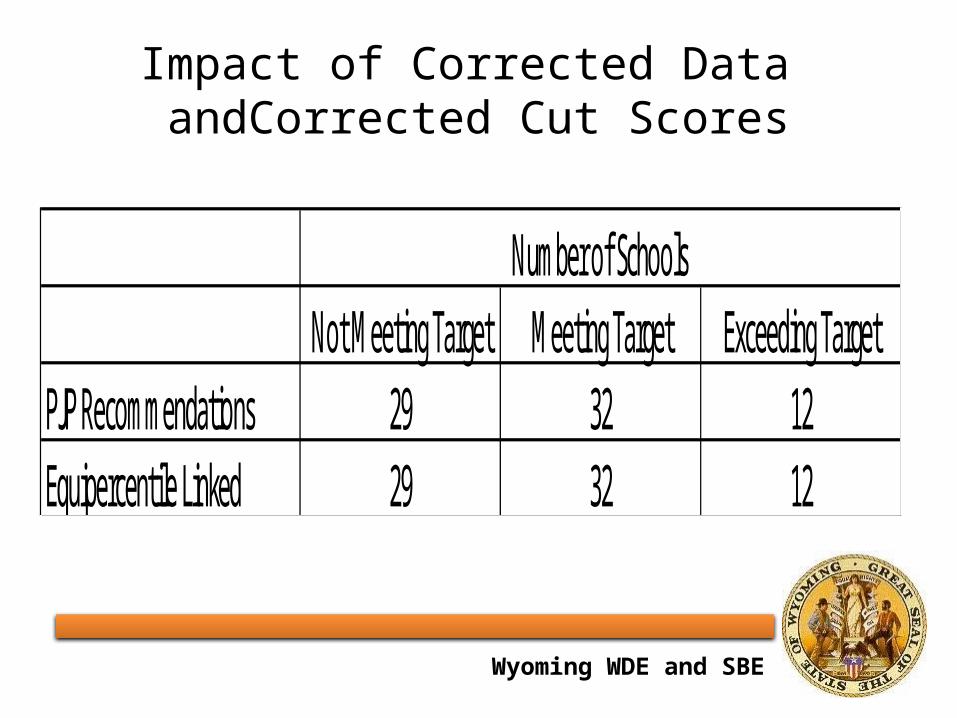
Impact of Corrected Data andCorrected Cut Scores
Not Meeting Target Meeting Target Exceeding TargetPJP Recommendations 29 32 12Equipercentile Linked 29 32 12
Number of Schools
Wyoming WDE and SBE
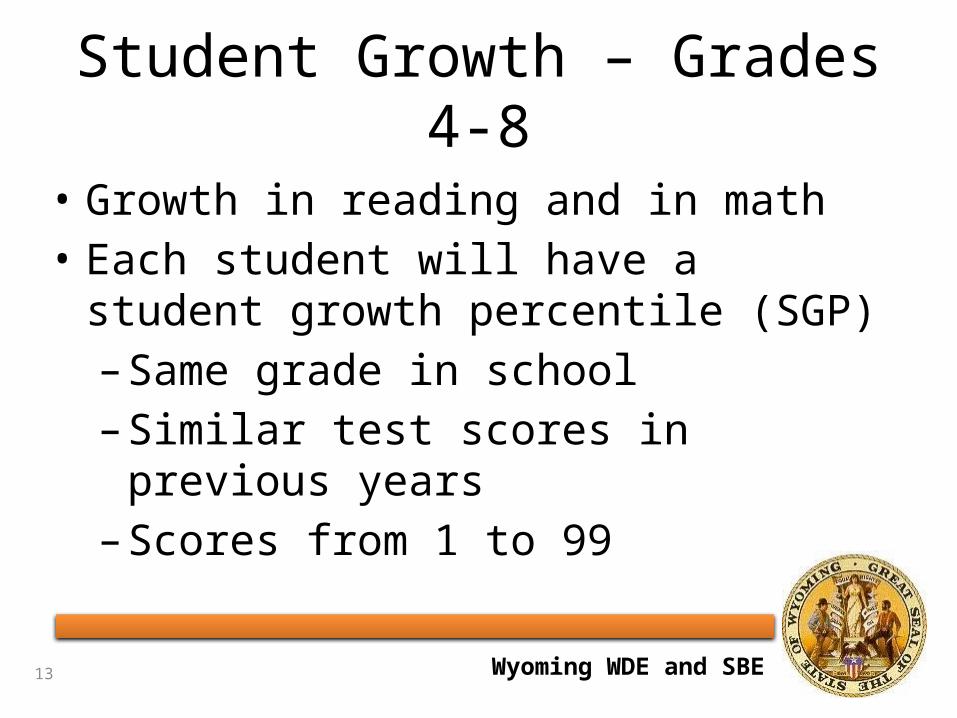
Student Growth – Grades 4-8
• Growth in reading and in math• Each student will have a student
growth percentile (SGP)–Same grade in school–Similar test scores in previous
years–Scores from 1 to 99
13
Wyoming WDE and SBE
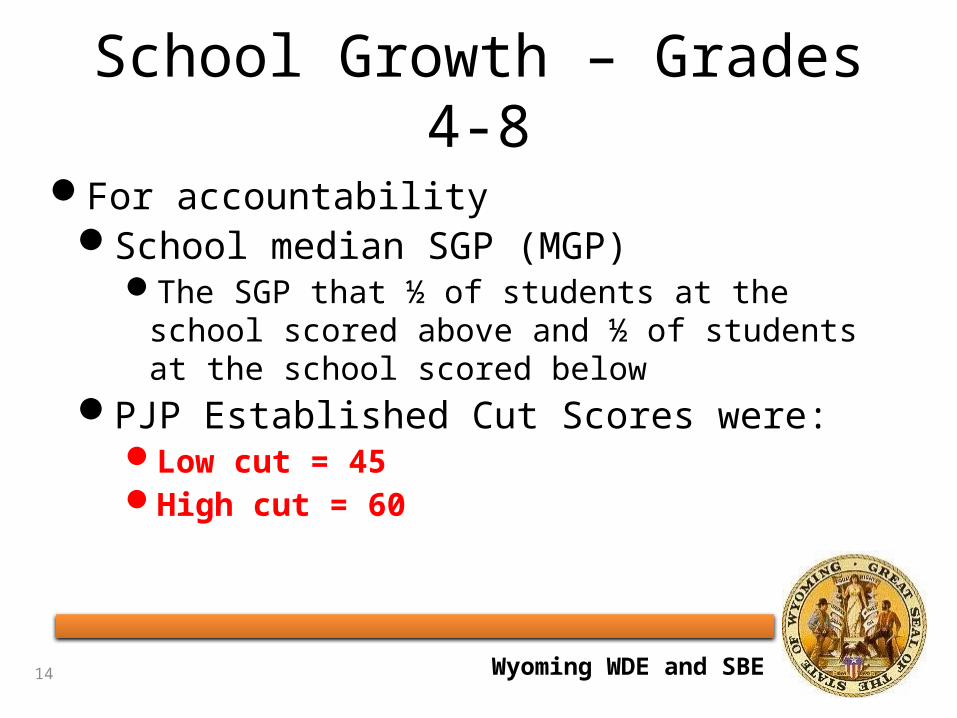
School Growth – Grades 4-8
For accountabilitySchool median SGP (MGP)
The SGP that ½ of students at the school scored above and ½ of students at the school scored below
PJP Established Cut Scores were:Low cut = 45High cut = 60
14
Wyoming WDE and SBE
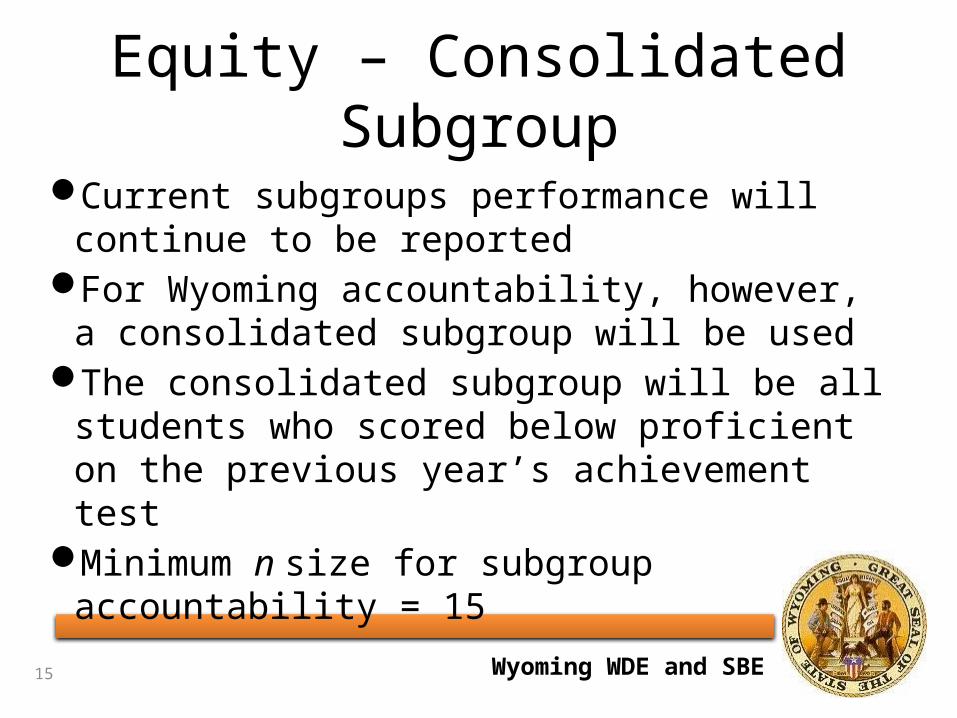
Equity – Consolidated Subgroup
Current subgroups performance will continue to be reported
For Wyoming accountability, however, a consolidated subgroup will be used
The consolidated subgroup will be all students who scored below proficient on the previous year’s achievement test
Minimum n size for subgroup accountability = 15
15
Wyoming WDE and SBE
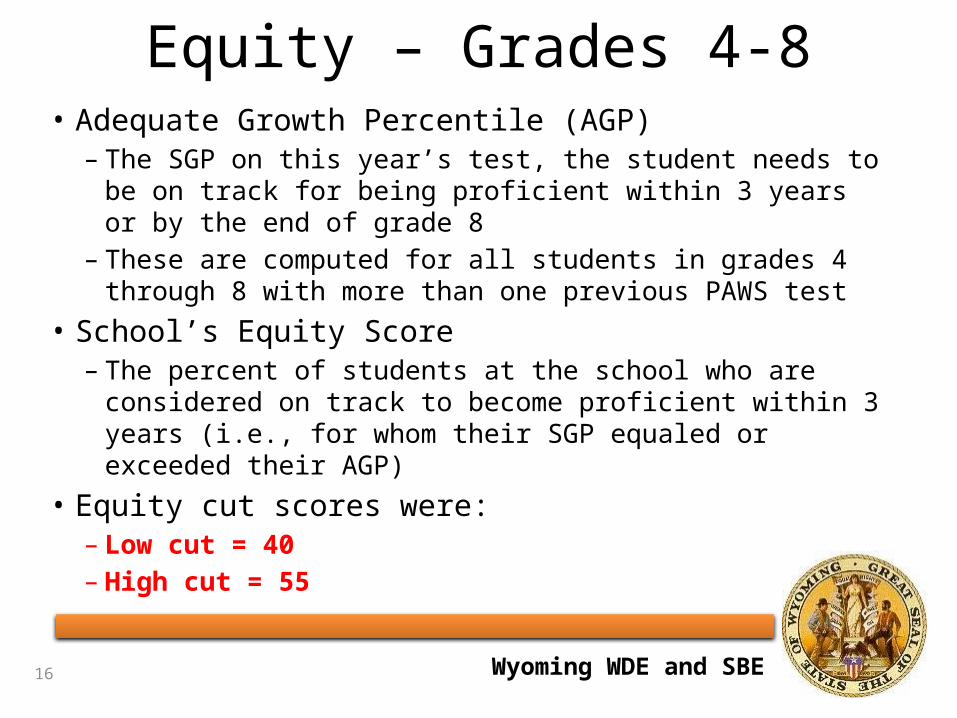
Equity – Grades 4-8• Adequate Growth Percentile (AGP)
– The SGP on this year’s test, the student needs to be on track for being proficient within 3 years or by the end of grade 8
– These are computed for all students in grades 4 through 8 with more than one previous PAWS test
• School’s Equity Score– The percent of students at the school who are
considered on track to become proficient within 3 years (i.e., for whom their SGP equaled or exceeded their AGP)
• Equity cut scores were:– Low cut = 40– High cut = 55
16
Wyoming WDE and SBE
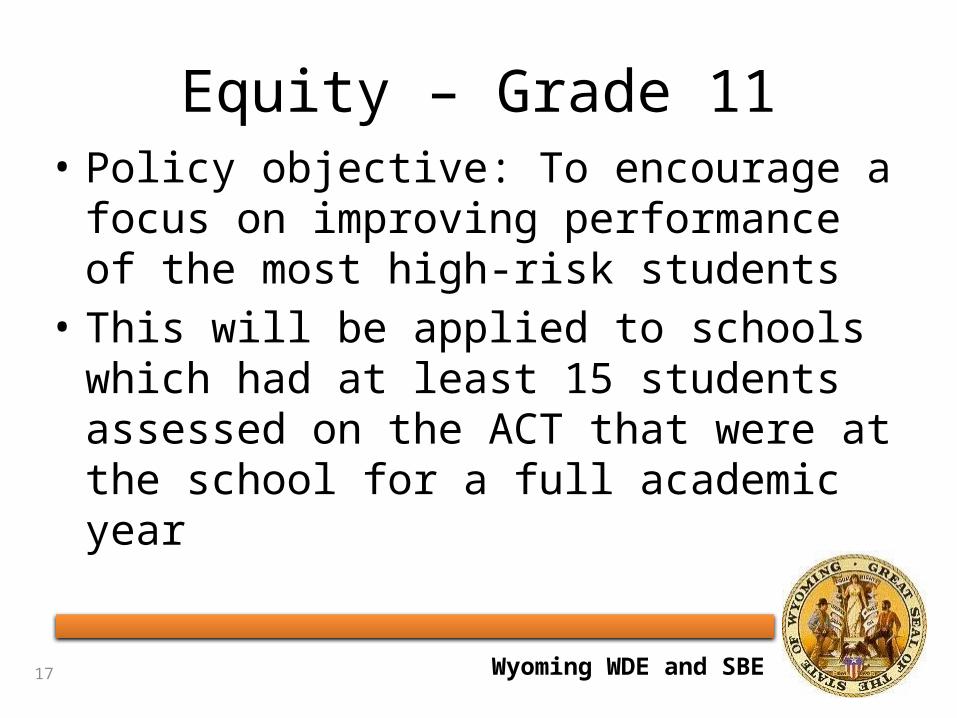
Equity – Grade 11• Policy objective: To encourage a
focus on improving performance of the most high-risk students
• This will be applied to schools which had at least 15 students assessed on the ACT that were at the school for a full academic year
17

Wyoming WDE and SBE
High School Equity 2013
• The percent of not proficient test scores in reading and math on the 2012 PAWS was computed
• The percent of not proficient test score in reading and math on the 2013 ACT subject area test was computed
• The change in the percent of not proficient test scores from 2012 to 2013 was computed
Wyoming WDE and SBE
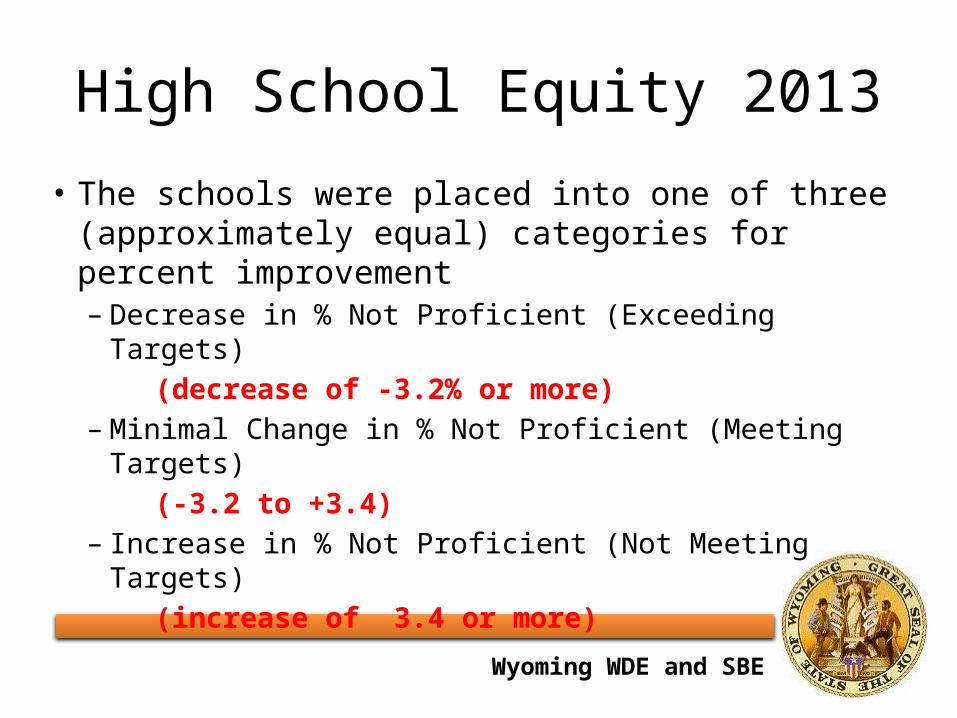
High School Equity 2013
• The schools were placed into one of three (approximately equal) categories for percent improvement– Decrease in % Not Proficient (Exceeding Targets) (decrease of -3.2% or more)– Minimal Change in % Not Proficient (Meeting
Targets) (-3.2 to +3.4)– Increase in % Not Proficient (Not Meeting
Targets) (increase of 3.4 or more)
Wyoming WDE and SBE
Correction
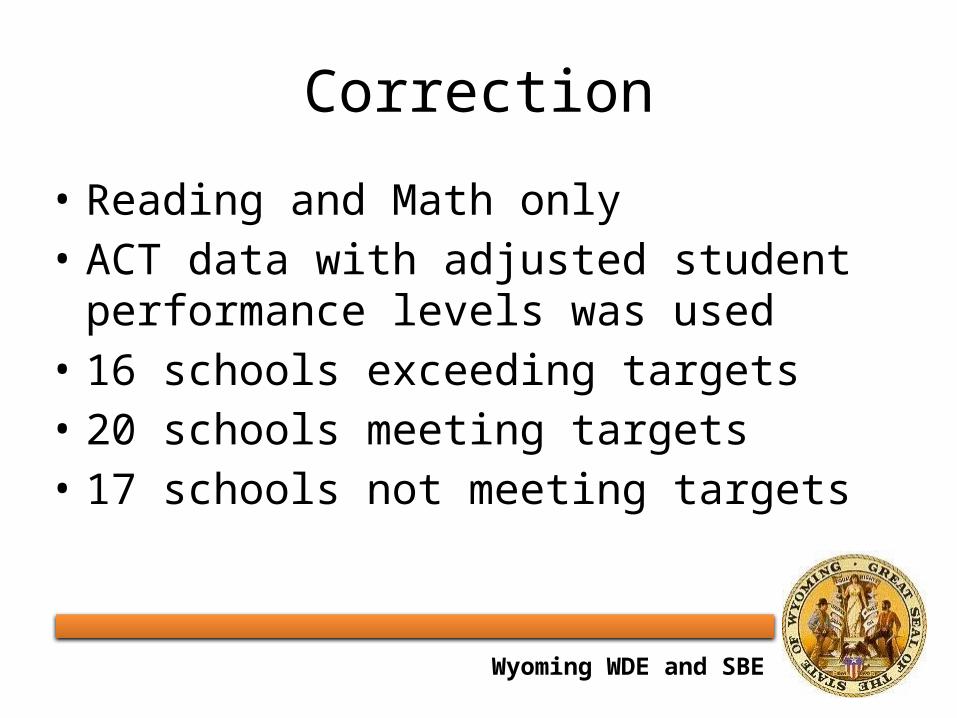
• Reading and Math only• ACT data with adjusted student
performance levels was used• 16 schools exceeding targets• 20 schools meeting targets• 17 schools not meeting targets
Wyoming WDE and SBE
High School Equity in 2014
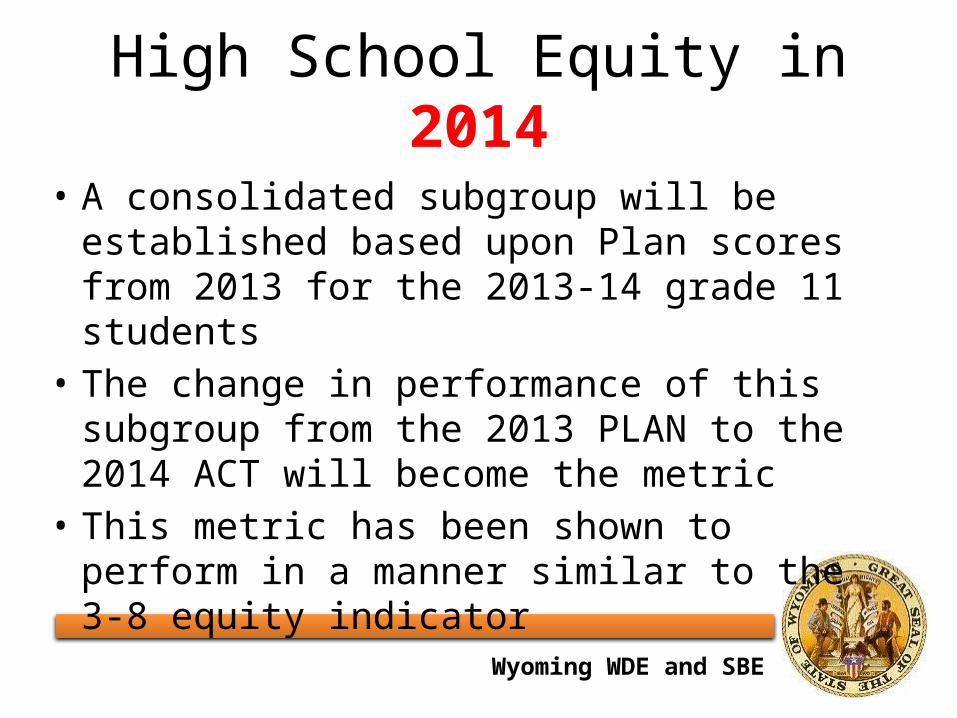
• A consolidated subgroup will be established based upon Plan scores from 2013 for the 2013-14 grade 11 students
• The change in performance of this subgroup from the 2013 PLAN to the 2014 ACT will become the metric
• This metric has been shown to perform in a manner similar to the 3-8 equity indicator
Wyoming WDE and SBE
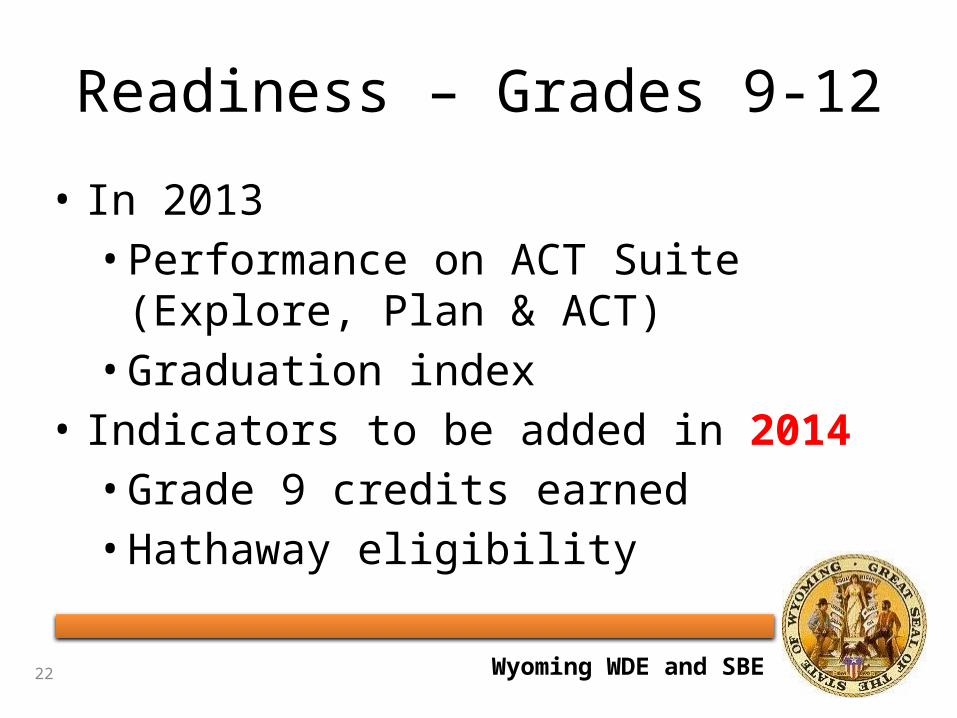
Readiness – Grades 9-12
• In 2013• Performance on ACT Suite
(Explore, Plan & ACT)• Graduation index
• Indicators to be added in 2014• Grade 9 credits earned• Hathaway eligibility
22
Wyoming WDE and SBE
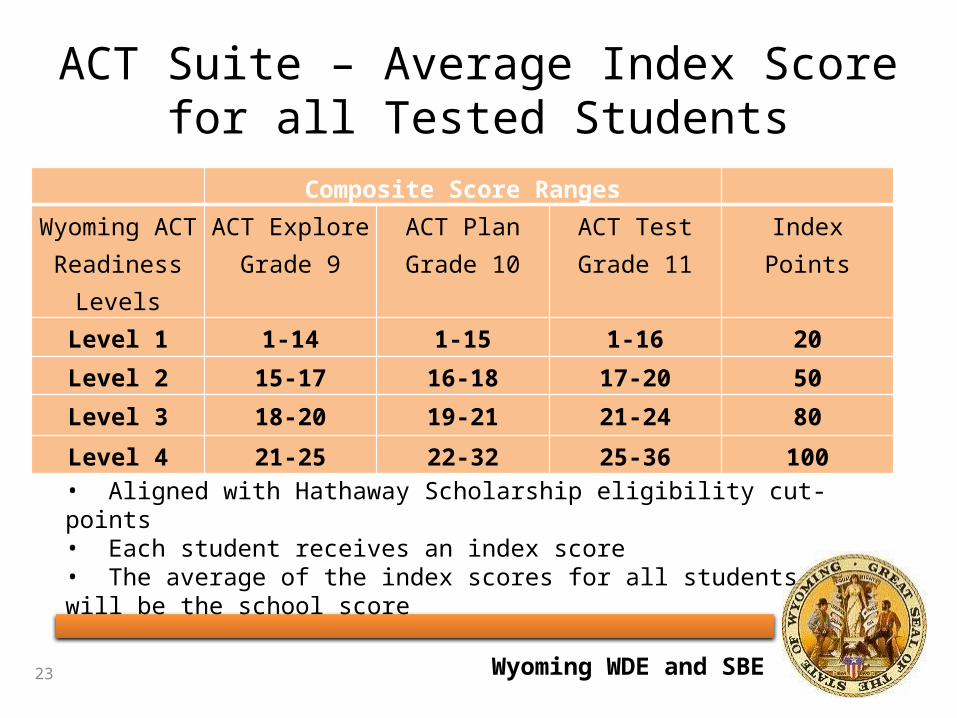
ACT Suite – Average Index Score for all Tested Students
Composite Score RangesWyoming
ACT Readiness
Levels
ACT Explore Grade 9
ACT Plan Grade 10
ACT Test Grade 11
Index Points
Level 1 1-14 1-15 1-16 20
Level 2 15-17 16-18 17-20 50
Level 3 18-20 19-21 21-24 80
Level 4 21-25 22-32 25-36 100• Aligned with Hathaway Scholarship eligibility cut-points• Each student receives an index score• The average of the index scores for all students will be the school score
23
Wyoming WDE and SBE
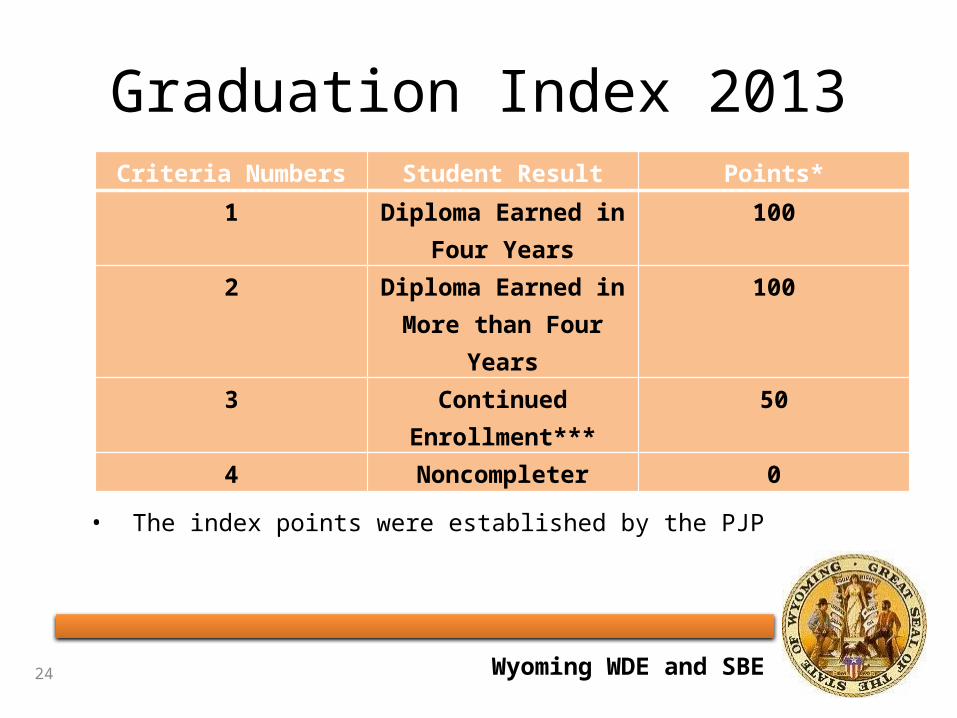
Graduation Index 2013Criteria Numbers Student Result Points*
1 Diploma Earned in Four Years
100
2 Diploma Earned in More than Four
Years
100
3 Continued Enrollment***
50
4 Noncompleter 0
• The index points were established by the PJP
24
Wyoming WDE and SBE
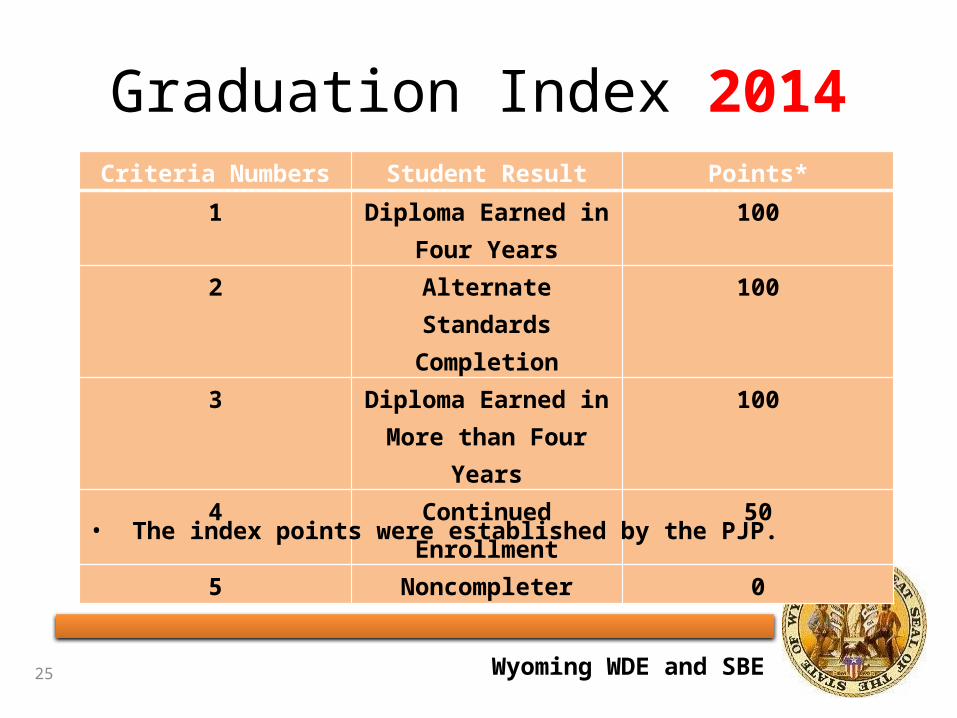
Graduation Index 2014Criteria Numbers Student Result Points*
1 Diploma Earned in Four Years
100
2 Alternate Standards Completion
100
3 Diploma Earned in More than Four Years
100
4 Continued Enrollment 50
5 Noncompleter 0
• The index points were established by the PJP.
25

Wyoming WDE and SBE
Grade 9 Credits Earned - 2014
• The percent of students who completed grade 9 with one fourth of the credits required to receive a diploma
26
Wyoming WDE and SBE
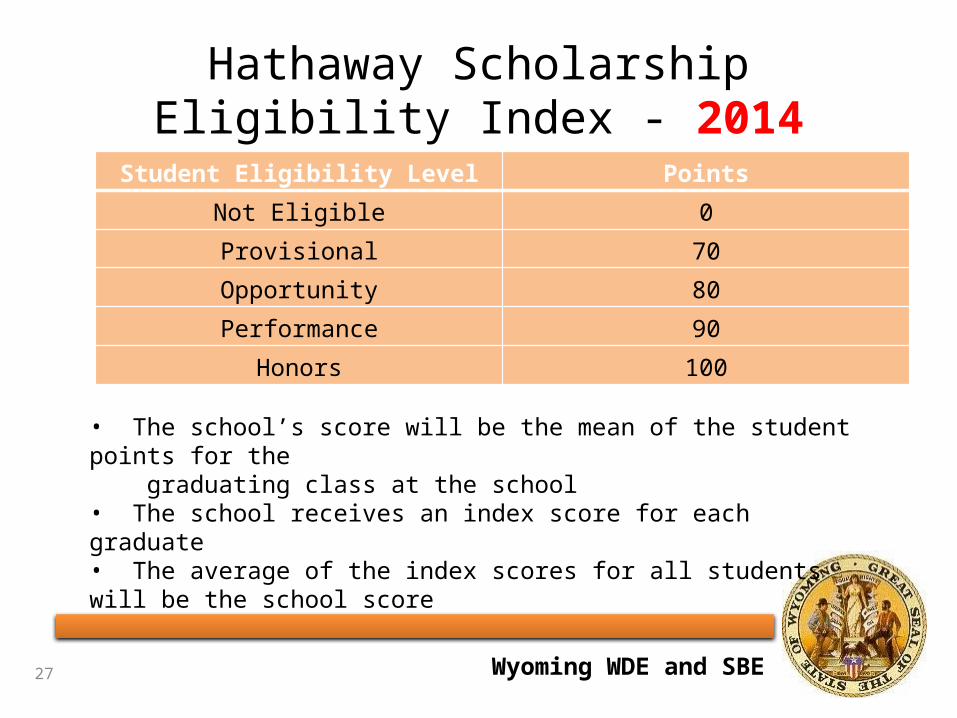
Hathaway Scholarship Eligibility Index - 2014
Student Eligibility Level Points
Not Eligible 0
Provisional 70
Opportunity 80
Performance 90
Honors 100
• The school’s score will be the mean of the student points for the graduating class at the school• The school receives an index score for each graduate• The average of the index scores for all students will be the school score
27
Wyoming WDE and SBE
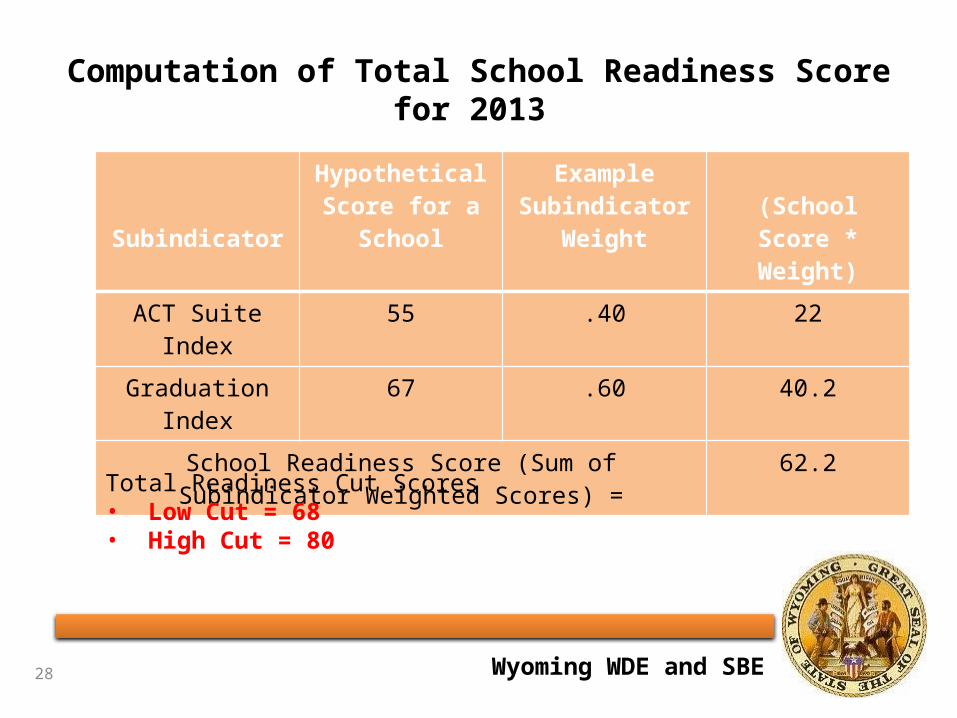
Computation of Total School Readiness Score for 2013
Subindicator
Hypothetical Score for a
School
Example Subindicator
Weight(School Score * Weight)
ACT Suite Index
55 .40 22
Graduation Index
67 .60 40.2
School Readiness Score (Sum of Subindicator Weighted Scores) =
62.2
28
Total Readiness Cut Scores• Low Cut = 68• High Cut = 80
Wyoming WDE and SBE
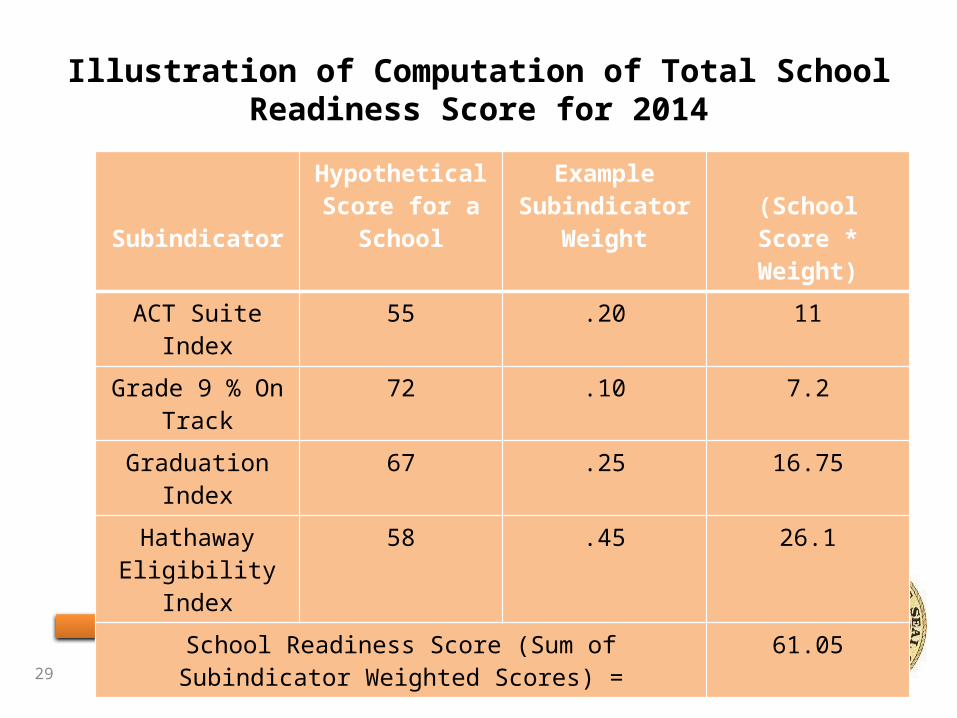
Illustration of Computation of Total School Readiness Score for 2014
Subindicator
Hypothetical Score for a
School
Example Subindicator
Weight(School Score * Weight)
ACT Suite Index
55 .20 11
Grade 9 % On Track
72 .10 7.2
Graduation Index
67 .25 16.75
Hathaway Eligibility
Index
58 .45 26.1
School Readiness Score (Sum of Subindicator Weighted Scores) =
61.05
29
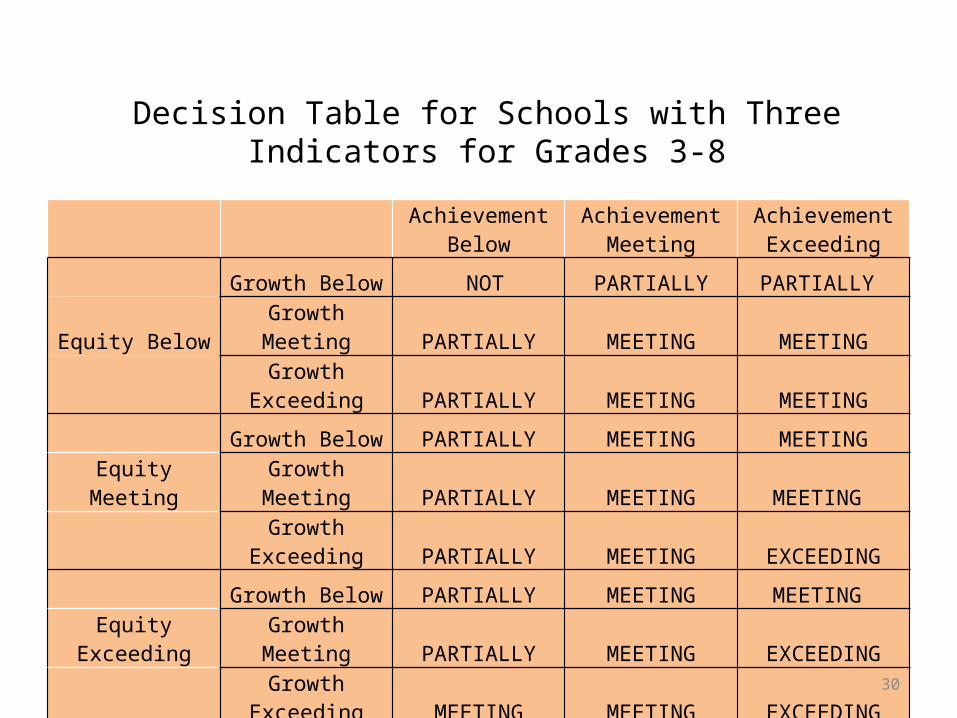
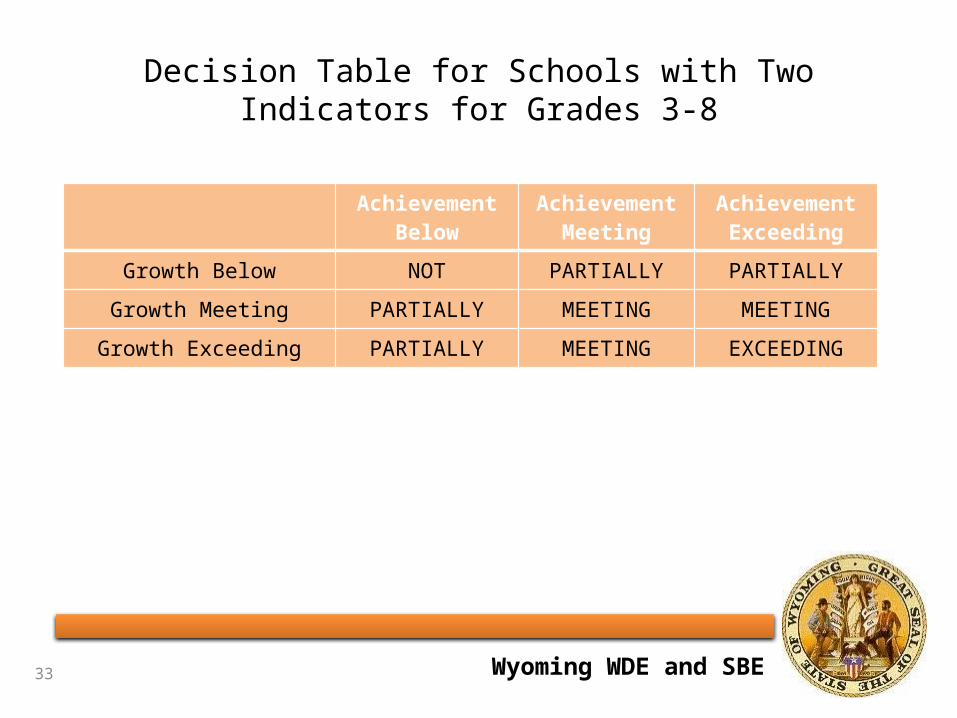
Achievement Below
Achievement Meeting
Achievement Exceeding
Growth Below NOT PARTIALLY PARTIALLY
Equity BelowGrowth Meeting PARTIALLY MEETING MEETING
Growth
Exceeding PARTIALLY MEETING MEETING
Growth Below PARTIALLY MEETING MEETING
Equity MeetingGrowth Meeting PARTIALLY MEETING MEETING
Growth
Exceeding PARTIALLY MEETING EXCEEDING
Growth Below PARTIALLY MEETING MEETING Equity
ExceedingGrowth Meeting PARTIALLY MEETING EXCEEDING
Growth
Exceeding MEETING MEETING EXCEEDING
Decision Table for Schools with Three Indicators for Grades 3-8
30
Wyoming WDE and SBE
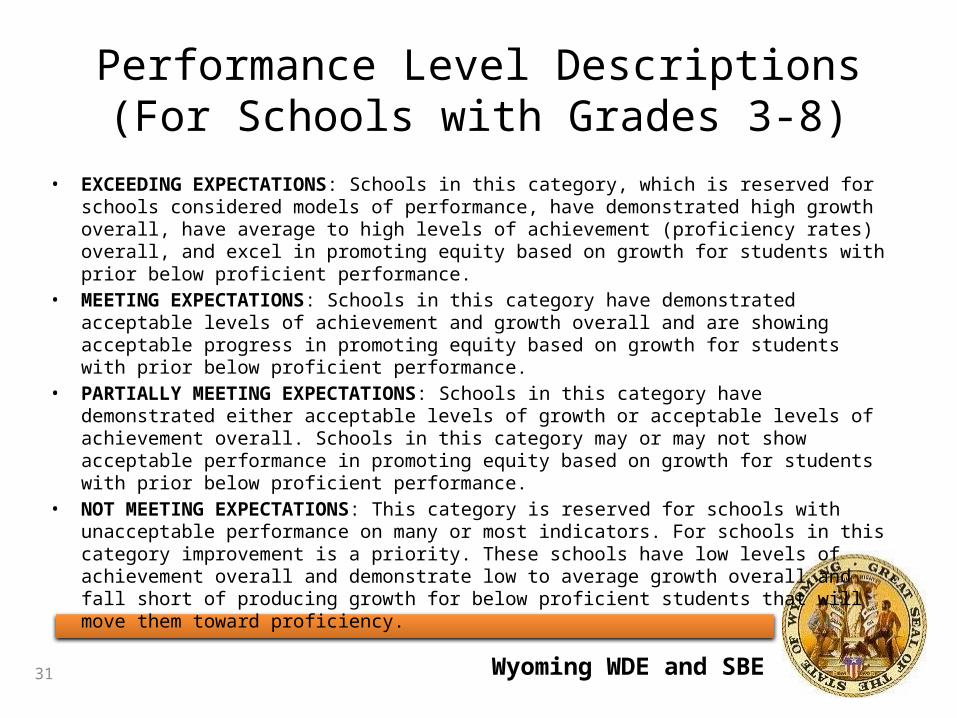
Performance Level Descriptions(For Schools with Grades 3-8)
• EXCEEDING EXPECTATIONS: Schools in this category, which is reserved for schools considered models of performance, have demonstrated high growth overall, have average to high levels of achievement (proficiency rates) overall, and excel in promoting equity based on growth for students with prior below proficient performance.
• MEETING EXPECTATIONS: Schools in this category have demonstrated acceptable levels of achievement and growth overall and are showing acceptable progress in promoting equity based on growth for students with prior below proficient performance.
• PARTIALLY MEETING EXPECTATIONS: Schools in this category have demonstrated either acceptable levels of growth or acceptable levels of achievement overall. Schools in this category may or may not show acceptable performance in promoting equity based on growth for students with prior below proficient performance.
• NOT MEETING EXPECTATIONS: This category is reserved for schools with unacceptable performance on many or most indicators. For schools in this category improvement is a priority. These schools have low levels of achievement overall and demonstrate low to average growth overall and fall short of producing growth for below proficient students that will move them toward proficiency.
31
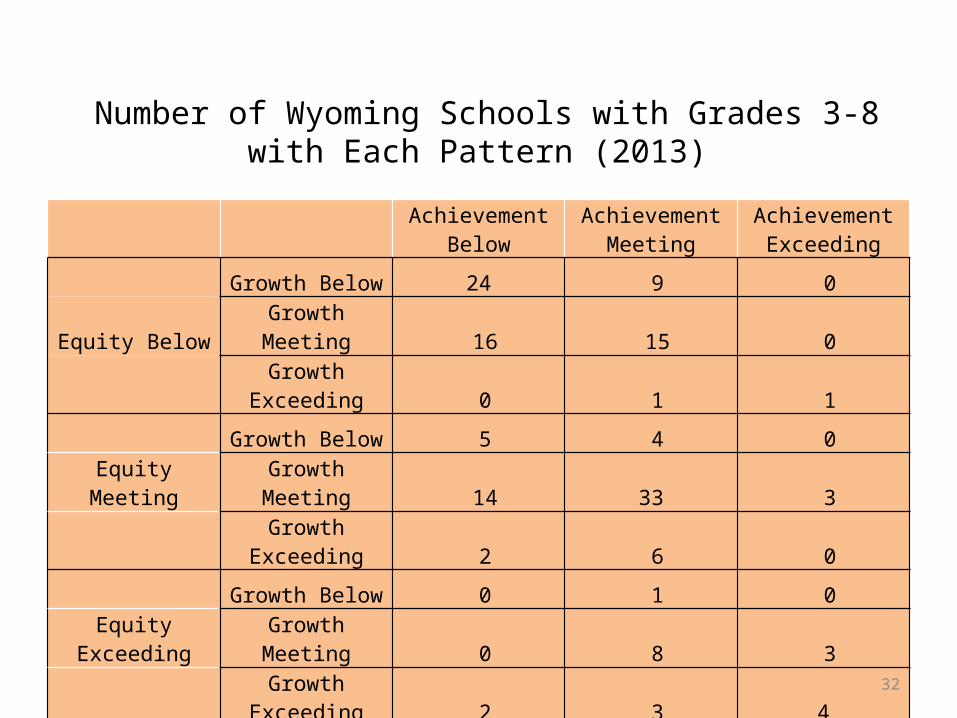
Achievement Below
Achievement Meeting
Achievement Exceeding
Growth Below 24 9 0
Equity BelowGrowth Meeting 16 15 0
Growth
Exceeding 0 1 1
Growth Below 5 4 0
Equity MeetingGrowth Meeting 14 33 3
Growth
Exceeding 2 6 0
Growth Below 0 1 0Equity
ExceedingGrowth Meeting 0 8 3
Growth
Exceeding 2 3 4
Number of Wyoming Schools with Grades 3-8 with Each Pattern (2013)
32
Wyoming WDE and SBE
Decision Table for Schools with Two Indicators for Grades 3-8
33
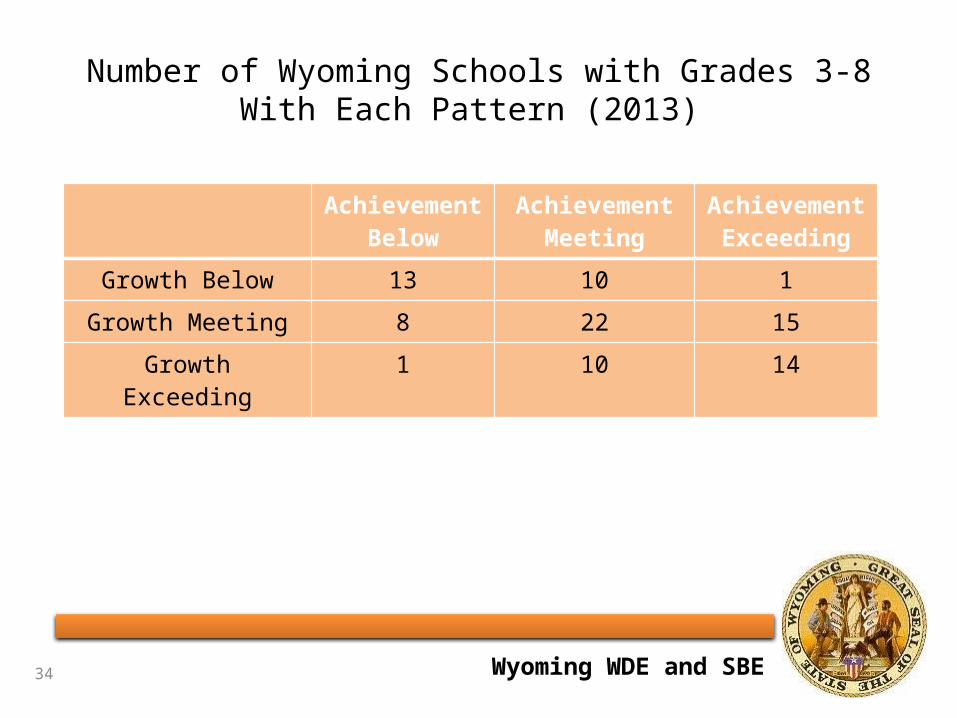
Achievement Below
Achievement Meeting
Achievement Exceeding
Growth Below NOT PARTIALLY PARTIALLY
Growth Meeting PARTIALLY MEETING MEETING
Growth Exceeding PARTIALLY MEETING EXCEEDING
Wyoming WDE and SBE
Number of Wyoming Schools with Grades 3-8 With Each Pattern (2013)
34
Achievement Below
Achievement Meeting
Achievement Exceeding
Growth Below 13 10 1
Growth Meeting 8 22 15
Growth Exceeding 1 10 14
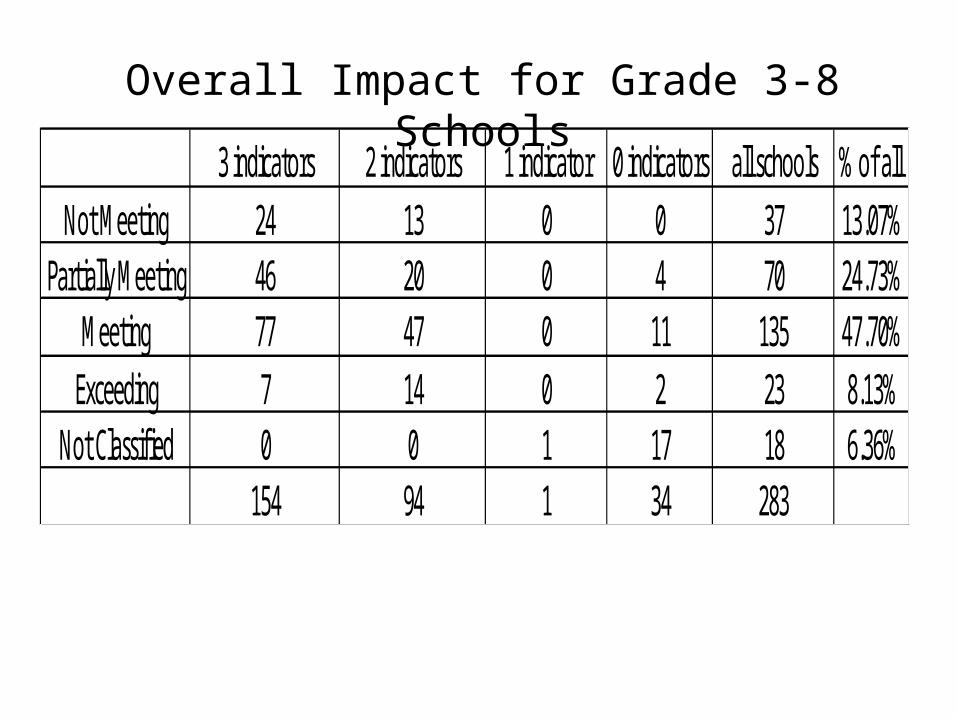
3 indicators 2 indicators 1 indicator 0 indicators all schools % of all Not Meeting 24 13 0 0 37 13.07%
Partially Meeting 46 20 0 4 70 24.73%Meeting 77 47 0 11 135 47.70%
Exceeding 7 14 0 2 23 8.13%Not Classified 0 0 1 17 18 6.36%
154 94 1 34 283
Overall Impact for Grade 3-8 Schools
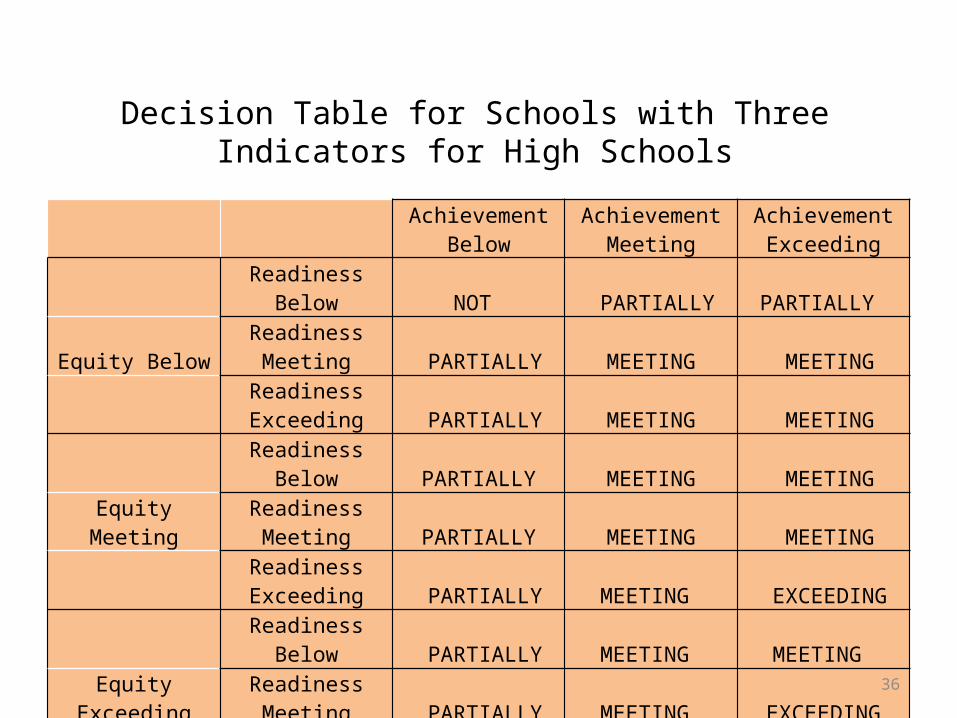
Achievement Below
Achievement Meeting
Achievement Exceeding
Readiness
Below NOT PARTIALLY PARTIALLY
Equity BelowReadiness Meeting PARTIALLY MEETING MEETING
Readiness Exceeding PARTIALLY MEETING MEETING
Readiness
Below PARTIALLY MEETING MEETING
Equity MeetingReadiness Meeting PARTIALLY MEETING MEETING
Readiness Exceeding PARTIALLY MEETING EXCEEDING
Readiness
Below PARTIALLY MEETING MEETING Equity
ExceedingReadiness Meeting PARTIALLY MEETING EXCEEDING
Readiness Exceeding PARTIALLY MEETING EXCEEDING
Decision Table for Schools with Three Indicators for High Schools
36
Wyoming WDE and SBE
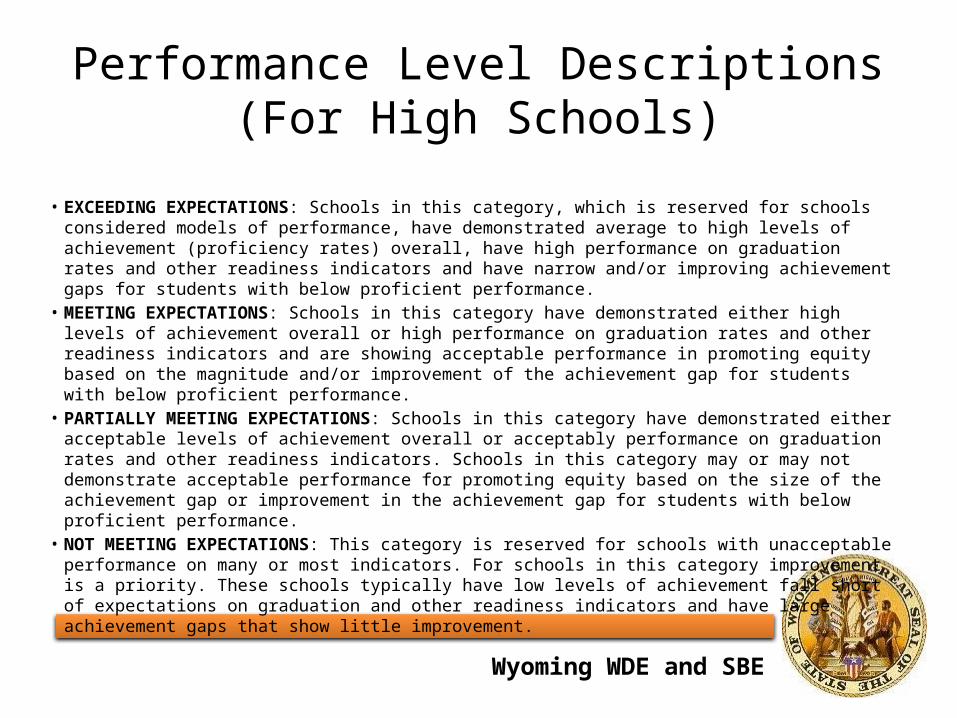
Performance Level Descriptions(For High Schools)
• EXCEEDING EXPECTATIONS: Schools in this category, which is reserved for schools
considered models of performance, have demonstrated average to high levels of achievement (proficiency rates) overall, have high performance on graduation rates and other readiness indicators and have narrow and/or improving achievement gaps for students with below proficient performance.
• MEETING EXPECTATIONS: Schools in this category have demonstrated either high levels of achievement overall or high performance on graduation rates and other readiness indicators and are showing acceptable performance in promoting equity based on the magnitude and/or improvement of the achievement gap for students with below proficient performance.
• PARTIALLY MEETING EXPECTATIONS: Schools in this category have demonstrated either acceptable levels of achievement overall or acceptably performance on graduation rates and other readiness indicators. Schools in this category may or may not demonstrate acceptable performance for promoting equity based on the size of the achievement gap or improvement in the achievement gap for students with below proficient performance.
• NOT MEETING EXPECTATIONS: This category is reserved for schools with unacceptable performance on many or most indicators. For schools in this category improvement is a priority. These schools typically have low levels of achievement fall short of expectations on graduation and other readiness indicators and have large achievement gaps that show little improvement.
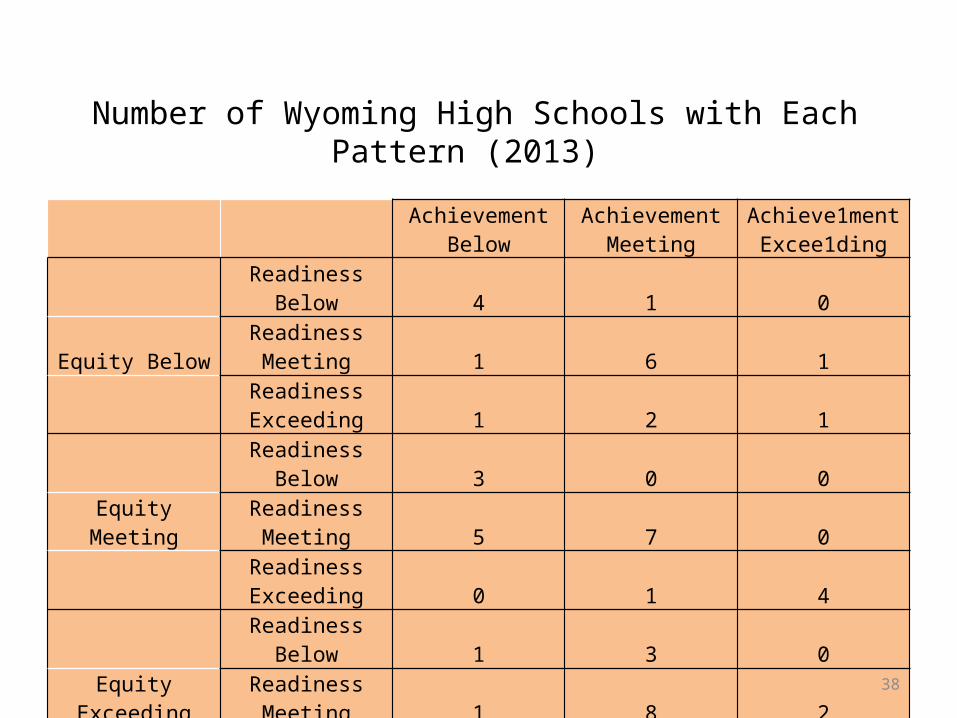
Achievement Below
Achievement Meeting
Achieve1ment Excee1ding
Readiness
Below 4 1 0
Equity BelowReadiness Meeting 1 6 1
Readiness Exceeding 1 2 1
Readiness
Below 3 0 0
Equity MeetingReadiness Meeting 5 7 0
Readiness Exceeding 0 1 4
Readiness
Below 1 3 0Equity
ExceedingReadiness Meeting 1 8 2
Readiness Exceeding 0 0 1
Number of Wyoming High Schools with Each Pattern (2013)
38
Wyoming WDE and SBE
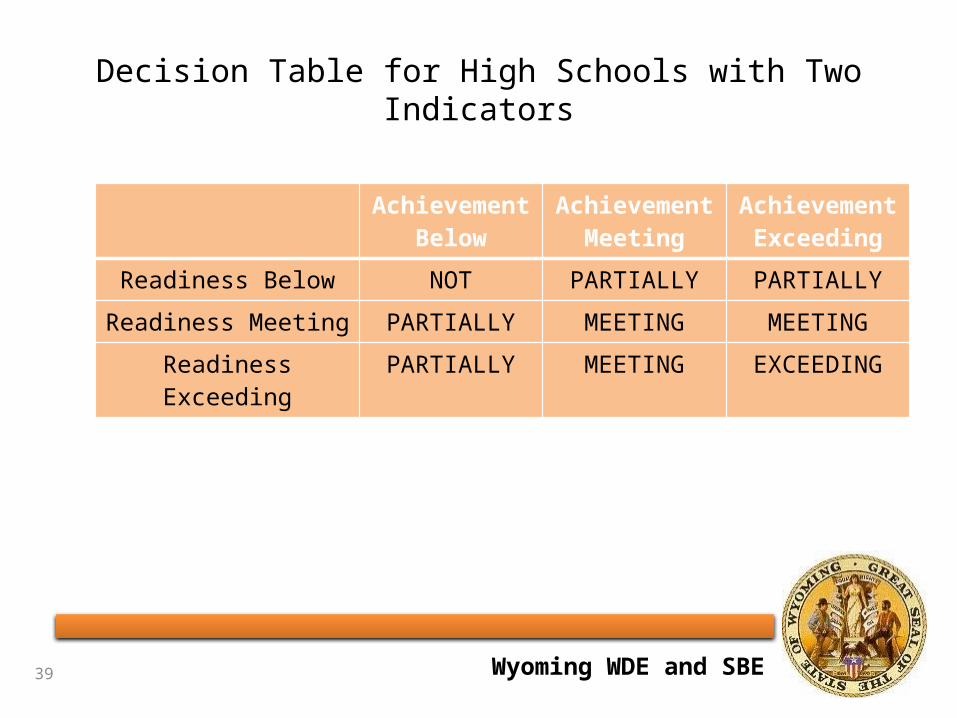
Decision Table for High Schools with Two Indicators
39
Achievement Below
Achievement Meeting
Achievement Exceeding
Readiness Below NOT PARTIALLY PARTIALLY
Readiness Meeting PARTIALLY MEETING MEETING
Readiness Exceeding
PARTIALLY MEETING EXCEEDING
Wyoming WDE and SBE
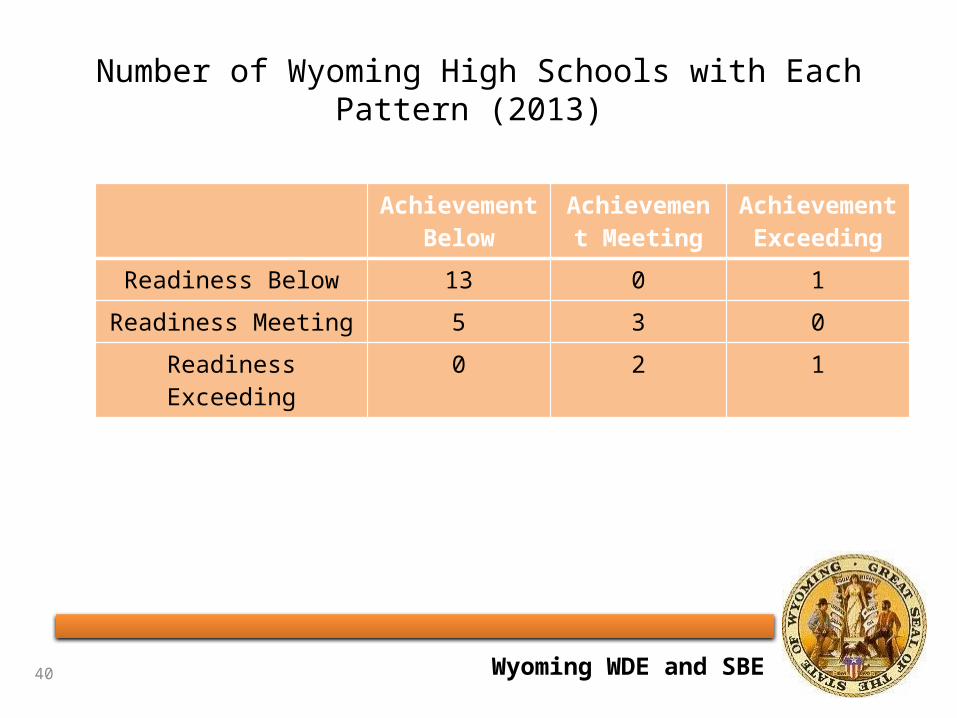
Number of Wyoming High Schools with Each Pattern (2013)
40
Achievement Below
Achievement Meeting
Achievement Exceeding
Readiness Below 13 0 1
Readiness Meeting 5 3 0
Readiness Exceeding
0 2 1
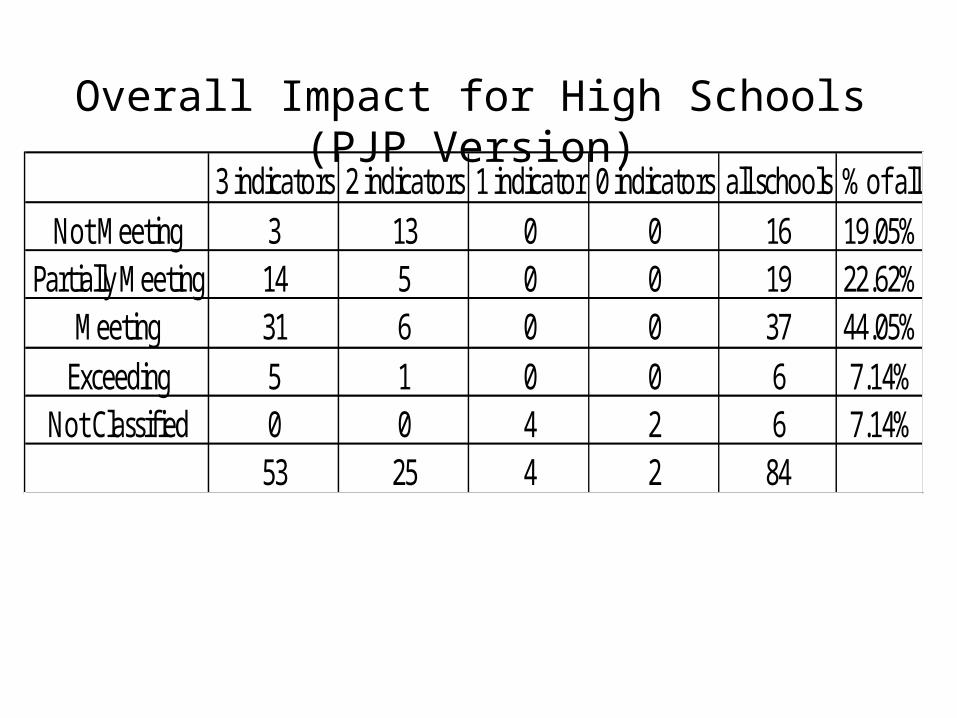
3 indicators 2 indicators 1 indicator 0 indicators all schools % of allNot Meeting 3 13 0 0 16 19.05%
Partially Meeting 14 5 0 0 19 22.62%Meeting 31 6 0 0 37 44.05%
Exceeding 5 1 0 0 6 7.14%Not Classified 0 0 4 2 6 7.14%
53 25 4 2 84
Overall Impact for High Schools (PJP Version)
Wyoming WDE and SBE
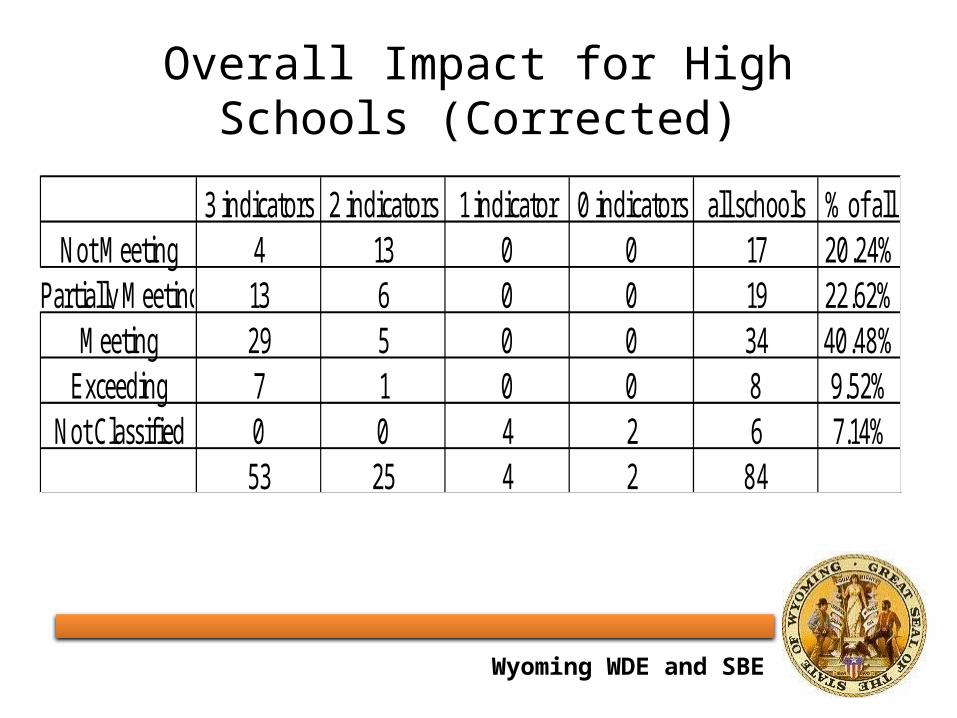
Overall Impact for High Schools (Corrected)
3 indicators 2 indicators 1 indicator 0 indicators all schools % of allNot Meeting 4 13 0 0 17 20.24%
Partially Meeting 13 6 0 0 19 22.62%Meeting 29 5 0 0 34 40.48%
Exceeding 7 1 0 0 8 9.52%Not Classified 0 0 4 2 6 7.14%
53 25 4 2 84
Wyoming WDE and SBE
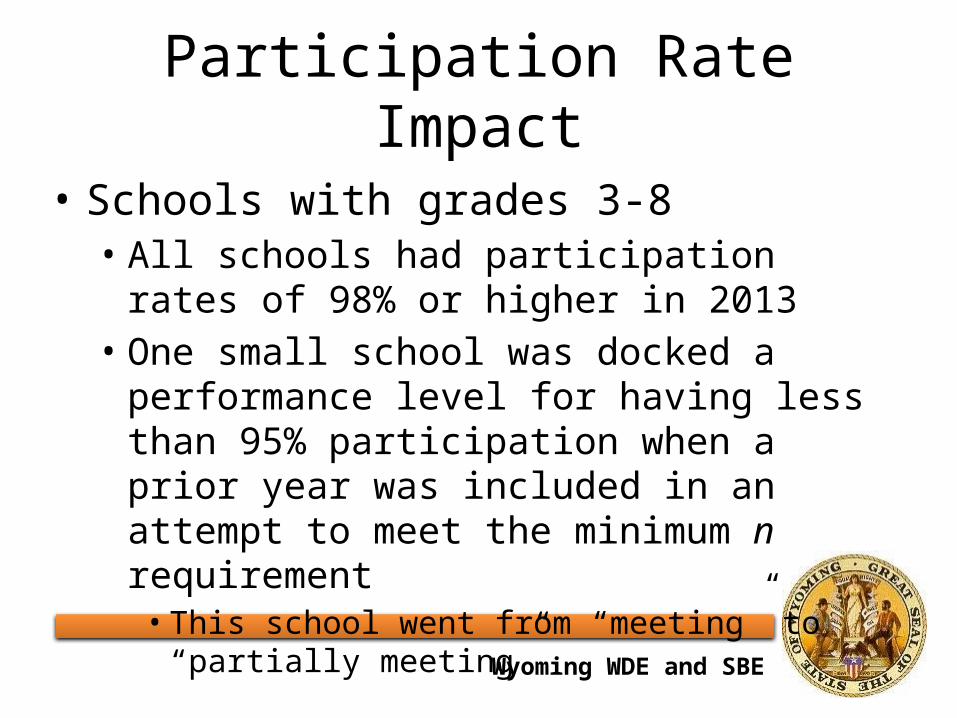
Participation Rate Impact
• Schools with grades 3-8• All schools had participation rates of
98% or higher in 2013• One small school was docked a
performance level for having less than 95% participation when a prior year was included in an attempt to meet the minimum n requirement• This school went from “meeting” to
“partially meeting”
Wyoming WDE and SBE
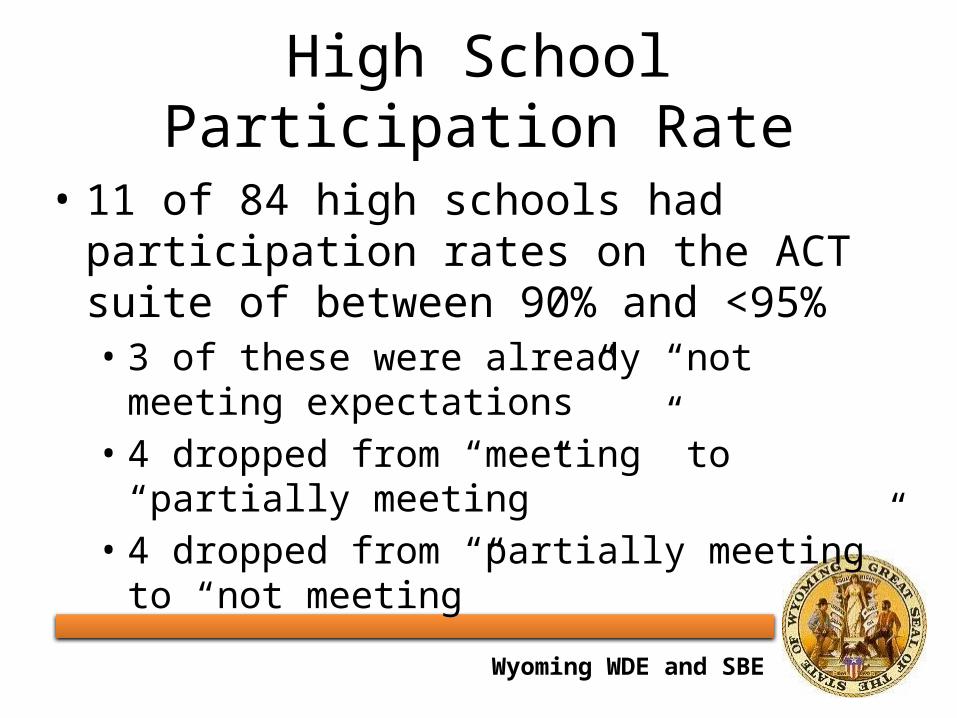
High School Participation Rate
• 11 of 84 high schools had participation rates on the ACT suite of between 90% and <95% • 3 of these were already “not meeting
expectations”• 4 dropped from “meeting” to “partially
meeting”• 4 dropped from “partially meeting” to
“not meeting”
Wyoming WDE and SBE
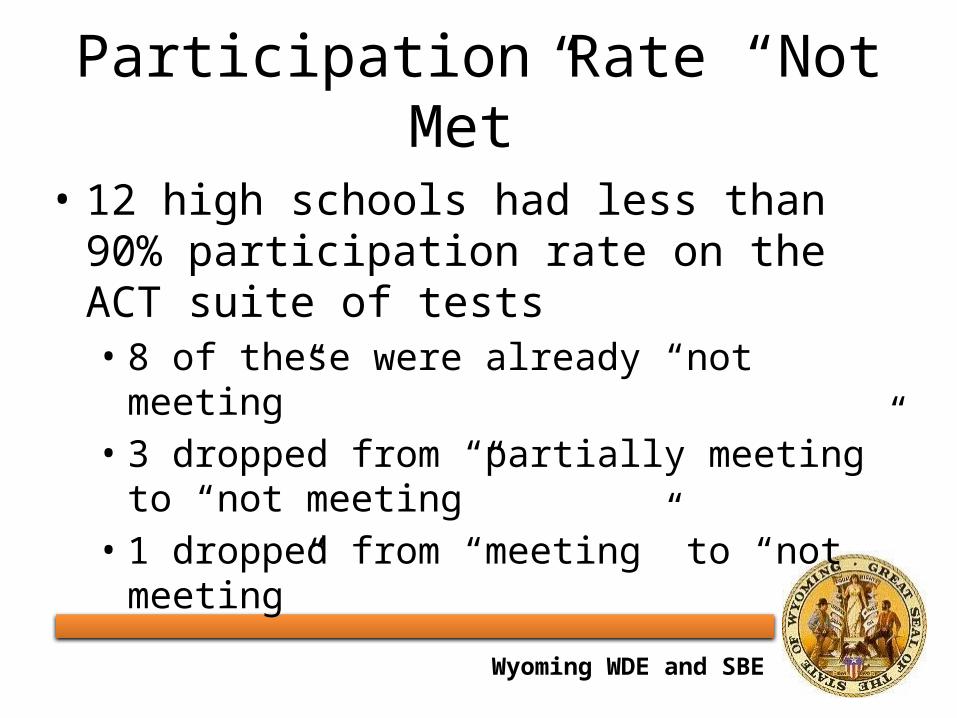
Participation Rate “Not Met”
• 12 high schools had less than 90% participation rate on the ACT suite of tests• 8 of these were already “not meeting” • 3 dropped from “partially meeting” to
“not meeting” • 1 dropped from “meeting” to “not
meeting”
Wyoming WDE and SBE
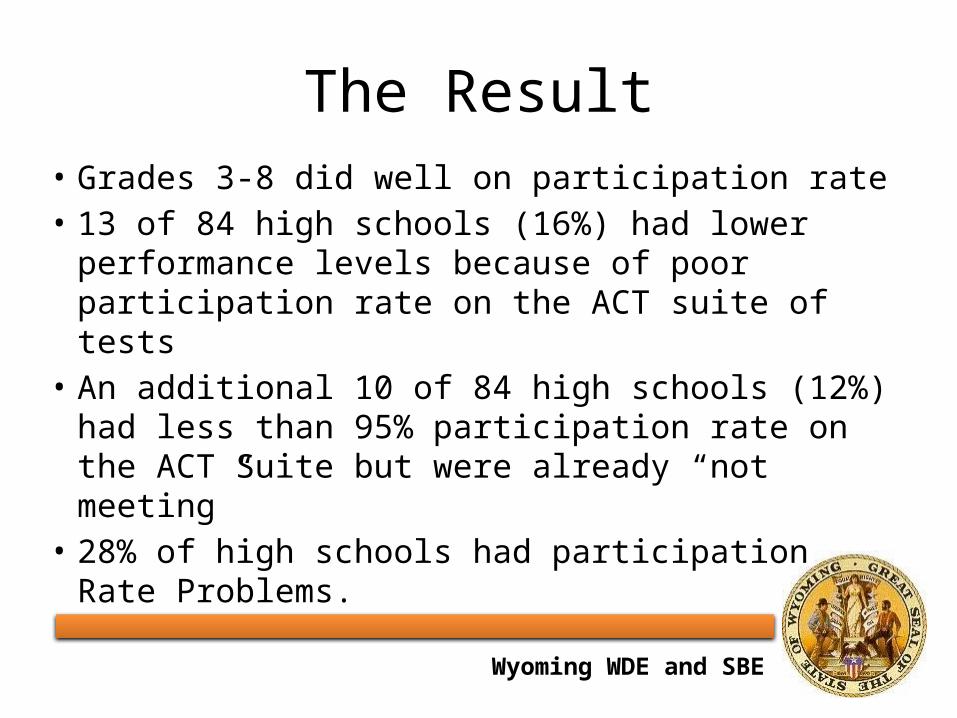
The Result• Grades 3-8 did well on participation rate• 13 of 84 high schools (16%) had lower
performance levels because of poor participation rate on the ACT suite of tests
• An additional 10 of 84 high schools (12%) had less than 95% participation rate on the ACT Suite but were already “not meeting”
• 28% of high schools had participation Rate Problems.
Wyoming WDE and SBE
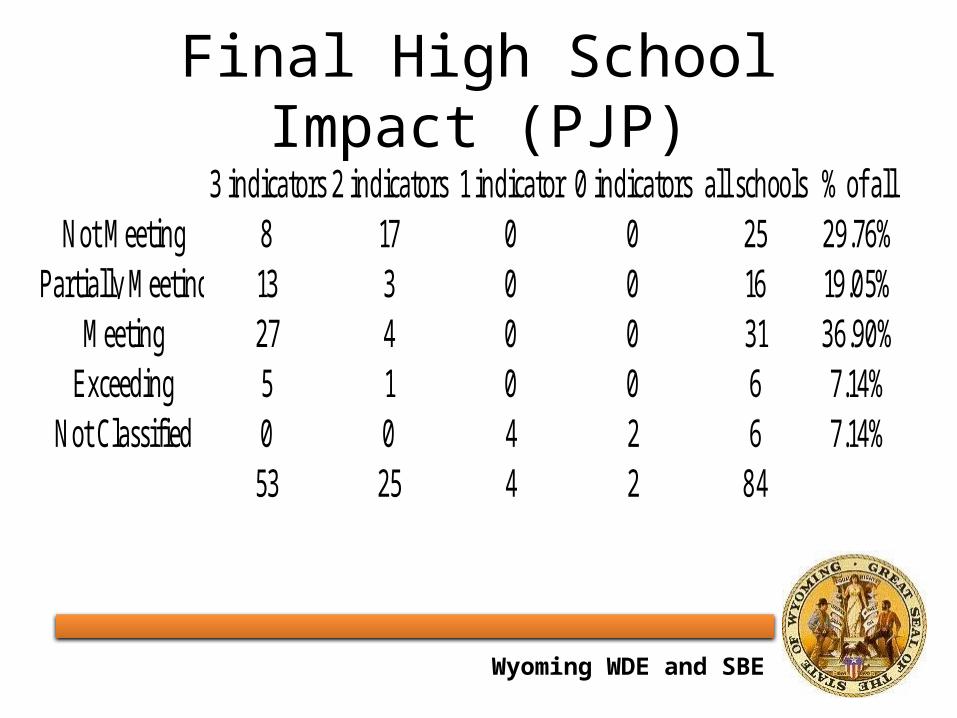
Final High School Impact (PJP)
3 indicators 2 indicators 1 indicator 0 indicators all schools % of allNot Meeting 8 17 0 0 25 29.76%
Partially Meeting 13 3 0 0 16 19.05%Meeting 27 4 0 0 31 36.90%
Exceeding 5 1 0 0 6 7.14%Not Classified 0 0 4 2 6 7.14%
53 25 4 2 84
Wyoming WDE and SBE
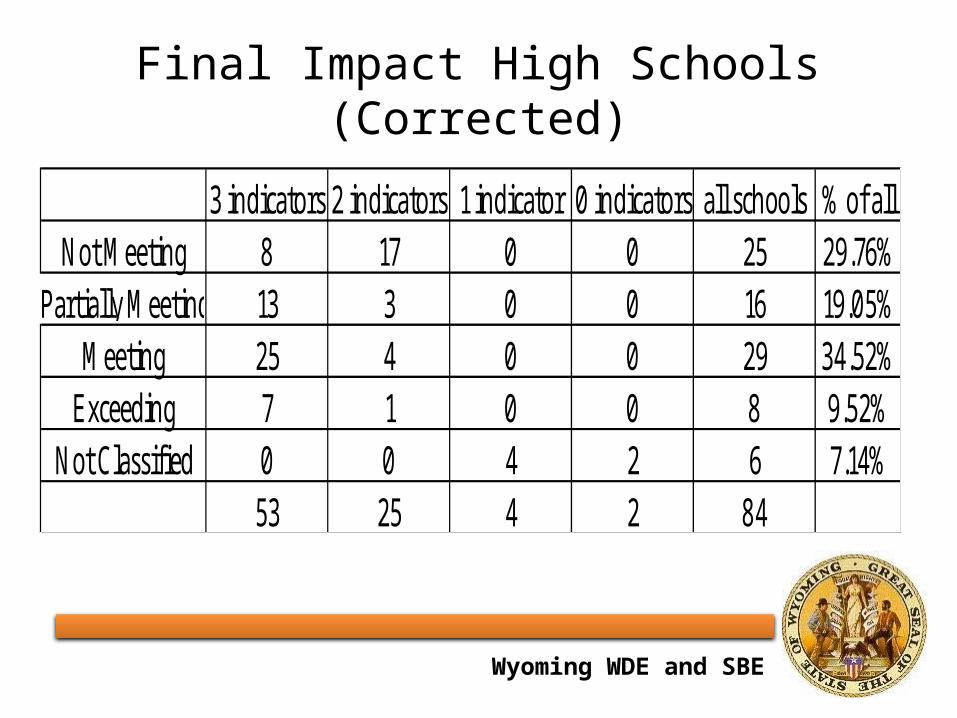
Final Impact High Schools (Corrected)
3 indicators 2 indicators 1 indicator 0 indicators all schools % of allNot Meeting 8 17 0 0 25 29.76%
Partially Meeting 13 3 0 0 16 19.05%Meeting 25 4 0 0 29 34.52%
Exceeding 7 1 0 0 8 9.52%Not Classified 0 0 4 2 6 7.14%
53 25 4 2 84
Wyoming WDE and SBE
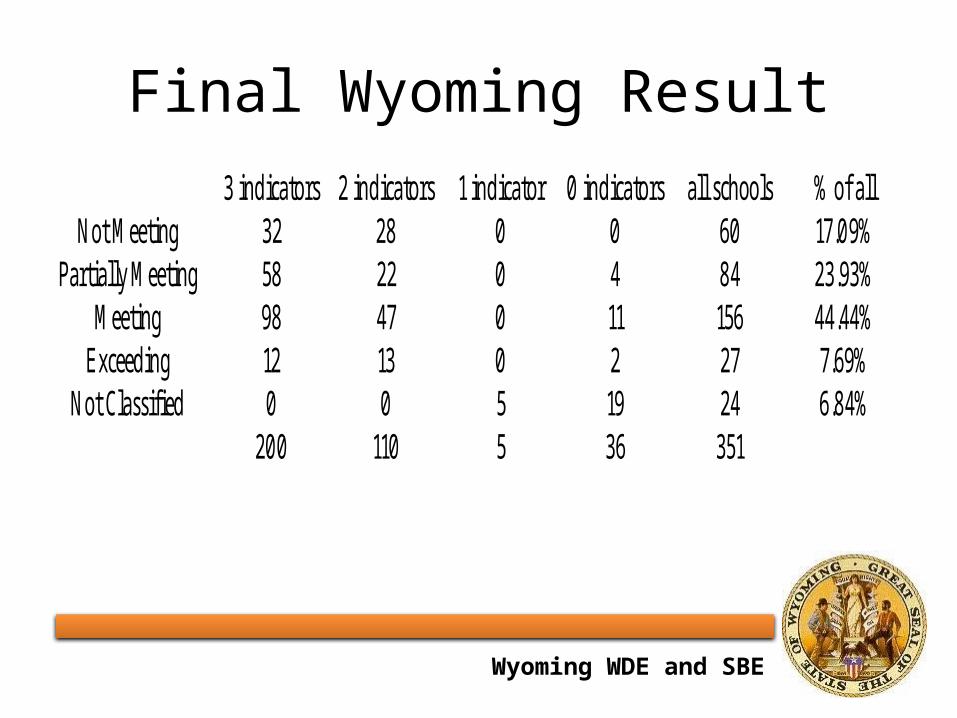
Final Wyoming Result3 indicators 2 indicators 1 indicator 0 indicators all schools % of all
Not Meeting 32 28 0 0 60 17.09%Partially Meeting 58 22 0 4 84 23.93%
Meeting 98 47 0 11 156 44.44%Exceeding 12 13 0 2 27 7.69%
Not Classified 0 0 5 19 24 6.84%200 110 5 36 351
Wyoming WDE and SBE
Contact Information
• Michael Flicek• [email protected]• 307-259-3963
• John Paul• [email protected]• 307-777-8771