dr. rich mackenzie, nrem 665, 10/9/08 · outwelling hypothesis organic matter from salt...
TRANSCRIPT

Fish Habitat Value of Coastal Wetlands
Dr. Rich MacKenzie, NREM 665, 10/9/08

Outwelling Hypothesis
Organic matter from salt marshOrganic matter from salt marshTeal 1962, Haines 1976, Haines 1977, Odum 2000
Coastal Ocean

Trophic transfer
Adult resident nekton
Coastal Ocean
Subtidalh l
Intertidalchannels
Intertidalpuddles
Open
channels
Open Estuary
Kneib 1997 2000

Trophic transfer
Coastal Ocean
Subtidalh l
Intertidalchannels
Intertidalpuddles
Open
channels
Open Estuary
Kneib 1997, 2000

Trophic transfer“Ontogenetic shift”
Adult residentnekton
g
Young resident nekton
Juvenile residentnekton
Coastal Ocean
Subtidalh l
Intertidalchannels
Intertidalpuddles
Open
channels
Open Estuary
Kneib 1997, 2000

Trophic transfer
Coastal Ocean
Subtidalh l
Intertidalchannels
Intertidalpuddles
Open
channels
Open Estuary
Kneib 1997, 2000

100
Food
80
100
uts
w/
60
80
Flood tide
chog
G
40
Ebb tide
Mum
mic
20
1 cm
% M
05/28 6/11 6/25 7/9 7/23
modified from Allen et al. 1994

Growth rates of mummichogswere significantly higher in fishwere significantly higher in fish
with access to marsh surface
d) 0.4
row
th ra
te G
(g/d
0.1
0.2
0.3
Inst
anta
neou
s g
-0.2
-0.1
0.0
Unrestricted Restricted0.2
Weisberg and Lotrich 1982

Trophic transferTransient marine nekton
(juvenile and adults)(juvenile and adults)
Coastal Ocean
Subtidalh l
Intertidalchannels
Intertidalpuddles
Open
channels
Open Estuary
Kneib 1997, 2000, Deegan and Garritt 1997, Deegan et al 2000,

Micropogonias undulatus
Mummichogs represented 8-43% of the diets of Atlantic croakerAtlantic croaker
Morone saxitilis
Mummichogs represented 9-23% of the diets of t i d bstriped bass
(Tupper and Able 2000, Nemerson 2001)


South Atlantic Salt Marsh
1
2
“Higher”marsh
Spartina alternifloralow marsh
Mudflat
Tida
l Ht (
m)
-1
0
-2
New England Salt Marsh
Spartina patenshigh marsh
S. alternifloralow marsh
Mudflatg low marsh
al H
t (m
)
0
1
2
Tida
-2
-1

salt marsh pools
• 12% of marsh surface is covered with salt marsh poolsp
• 5500 pools/300 haDionne 2006

Fundulus heteroclitus

OBJECTIVEOBJECTIVE
determine the habitat value of Spartina patens marsh surfacefor resident mummichogs:) f1) resident fish production
2) stable isotope (15N, 13C)

“POOL ONLY”OO O

“POOL PLUS MARSH”“POOL PLUS MARSH”Vegetated area = 3x surface area of pool

“CONTROL”


Pictures of weighing and measuringPictures of weighing and measuring
P = Ginst * B Chapman 1978

Webhannet Marsh2003
0.8Total Production ns a
0.4
0.6
0.2
n (g
m-2
d-1
)
Control PoolMars PoolOnly0.0
Moody Marsh2003ar
y Pr
oduc
tion
0 8
Seco
nda
0.6
0.8Total Production ns b
0.2
0.4
MacKenzie and Dionne In pressControl PoolMars PoolOnly0.0
0.2

Stable Stable isotopes 101isotopes 101pp
C b (13C/12C) Nit (15N/14N) S lf (34S/32S)Carbon (13C/12C), Nitrogen (15N/14N), Sulfur (34S/32S)
δX = [(Rsample/Rstandard)-1] x 1,000p
X = 13C, 15N, 34Sd i t f il ‰expressed in terms of per mil, ‰

Salt Marsh Food Web
8
)
6
PhytoplanktonS. patens
δ 15
N (‰
)
4
0
2
δ 13C (‰)
-35 -30 -25 -20 -15 -100
Two food sources: phytoplankton and S. patens marsh grass

Salt Marsh Food Web
8
)
6
PhytoplanktonS. patensFish
δ 15
N (‰
)
4
0
2
δ 13C (‰)
-35 -30 -25 -20 -15 -100
If a fish only feeds on phytoplankton, the Carbon signature for the fish will be similar to Carbon signature of phytoplankton

Salt Marsh Food Web
8
)
6
PhytoplanktonS. patensFish
δ 15
N (‰
)
4
0
2
δ 13C (‰)
-35 -30 -25 -20 -15 -100
If a fish only feeds on S. patens, the C signature of the fish will be similar to the C signature of the S. patens

Salt Marsh Food Web
8
)
6
PhytoplanktonS. patensFish
δ 15
N (‰
)
4
0
2
δ 13C (‰)
-35 -30 -25 -20 -15 -100
If a fish feeds equally on phytoplankton and S. patens, the C signatureof the fish will be between the C signatures of the phytoplankton and the S. patens

Salt Marsh Food Web
8
)
6
PhytoplanktonS. patensFishPredatory Fish
δ 15
N (‰
)
4
0
2
δ 13C (‰)
-35 -30 -25 -20 -15 -100
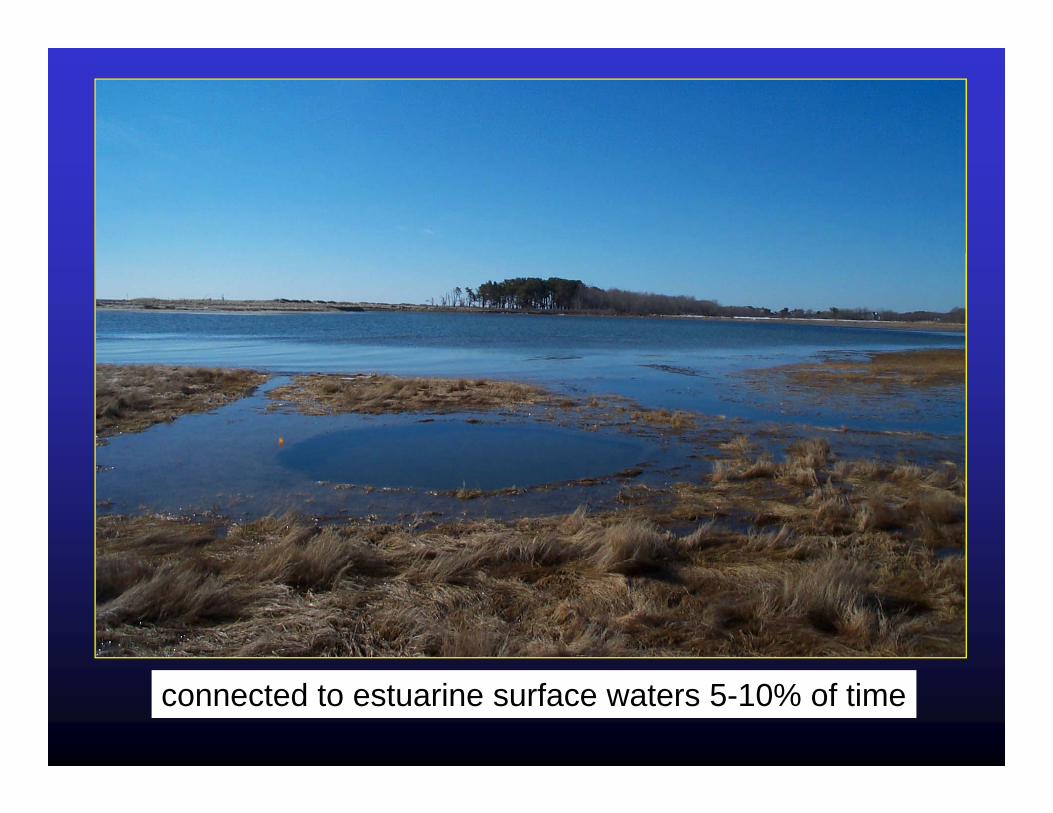
connected to estuarine surface waters 5-10% of time

K15NO3 additions- 5% background levels of NO3

200260
Mummichog200250
CPOM
EPI
MummichogN
(‰)
30
40FPOM
δ 15
N
20
30
10BMA
PATENS
13C (‰)
-18 -17 -16 -15 -14 -13 -12 -11 -100
δ 13C (‰)
Phillips and Gregg 2003

on
20020.8
1.0CPOMFPOMBenthic MicroalgaeEpiphytic AlgaeS
t Con
trib
utio
0
0.6
S. patens
Perc
ent
0.2
0.4
Control Pool-Plus-Marsh0.0
MacKenzie and Dionne In review

20020.8
1.0CPOMFPOMBenthic MicroalgaeEpiphytic AlgaeS t
0 4
0.6
S. patens
butio
n 0.2
0.4
2003rcen
t Con
tri
0.8CPOMFPOM
Control Pool-Plus-Marsh0.0
Per
0.6
Benthic MicroalgaeEpiphytic AlgaeS. patens
0.2
0.4
Control Pool-Plus-Marsh Pool-Only0.0

2
2003
6/2 6/16 6/30 7/14 7/28 8/11 8/25ve
l (m
)
1
2an
Sea
Le
0
1
ve to
Mea
1
0
eigh
t rel
ati
2
-1
Tide
he
3
-22002 height (m)2003 height (m)Average marsh elevation (m)
2002
6/3 6/17 7/1 7/15 7/29 8/12 8/26 -3
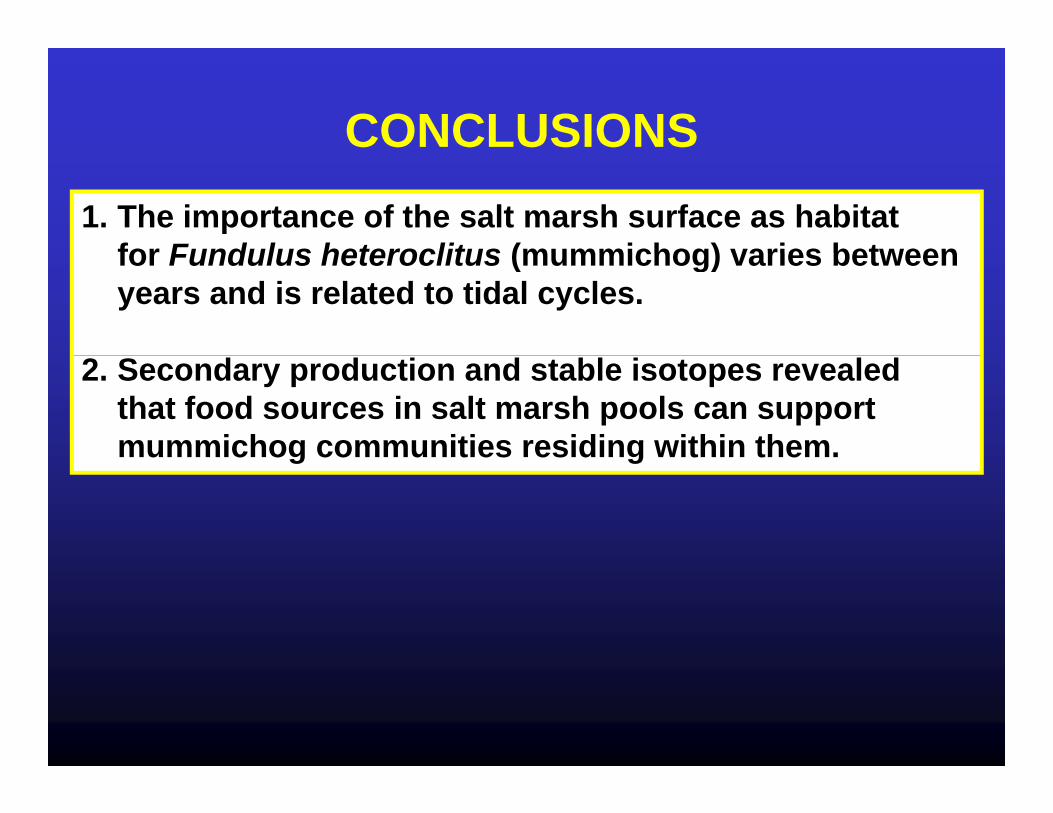
CONCLUSIONS1. The importance of the salt marsh surface as habitat
for Fundulus heteroclitus (mummichog) varies betweenfor Fundulus heteroclitus (mummichog) varies between years and is related to tidal cycles.
2. Secondary production and stable isotopes revealedthat food sources in salt marsh pools can supportmummichog communities residing within them.g g

Mangrove Ecosystemsg y

Mangrove Distribution in 2005Mangrove Distribution in 2005
25-30o N
25-30o S
Globally: 15,200,000 – 17,000,000 haOceania: 1,972,000 haMi i 13 349 hMicronesia: 13,349 ha Oahu: 147 ha

Bruguiera gymnorrhiza
Five major families of mangrove trees:AvicenniaceaeCombretaceaePalmaePalmaeRhizophoraceaeSonneratiaceae

Distribution of mangrove species in the Indo Pacific region
020Indo West Pacific (IWP)
P A C I F I C O C E A N
EQUATOR
5
10
5
10 2030
30Palau
Pohnpei
Kosrae
I N D I AN O C E A N
102030
30 205
4010
CORAL�SEA 5
100
World spp ~70 total 58 IWP & 12 AEP
Moreton
0
NB: Curved lines represent species number boundaries
World spp 70 total, 58 IWP & 12 AEP
NC Duke et al. 1998
Tree species richness w/in mangrove forests in Micronesia ranges from 19-11

Sonneratia alba
Rhizophora spp. p pp

Mangroves in the Caribbean
Coral reefShallow coral reef
Mumby et al. 2004Coral reefShallow coral reef

Mangrove outwellingAbove ground NPP14 838 kg C/ha/yr14,838 kg C/ha/yr
Litter export to creeks
2,738 kg C/ha/yr
Litterfall3,438 kg C/ha/yr
resident fish
Consumption Faeces462 C/ /
transient fish
pby crabs
700 kg C/ha/yr462 kg C/ha/yr
Microbial pool DOMp???? ????
Modified from Robertson et al. 1992

Perisesarma messa
Uca sp.

Japan
Hawaii
GuamPhilippines CNMI
Palau
YapChuuk Pohnpei Marshall
IslandsKosrae
NewCaledonia
TahitiAmericanSamoa
Fiji


cut prop root
mangrove trees
p p
floatsTid d fi hTide and fishmove into mangrove

Tide movesout of mangrove, fish migrate into
seaward end of net

Glass FishGlass Fish
Cardinal FishCardinal Fish

Utwe-Walung Marine Park14
16al
Fis
h
12
14C
ardi
na
8
10
F i
Cardinal Fish
mbe
r of
4
6FringeInterior
Num
2
4
Fi h L th ( )20 30 40 50 60
0
Fish Length (mm)Significantly smaller fish ( p < 0.01) were collected from the mangrove interior (avg length = 34.2 ± 1.3 mm ) vs. fringe (avg length = 40.0 ± 1.0 mm).

MANGROVE FOOD WEB
14Mangrove Leaves
)
10
12Mangrove LeavesAlgae in mudAlgae on rocks/rootsSeagrass
δ 15
N (‰
)
6
8
0
2
4
δ 13C (‰)
-35 -30 -25 -20 -15 -10 -50
mangroves Seagrass

MANGROVE FOOD WEB
14Mangrove Leaves
Periophthalmus sp. (mudskipper) Kuhlia sp. (flagtail)
)
10
12Mangrove LeavesBenthic microalgaeEpiphytic algaeEnhalus seagrassMudskipperShrimpFlagtail
live in mangroves
δ 15
N (‰
)
6
8Flagtail
Macrobrachium lar shrimp
0
2
4Macrobrachium lar shrimp
δ 13C (‰)
-35 -30 -25 -20 -15 -10 -50

MANGROVE FOOD WEBBlacktail snapper
14Mangrove Leaves
)
10
12Mangrove LeavesBenthic microalgaeEpiphytic algaeEnhalus seagrassMudskipperShrimpFl t il
δ 15
N (‰
)
6
8FlagtailBlacktail SnapperEmperor Fish
0
2
4
Emperor Fish
δ 13C (‰)
-35 -30 -25 -20 -15 -10 -50

Mangrove outwellingAbove ground NPP14 838 kg C/ha/yr14,838 kg C/ha/yr
Litter export to creeks
2,738 kg C/ha/yr
Litterfall3,438 kg C/ha/yr
Consumption pby crabs
700 kg C/ha/yr
Modified from Robertson et al. 1992

“…ecological systems of small islands and the functions that they perform, will besensitive to the rate and magnitude of climate change and sea level raise, especiallywhere exacerbated by human activities.” (IPCC, 2007)

Low Zone IntermediateZone High ZoneZone g

High
Low Intermediate
g

High Zone
IMPACTS OF INCREASED FLOODINGON LEAF RESIDENCE TIMEHigh Zone
Intermediate ZonePlaced 9, colored leaves in each of the 3 zones righteach of the 3 zones right before high tide. Returned after 2 consecutive tides to
h f l
Low Zone
measure how far leavesmoved.

) 1400
4 ho
urs
1200 Low ZoneIntermediate ZoneHi h Z
d (c
m/2
4
800
1000High Zone
vele
led
600
800P < 0.05
ance
tra
400 ns
Dis
ta
0
200 ? ?
2007July August

IMPACTS OF INCREASED FLOODING ON LEAF CONSUMPTION BY CRABSLEAF CONSUMPTION BY CRABS
Tethered 5 leaves in each of the three zones.

DAY 0 DAY 2
Photographed leaves on day 0, 1, and 2. Loss rate was g p ydetermined from change in surface area of leaf using ImageJ photoanalysis package.

110g 90
100
mai
ning
80
90
ent R
em
60
70
High Zone
Perc
e
50Intermediate ZoneLow Zone
30
40 P < 0.05
20078/13 8/14 8/15 8/16 8/17

WNERR Benthic TeamEric Brazer
Jim Dochtermann Cara Ellis
Mike “Bronco” HaasMike “Bronco” HaasJeremy MillerScott OrringerLexi Weintraub
Liz Wilson
Nicole Cormier
Palau Mangrove TeamCarmen PippitJ CNicole Cormier Jesse CruzLilah Xavier
Caitlin Kryss