dr. u. kerin, siemens ag pmu-based wide area protection
TRANSCRIPT

© Siemens AG, EM SG PTI , 2015 All rights reserved www.siemens.com
PMU-based Wide Area Protection System – Concept and application in a large longitudinal system
Dr. U. Kerin, Siemens AG

EPCC 2015, Bled, Slovenia Dr. Uros Kerin © Siemens AG, EM SG PTI, 2015 All rights reserved. May 17-20, 2015
Why is there an increasing demand for information
on power system operations ?
• growing demand on electrical energy world wide
• more and more renewable sources with fluctuating infeed
characteristic
• change of the role of conventional plants
• part load and flexible operation of conventional plants
• high flexibility of transmission
• hybrid system to interconnect new renewable sources with
the grid
• operation closer to the stability and capacity limits of the
system
• new targets : sustainability, environmental friendly sources
Page 2

EPCC 2015, Bled, Slovenia Dr. Uros Kerin © Siemens AG, EM SG PTI, 2015 All rights reserved. May 17-20, 2015
Development over time
Page 3
1960 1970 2000 2010
Passive electric systems (transformers, generators transmission lines, mechanical breakers) Passive electric systems (transformers, generators transmission lines, mechanical breakers)
Development of power systems
1980 1990
IGBT based FACTS, MT- HVDC
Complex intelligent systems power electronics, fast digital and protecition systems Complex intelligent systems power electronics, fast digital and protecition systems
Smart Grids
Distributed Generation
Electric Vehicles
First SCADA systems
Development of supervisory systems for power system control
PMU PMU
SCADA / EMS systems for power systems SCADA / EMS systems for power systems
Stability tools (DSA, TSA, VSA etc) Stability tools (DSA, TSA, VSA etc)
2020
EPCC 2015, Bled, Slovenia Dr. Uros Kerin © Siemens AG, EM SG PTI, 2015 All rights reserved. May 17-20, 2015
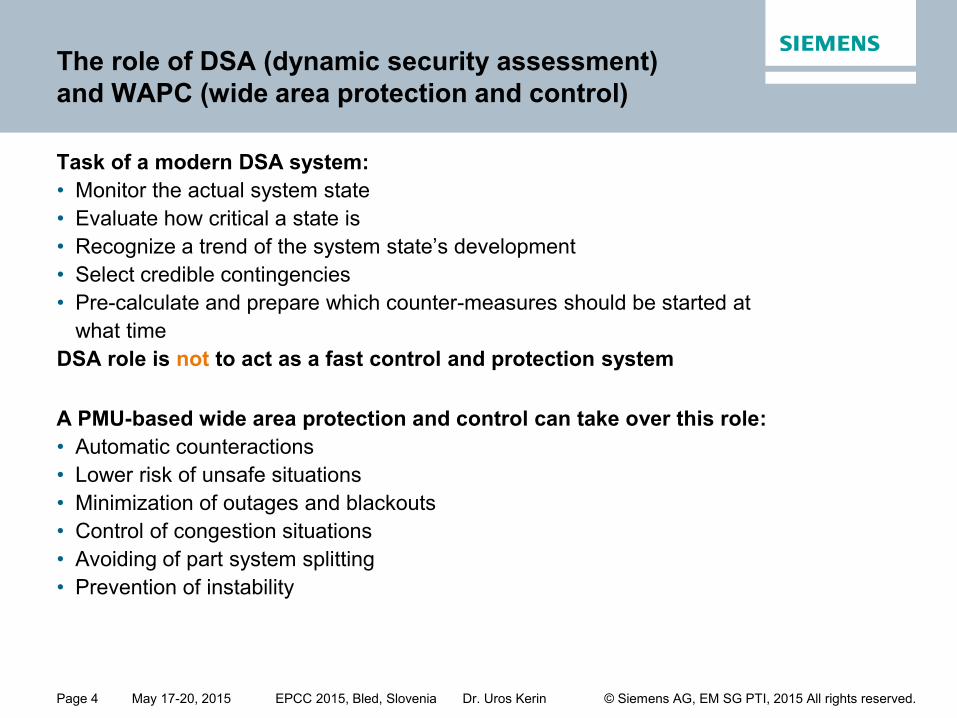
The role of DSA (dynamic security assessment)
and WAPC (wide area protection and control)
Task of a modern DSA system:
• Monitor the actual system state
• Evaluate how critical a state is
• Recognize a trend of the system state’s development
• Select credible contingencies
• Pre-calculate and prepare which counter-measures should be started at
what time
DSA role is not to act as a fast control and protection system
Page 4
A PMU-based wide area protection and control can take over this role:
• Automatic counteractions
• Lower risk of unsafe situations
• Minimization of outages and blackouts
• Control of congestion situations
• Avoiding of part system splitting
• Prevention of instability
EPCC 2015, Bled, Slovenia Dr. Uros Kerin © Siemens AG, EM SG PTI, 2015 All rights reserved. May 17-20, 2015
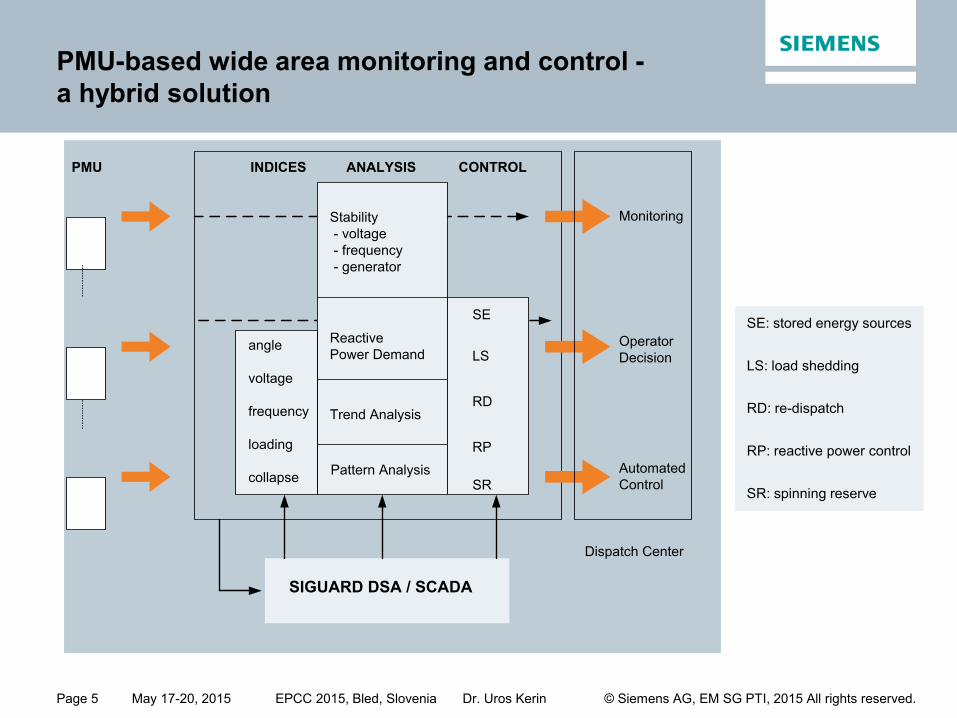
PMU-based wide area monitoring and control -
a hybrid solution
Page 5
SE: stored energy sources
LS: load shedding
RD: re-dispatch
RP: reactive power control
SR: spinning reserve
Stability
- voltage
- frequency
- generator
Reactive
Power Demand
Trend Analysis
Pattern Analysis
LS
RD
RP
Monitoring
Operator
Decision
Automated
Control
INDICES ANALYSIS CONTROL
SIGUARD DSA / SCADA
PMU
SE
SR
Dispatch Center
angle
voltage
frequency
loading
collapse
EPCC 2015, Bled, Slovenia Dr. Uros Kerin © Siemens AG, EM SG PTI, 2015 All rights reserved. May 17-20, 2015
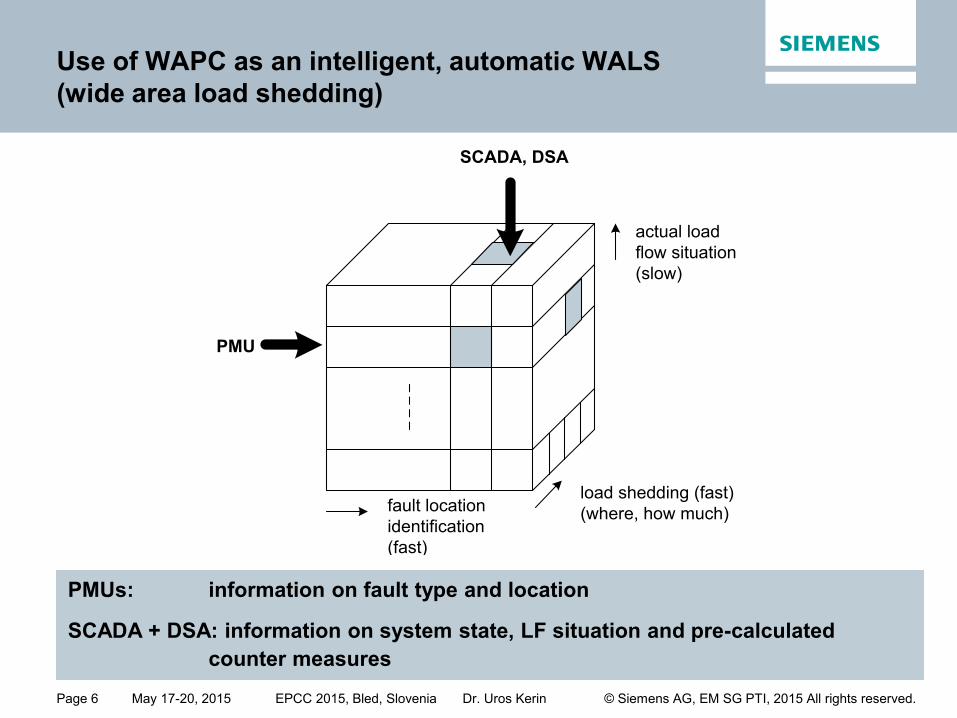
Use of WAPC as an intelligent, automatic WALS
(wide area load shedding)
Page 6
fault location
identification
(fast)
load shedding (fast)
(where, how much)
actual load
flow situation
(slow)
PMU
SCADA, DSA
PMUs: information on fault type and location
SCADA + DSA: information on system state, LF situation and pre-calculated
counter measures
EPCC 2015, Bled, Slovenia Dr. Uros Kerin © Siemens AG, EM SG PTI, 2015 All rights reserved. May 17-20, 2015
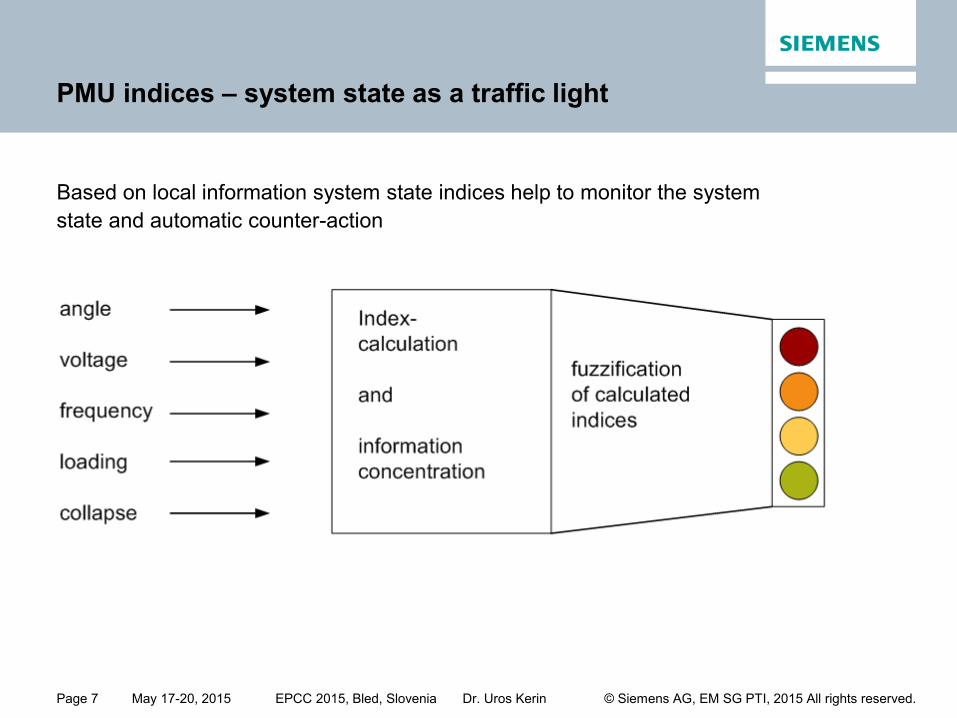
PMU indices – system state as a traffic light
Based on local information system state indices help to monitor the system
state and automatic counter-action
Page 7

EPCC 2015, Bled, Slovenia Dr. Uros Kerin © Siemens AG, EM SG PTI, 2015 All rights reserved. May 17-20, 2015
PMU indices to analyze system dynamic and stability
• Small signal stability index (SSSI)
• Angle index (AI)
• Frequency gradient index (FGI)
• Maximum Frequency Deviation Index (MFDI)
• Quasi-Stationary Voltage Index (QSVI)
• Voltage Drop Index (VDI)
• Voltage Ride Through Index (VRTI)
• Line Power Flow Index (LPFI)
• Transformer Power Flow Index (TPFI)
• Nodal Loading Index (NLI)
Page 8
EPCC 2015, Bled, Slovenia Dr. Uros Kerin © Siemens AG, EM SG PTI, 2015 All rights reserved. May 17-20, 2015
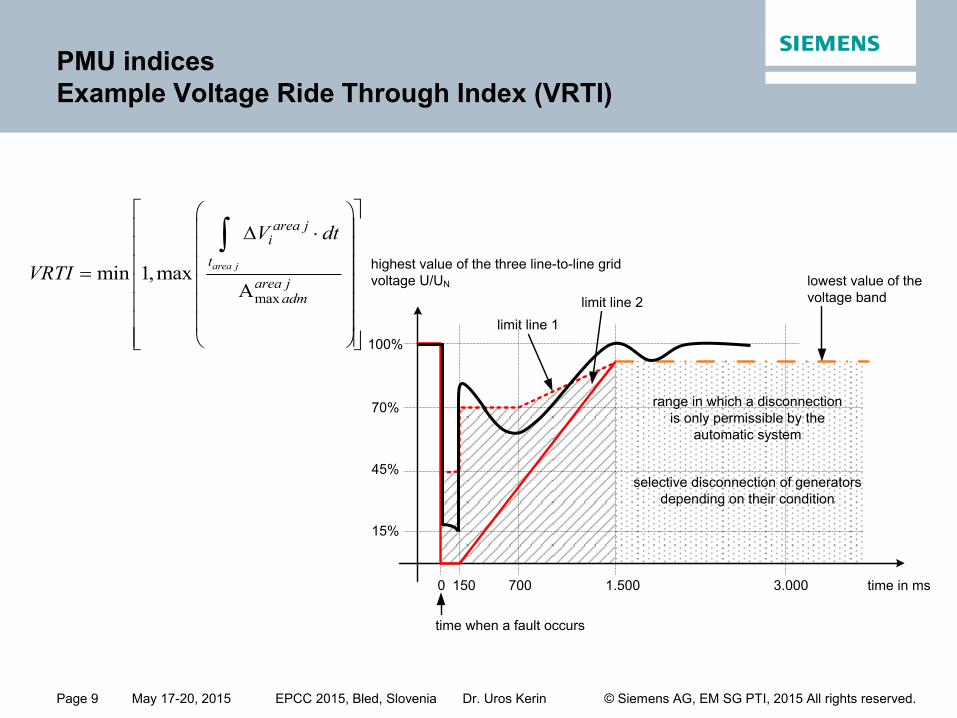
PMU indices
Example Voltage Ride Through Index (VRTI)
Page 9
max
min 1,maxA
area j
area ji
t
area jadm
V dt
VRTI
time in ms3.0001.5007001500
100%
70%
45%
15%
lowest value of the
voltage band
highest value of the three line-to-line grid
voltage U/UN
limit line 1
limit line 2
range in which a disconnection
is only permissible by the
automatic system
selective disconnection of generators
depending on their condition
time when a fault occurs

EPCC 2015, Bled, Slovenia Dr. Uros Kerin © Siemens AG, EM SG PTI, 2015 All rights reserved. May 17-20, 2015
PMU indices
Example Nodal loading Index (NLI)
Information about nodal system ranking margins are available in the LF data!
Page 10
Vi
Yil
Yik
Yim
Vm
Vk
.
.
.
.
.
Pi, Qi
kik
N
iii ViiYYEEkk
/11
222 21/,4112
21iiiiiiiiii
iii PQP
Pe
ii
iiii
iiii
ii
ii
P
Q
iii
P
QEY
sincos
cossin2
1
Distance to loading limits:
4 1 / 1ii ii iand Q e
1,...min 1,max 4 ii
i NNLI
Information of neighboring admittances are necessary (SCADA/DSA)

EPCC 2015, Bled, Slovenia Dr. Uros Kerin © Siemens AG, EM SG PTI, 2015 All rights reserved. May 17-20, 2015
Example of WALS
Large 500 kV system with longitudinal structure
Page 11
Nord
Central
South
Case 1
Case 2

EPCC 2015, Bled, Slovenia Dr. Uros Kerin © Siemens AG, EM SG PTI, 2015 All rights reserved. May 17-20, 2015
Blackout May, 22. 2013 in Vietnam
Page 12
Blackout area
22 May 2013, 14:00
- High load situation 19.800
MW
- 1 major 500kV line lost
- About 9,4 GW, 22 provinces
and 8 millions customers lost
- 9 hours until system
restoration
Frequency dependent load
shedding too slow
Dynamic process
irreversable
Point of no return reached 1,5 sec
EPCC 2015, Bled, Slovenia Dr. Uros Kerin © Siemens AG, EM SG PTI, 2015 All rights reserved. May 17-20, 2015
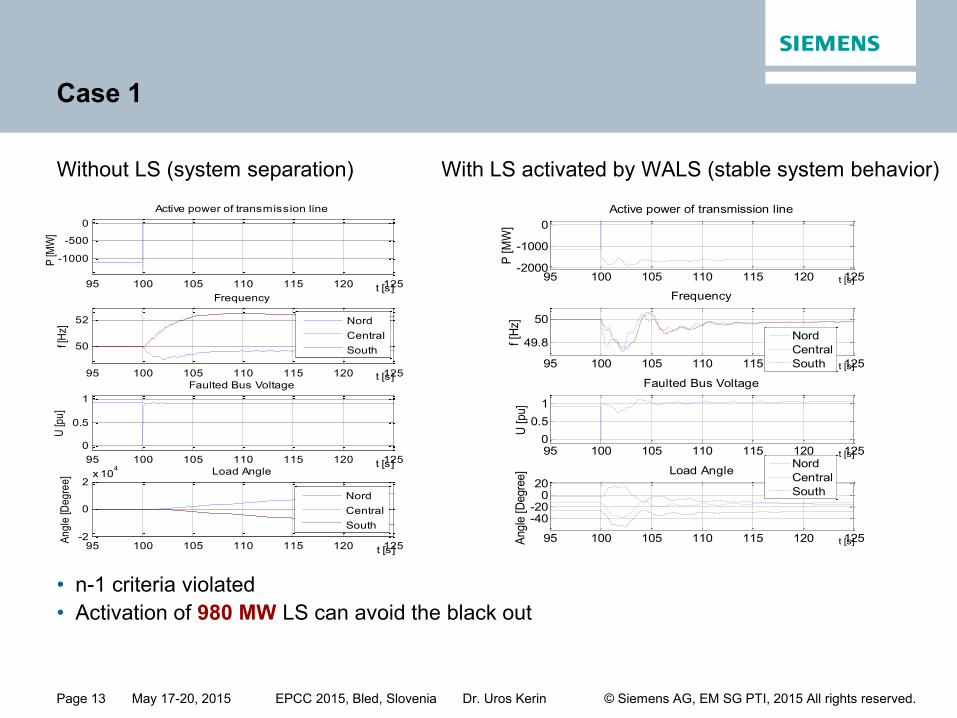
Case 1
Without LS (system separation)
Page 13
With LS activated by WALS (stable system behavior)
• n-1 criteria violated
• Activation of 980 MW LS can avoid the black out
95 100 105 110 115 120 125-2000
-1000
0
Active power of transmission line
t [s]
P [
MW
]
95 100 105 110 115 120 125
49.8
50
Frequency
t [s]
f [H
z]
Nord
Central
South
95 100 105 110 115 120 1250
0.5
1
Faulted Bus Voltage
t [s]
U [
pu]
95 100 105 110 115 120 125
-40-20
020
Load Angle
t [s]Angle
[D
egre
e]
Nord
Central
South
95 100 105 110 115 120 125
-1000
-500
0
Active power of transmission line
t [s]
P [M
W]
95 100 105 110 115 120 125
50
52
Frequency
t [s]
f [H
z]
Nord
Central
South
95 100 105 110 115 120 125
0
0.5
1
Faulted Bus Voltage
t [s]
U [p
u]
95 100 105 110 115 120 125-2
0
2x 10
4 Load Angle
t [s]
An
gle
[De
gre
e]
Nord
Central
South
EPCC 2015, Bled, Slovenia Dr. Uros Kerin © Siemens AG, EM SG PTI, 2015 All rights reserved. May 17-20, 2015
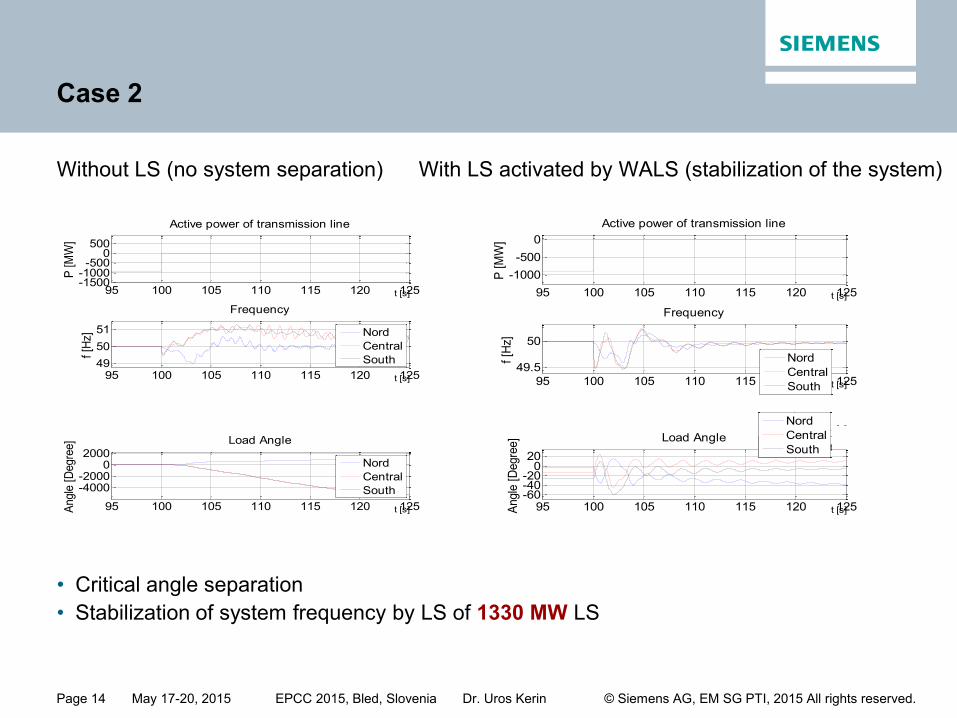
Case 2
Without LS (no system separation)
Page 14
With LS activated by WALS (stabilization of the system)
• Critical angle separation
• Stabilization of system frequency by LS of 1330 MW LS
95 100 105 110 115 120 125-1500-1000-500
0500
Active power of transmission line
t [s]
P [
MW
]
95 100 105 110 115 120 12549
50
51
Frequency
t [s]
f [H
z]
Nord
Central
South
95 100 105 110 115 120 1250
0.5
1
Faulted Bus Voltage
t [s]
U [
pu]
95 100 105 110 115 120 125
-4000-2000
02000
Load Angle
t [s]Angle
[D
egre
e]
Nord
Central
South
95 100 105 110 115 120 125
-1000
-500
0
Active power of transmission line
t [s]
P [
MW
]
95 100 105 110 115 120 125
49.5
50
Frequency
t [s]
f [H
z]
Nord
Central
South
95 100 105 110 115 120 1250
0.5
1
Faulted Bus Voltage
t [s]
U [
pu]
95 100 105 110 115 120 125-60-40-20
020
Load Angle
t [s]Angle
[D
egre
e]
Nord
Central
South
95 100 105 110 115 120 125
-1000
-500
0
Active power of transmission line
t [s]
P [
MW
]
95 100 105 110 115 120 125
49.5
50
Frequency
t [s]
f [H
z]
Nord
Central
South
95 100 105 110 115 120 1250
0.5
1
Faulted Bus Voltage
t [s]
U [
pu]
95 100 105 110 115 120 125-60-40-20
020
Load Angle
t [s]Angle
[D
egre
e]
Nord
Central
South
EPCC 2015, Bled, Slovenia Dr. Uros Kerin © Siemens AG, EM SG PTI, 2015 All rights reserved. May 17-20, 2015
Conclusion
• Online tools in combination with WAPC based on PMU-measurement
can help to
• improve system operation
• increase use of system capacity
• make better use of system reserve
• create fast countermeasures in case of critical situations
• reduce risk of instability and black outs
• by automatic counteractions
• The example showed that the reliability of a non safe system can be
improved and system splitting and blackout can be prevented
Page 15

EPCC 2015, Bled, Slovenia Dr. Uros Kerin © Siemens AG, EM SG PTI, 2015 All rights reserved. May 17-20, 2015
Thank you for your attention
Dr. Uros Kerin
Consultant
Energy Management
Smart Grid Division
Siemens AG
EM SG PTI NC DYS
Freyeslebenstraße 1
91058 Erlangen
Germany
Phone: +49-9131-7-21023
Fax: +49-9131-7-35159
E-mail: [email protected]
Page 16
www.siemens.com