draft - 3g ran dimensioning
DESCRIPTION
#3G #Planning #DimensioningTRANSCRIPT

1 © Nokia Siemens Networks
3G RAN Dimensioning3G RAN Dimensioning
Telkomsel Indonesia
NPO Sub Region IndonesiaNOKIA SIEMENS NETWORK

2 © Nokia Siemens Networks
3G DIMENSIONING
1. 3G Traffic Model
2. Channelization code dimensioning
3. Fractional Load calculation
4. Baseband dimensioning
5. Iub ATM & IP dimensioning
6. RNC dimensioning
7. Traffic forecasting for long term 3G planning
8. Exercise : End-toEnd RAN dimensioning

3 © Nokia Siemens Networks
3G Traffic Model
1. CS & PS traffic model in 3G2. BH Share factor3. SHO Overhead factor4. Re-transmission factor5. HSPA simultaneous factor6. BTS load distribution factor (Uneven load factor)

4 © Nokia Siemens Networks
Standard Traffic Model (1/3)
• The purpose of a standard traffic model is to have information about the traffic demand available if no detailed traffic model is provided for network dimensioning.
• Standard traffic model is defined assuming a “standard” subscriber, using all accounted services in parallel – the service split is applied on the traffic demand basis (no split on the subscriber basis).
• Selected default services are:1. Speech with 0.92 BHCA and a traffic demand of 22 mErlang per subscriber in the busy hour, which
corresponds to call duration of 86s, mapped to CS Conversational AMR 12.2 and CS voice over HSPA.
2. Video telephony mapped to CS Conversational UDI 64 with 0.005 BHCA and a traffic demand of 0.2 mErlang per subscriber in the busy hour, which corresponds to call duration of 144s.
3. Data services mapped to PS Interactive/Background RAB services, differentiated between R99 and HSxPA with 0.7 BHCA, and a traffic demand (in DL) of: 1631 bps per subscriber in the busy hour. This traffic demand is split into:– R99 traffic demand per subscriber: 326 bps– HSxPA traffic demand per subscriber: 1305 bps

5 © Nokia Siemens Networks
Standard Traffic Model (2/3)
These are applicable assumptions for trafic model standard :1. BHCA split between R99 – HSxPA (Release 5/6) of 20% : 80% 2. BHCA split between Release 5 UE and Release 6 UE of 75% : 5%3. Asymmetry:
• Overall (UL:DL): 1: 4.41• R99 (UL:DL): 1:5.82• HSDPA Release 5 (UL R99 : DL HSDPA): 1:4.42• HSxPA Release 6 (UL HSUPA : DL HSDPA): 1:4.16

6 © Nokia Siemens Networks
Standard Traffic Model (3/3)

8 © Nokia Siemens Networks
BH Share Factor (1/2)
• Traffic forcasting usually used the history of data traffic based on daily base
• How to convert the daily data into required capacity in BH (Erl or Mbps) using BH share factor
Voice Erl Voice Erl
Vo
ice
(E
rlan
g /
Da
y)
Required capacity in BH

9 © Nokia Siemens Networks
BH Share Factor (2/2)
• Data should be collected form normal traffic period when there are no major public holidays or any other similar events which may influence the calculations.
• The result may need to be tuned in case the network is already suffering from high level blocking.
• Typically CS and PS busy hours does not exist in the same time. Busy Hour times vary between the operators.
• CS BH share can be calculated by using Voice Erlangs and PS BH share by using average throughput.
Bh Share Factor = Max(Throughput) / Daily Throughput
BH Throughput

10 © Nokia Siemens Networks
SHO Overhead Factor (1/2)
E1A CPICH E1B CPICH
Offset 4dB Offset 6dB
SHO SHO areaarea
cell Acell A
cell Bcell B
3//_____
2//_____
/_____
/_____
/_____
/______
NRTRTSETACTINCELLTHREE
NRTRTSETACTINCELLTWO
NRTRTSETACTINCELLONE
NRTRTSETACTINCELLTHREE
NRTRTSETACTINCELLTWO
NRTRTFORSETACTINCELLONE
eSetAvgOfActiv
Denominators 1/2/3:
Call with 1 radio link : Belongs completely to its single active cell
Cell with 2 radio links : Half the call belongs to each active cell
Cell with 3 radio links : One third of the call belongs to each active cell

11 © Nokia Siemens Networks
• Average of active set in WJ area :- Active set RT = 1.3 (30%
overhead)- Active set NRT = 1.1 (10%
overhead)
• SHO overhead is less than 40% = Good cell border planning
SHO Overhead Factor (2/2)

12 © Nokia Siemens Networks
HS Simultaneous Factor
• Up to RU20, HSDPA user will consume CE for A-DCH signalling that is 1 CE per A-DCH + SHO factor must be included if HS SCC was active
• In CE dimensioning HS simultaneous factor must be included, otherwise there will be over CE dimensioning
• HS Simulataneous Factor =
(max HS user A + max HS user B + max HS user B)
Max (HS user A + HS user B + HS user C)
Cell C
Cell B
Cell A

13 © Nokia Siemens Networks
BTS load distribution factor (Uneven load factor)
In real-life networks, daily traffic in certain BTSs is distributed differently over time. In many cases, BTSs with different traffic profiles and traffic distribution in space and time work under one radio network controller. Therefore, BTS load distribution needs to be taken into account during the RNC and Iub dimensioning process.
The difference between the RNC traffic demand calculated by “even load calculations” and “uneven load calculations” is called the BTS load distribution factor (LDF).
Even load distribution Un-Even load distribution

14 © Nokia Siemens Networks
To calculate the BTS load distribution factor (LDF), adhere to the following principles:
1.Identify the busiest hour for each cell, the volume of data carried in that hour, and work out each BTS “personal” BH throughput.2.Sum the results to give an equivalent throughput value (see: Even load calculation)3.Identify the traffic in each BTS in every hour.4.Sum the results for every hour and choose the highest result to give an aggregated BH throughput value (see: Uneven load calculation).5.Divide an equivalent throughput value by an aggregated BH throughput value to receive BTS load distribution factor.
By considering LDF factor the required RNC capacity can be reduced by factor LDF

15 © Nokia Siemens Networks
Example : • 300 bts connected to 1 RNC. Each BTS has 5 Mbps traffic demand in BH• Required RNC capacity is 300 x 5 Mbps = 1500 Mbps• Because of the geographical distribution, BTSs under one RNC have their busy hours at different time
• Taking into account BTS BH distribution in time, the maximum load at the RNC level is 935 Mbps and it is at 6 p.m. With this data, it is possible to calculate the BTS load distribution factor (LDF):
LDF = 1500 Mbps / 935 Mbps = 1.6
• Once you have calculated the LDF, it is possible to decrease the needed RNC throughput which is calculated by dividing them by 1.6. The values received reflect required throughput with respect to traffic distribution over time.

16 © Nokia Siemens Networks
Load Calculation Introduction
• Cell load calculation is needed to order to estimate the level air interface load in the cell
• Air interface load depends on service mix, radio propagations network topology and number of active connections as well as traffic inputs• Service type EbNo• Propagation model Orthogonality• Network topology Little i

17 © Nokia Siemens Networks
UL Load Calculation
/
• UL load factor can be calculated using the following equation (Holma and Toskala, 2004)
• The corresponding noise rise is
power noise thermal the is
power widebandreceived total is
rise Noise
total
UL
total
N
N
P
I
P
I
1
1connection single a offactor activity theis
connection single a of ratebit theis
rate chip theis
connection single a offactor load theis
ceinterferen cellown w.r.t.ceinterferen cellother of ratio is
factor load ULis UL
j
j
j
v
R
W
L
i

18 © Nokia Siemens Networks
DL Load Calculation
• DL load factor can be calculated using the following equation (Holma and Toskala, 2004)
N
jjj
j
jbj i
RW
NEv
1
0DL )1(
/
/
• The corresponding noise rise is
DL
rise Noise
1
1
jv
jR
W
j
ji
j
j
j
j
user offactor activity theis
user of ratebit theis
rate chip theis
user of channel ofity orthogonal is
user for ceinterferen cellown w.r.t.ceinterferen cellother of ratio is
factor load DL theis DL

19 © Nokia Siemens Networks
Code Dimensioning
Channellization code consumption :1.Common Channel2.R99 Radio Access Bearer3.HSDPA
1. HS-PDSCH Code
2. HS-SCCH
3. A-DCH
4.HSUPA1. E-HICH
2. R-AGCH

20 © Nokia Siemens Networks
RAB ServiceRAB SF Consumption Remark
Voice 128 Depend on #Simultaneous user 256 for AMR NB 4.75 & 5.9Video 32 Depend on #Simultaneous userPS 16 128 Depend on #Simultaneous userPS 64 32 Depend on #Simultaneous userPS 128 16 Depend on #Simultaneous userPS 256 8 Depend on #Simultaneous userPS 384 8 Depend on #Simultaneous user
Common ChannelChannel SF Consumption Remark
P-CPICH 256 Fixed = 1P-CCPCH 256 Fixed = 1PICH 256 Fixed = 1S-CCPCH (PCH) 256 Depend on configuration If 2nd S-CCCPH active or 128 if 24 kbps PCHS-CCPCH (FACH) 64 Fixed = 1HS-SCCH 128 Depend on code multiplexingE-HICH & E-RGCH 128 Depend on number of HSUPA user 1 CC cam serve up to 20 UEE-AGCH 256 Depend on configurationA-DCH 256 Depend on number of HSUPA user F-DPCH allows to serve 10 UE in 1 CC
Code Consumption per RAB & Common Channel

21 © Nokia Siemens Networks
Baseband Dimensioning
1. System Module Capacity2. Common Channel Dimensioning3. R99 CE Dimensioning4. HSPA Dimensioning 5. RU20 to RU30 Conversion Rule

22 © Nokia Siemens Networks
Active usersActive users
BaseBand Dimensioning
Site configuration(# of carriers,
cell range)
Site configuration(# of carriers,
cell range)
Traffic DemandTraffic Demand
Common Control
Channels
Common Control
ChannelsR99R99
HSDPA(Scheduler
type)
HSDPA(Scheduler
type)HSUPAHSUPA
BaseBand requirements (#CE, CE licenses)BaseBand requirements (#CE, CE licenses)
Changed in RU30 using
HSPA Processing Set

23 © Nokia Siemens Networks
System Module Capacity in RU20
FSMB•3 sub modules, each having 80 CE•Total 240 CE for traffic use
SM Rel. 1 SM Rel. 2 SM Rel. 2 SM Rel. 2
FSMC•One sub module, which has 180 CE capacity for traffic use
FSMD•Two sub module, which has 396 CE capacity for traffic use
180 216 216180 216180
FSME•Three sub module, which has 612 CE capacity for traffic use
The available CE in RU20 was used both by R99 and HSPA

24 © Nokia Siemens Networks
System Module Capacity in RU30
FSMB•3 sub modules, each having 80 CE•Total 240 CE for traffic use
SM Rel. 1 SM Rel. 2 SM Rel. 2 SM Rel. 2
FSMC•Has 5 sub unit
FSMD•Has 12 sub unit
FSME•Has 19 sub unit
One available sub unit provides 48 CE for R99

25 © Nokia Siemens Networks
In RU30, the System Module Rel.2 baseband capacity consists of subunits that can be used for: 1.CCCH processing If number of configured cells > 6. With two SM Rel 2, additional CCCH resource are not required.2.R99 users processing 3.HSDPA cells, users, and throughput processing 4.HSUPA users and throughput processing 5.CS Voice over HSPA users processing 6.Interference cancellation processing (RAN1308: HSUPA Interference Cancelation Receiver)
The capacity of baseband also depends on number of commissioned cells
Note:* one subunit needed (48 Rel99 CE) for CCCH processing with one System Module rel.2
for high configuration

26 © Nokia Siemens Networks
The capacity of basband module in RU30 can be calculated using formula below:
SM_Rel99_CE_Capacity = min (#Rel99_CE_licenses ; 48* number_of_available_subunits)
Number_of available_subunits = (number_of_subunits –subunits_for HSDPA – subunits_for_PIC_pool – subunits_for_static_HSUPA)
where: - number of subunits = number of System Module rel.2 subunits from previous table - subunits_for_HSDPA = number of HSDPA commissioned subunits - subunits_for_PIC_pool = number of commissioned interference cancellation subunits - subunits_for_static_HSUPA - number of HSUPA static commissioned subunits

27 © Nokia Siemens Networks
The following DL Common Control Channels are supported per each cell in BTS:
• 1 x P-SCH (Primary – Synchronization Channel) • 1 x S-SCH (Secondary – Synchronization Channel) • 1 x P-CCPCH (Primary – Common Control Physical Channel) • 1 x P-CPICH (Primary – Common Pilot Channel) • 1 x PICH (Paging Indicator Channel) • 1 x AICH (Acquisition Indicator Channel) • 3 x S-SCCPCH (Secondary Common Control Physical Channel)
In the UL, resources for processing the PRACH channel per each cell are required. The cells with ranges bigger than 20 km are called extended cells.
Common Channel Dimensioning
DL1 x P-SCH1 x S-SCH
1 x P-CCPCH1 x P-CPICH
1 x PICH1 x AICH
3 x S-SCCPCH
ULPRACH

28 © Nokia Siemens Networks
Common Channel Requirement in RU20/RU30
Common Control Channel usage with Release 1 HW (RU20/RU30)
Number of cells UL DL
1…3 (e.g. 1+1+1) 26 CE 26 CE
4…6 (e.g. 2+2+2) 52 CE 52 CE
7…9 (e.g.. 3+3+3) 78 CE 78 CE
10…12 (e.g. 4+4+4) Requires Rel.2 System Module as Extension Module
Common Control Channels included in Rel2 HW System Module (No CE Required) as below:
1 System Module 3 cells/20 km cell radius. E.g. 1+1+1 with 20 km cell radius
1 System Module 6 cells/10 km cell radius. E.g. 2+2+2 or 6*1 with 10 km cell radius
2 System Modules 6 cells/20 km cell radius. E.g. 2+2+2 or 6*1 with 20 km cell radius
2 System Modules 9 cells/10 km cell radius. E.g. 3+3+3 with 10 km cell radius
2 System Modules 12 cells/10 km cell radius. E.g. 4+4+4 with 10 km cell radius
Site configuration(# of carriers,
cell range)
Site configuration(# of carriers,
cell range)
Common Control
Channels
Common Control
Channels
Baseband requirements for CCCH depends on BTS configuration (number of cells) and cell range. For extended cells additional CE are needed.
Below exemplary tables presenting CCCH requirements for HW rel.1 and rel.2 in RU20/RU30
Note:1. For System Module
release mix case (FSMB + FSMC/D/E), System Module Rel.2 is selected for CCCH processing (unless frequency layer mapping to HW or Local Cell Grouping is used)
2. When Local Cell Grouping is used, each LCG has to provide CCCH processing resources for cells which are dedicated to a particular LCG

29 © Nokia Siemens Networks
Req CE/Connection
UL DL UL DLAMR Speech Conversational CS 1.2 64 128 1 1AMR Speech Conversational CS 7.95 64 128 1 1AMR Speech Conversational CS 5.9 64 128 1 1AMR Speech Conversational CS 4.75 64 128 1 1AMR Speech Conversational CS 12.65 64 128 1 1AMR Speech Conversational CS 8.85 64 128 1 1AMR Speech Conversational CS 6.65 64 128 1 1Packet Interactive / Background PS 16 64 128 1 1Packet Interactive / Background PS 32 32 64 2 2Packet Interactive / Background PS 64 16 32 4 4Packet Interactive / Background PS 128 8 16 4 4Packet Interactive / Background PS 256 4 8 8 8Packet Interactive / Background PS 384 4 8 16 16UDI Conversational CS 64 16 32 4 4Streaming Streaming CS 57.6 16 32 4 4Streaming Streaming CS 14.4 64 128 1 1
RAB Traffic Class CS/PS Max Bit Rate (kbps)SF RU20/RU30
Baseband resources per one Rel99 traffic channel for SM Rel. 1
R99 CE DimensioningCE Requirement per RAB
• Required CE for R99 depends on RAB and its bit rate

30 © Nokia Siemens Networks
UL DL UL DL UL DLAMR Speech Conversational CS 1.2 64 128 1 1 1 1AMR Speech Conversational CS 7.95 64 128 1 1 1 1AMR Speech Conversational CS 5.9 64 128 1 1 1 1AMR Speech Conversational CS 4.75 64 128 1 1 1 1AMR Speech Conversational CS 12.65 64 128 1 1 1 1AMR Speech Conversational CS 8.85 64 128 1 1 1 1AMR Speech Conversational CS 6.65 64 128 1 1 1 1Packet Interactive / Background PS 16 64 128 1 1 1 1Packet Interactive / Background PS 32 32 64 2 2 2 2Packet Interactive / Background PS 64 16 32 4 4 4 4Packet Interactive / Background PS 128 8 16 4 4 4 4Packet Interactive / Background PS 256 4 8 9 9 6 6Packet Interactive / Background PS 384 4 8 12 12 8 8UDI Conversational CS 64 16 32 4 4 4 4Streaming Streaming CS 57.6 16 32 4 4 4 4Streaming Streaming CS 14.4 64 128 1 1 1 1
RU20 RU30Req CE/Connection
Max Bit Rate (kbps)SF
CS/PSTraffic ClassRAB
Baseband resources per one Rel99 traffic channel for SM Rel. 2
Less CE required in DL and UL for PS 256 and PS 384

31 © Nokia Siemens Networks
R99 Traffic Channel Elements (CE) usage is divided in PS and CS bearer consumption
Uplink and downlink CE requirements are calculated separately as well as CS and PS:
R99 traffic CE requirements calculation:
Where :CEDL_DLbearer / CEUL_ULbearer - Number of DL CE and UL CE required for one active user of bearer
Traffic DemandTraffic Demand
R99R99
R99 PS(e.g. PS IB 64/384
kbps)
R99 PS(e.g. PS IB 64/384
kbps)
R99 CS( e.g. AMR 12.2)
R99 CS( e.g. AMR 12.2)
DLbearersCSDLbearerCS
DLbearersPSDLbearerPS
ULbearersCSULbearerCS
ULbearersPSULbearerPS
CEqDLCEqDLlCEDL
CEqULCEqULlCEUL
__
__
__
__
_Re_Re99Re_
_Re_Re99Re_
ReqUL_CEULbearer = CEUL_ULbearer * ActiveUsers_ULbearer
ReqDL_CEDLbearer = CEDL_DLbearer * ActiveUsers_DLbearer
R99 CE DimensioningCE Calculation for R99

32 © Nokia Siemens Networks
Active users per CS bearer 1. For 1 CS bearer normal Erlang B is used
2. For 2 or more CS bearers ▪ Active users from Erlang B separately for each bearer▪ Active users from MDE (multiplexing gain due to the same resource sharing)
DLFactorULMDE /_*Traffic_Roundup s_ActiveUser arer_1CS_UL/DLbearerCS_UL/DLbe
nbearer ofuser active 1per required resources CE - _ nCS_bearer_BC
Where:
R99 CS( e.g. AMR 12.2)
R99 CS( e.g. AMR 12.2)
Blocking
Activity
Erl;
][Site_TrafficPerSHFErlangB s_ActiveUser arerCS_UL/DLbe
arerCS_UL/DLbe
Values for example1.Activity (factor) = 0,5 for voice 2.Activity (factor) = 1 for video3.SHF = 30 % 4.Blocking = 2 %
R99 CE DimensioningCS R99 Calculation

33 © Nokia Siemens Networks
PS active users calculation UL/DL for all PS Rel’99 traffic channels
Active users independently for UL and DL
Where SHF - Soft Handover Factor (e.g. 30%)
TrafficPerSiteGOS – inputted traffic with/without traffic overhead depending on GoS ▪ no overhead for ‘best effort’▪ ‘delay’ overhead calculated on base of lookup tables equivalent to M/G/R-PS
MeanRate_PS_UL/DL bearer = DataRatebearer * Throughput ▪ Throughput as a percentage of the nominal Data Rate▪ Throughput => 79% ▪ For example 128 kbps * 0.79 = 101 kbps
ReqUL_CEPS_ULbearer = CEULperTCH_ULbearer * ActiveUsers_PS_ULbearer
ReqDL_CEPS_DLbearer = CEDLperTCH_DLbearer * ActiveUsers_PS_DLbearer
R99 PS(e.g. PS IB
64/384 kbps)
R99 PS(e.g. PS IB
64/384 kbps)
R99 CE DimensioningPS R99 Calculation

34 © Nokia Siemens Networks
HSDPA CE Dimensioning in RU20/RU30
HSDPA baseband requirements for RU20 or RU30 SM Rel 1 :
UL bearerUL bearerULUL
HSDPAScheduler
Pool
HSDPAScheduler
Pool
SRBSRBDLDL
ULUL DLDL
In UL direction each HSDPA user requires R99 associated bearer.
In DL direction each HSDPA user requires 1 CE in DL for Signaling Radio Bearer (SRB).
HSDPA Scheduler pool is needed in UL/DL per each scheduler. In RU 30, There is no baseband requirement for HSDPA Scheduller.
Not required anymore in RU30

35 © Nokia Siemens Networks
HSDPA Active Users are calculated:
Twice (according to the formulas presented below),
Max(UL,DL) is taken for CE requirements calculation
Different values of SHF are taken in calculations
HSDPAScheduler Pool
HSDPAScheduler Pool
SRBSRB
ULUL
DLDL HSDPAScheduler Pool
HSDPAScheduler Pool
UL bearerUL bearer

36 © Nokia Siemens Networks
In UL direction each HSUPA (non-FDPCH) user requires 1CE for Signaling Radio Bearer (SRB).
In DL direction each HSUPA user requires 1 CE in DL for Signaling Radio Bearer (SRB).
HSUPA Scheduler pool is needed in UL/DL per each scheduler
SRBSRBULUL
HSDPAScheduler Pool
HSDPAScheduler Pool
SRBSRBDLDL
HSUPA CE Dimensioning in RU20/RU30

37 © Nokia Siemens Networks
HSUPA Active Users are calculated according to formulas:
Twice (according to the formula presented below)
Max(UL,DL) is taken for CE requirements calculation
Different values of SHF shall be taken in calculations
HSDPAScheduler Pool
HSDPAScheduler Pool
SRBSRB
ULUL
DLDL HSDPAScheduler Pool
HSDPAScheduler Pool
SRBSRB

38 © Nokia Siemens Networks
HSPA Capacity License in RU30
1. RU30 introduce new Baseband licensing aspects valid for System Modules Rel.2: • Rel99 CE licenses • HSDPA and HSUPA processing sets (System Module Rel.2)
2. In case of System Module rel.2, the Rel99 CE license defines the maximum capacity for pure Rel99 traffic. HSDPA/HSUPA schedulers are not consuming Rel99 CE licenses. In case of System Module rel.1, Rel99 CE licenses are consumed by both R99 and HSPA traffic.
3. The HSDPA BTS processing set describes the capacity reservation inside the Rel.2 HW (Flexi Rel.2) that allows a certain number of HSDPA users and DL throughput to be reached.
4. The HSDPA BTS processing set does not directly increase the capacity for maximum user amount and throughput. Separate ASW (application software) licenses for peak throughput and user amount are required.

39 © Nokia Siemens Networks
HSDPA Scheduler in RU30
1. Only one type of scheduler is available in RU30 which depend on activated features, number and type of processing sets and HSDPA throughput commisioning by operator
2. Up to 2 HSDPA scheduller per SM based on TCEL setting3. Maximum throughput per scheduler based on "HSDPA Throughput Step" (defined by commissioning)4. Each HSDPA throughput step refers to 7.2 Mbps, so HSDPA scheduler throughput can be limit by HSDPA
throughput step5. When 2 SM & more than one LCG or HSPA frequency mapping was used, two scheduler can be activated on
both SM (4 scheduler per BTS) otherwise maximum 2 Scheduler per BTS (only can be activated on 1 SM)6. If HSDAP throughput was not commissioned, default mapping from existing scheduler will be used7. HSDPA scheduler doesn't consume R99 CE license but depending on commissioned HSDPA throughput, it will
reduce available baseband capacity.8. Max 6 cell can be assigned to HSDPA scheduler with up to 240 HSDPA user can be supported per scheduler 9. TCEL group rules in RU30
1. Tcel groups 1 & 3 are handled by 1st scheduler2. Tcel groups 2 & 4 are handled by 2nd scheduler

40 © Nokia Siemens Networks
The default rule will be automatically used for HSPA cells If HSDPA throughput was not commissioned and the user script (presenting SW upgrade conversion settings) is not available
Default rule for HSDPA baseband capacity allocation
HSDPA throughput steps will define the maximum HSDPA throughput for the HSDPA scheduler.
SM Rel.2 HSDPA throughput steps
HSDPA_scheduler_throughput = Min (HSDPA_throughput_step * 7.2 Mbps ; Maximum throughput for HSDPAscheduler}
Where:-HSDPA_throughput_step=commissioned scheduler throughput -Maximum throughput for HSDPA=maximum throughput referred in Mbps for corresponding HSDPA throughput step from Table
41 © Nokia Siemens Networks
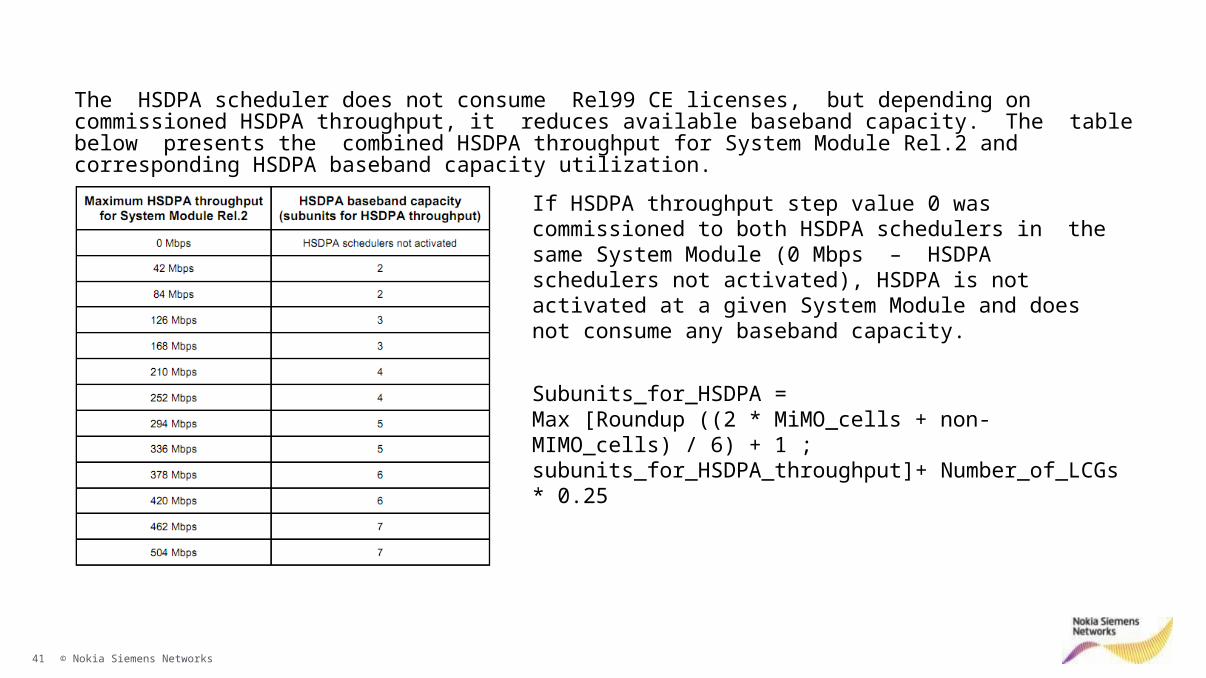
The HSDPA scheduler does not consume Rel99 CE licenses, but depending on commissioned HSDPA throughput, it reduces available baseband capacity. The table below presents the combined HSDPA throughput for System Module Rel.2 and corresponding HSDPA baseband capacity utilization.
If HSDPA throughput step value 0 was commissioned to both HSDPA schedulers in the same System Module (0 Mbps – HSDPA schedulers not activated), HSDPA is not activated at a given System Module and does not consume any baseband capacity.
Subunits_for_HSDPA = Max [Roundup ((2 * MiMO_cells + non-MIMO_cells) / 6) + 1 ; subunits_for_HSDPA_throughput]+ Number_of_LCGs * 0.25

42 © Nokia Siemens Networks
For example: 2 HSDPA schedulers were activated at System Module rel.2 with 1 LCG (6 non-MIMO cells and 3 MIMO cells),
1. Commissioned HSDPA throughput step to scheduler #1 is equal to 2, 2. Commissioned HSDPA throughput step to scheduler #2 is equal to 6
HSDPA_scheduler #1_throughput = Min {2 * 7.2Mbps ; 42Mbps}=Min{14.4Mbps ; 42Mbps}=14.4 Mbps HSDPA_scheduler #2_throughput = Min {6 * 7.2Mbps ; 42Mbps}=Min{43.2Mbps ; 42Mbps}= 42 Mbps (The HSDPA scheduler
throughput can be limited with the HSDPA BTS processing set license )
Baseband capacity required by HSDPA can be calculated according to the formula :• The total HSDPA throughput available per System Module equals (14.4 + 42 Mbps) = 56.4 Mbps• In order to fulfill HSDPA throughput conditions, 3subunits
Subunits_for_HSDPA = Max [Roundup ((2 * 3+ 6) / 6) + 1 ; 2]+ 1* 0.25 = 3.25 sub unit for HSDPA

43 © Nokia Siemens Networks
HSDPA BTS Processing Set Resources Allocation
HSDPA license resources (specified by HSDPA BTS processing sets) are distributed among HSDPA Sschedulers / LCGs according to the rules presented below: 1)HSDPA throughput:
• Total HSDPA licensed throughput is distributed among the available HSDPA schedulers. • In case when only one HSDPA processing set 1 or set 2 was bought, then all the licensed throughput will be
assigned to one scheduler. • In case when HSDPA processing set 3 was bought, then all the licensed throughput can be shared between
multiple schedulers (up to 4). • In case when there are not sufficient HSDPA licenses compared to the number of scheduler, not all
schedulers may get HSDPA throughput. For example: The operator has two schedulers and 1 x HSDPA BTS Processing Set 2. In this case first scheduler gets 21Mbps and the second scheduler 0Mbps.
Mbps2.7*er_BTSput_step_pPA_throughTotalOfHSD
pughput_steHSDPA_throScheduler_*s_1essing_SetHSDPA_Proc#Roundup
Mbps21*r_BTSut_step_peA_throughper_of_HSDPTotal_numb
pughput_steHSDPA_throScheduler_*s_3)essing_SetHSDPA_Proc4*#s_2essing_SetHSDPA_Proc(#Roundup
HSDPA Schedulled Throughput :(For Processing Set 1)
HSDPA Schedulled Throughput :(For Processing Set 2/3)

44 © Nokia Siemens Networks
2 schedulers:
1st: HSDPA throughput step # 8 5 x HSDPA BTS Processing Set #1 (for example)
2nd: HSDPA throughput step # 11 5 x HSDPA BTS Processing Set #1 = 5 * 7.2 Mbps = 36 Mbps
So:
1st: Scheduler_licensed_throughput = Round down {5 * (8/19)} * 7.2 Mbps = Round down {2.11} * 7.2 Mbps = 14.4 Mbps
2nd:
Scheduler_licensed_throughput = Round down {5* (11/19)} * 7.2 Mbps = Round down {2.89} * 7.2 Mbps = 14.4 Mbps
36 Mbps – 2 * 14.4 Mbps = 7.2 Mbps, this the throughput which was "left" after calculations
If after calculations presented above throughput for all schedulers is lower than all licensed throughput in the BTS, remaining throughput is distributed with the same granularity (7.2 Mbps or 21Mbps depending on available HSDPA BTS Processing Sets) prioritizing schedulers in such order:
1. scheduler with licensed throughput below commissioned throughput
2. scheduler with lowest licensed throughput
Based on above the 7.2 Mbps throughput which was "left" will be distributed to the 2nd scheduler due to the fact that its licensed throughput (HSDPA throughput step #11) was higher than first one had (HSDPA throughput step #8).
∑ = 19
Example :
45 © Nokia Siemens Networks
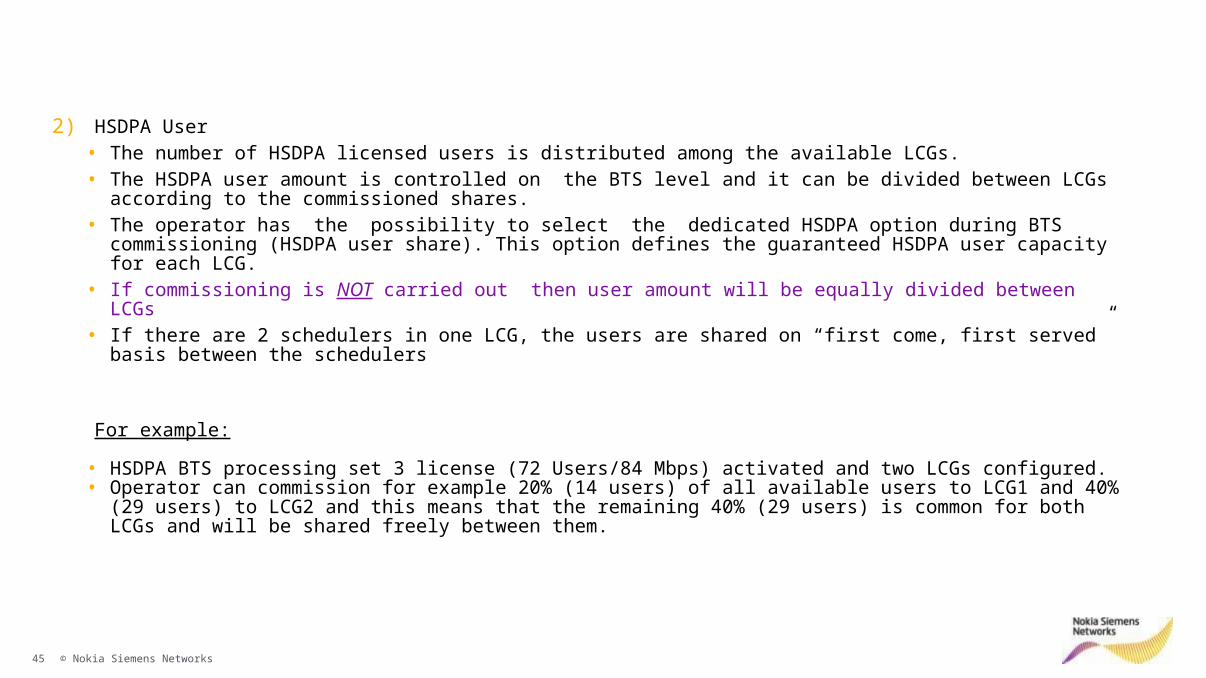
2) HSDPA User • The number of HSDPA licensed users is distributed among the available LCGs. • The HSDPA user amount is controlled on the BTS level and it can be divided between LCGs according to
the commissioned shares.• The operator has the possibility to select the dedicated HSDPA option during BTS commissioning
(HSDPA user share). This option defines the guaranteed HSDPA user capacity for each LCG. • If commissioning is NOT carried out then user amount will be equally divided between LCGs• If there are 2 schedulers in one LCG, the users are shared on “first come, first served” basis between the
schedulers
For example:
• HSDPA BTS processing set 3 license (72 Users/84 Mbps) activated and two LCGs configured.• Operator can commission for example 20% (14 users) of all available users to LCG1 and 40% (29 users) to
LCG2 and this means that the remaining 40% (29 users) is common for both LCGs and will be shared freely between them.

46 © Nokia Siemens Networks
• HSUPA activation does NOT consume any baseband resources
• HSUPA baseband resources allocation is performed in steps – so called HSUPA resource steps. One step is
equal to ¼ of one subunit.
• HSUPA baseband capacity reservation is based on HSUPA license (HSUPA BTS processing sets). One HSUPA
BTS processing set license requires 2 HSUPA resource steps (1/2 subunit)
• First HSUPA BTS processing set can be utilized by Rel’99 users (even without Rel’99 CE licenses)
HSUPA Scheduller in RU30

47 © Nokia Siemens Networks
RU20 to RU30 Conversion Rule
CEs to Rel’99 CEs conversion:
• Rel’99 CES = (current number of CEs
– HSDPA scheduler(s) CE consumption
– HSUPA CEs consumption)
• Existing CE licenses will be replaced by new Rel’99 CEs.

48 © Nokia Siemens Networks
HSDPA Processing Set Replacement Rules for RU20 Customers ”Minimum BB” and ”16 Users per cell” Schedulers
Users: 16 Users: 32 72 72Mbps: 3,6 Mbps: 7,2 21 84 Users Mbps
# od schedulers Users Mbps # of PS1 # of PS2 # of PS3 Users Mbps1 16 3,6 1 32 7,2 16 3,62 32 7,2 1 32 7,23 48 10,8 2 64 14,4 16 3,64 64 14,4 2 64 14,45 80 18 3 96 21,6 16 3,66 96 21,6 3 96 21,67 112 25,2 4 128 28,8 16 3,68 128 28,8 4 128 28,89 144 32,4 5 160 36 16 3,6
10 160 36 5 160 3611 176 39,6 6 192 43,2 16 3,612 192 43,2 6 192 43,2
Total capacity
RU30 Difference
Total capacity
RU10/RU20
scheduler capacity 16 Users / 3.6 Mbps
36 CEs per scheduler
cu
sto
me
r g
ets
ev
en
mo
re !
!!

49 © Nokia Siemens Networks
- 72 CEs per scheduler each
Users: 72 Users: 32 72 72Mbps: 14,0 Mbps: 7,2 21 84 Users Mbps
# od schedulers Users Mbps # of PS1 # of PS2 # of PS3 Users Mbps1 72 14 1 72 21 72 144 28 2 144 42 143 216 42 3 216 63 214 288 56 4 288 84 285 360 70 5 360 105 356 432 84 6 432 126 427 504 98 7 504 147 498 576 112 8 576 168 569 648 126 9 648 189 63
10 720 140 10 720 210 7011 792 154 11 792 231 7712 864 168 12 864 252 84
RU10/RU20 RU30 Difference
Total capacity Total capacity
”Sh
are
d S
ch
ed
ule
r” a
nd
”F
ull
Ba
se
ba
nd
S
ch
ed
ule
r” 1
6 Q
AM
(D
L),
S
ch
ed
ule
r c
ap
ac
ity
: 7
2
us
ers
/ 1
4 M
bp
s
cu
sto
me
r g
ets
ev
en
mo
re !
!!
Users: 72 Users: 32 72 72Mbps: 21,0 Mbps: 7,2 21 84 Users Mbps
# od schedulers Users Mbps # of PS1 # of PS2 # of PS3 Users Mbps1 72 21 1 72 212 144 42 2 144 423 216 63 3 216 634 288 84 4 288 845 360 105 5 360 1056 432 126 6 432 1267 504 147 7 504 1478 576 168 8 576 1689 648 189 9 648 189
10 720 210 10 720 21011 792 231 11 792 23112 864 252 12 864 252
RU20 RU30 Difference
Total capacity Total capacity
”Sh
are
d S
ch
ed
ule
r” a
nd
”F
ull
B
as
eb
an
d S
ch
ed
ule
r” 6
4
QA
M (
DL
), S
ch
ed
ule
r c
ap
ac
ity
: 7
2 u
se
rs /
21
Mb
ps
cu
sto
me
r g
ets
th
e s
am
e !
!!
No differentiation between 16QAM and 64QAM in RU30 using same # PS 2 !

50 © Nokia Siemens Networks
- 72 CEs per scheduler each
Users: 72 Users: 32 72 72Mbps: 42,0 Mbps: 7,2 21 84 Users Mbps
# od schedulers Users Mbps # of PS1 # of PS2 # of PS3 Users Mbps1 72 42 1 72 84 422 144 84 1 1 144 105 213 216 126 2 1 216 1264 288 168 2 2 288 210 425 360 210 3 2 360 231 216 432 252 4 2 432 2527 504 294 4 3 504 336 428 576 336 5 3 576 357 219 648 378 6 3 648 378
10 720 420 6 4 720 462 4211 792 462 7 4 792 483 2112 864 504 8 4 864 504
RU20 RU30 Difference
Total capacity Total capacity
”Sh
are
d S
ch
ed
ule
r” D
C-
HS
DP
A,
Sc
he
du
ler
ca
pa
cit
y:
72
us
ers
/ 4
2
Mb
ps
cu
sto
me
r g
ets
ev
en
mo
re !
!!
Users: 72 Users: 32 72 72Mbps: 28,0 Mbps: 7,2 21 84 Users Mbps
# od schedulers Users Mbps # of PS1 # of PS2 # of PS3 Users Mbps1 72 28 1 72 84 562 144 56 1 1 144 105 493 216 84 2 1 216 126 424 288 112 3 1 288 147 355 360 140 4 1 360 168 286 432 168 5 1 432 189 217 504 196 6 1 504 210 148 576 224 7 1 576 231 79 648 252 8 1 648 252
10 720 280 8 2 720 336 5611 792 308 9 2 792 357 4912 864 336 10 2 864 378 42
Difference
Total capacity Total capacity
RU20 RU30
”Sh
are
d S
ch
ed
ule
r” a
nd
”F
ull
Ba
se
ba
nd
S
ch
ed
ule
r” w
ith
MIM
O,
Sc
he
du
ler
ca
pa
cit
y:
72
u
se
rs /
28
Mb
ps
cu
sto
me
r g
ets
ev
en
mo
re !
!!

51 © Nokia Siemens Networks
HSUPA Processing Set Conversion
Microsoft Word Document
Conversion for HSUPA shall be based only on HSUPA users
Conversion shall be done per LCG in BTS meaning that conversion rule shall be done separately for all LCGs of
BTS (i.e. up to 4 times at maximum).
Conversion shall be done only for FSMC/D/E system modules
For FSMB the existing dimensioning/Rel’99 CEs usage is still valid
In case of mixed configuration (FSMB + FSMC/D/E) HSUPA conversion shall be done only for LCG(s) that are in
FSMC/D/E
Conversion rules into HSUPA Processing sets are applied separately for each LCG. The following (RNC & BTS) key
information is used:
1. HSPA72UsersEnabled (RNC WCELL parameter: enabled/disabled)
2. Values of HSUPAXUsersEnabled (3,12, 24, 60)
3. Calculation, if there is capacity for 80 HSUPA UEs in the LCG
4. # of Flexi Rel2 system modules having HSUPA and/or supporting 80 HSUPA UEs

52 © Nokia Siemens Networks
RNC Dimensioning Process
Based on throughput

53 © Nokia Siemens Networks
RNC Dimensioning Process
InputTraffic, NodeBs, Carriers, Iub, Iur,Iu-CS
Check Throughput Limitations
Check BTS Connectivity Limitations
Check Interface UnitCapacity Limitations
Select highest number from the received results
Number of RNCs needed
Number of RNCs considering the limit
Number of RNCs considering the limit
Number of RNCs considering the limit
Check AAL2Connectivity Limitations
RNCRNC196/RNC450 RNC2600
Not relevant for RNC2600, as the A2SU units are
removed

54 © Nokia Siemens Networks
Add SHO and protocol overhead
Add SHO and protocol overhead
RNC dimensioning based on throughput
Input: Traffic per site in traffic types
Calculate AMR Load
Calculate CS Data load
Calculate NRT Data Load
Number of RNCs needed
Apply traffic mix rule
Calculate HSDPALoad
Apply FP Rate

55 © Nokia Siemens Networks
RNC Dimensioning Process
Based on ICSU Control Plane Load

56 © Nokia Siemens Networks
RNC dimensioningICSU load – RNC2600 CP rule
• This rule gives an indication of the RNC capacity in terms of control plane processing.
• The rule cannot be used in isolation, the result has to be combined with the other capacity limits of the RNC.
• ICSU CPU load calculation is based on the number of signalling events and so-called „CPU cost” of each event.
Check RNC Control Plane Load

57 © Nokia Siemens Networks
RNC dimensioningICSU load – RNC2600 CP rule
• List of relevant signalling events having impact on Control Plane load.
Event: Description:
PagingAmount of pagings in 1 second
NAS signaling
Amount of NAS signaling messages in 1 second including SMSs. LACs, RACs, IMSI attach/detach, SCC, SRNS Relocations
SHO Amount of Soft Handovers in 1 second
CS callCS call attempts in 1 second
PS call PS call attempts (RT and NRT), Rel99 and HSDPA in 1 second
DCH-FACH
Amount of state transictions between Cell_DCH and Cell_FACH in 1 second
HS-DSCH-FACH
Amount of state transitions between Cell_DCH (incl. HS-DSCH) and Cell_FACH in 1 second
DCH-PCH
Amount of state transitions between Cell_DCH (incl. HS-DSCH) and Cell_PCH in 1 second
FACH-PCH
Amount of state transictions between Cell_FACH and Cell_PCH in 1 second
NBAP measurements
Amount of dedicated NBAP measurements in 1 second

58 © Nokia Siemens Networks
RNC dimensioningICSU load – RNC2600 CP rule – Step 1/3
• Derive frequency of the signalling events from traffic profile [1/s].• Calculate aggregated loads, separately for CS/PS –related and common procedures, using the following formulas (i –
particular event) :
• weight[i] = offset[i] + gradient[i]*RRCoCCH[%]
0
0
0
][i]frequency[__
][i]frequency[__
][i]frequency[__
i
i
i
iweightoncontributiBHCAcommon
iweightoncontributiBHCAPS
iweightoncontributiBHCACS
RU20 offset RRCoCCH gradient
Paging 93 -1.4
NAS 2399 -964
SHO 1580 -23.2
CS call 3995 -712.6
PS call 5602 -1601DCH-FACH 1545 -257.6HS-DSCH-FACH 1404 -234DCH-PCH 1375 -229.2FACH-PCH 307 -51NBAP meas 41 -0.6

59 © Nokia Siemens Networks
RNC dimensioningICSU load – RNC2600 CP rule – Step 2/3
• Calculate “mixed BHCA limit” for concrete RNC Capacity Step according to the following equation:
– where:– max_CS_BHCA and max_PS_BHCA – BHCA limitations for concrete RNC capacity step and inlude NAS
signalling– CS_PS_ratio has to be calculated using following formula:
Where:
BHCAPSratioPSCSBHCACSratioPSCSitBHCAMixed _max_*)__1(__max_*__lim__
ratioonlyPSratioonlyCS
ratioonlyCSratioPSCS
____
____
oncontributiBHCAcommonBHCACS
oncontributiBHCACSratioonlyCS
___max_
____
oncontributiBHCAcommonBHCAPS
oncontributiBHCAPSratioonlyPS
___max_
____

60 © Nokia Siemens Networks
RNC dimensioningICSU load – RNC2600 CP rule – Step 3/3
• Finally, check if calculated aggregated BHCA loads don’t exceed mixed_BHCA_limit:
1lim__
______
itBHCAmixed
oncontributiBHCAcommononcontributiBHCAPSoncontributiBHCACS

61 © Nokia Siemens Networks
Formula Explanation
1.CS_BHCA_Contributions, PS_BHCA_Contributions, Common_BHCA_Contributions:i. Frequency: From measurementii. Weight: Constant from table
2.Max_CS_BHCA = CS_BHCA + NAS_BHCA per Subs * Max CS_Subs – All constant from Product Specification
3.Max_PS_BHCA = PS_BHCA + NAS_BHCA per Subs * Max PS_Subs– All constant from Product Specification
4. CS_only_ration, PS_only_ratio: calculation from measurement with contant table and constant from product specification

62 © Nokia Siemens Networks
RNC dimensioningICSU load – RNC CP rule – Measurements (1/2)
Event Counter Counter Name Frequency Fomula
CS call
M1001C66 RAB_STP_ATT_CS_VOICE
=(M1001C66 + M1001C67 + M1001C68 + M1001C599 + M1001C653 + M1001C655 + M1001C657) / DURATION
M1001C67 RAB_STP_ATT_CS_CONV
M1001C68 RAB_STP_ATT_CS_STREAM1001C599
RAB_STP_ATT_CS_VOICE_WPSM1001C653
RAB_RELOC_STP_ATT_CS_VOICEM1001C655
RAB_RELOC_STP_ATT_CS_CONVM1001C657
RAB_RELOC_STP_ATT_CS_STREA
PS call
M1001C70 RAB_STP_ATT_PS_STREA
=(M1001C70 + M1001C71 + M1001C72 + M1001C651 + M1001C817 + M1001C826) / DURATION
M1001C71 RAB_STP_ATT_PS_INTER
M1001C72 RAB_STP_ATT_PS_BACKG
M1001C651 RAB_RELOC_STP_ATT_PS_STREA
M1001C817 RAB_RELOC_STP_ATT_PS_INT
M1001C826 RAB_RELOC_STP_ATT_PS_BGR
Paging M1003C36 REC_PAG_MSG =M1003C36 / DURATION
SHO
M1007C10CELL_ADD_REQ_ON_SHO_FOR_RT
=((M1007C10 + M1007C12) / (SHO RT) + (M1007C27 + M1007C29) / (SHO NRT)) / DURATION
M1007C12CELL_REPL_REQ_ON_SHO_FOR_RT
M1007C27CELL_ADD_REQ_ON_SHO_FOR_NRT *) SHO RT and SHO NRT see below
M1007C29CELL_REPL_REQ_ON_SHO_FOR_NRT
DCH-FACHM1006C45 CELL_DCH_STATE_TO_CELL_FACH
=(M1006C45 + M1006C46) / DURATION - "HS-DSCH-FACH"M1006C46 CELL_FACH_STATE_TO_CELL_DCH

63 © Nokia Siemens Networks
RNC dimensioningICSU load – RNC CP rule – Measurements (2/2)
Event Counter Counter Name Frequency Fomula
HS-DCH-FACHM1006C154 SUCC_HS_DSCH_TO_FACH
=(M1006C154 + M1006C152) / DURATIONM1006C152 SUCC_FACH_TO_HS_DSCH
FACH-PCH M1006C48 CELL_FACH_STATE_CELL_PCH_UPD =(M1006C48 + M1006C47) / DURATION
M1006C47 CELL_FACH_STATE_CELL_PCH_INA
DCH-PCHM1006C114 CELL_DCH_STATE_TO_CELL_PCH
=(M1006C114 +M1006C197) / DURATIONM1006C197 SUCC_PCH_DCH_TRANS_UMRLC
NAS, M1001C0 RRC_CONN_STP_ATT
=(M1001C0 + M1001C808 + M1008C222 + M1008C223)/DURATION - "CS call" - "PS call"
Serving Cell ChangeM1001C808 RRC_RELOC_STP_ATT
M1008C222 SCC_INTRA_BTS_SUCCESSFUL
M1008C223 SCC_INTER_BTS_SUCCESSFUL
NBAP M1005C148 DEDIC_MEAS_REPORT =M1005C148 / DURATION
SHO RT
M1007C0ONE_CELL_IN_ACT_SET_FOR_RT
=(M1007C0 + M1007C1 * 2 + M1007C2 * 3 - M1007C6 * 2) / (M1007C0 + M1007C1 + M1007C3 - M1007C6)
M1007C1TWO_CELLS_IN_ACT_SET_FOR_RT
M1007C2THREE_CELLS_IN_ACT_SET_RT
M1007C6
SOFTER_HO_DUR_ON_SRNC_FOR_RT
SHO NRT
M1007C19ONE_CELL_IN_ACT_SET_FOR_NRT
=(M1007C19 + M1007C20 * 2 + M1007C21 * 3 - M1007C25 * 2) / (M1007C19 + M1007C20 + M1007C21 - M1007C25)
M1007C20
TWO_CELLS_IN_ACT_SET_FOR_NRTM1007C21
THREE_CELLS_IN_ACT_SET_NRTM1007C25
SOFTER_HO_DUR_ON_SRNC_NRT

64 © Nokia Siemens Networks
ICSU Load Calculation vs MeasurementRNC Dago2

65 © Nokia Siemens Networks
Nokia Siemens Networks:Reinventing the connected world
Thank you!