draft black bear data analysis unit management...
TRANSCRIPT

DRAFT BLACK BEAR DATA ANALYSIS UNIT MANAGEMENT PLAN Western San Luis Valley
DAU B-13
GAME MANAGEMENT UNITS 68, 76, 79, 80, 81, 681, 682, 791
Southwest Region
Prepared for:
Colorado Parks and Wildlife
By: Stephanie Steinhoff
Terrestrial Wildlife Biologist Date: September 2012

2
DATA ANALYSIS UNIT PLAN FOR B-13
EXECUTIVE SUMMARY GMUs: 68, 76, 79, 80, 81, 681, 682, and 791 (Saguache, San Juan, Hinsdale, Mineral, Rio Grande, Conejos, Archuleta, and Alamosa counties) Land Ownership: 51% USFS, 31% Private, 12% BLM, 5% State, 1% Land Trust Current Objective: Stable, no population objective for B-13 Current Mortality Objectives: Harvest objective: 12 Total mortality objective: 19 New Strategic Goal: Maintain a stable bear population in B-13 Initial total annual mortality objective: 63 Initial total annual harvest objective: 57 Mortality objectives are derived and monitored through review of the age structure of bear mortality, the composition of gender in harvest, conflict/damage levels and from bear density estimates, where available.
Figure 1. Male harvest, female harvest and total non-hunt black bear mortality in B-13 (2000-2010). Black bear Data Analysis Unit (DAU) B-13 is located in the Western San Luis Valley of Colorado. The DAU includes portions of Saguache, San Juan, Hinsdale, Mineral, Rio Grande, Conejos, Archuleta, and Alamosa Counties. The Game Management Units (GMUs) in B-13 are 68, 76, 79, 80, 81, 681, 682, and 791. Majority of the 3.33 million acre (9,246 km2) DAU is public land and part of the Rio Grande National Forest. Agriculture is an important component on the 1.05 million acres (4,241 km2) of private land. Essentially all of the DAU is considered overall black bear (Ursus americanus) range. However, compared to more productive habitat in Colorado to the east and west, B-13 lacks high bear densities.
3
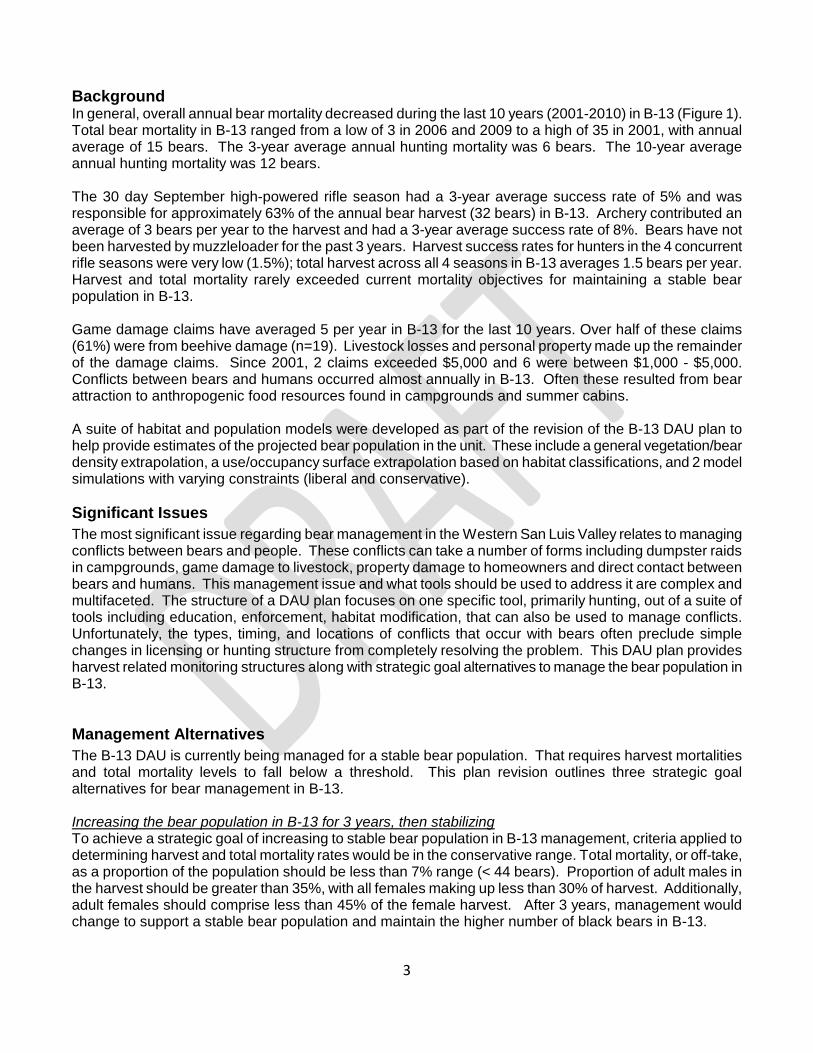
Background In general, overall annual bear mortality decreased during the last 10 years (2001-2010) in B-13 (Figure 1). Total bear mortality in B-13 ranged from a low of 3 in 2006 and 2009 to a high of 35 in 2001, with annual average of 15 bears. The 3-year average annual hunting mortality was 6 bears. The 10-year average annual hunting mortality was 12 bears. The 30 day September high-powered rifle season had a 3-year average success rate of 5% and was responsible for approximately 63% of the annual bear harvest (32 bears) in B-13. Archery contributed an average of 3 bears per year to the harvest and had a 3-year average success rate of 8%. Bears have not been harvested by muzzleloader for the past 3 years. Harvest success rates for hunters in the 4 concurrent rifle seasons were very low (1.5%); total harvest across all 4 seasons in B-13 averages 1.5 bears per year. Harvest and total mortality rarely exceeded current mortality objectives for maintaining a stable bear population in B-13. Game damage claims have averaged 5 per year in B-13 for the last 10 years. Over half of these claims (61%) were from beehive damage (n=19). Livestock losses and personal property made up the remainder of the damage claims. Since 2001, 2 claims exceeded $5,000 and 6 were between $1,000 - $5,000. Conflicts between bears and humans occurred almost annually in B-13. Often these resulted from bear attraction to anthropogenic food resources found in campgrounds and summer cabins. A suite of habitat and population models were developed as part of the revision of the B-13 DAU plan to help provide estimates of the projected bear population in the unit. These include a general vegetation/bear density extrapolation, a use/occupancy surface extrapolation based on habitat classifications, and 2 model simulations with varying constraints (liberal and conservative).
Significant Issues The most significant issue regarding bear management in the Western San Luis Valley relates to managing conflicts between bears and people. These conflicts can take a number of forms including dumpster raids in campgrounds, game damage to livestock, property damage to homeowners and direct contact between bears and humans. This management issue and what tools should be used to address it are complex and multifaceted. The structure of a DAU plan focuses on one specific tool, primarily hunting, out of a suite of tools including education, enforcement, habitat modification, that can also be used to manage conflicts. Unfortunately, the types, timing, and locations of conflicts that occur with bears often preclude simple changes in licensing or hunting structure from completely resolving the problem. This DAU plan provides harvest related monitoring structures along with strategic goal alternatives to manage the bear population in B-13.
Management Alternatives The B-13 DAU is currently being managed for a stable bear population. That requires harvest mortalities and total mortality levels to fall below a threshold. This plan revision outlines three strategic goal alternatives for bear management in B-13. Increasing the bear population in B-13 for 3 years, then stabilizing To achieve a strategic goal of increasing to stable bear population in B-13 management, criteria applied to determining harvest and total mortality rates would be in the conservative range. Total mortality, or off-take, as a proportion of the population should be less than 7% range (< 44 bears). Proportion of adult males in the harvest should be greater than 35%, with all females making up less than 30% of harvest. Additionally, adult females should comprise less than 45% of the female harvest. After 3 years, management would change to support a stable bear population and maintain the higher number of black bears in B-13.

4
Maintaining a stable bear population in B-13 To achieve a strategic goal of maintaining a stable bear population in B-13 management, criteria applied to determining harvest and total mortality rates should fall in an intermediate range. Total mortality, or off-take, as a proportion of the population should fall in the 7-13% range (44 – 82 bears). Proportion of adult males in the harvest should be within 25-35%, with all females making up 30-40% of harvest. Additionally, adult females should comprise approximately 45-55% of the female harvest. Decreasing the bear population in B-13 for 3 years, then stabilizing To achieve a strategic goal of decreasing the bear population in B-13 management, criteria applied to determining harvest and total mortality rates would be in the liberal range. Total mortality, or off-take, as a proportion of the population could exceed 13% (> 82 bears). Proportion of adult males in the harvest can be low, even below 25%, with total female harvest rates going over 40%. Additionally, proportions of adult females can comprise over 55% of the female harvest. After 3 years, management would change to support a stable bear population and maintain the lower number of black bears in B-13.
Preferred Strategic Goal Manage for a stable bear population in B-13. Management criteria used in annual review of harvest and total mortality will fall in the intermediate range. Based on current presumptive estimates of bear density, the harvest mortality objective will be 57 bears, with a total mortality objective of 63 bears. This corresponds to the median of the 7-13% total off-take rate supported by the literature for maintaining a stable bear population. Proportion of adult males in the harvest should be within 25-35%, with all females making up 30-40% of harvest. Additionally, adult females should comprise approximately 45-55% of the female harvest. A secondary goal for the B-13 DAU will be to reduce and mitigate human/bear conflicts and game damage. To meet this goal, there may be infrequent occasions that require exceeding the bear mortality thresholds commensurate with a stable population for highly localized areas. Within the context of a DAU population, this flexibility is compatible with an overall stable goal.
This plan was approved by the Colorado Parks and Wildlife Commission on _____________.

5
BEAR DATA ANALYSIS UNIT (DAU) B-13 GAME MANAGEMENT UNITS 68, 76, 79, 80, 81, 681, 682, and 791
TABLE OF CONTENTS EXECUTIVE SUMMARY ......................................................................................................................................... 2
Significant Issues .............................................................................................................................................. 3 Management Alternatives ............................................................................................................................... 3 Preferred Strategic Goal .................................................................................................................................... 4
TABLE OF CONTENTS .......................................................................................................................................... 5 LIST OF FIGURES AND TABLES .......................................................................................................................... 7 INTRODUCTION AND PURPOSE .......................................................................................................................... 8
DAU Plans and Wildlife Management by Objectives...................................................................................... 8 Data Analysis Unit Description ......................................................................................................................... 9
Location ...................................................................................................................................................... 9 Climate ...................................................................................................................................................... 11 Topography and Vegetation ................................................................................................................... 11 Land Use and Land Status ...................................................................................................................... 13
MANAGEMENT HISTORY .................................................................................................................................... 15 Administrative .................................................................................................................................................. 15 Hunting Seasons .............................................................................................................................................. 15 License Allocation History .............................................................................................................................. 15 Mortality- Harvest and Non-Harvest ............................................................................................................... 16 Mortality- Method of Take ................................................................................................................................ 18 Mortality - Age and Gender ............................................................................................................................. 19 Game Damage and Human Conflict Management ....................................................................................... 20 Current harvest and total mortality objectives ............................................................................................. 21
MANAGEMENT CONSIDERATIONS ................................................................................................................... 21 Habitat Models .................................................................................................................................................. 21
General Vegetation/Bear Density Extrapolation ................................................................................... 22 Use/Occupancy Density Extrapolation .................................................................................................. 23
Forage Condition - Mast Production Surveys ........................................................................................... 255 Population Models ......................................................................................................................................... 266
Liberal Model .......................................................................................................................................... 266 Conservative Model ............................................................................................................................... 266
Mortality Density and Rates .......................................................................................................................... 277 Mortality Composition Indices and Management Criteria ......................................................................... 277 Social Factors ................................................................................................................................................. 300
STRATEGIC GOALS AND MANAGEMENT OBJECTIVES ............................................................................... 300 Process for Developing Strategic Goals and Management Objectives ................................................... 300
Public Input Process ............................................................................................................................. 300 Mortality and harvest objective development ..................................................................................... 311
Monitored Data to Inform Management ....................................................................................................... 302 Total mortality ......................................................................................................................................... 322 Hunter harvest ........................................................................................................................................ 322 Proportion of mortality by age and gender ......................................................................................... 332 Forage condition monitoring ................................................................................................................ 333 Game damage and human conflict ...................................................................................................... 343
Management Objectives ................................................................................................................................ 303 Total Mortality Objective ....................................................................................................................... 323 Hunter Harvest Objective ...................................................................................................................... 333

6
Age & Gender Structure Objectives ..................................................................................................... 344 Game Damage and Human Conflict Objectives ................................................................................. 344
CONCLUSION AND PREFERRED DAU STRATEGIC GOAL .......................................................................... 344 REFERENCES....................................................................................................................................................... 36 APPENDIX: Previous DAU Plan ............................................................................... Error! Bookmark not defined.

7
LIST OF FIGURES AND TABLES Figure 1. Male harvest, female harvest and total non-hunt black bear mortality in B-13 (2000-2010)…..2 Figure 2. Management by objectives process used by CPW to manage big game populations on a DAU basis…………………………………………………..……………………………………………………...……...9 Figure 3. Location and land ownership patterns of B-13…………………………………………………….10 Figure 4. Vegetation classes in B-13…………………………………………………………………….........12 Figure 5. Black bear activity layers in B-13…………………………………………………………………...14 Figure 6. Ten-year license history in B-13………………………………………………………………….…16 Figure 7. Total black bear mortality in B-13………………………………………………………………..….17 Figure 8. Annual average hunting and total mortality by GMU (2001-2010). No known bear mortalities occurred in GMU 791……………………………………………………………………………………………………………….…17 Figure 9. Proportion of females in B-13 harvest and non-harvest mortality………………………….....…18 Figure 10. Age distribution of harvested bears in B-13 (2006-2010)……………………………….……...19 Figure 11. Age distribution of bears from all mortality sources in B-13 (2006-2010)………….….………20 Figure 12. Causes and percentage of known non-harvest mortality in B-13 from 2001-2010…….….…21 Figure 13. Location of bear mortalities in B-13 (2000-2013)…………………………………………..…....24 Figure 14. Bear mast potential scale by Game Management Unit (GMU), assessed in 2008. Scaling was based on the number and type of mast producing species important to bear foraging (1.00 - red = no ranked species present; 1.25 - orange = only 1 or 2 ranked species present, not Gambel’s oak; 1.50 - yellow = juniper, chokecherry, and serviceberry; 1.75 - light green = Gambel’s oak and any other ranked species; and 2.00 - bright green=all four ranked species present)…………………………………………………………25 Figure 15. Harvest composition by age class and gender in B-13 from 2008-2010……………...…..….28 Figure 16. Composition of female harvest in B-13 by age class from 2008-2010………………..……....29
Table 1. Black bear harvest history, by method of take, in B-13 (2001-2010)…………………….……...18 Table 2. B-13 bear numbers based on vegetation extrapolation………………………………..………….22 Table 3. Results of habitat surface area analysis for use/occupancy population estimate in B-13….....23

8
INTRODUCTION AND PURPOSE Colorado Parks and Wildlife (CPW) manages wildlife for the use, benefit and enjoyment of the people of the state in accordance with the CPW’s Strategic Plan and mandates from the CPW Commission and the Colorado Legislature. Colorado’s wildlife resources require careful and increasingly intensive management to accommodate the many and varied public demands and growing impacts from people. Colorado Parks and Wildlife is responsible for the maintenance of Colorado’s big game at population levels that are established through a public review process and approved by the CPW Commission.
DAU Plans and Wildlife Management by Objectives To manage the state’s big game populations, the CPW uses a “management by objective” approach (Figure 2). Big game populations are managed to achieve objectives established for data analysis units (DAUs). DAUs are geographic areas that typically contain an individual big game population. For large mobile carnivores like black bears, DAUs are primarily administrative constructs with generally similar habitats and/or human social considerations. DAUs are composed of smaller areas designated as game management units (GMUs), which provide a more practical framework where the management goals can be refined and applied on a finer scale, typically through hunting regulations. The DAU plan process is designed to balance public demands, habitat and big game populations into a management scheme for the individual DAU. The public, hunters, federal and local land use agencies, landowners and agricultural interests are involved in the determination of the plan objectives through input given during public meetings as well as online surveys, the opportunity to comment on draft plans and when final review is undertaken by the CPW Commission. The strategic goals and specific mortality objectives defined in the plan guide a long term cycle of annual information collection, information analysis and decision making. The end product of this process is a recommendation for numbers of hunting licenses for the DAU (Figure 2). The plan also specifically outlines the management techniques that will be used to reach desired objectives. Colorado Parks and Wildlife intends to update these plans as new information and data become available, at least once every ten years.

9
Figure 2. Management by objectives process used by CPW to manage big game populations on a DAU basis.
Data Analysis Unit Description Location Data Analysis Unit (DAU) B-13 is located in south central Colorado (Figure 3). It is bounded on the north and west by the continental divide, on the south by the Colorado – New Mexico border, and on the east by Highway 17 and the Rio Grande River. The DAU includes portions of Saguache, San Juan, Hinsdale, Mineral, Rio Grande, Conejos, Archuleta, and Alamosa Counties. The Game Management Units (GMUs) in B-13 are 68, 76, 79, 80, 81, 681, 682, and 791.
The counties encompassed by B-13 are considered rural with a mosaic of land tenure. Alamosa, Conejos, Costilla, Mineral, Rio Grande, and Saguache counties comprise majority of the unit. On the valley floor, agriculture is the dominant economic driver. In the foothills and mountains, hunting and tourism provide substantial revenue for the local communities. Due to these outdoor activities, people come into close contact with black bears, especially during the summer months.
The majority of the 3.33 million acre (9,246 km2) DAU is public land (Figure 3). Fifty-one percent of the DAU (1.70 million acres [6,879 km2]) is managed by the US Forest Service (USFS). The USFS lands are nearly all part of the Rio Grande National Forest. The Bureau of Land Management (BLM) is the next largest public land manager with 415 hundred-thousand acres (1,681 km2, 12% of the DAU), which is mainly along the foothills. The state of Colorado manages about 5% of the DAU (151 thousand acres [609 km2]). The State Land Board (SLB) holds 121 thousand acres (492 km2), majority of which is under the Public Access Program and Stewardship Trust Lands. Colorado Parks and Wildlife manages 29.15 thousand acres (118 km2), most of which are State Wildlife Areas (SWA). Hot Creek, La Jara, Russell Lakes, and Higel are the largest SWAs in B-13. The Nature Conservancy oversees 1% of the DAU (3,429 acres [13.88 km2]) as Land Trust. The remaining lands within the DAU are in private ownership.

10
Figure 3. Location and land ownership patterns of B-13.

11
Approximately one-half of the DAU is considered overall black bear range. Approximately 34% of the DAU is designated as summer concentration habitat for black bears. These summer sites occur mainly in the mountains and along river corridors (Figures 4 and 5). Twenty percent of B-13 is denoted as fall concentration areas for black bears.
Climate In general, B-13 has highland mountain climate with cool summers and very cold winters with heavy snow. The higher elevations of the mountains receive 30 inches of precipitation per year. The foothills receive 10 to 12 inches and the valley floor gets only 7 to 8 inches annually and is considered a high desert. The northern part of the DAU is in the rain shadow of the San Juan Mountains and is somewhat drier than the western and southern portions of the San Luis Valley. The higher elevations of the San Juan Mountains in the southwest portion of the DAU receive 50 inches of precipitation annually, while the foothills get 12 to 16 inches. Most annual precipitation comes in the form of snow; however, summer moisture in the form of rain can have a significant impact on the growth of plant forage resources used by bears.
Topography and Vegetation Elevation ranges from a low of about 7,500 feet north of Monte Vista to over 14,000 feet in the San Juan mountains. The lower elevations between 7,500 and 8,200 feet are grassland\shrub and agricultural lands. As elevation and precipitation increase, the vegetation changes to pinion-juniper (Pinus edulis-Juniperus spp.), ponderosa pine (Pinus ponderosa), then Douglas fir (Pseudotsuga) and white fir (Abies concolor) combined with extensive stands of aspen (Populus tremuloides). Lodgepole pine (Pinus contorta) is found in the northern part of the DAU. Between 9,500 and 12,500 feet stands of Englemann spruce (Picea engelmannii) and subalpine fir (Abies lasiocarpa) are predominate. Large areas of alpine occur above 12,500 feet.
Principal vegetation classes across the DAU include Englemann spruce-fir mix, rabbitbrush (Chrysothamnus viscidiflorus)-grass mix, grass dominated rangeland, and irrigated agriculture. There is a relatively smaller component of aspen, rocky outcrops, greasewood (Sarcobatus vermiculatus), pinon juniper, sedges (Carex spp.), Douglas fir, ponderosa pine, subalpine grasses and forbes. Bears most often occur in the spruce-fir, ponderosa pine, and aspen communities. A vegetative analysis was conducted in B-13 to classify bear habitat within the DAU. Of the 3.33 million acres (13,490 km2), 1.62 million acres (6,566 km2) is not considered bear habitat. The remaining 1.71 million acres (6,923 km2) is considered bear habitat with 1.19 million acres (4,812 km2) identified as primary habitat (cover types that bears typically and normally are found at various times of year), 0.15 million acres (606 km2) identified as secondary habitat (cover types that bears occasionally use but is not preferred) and 0.37 million acres (1,494 km2) identified as edge habitat (cover types infrequently or rarely used and might be found in mostly when adjacent to primary cover types). Bear densities are highest in areas with an abundance of soft mast trees and shrubs, such as pinyon-juniper, serviceberry (Amelanchier utahensis) and Gambel’s oak (Quercus gambelii, Figure 4). Apart from the aspen vegetation class, none of the coarse-scale vegetation communities support high densities of bears on their own. Natural forage sources important to bears exist at a much finer scale in B-13. The primary finer-scale vegetation class of highest use however, would be the riparian communities closely associated with the ponderosa pine forests and foothill shrub components. Natural bear habitat could be considered fair to poor in much of B-13 relative to other parts of Colorado. The Western San Luis Valley has a fair amount of pinyon pine trees that provide some hard mast as a food resource. A low abundance of oakbrush, occurring mainly in Saguache county, supplies additional hard mast. Soft mast production (predominately serviceberry) is rare but can be found in riparian areas (Figure 4). While natural food sources may be moderately productive at best, bears living near human communities in the Western San Luis Valley have another significant source of high-quality nutrition in the form of

12
anthropogenic sources. Anthropogenic sources include food associated with human activities including trash, pet food, barbeque grills and bird feeders. This is in addition to food associated with traditional human agricultural activities including crop fields, livestock, and beehives.
Figure 4. Vegetation classes in B-13.

13
Land Use and Land Status Recreational activity in the Western San Luis Valley is one of the dominant issues when evaluating bear management in B-13. Summer recreation continues to increase in this area. Out-of-state tourists and locals from the San Luis Valley visit the mountains to escape the summer heat and enjoy the outdoors. Activities include camping, hiking, horseback riding, mountain biking, fishing, and use of off-highway vehicles (OHVs). United States Forest Service and BLM lands receive the majority of these recreationalists. These same lands overlap bear habitat in the DAU (Figure 5). The impacts by these various forms of recreation in B-13 are unknown. However, human activity in the area likely alters the normal patterns of bears. Noise pollution may displace bears from some areas while human food and trash may attract bears into other areas.
Land development and habitat fragmentation are more localized and less immediate problems in B-13. Since the majority of the bear habitat is in the Rio Grande National Forest, there is a lower risk of road and building construction. However, proposed land exchange and resort construction near Wolf Creek Ski area may impact summer concentration habitat for bears. Conflicts between humans and bears already occur nearby in South Fork as well as between Wolf Creek Pass and Pagosa Springs. If human density grows around Wolf Creek pass, encounters between humans and bears likely will rise.
Private land exists in the unit along the Conejos River, the Rio Grande River, and San Luis Creek. As interests for “summer cabins” increase, so do the chances of development of these lands. Secondary impacts from development to the bear population could be increased human food sources, increased human use in occupied bear areas, and increased vehicle traffic.
Another form of land development that may affect bear habitat is oil and gas extraction. Although this issue is in the beginning stages, public land agencies are considering leasing more land to industries. Habitat alteration and noise disturbance from oil and gas wells may push bears out of those sites and into other places. Displaced bears may cause problems in the places where they relocate if they pursue human food sources.

14
Figure 5. Black bear activity layers in B-13.

15
MANAGEMENT HISTORY
Administrative The DAU included GMUs 68, 76, 79, 80, 81, 681, 682, and 791 and the corresponding boundaries for over 10 years. In 2005, GMUs 682 and 791 were formed and added to the DAU. These units primarily were created to help manage elk and deer numbers on the valley floor. Management of land in the DAU varies greatly based on whether ownership is public or private and by the habitat type.
Hunting Seasons Prior to 1935, black bears were not considered a game animal, which afforded them no protection from being shot on sight if they were encountered, or preyed on livestock. In 1935, they were awarded some protection by being classified by the state legislature as a game animal. This established limits on the annual harvest and on the number of licenses that an individual could possess. From 1935 to 1963, bears were hunted in the fall usually concurrently with the annual deer and elk seasons. In 1964, a spring hunting season was established with unlimited licenses available. This continued until 1986, when licenses for the spring season were limited (Beck 1991). The fall hunting seasons occurred concurrently with the established deer and elk seasons. Licenses were unlimited until the limited September rifle seasons were established in 1989. Hunters wishing to hunt bears during the established deer and elk season still had access to unlimited licenses until 2005 when license caps were established for these licenses (Appendix). In 1992, a constitutional amendment was passed and changed bear hunting within the state by preventing bear hunting prior to September 1st and outlawed the use of bait and dogs as aids for hunting black bears. Since 1992 annual hunting seasons have opened on September 2nd. The average hunter harvest in the last 10 years was 12 bears, with a low of 3 in 2006 and 2009 and a high of 33 in 2001. Removal of problem bears added an average of 3 bears to the harvest each year. Licenses have been unlimited in regular rifle seasons. During 1993 and 1994 seasons, 1,000 licenses were issued on a statewide basis. From 1995 through 1998, 2,000 licenses were issued for the September season. Starting in 1999 licenses for the September season were issued on a DAU basis, and 100 licenses were allocated. Since 2000, hunting seasons have started with an early, limited rifle season that runs from September 2nd through September 30th each year, along with concurrent archery, muzzleloader, 1st, 2nd, 3rd and 4th rifle season licenses. Under the current season structure, the 4 concurrent seasons are 5 days, 9 days, 9 days and 5 days in length. Harvest is concentrated in the limited September rifle season as it is synchronized with the initial phases of the bear hyperphagia period.
License Allocation History License allocations in B-13 have had only a few changes in the last 10 years (Figure 6). From 1999-2002 September rifle licenses were specified in B-13, but unlimited in number. Since the fall of 2003, September rifle licenses have been limited. In fall 2008, September rifle licenses quota was raised from 50 to 75. Those license numbers have remained the same since then. Archery and muzzleloader seasons were specified and limited from 2003 – 2004. Beginning in the fall of 2005, archery, muzzleloader, and concurrent rifle (1st, 2nd, 3rd and 4th big game rifle seasons) became over-the-counter (OTC) with caps. That meant that a limited number of licenses (capped number) were issued for each hunt code but licenses could be purchased without going through the limited draw (bought first-come, first-served). However, this had no functional impact on concurrent rifle season bear hunter opportunity, as the license cap was rarely reached.

16
Archery and muzzleloader hunters experienced an impact in opportunity in going from unlimited to OTC with caps, as those licenses often sell out within a few days of going on sale.
Figure 6. Ten-year license history in B-13.
Mortality- Harvest and Non-Harvest In general, overall annual bear mortality dampened over the last 10 years (2001-2010) in B-13 (Figure 7). Total bear mortality in B-13 ranged from a high of 35 in 2001 to a low of 3 in 2006 and 2009. While the 10-year average for annual bear mortality was 14 bears, the 3-year average was half that amount with only 7 bears. Mortality from hunter harvest accounted for most of the total bear mortality. The 10-year average of hunting mortality was 12 bears per year and 3-year average was 6 bears per year. A similar trend occurred with non-harvest mortalities, which went from a 10-year average of 3 bears to a 3-year average of 1 bear.

17
Figure 7. Total black bear mortality in B-13.
Harvest mortality and total mortality varied by GMU, but were proportionally consistent across the last 10 years (2001-2010). Game Management Unit 81 had the highest levels of harvest and total mortality in the DAU, followed by GMUs 80 and 681 (Figure 8). Game Management Unit 682 did not have any reported harvest mortality; GMU 791 had no known bear mortality. Harvest levels appear to be roughly proportional to the amount of fall bear habitat, GMU size and hunting access levels. Total mortality contributions per GMU follow the same ranking order as harvest mortality.
Figure 8. Annual average hunting and total mortality by GMU (2001-2010). No known bear mortalities occurred in GMU 791. The proportion of females in the B-13 mortality was fairly constant over the last 10 years (Figure 9). A higher proportion of females were taken from non-harvest mortality in 2002. A lower proportion of females were taken by harvest mortality in 2009. These variations may be due to the relatively small annual harvest numbers in B-13 where a difference of a few females in either direction can impact the proportions. While the proportion can vary significantly in any given year, the 3-year and 10-year averages of female

18
proportions in mortality were fairly similar. The 3-year average proportion of females in the harvest was 28%, while the 10-year average was 34%. Proportion of females in non-harvest mortality was much lower than that of harvest mortality. The 3-year proportion of females in non-harvest mortality was 0% and 10-year average was 4%.
Figure 9. Proportion of females in B-13 harvest and non-harvest mortality.
Mortality- Method of Take Among methods of take, the 30 day September high-powered rifle season had the highest average 3-year success rate (5%), and was responsible for approximately 63% of the annual bear harvest in B-13 (Table 1). Archery hunters contributed a 10-year average of 1 bear per year to the harvest and had a 3-year average success rate around 8% in B-13. Bears were not harvested by muzzleloader for the past 3 years. Harvest success rates for hunters in the 4 concurrent rifle seasons were very low (1.5%); total harvest across all 4 seasons in B-13 averaged 1.5 bears per year. Harvest and total mortality rarely exceeded current mortality objectives for maintaining a stable bear population in B-13.
Year Archery Harvest
Muzzleloader Harvest
September Rifle Harvest
1st-4th Rifle Season Harvest
2001 0 0 0 0 2002 0 0 0 0 2003 0 0 0 0 2004 0 0 0 0 2005 1 0 7 9 2006 0 0 2 3 2007 3 1 11 14 2008 0 0 4 5 2009 1 0 2 2 2010 4 0 6 8
3 year average 2 0 4 5 10 year average 1 0 3 4
Table 1. Black bear harvest history, by method of take, in B-13 (2001-2010).
19
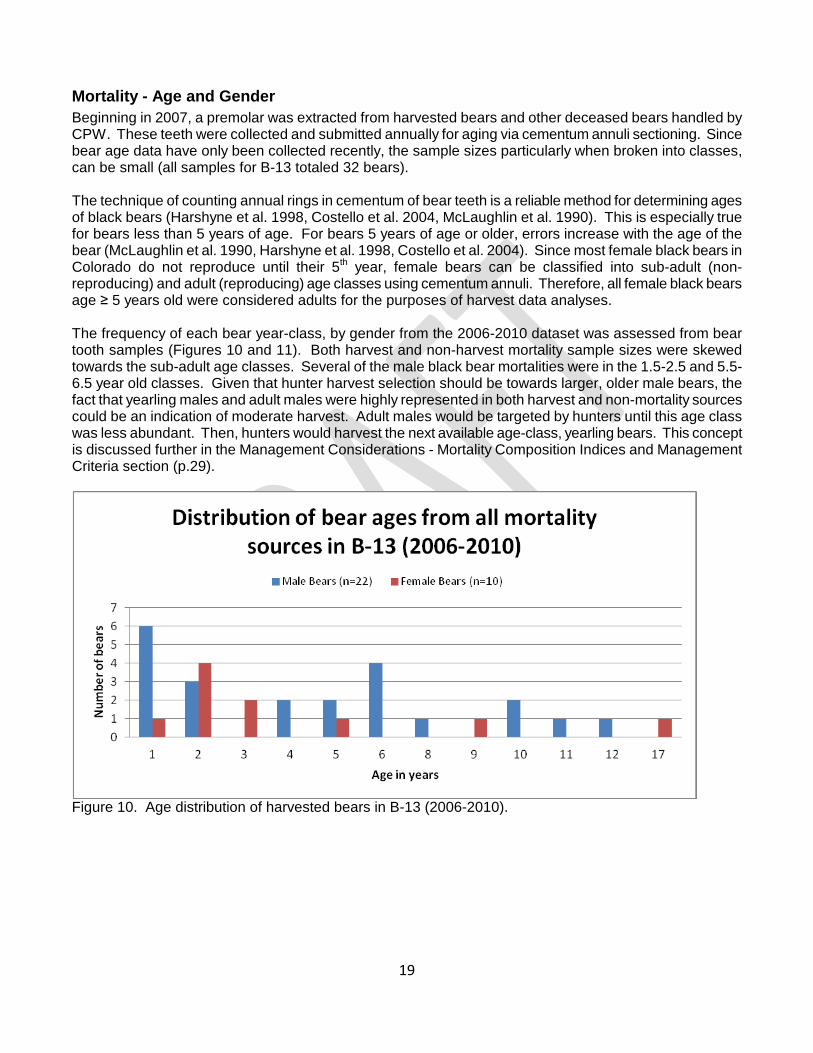
Mortality - Age and Gender Beginning in 2007, a premolar was extracted from harvested bears and other deceased bears handled by CPW. These teeth were collected and submitted annually for aging via cementum annuli sectioning. Since bear age data have only been collected recently, the sample sizes particularly when broken into classes, can be small (all samples for B-13 totaled 32 bears). The technique of counting annual rings in cementum of bear teeth is a reliable method for determining ages of black bears (Harshyne et al. 1998, Costello et al. 2004, McLaughlin et al. 1990). This is especially true for bears less than 5 years of age. For bears 5 years of age or older, errors increase with the age of the bear (McLaughlin et al. 1990, Harshyne et al. 1998, Costello et al. 2004). Since most female black bears in Colorado do not reproduce until their 5th year, female bears can be classified into sub-adult (non-reproducing) and adult (reproducing) age classes using cementum annuli. Therefore, all female black bears age ≥ 5 years old were considered adults for the purposes of harvest data analyses. The frequency of each bear year-class, by gender from the 2006-2010 dataset was assessed from bear tooth samples (Figures 10 and 11). Both harvest and non-harvest mortality sample sizes were skewed towards the sub-adult age classes. Several of the male black bear mortalities were in the 1.5-2.5 and 5.5-6.5 year old classes. Given that hunter harvest selection should be towards larger, older male bears, the fact that yearling males and adult males were highly represented in both harvest and non-mortality sources could be an indication of moderate harvest. Adult males would be targeted by hunters until this age class was less abundant. Then, hunters would harvest the next available age-class, yearling bears. This concept is discussed further in the Management Considerations - Mortality Composition Indices and Management Criteria section (p.29).
Figure 10. Age distribution of harvested bears in B-13 (2006-2010).

20
Figure 11. Age distribution of bears from all mortality sources in B-13 (2006-2010).
Game Damage and Human Conflict Management Game damage claims have averaged 5 per year in B-13 for the last 10 years. Over half of these claims (61%) are from beehive damage (n=19). Livestock losses and personal property make up the remainder of the damage claims. Since 2001, 2 claims exceeded $5,000 and 6 were between $1,000 - $5,000. Conflicts between bears and humans occur annually in B-13. Often these result from bear attraction to anthropogenic food resources found in campgrounds and summer cabins.
There have been 37 black bear claims paid out in B-13 in the 10 years since personal property claims were removed from CPW liability (August 2001). Sixty one percent of these claims were for beehives (n=19); the remainder were for livestock and personal property. The mean claim payment since 2001 was $1,238, with a range from $50- $6,975. During these 10 years, the 2 claims that exceeded $5,000 were for beehives. Six claims were between $1,000 - $5,000; 2 of these were for beehives, 2 for cattle, 1 for feed, and 1 for a recreational vehicle. The majority of the claims have been in GMU 81 (n=20), followed by GMU 79 (n=4). Game management units 68 and 681 had 2 claims each, and GMUs 76, 80, and 791 had 1 claim each.
21
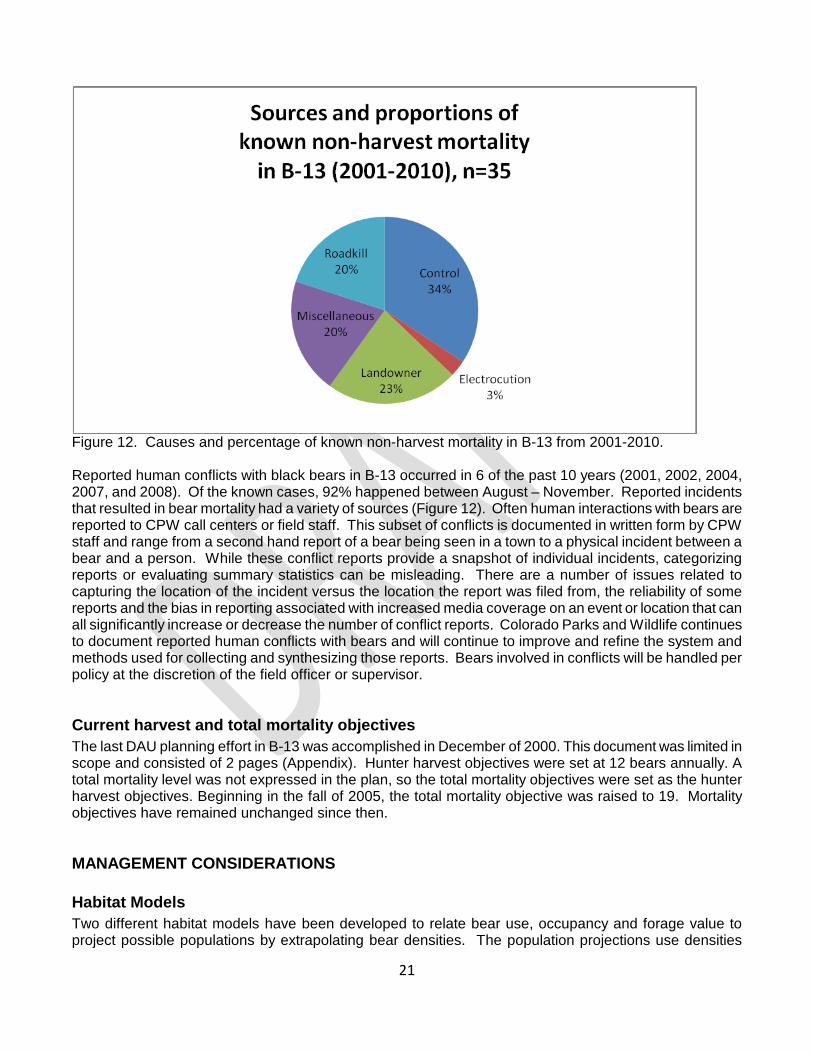
Figure 12. Causes and percentage of known non-harvest mortality in B-13 from 2001-2010.
Reported human conflicts with black bears in B-13 occurred in 6 of the past 10 years (2001, 2002, 2004, 2007, and 2008). Of the known cases, 92% happened between August – November. Reported incidents that resulted in bear mortality had a variety of sources (Figure 12). Often human interactions with bears are reported to CPW call centers or field staff. This subset of conflicts is documented in written form by CPW staff and range from a second hand report of a bear being seen in a town to a physical incident between a bear and a person. While these conflict reports provide a snapshot of individual incidents, categorizing reports or evaluating summary statistics can be misleading. There are a number of issues related to capturing the location of the incident versus the location the report was filed from, the reliability of some reports and the bias in reporting associated with increased media coverage on an event or location that can all significantly increase or decrease the number of conflict reports. Colorado Parks and Wildlife continues to document reported human conflicts with bears and will continue to improve and refine the system and methods used for collecting and synthesizing those reports. Bears involved in conflicts will be handled per policy at the discretion of the field officer or supervisor.
Current harvest and total mortality objectives The last DAU planning effort in B-13 was accomplished in December of 2000. This document was limited in scope and consisted of 2 pages (Appendix). Hunter harvest objectives were set at 12 bears annually. A total mortality level was not expressed in the plan, so the total mortality objectives were set as the hunter harvest objectives. Beginning in the fall of 2005, the total mortality objective was raised to 19. Mortality objectives have remained unchanged since then.
MANAGEMENT CONSIDERATIONS
Habitat Models Two different habitat models have been developed to relate bear use, occupancy and forage value to project possible populations by extrapolating bear densities. The population projections use densities

22
derived from relevant Colorado data and from literature. Managers applied densities representative of similar habitats and vegetation types in Colorado to develop population projections and then select population ranges which best represent current conditions in the DAU.
General Vegetation/Bear Density Extrapolation The first model was developed by Gill and Beck (1991) in an unpublished report to the CPW Commission and was modified by Apker (2003) in an internal Colorado Division of Wildlife report. This model applies subjective probable black bear densities for different vegetation types to the amount of land area of those vegetation types in the various GMUs. The vegetation type amounts for this model were derived from landsat GAP project coarse vegetation types. This vegetation/density model provides a snapshot extrapolation of possible bear population size in Colorado based on current vegetation classes and both measured and projected bear densities in those vegetation classes from the 1990s. This model and its subsequent extrapolation yielded a projected bear population in B-13 of 635 black bears (Table 2).
Common Name Square Miles of
Veg. Class in DAU Acres of Veg. Class in DAU
Percent of DAU in Veg. Class
Bear Density as 1 bear/X mi2
Bear Numbers
Aspen 393.12 251,597 7.57% 1 393
Bristlecone pine 4.61 2,948 0.09% 10 0
Douglas fir 334.83 214,291 6.45% 8 42
Forest dominated wetland/riparian 2.7 1,725 0.05% 10 0
Gambel oak 4.94 3,163 0.10% 1 5
Juniper woodland 1.14 731 0.02% 20 0
Limber pine 1.39 892 0.03% 10 0
Lodgepole pine 34.66 22,180 0.67% 10 3
Mesic upland shrub 0.99 633 0.02% 6 0
Mixed conifer 39.56 25,319 0.76% 10 4
Mixed forest 0.3 193 0.01% 6 0
Pinyon juniper 341.08 218,291 6.57% 8 43
Ponderosa Pine 120.58 77,174 2.32% 6 20
Shrub dominated wetland/riparian 12.65 8,093 0.24% 10 1
Spruce fir 1,108.73 709,589 21.36% 10 111
Subalpine meadow 118.27 75,692 2.28% 10 12
TOTAL 2,519.55 1,612,511 48.55%
635 bears
Table 2. B-13 bear numbers based on vegetation extrapolation.
23
Use/Occupancy Density Extrapolation Bear habitat in B-13 was evaluated using a 2 tiered habitat ranking system. First, the landscape was categorized by vegetation classes using CPW Basinwide GIS Vegetation Classification data. Secondly, each of these vegetation classes was refined according to bear use/occupancy and relative forage value. Use/occupancy was defined at 4 levels: primary, secondary, edge, and out (or not bear habitat). Primary vegetation classes represented in B-13 were aspen, aspen/mountain shrub, mixed forest, ponderosa pine, spruce/fir mix, lodgepole pine, and Gambel’s oak (Figure 4). Relative forage value was rated for primary, secondary, and edge habitat at 3 levels; high, moderate or low based upon the perceived potential of those habitats to provide forage for black bears. Use/occupancy terms were defined as follows:
Primary – cover types that bears typically and normally are found at various times of year. Secondary – cover types that bears occasionally use but is not preferred. Edge – cover types infrequently used, but bears may be found in when adjacent to primary cover types. Out – cover types that are not black bear habitat or those in which bears would only travel through.
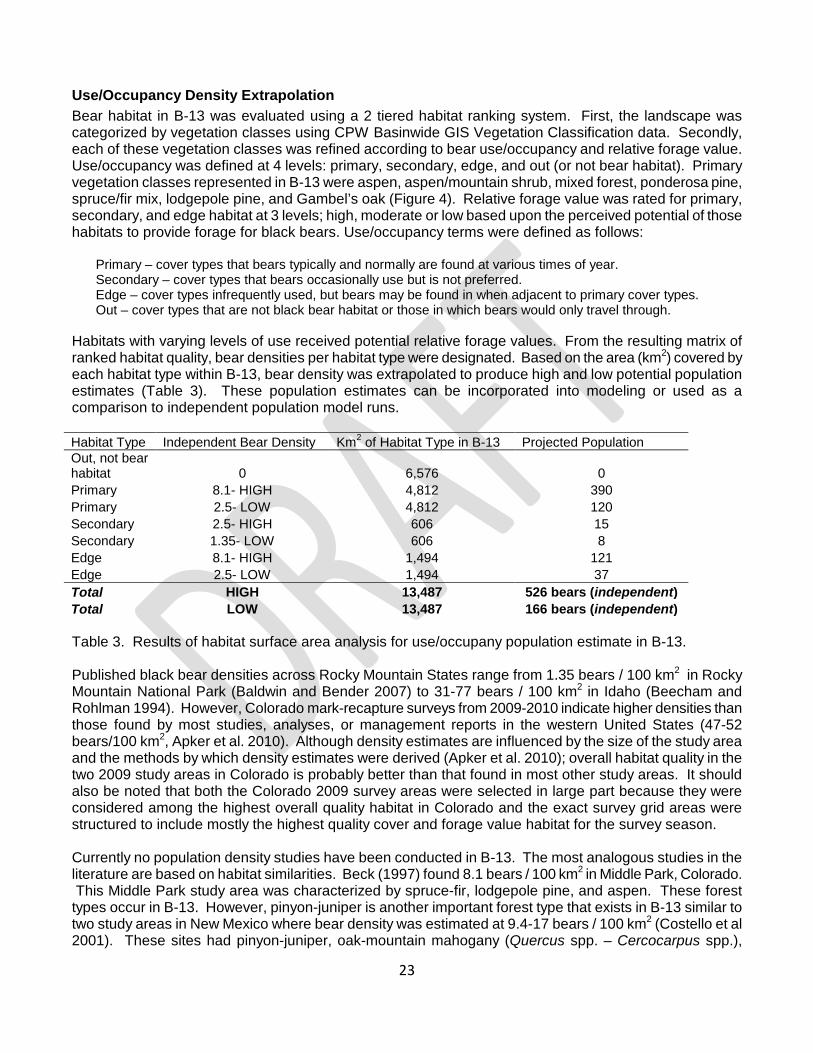
Habitats with varying levels of use received potential relative forage values. From the resulting matrix of ranked habitat quality, bear densities per habitat type were designated. Based on the area (km2) covered by each habitat type within B-13, bear density was extrapolated to produce high and low potential population estimates (Table 3). These population estimates can be incorporated into modeling or used as a comparison to independent population model runs. Habitat Type Independent Bear Density Km2 of Habitat Type in B-13 Projected Population Out, not bear habitat 0 6,576 0 Primary 8.1- HIGH 4,812 390 Primary 2.5- LOW 4,812 120 Secondary 2.5- HIGH 606 15 Secondary 1.35- LOW 606 8 Edge 8.1- HIGH 1,494 121 Edge 2.5- LOW 1,494 37 Total HIGH 13,487 526 bears (independent) Total LOW 13,487 166 bears (independent) Table 3. Results of habitat surface area analysis for use/occupany population estimate in B-13. Published black bear densities across Rocky Mountain States range from 1.35 bears / 100 km2 in Rocky Mountain National Park (Baldwin and Bender 2007) to 31-77 bears / 100 km2 in Idaho (Beecham and Rohlman 1994). However, Colorado mark-recapture surveys from 2009-2010 indicate higher densities than those found by most studies, analyses, or management reports in the western United States (47-52 bears/100 km2, Apker et al. 2010). Although density estimates are influenced by the size of the study area and the methods by which density estimates were derived (Apker et al. 2010); overall habitat quality in the two 2009 study areas in Colorado is probably better than that found in most other study areas. It should also be noted that both the Colorado 2009 survey areas were selected in large part because they were considered among the highest overall quality habitat in Colorado and the exact survey grid areas were structured to include mostly the highest quality cover and forage value habitat for the survey season. Currently no population density studies have been conducted in B-13. The most analogous studies in the literature are based on habitat similarities. Beck (1997) found 8.1 bears / 100 km2 in Middle Park, Colorado. This Middle Park study area was characterized by spruce-fir, lodgepole pine, and aspen. These forest types occur in B-13. However, pinyon-juniper is another important forest type that exists in B-13 similar to two study areas in New Mexico where bear density was estimated at 9.4-17 bears / 100 km2 (Costello et al 2001). These sites had pinyon-juniper, oak-mountain mahogany (Quercus spp. – Cercocarpus spp.),

24
ponderosa pine, mixed conifer, and aspen. With the exception of oak-mountain mahogany, the New Mexico habitat was similar to B-13. Several other correlates of bear habitat use/occupancy include harvest density/locations, roadkill/highway crossings, and conflict hotspots. An evaluation of B-13 harvest locations superimposed on the basic categories of bear habitat use and occupancy indicated that most harvest, and presumably majority of the bears, were found in primary habitat (Figure 13). Some bears were harvested outside of modeled habitat, but along riparian corridors (e.g., Saguache Creek, Rio Grande River, and Conejos River). A few bears occurred in localized areas associated with anthropogenic food sources as documented through roadkill, harvest and conflicts (APHIS/ADC, CPW and Landowner).
Figure 13. Location of bear mortalities in B-13 (2000-2013).
25
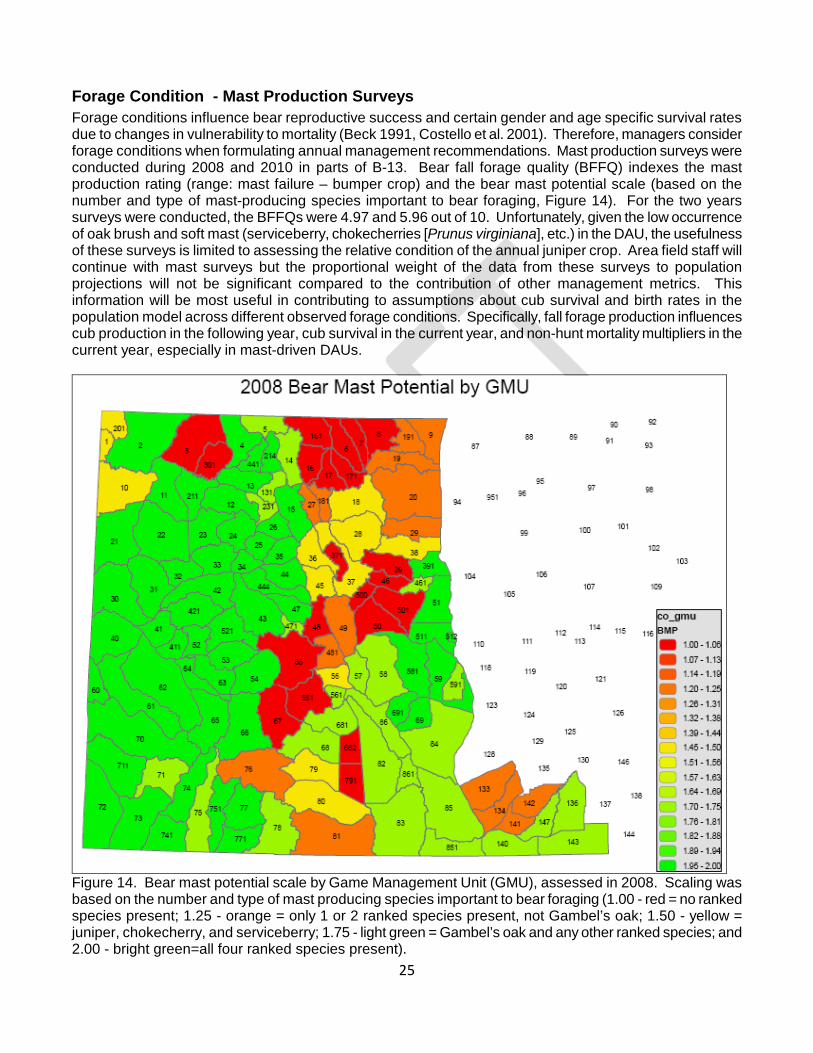
Forage Condition - Mast Production Surveys Forage conditions influence bear reproductive success and certain gender and age specific survival rates due to changes in vulnerability to mortality (Beck 1991, Costello et al. 2001). Therefore, managers consider forage conditions when formulating annual management recommendations. Mast production surveys were conducted during 2008 and 2010 in parts of B-13. Bear fall forage quality (BFFQ) indexes the mast production rating (range: mast failure – bumper crop) and the bear mast potential scale (based on the number and type of mast-producing species important to bear foraging, Figure 14). For the two years surveys were conducted, the BFFQs were 4.97 and 5.96 out of 10. Unfortunately, given the low occurrence of oak brush and soft mast (serviceberry, chokecherries [Prunus virginiana], etc.) in the DAU, the usefulness of these surveys is limited to assessing the relative condition of the annual juniper crop. Area field staff will continue with mast surveys but the proportional weight of the data from these surveys to population projections will not be significant compared to the contribution of other management metrics. This information will be most useful in contributing to assumptions about cub survival and birth rates in the population model across different observed forage conditions. Specifically, fall forage production influences cub production in the following year, cub survival in the current year, and non-hunt mortality multipliers in the current year, especially in mast-driven DAUs.
Figure 14. Bear mast potential scale by Game Management Unit (GMU), assessed in 2008. Scaling was based on the number and type of mast producing species important to bear foraging (1.00 - red = no ranked species present; 1.25 - orange = only 1 or 2 ranked species present, not Gambel’s oak; 1.50 - yellow = juniper, chokecherry, and serviceberry; 1.75 - light green = Gambel’s oak and any other ranked species; and 2.00 - bright green=all four ranked species present).

26
Population Models Deterministic population models were developed on a framework of annual biological, harvest and density assumptions to project assumed populations using available data. We used a starting population at the higher end of the range taken from the early 1990s vegetation/density extrapolation and projected it to 2014. We used plausible values for age specific survival, number of cubs per litter, and the model includes input values to account for changes to reproduction and mortality rates due to poor forage years. For years 1995, 2002, 2007, and 2010, mast production was rated lower than average; 1999 and 2006 were rated as above average years; all other years since 1992 were considered average for mast production. We used the relative amount of non-hunt mortality to provide an index of forage conditions. The models used mortality data with harvest as a direct model input and non-hunt mortality adjusted upward since CPW records do not document all non-hunt mortality. Population estimates predicted by models were derived from plausible, yet assumed input values. Two models in B-13 were compared. One projected a liberal population with attendant liberal, but plausible model parameters. The other was a conservative population projection with more conservative parameters. Assumptions common to both Liberal and Conservative Models The initial population size of 600 bears and the starting age distributions for both models was derived from extrapolations of habitat quantity and known bear densities from the literature. Sex ratio at birth was assumed to be 50/50, with an average litter size of 1.8. Adult female bears were considered capable of reproducing, ≥ 5 years old. Birth interval was estimated to be 2 years between litters. Subadult and adult survival rates were largely midpoints of published ranges in New Mexico and Colorado (Costello et al. 2001, Beck 1991, Beck 1997), while cub survival fell within published ranges but was modulated by a mast index that is intended to reflect documented forage conditions on a yearly basis. Given the weak influence of mast in B-13, cub survival rates were assumed to be slightly lower but less variable than in models of mast-driven systems. Cub survival rates were estimated as 40% (poor food years), 57% (average food years) and 65% in good food years. Predicted population and age structure levels beyond the current year (2012) relied upon the continuation of assumptions used in the preceding years, as well as projected future mortality levels at levels necessary to stabilize the population.
Liberal Model The assumptions used specifically in the liberal model included annual age and gender specific survival rates that were unaffected by natural or human forage conditions, although the forage condition or mast index that modulates cub survival rates did minimally impact age class totals (see rates below). Age class mortality was calculated using reported harvest mortality multiplied by an estimated non-harvest rate of 1.5. Modeling efforts using the liberal inputs yields a 2011 post-hunt population projection of 846 bears, with 130 cubs, 426 females and 209 males. Excluding cubs, the 2011 B-13 projection of independent bears is 715.
Conservative Model The assumptions used specifically in the conservative model included annual age and gender specific survival rates that were generally 1-2% lower than those used in the liberal model, and were unaffected by natural or human forage conditions. Age class mortality was calculated using reported harvest mortality multiplied by an estimated non-harvest rate of 1.25. Modeling efforts using the conservative inputs outlined above yields a 2011 post-hunt population projection of 747 bears, with 117 cubs, 380 females and 250 males. Excluding cubs, the 2011 B-13 projection of independent bears is 630.

27
The results of the liberal and conservative models fit better with the vegetation extrapolation population estimates (Table 2) than the habitat surface estimates (Table 3). Nonetheless, the value of the models is most worthwhile in the population trajectories and responses to mortality and forage condition variability than the absolute population numbers they produce.
Mortality Density and Rates The amount of human-caused mortality in relation to the amount of suitable habitat available is another method to gauge the impacts of human-caused mortality on black bear populations. This can be useful in illustrating impacts on a more local scale and standardizing mortality between DAUs with varying habitat suitability. The number of human-caused mortalities can be divided by the area of primary and secondary habitat. Thus B-13, with 5,418 km2 of primary and secondary habitat and an average of approximately 15 bear mortalities per year over the past 10 years, had a mortality density of 0.27 bears / 100 km2. Assuming that the bear population is approximately 630 bears, which is the rounded mid-point between the various habitat and population model projections, the median bear population density in the DAU is about 11.6 bears/100 km2. Using these figures to calculate a mortality rate yields: 0.27/11.6 = 2%. Some non-harvest bear mortality likely occurs in B-13 that is undetected, but it is unlikely that the average 10-year total mortality exceeds 45 bears. At that level the mortality rate would be about 7% with the median bear population density. Miller (1990) demonstrated that under optimal conditions of reproduction and survival, maximum sustainable total mortality for black bears could be as high as 14.2%. Beck and White (1996, unpublished) conducted black bear population simulation analyses, which given their assumptions, produced stable bear populations with annual mortality at up to 15%. It is unlikely that bears annually experience optimum reproduction and survival conditions due to environmental variation affecting forage conditions and black bear vulnerability to mortality factors. Therefore, we formulated mortality rate thresholds associated with different management strategies which are somewhat lower than the foregoing:
Management Strategy Mortality Rate Threshold Total Mortality for 630 bears
Increasing < 7% <44 Stable 7% - 13% 44-82 Decreasing > 13% >82
Mortality Composition Indices and Management Criteria Black bear vulnerability to harvest and other mortality factors varies depending upon differences in habitat, hunter effort or pressure, access, and forage conditions. Bears are less vulnerable where cover is dense over large geographic areas. They are more vulnerable where vehicle access is good. The greatest influence in annual variation in bear vulnerability is forage conditions. When natural forage quality or availability is poor bears must become much more mobile in search of food, especially during fall hyperphagic periods. Increased mobility tends to result in bears being more visible to hunters, more likely to encounter human food sources, more frequently found along or crossing roads, and more concentrated in areas where there may be relatively more forage available. All of these tendencies can result in increased hunter harvest, increase human-conflict mortality, more roadkills and other forms of mortality. Not all segments of bear populations are equally vulnerable however, regardless of other influences. Hunting pressure affects harvest rate, which affects age structure, sex ratios, and densities of black bear

28
populations. Adult males are typically most vulnerable because they are bold (often use open areas) and have larger home ranges. Sub-adult males are slightly less vulnerable. Consequently, the adult male segment of a population is the first to be reduced under hunter pressure. As harvest rates increase, the proportion of sub-adult black bears (those < 5 years old) in the harvest typically increases, whereas the proportion of adult males declines. A low percentage of adult males (≥5 years old) in the harvest may be an indication of over-harvest. This criterion is a more sensitive indicator of black bear population levels than median age (Idaho Dept. of Fish and Game 1998). The mean percent of adult males in the harvest in relatively stable populations in Idaho (Beecham and Rohlman 1994) and New Mexico (Costello et al. 2001) under moderate to high harvest levels was 30% and 28%, respectively. Studies of black bear populations in Alaska, Virginia, and Arizona showed similar relationships between lightly and heavily hunted populations. Therefore, 25% to 35% adult males in the harvest could indicate a stable black bear population. Levels lower than 25% may indicate a higher level of harvest, which has reduced the adult male segment of the population; whereas levels higher than 35% may indicate a much lighter harvest level. Based on the past 3 years of data, adult males comprised 31% of the total harvest in B-13, which may reflect a stable black bear population (Figure 15). As harvest levels increase and additional adult and sub-adult males are removed from an area, the proportion of females in the harvest begins to increase (Fraser et al. 1982, Kolenosky 1986, Beecham and Rohlman 1994), because female are least vulnerable, especially if accompanied by cubs. The average percent females in the harvest of black bear populations under moderate and high hunting pressure in Idaho (Beecham and Rohlman 1994) and New Mexico (Costello et al. 2001) was 35% and 40%, respectively. Beecham and Rohlman (1994) suggest a desired proportion of female harvest of 35% to maintain a stable population, whereas Beck (1991) suggested maintaining <40% females in harvest. Therefore, a range of 30% to 40% females in the total harvest could indicate a stable black bear population. Data Analysis Unit B-13 appeared to be at the lower end of the stable range, with a 31% female harvest rate over the last 5 years (Figure 15). Proportions < 30% may suggest an increasing number of females in the population. Monitoring this criterion helps ensure a stable reproductive portion of the population and the ability of the population to rebound in the event of a decline.
Figure 15. Harvest composition by age class and gender in B-13 from 2008-2010.

29
With increasing harvest of a black bear population, younger females are removed and older females become more common in the harvest. Thus, the proportion of adults in the female harvest should rise with harvest rates, increasing mean age of females in the harvest (Kolenosky 1986, Beecham and Rohlman 1994). This phenomenon is especially important with late-reproducing species like bears, since removing adult females has the enhanced effect of not only reducing the number of bears in the population, but also decreasing reproductive potential of the population and, thus, its ability to respond to declines. The delayed response of slow reproducing populations to reductions was noted by Harris (1984) and was demonstrated in modeling efforts by Miller (1990), who predicted black bear populations reduced by 50% would take an average of 17 years to recover if hunting pressure was reduced by 25%.
The percent of adults in the female harvest, rather than mean or median age of the females in the harvest, can also be used to gauge the presumed population trajectory. Averaged over a three-year period, this criterion provides a more meaningful measurement of female harvest age structure, especially in areas with small sample sizes. The mean percent of adult females in the harvest of two New Mexico black bear populations under moderate and high harvest pressure was 55% and 70%, respectively (Costello et al. 2001). The mean percent adult females in the Wyoming statewide female black bear harvest from 1994-2005 was 47%, with a range of 32% – 57%, suggesting that 45 – 55% adult female harvest provides a stable proportion of adult females (Wyoming Game and Fish Dept. 2007). In B-13, adult females comprised 33% of the female harvest from 2008-2010, indicative of a growing population under this criteria (Figure 16).
Figure 16. Composition of female harvest in B-13 by age class from 2008-2010.
Analyzing criterion independently rather than collectively could mislead conclusions. For instance, considering only a reduced percentage of adult males in the harvest may indicate a population shift from light to moderate harvest. However, other criteria may show an increased proportion of females and higher proportion of adult females in the harvest, indicating a much higher level of harvest than assessing only male harvest. A high percentage of adults in the female harvest, studied independently, would indicate

30
population reduction. However, when the percent adult males and percent females in the harvest are both in the population increase or stable range, the population may actually be growing. This situation may occur when black bears immigrate into the DAU from neighboring source population(s). Source areas can be defined as areas of suitable habitat with little to no human-caused mortality that may provide dispersing bears to surrounding areas (Beecham and Rohlman 1994, Powell et al. 1996). Areas adjacent to sources may have a lower proportion of adults in the harvest due to sub-adults dispersing to occupy vacant home ranges of harvested bears. These areas may also be able to rebound more quickly from overharvest (Beecham and Rohlman 1994). Dispersing sub-adult males also may supplement surrounding populations and absorb much of the harvest to the point where female harvest remains low and adult females comprise a higher proportion of the population.
To better evaluate harvest data, black bear seasons were set for a 5-year period as with most other big game species in Colorado. We recommend that harvest objectives and attendant license allocations be set for 3-year periods. This would allow for a more complete analysis of the effects of harvest by holding dates and quotas constant for each 3-year season cycle. In order to increase the sample size of the harvest data and to reduce the influence of high or low annual harvest rates due to environmental or other factors, 3-year running averages will be used in harvest data analyses rather than analyzing annual data independently. While the evaluation of harvest criteria will be analyzed using a 3-year average, data from the previous 10 years (2 black bear generations) or longer should be analyzed to illustrate longer-term trends in harvest and related population trends.
Social Factors The social factors that influence management scenarios in B-13 include game damage and human conflicts. As stated in the game damage section, the 10-year annual average number of game damage claims in the DAU was 5, majority of which were for apiary damage. Most of these beekeepers are small, non-commercial operations with a relatively few hives. A single bear in one night can, however, significantly impact a landowner/beekeeper with few hives. The majority of claims in B-13 have been in Conejos county; this may be a reflection of the habitat. A significant number of rural, low-acreage landowners keep bees or hobby livestock. Direct, significant human conflicts with black bears in B-13 typically involve a bear entering or attempting to enter a home, cabin, trailer or car. These conflicts are dealt with by CPW field staff differently depending on severity of the incident, other site-specific qualities and whether the bear in question had been previously handled by the CPW. There is a CPW policy on handling bears that have already received a first “strike”, as well as procedures to follow if a bear makes physical contact with a person.
STRATEGIC GOALS AND MANAGEMENT OBJECTIVES
Process for Developing Strategic Goals and Management Objectives
Public Input Process The draft DAU plan was posted on the CPW website for 30 days. During this time, an online survey and public meeting with printed survey forms provided opportunity for public stakeholders to comment on future management scenarios in B-13 (Lischka 2012, unpublished). Impacted federal, county and local municipality land management and natural resource agencies were contacted directly for comment. The public meeting was advertised in the local media, on the CPW website and through a press release. Meeting attendance was noted along with perspectives on bear population goals and other comments directly related to management.

31
Majority of the online survey respondents (n=125) were Colorado residents (84.7%) living in B-13 (68%, Lischka 2012, unpublished). Just under half the respondents were bear hunters or applicants (45.1%). Others were interested constituents (35.2%). Most people were involved in some type of outdoor activity in past 3 years and did not have negative human – bear interaction in the Western San Luis Valley during this timeframe. More hunters (61.9%) were somewhat satisfied to very satisfied with their experiences than not. There was no strong majority opinion concerning the management alternatives for B-13; 36.6% supported maintaining the population, 30.4% supported increasing the population, and 17.0% supported decreasing the population.
Mortality and harvest objective development Subsequent total mortality and harvest objectives are presented as a range of probable amounts necessary to achieve the strategic goal of the DAU. Annual monitoring of mortality amounts, gender and age structure, Colorado black bear density study, and annual forage condition survey results are all incorporated into determining annual mortality objectives. However, the models and their results have not been validated with demographic data from Colorado bear populations. Moreover, the data that has been collected and used for model inputs result from relatively new efforts. We anticipate that the models will change and be improved over time and thus should be viewed as presumptive estimates. Therefore, although the plan identifies mortality and age and gender objectives, these are initial values. Modeling will be conducted every other to every third year, while other mortality data and demographics are collected and analyzed annually. Population extrapolations based on predicted densities, range-wide or within vegetation associations, will be re-evaluated as new data is gathered via research and mark-recapture surveys. While unlikely, objectives may be periodically adjusted in order to achieve the DAU strategic goals based on changes in the information sources above. Specific objectives will be documented in annual objective sheets approved by Colorado Parks and Wildlife Commission. These objective sheets will also govern annual license levels to achieve the DAU strategic goals. Three Alternative Strategic Goals in B-13 were considered: • Increasing the bear population in B-13 for 3 years, then stabilizing To achieve a strategic goal of increasing to stable bear population in B-13 management, criteria applied to determining harvest and total mortality rates would be in the conservative range. Total mortality, or off-take, as a proportion of the population should be less than 7% range (< 44 bears). Proportion of adult males in the harvest should be greater than 35%, with all females making up less than 30% of harvest. Additionally, adult females should comprise less than 45% of the female harvest. After 3 years, management would change to support a stable bear population and maintain the higher number of black bears in B-13. • Stable bear population in B-13 To achieve a strategic goal of maintaining a stable bear population in B-13 management, criteria applied to determining harvest and total mortality rates should fall in an intermediate range. Total mortality, or off-take, as a proportion of the population should fall in the 7-13% range (44 – 82 bears). Proportion of adult males in the harvest should be within 25-35%, with all females making up 30-40% of harvest. Additionally, adult females should comprise approximately 45-55% of the female harvest. • Decreasing the bear population in B-13 for 3 years, then stabilizing To achieve a strategic goal of decreasing the bear population in B-13 management, criteria applied to determining harvest and total mortality rates would be in the liberal range. Total mortality, or off-take, as a proportion of the population could increase into the greater than 13% (> 82 bears). Proportion of adult males in the harvest can be low, even below 25%, with total female harvest rates going over 40%. Additionally, adult females proportions in the female harvest can comprise account for rates over 55%. After 3 years, management would change to support a stable bear population and maintain the lower number of black bears in B-13.

32
Monitored Data to Inform Management All known dead black bear, from both harvest and non-harvest sources, are checked by CPW staff to obtain biological information. The proportion in total mortality of each gender will continue to be closely monitored on an annual basis to assure that female mortality rates are not contrary to the DAU strategic goals. Age structure in total mortality and reproductive history are derived from extraction of a premolar tooth from bears when bear harvest and non-hunt mortality is reported through the mandatory check. In upcoming years, additional tooth samples yielding age structure data should allow for better evaluation of population dynamics, including primapatry and litter intervals from female bears.
In 2009-2011, hair snag surveys were conducted in select locations in Colorado. Additional hair snag survey areas may be established in the future during the term of this DAU plan. Results about bear density, gender, and possibly age structure from these surveys may be incorporated into the habitat model/density extrapolations. Because of low reproductive rates, black bear populations cannot sustain high harvest levels over prolonged periods. Research has shown that high harvest levels can quickly reduce black bear populations to levels where severe reductions in harvest quotas and season lengths may be necessary for greater than 10 years for full recovery of a population (Miller 1990, Beecham and Rohlman 1994). Therefore, the following harvest criteria will be assessed at the DAU level, with each DAU strategic goal set to achieve the criteria for reduced, stable, or increasing black bear numbers. Total mortality Monitoring harvest and overall mortality totals in relation to projected population size will be important in interpreting mean age and relative proportions of age/gender classes as indices. Using the 3-year running average standardizes annual variation. The total mortality objective uses percent of estimated population as a guide (Decreasing >13%, Maintaining 7-13%, Increasing <7%). Maintaining the population can be simplified to the median (10%) to provide a mid-point of the range as the goal.
Hunter harvest The strategic population goal (decreasing, maintaining, or increasing) dictates the totally mortality objective and therefore the hunter harvest objective according to the percent off-take from the population based on established bear research. Hunter harvest rates will be estimated by deducting the 3-year running average amount of non-hunter mortality (n=1) from the total mortality objective (n=19). For 2009-2010, the percentages of hunter harvest compared to non-hunter mortality were fairly proportional (10% non-hunter mortality and 90% hunter harvest).
Proportion of mortality by age and gender The following 3 harvest criteria will be monitored annually, using a 3-year average in B-13.
Age and Gender Structure
in Total Harvest Population Trend
Decreasing Stable Increasing % of Adult Males in Total Harvest < 25% 25 - 35% > 35% % of All Females in Total Harvest > 40% 30 - 40% < 30% % of Adult Females in Total Female Harvest > 55% 45 - 55% < 45%

33
Forage condition monitoring
Collected annually this data can be used when projecting reproductive rates, cub survival, vulnerability to harvest and other factors related to modeling and predicting population trends for the upcoming year. Forage condition and mast production surveys were conducted in DAU B-13. Results of these surveys were incorporated into population modeling efforts. However, since B-13 is not a mast-driven system, these surveys have marginal impact on population estimates compared to mortality, age and gender structure data. Future survey efforts will occur as needed.
Game damage and human conflict Levels of submitted game damage claims and documented conflicts between humans and bears will be evaluated on an ongoing basis. In most cases, management efforts will be targeted at individual bears/locations that are involved in these situations. Management actions include a wide array of techniques and strategies that are employed on a case by case basis. Management Objectives The specific total mortality and harvest objectives are based on present information and assumptions about population status and trajectory. These represent starting points in an ongoing process. Annual changes to mortality and harvest objectives are anticipated based on new information and evaluation of monitored data. Annual quantitative objectives will be documented in DAU objective sheets approved by the Parks and Wildlife Commission during annual regulation cycles. Using the 4 different models/techniques to project plausible bear population sizes in B-13 yields the following: Vegetation/ Bear Density extrapolation = 635 independent bears Use/occupancy density model population extrapolation = 166 – 527 independent bears Liberal Population Model for 2011 = 846 bears (715 independent) Conservative Population Model for 2011 = 747 bears (630 independent)
For purposes of calculating mortality objectives to correspond with the strategic goal in the DAU a 2011 estimated post-hunt population of 630 independent bears will be used. This is based on the suite of models and extrapolations above and is supported by the ranges provided by those estimates. Overall mortality and hunter harvest objectives will be calculated based on this population projection and application of the 3-year average harvest criteria that are appropriate for the selected strategic goal.
Total Mortality Objective Assuming a bear population estimate of 630 in B-13, the 3 mortality objectives considered were: Decrease the population (>13%) - 82 bears Maintain the population (10%) - 63 bears Increase the population (<7%) - 44 bears In order to achieve a DAU strategic goal of 10% total mortality in B-13, it is estimated that the average total mortality objective based on the 3-year running average should be 63 bears. Hunter Harvest Objective Annual hunter harvest objectives are determined by deducting the 3-year running average amount of non-hunter mortality (10%) from the total mortality objective:

34
Decrease the population (90% of 82 bears) - 74 bears Maintain the population (90% of 63 bears) - 57 bears Increase the population (90% of 44 bears) - 40 bears If the strategic goal is to maintain the population, then hunter harvest objectives could be adjusted up or down to (presumably) increase or decrease the rate population growth or decline. Based on a total mortality objective of 63 bears, the hunter harvest objective will be 57 bears.
Age & Gender Structure Objectives It is estimated that the 3-year running average proportion of age and gender structure in total mortality should meet the following criteria:
Age and Gender Structure in Total Mortality
Population Trend Decreasing Stable Increasing
Adult Males in Total Mortality < 16 16 – 22 > 22 All Females in Total Mortality > 25 19 – 25 < 19 Adult Females in Total Female Mortality > 35 28 – 35 < 28
In hunter harvest, the 3-year running average proportion of age and gender structure should meet the following criteria:
Age and Gender Structure in Total Harvest
Population Trend Decreasing Stable Increasing
Adult Males in Total Harvest < 14 14 – 20 > 20 All Females in Total Harvest > 23 17 – 23 < 17 Adult Females in Total Female Harvest > 31 25 – 31 < 25
Game Damage and Human Conflict Objectives Standard CPW management techniques will be employed in B-13 to reduce game damage and human conflicts with bears. While management techniques used may be similar in both management zones, the application of lethal control to remove conflict individuals in bear management zones may be used more consistently. Other methods of non-lethal intervention will be used when the conditions and individual situation warrant it.
CONCLUSION AND PREFERRED DAU STRATEGIC GOAL Preferred DAU Strategic Goal: maintain a stable bear population in DAU B-13 based on habitat availability, human and agricultural conflict potential, and public input during the public meeting and a 30-day comment period. Mortality objectives should be in the intermediate range to support this goal. The total mortality objective for the stable management goal is 63 bears per year, with a hunter harvest objective of 57 per year. Total mortality, or off-take, as a proportion of the population should fall in the 7-13% range. Proportion of adult males in the annual harvest should be within 25-35%, with all females making up 30-40% of harvest. Additionally, adult females should comprise approximately 45-55% of the annual female harvest. Not every management index must be in complete agreement, but most should point toward a stable trend.

35
The specific total mortality and harvest objectives are based on present information and assumptions about population status and trajectory. These represent starting points in an ongoing process. Changes to mortality and harvest objectives may occur based on new information and evaluation of monitored data. Any changes will be documented in DAU objective sheets approved by the Wildlife Commission during annual regulation cycles. Harvest criteria will continue to be monitored on a 3-yr running average. Age structure of bear mortality, the composition of gender in harvest, conflict/damage levels and applicable bear density estimates will be reviewed annually. Hunting licenses will be adjusted accordingly to meet objectives. Human/bear conflicts and game damage from bears will be minimized to the extent possible. When necessary, bear mortality thresholds may be temporarily exceeded in highly localized areas to address conflict and/or damage issues. The overall stable goal still will be upheld at the DAU level in the long term.
36
REFERENCES Apker, J.A. 2003. Colorado status report – black bear. Monte Vista, CO. Colorado Division of Wildlife. Apker, J. A., P. Lukacs, J. Broderick, B. Dreher, J. Mao, A. Vitt. 2010. Non-Invasive DNA-Based Black Bear Density Estimates in Colorado – 2009. Internal Colorado Division of Wildlife Memo. Baldwin, R. A. and L. C. Bender. 2007. Population demographics, habitat utilization, critical habitats, and condition of black bears in Rocky Mountain National Park. Rocky Mountain National Park, Estes Park, Colorado. 244pp.
Beck, T.D. 1991. Black bears of west-central Colorado. Colorado Division of Wildlife Report Number 39. 86pp. Beck, T. D. 1997. Development of black bear inventory techniques. Colorado Division of Wildlife. Wildlife Research Report. Federal Aid Project W-153-R-10, Final Report. 11pp. Beecham, J.J. and J. Rohlman. 1994. A shadow in the forest: Idaho’s black bear. The University of Idaho Press, Idaho, 245pp. Costello, C.M., D.E. Jones, K.A. Green Hammond, R.M. Inman, K.H. Inman, B.C. Thompson, R.A. Deitner, H.B. Quigley. 2001. A study of black bear ecology in New Mexico with models for population dynamics and habitat suitability. Final Report Federal Aid in Wildlife Restoration Project W-131-R. 197 pp. Costello, C.M., K.H. Inman, D.E. Jones, R.M. Inman, B.C. Thompson, H.B. Quigley. 2004. Reliability of the cementum annuli technique for estimating age of black bears in New Mexico. Wildlife Society Bulletin 32:169 – 176. Fraser, D.G., J.F. Gardner, G.B. Kolenosky, and S. Strathearn. 1982. Estimation of harvest rate of black bears from age and sex data. Wildlife Society Bulletin 10:53 – 57. Harris, R.B. 1984. Harvest age structure as an indicator of grizzly bear population status. M.S. thesis, University of Montana, Missoula. 204pp. Harshyne, W.A., D.R. Diefenbach, G.L. Alt, G.M. Matson. 1998. Analysis of error from cementum-annuli age estimates of known-age Pennsylvania black bears. Journal of Wildlife Management 62:1281 – 1291. Idaho Dept. of Fish and Game. 1998. Idaho black bear management plan, 1999 – 2010: Status and objectives of Idaho’s black bear resource. 77pp. Kolenosky, G.B. 1986. The effects of hunting on an Ontario black bear population. International Conference on Bear Research and Management 6:45 – 55. Lischka, S. (2012, unpublished). Western San Luis Valley Bear Management Study. Online Public Survey. Colorado Parks and Wildlife. McLaughlin, C.R., G.J. Matula, Jr., R.A. Cross, W.H. Halteman, M.A. Caron, AND K.I. Morris. 1990. Precision and accuracy of estimating age of Maine black bears by cementum annuli. International Conference on Bear Research and Management 8:415–419.

37
Miller, S.D. 1990. Population management of bears in North America. International Conference on Bear Research and Management 8:357 – 373. Powell, R.A., J.W. Zimmerman, and D.E. Seaman. 1996. Demographic analyses of a hunted black bear population with access to a refuge. Conservation Biology 10:224 – 234.
Wyoming Game and Fish Department. 2007. Wyoming black bear management plan. 59pp.
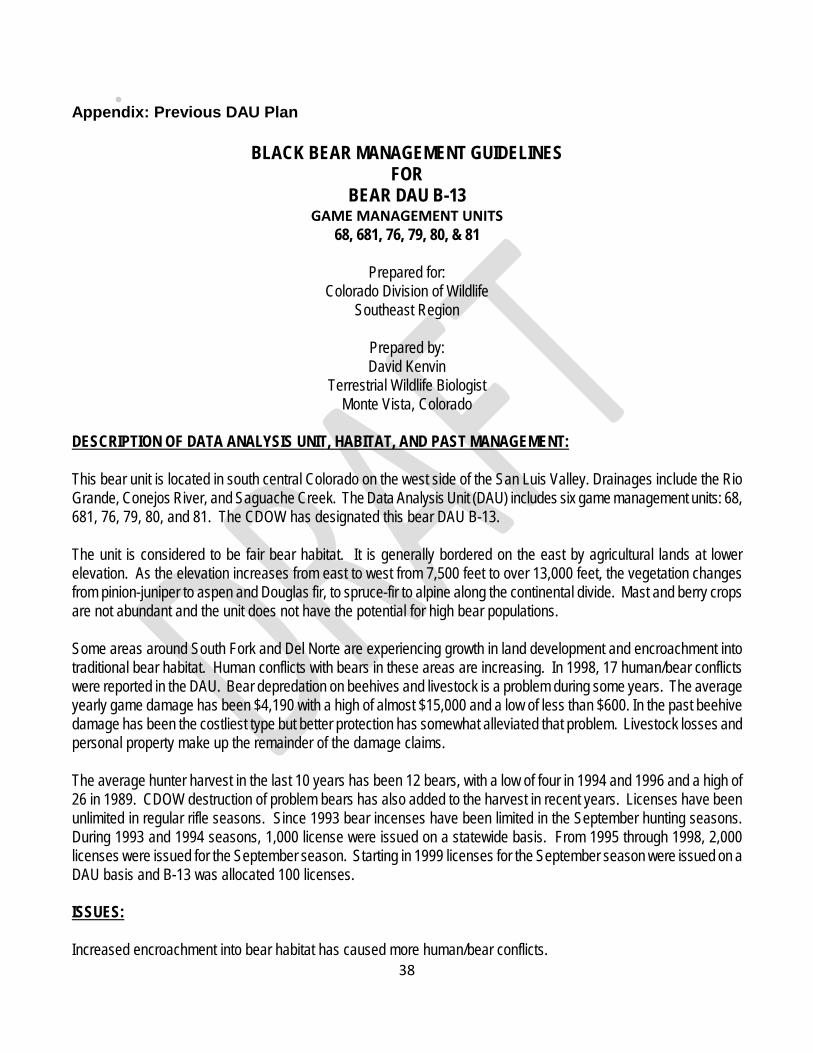
38
• Appendix: Previous DAU Plan
BLACK BEAR MANAGEMENT GUIDELINES FOR
BEAR DAU B-13 GAME MANAGEMENT UNITS
68, 681, 76, 79, 80, & 81
Prepared for: Colorado Division of Wildlife
Southeast Region
Prepared by: David Kenvin
Terrestrial Wildlife Biologist Monte Vista, Colorado
DESCRIPTION OF DATA ANALYSIS UNIT, HABITAT, AND PAST MANAGEMENT: This bear unit is located in south central Colorado on the west side of the San Luis Valley. Drainages include the Rio Grande, Conejos River, and Saguache Creek. The Data Analysis Unit (DAU) includes six game management units: 68, 681, 76, 79, 80, and 81. The CDOW has designated this bear DAU B-13. The unit is considered to be fair bear habitat. It is generally bordered on the east by agricultural lands at lower elevation. As the elevation increases from east to west from 7,500 feet to over 13,000 feet, the vegetation changes from pinion-juniper to aspen and Douglas fir, to spruce-fir to alpine along the continental divide. Mast and berry crops are not abundant and the unit does not have the potential for high bear populations. Some areas around South Fork and Del Norte are experiencing growth in land development and encroachment into traditional bear habitat. Human conflicts with bears in these areas are increasing. In 1998, 17 human/bear conflicts were reported in the DAU. Bear depredation on beehives and livestock is a problem during some years. The average yearly game damage has been $4,190 with a high of almost $15,000 and a low of less than $600. In the past beehive damage has been the costliest type but better protection has somewhat alleviated that problem. Livestock losses and personal property make up the remainder of the damage claims. The average hunter harvest in the last 10 years has been 12 bears, with a low of four in 1994 and 1996 and a high of 26 in 1989. CDOW destruction of problem bears has also added to the harvest in recent years. Licenses have been unlimited in regular rifle seasons. Since 1993 bear incenses have been limited in the September hunting seasons. During 1993 and 1994 seasons, 1,000 license were issued on a statewide basis. From 1995 through 1998, 2,000 licenses were issued for the September season. Starting in 1999 licenses for the September season were issued on a DAU basis and B-13 was allocated 100 licenses. ISSUES: Increased encroachment into bear habitat has caused more human/bear conflicts.

39
Depredation by bears on beehives, livestock, and personal property. Maintain a healthy bear population. Perceptions of bear depredation on deer and elk. MANAGEMENT RECOMMENDATIONS: Management of bears is difficult because of the cost of obtaining population information. Sound inventory techniques such as mark and recapture are cost prohibited on a statewide basis. Recent studies have indicated that bear depredation on deer and elk is not an important mortality factor to these populations. Management of bears will be based on three objectives; 1) a sport hunting objective 2) a game damage objective and 3) a nuisance objective. SPORT HUNTING HARVEST OBJECTIVE: Sport hunting will continue to be the primary tool to maintain a healthy and viable bear population. The preferred management objective is to keep the sport harvest at the ten-year average of 12 bears per year for all seasons. The limited bear licenses for the September season will be set along with the estimated regular rifle season harvest to meet the objective. The CDOW will manage the DAU for stable sport hunting activity. GAME DAMAGE OBJECTIVE: The management objective is to keep the game damage below the current 9-year average of $4,200. To meet this objective the CDOW will need to continue with preventative measures on beehives, educate the public on protecting personal property, continue the two strike policy on nuisance bear and adjust the hunting quota on bears. NUISANCE OBJECTIVE: The goal is to decrease the nuisance complains from current levels. This will do by the continuing education program for the general public.