draft final report 12-2-09 - washingtonleg.wa.gov/.../crg_draftfinalreport_120209.pdf · adopted a...
TRANSCRIPT


Dec. 2, 2009 2
Cedar River Group
Kathy Scanlan
93 Pike Street, Suite 315
Seattle, WA 98101
(206) 223-7660 x105
Joint Transportation Committee
Staff Contact: Gene Baxstrom
P.O. Box 40937
Olympia, WA 98504-0937
(360) 786-7327
DRAFT 3
TABLE OF CONTENTS EXECUTIVE SUMMARY ..................................................................................................................... 6
I. PURPOSE ...................................................................................................................................... 16
2007 Long-Term Transportation Financing Study ......................................................................... 16
II. TRENDS AFFECTING TRANSPORTATION FUNDING METHODS ............................................ 18
A. Energy ....................................................................................................................................... 18
B. Climate Change ........................................................................................................................ 21
C. Mobility ...................................................................................................................................... 22
D. Federal Policies and Funding .................................................................................................... 23
III. WASHINGTON STATE FUNDING METHODS ............................................................................ 26
A. Nickel and TPA ......................................................................................................................... 27
B. Funding Sources and Direct Revenues 2009-2025 16-Year Financial Plan .............................. 27
C. Characteristics of State Revenue Sources ................................................................................ 28
D. State Funds/Accounts ............................................................................................................... 29
E. Risk Assessment ....................................................................................................................... 30
F. Vehicle Owner Costs ................................................................................................................. 31
IV. EVALUATION FRAMEWORK ..................................................................................................... 34
V. ALTERNATIVES AND IMPLEMENTATION OVERVIEW ............................................................. 36
A. Implementation .......................................................................................................................... 37
VI. STATE FUNDING METHOD ANALYSIS ..................................................................................... 40
A. Fuel ........................................................................................................................................... 40
B. Vehicles ..................................................................................................................................... 50
C. Drivers ....................................................................................................................................... 63
D. Transportation Related Businesses .......................................................................................... 67
E. Use ............................................................................................................................................ 69
F. Transportation System: State Access Permits .......................................................................... 80
VII. STATE FUNDING METHOD RECOMMENDATIONS ................................................................ 83
A. Recommended Funding Tools .................................................................................................. 83
B. Medium Term (5 Year) Recommendations ............................................................................... 84
C. Longer-Term Recommendations: Shift from Motor Vehicle Fuel Taxes .................................... 87
D. Longer Term Recommendations: Mobility ................................................................................. 88
E. Other Funding Methods Recommended in the 2007 Study ....................................................... 88
Dec. 2, 2009 4
VIII. LOCAL JURISDICTION TRANSPORTATION FUNDING .......................................................... 90
A. Local Responsibilities in Transportation .................................................................................... 90
B. Current Local Jurisdiction State and Local Funding Sources .................................................... 91
C. Assessment of the Local Funding Transportation System ........................................................ 99
D. Why Local Funding Options Are Not Being Fully Used ........................................................... 102
E. Local Funding Alternatives ...................................................................................................... 104
F. Local Funding Recommendations ........................................................................................... 107
List of Exhibits
EXHIBIT 1. WASHINGTON STATE FUEL CONSUMPTION FY 90 TO FY 08 ................................. 20
EXHIBIT 2. PROJECTED GROSS MOTOR FUEL TAX REVENUES – YEAR OF EXPENDITURE DOLLARS ......................................................................................................................................... 21
EXHIBIT 3. STATE VMT AND DAILY VMT PER CAPITA 1990-2008 .............................................. 22
EXHIBIT 4. SOURCES OF HIGHWAY TRUST FUND REVENUES FFY 2005-2008 ....................... 24
EXHIBIT 5. TAXES AND FEES FOR THE 2003 NICKEL AND 2005 TPA PACKAGES ................... 27
EXHIBIT 6. STATE TRANSPORTATION 16-YEAR FUNDING AND DIRECT REVENUE ............... 28
EXHIBIT 7. RISK SCENARIO ........................................................................................................... 31
EXHIBIT 8. VEHICLE SCENARIO ASSUMPTIONS ......................................................................... 31
EXHIBIT 9. SUMMARY OF ANNUAL TRANSPORTATION TAXES/FEES FOR ALL VEHICLE TYPES (MID-LEVEL USAGE) .......................................................................................................... 32
EXHIBIT 10. PASSENGER VEHICLE STATE TRANSPORTATION TAXES & FEES ...................... 33
EXHIBIT 11. STATE TRANSPORTATION TAXES & FEES AS PERCENT OF HOUSEHOLD BUDGET (SEATTLE SMSA 2004-5) ................................................................................................. 33
EXHIBIT 12. EVALUATION FRAMEWORK ...................................................................................... 35
EXHIBIT 13. FUNDING METHODS REVIEWED .............................................................................. 36
EXHIBIT 14. REVENUE YIELD, DISTRIBUTION, AND DRIVER IMPACTS, INDEX FUEL TAX (CPI) .......................................................................................................................................................... 43
EXHIBIT 15. REVENUE YIELD, DISTRIBUTION, AND DRIVER IMPACTS, $0.01 ANNUAL INCREASE IN MOTOR FUEL TAX ................................................................................................... 45
EXHIBIT 16. REVENUE YIELD, DISTRIBUTION AND DRIVER IMPACTS SPECIAL ASSESSMENT FEE ................................................................................................................................................... 47
EXHIBIT 17. REVENUE YIELD, DISTRIBUTION AND DRIVER IMPACTS RAISE STATE SPECIAL SALES TAX FROM 0.3% TO 0.5% ................................................................................................... 52
EXHIBIT 18. SUMMARY OF PASSENGER VEHICLE FEES ........................................................... 54
EXHIBIT 19. SUMMARY OF TRUCK FEES ..................................................................................... 57

Dec. 2, 2009 5
EXHIBIT 20. SUMMARY OF RECREATION VEHICLE FEES .......................................................... 59
EXHIBIT 21. SUMMARY OF DRIVER FEES .................................................................................... 64
EXHIBIT 22. REVENUE YIELD, DISTRIBUTION AND DRIVER IMPACTS, BRING ALL FEES UP-TO-DATE AND INDEX TO CPI ......................................................................................................... 66
EXHIBIT 23. SUMMARY OF BUSINESS FEES ................................................................................ 68
EXHIBIT 24. GOLDEN GATE BRIDGE, HIGHWAY & TRANSPORTATION DISTRICT TOLL REVENUES TO TRANSIT & FERRIES ............................................................................................ 71
EXHIBIT 25. ACCESS MANAGEMENT PERMIT FEES .................................................................. 81
EXHIBIT 26. RECOMMENDED FUNDING METHODS - 2009-27 FINANCIAL PLANS .................... 83
EXHIBIT 27. ADDITIONAL STATE TRANSPORTATION FUNDING SOURCES AVAILABLE TO COUNTIES AND CITIES ................................................................................................................... 92
EXHIBIT 28. 2007 COUNTY ROAD REVENUES, PERCENTAGE BY SOURCE ............................. 93
EXHIBIT 29. TRANSPORTATION TAX OPTIONS AND FEES AVAILABLE FOR COUNTIES ........ 93
EXHIBIT 30. 2007 CITY TRANSPORTATION REVENUES, PERCENTAGE BY SOURCE ............. 95
EXHIBIT 31. CITY TRANSPORTATION TAXES .............................................................................. 95
EXHIBIT 32. TRANSIT SYSTEMS EXCLUDING SOUND TRANSIT 2007 REVENUE SOURCES .. 97
EXHIBIT 33. AVAILABLE FUNDING SOURCES FOR TRANSPORTATION SPECIAL PURPOSE DISTRICTS ....................................................................................................................................... 98
EXHIBIT 34. COUNTY ROAD LEVY ASSESSMENT (TAX YEAR 2009) ....................................... 100
EXHIBIT 35. LOCAL JURISDICTIONS ADDITIONAL MOTOR VEHICLE RENTAL SALES TAX AUTHORIZATIONS ........................................................................................................................ 106
Dec. 2, 2009 DRAFT 6
EXECUTIVE SUMMARY The 2009 legislature directed the Joint Transportation Committee (JTC) to conduct a comprehensive analysis of mid-term and long-term transportation funding mechanisms and methods. The study analyzes the feasibility and practicality of implementing funding methodologies identified in the JTC’s 2007 Long-Term Transportation Financing Study, as well as other methods identified by the committee, staff, and consultants. The principle objective is to identify specific steps for the legislature and agencies to begin implementing viable mid-term and long-term transportation funding approaches. The primary focus is on state imposed and collected transportation taxes and fees, but the report also includes a discussion of local funding options.
2007 Long-Term Transportation Financing Study
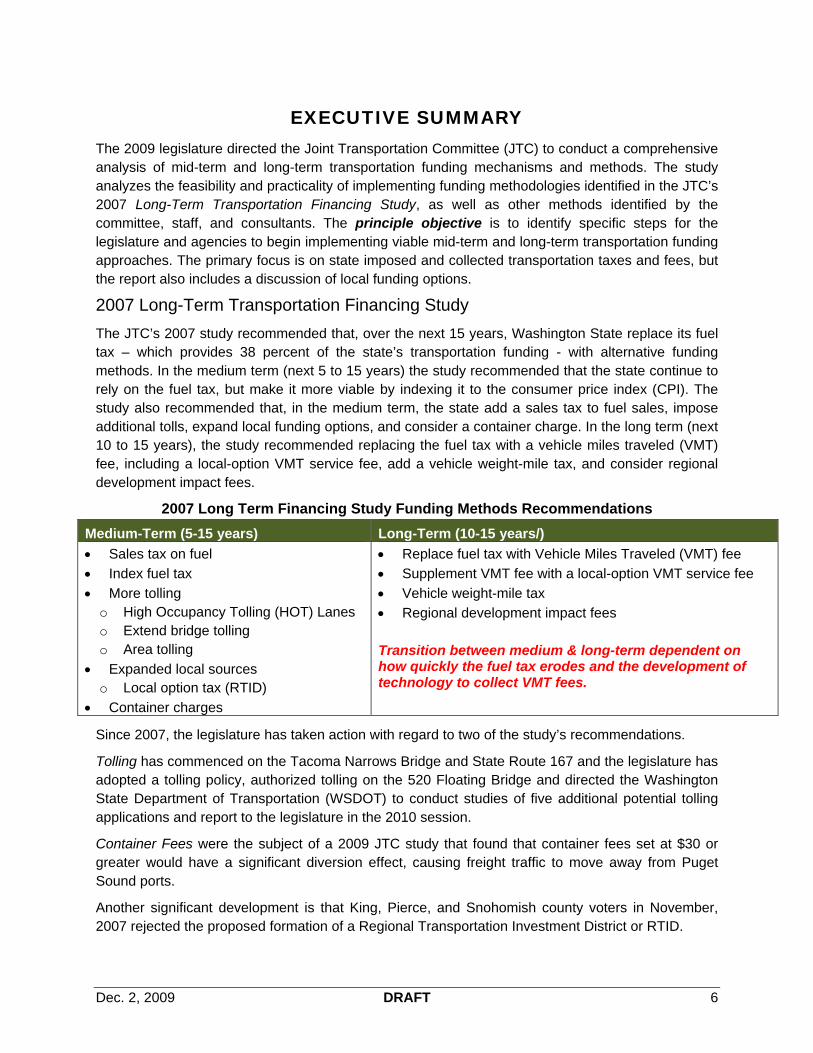
The JTC’s 2007 study recommended that, over the next 15 years, Washington State replace its fuel tax – which provides 38 percent of the state’s transportation funding - with alternative funding methods. In the medium term (next 5 to 15 years) the study recommended that the state continue to rely on the fuel tax, but make it more viable by indexing it to the consumer price index (CPI). The study also recommended that, in the medium term, the state add a sales tax to fuel sales, impose additional tolls, expand local funding options, and consider a container charge. In the long term (next 10 to 15 years), the study recommended replacing the fuel tax with a vehicle miles traveled (VMT) fee, including a local-option VMT service fee, add a vehicle weight-mile tax, and consider regional development impact fees.
2007 Long Term Financing Study Funding Methods Recommendations
Medium-Term (5-15 years) Long-Term (10-15 years/)
Sales tax on fuel
Index fuel tax
More tolling o High Occupancy Tolling (HOT) Lanes o Extend bridge tolling o Area tolling
Expanded local sources o Local option tax (RTID)
Container charges
Replace fuel tax with Vehicle Miles Traveled (VMT) fee
Supplement VMT fee with a local-option VMT service fee
Vehicle weight-mile tax
Regional development impact fees Transition between medium & long-term dependent on how quickly the fuel tax erodes and the development of technology to collect VMT fees.
Since 2007, the legislature has taken action with regard to two of the study’s recommendations.
Tolling has commenced on the Tacoma Narrows Bridge and State Route 167 and the legislature has adopted a tolling policy, authorized tolling on the 520 Floating Bridge and directed the Washington State Department of Transportation (WSDOT) to conduct studies of five additional potential tolling applications and report to the legislature in the 2010 session.
Container Fees were the subject of a 2009 JTC study that found that container fees set at $30 or greater would have a significant diversion effect, causing freight traffic to move away from Puget Sound ports.
Another significant development is that King, Pierce, and Snohomish county voters in November, 2007 rejected the proposed formation of a Regional Transportation Investment District or RTID.

Implementing Alternative Transportation Funding Methods Draft Final Report
Dec. 2, 2009 7
Trends Affecting State Transportation Funding Methods
Developments since 2007 in energy, climate change, congestion and federal policy were reviewed to inform this funding method review. The consultants found:
Energy. Since 2007 motor vehicle fuel consumption per capita has continued the decline that started in FY 1999, with for the first time in FY 2008 total motor vehicle fuel consumption declining. Even before the adoption in May 2009, of new Corporate Average Fuel Standards (CAFÉ) that mandate higher levels of new vehicle fuel economy, the forecast of motor vehicle fuel revenues was $1.7 billion lower over the 2010-30 period than was forecast in 2007. The adoption of the new CAFÉ standards may further accelerate the erosion of revenues from the motor vehicle fuel tax.
Climate change. Current state climate change laws establish benchmarks for reductions in daily vehicle miles traveled (VMT) per capita. The benchmarks are being reviewed to determine whether, with the advent of electric cars and other low emission vehicles, VMT is a reasonable proxy for the transportation system’s contribution to greenhouse gas emissions (GHG). Until the review is completed and WSDOT refines its projection of total annual VMT in June 2010 an accurate projection of total VMT is not possible. The consultants have not, nor do the Transportation Revenue Forecast Council’s (TRTC) revenue forecasts, assume attainment of the existing VMT reduction goals.
Congestion. Congestion is a significant issue for the state’s urban areas and the state has begun to use pricing strategies to reduce congestion. The state’s medium and long-term funding methods should include methods that can be selectively applied in urban areas to address congestion.
Federal. At the federal level, the current administration is not expected to propose a long term transportation funding method for 18 months. Although three federal commissions have endorsed use based fees, in particular a vehicle miles traveled fee, to replace the federal fuel tax, the administration has indicated that it will not consider such a fee. This leaves the state with little option but to assume a continuation of existing federal funding methods until long-term federal policy is clarified.
Washington State Funding Methods
State funding is for the 2009-25 16-year financial plan is shown below.
State Transportation 16-Year Funding and Direct Revenue
Source 2009-25 Totals (billions)
% 2009-25 Funding
% 2009-25 Direct Revenue*
Motor Vehicle Fuel Tax – 37.5 cpg** $17.7 38% 52% Licenses, Permits, Fees & Abstracts** $9.7 21% 28% Bond Sales $6.4 14% Federal Funds $5.7 12% Ferry Revenues $3.4 7% 10% Tolling (Tacoma Narrows Bridge/SR 167)
$1.5 3% 4%
Vehicles Sales Taxes $1.2 3% 4% Miscellaneous/Interest ($0.4 billion) $1.1 2% 2% Total Funds/Revenue $46.7 billion $46.7 billion $34.1 billion *Excludes bond sales, federal funds, and interest which are not direct revenues. ** Excludes local distributions

Implementing Alternative Transportation Funding Methods Draft Final Report
Dec. 2, 2009 8
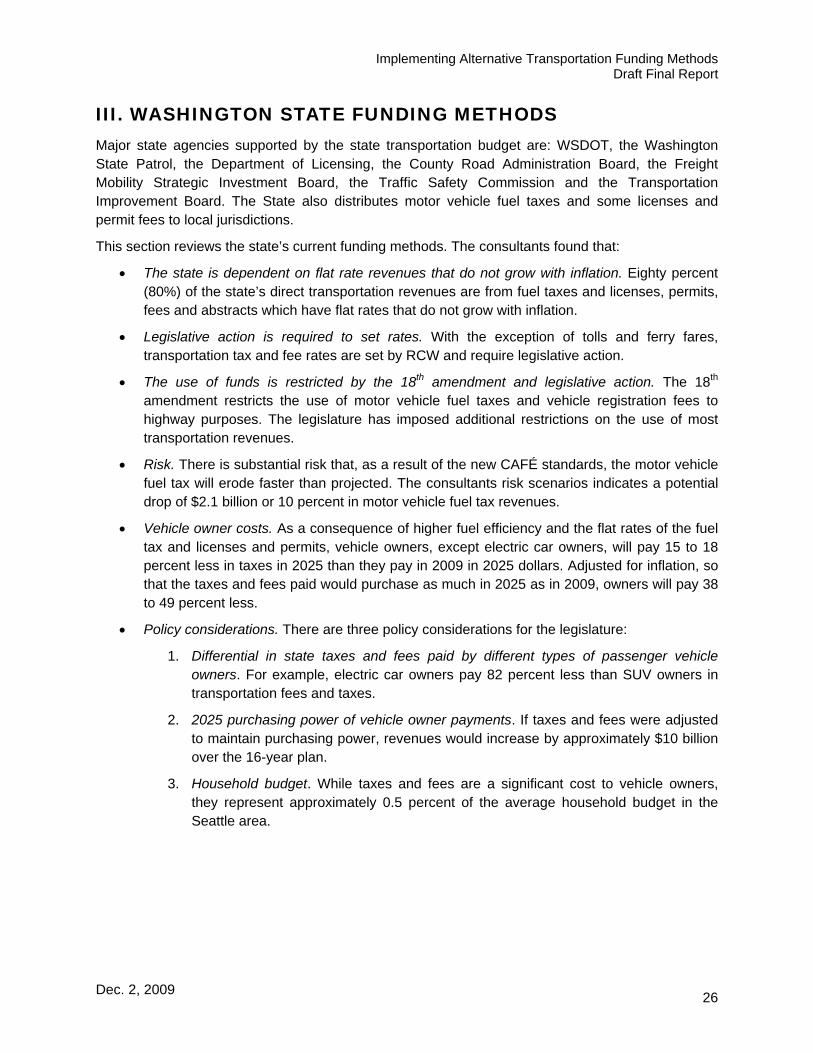
The state is dependent on flat rate revenues that do not grow with inflation. Eighty percent (80%) of the state’s direct transportation revenues are from fuel taxes and licenses, permits, fees and abstracts which have flat rates that do not grow with inflation.
Legislative action is required to set rates. With the exception of tolls and ferry fares, transportation tax and fee rates are set by RCW and require legislative action.
The use of funds is restricted by the 18th amendment and legislative action. The 18th amendment restricts the use of motor vehicle fuel taxes and vehicle registration fees to highway purposes. The legislature has imposed additional restrictions on the use of most transportation revenues, in part because fees must be imposed for specific purposes.
Vehicle Owner Impact
Vehicle owners will pay substantially less in 2025 than they do in 2009. As a consequence of higher fuel efficiency and the flat rates of the fuel tax and licenses and permits, vehicle owners, except electric car owners, will pay 15 to 18 percent less in taxes in 2025 than they pay in 2009 in 2025 dollars. Adjusted for inflation, so that the taxes and fees paid by a vehicle owner would purchase as much in 2025 as in 2009, owners will pay 38 to 49 percent less.
The reduction in vehicle owner payments has a $10 billion affect on transportation revenues. If taxes and fees were adjusted to maintain purchasing power, revenues would increase by approximately $10 billion over the 16-year plan.
The differential in state taxes and fees paid by different types of passenger vehicle owners is substantial. For example, electric car owners pay 82 percent less than SUV owners in transportation fees and taxes.
Risk Scenario
To help frame the analysis, the consultants developed a risk scenario based on implementation of the CAFÉ standards and greater market penetration of electric vehicles. Overall under the consultants’ risk analysis, the total potential drop in fuel taxes is $2.2 billion over the 16-year plan.
Implementing Alternative Transportation Funding Methods Draft Final Report
Dec. 2, 2009 9
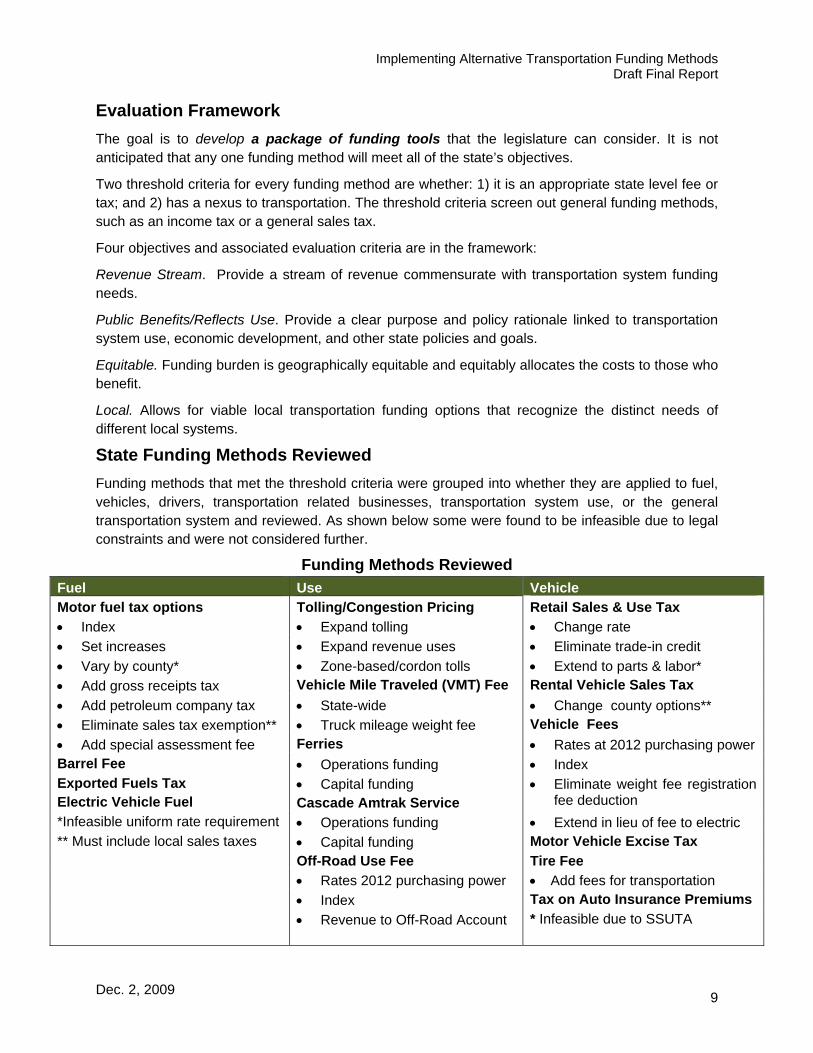
Evaluation Framework
The goal is to develop a package of funding tools that the legislature can consider. It is not anticipated that any one funding method will meet all of the state’s objectives.
Two threshold criteria for every funding method are whether: 1) it is an appropriate state level fee or tax; and 2) has a nexus to transportation. The threshold criteria screen out general funding methods, such as an income tax or a general sales tax.
Four objectives and associated evaluation criteria are in the framework:
Revenue Stream. Provide a stream of revenue commensurate with transportation system funding needs.
Public Benefits/Reflects Use. Provide a clear purpose and policy rationale linked to transportation system use, economic development, and other state policies and goals.
Equitable. Funding burden is geographically equitable and equitably allocates the costs to those who benefit.
Local. Allows for viable local transportation funding options that recognize the distinct needs of different local systems.
State Funding Methods Reviewed
Funding methods that met the threshold criteria were grouped into whether they are applied to fuel, vehicles, drivers, transportation related businesses, transportation system use, or the general transportation system and reviewed. As shown below some were found to be infeasible due to legal constraints and were not considered further.
Funding Methods Reviewed
Fuel Use Vehicle Motor fuel tax options Tolling/Congestion Pricing Retail Sales & Use Tax
Index Expand tolling Change rate
Set increases Expand revenue uses Eliminate trade-in credit
Vary by county* Zone-based/cordon tolls Extend to parts & labor*
Add gross receipts tax Vehicle Mile Traveled (VMT) Fee Rental Vehicle Sales Tax
Add petroleum company tax State-wide Change county options**
Eliminate sales tax exemption** Truck mileage weight fee Vehicle Fees
Add special assessment fee Ferries Rates at 2012 purchasing power Barrel Fee Operations funding Index Exported Fuels Tax Electric Vehicle Fuel
Capital funding Cascade Amtrak Service
Eliminate weight fee registration fee deduction
*Infeasible uniform rate requirement Operations funding Extend in lieu of fee to electric ** Must include local sales taxes Capital funding Motor Vehicle Excise Tax
Off-Road Use Fee Tire Fee Rates 2012 purchasing power Add fees for transportation Index Tax on Auto Insurance Premiums
Revenue to Off-Road Account * Infeasible due to SSUTA
Implementing Alternative Transportation Funding Methods Draft Final Report
Dec. 2, 2009 10
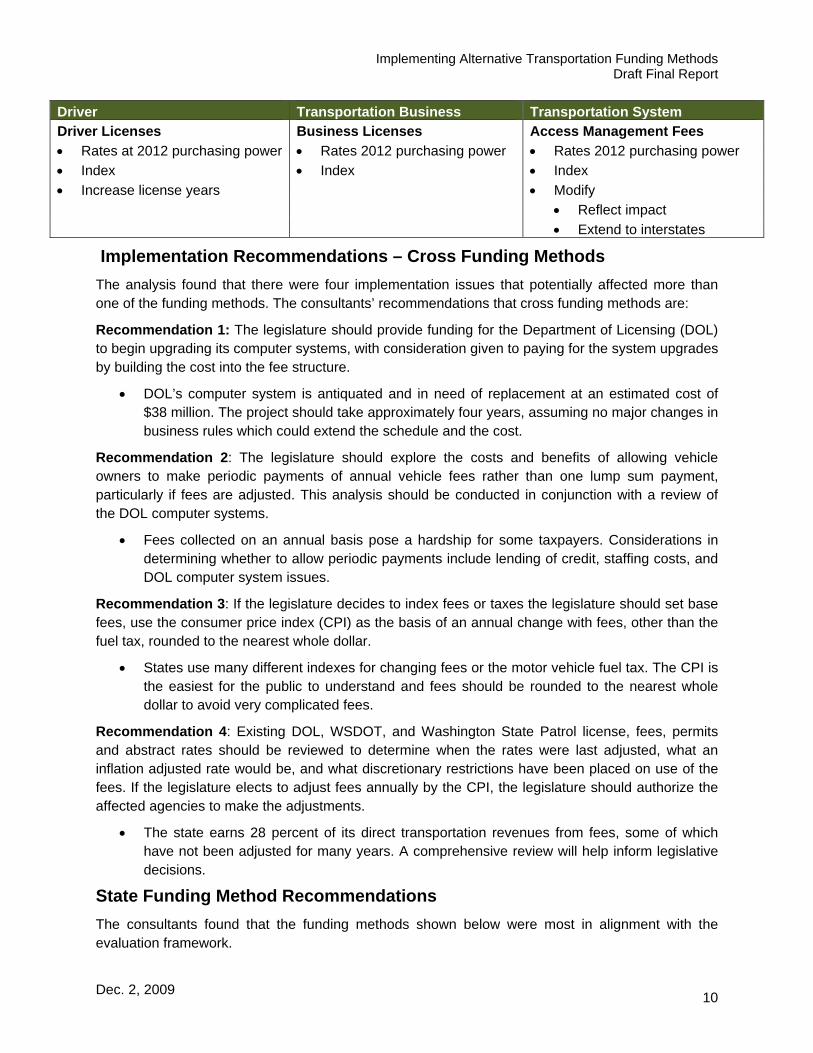
Driver Transportation Business Transportation System Driver Licenses Business Licenses Access Management Fees
Rates at 2012 purchasing power Rates 2012 purchasing power Rates 2012 purchasing power
Index Index Index
Increase license years Modify Reflect impact Extend to interstates
Implementation Recommendations – Cross Funding Methods
The analysis found that there were four implementation issues that potentially affected more than one of the funding methods. The consultants’ recommendations that cross funding methods are:
Recommendation 1: The legislature should provide funding for the Department of Licensing (DOL) to begin upgrading its computer systems, with consideration given to paying for the system upgrades by building the cost into the fee structure.
DOL’s computer system is antiquated and in need of replacement at an estimated cost of $38 million. The project should take approximately four years, assuming no major changes in business rules which could extend the schedule and the cost.
Recommendation 2: The legislature should explore the costs and benefits of allowing vehicle owners to make periodic payments of annual vehicle fees rather than one lump sum payment, particularly if fees are adjusted. This analysis should be conducted in conjunction with a review of the DOL computer systems.
Fees collected on an annual basis pose a hardship for some taxpayers. Considerations in determining whether to allow periodic payments include lending of credit, staffing costs, and DOL computer system issues.
Recommendation 3: If the legislature decides to index fees or taxes the legislature should set base fees, use the consumer price index (CPI) as the basis of an annual change with fees, other than the fuel tax, rounded to the nearest whole dollar.
States use many different indexes for changing fees or the motor vehicle fuel tax. The CPI is the easiest for the public to understand and fees should be rounded to the nearest whole dollar to avoid very complicated fees.
Recommendation 4: Existing DOL, WSDOT, and Washington State Patrol license, fees, permits and abstract rates should be reviewed to determine when the rates were last adjusted, what an inflation adjusted rate would be, and what discretionary restrictions have been placed on use of the fees. If the legislature elects to adjust fees annually by the CPI, the legislature should authorize the affected agencies to make the adjustments.
The state earns 28 percent of its direct transportation revenues from fees, some of which have not been adjusted for many years. A comprehensive review will help inform legislative decisions.
State Funding Method Recommendations
The consultants found that the funding methods shown below were most in alignment with the evaluation framework.

Implementing Alternative Transportation Funding Methods Draft Final Report
Dec. 2, 2009 11
Fuel Use Vehicle Motor fuel tax options Tolling/Congestion Pricing Retail Sales & Use Tax
Index Expand tolling Change rate
Set increases Expand revenue uses Vehicle Fees
Add special assessment fee Ferries & Cascade Amtrak Rates at 2012 purchasing power Operations funding Index Capital funding Modify weight fees Off-Road Use Fee Extend in lieu of fee to electric Rates 2012 purchasing power Tire Fee
Index Add fees for transportation Driver Transportation Business Transportation System Driver Licenses Business Licenses Access Management Fees
Rates 2012 purchasing power Rates 2012 purchasing power Rates 2012 purchasing power
Index Index Index Modify
Reflect impact Extend to interstates
Medium Term Recommendations
All recommendations are described as potential action items because decisions on which funding methods to adopt cannot be made without reference to specific projects or programs the legislature is trying to fund.
Seven actions are recommended for immediate consideration by the legislature. Revenues from these are shown in the table below.
Maintain the viability of license and permit fee revenues
Action 1: The legislature should adopt comprehensive legislation increasing the fees to 2012 purchasing power and indexing them to the CPI to maintain purchasing power. The legislature should also provide authorization through the budget process to the affected agencies to modify the fees annually, and direct the resulting Capron refunds to WSF.
Maintain the short and medium-term viability of the fuel tax
Action 2: The legislature should index the tax to the CPI to maintain its purchasing power and, to off-set declines in per capita consumption increase the tax rate annually year or add a transportation assessment fee to the retail price of motor vehicle fuel. Any resulting Capron refunds should be directed to WSF.
Adopt in-lieu of vehicle fuel tax fees for electric and other high mileage vehicles
Action 3: The legislature should, consistent with fees adopted for natural gas and propane powered vehicles, adopt in-lieu of fees for electric vehicles and other high mileage vehicles.
Extend tolling applications
Action 4: The legislature should consider funding additional projects with tolls.

Implementing Alternative Transportation Funding Methods Draft Final Report
Dec. 2, 2009 12
Secure WSF capital funding
Action 5: To help secure capital funding for Ferries, the legislature should consider, in addition to increasing and indexing the motor vehicle fuel tax, a capital surcharge on ferry fares, directing the additional Capron refunds to the Ferry capital account, distributing a portion of license fees to ferries capital account, and re-balancing the distribution of the motor vehicle fuel tax between the Ferris operations and capital accounts.
Review Amtrak Cascades Service funding
Action 6 The legislature should review Amtrak Cascades service farebox recovery and opportunities to decrease the state’s subsidy and for the imposition of a capital surcharge on tickets.
Revise the WSDOT Access Management Program
Action 7.The legislature should consider expanding WSDOT’s access management program to require entities that impact state or interstate highways to mitigate that impact.
Revenue (billions)
State Funds (billions)
Local (billions)
Vehicle Owner Mid-Size 2009 $272 = 2025 $437
Maintain the viability of license and permit fee revenues
$3.8
$1.0 – Motor Vehicle Fund $0.5 – Multimodal Fund $0.2 – Nickel & TPA $1.3 – State Patrol $0.7 – Ferry Operations $0.1 – Ferry Capital
$18 million Capron
$297
Maintain the short and medium-term viability of the fuel tax
Index $4.4 Risk $6.6 TRFC
$1.1-$1.7 Motor Vehicle Fund $1.6-$2.4 Nickel & TPA $0.1-$0.1 Ferry Operations $0.1-$0.1 Ferry Capital $0.1-$0.1 Other
$1.4 - $2.2 Distributed $27-41 million Capron
$329
1 cpg $3.9 Risk $3.4 TRFC
$0.9-$1.0 Motor Vehicle Fund $1.2-$1.4 Nickel & TPA $0.1-$0.1 Ferry Operations $0.1-$0.1 Ferry Capital $0.1-$0.1 Other
$1.0-$1.3 Distributed $21-24 million Capron
$304
2% assessment Fund allocation TBD $295
Adopt in-lieu of vehicle fuel tax fees for electric and other high mileage vehicles
$271 million- Risk $1.0 million - TRFC
$297 Electric change from $77=$123 to $188
Extend tolling applications TBD
Implementing Alternative Transportation Funding Methods Draft Final Report
Dec. 2, 2009 13
Revenue (billions)
State Funds (billions)
Local (billions)
Vehicle Owner Mid-Size 2009 $272 = 2025 $437
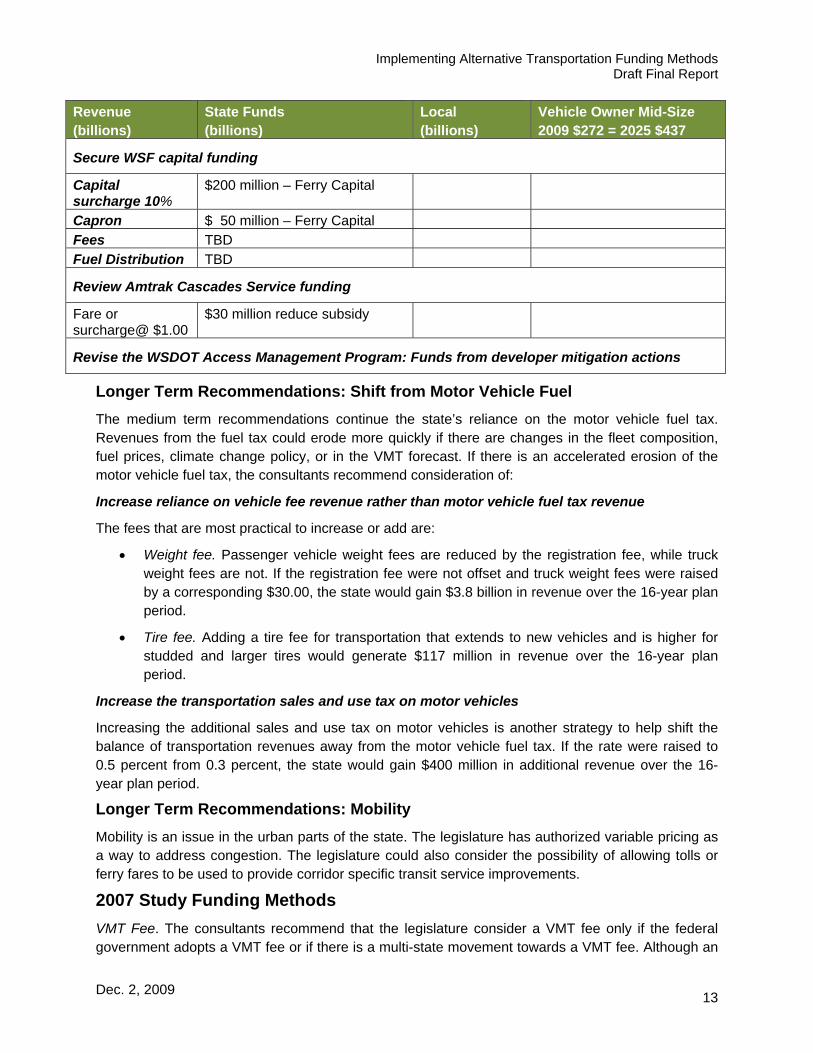
Secure WSF capital funding
Capital surcharge 10%
$200 million – Ferry Capital
Capron $ 50 million – Ferry Capital Fees TBD Fuel Distribution TBD
Review Amtrak Cascades Service funding
Fare or surcharge@ $1.00
$30 million reduce subsidy
Revise the WSDOT Access Management Program: Funds from developer mitigation actions
Longer Term Recommendations: Shift from Motor Vehicle Fuel
The medium term recommendations continue the state’s reliance on the motor vehicle fuel tax. Revenues from the fuel tax could erode more quickly if there are changes in the fleet composition, fuel prices, climate change policy, or in the VMT forecast. If there is an accelerated erosion of the motor vehicle fuel tax, the consultants recommend consideration of:
Increase reliance on vehicle fee revenue rather than motor vehicle fuel tax revenue
The fees that are most practical to increase or add are:
Weight fee. Passenger vehicle weight fees are reduced by the registration fee, while truck weight fees are not. If the registration fee were not offset and truck weight fees were raised by a corresponding $30.00, the state would gain $3.8 billion in revenue over the 16-year plan period.
Tire fee. Adding a tire fee for transportation that extends to new vehicles and is higher for studded and larger tires would generate $117 million in revenue over the 16-year plan period.
Increase the transportation sales and use tax on motor vehicles
Increasing the additional sales and use tax on motor vehicles is another strategy to help shift the balance of transportation revenues away from the motor vehicle fuel tax. If the rate were raised to 0.5 percent from 0.3 percent, the state would gain $400 million in additional revenue over the 16-year plan period.
Longer Term Recommendations: Mobility
Mobility is an issue in the urban parts of the state. The legislature has authorized variable pricing as a way to address congestion. The legislature could also consider the possibility of allowing tolls or ferry fares to be used to provide corridor specific transit service improvements.
2007 Study Funding Methods
VMT Fee. The consultants recommend that the legislature consider a VMT fee only if the federal government adopts a VMT fee or if there is a multi-state movement towards a VMT fee. Although an

Implementing Alternative Transportation Funding Methods Draft Final Report
Dec. 2, 2009 14
interstate agreement is theoretically possible, it is very difficult for an individual state to implement a VMT fee. In a June 2009 National Cooperative Highway Research Program study, four states of six states reviewed said they assumed implementation would have to be done at the federal level. Changes involving new technology built into new vehicles or roadway changes would clearly need to be federal – or alternatively perhaps a major market state such as California could set the standards all other states could follow. A state that decides to implement a VMT on its own would have a high risk of fraud from individuals claiming miles driven in another state. The study also found that self-reporting or odometer checking as a way to collect a VMT fee would also be subject to abuse and fraud.
Sales Tax on Motor Vehicle Fuel. A sales tax on motor vehicle fuel would generate General Fund review unless there was a specific legislative direction to fund transportation. The consultants note that special assessment fee applied at retail to fuel sales could be designated for a specific transportation purpose.
Local Funding Methods
Counties. In 2007, the total amount of county road revenue generated was $887 million, of which 43 percent was from county road property taxes, 14 percent from federal sources, 16 percent from distributions of the state motor fuel tax, 8 percent from other state funds, and 16 percent from other county sources. Counties receive 4.92 cpg of the state motor fuel tax, which is distributed by formula based on mileage, needs, resources, and population. The County road levy is subject both to the 2.25 per $1,000 AV and the Iniative-747 1% limit. The result is the 96 percent of road levy capacity is being used.
Cities. In 2007, total city transportation revenues equaled $1.3 billion, of which 74 percent was generated by city taxes, permits and fees, and operating transfers; 7 percent from distributions of the state fuel tax; 8 percent from other state sources; 9 percent from the federal government; and 2 percent from other sources. Cities are largely reliant on general purposes taxes (i.e., sales and use taxes, real and personal property taxes) for transportation investment that competes with other general fund needs.
Special purpose districts – transit. Washington State has 28 transit districts, including Sound Transit. In 2007, the 27 transit districts other than Sound Transit had capital and operating revenues of $1.3 billion, of which 64 percent was from sales and other local taxes, 11 percent from fares, 11 percent from the federal government, 2 percent from the state, and 12 percent from other sources. Local governments are authorized to levy a sales and use tax of up to 0.9 percent for transit. King County METRO and Community Transit, which between them had 68 percent of all transit passenger trips in 2007, levy the maximum 0.9 percent rate, and Kitsap Transit, with 2 percent of all transit passenger trips, levies 0.8 percent.
Reasons why local funding options are not being fully used fall under four categories: (1) there may be significant political hurdles, such as voter approval requirements, associated with implementing a funding mechanism; (2) the funding mechanism may be restricted in its use or applicability (i.e., funding mechanisms may be geographically or use restricted); (3) implementation of a funding mechanism may require a high level of inter-jurisdictional cooperation and coordination, which may be difficult to obtain (local option motor vehicle and special fuel tax); and (4) in the case of transportation benefit districts, the mechanism has only recently (May 2008) become available as a funding tool for all cities and counties.

Implementing Alternative Transportation Funding Methods Draft Final Report
Dec. 2, 2009 15
Local Government Funding Options: Increased State Funding. Options considered for local government include: increased state funding from already mandated distributions if the legislature increase the fuel tax or fees; increasing the distribution percentages; distributing some fee revenue to local jurisdictions; and increasing funding of state grant programs.
Local Government Funding Options: Jurisdiction Discretion. Options reviewed include: for cities, allowing the creation of a street utility; for counties, modifications to existing transportation benefit district and motor fuel taxing authorizations and allowing all counties to impose the same total rental vehicle sales tax as King County; and for transit, transferring taxing opportunities made available to the Regional Transportation Investment District (RTID) to transit.
Local Government Funding Recommendations
Action 1. Increase if funding permits state grant programs from the Transportation Improvement Board, the County Road Administration Board, the Freight Mobility Strategic Investment Board, and the Public Transportation Division.
Action 2. Authorize cities to create street utilities to provide a dedicated funding source for street maintenance and preservation.
Action 3. Amend the authority for Transportation Benefit Districts to impose license fees so that a fee of up to $100 can be imposed by a councilmanic vote.
Action 4. Amend the authority for counties to impose an additional motor vehicle and special fuel tax to establish the rate as cents per gallon rather than as a percentage of the state motor vehicle fuel tax and provide councilmanic authority.
Action 5. Transfer the increased sales tax limit and employer taxes authorized for RTID to support transit.
In the longer-term the legislature could consider additional state funds distribution to local jurisdictions and additional rental car tax authority.

Implementing Alternative Transportation Funding Methods Draft Final Report
Dec. 2, 2009 16
IMPLEMENTING ALTERNATIVE TRANSPORTATION FUNDING METHODS STUDY
DRAFT Final Report
I. PURPOSE The 2009 legislature directed the Joint Transportation Committee (JTC) to conduct a comprehensive analysis of mid-term and long-term transportation funding mechanisms and methods. Elements of the study are to include existing data and trends, policy objectives, performance and evaluation criteria, incremental transition strategies, and possibly, scaled testing (ESSB 5352 (204) (1)).
The study analyzes the feasibility and practicality of implementing funding methodologies identified in the JTC’s 2007 Long-Term Transportation Financing Study, as well as other methods identified by the committee, staff, and consultants. The principle objective is to identify specific steps for the legislature and agencies to begin implementing viable mid-term and long-term transportation funding approaches. The primary focus is on state imposed and collected transportation taxes and fees.
2007 Long-Term Transportation Financing Study The JTC’s 2007 study recommended that, over the next 15 years, Washington State replace its fuel tax – which provides 38 percent of the state’s transportation funding - with alternative funding methods. The study found that the fuel tax was becoming less viable as a funding method as vehicles become more fuel efficient and as inflation erodes the purchasing power of the flat 37.5 cents per gallon (cpg) fuel tax rate.
In the medium term (next 5 to 15 years) the study recommended that the state continue to rely on the fuel tax, but make it more viable by indexing it to the consumer price index (CPI). The study also recommended that, in the medium term, the state add a sales tax to fuel sales, impose additional tolls, expand local funding options, and consider a container charge.
In the long term (next 10 to 15 years), the study recommended replacing the fuel tax with a vehicle miles traveled (VMT) fee, including a local-option VMT service fee, add a vehicle weight-mile tax, and consider regional development impact fees.
2007 Long Term Financing Study Funding Methods Recommendations
Medium-Term (5-15 years) Long-Term (10-15 years/)
Sales tax on fuel
Index fuel tax
More tolling o High Occupancy Tolling (HOT) Lanes o Extend bridge tolling o Area tolling
Expanded local sources o Local option tax (RTID)
Container charges
Replace fuel tax with Vehicle Miles Traveled (VMT) fee
Supplement VMT fee with a local-option VMT service fee
Vehicle weight-mile tax
Regional development impact fees Transition between medium & long-term dependent on how quickly the fuel tax erodes and the development of technology to collect VMT fees.

Implementing Alternative Transportation Funding Methods Draft Final Report
Dec. 2, 2009 17
Since 2007, the legislature has taken action with regard to two of the study’s recommendations:
Tolling. RCW 47.56.830, adopted in the 2008 legislative session, designates the legislature as the only entity with the authority to impose tolls on the state highway system and establishes policies for tolling. Tolling commenced on the Tacoma Narrows Bridge in 2007 and on State Route 167 High Occupancy Toll (HOT) Lanes in 2008. In the 2009 session, the legislature authorized tolling for the 520 Floating Bridge and directed the Washington State Department of Transportation (WSDOT) to conduct studies of five additional potential tolling applications and report to the legislature in the 2010 session.
Container Fees. In 2007, the Washington State Senate introduced Senate Bill 5207 that would have created a freight congestion relief account funded through a $50 container fee with “container” defined as a twenty-foot equivalent (TEU). In response to strong opposition to this bill, the Senate instead directed the JTC to study container fees and other freight funding mechanisms. In January 2009, the JTC published its Freight Investment Study, which found that container fees set at $30 or greater would have a significant diversion effect, causing freight traffic to move away from Puget Sound ports. The analysis was not sufficiently sensitive to predict the diversionary effects of container fees below $30.No additional legislative action has been taken.
Another significant development is that King, Pierce, and Snohomish county voters in November, 2007 rejected the proposed formation of a Regional Transportation Investment District or RTID.

Implementing Alternative Transportation Funding Methods Draft Final Report
Dec. 2, 2009 18
II. TRENDS AFFECTING TRANSPORTATION FUNDING METHODS
This section reviews energy, climate change, and mobility trends as well as federal policies that inform the state’s transportation funding methods. The consultants found that:
Energy. Energy policies, particularly the new Corporate Average Fuel Standards (CAFÉ) that mandate higher levels of new vehicle fuel economy, will accelerate the erosion of the fuel tax.
Climate change. Current state climate change laws establish benchmarks for reductions in daily vehicle miles traveled (VMT) per capita. The benchmarks are being reviewed to determine whether, with the advent of electric cars and other low emission vehicles, VMT is a reasonable proxy for the transportation system’s contribution to greenhouse gas emissions (GHG). Until this review is completed and WSDOT refines its projection of total annual VMT in June 2010, attainment of the daily per capita VMT benchmarks should not be assumed in making transportation funding decisions.
Congestion. Congestion is a significant issue for the state’s urban areas and the state has begun to use pricing strategies to reduce congestion. The state’s medium and long-term funding methods should include methods that can be selectively applied in urban areas to address congestion.
Federal. At the federal level, the current administration is not expected to propose a long term transportation funding method for 18 months. Although three federal commissions have endorsed use based fees, in particular a vehicle miles traveled fee, to replace the federal fuel tax, the administration has indicated that it will not consider such a fee. State decisions on long-term funding methods should assume current federal funding methods until the administration or Congress develops a new policy.
A. Energy The 2007 JTC study stated that the transition between medium and long-term funding sources would be dependent in part on how quickly the fuel tax erodes. The major trends in energy, including rising oil prices, rising vehicle fuel economy, use of alternative fuels, and the advent of electric vehicles will accelerate the erosion of the fuel tax.
Rising oil prices. Economists forecast that oil prices will continue to increase over the next 10-20 years as we reach the end of peak production and actual extraction becomes more difficult. US government forecasting entities, including the Department of Energy (DOE), forecast that fuel prices will rise due to increasing demand from developing economies like China and India and the depletion of petroleum reserves. The Washington State fuel price March 2009 forecast also anticipates rising gasoline retail prices, peaking at $4.69 per gallon in FY 2020.
Rising fuel economy/new CAFÉ standards. In May 2009, President Obama accelerated fuel economy standards by ordering the corporate average fuel economy standard to increase by 5 percent each year, building on the 2011 standard through 2016. This means an industry standard of 35.5 miles per gallon (mpg) by 2016, an average increase of eight mpg per

Implementing Alternative Transportation Funding Methods Draft Final Report
Dec. 2, 2009 19
vehicle compared to current requirements. Specifically, the new standards would require an average mileage standard of 39 mpg for cars and 30 mpg for trucks by 2016.
Increasing use of alternative fuels: As conventional fuel prices increase, many see an opportunity for the introduction of advanced vehicle technologies that rely on alternative fuels. Some forecasts place hybrid vehicle technologies (which use a combination of electricity with either biofuels or conventional motor fuels) at roughly 15 percent of the new vehicle market in 2025 increasing to 70 percent by 2040.1 These forecasts also estimate that fuel cell technologies would make an appearance by 2040, constituting 30 percent of the new vehicle market.
Increased market penetration by electric vehicles Washington State is encouraging the introduction of electric vehicles. In the 2009 session, the legislature adopted 2SHB 1481 (Chapter 459, 2009 Laws – codified in multiple chapters) to encourage the transition to electric vehicle use and to expedite the establishment of a convenient, cost-effective, electric vehicle infrastructure. In 2010, Seattle will become one of the first cities where Nissan sells electric vehicles. The vehicles are anticipated to be able to exceed highway speed limits, go 100 miles on a charge, and recharge in four to eight hours using a 220-volt line. The City of Seattle will help make the vehicles viable by, among other actions, assisting in the development of a charging network and creating charging stations.
Since the 2007 study, the consumption of motor fuel per capita (population 18 and over) has dropped in Washington State as a result of increasing vehicle fuel efficiency and increasing gasoline costs. In FY 2008 total motor fuel consumption dropped, with a 1 percent reduction between FY 2007 and FY 2008. Per capita consumption has declined each year since FY 1999, with a total drop of 10 percent between FY 1999 and FY 2008 from 720.6 gallons per capita to 650.6 gallons per capita.
1 The Fuel Tax and Alternatives for Transportation Funding: Special Report 285 (Transportation Research Board, 2006)

Implementing Alternative Transportation Funding Methods Draft Final Report
Dec. 2, 2009 20
Exhibit 1. Washington State Fuel Consumption FY 90 to FY 08
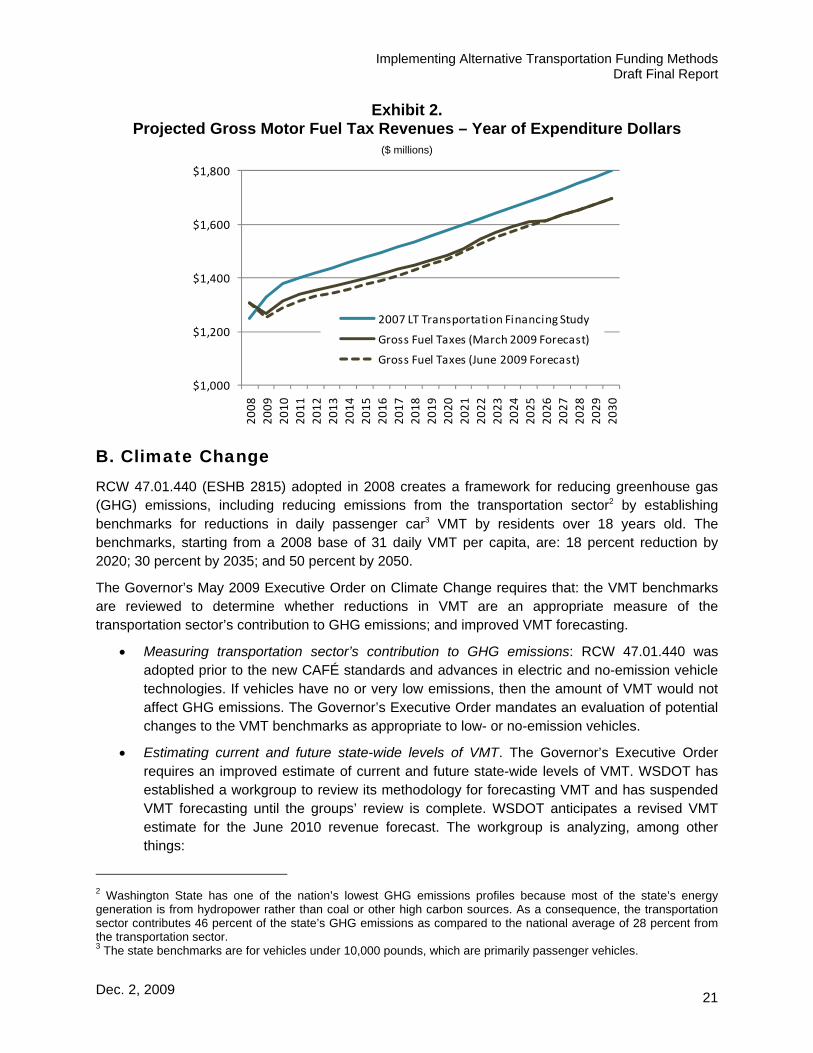
The declines in per capita fuel consumption are reflected in a faster erosion of fuel tax revenue than was anticipated in the 2007 study. The March 2009 Transportation Revenue Forecast Council (TRFC) projections assume moderate and gradual changes in consumption trends based on fuel prices and increasing fuel efficiency of the fleet but did not account for the May 2009 change in CAFÉ standards. Even so, the March forecast projects estimated motor fuel tax revenue decreasing relative to 2007 assumed levels. This change represents a decrease in revenues of $1.7 billion over the 2010-2030 period with purchasing power continuing to decline. Using the November 2009 forecasts, the picture continues to worsen.
2,000.00
2,200.00
2,400.00
2,600.00
2,800.00
3,000.00
3,200.00
3,400.00
500
550
600
650
700
90 91 92 93 94 95 96 97 98 99 00 01 02 03 04 05 06 07 08
Fuel Consumption
Total Gallons (millions)
Yearly Per Capita
Yearly Gallons Total
Implementing Alternative Transportation Funding Methods Draft Final Report
Dec. 2, 2009 21
Exhibit 2. Projected Gross Motor Fuel Tax Revenues – Year of Expenditure Dollars
($ millions)
B. Climate Change RCW 47.01.440 (ESHB 2815) adopted in 2008 creates a framework for reducing greenhouse gas (GHG) emissions, including reducing emissions from the transportation sector2 by establishing benchmarks for reductions in daily passenger car3 VMT by residents over 18 years old. The benchmarks, starting from a 2008 base of 31 daily VMT per capita, are: 18 percent reduction by 2020; 30 percent by 2035; and 50 percent by 2050.
The Governor’s May 2009 Executive Order on Climate Change requires that: the VMT benchmarks are reviewed to determine whether reductions in VMT are an appropriate measure of the transportation sector’s contribution to GHG emissions; and improved VMT forecasting.
Measuring transportation sector’s contribution to GHG emissions: RCW 47.01.440 was adopted prior to the new CAFÉ standards and advances in electric and no-emission vehicle technologies. If vehicles have no or very low emissions, then the amount of VMT would not affect GHG emissions. The Governor’s Executive Order mandates an evaluation of potential changes to the VMT benchmarks as appropriate to low- or no-emission vehicles.
Estimating current and future state-wide levels of VMT. The Governor’s Executive Order requires an improved estimate of current and future state-wide levels of VMT. WSDOT has established a workgroup to review its methodology for forecasting VMT and has suspended VMT forecasting until the groups’ review is complete. WSDOT anticipates a revised VMT estimate for the June 2010 revenue forecast. The workgroup is analyzing, among other things:
2 Washington State has one of the nation’s lowest GHG emissions profiles because most of the state’s energy generation is from hydropower rather than coal or other high carbon sources. As a consequence, the transportation sector contributes 46 percent of the state’s GHG emissions as compared to the national average of 28 percent from the transportation sector. 3 The state benchmarks are for vehicles under 10,000 pounds, which are primarily passenger vehicles.
$1,000
$1,200
$1,400
$1,600
$1,800
2008
2009
2010
2011
2012
2013
2014
2015
2016
2017
2018
2019
2020
2021
2022
2023
2024
2025
2026
2027
2028
2029
2030
2007 LT Transportation Financing Study
Gross Fuel Taxes (March 2009 Forecast)
Gross Fuel Taxes (June 2009 Forecast)
Implementing Alternative Transportation Funding Methods Draft Final Report
Dec. 2, 2009 22
o VMT and gasoline consumption: Until February 2008, when WSDOT completed its last forecast, the VMT forecast was based on the growth rate in gasoline consumed. Changes in vehicle miles traveled will not necessarily track with changes in gasoline consumption as vehicles become more fuel efficient or use little or no gasoline.
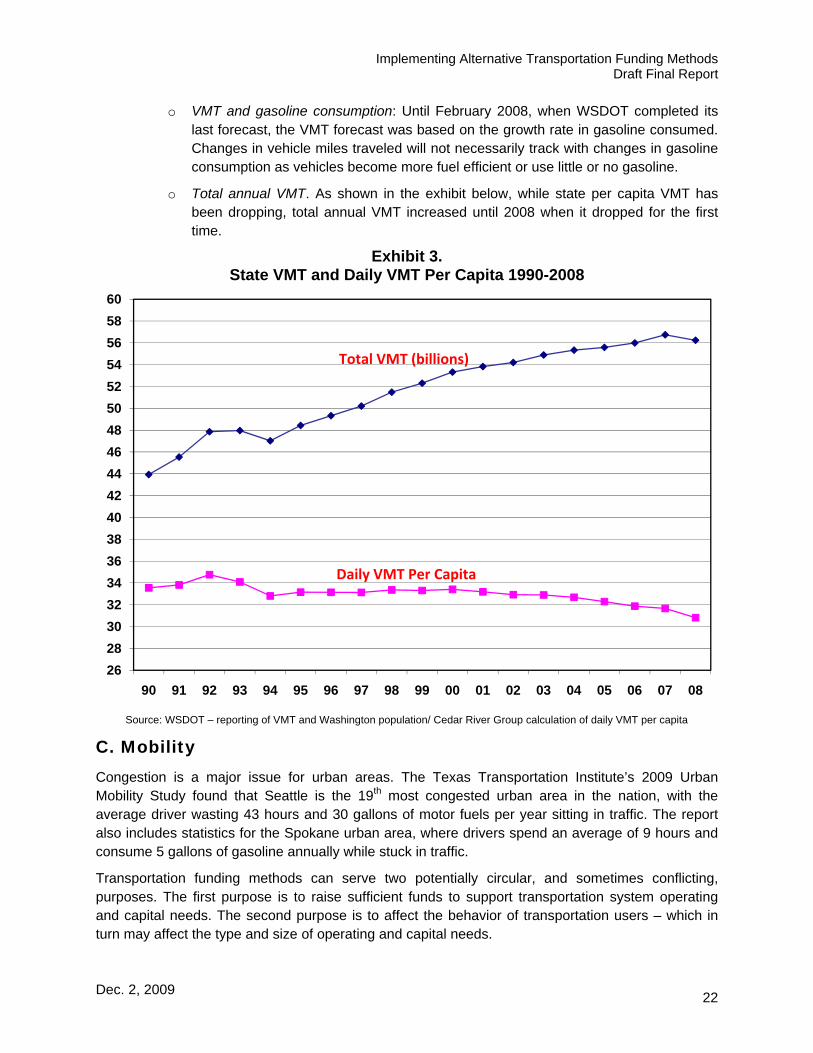
o Total annual VMT. As shown in the exhibit below, while state per capita VMT has been dropping, total annual VMT increased until 2008 when it dropped for the first time.
Exhibit 3. State VMT and Daily VMT Per Capita 1990-2008
Source: WSDOT – reporting of VMT and Washington population/ Cedar River Group calculation of daily VMT per capita
C. Mobility Congestion is a major issue for urban areas. The Texas Transportation Institute’s 2009 Urban Mobility Study found that Seattle is the 19th most congested urban area in the nation, with the average driver wasting 43 hours and 30 gallons of motor fuels per year sitting in traffic. The report also includes statistics for the Spokane urban area, where drivers spend an average of 9 hours and consume 5 gallons of gasoline annually while stuck in traffic.
Transportation funding methods can serve two potentially circular, and sometimes conflicting, purposes. The first purpose is to raise sufficient funds to support transportation system operating and capital needs. The second purpose is to affect the behavior of transportation users – which in turn may affect the type and size of operating and capital needs.
26
28
30
32
34
36
38
40
42
44
46
48
50
52
54
56
58
60
90 91 92 93 94 95 96 97 98 99 00 01 02 03 04 05 06 07 08
Daily VMT Per Capita
Total VMT (billions)

Implementing Alternative Transportation Funding Methods Draft Final Report
Dec. 2, 2009 23
Since the 2007 study, the state is using funding methods to reduce congestion in urban areas:
Tolling policy. The state’s tolling policy in RCW 47.56.830 allows variable pricing, with the rates “set to optimize system performance, recognizing necessary trade-offs to generate revenue.”
SR 167 High Occupancy Vehicle Toll (HOT) lanes. The legislature authorized a four year congestion pricing pilot project for the SR 167 HOT lanes starting in 2008. The pilot has improved traffic flow and reduced congestion.4
Funding methods that reduce congestion are applicable in congested urban areas, but are not applicable in those parts of the state that do not have high levels of congestion.
D. Federal Policies and Funding The state’s funding methods are affected by: current federal funding methods, which to an even greater extent than the state rely on fuel taxes; shortfalls in the Highway Trust Fund (HTF); and recommendations from federal panels that would, if implemented, alter federal funding methods. The federal government is filling the shortfalls in the HTF while the administration develops its recommendation for long-term funding methods.
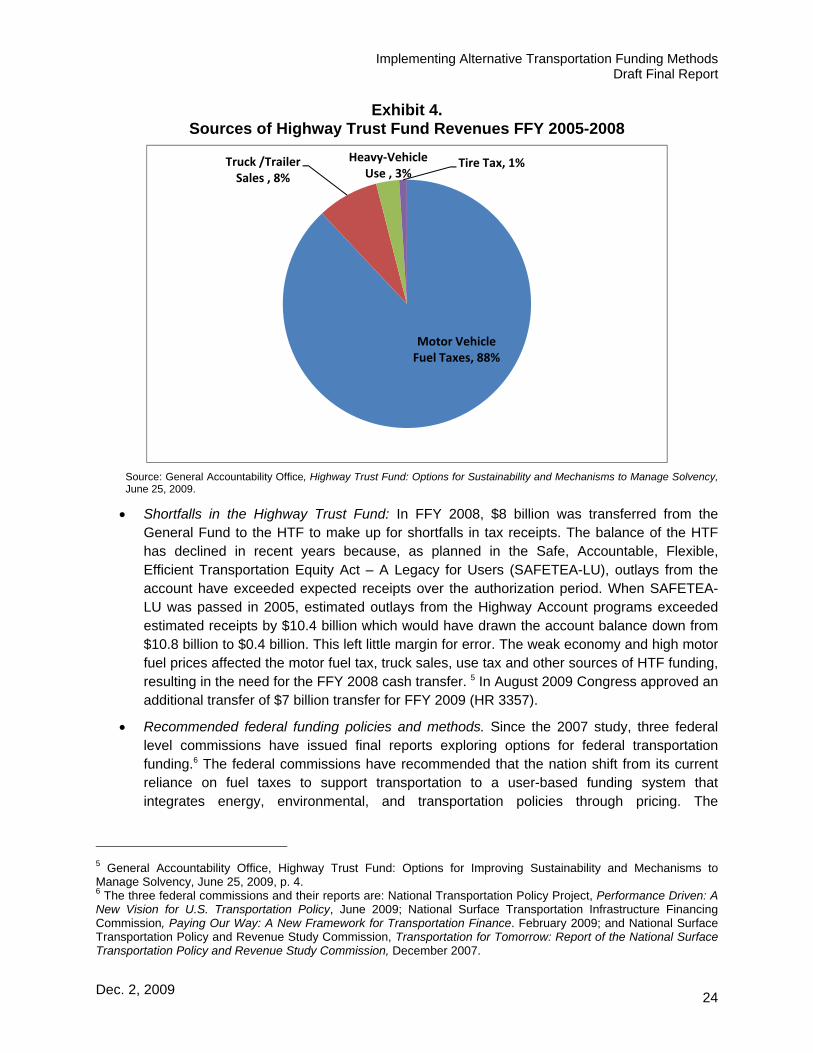
Federal transportation funding methods: For Federal Fiscal Years (FFY) 2005 through 2008, 88 percent of federal transportation revenues came from fuel taxes. The federal gasoline tax is 18.4 cpg and was last increased in 1993. The majority of the tax (15.44 cpg) is dedicated to the Highway Account in the HTF, which funnels approximately $33 billion a year to the states. The remaining 2.86 cpg goes to the Mass Transit Account, which helps support transit systems in Washington and other states. For diesel fuel, the tax rate is 24.4 cpg with 21.44 cpg allocated to the Highway Account and 2.86 cents to the Mass Transit Account. The remaining 12 percent of federal revenues came from truck related taxes, including a truck and trailer sales tax, a truck tire tax, and a heavy vehicle use tax.
4 Washington State Department of Transportation, SR 167 High Occupancy Toll (HOT) Lanes Pilot Project, May 3, 2008-December 31, 2008 Eight Month Performance Summary, January 7, 2008.
Implementing Alternative Transportation Funding Methods Draft Final Report
Dec. 2, 2009 24
Exhibit 4. Sources of Highway Trust Fund Revenues FFY 2005-2008
Source: General Accountability Office, Highway Trust Fund: Options for Sustainability and Mechanisms to Manage Solvency, June 25, 2009.
Shortfalls in the Highway Trust Fund: In FFY 2008, $8 billion was transferred from the General Fund to the HTF to make up for shortfalls in tax receipts. The balance of the HTF has declined in recent years because, as planned in the Safe, Accountable, Flexible, Efficient Transportation Equity Act – A Legacy for Users (SAFETEA-LU), outlays from the account have exceeded expected receipts over the authorization period. When SAFETEA-LU was passed in 2005, estimated outlays from the Highway Account programs exceeded estimated receipts by $10.4 billion which would have drawn the account balance down from $10.8 billion to $0.4 billion. This left little margin for error. The weak economy and high motor fuel prices affected the motor fuel tax, truck sales, use tax and other sources of HTF funding, resulting in the need for the FFY 2008 cash transfer. 5 In August 2009 Congress approved an additional transfer of $7 billion transfer for FFY 2009 (HR 3357).
Recommended federal funding policies and methods. Since the 2007 study, three federal level commissions have issued final reports exploring options for federal transportation funding.6 The federal commissions have recommended that the nation shift from its current reliance on fuel taxes to support transportation to a user-based funding system that integrates energy, environmental, and transportation policies through pricing. The
5 General Accountability Office, Highway Trust Fund: Options for Improving Sustainability and Mechanisms to Manage Solvency, June 25, 2009, p. 4. 6 The three federal commissions and their reports are: National Transportation Policy Project, Performance Driven: A New Vision for U.S. Transportation Policy, June 2009; National Surface Transportation Infrastructure Financing Commission, Paying Our Way: A New Framework for Transportation Finance. February 2009; and National Surface Transportation Policy and Revenue Study Commission, Transportation for Tomorrow: Report of the National Surface Transportation Policy and Revenue Study Commission, December 2007.
Motor Vehicle Fuel Taxes, 88%
Truck /Trailer Sales , 8%
Heavy‐Vehicle Use , 3%
Tire Tax, 1%

Implementing Alternative Transportation Funding Methods Draft Final Report
Dec. 2, 2009 25
commissions have recommended a national mode-neutral vehicle miles traveled fee, with recommendations that the federal government invest in research on implementing such a fee, and other fees that reflect system use. ”Ideally, user fees should capture diverse elements of use including miles traveled on roadways, vehicle weight or number of axles, contribution to congestion, and emissions.”7
o Current administration. The Obama administration has not yet made a recommendation on a long-term federal funding strategy and it is not clear whether the administration will endorse the recommendations of the commissions to impose a vehicle miles traveled fee. In March 2009, the US Department of Transportation issued a written statement that: "The policy of taxing motorists based on how many miles they have traveled is not and will not be Obama administration policy."8 The administration anticipates making recommendations on long-term transportation financing in the next 18 months.9
7 Ibid., p. 94. A similar recommendation is included in National Surface Transportation Infrastructure Financing Commission, Paying Our Way: A New Framework for US Transportation Policy, February 2009, p. 8. 8 CNN.com edition, Transportation agency: Obama will not pursue mileage tax, Feb., 20, 2009. 9 Administration Proposal for Stage 1 Reauthorization.
Implementing Alternative Transportation Funding Methods Draft Final Report
Dec. 2, 2009 26
III. WASHINGTON STATE FUNDING METHODS Major state agencies supported by the state transportation budget are: WSDOT, the Washington State Patrol, the Department of Licensing, the County Road Administration Board, the Freight Mobility Strategic Investment Board, the Traffic Safety Commission and the Transportation Improvement Board. The State also distributes motor vehicle fuel taxes and some licenses and permit fees to local jurisdictions.
This section reviews the state’s current funding methods. The consultants found that:
The state is dependent on flat rate revenues that do not grow with inflation. Eighty percent (80%) of the state’s direct transportation revenues are from fuel taxes and licenses, permits, fees and abstracts which have flat rates that do not grow with inflation.
Legislative action is required to set rates. With the exception of tolls and ferry fares, transportation tax and fee rates are set by RCW and require legislative action.
The use of funds is restricted by the 18th amendment and legislative action. The 18th amendment restricts the use of motor vehicle fuel taxes and vehicle registration fees to highway purposes. The legislature has imposed additional restrictions on the use of most transportation revenues.
Risk. There is substantial risk that, as a result of the new CAFÉ standards, the motor vehicle fuel tax will erode faster than projected. The consultants risk scenarios indicates a potential drop of $2.1 billion or 10 percent in motor vehicle fuel tax revenues.
Vehicle owner costs. As a consequence of higher fuel efficiency and the flat rates of the fuel tax and licenses and permits, vehicle owners, except electric car owners, will pay 15 to 18 percent less in taxes in 2025 than they pay in 2009 in 2025 dollars. Adjusted for inflation, so that the taxes and fees paid would purchase as much in 2025 as in 2009, owners will pay 38 to 49 percent less.
Policy considerations. There are three policy considerations for the legislature:
1. Differential in state taxes and fees paid by different types of passenger vehicle owners. For example, electric car owners pay 82 percent less than SUV owners in transportation fees and taxes.
2. 2025 purchasing power of vehicle owner payments. If taxes and fees were adjusted to maintain purchasing power, revenues would increase by approximately $10 billion over the 16-year plan.
3. Household budget. While taxes and fees are a significant cost to vehicle owners, they represent approximately 0.5 percent of the average household budget in the Seattle area.

Implementing Alternative Transportation Funding Methods Draft Final Report
Dec. 2, 2009 27
A. Nickel and TPA In 2003 and 2005 the State raised the motor vehicle fuel tax10 and other fees and charges to support two WSDOT capital programs: the 2003 Nickel Funding Package and the 2005 Transportation Partnership Act Funding Package. Both funding packages invest in highway, rail, ferry, transit and freight projects across the state. The motor vehicle fuel tax is currently 37.5 cpg, of which 23 cpg is the base rate, 5 cpg supports the Nickel program and 9.5 cpg the Transportation Partnership Program.
Exhibit 5. Taxes and Fees for the 2003 Nickel and 2005 TPA Packages
Tax Nickel Package 2003 TPA Package 2005
Motor Vehicle Fuel Tax 5 cpg increase 9.5 cpg increase
Fees 15% increase in gross weight fees on heavy trucks
$20 license plate retention fee
Vehicle weight fee
Light truck weight fee
Annual motor home fee of $75.00
Identicards - $5.00 increase
Driver Instruction Permit - $5.00 increase
License reinstatement after suspension or revocation $55.00 increase
DUI hearings - $100.00 increase
Sales Tax 0.3% increase in motor vehicle sales tax
The Nickel gas tax increase will sunset when the bonds issued against the revenue expire, currently estimated to be 2053. The other components of the Nickel funding package as well as the TPA increases do not expire.
B. Funding Sources and Direct Revenues 2009-2025 16-Year Financial Plan The exhibit below shows the sources of state transportation funding, excluding distributions to local jurisdictions, for the 2009-25 16-year financial plan. Based on the March 2009 revenue forecast (the forecast in effect when the legislature adopted the budget) total funding from all sources is $46.7 billion, of which 38 percent is from the motor vehicle fuel tax, 21 percent from licenses, fees, permits, and abstracts, 14 percent from bond sales, 12 percent from federal funds, 7 percent from ferry revenues (primarily fares), 3 percent from sales and use taxes on the sale and rental of vehicles, 3 percent from tolls collected from the Tacoma Narrows Bridge and SR 167, and 2 percent from interest ($423 million) and other sources. If only direct revenue is considered, which excludes bond sales, federal funds and interest, the motor vehicle fuel tax accounts for 52 percent of all state transportation direct revenue and licenses, permits, fees and abstracts 28 percent. The remaining 20 percent of direct revenue is from Washington State Ferries, tolling on the Tacoma Narrows Bridge and SR 167, vehicle sales and use taxes, and other miscellaneous sources.
10 The motor vehicle fuel tax referenced here includes the special fuel tax which applies to other combustible motor vehicle gases and liquids such as biodiesel, propane, natural gas, and butane.

Implementing Alternative Transportation Funding Methods Draft Final Report
Dec. 2, 2009 28
Exhibit 6.
State Transportation 16-Year Funding and Direct Revenue
Source 2009-25 Totals (billions)
% 2009-25 Funding
% 2009-25 Direct Revenue*
Motor Vehicle Fuel Tax – 37. 5 cpg** $17.7 38% 52% Licenses, Permits, Fees & Abstracts** $9.7 21% 28% Bond Sales $6.4 14% Federal Funds $5.7 12% Ferry Revenues $3.4 7% 10% Tolling (Tacoma Narrows Bridge/SR 167)
$1.5 3% 4%
Vehicles Sales Taxes $1.2 3% 4% Miscellaneous/Interest ($0.4 billion) $1.1 2% 2% Total Funds/Revenue $46.7 billion $46.7 billion $34.1 billion
*Excludes bond sales, federal funds, and interest which are not direct revenues.
** Excludes revenues distributed to local governments.
C. Characteristics of State Revenue Sources The major sources of state revenues – fuel taxes and licenses, permits, fees and abstracts – are set fees that do not respond to inflation. With the exception of tolls and ferry fares, where rates are set by the Washington State Transportation Commission (WSTC), all other taxes and fees, with some minor exceptions, are set by RCW and require legislative action. The use of state revenue sources is constrained by the 18th amendment to the Washington State Constitution, under which expenditures of motor vehicle fuel taxes and motor vehicle registration fees are limited to highway purposes, and by legislative restrictions.
State dependence on flat rate revenues: Eighty percent (80%) of direct state transportation revenue is from the motor vehicle fuel tax and licenses, permits, fees and abstract all of which have set rates. These revenue sources, therefore, respond to changes in population, use of fuel, vehicle ownership, or other factors but do not respond to inflationary cost increases. The only transportation funding methods that respond to inflation are the vehicle sales and uses taxes, which are an additional11 0.3 percent on the sale or lease of automobiles and an additional 5.9 percent on vehicle rentals. These sales and use taxes respond to the increased cost of vehicles and of vehicle rentals. Ferry fares and toll rates are set by the WSTC. The 16-year financial plan assumes 2.5 percent annual fare increases for ferries, an increase in the toll rate for the Tacoma Narrows Bridge to $4.00 for electronic toll collection in the 2009-11 biennia (which was not enacted by the WSTC), and toll increases in the outer biennia.
Legislative action required. With the exception of tolls and ferry fares, all other taxes and fees with few exemptions are set by RCW and require legislative action. Tax increases are subject to Initiative 960, passed by the voters in 2007. Initiative 960 requires that OFM
11 The sales and use tax that goes to transportation is in addition to the state sales tax of 6.5 percent which goes to the state’s general fund.

Implementing Alternative Transportation Funding Methods Draft Final Report
Dec. 2, 2009 29
determine the ten-year cost to taxpayers of any proposed legislation that would raise taxes, impose new fees, or increase current fees and communicate the most up-to-date analysis to each member of the Legislature, the news media, and the public through email. This process was initiated in the 2008 session. Under the initiative, legislative decisions to increase fees are subject to majority rule while legislative decisions to increase taxes are subject to two-thirds approval.
18th amendment restrictions. The 18th amendment to the state constitution limits the use of motor vehicle license fees and motor vehicle fuel taxes to highway purposes and specifically excludes from the restriction vehicle operator’s license fees, excise taxes imposed on motor vehicles in lieu of a property tax, or fees for certificates of ownership, or other taxes or fees not levied primarily for highway purposes.
All fees collected …as license fees for motor vehicles and all excise taxes collected … on the sale, distribution or use of motor vehicle fuel and all other state revenue intended to be used for highway purposes, shall be… placed in a special fund to be used exclusively for highway purposes … construed to include:
(a) The necessary operating, engineering and legal expenses connected with the administration of public highways, county roads and city streets;
(b) The construction, reconstruction, maintenance, repair and betterment of public highways, county roads, bridges and city streets; including the costs and expense of … policing by the state of public highways … and operation of ferries which are a part of any public highway…
Provided, that this section shall not be construed to include revenue from general or special taxes or excises not levied primarily for highway purposes, or apply to vehicle operator’s license fees or any excise tax imposed on motor vehicles or the use thereof in lieu of a property tax …, or fees for certificates of ownership of motor vehicles. (1943 House Joint Resolution No. 4, p. 938. Approved November, 1944)
Legislative restrictions. The legislature has further restricted the use of fees to specific purposes. Fees, as distinguished from taxes, are required to be established for specific purposes and use restricted to those purposes. For example, toll revenues from an eligible facility are restricted by RCW 47.56.830 to “construct, improve, preserve, maintain, or operate the eligible toll facility.” Revenues from individual licenses, fees, and permits are directed by RCW to specific sub-accounts for special purposes, an example of which is revenue from motorcycle endorsements and permits directed to the motorcycle safety education account.
D. State Funds/Accounts The state has two primary transportation funds, the motor vehicle fund and the multimodal fund, both of which have numerous sub-accounts which restrict the use of funds.

Implementing Alternative Transportation Funding Methods Draft Final Report
Dec. 2, 2009 30
Motor vehicle fund: The motor vehicle fund was established for the purpose of supporting highway and highway-related programs and all accounts in the fund are subject to the 18th amendment restrictions. Rail, transit, and air transportation may not be financed with motor vehicle fund dollars. The motor vehicle fund has 19 accounts.
Multimodal transportation fund: This fund is used for general transportation purposes with revenues and accounts that are not subject to the 18th amendment. As a result, revenues from this fund can be used for rail, transit, and air transportation and other non-highway purposes as well as for highway purposes. This fund has 24 active accounts.
E. Risk Assessment The consultants have developed a risk profile based on implementation of the CAFÉ standards and greater market penetration of electric vehicles. As shown in the exhibit below, the March forecast was adopted prior to the change in the CAFÉ standards and assumes a continuation of the historical gallons per capita consumption of motor vehicle fuels. The consultants’ risk scenario incorporates the CAFÉ standards, assumes a shift from compact cars into hybrid and electric vehicles such that 5 percent and 10 percent of the total fleet is comprised of electric and hybrid vehicles respectively, and assumes that vehicle miles traveled per capita remains constant over time. This results in average fuel economy rising from 21.3 mpg in 2010 to 26.8 mpg in 2025 - a 25 percent increase in overall average fuel efficiency. The consultants’ risk profile does not incorporate any fuel consumption risk resulting from price increases above those included in the November forecast. Under these assumptions, total revenues from the motor vehicle fuel tax would be $19.4 billion over the 16 year plan, a reduction of $2.2 billion versus the November baseline forecast.

Implementing Alternative Transportation Funding Methods Draft Final Report
Dec. 2, 2009 31
Exhibit 7. Risk Scenario
F. Vehicle Owner Costs The consultants have estimated the cost to vehicle owners of state transportation fuel taxes, licenses and permits, and sales and use tax by representative vehicle types at different levels of vehicle use. The calculations do not include tolls or ferry fares which apply only to users of the tolled facilities.
The consultants analyzed six different passenger vehicle types and two truck types as shown in the exhibit below. Each passenger vehicle type was analyzed assuming low use (8,000 miles per year), medium use (11,500 miles per year) and heavy use (15,000 miles per year). The medium trucks were analyzed assuming 13,500 miles per year for the low use, 27,000 for medium use, and 45,000 for high use and the heavy trucks for 13,000, 32,500, and 65,000 miles per year respectively.
Exhibit 8. Vehicle Scenario Assumptions
Vehicle Type Weight (lbs) Miles Per Gallon (2009)
Fleet average
Miles Per Gallon (2025)
Fleet average
Miles Per Gallon % Increase
Compact <4,000 30.0 36.1 20% Mid-Size Sedan 4,001 – 6,000 21.0 25.3 20% SUVs/Pick-ups 6,001 – 8,000 12.0 14.5 20% Hybrid <4,000 45.0 54.2 20%
300
350
400
450
500
550
600
1972
1974
1976
1978
1980
1982
1984
1986
1988
1990
1992
1994
1996
1998
2000
2002
2004
2006
2008
2010
2012
2014
2016
2018
2020
2022
2024
Historical and Projected Gallons Per Capita
Historical Gallons per capita
Projected Gallons Per Capita (Risk Scenario)
Projected Gallons Per Capita (March 2009 Forecast)
Projected Gallons Per Capita (Nov 2009 Forecast)

Implementing Alternative Transportation Funding Methods Draft Final Report
Dec. 2, 2009 32
Vehicle Type Weight (lbs) Miles Per Gallon (2009)
Fleet average
Miles Per Gallon (2025)
Fleet average
Miles Per Gallon % Increase
Electric <4,000 230.0 277.0 20% Motorcycle <4,000 0.0 60.2 20% Freight (Medium)
22,001 – 24,000
7.0 8.4 20%
Freight (Heavy) 40,001 – 42,000
5.7 6.8 20%
Over time, increasing fuel efficiency will result in decreasing fuel taxes. In addition, because the fuel tax and all licenses, permits, and fees are flat rates, the taxes paid lose purchasing power against inflation. As a consequence, vehicle owners will pay less in 2025 than they are paying in 2009 before adjusting for inflation and even less in terms of purchasing power. For example, the average owner of a mid-size sedan will pay $241 in 2025 compared to $272 in 2009, which is 12 percent less. To maintain $272 in purchasing power in 2025, the vehicle owner would need to pay $437. By paying only $241 in 2025, the owner is in terms of purchasing power paying 45 percent less in 2025 than in 2009.
Exhibit 9. Summary of Annual Transportation Taxes/Fees for All Vehicle Types
(Mid-Level Usage)
Vehicle Type 2009 2014 2019 2025
% Change 2009-25
% Change 2009 Purchasing
Power Compact $197 $189 $179 $175 -11% -45% Mid-Size Sedan $272 $260 $246 $241 -12% -45% SUVs/Pick-ups $437 $414 $390 $379 -13% -46% Hybrid $151 $146 $140 $137 - 9% -43% Electric $77 $76 $76 $76 -0.4% -37% Motorcycle $138 $133 $127 $124 -10% -44% Freight (Medium) $1,694 $1,605 $1,503 $1,456 -14% -46% Freight (Heavy) $2,865 $2,737 $2,589 $2,523 -12% -45%
This analysis raises policy issues for the legislatures’ consideration including:
Differential costs between passenger vehicle types. As shown in the exhibit below, an electric car owner in 2009 pays 82 percent less than the owner of a light truck or SUV in transportation taxes and fees and 80 percent less in 2025. Owners of mid-size sedans in 2025 will pay 37 percent less than a SUV owner, compact car owners 54 percent less, hybrid owners 64 percent less, and motorcycle owners 67 percent less.

Implementing Alternative Transportation Funding Methods Draft Final Report
Dec. 2, 2009 33
Exhibit 10. Passenger Vehicle State Transportation Taxes & Fees
Passenger Vehicle Type
2009 State Taxes & Fees
% compared to highest
2025 State Taxes & Fees
% compared to highest
SUVs/Pick-ups $437 $379 Mid-Size Sedan $272 -38% $241 -37% Compact $197 -55% $175 -54% Hybrid $151 -65% $137 -64% Motorcycle $138 -68% $124 -67% Electric $77 -82% $ 77 -80%
Purchasing power 2025. If taxes and fees were adjusted to maintain 2025 purchasing power, revenues would increase by approximately $10 billion over the 16-year plan.
Impact on household transportation budgets. State transportation taxes and fees, while significant, represent a relatively small portion of a household budget. Based on data from the Bureau of Labor Statistics, for 2004-05 for the Seattle Standard Metropolitan Statistical Area, which encompasses most of the four county area of Pierce, King, Snohomish and Kitsap counties, transportation is approximately 17.6 percent of a household budget, with state transportation taxes and fees for one standard sedan approximately 0.5 percent.
Exhibit 11. State Transportation Taxes & Fees as Percent of Household Budget
(Seattle SMSA 2004-5)
Housing32.4%
Food12.8%
Healthcare5.4%
Entertainment5.6%
Personal Inurance & Pensions
11.6%
Apparel & Services
3.4%
Other7.5%
Cash contributions
3.8%
Ownership (net outlay)7.2%
Gas and Oil3.5%
Insurance, Maint. & Other
6.3%
State taxes and fees0.5%
Transport
Implementing Alternative Transportation Funding Methods Draft Final Report
Dec. 2, 2009 34
IV. EVALUATION FRAMEWORK The goal is to develop a package of funding tools that the legislature can consider. It is not anticipated that any one funding method will meet all of the state’s objectives.
Two threshold criteria for every funding method are whether the funding method: 1) is an appropriate state level fee or tax; and 2) has a nexus to transportation. The threshold criteria screened out general funding methods, such as an income tax or a general sales tax, from consideration.
Four objectives and associated evaluation criteria are included in the framework:
Revenue stream. Provide a stream of revenue commensurate with transportation system funding needs. Evaluation criteria are: the potential revenue from the funding method; whether the funding method is responsive to inflation, population change, and economic growth; whether it is stable and predictable - particularly in view of projected and potential changes in vehicle miles traveled (VMT), energy sources, and energy prices; whether administration is easy for the public to understand and comply with; whether collection is cost-efficient; and whether the funding method is compatible with current or potential federal funding methods.
Benefits/reflect use. Provide a clear purpose and policy rationale linked to transportation system use, economic development, and other state policies and goals. Evaluation criteria are: is the funding method linked to a particular transportation service or facility so taxpayers clearly understand the benefit received; does the funding method reflect use and vary by how much, when, and/or where an individual uses the transportation system; is it available to fund a full range of transportation choices or is it restricted by the 18th Amendment to the Washington State Constitution or by existing law; does it positively affect transportation system performance and other state policies and goals by, for example, reducing congestion or greenhouse gas (GHG) emissions; and does it create and grow system connections by reducing barriers between transportation modes.
Equitable. Funding burden is geographically equitable and equitably allocates transportation costs to those who benefit. Evaluation criteria are: do the costs to individual taxpayers reflect the benefits they receive from the transportation service or facility; do these same costs reflect the impact the user has on the transportation service or facility; do the costs reflect geographic variations in the state, including such things as access to multi-modal transportation choices, needs, highway types, and levels of use; and what is the cost impact on low tax base communities and would they be disproportionate.
Local. Allows for viable local transportation funding options that recognize the distinct needs of different local systems. Evaluation criteria are: does the funding method provide a revenue stream that could, by legislative authorization, be distributed to local systems; does it provide an opportunity for the legislature to authorize viable local options; and does it promote continuity of the transportation system by reducing inter-jurisdictional barriers.
The evaluation framework is summarized in the exhibit below.

Implementing Alternative Transportation Funding Methods Draft Final Report
Dec. 2, 2009 DRAFT 35
Exhibit 12. Evaluation Framework
GOAL: Develop a package of funding tools that the legislature can consider to meet transportation funding objectives.
THRESHOLD CRITERIA: Does the funding method meet the following two criteria? If not, it will not be evaluated.
The funding method is an appropriate state level fee or tax.
The funding method has a nexus with transportation.
Revenue StreamProvide a stream of revenue commensurate with transportation system funding needs.
Public Benefit -Reflects Use
Provide a clear purpose and policy rationale linked to transportation system use, economic development and other state policies and goals.
EquitableFunding burden is geographically equitable and equitably allocates the costs to those who benefit.
LocalAllows for viable local transportation funding options that recognize the distinct needs of different local systems.
Revenue Stream
Revenue potential
Responsive to inflation & growth
Stable & predictable
Administration
Collection cost
Federal compatibility
Public Benefit -Reflects Use
Link to transportation service or facility
Reflects use
Available to fund a full range of transportation choices
Positively affects transportation system performance & other state policies & goals
Creates and grows system connections
OBJECTIVES
EVALUATION CRITERIA BY OBJECTIVE
Equitable
Costs reflect user benefits
Costs reflect user impact
Costs reflect geographic variation
Cost impact on low tax base communities
Local
Provides revenue stream that could support local systems
Provides an opportunity for viable local options
Promotes continuity of transportation system
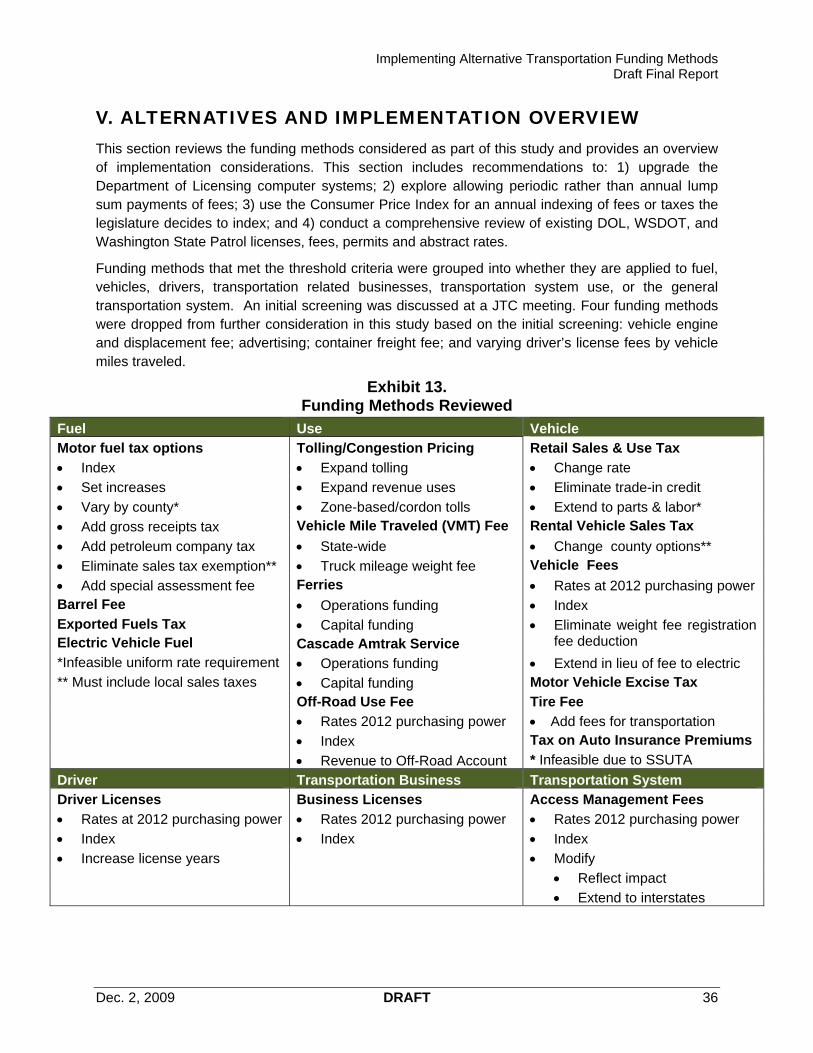
Implementing Alternative Transportation Funding Methods Draft Final Report
Dec. 2, 2009 DRAFT 36
V. ALTERNATIVES AND IMPLEMENTATION OVERVIEW This section reviews the funding methods considered as part of this study and provides an overview of implementation considerations. This section includes recommendations to: 1) upgrade the Department of Licensing computer systems; 2) explore allowing periodic rather than annual lump sum payments of fees; 3) use the Consumer Price Index for an annual indexing of fees or taxes the legislature decides to index; and 4) conduct a comprehensive review of existing DOL, WSDOT, and Washington State Patrol licenses, fees, permits and abstract rates.
Funding methods that met the threshold criteria were grouped into whether they are applied to fuel, vehicles, drivers, transportation related businesses, transportation system use, or the general transportation system. An initial screening was discussed at a JTC meeting. Four funding methods were dropped from further consideration in this study based on the initial screening: vehicle engine and displacement fee; advertising; container freight fee; and varying driver’s license fees by vehicle miles traveled.
Exhibit 13. Funding Methods Reviewed
Fuel Use Vehicle Motor fuel tax options Tolling/Congestion Pricing Retail Sales & Use Tax
Index Expand tolling Change rate
Set increases Expand revenue uses Eliminate trade-in credit
Vary by county* Zone-based/cordon tolls Extend to parts & labor*
Add gross receipts tax Vehicle Mile Traveled (VMT) Fee Rental Vehicle Sales Tax
Add petroleum company tax State-wide Change county options**
Eliminate sales tax exemption** Truck mileage weight fee Vehicle Fees
Add special assessment fee Ferries Rates at 2012 purchasing power Barrel Fee Operations funding Index Exported Fuels Tax Electric Vehicle Fuel
Capital funding Cascade Amtrak Service
Eliminate weight fee registration fee deduction
*Infeasible uniform rate requirement Operations funding Extend in lieu of fee to electric ** Must include local sales taxes Capital funding Motor Vehicle Excise Tax
Off-Road Use Fee Tire Fee Rates 2012 purchasing power Add fees for transportation Index Tax on Auto Insurance Premiums
Revenue to Off-Road Account * Infeasible due to SSUTA
Driver Transportation Business Transportation System Driver Licenses Business Licenses Access Management Fees
Rates at 2012 purchasing power Rates 2012 purchasing power Rates 2012 purchasing power
Index Index Index
Increase license years Modify Reflect impact Extend to interstates
Implementing Alternative Transportation Funding Methods Draft Final Report
Dec. 2, 2009 DRAFT 37
A. Implementation There are implementation issues that affect an array of these funding alternatives, including;
Department of Licensing Computer System. The Department of Licensing (DOL) collects the fuel tax, most licenses, fees, permits, and abstract charges, and provides information that supports the Washington State Patrol and, through license plate recognition, tolling. The DOL computer system is antiquated and in need of replacement. A new vehicle system would cost approximately $30 million and a new fuel tax system an additional $8 million. Fundamental changes in funding methods would likely increase the cost of system replacement. Costs of improving the system can be recouped either by state financing or vendor financing. Some vendors are willing to provide a system with payment from per transaction fees. DOL estimates that complete replacement of these systems would take approximately four years.
Consultant Recommendation 1: The legislature should provide funding for DOL to begin upgrading its computer systems, with consideration given to paying for the system upgrades by building the cost into the fee structure.
Periodic payments. The state has historically renewed license tabs on an annual basis, including the collection of any local fees such as the motor vehicle excise tax collected by DOL for Sound Transit. The motor vehicle fuel tax is upon removal from the terminal rack, the fuel tax is included in the price of fuel at the pump. If, over time, the motor fuel tax declines and is replaced by any form of payment that requires a single annual payment this could create a hardship for taxpayers. If the state allows periodic payments (either quarterly or monthly) it would be easier for some taxpayers to comply. Issues that would have to be addressed in making periodic payments possible include: compliance with Article 5 of the state constitution which prohibits the state from lending its credit; computer system support; and potential extra staffing costs for DOL and county agents.
Consultant Recommendation 2: The legislature should explore the costs and benefits of allowing vehicle owners to make periodic payments of annual vehicle fees rather than one lump sum payment. This analysis should be conducted in conjunction with a review of the DOL computer systems.
Indexing. Eighty percent (80%) of the states’ direct transportation revenues are from flat rate taxes and fees. Indexing fees and taxes is an alternative that applies to fuel, vehicle, driver, transportation business, and system funding methods. If the legislature should decide to index any of these fees and taxes, issues arise as to which index to use, how often to adjust rates, rounding, and whether to establish a floor.
o Index. Ten (10) states index their motor vehicle fuel tax rate, with two using the consumer price index, four the wholesale fuel price index, and one each using the producer price index, the average cost of fuel, the retail price of fuel, or alternative fuels sold. California indexes its driver and vehicle licenses and permits to the California Consumer Price Index. A federal study recommended that the federal fuel tax, which is not indexed, be indexed to the transportation construction cost index.

Implementing Alternative Transportation Funding Methods Draft Final Report
Dec. 2, 2009 DRAFT 38
o How often to index. California adjusts its driver and vehicle licenses and permit fees annually. Of the 10 states that index the motor vehicle fuel tax, five do it annually, four semi-annually, and one quarterly.
o Rounding. When adjusting licenses and permit fees, California rounds to the nearest dollar. If the CPI adjustment is $.49 or less the fees does not change. If $.50 or more the fee is adjusted to the next dollar.
o Floor. To prevent drops in revenue the consultants recommend that the legislature establish base fees as a floor below which rates will not drop.
Consultant Recommendation 3: If the legislature decides to index fees or taxes the legislature should set base fees, use the CPI as the basis of an annual change with fees, other than the fuel tax, rounded to the nearest whole dollar.
Reviewing fees, licenses, permits & abstracts. The consultants found three issues with the existing vehicle, driver, business, and other fees, licenses, permits and abstracts charges.
o Fee adjustment. Because fees are not indexed, many of them have not been increased to keep pace with inflation. Some significant changes were made to fees in 2005 and some fees were adjusted in 2007. Many fees have not been adjusted for ten or more years, including a few that have not been adjusted since their adoption in the 1940s and 1950s.
o Accounts. Under the 18th amendment motor vehicle registration fee revenues are restricted to highway purposes. The legislature has directed some fees to motor vehicle fund accounts that are not motor vehicle registration fees (i.e. vehicle dealer fees) thereby restricting the use of these revenues to highway purposes.
o Initiative 960 compliance. If the legislature decides to increase fees or index them, compliance with initiative 960 will require that the legislature grant that authority each biennium to DOL or other affected agencies.
Consultant Recommendation 4. Existing DOL, WSDOT, and Washington State Patrol license, fees, permits and abstract rates should be reviewed to determine when the rates were last adjusted, what an inflation adjusted rate would be, and what discretionary restrictions have been placed on use of the fees. If the legislature elects to adjust fees annually by the CPI, the legislature should authorize the affected agencies to make the adjustments.
Streamlined Sales and Use Tax Agreement. The Streamlined Sales and Use Tax Agreement (SSUTA), a multi-state agreement, governs the application of sales and use tax in the state.
o Additional sales tax limitation. The state has imposed an additional sales and use tax on vehicle sales and leases and on the rental of motor vehicles. Section 308 of SSUTA exempts additional sales and use taxes on motor vehicles from the general requirement that the sales and use taxes be uniformly applied. Section 308 states that: “[n]o member state shall have multiple state sales and use tax rates on items of personal property or services . . . The provisions of this section do not apply to sales or use taxes levied on electricity, piped natural or artificial gas, or other heating fuels delivered by the seller, or the retail sale or transfer of motor vehicles, aircraft,

Implementing Alternative Transportation Funding Methods Draft Final Report
Dec. 2, 2009 DRAFT 39
watercraft, modular homes, manufactured homes, or mobile homes.” Extending the additional sales and use tax to parts and labor, which was considered in the study, would violate the SSUTA.
o Local sales tax rates. If the sales and use tax is extended to motor vehicle fuel, it must include both state and local sales tax. SSUTA Section 302 states that “the tax base for local jurisdictions shall be identical to the state tax base unless otherwise prohibited by federal law. This section does not apply to sales or use taxes levied on the retail sale or transfer of motor vehicles, aircraft, watercraft, modular homes, manufactured homes, or mobile homes.”

Implementing Alternative Transportation Funding Methods Draft Final Report
Dec. 2, 2009 DRAFT 40
VI. STATE FUNDING METHOD ANALYSIS This section reviews funding methods organized whether the tax or fee is applied to fuel, vehicles, drivers, transportation businesses, use of the system, or the general transportation system. The exhibit below summarizes the revenues and impacts on vehicle owners of the major options considered.
For each major funding option, a range for the potential increase in revenue over the 16-year legislative financial plan is provided, with the upper bound based on the November forecast assumptions and the lower bound based on the consultant risk scenario. The vehicle owner impacts are based on the expected improvements in fuel efficiency for each of the representative vehicle types and show how each major funding option changes the expected 2025 taxes and fees. These 2025 tax and fee levels can then be compared with the No Action and constant Purchasing Power estimates. For example, Scenario 1 which brings all driver and vehicle fees up-to-date, by escalating from 2005 to 2012 using CPI, would raise approximately $2.1billion in new revenue. The impact on the owner of a mid-size sedan would see their expected 2025 tax and fees increase from $241 to $263,which is still less than the current cost of $272 and much lower than $437, which is what it would take for the 2009 tax and fees to maintain the current purchasing power in 2025.
A. Fuel The motor vehicle fuel tax will, even under the consultants’ risk scenario, remain a significant revenue source during the 16-year plan period. The options considered for fees and taxes applied to fuel include: re-structuring the motor vehicle fuel tax, a barrel fee, an exported fuels tax, and applying a tax to electricity used by vehicles.
1. Restructure Motor Vehicle Fuel (Gasoline, Diesel and Special Fuels) Tax
Seven options were reviewed to restructure the motor vehicle fuel tax:
Index: Index the full 37.5 cpg motor vehicle fuel tax to the CPI and adjust annually.
Set increases. Increase the rate by a set amount each year. The analysis assumes a 1.0 cent per gallon (cpg) increase each year in the base 23 cpg.
Add a gross receipts tax as a percentage of the wholesale price of motor vehicle fuel. Connecticut applies a 7.53 percent gross receipts tax on the wholesale price of motor vehicle fuel. In Washington state, wholesalers are subject to the business and occupation tax at the rate of 0.484 percent. Any new and additional gross receipts tax on the wholesale price of fuel should be separately imposed on the wholesaler to avoid any conflict with existing business and occupation tax deductions. Affected taxpayers would be the 83 licensed gasoline distributors and 116 licensed diesel distributors in the state.12
Add a petroleum company tax as a flat rate to the wholesale price of motor vehicle fuel. New York has a 16.4 cpg petroleum business tax applied on the wholesale price. This tax would
12 Joint Legislative Accountability and Review Committee, Preliminary Report: 2008 Full Tax Preference Performance Reviews, p. 89.

Implementing Alternative Transportation Funding Methods Draft Final Report
Dec. 2, 2009 DRAFT 41
be administered by DOL in association with the motor vehicle fuel tax which is collected when fuel is delivered to the terminal rack from a refinery, pipeline, or barge.
Eliminate the sales tax exemption for motor vehicle fuel. Ten (10) states add sales tax to retail purchases of motor fuel ranging from 2 percent to 7 percent, or 4 to 8 cpg. Sales tax is applied to the retail price after state and/or federal excise taxes are deducted in four states. One state adds a sales tax only in areas where mass transit systems exist. Washington state sales and use tax revenues are deposited in the General Fund, which absent legislative action, would be the distribution of sales and use taxes applied to fuel sales. The Joint Legislative Review and Audit Committee’s (JLARC) 2009 Full Tax Preference Performance Review Report recommended that the fuel tax exemption remain in place. The Report also found that a sales and use tax on motor vehicle fuel would not be subject to the 18th amendment. To minimize collection costs DOR recommends that the sales tax be directly reflected in the metered pump price.
Add a special assessment fee. Vermont has a motor fuel infrastructure assessment – 2 percent of the average retail price of motor vehicle fuel. To distinguish the fee from a tax, the fee must be limited to use for a specific purpose. A special assessment fee would not be subject to the 18th amendment.
a. Implementation
From an implementation standpoint, the most straightforward alternatives to restructure the motor vehicle fuel tax are indexing and/or set increases in the flat rate. Indexing would allow the motor vehicle fuel tax to grow with inflation and increasing the flat fee would offset declining motor vehicle fuel consumption per capita.
A special assessment fee similar to the Vermont infrastructure assessment is the next most practical option. It would be a new fee and therefore more difficult to implement than modifying the existing motor vehicle fuel tax. The fee, unlike the motor vehicle fuel options, would not be subject to the 18th amendment and could be clearly distinguished from taxes that benefit the General Fund. The legislature would have to designate the purposes of the special fee and limit the use of the funds to that purpose.
The application of a tax to the wholesale price of motor fuel is less practical than adjusting the current motor vehicle tax rates because it would be a new tax. Ultimately such a tax would be reflected in the retail price.
Extending the sales and use tax to motor vehicle fuel by eliminating the current exemption would not benefit the state’s transportation funds unless the legislature took specific action to direct additional tax revenue to transportation. Transit agencies that receive local option sales tax revenues would benefit from the extension of the sales and use tax to motor vehicle fuel.
b. Revenues and Impact on Vehicle Owners: Indexing
Indexing the motor vehicle fuel tax using the CPI starting in 2012 would increase revenues from the amount forecasted in the TFRC’s November forecast by $6.8 billion and in the consultants’ risk scenario by $4.4 billion. By 2025 the indexing scenario would increase the gas tax rate from 37.5 cpg to 57.0 cpg.

Implementing Alternative Transportation Funding Methods Draft Final Report
Dec. 2, 2009 DRAFT 42
The exhibit below presents the results of the indexing scenario in terms of the estimated increase in revenues, the distribution of these revenues (assuming current distribution formulas) and the impact on vehicle owners.
The state funds that would receive the largest distributions from indexing to the CPI are the motor vehicle fund and the Nickel and TPA accounts. The ferry accounts that have deficits at the end of the 2023-25 biennium would receive in the risk scenario $80 million or 66% of the $128.1 million needed to balance the operations account and $64 million or 7% of the $936.3 million needed to balance the capital account.
Local jurisdictions would receive distributions of $1.4 billion under the existing distribution formula in the risk scenario or $2.2 billion using November forecast consumption estimates. In addition, San Juan and Island counties would receive an additional $27 million or $41 million in Capron refunds.
Vehicle owners would under this scenario pay less in 2025 adjusted dollars than they are paying in 2009.

Implementing Alternative Transportation Funding Methods Draft Final Report
Dec. 2, 2009 DRAFT 43
Exhibit 14. Revenue Yield, Distribution, and Driver Impacts, Index Fuel Tax (CPI)
REVENUE SOURCES
5 0
Current Policy
TRFC
Projection
(Nov. 2009)
Risk Scenario
(Higher Fleet
Turnover)
Scenario
Assumptions
Year
Started
TRFC Projection
(Nov. 2009)
Risk Scenario
(Higher Fleet
Turnover)
Fuel Use (Net) $0.375/ gallon $21,629M $19,392M
Index N/A CPI 2012 $6,630M $4,404M
Regular Increase (annual) N/A $0M $0M
Special Assessment fee N/A $0M $0M
Vehicle and Driver Fees
Drivers License Fee $25 every 5 years $599M $599M $0 $0M $0M
Commercial Drivers
& Other Drivers License Fees$55 every 5 years $803M $803M $0 $0M $0M
Registration Fee (passenger) $30 $2,558M $2,558M $0.00 $0.00M $0M
Passenger Weight Fee $10/$20/$30 $962M $962M $0 $0.00M $0M
Combined License/Weight Fee $3,040M $3,040M 0% $0.00M $0M
Sales and Use Tax 0.30% $677M $677M 0.0% $0M $0M
$30,266M $28,029M $6,630M $4,404M
REVENUE DISTRIBUTIONMotor Vehicle Fund $7,979M $7,393M $1,738M $1,155M
Multimodal Fund $1,694M $1,694M $0M $M
Nickel & TPA Accounts $8,239M $7,433M $2,387M $1,586MState Patrol $2,415M $2,415M $0M $MHighway Safety Fund $1,402M $1,402M $0M $MFerry Operations $619M $578M $121M $80MFerry Capital $312M $280M $96M $64MOther State Funds Combined $589M $544M $133M $88M
Fund Allocation To Be Determined $0M $M
State Level Transportation Total $23,249M $21,739M $4,475M $2,972M
Cities & Counties (excl. Capron) $6,847M $6,134M $2,115M $1,405MTransit $M $M $0M $MCapron distribution to counties $171M $157M $41M $27M
Local Jurisdictions Total $7,018M $6,290M $2,156M $1,432M
GRAND TOTAL $30,266M $28,029M $6,630M $4,404M
Current
No Action
Purchasing
Power Adj.
2009 2025 vs SUV/Pick‐up 2025 2025 vs SUV/Pick‐up
Compact $197 $175 46% $316 $237 44%
Mid Size $272 $241 63% $437 $329 62%
SUV/Pick‐up $437 $379 100% $701 $534 100%
Hybrid $151 $137 36% $242 $179 33%
Electric $77 $77 20% $123 $85 16%
Motorcycle $138 $124 33% $221 $162 30%
Freight: Medium $1,694 $1,456 n/a $2,718 $2,081 n/a
Freight: Heavy $2,865 $2,523 n/a $4,598 $3,447 n/a
Total Expected Revenue
FY 2009‐2025
Incremental Revenue
FY 2009‐2025
CURRENT SITUATION CURRENT SCENARIO
* Assumes 11,500 miles per year on passenger vehicles and fleet composition/fuel efficiency included in the Risk Scenario
Estimated Impacts by Vehicle Type
Total Annual Transportation Taxes and Fees Paid in Revenue Categories Shown Here *
No Action Current Scenario

Implementing Alternative Transportation Funding Methods Draft Final Report
Dec. 2, 2009 DRAFT 44
b. Revenues and Impact on Vehicle Owners: Annual Increases in motor vehicle fuel tax
Increasing the motor vehicle fuel tax by 1 cpg starting in 2012 would increase revenues from the amount forecasted in the TFRC’s November forecast by $3.9 billion and in the consultants’ risk scenario by $3.4 billion. By 2025 annual a 1 cpg increase would result in a gas tax rate of 51.5 cpg.
The exhibit below presents the results of a 1 cpg annual increase scenario in terms of the estimated increase in revenues, the distribution of these revenues (assuming the additional monies are distributed using the current $0.375 formulas) and the impact on vehicle owners.
Similar to the CPI indexing scenario, the state funds that would receive the largest distributions from a 1 cpg annual increase are the motor vehicle fund and the Nickel and TPA accounts. The ferry accounts that have deficits at the end of the 2023-25 biennium would receive in the risk scenario $61 million or 48% of the $128.1 million needed to balance the operations account and $49 million or 5% of the $936.3 million needed to balance the capital account.
Local jurisdictions would receive distributions of $1.1 billion under the existing distribution formula in the risk scenario or $1.3 billion using the November forecast consumption estimates. In addition, San Juan and Island counties would receive an additional $21 million or $24 million in Capron refunds.
Vehicle owners would under this scenario pay less in 2025 adjusted dollars than they are paying in 2009.

Implementing Alternative Transportation Funding Methods Draft Final Report
Dec. 2, 2009 DRAFT 45
Exhibit 15. Revenue Yield, Distribution, and Driver Impacts, $0.01 Annual Increase in Motor
Fuel Tax
REVENUE SOURCES
6 0
Current Policy
TRFC
Projection
(Nov. 2009)
Risk Scenario
(Higher Fleet
Turnover)
Scenario
Assumptions
Year
Started
TRFC Projection
(Nov. 2009)
Risk Scenario
(Higher Fleet
Turnover)
Fuel Use (Net) $0.375/ gallon $21,629M $19,392M
Index N/A $0M $0M
Regular Increase (annual) N/A $0.01 2012 $3,948M $3,379M
Special Assessment fee N/A $0M $0M
Vehicle and Driver Fees
Drivers License Fee $25 every 5 years $599M $599M $0 $0M $0M
Commercial Drivers
& Other Drivers License Fees$55 every 5 years $803M $803M $0 $0M $0M
Registration Fee (passenger) $30 $2,558M $2,558M $0.00 $0.00M $0M
Passenger Weight Fee $10/$20/$30 $962M $962M $0 $0.00M $0M
Combined License/Weight Fee $3,040M $3,040M 0% $0.00M $0M
Sales and Use Tax 0.30% $677M $677M 0.0% $0M $0M
$30,266M $28,029M $3,948M $3,379M
REVENUE DISTRIBUTIONMotor Vehicle Fund $7,979M $7,393M $1,035M $886M
Multimodal Fund $1,694M $1,694M $0M $M
Nickel & TPA Accounts $8,239M $7,433M $1,421M $1,216MState Patrol $2,415M $2,415M $0M $MHighway Safety Fund $1,402M $1,402M $0M $MFerry Operations $619M $578M $72M $61MFerry Capital $312M $280M $57M $49MOther State Funds Combined $589M $544M $79M $68M
Fund Allocation To Be Determined $0M $M
State Level Transportation Total $23,249M $21,739M $2,665M $2,280M
Cities & Counties (excl. Capron) $6,847M $6,134M $1,259M $1,078MTransit $M $M $0M $MCapron distribution to counties $171M $157M $24M $21M
Local Jurisdictions Total $7,018M $6,290M $1,284M $1,098M
GRAND TOTAL $30,266M $28,029M $3,948M $3,379M
Current
No Action
Purchasing
Power Adj.
2009 2025 vs SUV/Pick‐up 2025 2025 vs SUV/Pick‐up
Compact $197 $175 46% $316 $219 45%
Mid Size $272 $241 63% $437 $304 62%
SUV/Pick‐up $437 $379 100% $701 $491 100%
Hybrid $151 $137 36% $242 $167 34%
Electric $77 $77 20% $123 $83 17%
Motorcycle $138 $124 33% $221 $151 31%
Freight: Medium $1,694 $1,456 n/a $2,718 $1,904 n/a
Freight: Heavy $2,865 $2,523 n/a $4,598 $3,186 n/a
Total Expected Revenue
FY 2009‐2025
Incremental Revenue
FY 2009‐2025
CURRENT SITUATION CURRENT SCENARIO
* Assumes 11,500 miles per year on passenger vehicles and fleet composition/fuel efficiency included in the Risk Scenario
Estimated Impacts by Vehicle Type
Total Annual Transportation Taxes and Fees Paid in Revenue Categories Shown Here *
No Action Current Scenario

Implementing Alternative Transportation Funding Methods Draft Final Report
Dec. 2, 2009 DRAFT 46
c. Revenue and Impact on Vehicle Owners: Special Assessment
Adding a special assessment fee of 2% on the average retail price of motor starting in 2012 would increase revenues from the amount forecasted in the TFRC’s November forecast by $4.6 billion and in the consultants’ risk scenario by $4.1 billion. The 2% assessment would likely result in an additional $0.07-$0.08 cpg, depending upon the retail price of fuel.
The exhibit below presents the results of a 2% special assessment on fuel in terms of the estimated increase in revenues, the distribution of these revenues (assuming the additional monies are distributed using the current $0.375 formulas) and the impact on vehicle owners.
Unlike other fuel tax and fee scenarios, the special assessment would not be subject to the 18th amendment, and the legislature would have to designate fund distribution specifically.
Vehicle owners would under this scenario pay less in 2025 adjusted dollars than they are paying in 2009.

Implementing Alternative Transportation Funding Methods Draft Final Report
Dec. 2, 2009 DRAFT 47
Exhibit 16. Revenue Yield, Distribution and Driver Impacts
Special Assessment Fee
REVENUE SOURCES
1 0
Current Policy
TRFC
Projection
(Nov. 2009)
Risk Scenario
(Higher Fleet
Turnover)
Scenario
Assumptions
Year
Started
TRFC Projection
(Nov. 2009)
Risk Scenario
(Higher Fleet
Turnover)
Fuel Use (Net) $0.375/ gallon $21,629M $19,392M
Index N/A $0M $0M
Regular Increase (annual) N/A $0M $0M
Special Assessment fee N/A 2.0% 2012 $4,591M $4,075M
Vehicle and Driver Fees
Drivers License Fee $25 every 5 years $599M $599M $0 $0M $0M
Commercial Drivers
& Other Drivers License Fees$55 every 5 years $803M $803M $0 $0M $0M
Registration Fee (passenger) $30 $2,558M $2,558M $0.00 $0.00M $0M
Passenger Weight Fee $10/$20/$30 $962M $962M $0 $0.00M $0M
Combined License/Weight Fee $3,040M $3,040M 0% $0.00M $0M
Sales and Use Tax 0.30% $677M $677M 0.0% $0M $0M
$30,266M $28,029M $4,591M $4,075M
REVENUE DISTRIBUTIONMotor Vehicle Fund $7,979M $7,393M $0M $M
Multimodal Fund $1,694M $1,694M $0M $M
Nickel & TPA Accounts $8,239M $7,433M $0M $MState Patrol $2,415M $2,415M $0M $MHighway Safety Fund $1,402M $1,402M $0M $MFerry Operations $619M $578M $0M $MFerry Capital $312M $280M $0M $MOther State Funds Combined $589M $544M $0M $M
Fund Allocation To Be Determined $4,591M $4,075M
State Level Transportation Total $23,249M $21,739M $4,591M $4,075M
Cities & Counties (excl. Capron) $6,847M $6,134M $0M $MTransit $M $M $0M $MCapron distribution to counties $171M $157M $0M $M
Local Jurisdictions Total $7,018M $6,290M $0M $M
GRAND TOTAL $30,266M $28,029M $4,591M $4,075M
Current
No Action
Purchasing
Power Adj.
2009 2025 vs SUV/Pick‐up 2025 2025 vs SUV/Pick‐up
Compact $197 $175 46% $316 $209 47%
Mid Size $272 $241 63% $437 $295 67%
SUV/Pick‐up $437 $379 100% $701 $439 100%
Hybrid $151 $137 36% $242 $233 53%
Electric $77 $77 20% $123 $160 36%
Motorcycle $138 $124 33% $221 $149 34%
Freight: Medium $1,694 $1,456 n/a $2,718 $1,697 n/a
Freight: Heavy $2,865 $2,523 n/a $4,598 $2,881 n/a
Total Expected Revenue
FY 2009‐2025
Incremental Revenue
FY 2009‐2025
CURRENT SITUATION CURRENT SCENARIO
* Assumes 11,500 miles per year on passenger vehicles and fleet composition/fuel efficiency included in the Risk Scenario
Estimated Impacts by Vehicle Type
Total Annual Transportation Taxes and Fees Paid in Revenue Categories Shown Here *
No Action Current Scenario

Implementing Alternative Transportation Funding Methods Draft Final Report
Dec. 2, 2009 DRAFT 48
2. Barrel Fee
A barrel fee imposed on motor vehicle fuel and motor diesel fuel to be used in the state would be collected at the wholesale level. If the barrel fee is $1.00, and if costs are passed through to retail sales, the resulting cost increase at retail would be 2.4 cents per gallon (cpg) or the equivalent of that increase in the motor vehicle fuel tax.
a. Implementation
Implementation of the fee will require DOL to issue rules, which will require support from the Attorney General. As noted in a fiscal note to a 2009 House bill that proposed a barrel fee, “the rules are expected to be fairly controversial and somewhat complicated.”13 As with the assessment fee, a barrel fee would need to be for a specific purpose. A barrel fee would not be subject to the 18th amendment.
b. Revenues and Impact on Vehicle Owners:
At $1.00 per barrel, a barrel fee would generate $1.3 billion over the 16-year plan, assuming the fee was added in 2012. If the fee were indexed to the CPI and rose annually, the total generated would be $1.6 billion over the 16-year plan.
3. Exported Fuels Tax
Under existing state law (RCW 82.36.300 and RCW 82.38.180) motor vehicle fuel taxes paid on gasoline or special fuels that are exported from the state are refunded. Three states impose an exported fuels tax. Tennessee imposes an export tax of 1/20th of 1 cent per gallon on petroleum products which are stored in the state and are subsequently exported. Texas requires licensed suppliers to collect either the Texas tax or the destination state’s tax on fuel exported from the state. Florida collects its motor vehicle fuel tax on purchases of fuel by exporters from terminal suppliers who are not licensed to collect taxes in states of destination.
As proposed in HB 2277 in the 2009 session, the exception for exported fuels would be eliminated and the state would provide a credit to the exporter for the difference between Washington’s fuel tax rate and the fuel tax rate in the importing state’s fuel tax if the rate is less than Washington’s.
a. Implementation
Implementation of the fee will require the DOL to collect data on every state importing Washington fuel; recognize its fuel tax rates, amount of fuel imported, and the rate difference between Washington State’s fuel taxes and the importing state’s fuel taxes. Tax returns would need to be modified for out of state fuel importers and new forms would be required for Washington State fuel dealers exporting fuel to other states. DOL would have to modify its fuel tax system to collect the exported fuels tax, which would add costs to the replacement of the new system.
One issue with removing the exception is that it would have to meet interstate commerce restrictions. JLARC’s tax preference study recommended retaining the exemption for exported fuel even though it may be possible, depending on the structure of the tax, to provide a less than full exemption on exported fuel and still comply with interstate commerce.14
13 Bill 1614 HB Fiscal Note, p. 2. 14 House Bill 2277: Bill Analysis
Implementing Alternative Transportation Funding Methods Draft Final Report
Dec. 2, 2009 DRAFT 49
b. Revenue and Impact on Vehicle Owners
Total revenue from an exported fuels tax over the six-year period from 2009-15 was estimated in the fiscal note to HB 2277 in the 2009 session at $3.0 billion. While this tax is charged at the business level and would apply to fuel that is exported out-of-state, the tax would increase the cost of doing business in Washington and these costs will be passed on to consumers. Given that the specific fuel being taxed will be consumed outside of Washington, it is unclear the degree to which this tax would be passed on to Washington drivers. If the additional cost of the tax is spread over all of the gallons produced by local refineries, then some of the cost would likely be paid by Washington drivers.
4. Electric Vehicle Fuel
For natural gas and propane vehicles Washington State imposes an additional license fee in lieu of the special fuel tax. This rate does not apply to Plug-in hybrid electric vehicles (PHEV) or electric vehicles.
Taxing the electricity used by electric vehicles is possible if the use is separately metered. A recent US Department of Energy study suggests that charging stations will most likely be separately metered as a way for utilities to encourage off-peak charging by providing significant discounts in the evening hours or charging a significant premium during peak hours. For example, Pacific Gas & Electric (PG&E) in northern California offers a special, discounted rate for plug-in and other electric vehicle customers, the "Experimental Time-of-Use Low Emission Vehicle rate”. In single-family and multi-family residential settings this “typically requires the addition of a second meter that monitors the energy use of the electric vehicle separately from the household load.”15
a. Implementation
The Department of Revenue (DOR) administers the state utility tax. An additional tax on separately metered electricity could be collected, but collecting on some other basis such as by charging unit would be difficult. The largest issue with implementing a tax on electricity used to power electric vehicles is the rapidly evolving technology associated with these vehicles. The following technologies would complicate the collection of a tax on electricity use:
Vehicle-to-grid technologies. Researchers are developing "vehicle-to-grid" technologies that allow a two-way connection between the PHEV and the local utility grid. While the vehicle is plugged in and not in use, the utility could take advantage of the extra electrical storage capacity in the vehicle batteries to help meet peak electricity demand, provide grid support services, or respond to power outages. PHEV owners could get "paid" by the utility for use of their vehicles, which would only be used when needed and without negative effects on the vehicle battery's state of charge. Google.org's Recharge IT program is demonstrating vehicle-to-grid technologies.16
Pricing intelligence technology. There are several ways to monitor the electricity usage by a PHEV. Most references cite either a separate electric plug or smart charger as the source of information that can be transmitted to the electric provider (and hence to a taxing authority). The intelligence could also be in the vehicle itself, tied to the charger
15 Ibid., p. 20. 16 U.S. Department of Energy, Energy Efficiency and Renewable Energy, August 12, 2008.
Implementing Alternative Transportation Funding Methods Draft Final Report
Dec. 2, 2009 DRAFT 50
unit. In this case, there would need to be a process to transmit the relevant electricity information from the vehicle or to store it securely for later processing
Off-the-grid recharging systems. Research has been done to tie plug-in hybrids to alternative recharging systems. One of the more notable examples is to have plug-in hybrids recharged from rooftop photovoltaic systems. Such systems would have virtually zero emissions, but would be very problematic to tax. Presumably there could be other off-the-grid systems tied to wind, hydro or equivalent technologies. The consultants could not find information about the extent to which this off-the-grid approach to PHEV recharging could penetrate the market.
A fee on electric vehicle fuel could be subject to the 18th amendment which states: All excise taxes collected by the State of Washington on the sale, distribution or use of motor vehicle fuel shall be paid into the state treasury and placed in a special fund to be used exclusively for highway purposes. If a charge on metered electricity were to be regarded as an excise tax on the sale, distribution, or use of motor vehicle fuel, it would be subject to the 18th amendment.
b. Revenue and Vehicle Owner Impact
Taxing electricity used by vehicles does not appear to be a practical alternative given the rapidly evolving PHEV technology. Potential revenue and vehicle owner impacts have not been calculated.
B. Vehicles Options for state funding methods that impose taxes or fees on vehicles are: increasing the retail sales and use tax on motor vehicles; modifications to the motor vehicle fees; a motor vehicle excise tax; a tire tax and a tax on auto insurance premiums.
1. Retail Sales and Use Tax on Motor Vehicles
With passage of the Nickel program, effective July 1, 2003 the state imposed an additional17 retail sales and use tax of 0.3 percent on every retail sale, lease or transfer of a motor vehicle, other than retail car rentals which are subject to the retail car rental tax. The tax is imposed on the net purchase price of the vehicle (i.e. net of trade-in value in accordance with RCW 82.08.010) and charges for all extra features added to the vehicle prior to delivery to the buyer or lessee. It does not apply to amounts charged for post-sale/delivery equipment and installation, sale of trailers, amounts charged for repairs of motor vehicles, and to sales of motor vehicles not subject to sales tax (i.e. sales to carriers engaged in interstate commerce, sales to the U.S. government). Until January 1, 2011, the additional retail sales and use tax does not apply to the sale of new passenger cars, light duty trucks, and medium duty passenger vehicles which utilize hybrid technology and have a US Environmental Protection Agency estimated highway gasoline mileage rating of at least 40 miles per gallon.18
Proceeds from the additional retail sales and use tax are deposited in the multimodal transportation account.19
17 The tax is in addition to all other state sales and use taxes. 18 Washington State Department of Revenue, Special Note Motor Vehicle Sales and Use Tax Rate Increase, June 17, 2003 and RCW 82.08.020. 19 Proceeds from the state retail sales and use tax of 6.5 percent are deposited in the general fund.
Implementing Alternative Transportation Funding Methods Draft Final Report
Dec. 2, 2009 DRAFT 51
Two options to restructure the sales and use tax were considered:
Increase the rate. This analysis shows the effect of increasing the additional sales and use tax rate to 0.5 percent.
Eliminate the trade-in credit. RCW 82.08.010 applies sales tax to “the total amount of consideration, except separately stated trade-in property of like kind”. (Section (1)(a) Eliminating the trade-in credit would be applicable to the 6.5 percent state sales tax as well as to the additional sales tax that funds transportation.
a. Implementation
The sales and use tax is currently collected. Increasing the rate and/or eliminating the trade-in credit would not affect the collection method.
b. Revenue and Impact on Vehicle Owners
The 16-year plan assumes revenues of $717 from the additional sales and use tax based on the March forecast or $677 million in the November forecast. Increasing the tax to 0.5 percent would generate an additional $412.million if the increase started in FY 12 and eliminating the trade-in credit would generate an additional $787 million in transportation funds.
All revenues would benefit the multimodal fund. Vehicle owners would pay less in 2025 than they are paying in 2009 under this scenario.
The exhibit below shows the revenue, distributions, and impacts on vehicle owners of increase the sales and use tax to 0.5 percent in 2012.

Implementing Alternative Transportation Funding Methods Draft Final Report
Dec. 2, 2009 DRAFT 52
Exhibit 17. Revenue Yield, Distribution and Driver Impacts
Raise State Special Sales Tax from 0.3% to 0.5%
2.
REVENUE SOURCES
14 0
Current Policy
TRFC
Projection
(Nov. 2009)
Risk Scenario
(Higher Fleet
Turnover)
Scenario
Assumptions
Year
Started
TRFC Projection
(Nov. 2009)
Risk Scenario
(Higher Fleet
Turnover)
Fuel Use (Net) $0.375/ gallon $21,629M $19,392M
Index N/A $0M $0M
Regular Increase (annual) N/A $0M $0M
Special Assessment fee N/A $0M $0M
Vehicle and Driver Fees
Drivers License Fee $25 every 5 years $599M $599M $0 $0M $0M
Commercial Drivers
& Other Drivers License Fees$55 every 5 years $803M $803M $0 $0M $0M
Registration Fee (passenger) $30 $2,558M $2,558M $0.00 $0.00M $0M
Passenger Weight Fee $10/$20/$30 $962M $962M $0 $0.00M $0M
Combined License/Weight Fee $3,040M $3,040M 0% $0.00M $0M
Sales and Use Tax 0.30% $677M $677M 0.5% 2012 $412M $412M
$30,266M $28,029M $412M $412M
REVENUE DISTRIBUTIONMotor Vehicle Fund $7,979M $7,393M $0M $M
Multimodal Fund $1,694M $1,694M $412M $412M
Nickel & TPA Accounts $8,239M $7,433M $0M $MState Patrol $2,415M $2,415M $0M $MHighway Safety Fund $1,402M $1,402M $0M $MFerry Operations $619M $578M $0M $MFerry Capital $312M $280M $0M $MOther State Funds Combined $589M $544M $0M $M
Fund Allocation To Be Determined $0M $M
State Level Transportation Total $23,249M $21,739M $412M $412M
Cities & Counties (excl. Capron) $6,847M $6,134M $0M $MTransit $M $M $0M $MCapron distribution to counties $171M $157M $0M $M
Local Jurisdictions Total $7,018M $6,290M $0M $M
GRAND TOTAL $30,266M $28,029M $412M $412M
Current
No Action
Purchasing
Power Adj.
2009 2025 vs SUV/Pick‐up 2025 2025 vs SUV/Pick‐up
Compact $200 $175 46% $321 $179 46%
Mid Size $278 $241 63% $445 $248 64%
SUV/Pick‐up $442 $379 100% $710 $387 100%
Hybrid $155 $137 36% $249 $143 37%
Electric $83 $77 20% $132 $86 22%
Motorcycle $140 $124 33% $224 $127 33%
Freight: Medium $1,705 $1,456 n/a $2,736 $1,471 n/a
Freight: Heavy $2,898 $2,523 n/a $4,651 $2,570 n/a
Total Expected Revenue
FY 2009‐2025
Incremental Revenue
FY 2009‐2025
CURRENT SITUATION CURRENT SCENARIO
* Assumes 11,500 miles per year on passenger vehicles and fleet composition/fuel efficiency included in the Risk Scenario
Estimated Impacts by Vehicle Type
Total Annual Transportation Taxes and Fees Paid in Revenue Categories Shown Here *
No Action Current Scenario
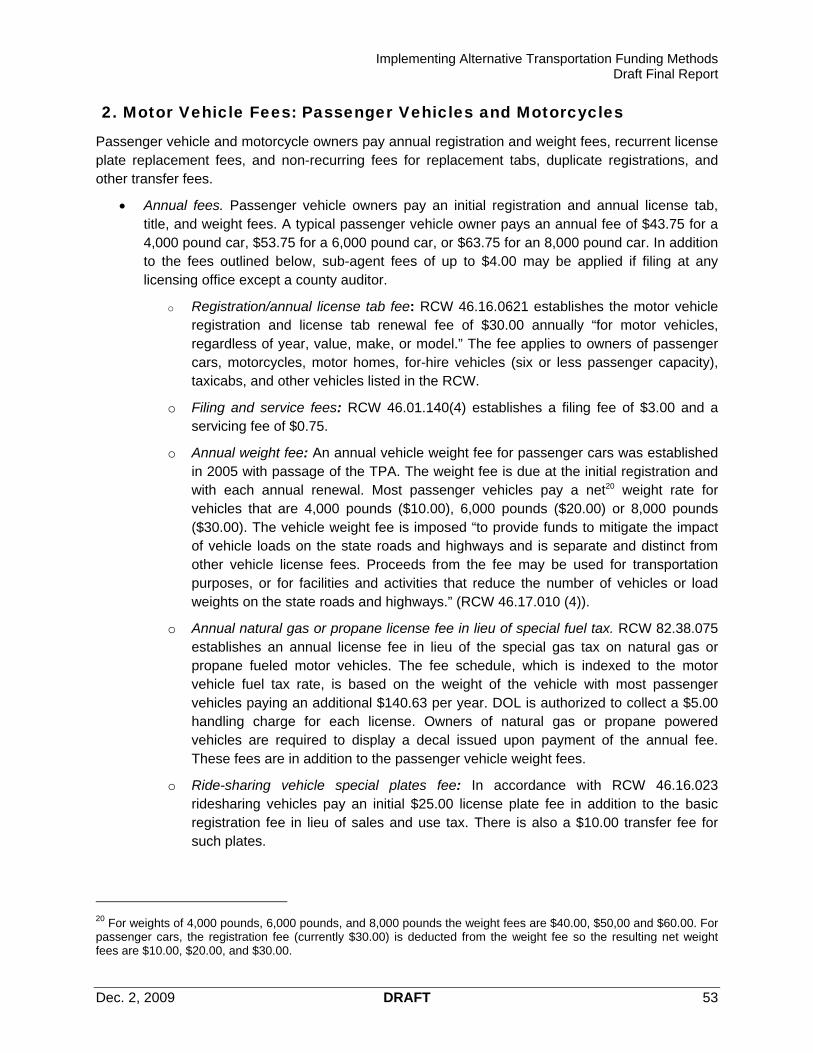
Implementing Alternative Transportation Funding Methods Draft Final Report
Dec. 2, 2009 DRAFT 53
2. Motor Vehicle Fees: Passenger Vehicles and Motorcycles
Passenger vehicle and motorcycle owners pay annual registration and weight fees, recurrent license plate replacement fees, and non-recurring fees for replacement tabs, duplicate registrations, and other transfer fees.
Annual fees. Passenger vehicle owners pay an initial registration and annual license tab, title, and weight fees. A typical passenger vehicle owner pays an annual fee of $43.75 for a 4,000 pound car, $53.75 for a 6,000 pound car, or $63.75 for an 8,000 pound car. In addition to the fees outlined below, sub-agent fees of up to $4.00 may be applied if filing at any licensing office except a county auditor.
o Registration/annual license tab fee: RCW 46.16.0621 establishes the motor vehicle registration and license tab renewal fee of $30.00 annually “for motor vehicles, regardless of year, value, make, or model.” The fee applies to owners of passenger cars, motorcycles, motor homes, for-hire vehicles (six or less passenger capacity), taxicabs, and other vehicles listed in the RCW.
o Filing and service fees: RCW 46.01.140(4) establishes a filing fee of $3.00 and a servicing fee of $0.75.
o Annual weight fee: An annual vehicle weight fee for passenger cars was established in 2005 with passage of the TPA. The weight fee is due at the initial registration and with each annual renewal. Most passenger vehicles pay a net20 weight rate for vehicles that are 4,000 pounds ($10.00), 6,000 pounds ($20.00) or 8,000 pounds ($30.00). The vehicle weight fee is imposed “to provide funds to mitigate the impact of vehicle loads on the state roads and highways and is separate and distinct from other vehicle license fees. Proceeds from the fee may be used for transportation purposes, or for facilities and activities that reduce the number of vehicles or load weights on the state roads and highways.” (RCW 46.17.010 (4)).
o Annual natural gas or propane license fee in lieu of special fuel tax. RCW 82.38.075 establishes an annual license fee in lieu of the special gas tax on natural gas or propane fueled motor vehicles. The fee schedule, which is indexed to the motor vehicle fuel tax rate, is based on the weight of the vehicle with most passenger vehicles paying an additional $140.63 per year. DOL is authorized to collect a $5.00 handling charge for each license. Owners of natural gas or propane powered vehicles are required to display a decal issued upon payment of the annual fee. These fees are in addition to the passenger vehicle weight fees.
o Ride-sharing vehicle special plates fee: In accordance with RCW 46.16.023 ridesharing vehicles pay an initial $25.00 license plate fee in addition to the basic registration fee in lieu of sales and use tax. There is also a $10.00 transfer fee for such plates.
20 For weights of 4,000 pounds, 6,000 pounds, and 8,000 pounds the weight fees are $40.00, $50,00 and $60.00. For passenger cars, the registration fee (currently $30.00) is deducted from the weight fee so the resulting net weight fees are $10.00, $20.00, and $30.00.

Implementing Alternative Transportation Funding Methods Draft Final Report
Dec. 2, 2009 DRAFT 54
o Specialized plates. Personalized plate fees are charged an additional amount, including $40.00 for the initial plates, $30.00 for the annual renewal, $10.00 for a transfer fee, and $2.00 for a wildlife rehabilitation fee.
Recurring Fees: Passenger vehicle owners pay a license plate replacement fee every seven years and an additional reflectorized plate fee.
o License plate replacement & reflectorized plate fee. RCW 46.16.233 provides for the periodic replacement of license plates with “frequency of replacement established in accordance with empirical studies documenting the longevity of the reflective materials used to make license plates.” DOL requires the replacement of plates every seven years. In addition, RCW 46.16.237 requires the payment of an additional $2.00 per plate as a reflectorized plate fee. The fees for plate replacement are $10.00 per plate and $2.00 per motorcycle plate. The plate reflectivity fee is $2.00 per plate. Owners are also required to pay an additional $3.75 in fees, including $3.00 filing fee, a $0.50 DOL services fee, and a $0.25 license plate technology fee. The total fee is $27.75 for a vehicle with two plates, $7.75 for a motorcycle, and $15.75 for trailers and vehicles with one plate.
o Retention of license plate number fee. In addition, owners can pay an additional $20.00 to retain the same license plate number.
Non-recurring fees. State fees collected on a non-recurring basis from passenger vehicle owners range from $0.50 for replacement tabs to $15.00 for a change in certificate of ownership.
The exhibit below summarizes the fees charged to passenger vehicle owners, where revenues are deposited, and when the fees were last modified.
Exhibit 18. Summary of Passenger Vehicle Fees
Fee Rate Account Transportation Fund
Rate Last Modified
Annual Fees
Registration/Annual License Tabs $30.00
$20.35 State Patrol $2.02 Ferry Operations $7.63 Motor Vehicle
Motor Vehicle
2000
Filing Fee $ 3.00 County agent/DOL 2000
Servicing Fee $ 0.75$0.50 DOL Service $0.25 License plate
technology
Motor Vehicle n/a 2000
Weight Fee $10- $30.00$3 million/yr –
Freight Mobility Rest - Multimodal
Multimodal 2005 (TPA)
Natural Gas/Propane Vehicle Fee $140.63 Motor Vehicle Motor Vehicle 198321
21 Indexed to the fuel tax

Implementing Alternative Transportation Funding Methods Draft Final Report
Dec. 2, 2009 DRAFT 55
Fee Rate Account Transportation Fund
Rate Last Modified
Ridesharing License Plate Fee $25.00 Motor Vehicle Motor Vehicle 1987 Specialized Plates - Initial $40.00 Wildlife n/a Specialized Plates - Annual $30.00 Wildlife n/a Specialized Plates – Transfer $10.00 Motor Vehicle Motor Vehicle Specialized Plates – Wildlife Rehab $2.00 Wildlife n/a Recurrent Fees License Plate Replacement – Car22 $10.00/plate Motor Vehicle Motor Vehicle 2005 (TPA) License Plate Replac- Motorcycle $2.00/plate Motor Vehicle Motor Vehicle 2005 (TPA) Retention of Same Number $20.00 Multimodal Multimodal 2003 (Nickel) Non-Recurrent Fees (also pay filing fees in addition) Replacement Tabs $0.50 Motor Vehicle Motor Vehicle Duplicate Registration $1.25 Motor Vehicle Motor Vehicle Duplicate Title $5.00 Motor Vehicle Motor Vehicle Title Transfer $5.00 Motor Vehicle Motor Vehicle Fee to Change Name $5.00 Motor Vehicle Motor Vehicle Certificate of Ownership $5.00 Nickel Motor Vehicle 2003 (Nickel) Certificate of Ownership – if previously registered in another state
$15.00Motor Vehicle Motor Vehicle
2002
Inspection with Certificate $65.00 Motor Vehicle Motor Vehicle 2002
Four options were reviewed for passenger vehicles:
Increase rate. The analysis is based on increasing rates to 2012 purchasing power.
Index fees. Annual indexing to the CPI.
Eliminate registration deduction for weight fee. This would have the effect of increasing the weight fees on passenger vehicles by $30.00.
Extend in lieu of special gas tax fee to Electric vehicles and other high mileage vehicles. High mileage vehicles could be defined as any getting more than 40 mpg, which would be the same definition used in the sales and use tax exemption for hybrids that sunsets in January 2011.
a. Implementation
Fees are collected by DOL. Study recommendations regarding improvements to the DOL computer system and allowing taxpayers to pay on a recurring basis are relevant to these fees. None of the options analyzed would modify DOL’s business rules and could be implemented as the computer system is replaced.
b. Revenue and Impact on Vehicle Owners
Passenger vehicle registration fees are anticipated to generate $2.6 billion in revenue in the 16-year plan. Modifying the rates and indexing them to keep pace with inflation would increase total
22 Also charged at the same time $4.00 reflectivity fee ($2.00 per plate); $3.00 filing fee; $0.50 DOL service fee; and $0.25 license plate technology fee.
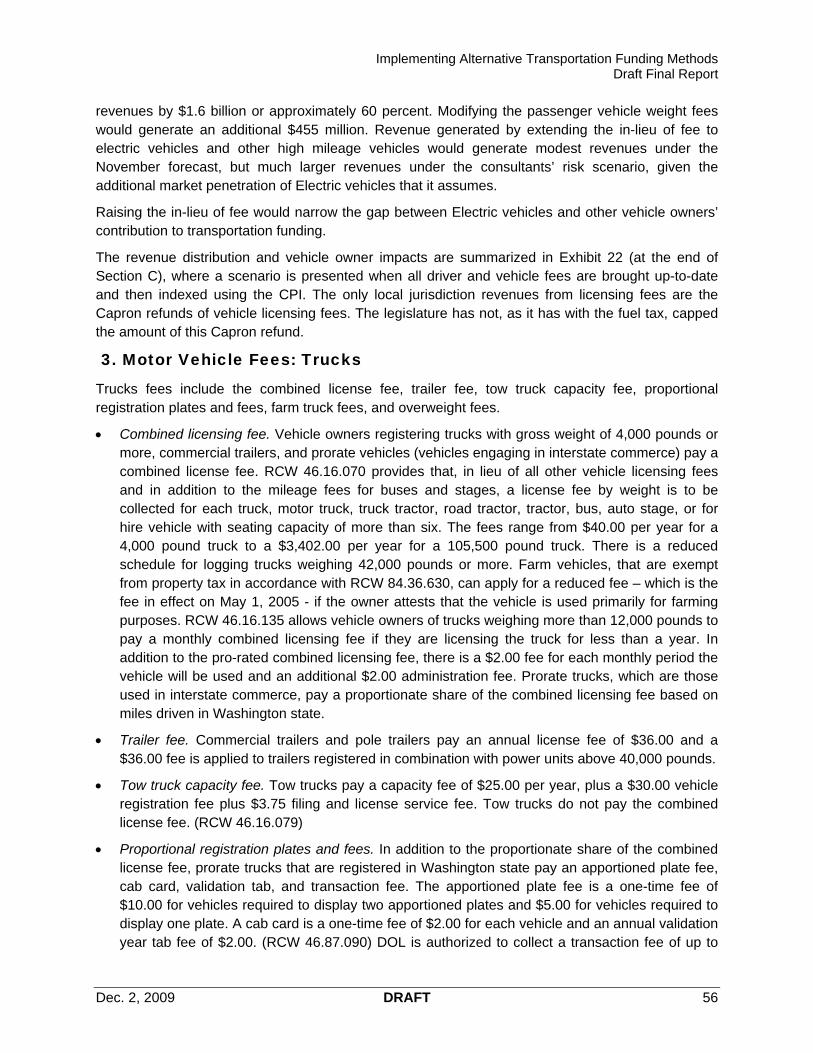
Implementing Alternative Transportation Funding Methods Draft Final Report
Dec. 2, 2009 DRAFT 56
revenues by $1.6 billion or approximately 60 percent. Modifying the passenger vehicle weight fees would generate an additional $455 million. Revenue generated by extending the in-lieu of fee to electric vehicles and other high mileage vehicles would generate modest revenues under the November forecast, but much larger revenues under the consultants’ risk scenario, given the additional market penetration of Electric vehicles that it assumes.
Raising the in-lieu of fee would narrow the gap between Electric vehicles and other vehicle owners’ contribution to transportation funding.
The revenue distribution and vehicle owner impacts are summarized in Exhibit 22 (at the end of Section C), where a scenario is presented when all driver and vehicle fees are brought up-to-date and then indexed using the CPI. The only local jurisdiction revenues from licensing fees are the Capron refunds of vehicle licensing fees. The legislature has not, as it has with the fuel tax, capped the amount of this Capron refund.
3. Motor Vehicle Fees: Trucks
Trucks fees include the combined license fee, trailer fee, tow truck capacity fee, proportional registration plates and fees, farm truck fees, and overweight fees.
Combined licensing fee. Vehicle owners registering trucks with gross weight of 4,000 pounds or more, commercial trailers, and prorate vehicles (vehicles engaging in interstate commerce) pay a combined license fee. RCW 46.16.070 provides that, in lieu of all other vehicle licensing fees and in addition to the mileage fees for buses and stages, a license fee by weight is to be collected for each truck, motor truck, truck tractor, road tractor, tractor, bus, auto stage, or for hire vehicle with seating capacity of more than six. The fees range from $40.00 per year for a 4,000 pound truck to a $3,402.00 per year for a 105,500 pound truck. There is a reduced schedule for logging trucks weighing 42,000 pounds or more. Farm vehicles, that are exempt from property tax in accordance with RCW 84.36.630, can apply for a reduced fee – which is the fee in effect on May 1, 2005 - if the owner attests that the vehicle is used primarily for farming purposes. RCW 46.16.135 allows vehicle owners of trucks weighing more than 12,000 pounds to pay a monthly combined licensing fee if they are licensing the truck for less than a year. In addition to the pro-rated combined licensing fee, there is a $2.00 fee for each monthly period the vehicle will be used and an additional $2.00 administration fee. Prorate trucks, which are those used in interstate commerce, pay a proportionate share of the combined licensing fee based on miles driven in Washington state.
Trailer fee. Commercial trailers and pole trailers pay an annual license fee of $36.00 and a $36.00 fee is applied to trailers registered in combination with power units above 40,000 pounds.
Tow truck capacity fee. Tow trucks pay a capacity fee of $25.00 per year, plus a $30.00 vehicle registration fee plus $3.75 filing and license service fee. Tow trucks do not pay the combined license fee. (RCW 46.16.079)
Proportional registration plates and fees. In addition to the proportionate share of the combined license fee, prorate trucks that are registered in Washington state pay an apportioned plate fee, cab card, validation tab, and transaction fee. The apportioned plate fee is a one-time fee of $10.00 for vehicles required to display two apportioned plates and $5.00 for vehicles required to display one plate. A cab card is a one-time fee of $2.00 for each vehicle and an annual validation year tab fee of $2.00. (RCW 46.87.090) DOL is authorized to collect a transaction fee of up to

Implementing Alternative Transportation Funding Methods Draft Final Report
Dec. 2, 2009 DRAFT 57
$10.00 each time a vehicle is added to the Washington state fleet and each time the proportional registration of a Washington-based vehicle is renewed. DOL’s rate is $4.50.
Farm vehicle fees. Farm vehicles which make incidental use of the public roads are required by RCW 46.16.025 to have an identification decal. A one-time licensing fee of $5.00 is charged for the decal. Motor trucks, truck tractors, and tractors owned and operated by farmers must pay a gross weight fee annually. Payment for the special license is on the declared gross weight at the amounts established in 46.16.070 less $23.00, divide the difference by two and add $23.00. (RCW 46.16.090) As an alternative to the monthly combined licensing fee, motor trucks, truck tractors, and tractors owned and operated by farmers may, as an alternative to the first partial month of the license registration, operate the vehicle using a farm vehicle trip permit if the license gross weight does not exceed 80,000 pounds for a combination of vehicles, nor 40,000 pounds for a single-unit vehicle with three or more axles. Up to four permits may be authorized per year. Each permit costs $6.25.
Special permit fee for oversize/overweight fees. Overheight, overlength, overwidth, and overweight vehicles using state highways are subject to a special permit fee administered by WSDOT for each movement. There are special fee rates for farm vehicles and for logging trucks.
Trip permits. A trip permit fee is required for vehicle owners temporarily moving an unlicensed vehicle. The permit is generally used by commercial drivers who do not enter Washington frequently enough to use a prorated license. RCW 46.16.160 allows the permits for three consecutive days, with no more than three such licenses for a single vehicle during a 30-day period, except for recreational vehicles which are limited to two permits in a one-year period. The total cost of a trip permit fee is $20.00, $1.00 filing, $15.00 administrative fee, $1.00 excise tax, and $5.00 surcharge.
Special fuel trip permit. RCW 82.38.100 authorizes a special fuel single trip permit that is applied to special fuel users temporarily entering the state for commercial purposes. The three day permit is collected in lieu of the special fuel tax otherwise assessable for importing and using special fuels in Washington. The fee is $25.00, including a $1.00 filing fee kept by county auditors or licensing agents, a $10.00 administrative fee, a $9.00 excise tax, and a $5.00 surcharge.
Fee in lieu of special fuel tax. Natural gas and propane trucks also pay a weight based fee in lieu of the special fuel tax.
The exhibit below summarizes the fees charged to trucks, where revenues are deposited, and when the fees were last modified.
Exhibit 19. Summary of Truck Fees
Fee Rate Account Transportation Fund
Rate Last Modified
Combined licensing fee Varies $2.00 auditor after Motor Vehicle 2005 Trailer fee $36.00 22.360% State Patrol Motor Vehicle Gross weight fee on farm vehicles Varies 3.375% Ferry Ops Motor Vehicle 1995
Farm vehicle trip permits Varies 5.237% Nickel Motor Vehicle 2005 11.533% TPA Motor Vehicle
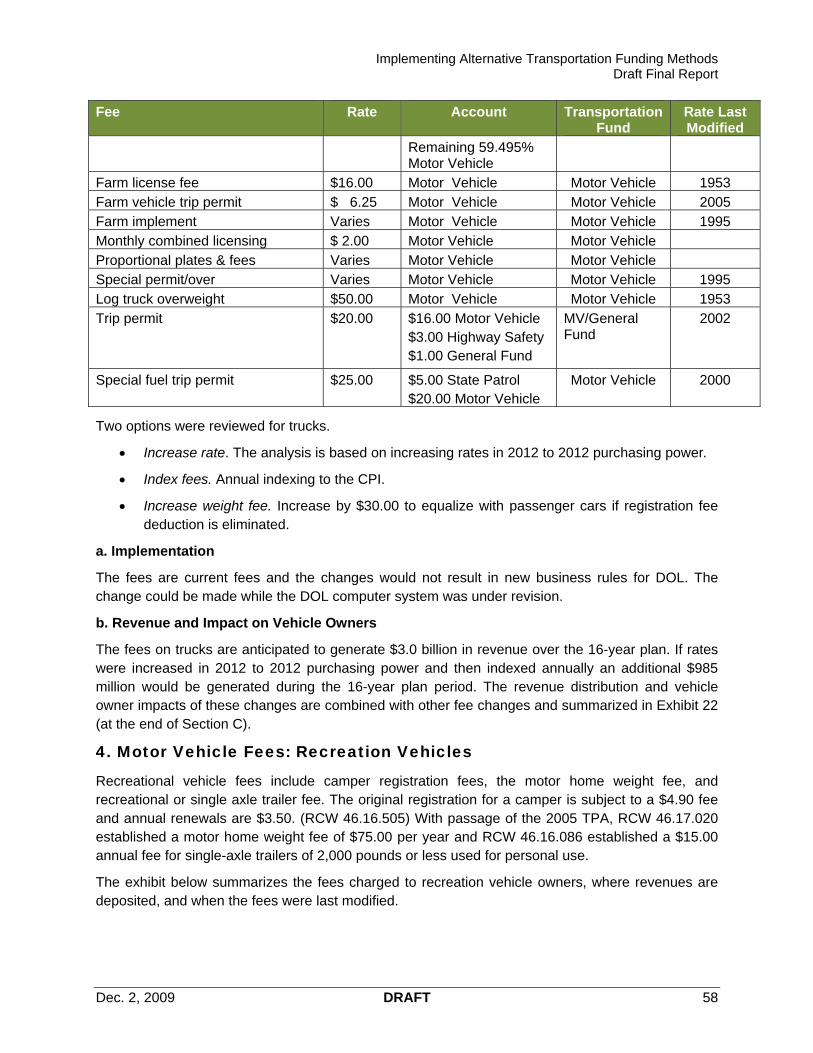
Implementing Alternative Transportation Funding Methods Draft Final Report
Dec. 2, 2009 DRAFT 58
Fee Rate Account Transportation Fund
Rate Last Modified
Remaining 59.495% Motor Vehicle
Farm license fee $16.00 Motor Vehicle Motor Vehicle 1953 Farm vehicle trip permit $ 6.25 Motor Vehicle Motor Vehicle 2005 Farm implement Varies Motor Vehicle Motor Vehicle 1995 Monthly combined licensing $ 2.00 Motor Vehicle Motor Vehicle Proportional plates & fees Varies Motor Vehicle Motor Vehicle Special permit/over Varies Motor Vehicle Motor Vehicle 1995 Log truck overweight $50.00 Motor Vehicle Motor Vehicle 1953 Trip permit $20.00 $16.00 Motor Vehicle
$3.00 Highway Safety $1.00 General Fund
MV/General Fund
2002
Special fuel trip permit $25.00 $5.00 State Patrol $20.00 Motor Vehicle
Motor Vehicle 2000
Two options were reviewed for trucks.
Increase rate. The analysis is based on increasing rates in 2012 to 2012 purchasing power.
Index fees. Annual indexing to the CPI.
Increase weight fee. Increase by $30.00 to equalize with passenger cars if registration fee deduction is eliminated.
a. Implementation
The fees are current fees and the changes would not result in new business rules for DOL. The change could be made while the DOL computer system was under revision.
b. Revenue and Impact on Vehicle Owners
The fees on trucks are anticipated to generate $3.0 billion in revenue over the 16-year plan. If rates were increased in 2012 to 2012 purchasing power and then indexed annually an additional $985 million would be generated during the 16-year plan period. The revenue distribution and vehicle owner impacts of these changes are combined with other fee changes and summarized in Exhibit 22 (at the end of Section C).
4. Motor Vehicle Fees: Recreation Vehicles
Recreational vehicle fees include camper registration fees, the motor home weight fee, and recreational or single axle trailer fee. The original registration for a camper is subject to a $4.90 fee and annual renewals are $3.50. (RCW 46.16.505) With passage of the 2005 TPA, RCW 46.17.020 established a motor home weight fee of $75.00 per year and RCW 46.16.086 established a $15.00 annual fee for single-axle trailers of 2,000 pounds or less used for personal use.
The exhibit below summarizes the fees charged to recreation vehicle owners, where revenues are deposited, and when the fees were last modified.

Implementing Alternative Transportation Funding Methods Draft Final Report
Dec. 2, 2009 DRAFT 59
Exhibit 20. Summary of Recreation Vehicle Fees
Fee Rate Account Transportation Fund
Rate Last Modified
Single axle trailer fee $15.00 $2.00 auditor after Motor Vehicle 2005 22.360% State Patrol
3.375% Ferry Ops
5.237% Nickel 11.533% TPA Remaining 59.495% Motor Vehicle
Camper registration $4.90 1st $3.50 renewal
TPA Motor Vehicle 1975
Motor home weight $75.00 TPA Motor Vehicle 2005
Two options were reviewed for recreational vehicles.
Increase rate. The analysis is based on increasing rates in 2012 to 2012 purchasing power.
Index fees. Annual indexing to the CPI.
Increase weight fee. Increase by $30.00 to equalize with passenger cars if registration fee deduction is eliminated.
a. Implementation
The fees are current fees and the changes would not result in new business rules for DOL. The change could be made while the DOL computer system was under revision.
b. Revenue and Impact on Vehicle Owners
The motor home weight fee is anticipated to generate $83 million in revenue over the 16-year plan. If rates were increased in 2012 to 2012 purchasing power and then indexed annually thereafter an additional $37 million would be generated during the 16-year plan period. The revenue distribution and vehicle owner impacts of these changes are combined with other fee changes and summarized in Exhibit 22 (at the end of Section C).
5. Motor Vehicle Excise Tax
The annual state motor vehicle excise tax (MVET) was repealed in the 2000 legislative session in response to a 1999 voter initiative. In the 1997-99 biennium the state collected $1.6 billion in motor vehicle excise taxes with a rate of 2.2 percent of the vehicle value (depreciation was statutorily defined), except for trucks over 40,000 pounds which were charged 2.78 percent of the value. Revenues generated were distributed as follows: transit districts 25%, State General Fund 20%, State Transportation Fund 16%, ferry system operating and capital 11%, and, cities and counties 14%. Total MVET revenues in the 1997-99 biennium for state transportation related purposes was $396 million dollars. Voter approval of Referendum 49 in 1998 reduced MVET rates, and the transfer of funds to the General Fund was eliminated after the 97-99 biennium. One year later in 1999, Initiative 695, which eliminated the MVET, was approved by the voters.

Implementing Alternative Transportation Funding Methods Draft Final Report
Dec. 2, 2009 DRAFT 60
Sound Transit imposes a 0.3 percent of value motor vehicle excise tax, which was kept in place when the MVET was repealed because bonds had been pledged against the revenues. The tax is administered by DOL and collected when a vehicle is first purchased and with the annual tab renewal. DOL uses the first published base Manufacturer's Suggested Retail Price (MSRP) of a vehicle for Sound Transit tax purposes.
The WSTC’s 2009 Long-Term Ferry Funding Study recommended that the legislature consider re-instating a state motor vehicle excise tax of 0.21 percent to close the Washington State Ferries (WSF) capital cap and eliminate administrative transfers of $1.1 billion from the motor vehicle and multimodal accounts to the Puget Sound ferries capital account.23 Prior to its repeal, the MVET provided the majority of WSF’s capital funds. Recognizing the difficulties of implementing a state-wide tax to pay only for WSF’s capital needs, the WSTC further recommended “that a multimodal funding package be developed with a portion of tax revenues allocated to various programs, including ferries, streets and highways, local transit, etc.”24
Three states have a vehicle personal property tax similar to the MVET: California, Kansas, and Virginia.
California: California bases its vehicle licensing fees on a percentage value of the automobile, which is in addition to the annual $34.00 registration fee. In May 2009 California increased the rate on automobiles, commercial vehicles under 10,001 pounds, motorcycles, and trailer coaches to 1.15 percent of the vehicle market value or vehicle purchase price amortized over eleven years. The previous rate of 0.65 percent remains in effect for commercial vehicles over 10,001 pounds.
Kansas: Kansas counties and the Unified School Districts of Kansas assess property taxes on personal property, including motor vehicles. The Kansas constitution governs the assessment and taxation of personal property, one subclass of which is motor vehicles. Motor vehicles are taxed based on 30 percent of their assessed value, with individual county mill rates then applied to that value. Motor vehicles are appraised by counties based on state guidelines.
Virginia: Virginia’s cities, counties, and towns are allowed to impose a vehicle personal property tax on automobiles, trucks, buses, motorcycles, motor homes, trailers, semi-trailers, and boats. The assessment is done by counties, with for example Arlington County basing its assessment on values in recognized vehicle pricing guides, such as the N.A.D.A. Used Car Guide. In 1998, the Commonwealth of Virginia revised the state statutes to provide property tax relief by exempting the first $20,000 of assessed value of cars, panel trucks, pick-up trucks, and motorcycles that are owned or leased by an individual and used for non-business purposes.
The option reviewed is:
State-wide MVET. Consistent with the WSTC recommendation, a motor vehicle excise tax to meet Ferries’ capital or other multi-modal needs as determined by the legislature was reviewed. The rate is assumed to be 0.21 percent.
23 Washington State Transportation Commission, Long-Term Ferry Funding Study, February 2009, p. 4-3. 24 Ibid., p. ES-11.

Implementing Alternative Transportation Funding Methods Draft Final Report
Dec. 2, 2009 DRAFT 61
a. Implementation
The tax is currently administered by DOL. It is relatively easy for the public to comply with, but as the initiative that led to its repeal shows it has been difficult for the public to accept. Issues that have arisen previously included the basis for valuation of the motor vehicles. The legislature could consider reducing the assessment basis and/or exempting a portion of the value from taxation as in Virginia. While potentially making the tax more acceptable, these changes would reduce revenues and could be confusing to Sound Transit District taxpayers. MVET revenues are not subject to the 18th amendment and are available to fund a variety of transportation choices.
b. Revenue and Impact on Vehicle Owners
The revenue potential for a motor vehicle excise tax is high, with the Sound Transit 2008 financial plan forecasting revenues of $1.8 billion during the 16-year financial plan period. At 0.21 percent, the MVET over a 22-year period is projected to raise $4.2 billion, per the 2009 Long-Term Ferry Funding Study .
6. Tire Fee
The State of Washington collects a fee of $1.00 for the retail sale of new replacement tires, the proceeds of which are deposited in the Waste Tire Removal Account in the Wildlife and Natural Resources Fund. RCW 70.95.521 as amended by the 2009 legislature provides that expenditures from the Waste Tire Removal Account may be used for the cleanup of unauthorized waste tire piles, measures that prevent future accumulation of unauthorized waste tire piles, and road wear related maintenance on state and local public highways. The legislation also requires that the state treasurer transfer any cash balance in excess of $1 million from the waste tire removal account to the motor vehicle account for the purpose of road wear related maintenance on state and local public highways.
Thirty-nine (39) states have a tire fee. Most states use the fee to support tire recycling or clean-up efforts. Three states use the tire fee to fund transportation. New Jersey has a $1.50 tire tax imposed on the sale of new tires, with approximately 80 percent of the revenue available for appropriation to the Department of Transportation to support snow removal operations. Pennsylvania charges a $1.00 tire tax on the sale of all tires in the state and all revenues are used to fund mass transit. New Mexico adds a $1.50 tire recycling fee to each vehicle registration and directs $1.00 of it to fund the Department of Transportation. Six states use the revenues generated in part or in whole for the general fund.
Twenty-eight (28) states including Washington collect the tire fee at retail. Of the 28 states that collected a tire fee at retail, approximately half apply the fee to tires that are sold as part of a new car sale and five charge a higher fee for truck or studded tires.
A tire fee is not subject to the 18th amendment. As currently directed by the legislature, transportation uses of the tire replacement fee are limited to road wear related maintenance on state and local public highways.
Options reviewed include:
Increase tire replacement fee to support transportation. The tire replacement fee could be increased with the increment used to support road wear related maintenance on state and local public highways or for other transportation purposes designated by the legislature. If

Implementing Alternative Transportation Funding Methods Draft Final Report
Dec. 2, 2009 DRAFT 62
increased by $1.00, the fee would be at or below the fee level for passenger cars in 10 states. The fee could be indexed to inflation.
Add a fee to the sale of vehicles with new tires. The tire replacement fee could be expanded to include a fee for the sale of tires that are sold as part of a motor vehicle as is done in approximately 50 percent of the states that collect a tire fee at retail.
Charge a higher tire fee for truck and studded tires. Charging a higher tire replacement fee for larger tires would reflect their greater impact on road maintenance.
a. Implementation
The tire fee is currently collected by the Department of Revenue. Collection costs would not increase if the fee were modified, but collection would have to be expanded to include car dealers if the fee were modified to include tires sold as part of a motor vehicle.
b. Revenue and Impact on Vehicle Owners
The current $1.00 tire replacement is expected to generate $86 million over the 16 year plan (assuming passenger vehicles replace an average of one tire per year). Raising this fee by $1.00, would generate an additional $86 million for transportation. Including a $1 per tire fee to the sale of new vehicles could generate approximately $15 million over the 16 year plan, and charging a higher fee for truck tires ($5 vs $1) could raise an additional $32 million over the 16 year plan.
7. Tax on Auto Insurance Premiums
RCW 48.14.020 imposes a 2 percent tax on insurance premiums in lieu of the state business and occupation tax. Revenue from the tax on casualty and property premiums, including auto coverages, is distributed to the state general fund.
The legislature could consider an additional special tax on auto insurance premiums to fund transportation, much as it has done with the additional 0.3 percent sales tax on vehicle sales. Such a tax would not be subject to the 18th amendment.
a. Implementation
The legislature would have to consider the potential impact on Washington state insurers of an increase in the insurance premium tax. Most states, including Washington, have a retaliatory provision in their insurance licensing laws. “As a consequence of the individual states’ power to enact non-uniform licensing insurance laws and each state’s interest in protecting its own domestic companies, most states have enacted “retaliatory” licensing provisions. These provisions basically state that if domestic insurers of state X are subjected in state Z to any fees or requirements in excess of what state X imposes on state Z’s domestic companies, then the requirements of state Z will be in state X to state Z’s domestic companies. For example, if state Z imposes a $5,000 license fee on state X’s domestic companies, then state X will also impose a $5,000 fee on any of state Z’s companies for a license (even if state X normally charges only $500.00 for such an application).” 25
Potential retaliation against Washington state insurers was an issue when SB 5296, a bill that would have added a $2.00 surcharge on some insurance policies to fund emergency management, was
25 Lencsis, Peter, Insurance Regulation in the United States: An Overview for Business and Government, 1997, p. 31.

Implementing Alternative Transportation Funding Methods Draft Final Report
Dec. 2, 2009 DRAFT 63
considered by the 2007 legislature.26 A review of other state insurance premiums indicates that Washington State is at the mid-point in its insurance premium tax, increasing the risk of retaliatory action against Washington state insurers.
The insurance premium tax is administered by the State Insurance Commissioner. There would be some minor additional administration to collect a differential fee for auto insurance premiums.
b. Revenue and Impact on Vehicle Owners
In 2007, total auto insurance premiums in the state were $4.25 billion. If an additional 0.3 percent tax were imposed on auto insurance premiums it would have net $12.7 million in 2007.27 Further analysis was not done because of the implementation issues involved with this tax.
C. Drivers Driver fees include driver licenses, identification cards, permits, and endorsements and special licenses. In addition, DOL charges for driver records or abstracts provided to drivers and/or insurance companies.
Driver Licenses/Identification Cards. Regular, enhanced, restricted and special driver licenses are issued for five year terms. Enhanced licenses can be used as a form of identification for border crossings. DOL also issues identification cards that do not allow the user to drive.
o Original State Drivers License or Identification Card. Forty-five dollars ($45.00), including $20.00 knowledge and/or driving test and $25.00 license fee. If the knowledge or drivers test is taken more than one time, there is an additional $20.00 fee. There is a $15.00 additional fee for an enhanced driver license. An identification card is $20.00.
o Driver or Identification Card Renewal: Twenty-five dollars ($25.00), or if more than 60 days late $35.00. A license can be extended for up to 12 months while the driver is out of state for $5.00. There is an addition fee of $15.00 to upgrade to enhanced license from a regular license. Identification card renewal is $20.00.
o Restricted or Special Licenses: One hundred dollars ($100.00) for occupational/restricted license. There is a fee of $100.00 for an ignition interlock license plus $20.00 per month; a $75.00 fee for a reissued driver license after suspension or revocation/$150.00 after alcohol related suspension or revocation, in addition to all other licensing fees; and a $50.00 fee for a probationary license after a DUI conviction or deferred prosecution
o Changes to License: There is a fee of $15.00 to replace a lost or stolen regular or enhanced license or an identification card and of $10.00 to change the name, address or photo on a regular or enhanced license or an identification card
26 Senate Bill Report SB 5296, 2007. 27 Washington State Office of the Insurance Commissioner, Annual Report Appendix A, Recapitulation of All Insurance Written in Washington State, p. A1.

Implementing Alternative Transportation Funding Methods Draft Final Report
Dec. 2, 2009 DRAFT 64
Instruction (Learners) Permit. An instruction permit costs $20.00, which includes two attempts to pass the knowledge exam. Additional knowledge exams have a fee of $20.00. There is a fee of $20.00 to renew an instruction permit, of $15.00 to replace a lost or stolen permit and of $10.00 to change the name, address or photo on the permit.
Motorcycle Endorsement. An endorsement permit is $15.00, which includes the endorsement knowledge test. Only one renewal of the permit is allowed. The original endorsement is $25.00 which includes a $5.00 application fee and $20.00 photo fee. Additional tests are $5.00. Renewal endorsement is $25.00 in addition to a regular driver license.
Commercial Driver License (CDL). A CDL permit is $10.00, with each general or endorsement knowledge test taken an additional $10.00. The skills test is $100.00 or if driving for Head Start or the Early Childhood Education and Assistance Program, $75.00. A hazardous materials endorsement is $10.00, plus $89.25 for fingerprinting and background check. A CDL endorsement can be added to a Washington driver license for $40.00 or a driver can pay $55.00 to transfer an out-of-state CDL endorsement to Washington. There is a $55.00 fee for renewing a CDL endorsement or $80.00 with CDL and motorcycle endorsements.
Agriculture Permits (Under 18 Years Old). Forty dollars ($40.00) including $20.00 for one knowledge test and one driving test. Additional knowledge or driving tests are $20.00. Renewals are $15.00.
Abstracts. DOL charges $10.00 for abstracts, which are copies of driving records.
The exhibit below summarizes driver fees, where revenues are deposited, and when the fees were last modified.
Exhibit 21. Summary of Driver Fees
Fee Rate Account Transport Fund
Rate Last Modified
Driver license – original, renewal Varies Highway Safety Multimodal 2000 Driver license - permit Varies Highway Safety Multimodal 2006 Driver license - duplicate $15.00 Highway Safety Multimodal 2002 Exam fee $20.00 Highway Safety Multimodal 2005 Extension fee $ 5.00 Highway Safety Multimodal Late renewal penalty $25.00 Highway Safety Multimodal 2000 Occupational license $100.00 Highway Safety Multimodal 2004 Enhanced license $15.00 Highway Safety Multimodal 2007 Identicards Varies Highway Safety Multimodal 2005
Motorcycle endorsements Varies Motorcycle Safety Multimodal 2002 Agricultural permits Varies Highway Safety Multimodal 2005
Reinstated licenses $75.00 Highway Safety Multimodal 2002 Reinstated DUI licenses $150.00 37% Multimodal Multimodal 1998 63% Impaired Driving
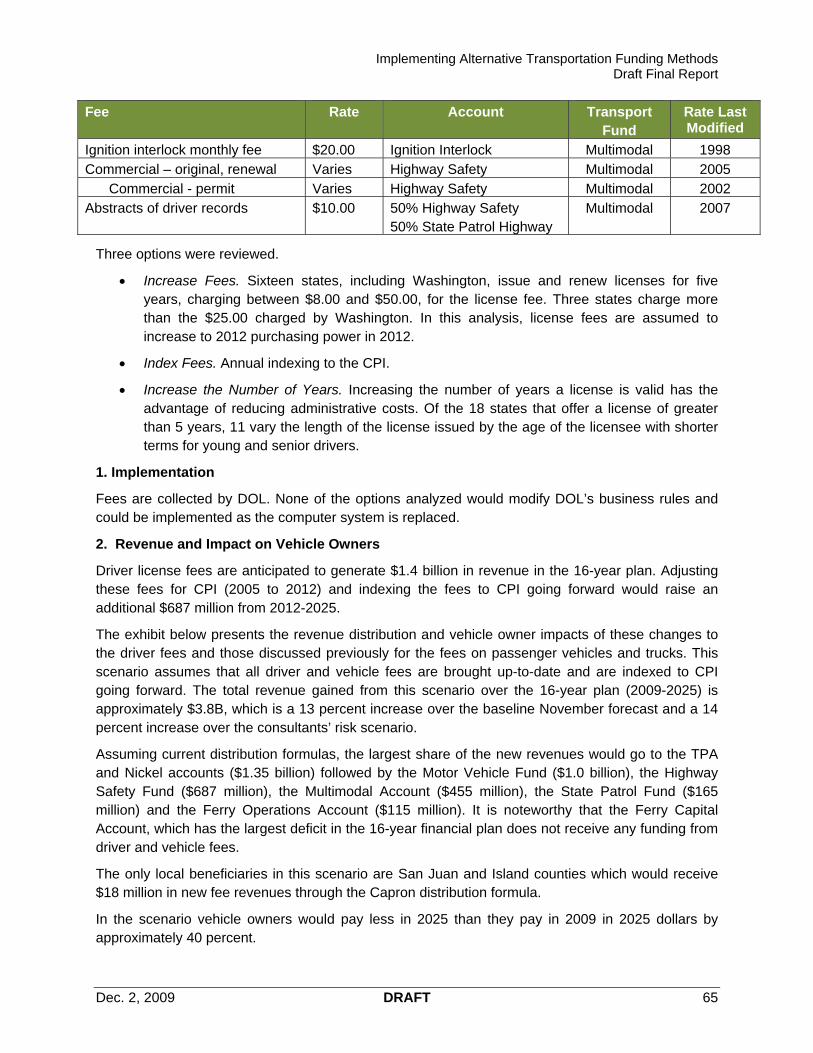
Implementing Alternative Transportation Funding Methods Draft Final Report
Dec. 2, 2009 DRAFT 65
Fee Rate Account Transport Fund
Rate Last Modified
Ignition interlock monthly fee $20.00 Ignition Interlock Multimodal 1998 Commercial – original, renewal Varies Highway Safety Multimodal 2005
Commercial - permit Varies Highway Safety Multimodal 2002 Abstracts of driver records $10.00 50% Highway Safety
50% State Patrol Highway Multimodal 2007
Three options were reviewed.
Increase Fees. Sixteen states, including Washington, issue and renew licenses for five years, charging between $8.00 and $50.00, for the license fee. Three states charge more than the $25.00 charged by Washington. In this analysis, license fees are assumed to increase to 2012 purchasing power in 2012.
Index Fees. Annual indexing to the CPI.
Increase the Number of Years. Increasing the number of years a license is valid has the advantage of reducing administrative costs. Of the 18 states that offer a license of greater than 5 years, 11 vary the length of the license issued by the age of the licensee with shorter terms for young and senior drivers.
1. Implementation
Fees are collected by DOL. None of the options analyzed would modify DOL’s business rules and could be implemented as the computer system is replaced.
2. Revenue and Impact on Vehicle Owners
Driver license fees are anticipated to generate $1.4 billion in revenue in the 16-year plan. Adjusting these fees for CPI (2005 to 2012) and indexing the fees to CPI going forward would raise an additional $687 million from 2012-2025.
The exhibit below presents the revenue distribution and vehicle owner impacts of these changes to the driver fees and those discussed previously for the fees on passenger vehicles and trucks. This scenario assumes that all driver and vehicle fees are brought up-to-date and are indexed to CPI going forward. The total revenue gained from this scenario over the 16-year plan (2009-2025) is approximately $3.8B, which is a 13 percent increase over the baseline November forecast and a 14 percent increase over the consultants’ risk scenario.
Assuming current distribution formulas, the largest share of the new revenues would go to the TPA and Nickel accounts ($1.35 billion) followed by the Motor Vehicle Fund ($1.0 billion), the Highway Safety Fund ($687 million), the Multimodal Account ($455 million), the State Patrol Fund ($165 million) and the Ferry Operations Account ($115 million). It is noteworthy that the Ferry Capital Account, which has the largest deficit in the 16-year financial plan does not receive any funding from driver and vehicle fees.
The only local beneficiaries in this scenario are San Juan and Island counties which would receive $18 million in new fee revenues through the Capron distribution formula.
In the scenario vehicle owners would pay less in 2025 than they pay in 2009 in 2025 dollars by approximately 40 percent.

Implementing Alternative Transportation Funding Methods Draft Final Report
Dec. 2, 2009 DRAFT 66
Exhibit 22. Revenue Yield, Distribution and Driver Impacts,
Bring All Fees Up-to-Date and Index to CPI
REVENUE SOURCES
9 Y
Current Policy
TRFC
Projection
(Nov. 2009)
Risk Scenario
(Higher Fleet
Turnover)
Scenario
Assumptions
Year
Started
TRFC Projection
(Nov. 2009)
Risk Scenario
(Higher Fleet
Turnover)
Fuel Use (Net) $0.375/ gallon $21,629M $19,392M
Index N/A $0M $0M
Regular Increase (annual) N/A $0M $0M
Special Assessment fee N/A $0M $0M
Vehicle and Driver Fees
Drivers License Fee $25 every 5 years $599M $599M $34 2012 $356M $356M
Commercial Drivers
& Other Drivers License Fees$55 every 5 years $803M $803M $68 2012 $331M $331M
Registration Fee (passenger) $30 $2,558M $2,558M $41.00 2012 $1,661M $1,661M
Passenger Weight Fee $10/$20/$30 $962M $962M $12/$25/$37 2012 $455M $455M
Combined License/Weight Fee $3,040M $3,040M 23% 2012 $985M $985M
Sales and Use Tax 0.30% $677M $677M No Change 2012 $0M $0M
$30,266M $28,029M $3,788M $3,788M
REVENUE DISTRIBUTIONMotor Vehicle Fund $7,979M $7,393M $1,001M $1,001M
Multimodal Fund $1,694M $1,694M $455M $455M
Nickel & TPA Accounts $8,239M $7,433M $165M $165MState Patrol $2,415M $2,415M $1,347M $1,347MHighway Safety Fund $1,402M $1,402M $687M $687MFerry Operations $619M $578M $115M $115MFerry Capital $312M $280M $0M $MOther State Funds Combined $589M $544M $0M $M
Fund Allocation To Be Determined $0M $M
State Level Transportation Total $23,249M $21,739M $3,770M $3,770M
Cities & Counties (excl. Capron) $6,847M $6,134M $0M $MTransit $M $M $0M $MCapron distribution to counties $171M $157M $18M $18M
Local Jurisdictions Total $7,018M $6,290M $18M $18M
GRAND TOTAL $30,266M $28,029M $3,788M $3,788M
Current
No Action
Purchasing
Power Adj.
2009 2025 vs SUV/Pick‐up 2025 2025 vs SUV/Pick‐up
Compact $197 $175 46% $316 $221 50%
Mid Size $272 $241 63% $437 $297 67%
SUV/Pick‐up $437 $379 100% $701 $443 100%
Hybrid $151 $137 36% $242 $184 42%
Electric $77 $77 20% $123 $124 28%
Motorcycle $138 $124 33% $221 $171 39%
Freight: Medium $1,694 $1,456 n/a $2,718 $1,635 n/a
Freight: Heavy $2,865 $2,523 n/a $4,598 $3,062 n/a
Total Expected Revenue
FY 2009‐2025
Incremental Revenue
FY 2009‐2025
CURRENT SITUATION CURRENT SCENARIO
* Assumes 11,500 miles per year on passenger vehicles and fleet composition/fuel efficiency included in the Risk Scenario
Estimated Impacts by Vehicle Type
Total Annual Transportation Taxes and Fees Paid in Revenue Categories Shown Here *
No Action Current Scenario

Implementing Alternative Transportation Funding Methods Draft Final Report
Dec. 2, 2009 DRAFT 67
D. Transportation Related Businesses Transportation fees and taxes are applied to dealer, tow truck operators, manufacturers, and wreckers, and transporter licenses (collectively called Group IV business licenses); taxis; and driver training schools.
Group IV Business Licenses.
o Dealer/Manufacturer business license: Vehicle dealers and manufacturers are required by RCW 46.70.061 to have permits. Snowmobile dealer fees are imposed by DOL under its rule making authority in RCW 46.01.110 and off-road vehicle dealers by RCW 46.09.080. Annual fees for the permits range from $25.00 to $750.00.
o Tow truck operator fee: Operators of tow truck businesses are required by RCW 46.55.030 to have an annual registration for the business and a permit for each tow truck. Before issuing the annual permit, the applicant is required to submit an inspection certificate from the state patrol. Annual and renewal fees are the same. The annual fee is $100.00 for the tow truck business and $50.00 per truck in addition to the normal registration fee.
o Transporter license fee and plate fees: Businesses that deal in transportation of vehicles owned by owners, such as driveaway and towaway services, are required by RCW 46.76.040 and RCW 46.76.050 to pay an annual license and plate fee. The fee does not apply to motor freight carriers licensed under RCW 81.80. The original license is $25.00, renewals are $15.00 per year, and there is a fee of $2.00 per set of plates.
o Hulk haulers, scrap processors, wrecker license fees. Businesses that transport destroyed vehicles or parts (hulk haulers), that recycle salvage vehicles through baling and shredding (scrap processors), and that dismantle vehicles for the purpose of selling second-hand parts(wreckers) are required by RCWs 46.79.060 and 46.80.060 to have special license plates. Fees are in addition to regular license plates and are $25.00 for the original plates and $2.00 for additional plates with the same license number.
Taxis. Owners of for-hire or taxi businesses and vehicles are required by RCWs 46.72.030, and 46.72.070 to have a one time business permit, if the city or county in which they operate does not license taxis, and an annual certificate for each vehicle. The one-time permit is $20.00 and at the annual certificate per vehicle is $20.00.
Driver Training. Driver training schools and driving training instructors are required to be licensed by the state. RCWs 46.82.130 and 46.82.320 allow DOL to establish the original application and renewal fees for driver training schools and instructors.
The exhibit below summarizes the fees charged to transportation businesses, where revenues are deposited, and when the fees were last modified.

Implementing Alternative Transportation Funding Methods Draft Final Report
Dec. 2, 2009 DRAFT 68
Exhibit 23. Summary of Business Fees
Fee Rate Account Transportation Fund
Rate Last Modified
Group IV Business Licenses Vehicle Dealer/Manufacturer
Dealer – Principal place $750 original $250 renewal $ 25 transfer
Motor Vehicle Motor Vehicle 2002
Dealer - Subagent $100 original $ 25 renewal
Motor Vehicle Motor Vehicle 2002
Dealer – Temp subagent $125 original $ 25 renewal
Motor Vehicle Motor Vehicle 2002
Manufacturer $750 original $250 renewal $ 25 transfer
Motor Vehicle Motor Vehicle 2002
Off-Road Dealer $ 25 original $ 25 renewal
Motor Vehicle Motor Vehicle 1990
Snowmobile Dealer $15.00 Motor Vehicle Motor Vehicle 1990
Tow Truck Operator Business $100 Motor Vehicle Motor Vehicle 1985 Per truck additional $ 50 Motor Vehicle Motor Vehicle 1985
Transporter License $25 original
$15 renewal Motor Vehicle Motor Vehicle 1947
Per set of plates $ 2 Motor Vehicle Motor Vehicle 1947 Hulk Haulers, Scrap
Original plates $25 Motor Vehicle Motor Vehicle 1971 Additional same number $ 2 Motor Vehicle Motor Vehicle 1971
For Hire Permit (one-time) $20 Highway Safety Multimodal 1993 Annual certif. per vehicle $20 Highway Safety Multimodal 1993
Driver Training Instructor (2 year license) $150 original
$100 renewal Highway Safety Multimodal 2006
Training school $500 original $250 renewal
Highway Safety Multimodal 2006
Training school branch $250 original $125 renewal
Highway Safety Multimodal 2006
Background check $35.25 Highway Safety Multimodal 2006
Two options were considered for transportation business fees.
Increase fees: Increase fees in 2012 to 2012 purchasing power

Implementing Alternative Transportation Funding Methods Draft Final Report
Dec. 2, 2009 DRAFT 69
Index fees: Index to CPI
1. Implementation
Fees are collected by DOL. None of the options analyzed would modify DOL’s business rules and either option could be implemented while the DOL computer is replaced.
2. Revenue Potential and Impact on Vehicle Owners
The Group IV business license fees are anticipated to generate $20.7 million in the 16-year plan period, of which 77 percent is from the dealer license fees, 10 percent each from the tow truck and wreckers’ fees, and 2 percent from transporter fees. Taxi and driver training school revenues are not identified separately in the forecasts.
If the Group IV business license fees were increased and indexed, an additional $7.2 million in revenue could be generated.
These license fee increases would have an indirect impact on vehicle owners.
E. Use The options considered for fees and taxes applied to use of the system are: tolling and congestion pricing; vehicle miles traveled fees; ferry revenues; Amtrak Cascades Service revenues; and off-road use fees.
1. Tolling
Tolling commenced on the Tacoma Narrows Bridge in 2007 and on State Route 167 High Occupancy Toll Lanes in 2008. In the 2009 session, the legislature authorized tolling for the 520 Floating Bridge and directed WSDOT to conduct studies of five additional potential tolling applications and report to the legislature in the 2010 session.
Allowed uses of toll revenue. RCW 47.56.830, adopted in the 2008 legislative session, requires that all revenues from an eligible toll facility must be used only to construct, improve, preserve, maintain, manage, or operate the eligible toll facility on or in which the revenue is collected. Expenditures of toll revenues are subject to appropriation and must be made only:
o To cover the operating costs of the eligible toll facility including necessary maintenance, preservation, administration, and toll enforcement by public law enforcement within the boundaries of the facility;
o To meet obligations for the repayment of debt and interest on the eligible toll facilities, and any other associated financing costs including, but not limited to, required reserves and insurance;
o To meet any other obligations to provide funding contributions for any projects or operations on the eligible toll facilities;
o To provide for the operations of conveyances of people or goods; or
o For any other improvements to the eligible toll facilities. (Section 4.(2))
Variable pricing. RCW 47.56.830 allows variable pricing, with the rates “set to optimize system performance, recognizing necessary trade-offs to generate revenue.” Variable pricing is anticipated on the SR 520 Bridge. WSDOT has a four year congestion pricing pilot project

Implementing Alternative Transportation Funding Methods Draft Final Report
Dec. 2, 2009 DRAFT 70
- SR 167 High Occupancy Vehicle Toll (HOT) lanes. For a toll that varies based on the level of congestion, single occupant vehicles can use the high occupancy vehicle lanes. HOT lanes began operating in May 2008, with a single HOT lane running in each direction of SR 167 for approximately nine miles between Renton and Auburn. The legislature has direct WSDOT to study additional HOT lanes in the I-405 corridor as a possible next step to implementing the I-405 Corridor Master Plan and connecting I-405 to the SR 167 HOT lanes - thereby creating a north-south Eastside Corridor Express Toll Lane System and a bypass to I-5.
Three options for tolling were reviewed:
Expand tolling implementation. The state legislature has requested studies of tolling for the Alaskan Way Viaduct, Columbia River Crossing, Interstate 405 Two High Occupancy Toll (HOT) Lanes, State Route 167 Corridor and 509 Corridor for presentation in the 2010 session. The WSTC’s Comprehensive Tolling Study in 2006 recommended other potential tolling applications including, I-90 Bridge, I-5, I-5 in Lewis County, Snoqualmie Pass, the SR 704 Cross Base Highway, and statewide truck tolling.
o Interstate tolls. Segment tolls could be used to toll parts of extended systems, such as I-5, to support repaving or other projects.. As the segment is improved, the toll could be removed and placed on another section of the interstate. Twenty-four (24) states have toll facility agreements with the Federal Highway Administration. Toll facility agreements allow states to impose tolls on segments of the interstate highway system. Many states have multiple agreements. Washington state does not have any federal toll facility agreements. Federal law allows pilot projects to toll to support interstate system construction (no more than three) and interstate system reconstruction and rehabilitation pilots (no more than three).
Expand allowed uses of toll revenue. The Washington State Climate Action Team’s report to the 2009 legislature recommended allowing the use of tolling revenues for public transit, carpooling, and other more sustainable travel patterns.28 The legislature could consider allowing either HOT lane toll revenue or highway/bridge facility toll revenue to be used to fund corridor specific transit service improvements.
o HOT lane toll revenue expanded use. In San Diego, revenue from the 1-15 HOT lanes is used to fund corridor transit service improvements. When the HOT lanes were started in 1997, State legislation required that revenues be used for transit improvements in the I-15 corridor. Consequently, a new express bus service, named Inland Breeze, was funded from the project revenue to improve transportation accessibility and service along the I-15 corridor.29
o Highway and bridge toll revenue expanded use. The federal government allows the use of excess toll revenues30 from highways constructed with federal funds for transit
28 Washington State Department of Commerce and Washington State Department of Transportation, Leading the Way: Implementing Practical Solutions to the Climate Change Challenge, November 2008, p. 4. 29 Supernak, Janucz, HOT Lanes on Interstate 15 in San Diego: Technology, Impacts and Equity Issue, 2005. 30 Excess revenues are toll revenues beyond those needed for debt service, reasonable return on private investment, and operation and maintenance.
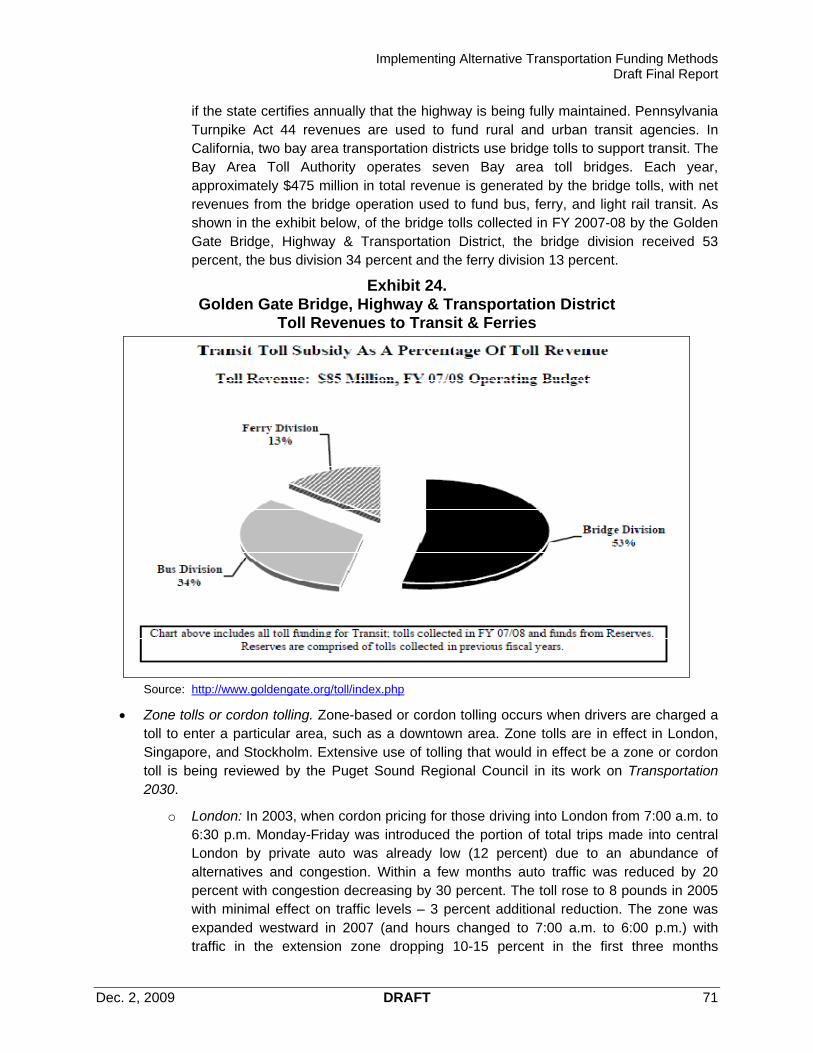
Implementing Alternative Transportation Funding Methods Draft Final Report
Dec. 2, 2009 DRAFT 71
if the state certifies annually that the highway is being fully maintained. Pennsylvania Turnpike Act 44 revenues are used to fund rural and urban transit agencies. In California, two bay area transportation districts use bridge tolls to support transit. The Bay Area Toll Authority operates seven Bay area toll bridges. Each year, approximately $475 million in total revenue is generated by the bridge tolls, with net revenues from the bridge operation used to fund bus, ferry, and light rail transit. As shown in the exhibit below, of the bridge tolls collected in FY 2007-08 by the Golden Gate Bridge, Highway & Transportation District, the bridge division received 53 percent, the bus division 34 percent and the ferry division 13 percent.
Exhibit 24. Golden Gate Bridge, Highway & Transportation District
Toll Revenues to Transit & Ferries
Source: http://www.goldengate.org/toll/index.php
Zone tolls or cordon tolling. Zone-based or cordon tolling occurs when drivers are charged a toll to enter a particular area, such as a downtown area. Zone tolls are in effect in London, Singapore, and Stockholm. Extensive use of tolling that would in effect be a zone or cordon toll is being reviewed by the Puget Sound Regional Council in its work on Transportation 2030.
o London: In 2003, when cordon pricing for those driving into London from 7:00 a.m. to 6:30 p.m. Monday-Friday was introduced the portion of total trips made into central London by private auto was already low (12 percent) due to an abundance of alternatives and congestion. Within a few months auto traffic was reduced by 20 percent with congestion decreasing by 30 percent. The toll rose to 8 pounds in 2005 with minimal effect on traffic levels – 3 percent additional reduction. The zone was expanded westward in 2007 (and hours changed to 7:00 a.m. to 6:00 p.m.) with traffic in the extension zone dropping 10-15 percent in the first three months

Implementing Alternative Transportation Funding Methods Draft Final Report
Dec. 2, 2009 DRAFT 72
compared to 2006 and congestion down 20-25 percent. The overall response has been positive with businesses noting the benefits of increased productivity and faster delivery times due to reduced congestion. Some smaller retailers that relied on customers driving in have had a negative reaction.31 In FY 2007/2008 137 million pounds in net revenue was invested in improving London transit. By law, all net revenue raised has to be invested in improving transit in London.
1. Implementation
The cost of collecting tolls is relatively high when compared to administering taxes such as the motor fuel tax. For the Tacoma Narrows Bridge costs related to tolls were 47 percent of revenues collected in FY 2008. In its first eight months of operation, HOT lane tolls on SR 167 did not cover costs.
WSDOT has issued a Request for Proposals (RFP) for the development of an All Electronic Toll Collecting (AETC) system and for a centralized customer service center that would service the needs of all WSDOT highway tolling operations. A recent study by the JTC: Independent Review of Toll Operations Cost for the Washington State Department of Transportation, Report of the Expert Review Panel September, 2009, reviewed the costs and made recommendations for modifications to the RFPs, many of which are being incorporated by WSDOT.
2. Revenue
Tolling is a potentially large source of revenue with, for example, 94.2 percent of the Tacoma Narrows Bridge capital costs as well as 100 percent of its operating costs covered by tolls.32 The 16-year plan anticipates tolling revenues from the Tacoma Narrows Bridge and SR 167, with the majority of funds from the Bridge tolls. Additional revenues from tolling will depend on the studies currently underway by WSDOT and on legislative decisions. It is anticipated, but not reflected in the 2009-25 16-year financial plan, that tolls on the Alaskan Way Viaduct will provide no more than $400 million of the capital cost for the project and that SR 520 bridge tolls will support $1.2 billion in capital costs.
Tolling has been authorized as a local option for cities to fund bridges (RCW 35.74.05), for counties to fund transportation benefit districts (RCW 36.73), and for regional transportation improvement districts (RCW 36.120). No local option tolls have been implemented.
2. Vehicle Miles Traveled (VMT) Fee
A vehicle miles traveled (VMT) fee has been recommended as a preferred method of replacing the federal reliance on the motor vehicle fuel tax for transportation funding33 and was recommended as a primary long-term funding method in the 2007 JTC Long-Term Transportation Financing Study. It has also been the subject of a pilot study in Oregon and is the subject of a University of Iowa study in cities in six states, including California, Idaho, Iowa, Maryland, North Carolina, and Texas. VMT fees are to be imposed in the Netherlands by 2014 and in Denmark by 2016.
An important consideration for a VMT fee is that it be implemented in a manner that encourages the use of low emission vehicles. “A simple VMT fee would provide no incentives for customers to buy
31 Sources: Lichtman, Todd, London Congestion Pricing Implications for Other Cities, and 2006 Annual Report. 32 Washington State Transportation Commission, Washington State Comprehensive Tolling Study Final Report– Volume 2, Background Paper #7: Tacoma Narrows Bridge Toll Policy, 2006, p. 7-6. 33 See Implementing Alternative Transportation Funding Methods: Draft White Paper on Policy Initiatives, p. 12-13.

Implementing Alternative Transportation Funding Methods Draft Final Report
Dec. 2, 2009 DRAFT 73
vehicles with higher fuel economy ratings because the fee would depend only on mileage. Concern about a lack of incentives for reducing carbon emissions is one reason that some observers caution against a premature commitment to plan for the full substitution of the gas tax with user-based fees.”34
Two options were considered:
State-wide VMT fee. As discussed below, this option is difficult to implement without federal action.
Truck VMT fee. Weight distance truck tolls would be a limited application of a VMT fee and would also have implementation problems, though fewer than a full VMT fee. VMT fees for trucks are now used in Germany, Switzerland and Austria. The Netherlands plans to implement a VMT fee for trucks in 2011 and Denmark in 2014. In Oregon, trucks pay a weight-mile tax instead of fuel tax. Illinois has a VMT weight tax as an optional tax for trucks that drive low miles and are only operated in the state of Illinois. In Kentucky, New Mexico and New York, trucks pay a mileage fee in addition to fuel tax. The fuel tax rate for diesel is less than the rate for gasoline in Kentucky and New York.35 None of the states that impose a weight mileage fee index the rate.
a. Implementation
Implementation is the major issue with a VMT fee. While a truck VMT fee would be less problematic to implement, it will raise resistance from truckers and is likely to lead to greater truck costs.36
Public acceptance. Drivers who live in non-urban areas who drive long distances and have limited access to transit or other multi-modal transportation options express reservations about the equity of a VMT fee.37 A 2006 poll of California voters found that while 40 percent of likely voters thought that what people pay in taxes and fees for transportation projects should take into account how much people drive, of 14 funding methods polled the least favored, with 23 percent in favor, was replacing the 18 cpg fuel tax with a 1cent/mile mileage fee.38 Perceptions of privacy problems are also a significant barrier to public acceptance.39
Federal. Although an interstate agreement is theoretically possible, it is very difficult for an individual state to implement a VMT fee. States would like the federal government to take the lead to prevent multiple incompatible systems.40 In a June 2009 National Cooperative Highway Research Program study, four states said they assumed implementation would
34 National Transportation Policy Project, Performance Driven: A New Vision for U.S. Transportation Policy, June 2009, p. 95 and p. 99. 35 In Idaho the legislature repealed its truck weight-mileage fee based on a court ruling that Idaho’s system discriminated against interstate trucking companies by having reduced weight-mile tax for natural resource commodities. These commodities included: farm (not for hire), logs, pulpwood, stull, poles, piling, rough lumber, ores, ore concentrates, sand and gravel, and livestock 36 National Cooperative Highway Research Program, Transportation Research Board of the National Academies, Implementable Strategies for Shifting to Direct Usage-Based Charges for Transportation Funding, p. xvii. 37 Texas Transportation Institute, Feasibility of Mileage-Based User Fees: Application in Rural/Small Urban Areas of Northeast Texas, Oct. 31, 2008, p. 8. 38 Mineta Transportation Institute, Transportation Funding Opportunities for the State of California, Oct. 2006, Appendix A. Survey Results and p. 11 of the Executive Summary. 39 National Cooperative Highway Research Program, Transportation Research Board of the National Academies, Implementable Strategies for Shifting to Direct Usage-Based Charges for Transportation Funding, p. xvii. 40 Ibid., p. xvii.
Implementing Alternative Transportation Funding Methods Draft Final Report
Dec. 2, 2009 DRAFT 74
have to be done at the federal level. Changes involving new technology built into new vehicles or roadway changes would clearly need to be federal – or alternatively perhaps a major market state such as California could set the standards all other states could follow. A state that decides to implement a VMT on its own would have a high risk of fraud from individuals claiming miles driven in another state. According to the National Cooperative Highway Research Program study, no state is interested in being first to implement a VMT fee but are rather interested in being part of a larger system.41
Collection. There have been several studies of how to collect a VMT. The basic options are self-reporting, odometer reading, pay at the pump, or in-vehicle equipment.
o Self-reporting. The American Association of State Highway and Transportation Officials (AASHTO) has recommended that if a VMT fee is to be part of the long-term solution to federal transportation funding, that Congress in the short term should consider developing a simple highway user fee option based on self-reporting of annual vehicle miles traveled that could be collected along with annual vehicle registration fees.42 While possible at the federal level, there are several drawbacks to a state implementing a self-reporting system. The National Cooperative Highway Research Program study concluded that self-reported odometer readings were too difficult to enforce.
Vehicle miles driven outside of Washington State: Unless the fee was attached to all vehicle miles driven, there would be no way for the state to audit the reported mileage and, as noted above, there is the potential for fraud from people claiming to have driven out-of-state miles.
Vehicles sold or transferred out of state: The state would have to develop a way to secure reports on vehicles that were sold out of state that included a final odometer reading.
o Odometer reading. The state could consider reading odometers, which would be difficult in those areas of the state that do not have emission inspection requirements and would require extending the inspection infrastructure beyond 2015 when emission inspections are scheduled to be phased out.
Assumed annual mileage with optional odometer readings. This would have lower operations costs and user burden, but would provide minimal pricing flexibility.
o Pay at the pump. This method was tested in Oregon and was found to be a reasonable way to collect a VMT fee. Minnesota is planning a pilot project on pay at the pump. The drawback is charging a VMT fee at the pump for Electric vehicles or other vehicles that use little or no fuel.
o On-Board technology/global positioning system (GPS). A University of Iowa study is examining ways to use on-board technology combined with GPS technology to
41 Ibid., p. 36 42 American Association of State Highway and Transportation Officials, Finance and Funding Legislative Recommendations, 2008, p. 5.

Implementing Alternative Transportation Funding Methods Draft Final Report
Dec. 2, 2009 DRAFT 75
determine vehicle miles traveled and the associated fee. Participants are being billed with varying degrees of information. At one extreme the billing statement will show the vehicle’s total mileage and fees for travel during the statement cycle and at the other the statement will include complete trip detail for all travel during the statement cycle.
b. Revenue
Assuming implementation in 2012 for the sake of comparison, revenue from a VMT of 1 cent per mile is estimated at $8.9 billion over the 16 year plan period. There is additional uncertainty in the forecast because WSDOT is revising its VMT forecasting methodology and does not anticipate having a new forecast until the June 2010 revenue forecast.
3. Ferry Revenues
At the end of the 2009-25 16-year financial plan, Washington State Ferries (WSF) accounts have a combined deficit of $1,064.4 million, of which $936.3 million or 88 percent is from the capital account and $128.1 million or 12 percent is from the operations account. The capital gap is anticipated to grow even larger in the period immediately following 2025 due to fleet replacement needs.43
Options considered include those that could increase operations funding and those that could increase capital funding. Capital funding options could be further restricted to the creation of a special account for vessel replacement which is WSF’s most urgent capital need.
Operations Funding Options
o Increase rates to increase farebox recovery. Farebox recovery is the total operations cost divided by revenues from fares, concessions and other earned income. Ninety-eight percent (98%) of income is from fares. Farebox recovery is anticipated to average 76 percent over the 16 year plan period, assuming annual fare increases of 2.5 percent.
o Fuel surcharge. A fuel surcharge would protect WSF’s operating budget when fuel prices increase beyond those assumed in the biennial budget. The current legislative financial plan does not include an assumption that WSF would implement a fuel surcharge, rather the legislature provided the following direction to WSF and the WSTC in the 2009-11 transportation budget (ESSB 5352): If (WSF) proposes a fuel surcharge, the department must evaluate other cost savings and fuel price stabilization strategies that would be implemented before the imposition of a fuel surcharge. (Section 223 (3)) If the commission considers implementing a ferry fuel surcharge, it must first submit an analysis and business plan to OFM and either the JTC or the transportation committees of the legislature. (Section 205 (6))
o Adaptive management options. RCW 47.60.290 requires WSF to consider, when developing fare proposals, options for using pricing to level vehicle peak demand and
43 See Implementing Alternative Transportation Funding Methods: Draft White Paper on Policy Initiatives, p. 4041.

Implementing Alternative Transportation Funding Methods Draft Final Report
Dec. 2, 2009 DRAFT 76
to increase off-peak ridership. Options that WSF has identified that might be used in the medium term that could meet this legislative direction are:44
Differential vehicle and passenger fare increases. The 2009-11 transportation budget (ESSB 5352) states that the WSTC “may only approve ferry fare rate changes that have the same proportionate change for passengers as for vehicles.” (Section 205, (1))
Additional seasonal surcharge for July and August – which was considered and not adopted by the WSTC in setting fares effective Oct. 2009
Small car discounts
Options that WSF has identified that might be used in the long-term that could meet this legislative direction are:
Time of day pricing for vehicles
Progressive pricing for larger vehicles
Modifications to frequent vehicle customer prices
Variable pricing for routes within travel sheds
o Non-resident pricing. Vehicles registered with out-of-state licenses could be charged an additional toll.
o Reservation surcharge. If a vehicle reservation system is implemented, it is anticipated that it will not require a surcharge. A non-refundable deposit would be applicable for no-shows. WSF does not plan to impose a surcharge for reservations so that customers are encouraged to make reservations.
o Capital Funding Options
o Capital surcharge on fares. RCW 47.60.290 states that if WSF’s operating revenues are used to support capital, the support must be specifically identified in fares. A capital surcharge could be used to fund a vessel replacement fund.
o Naming rights vessels. The 2009 transportation budget (ESSB 5352) stated that the WSTC may name state ferry vessels consistent with its authority to name state transportation facilities under RCW 47.01.420. When naming or renaming state ferry vessels, the commission shall investigate selling the naming rights and shall make recommendations to the legislature regarding this option. WSTC is currently reviewing naming options and potential revenues
o Special purpose lottery. Lottery proceeds currently go to the Education Construction Account, the General Fund, the Economic Development Reserve Account, the Problem Gambling Account, the Exhibition Center Account (Qwest Field), and the Baseball Stadium Account - King County (Safeco Field). Distributions to the Baseball
44 Washington State Ferries Long Range Plan identified other pricing strategies that are not evaluated including: congestion pricing for vehicles, progressive pricing for larger vehicles, modifications to frequent vehicle customer prices, and variable pricing for routes within travel sheds.

Implementing Alternative Transportation Funding Methods Draft Final Report
Dec. 2, 2009 DRAFT 77
Stadium account will stop when the bonds are retired, which may be as soon as 2012 but no later than 2016. Distributions to the Exhibition Center Account will stop when the bonds are retired, or December 31, 2020, whichever comes first. A lottery to support vessel construction could be a special purpose lottery, additional distribution, or replace retiring distributions to the baseball stadium and the exhibition center accounts.
1. Implementation
There are no implementation issues associated with these potential revenue sources, assuming legislative authorization.
2. Revenue
Operating revenue. Increasing fares by 3.5 percent per year rather than the 2.5 percent anticipate din the 16-year plan would generate approximately $42 million over the 16-year plan period and a fuel surcharge $104 million.. A reservation surcharge would generate an additional $13 million. The adaptive management options are intended to be revenue neutral.
Capital revenue. A 10 percent capital surcharge on all fares implemented in the fall of 2010 on would generate $200 million over the 16-year plan period.
4. Amtrak Cascades Service
Amtrak Cascades train service is funded by the states of Washington and Oregon, Amtrak, Sound Transit, the Province of British Columbia, the United States and Canadian federal governments, railroads, other participating organizations and agencies, and fare-paying passengers.
Washington does not have a dedicated fund source for rail, with operating and capital funding coming from the multi-modal account.
Washington is one of 14 states to provide funds to Amtrak for intercity passenger rail service. California funds its passenger rail Amtrak subsidy through its sales tax on gasoline and diesel and three states, like Washington, rely on their multi-modal funds which do not include gas tax revenues. Some states, including Oklahoma, Oregon, Illinois and New York use the general fund to support passenger rail, much in the way that Washington State transit agencies are reliant on local option sales tax revenue. Some states that do not restrict gas tax proceeds to highway uses, such as North Carolina, use general highway funds for the Amtrak subsidy.
Operations: Amtrak Cascades serves 466 route miles between Eugene, Oregon, and Vancouver, B.C. Amtrak provides operating funds for one daily round-trip route, Oregon provides funding for two round-trips between Portland and Eugene, and Washington, through WSDOT, provides for four roundtrips. Amtrak uses five trains for daily operations, two owned by Amtrak and the remainder by Washington State. 45 A second round-trip between Seattle and Vancouver B.C. started August 19, 2009 and will run as a pilot project through the Winter Olympics and Paralympics in 2010. Ridership on Washington State funded trains was 521,000 or 67 percent of total Cascades ridership.46
45 Washington State Department of Transportation, Gray Notebook June, 2009, p. 38. 46 Washington State Department of Transportation, Amtrak Cascades 2008 Performance Report, p. 2.

Implementing Alternative Transportation Funding Methods Draft Final Report
Dec. 2, 2009 DRAFT 78
In Federal Fiscal Year (FFY) 2008, state-supported Amtrak Cascades trains had a farebox recovery of 54 percent. Total taxpayer subsidy for Washington state-supported Amtrak Cascades trains (4 round-trips) was $14.6 million in FFY 2008.47 State support is the total program costs minus operational revenue received from tickets, food, and other services.
The 2006 Washington State Long-Range Plan for Amtrak Cascades assumes that farebox recovery will increase, averaging 75 percent over the next 20 year period, and assumes fares rise only with inflation and to meet projected operating costs.
Capital. Capital funds for Cascades service from Portland to Seattle are provided by BNSF Railway Company, the State of Washington, Amtrak, non-Amtrak federal funds, Sound Transit and the Federal Transit Administration, and Oregon (from Union Station to the Columbia River). Between 1994 and 2007, the State of Washington made $124.4 million in capital investments in Cascades, which represented 17 percent of a total of $717.2 million in Cascades capital investments. The largest investment, of $284.3 million or 40 percent of the total were in capacity improvements between Everett and Tacoma made by Sound Transit and the Federal Transit Administration to fund improvements related to Sounder service.48
The Pacific Northwest Rail Corridor (Eugene, Oregon to Vancouver BC) is one of the 11 federally designated high speed rail corridors. The American Recovery and Reinvestment Act (ARRA) passed by Congress in February 2009 includes $8 billion of federal funding for high speed rail, providing funds for the first federal investments in high speed passenger rail outside the northeast corridor.
In August 2009, WSDOT submitted grant applications for $439.98 million in funding for Track 1 projects, which are ready to go projects that can be completed within two years of obligation and have independent utility. Track 1 projects can be 100 percent federally funded. If approved, these projects would allow for the addition of one round-trip per day between Seattle and Portland.
Track 2 projects, which are also eligible for 100 percent federal funding, are high speed rail corridor projects that bring a benefit greater than the sum of individual parts. Applications for Track 2 projects were submitted Oct. 2, 2009. Track 2 projects are anticipated to allow for the addition of 3 more round-trips per day for a total of four more per day with the Track 1 applications.
Options reviewed include:
Increase fares to increase farebox recovery. Fares are established in collaboration between Amtrak and WSDOT, with WSDOT having the final determination on the state supported trips. Fares have been established primarily based on market analysis undertaken by Amtrak. Revenue is estimated based on a “revenue neutral policy, which means that revenue estimates reflect no change in price except adjustments for inflation and change in operation cost.”49 Projected increases in farebox recovery are the result of increased
47 Gray Notebook, December 31, 2008, p. 29. 48 Ibid., p. 10-3. 49 Washington State Department of Transportation, Amtrak Cascades Mid-Range Plan, December, 2008. p. 7-8.

Implementing Alternative Transportation Funding Methods Draft Final Report
Dec. 2, 2009 DRAFT 79
ridership and do not reflect price adjustments as service and on-time reliability improves with projected capital investments.
Add a capital surcharge to fares. Much like WSF capital funding options, a capital surcharge could be added to Amtrak Cascades passenger fares.
a. Implementation
Fares are collected by Amtrak and are part of the costs included in the subsidy calculations.
b. Revenue
The revenue estimates are based on the current four round-trips subsidized by WSDOT. Additional round-trips that may result if the Federal AARP funding is approved are not included. If fares are increased, it would reduce WSDOT’s subsidy of Amtrak service. For each 1 percent increase in fares, WSDOT’s subsidy would decrease by 1 percent.
Revenue estimates for a capital surcharge assume a $1.00 surcharge per passenger ticket and are based on the ridership estimates included in the 2006 Long-Range Plan for Amtrak Cascades. Under this scenario, the capital surcharge could generate approximately $30 million over the 16 year plan.
5. Off-Road Use Fee
The current off-road vehicle use permit fee applies to all off-road vehicle owners. The fee is $18.00 for an annual permit, $7.00 for a 60-day temporary permit, and $10.00 for a transfer fee. The rate was last raised in 2004.
Eighty-two percent (82%) of the biennial $3.1 million from the fee is deposited in the Nonhighway and Off-Road Vehicle Activities account in the Outdoor Recreation Account in the Wildlife and Natural Resources Fund and administered by the Department of Natural Resources. Eighteen percent (18%) is deposited in the motor vehicle account, with the revenue intended to cover the DOL’s administrative costs.50
Two options have been identified for further analysis:
Increase and index the off-road use fee. The off-road use fee was last modified in 2004.
Dedicate all revenues to the Nonhighway and Off-Road Vehicle Activities. If 100 percent of the fees were devoted to the Nonhighway and off-road vehicle activities account, motor vehicle funds would be reduced by $4.5 million over the 16-year plan period.
1. Implementation
The off-road use fee is already collected. There would be no implementation issues.
50 RCW 46.09.170 states: The moneys collected by the department under this chapter shall be distributed from time to time but at least once a year in the following manner: The department shall retain enough money to cover expenses incurred in the administration of this chapter: PROVIDED, That such retention shall never exceed eighteen percent of fees collected. The remaining moneys shall be distributed for ORV recreation facilities by the board in accordance with RCW 46.09.170(2)(d)(ii)(A).

Implementing Alternative Transportation Funding Methods Draft Final Report
Dec. 2, 2009 DRAFT 80
2. Revenue
The impact on the motor vehicle fund is relatively small. If the fees are doubled, motor vehicle funds would increase by $4.5 million over 16 year representing the 18 percent that goes to the fund. If indexed, motor vehicle funds would increase by an additional $2.7 million. If the registration and renewal fees are increased, the number of temporary use permits may increase, which could affect overall revenues.
F. Transportation System: State Access Permits The state has authorized local governments to assess impact fees51, which are charges assessed by local governments against new development projects that attempt to recover the cost incurred by government in providing the public facilities required to serve the new development. Impact fees are only used to fund facilities, such as roads, schools, and parks, that are directly associated with the new development. They may be used to pay the proportionate share of the cost of public facilities that benefit the new development; however, impact fees cannot be used to correct existing deficiencies in public facilities. In Washington, impact fees are authorized under the Growth Management Act (RCW 82.02.050 - .100), as part of "voluntary agreements" under RCW 82.02.020, under the "Local Transportation Act" (RCW 39.92.040), and as mitigation for impacts under the State Environmental Policy Act (SEPA - Ch. 43.21C RCW). GMA impact fees are only authorized for public streets and roads; publicly owned parks, open space, and recreation facilities; school facilities; and fire protection facilities in jurisdictions that are not part of a fire district.52 Fourteen (14) jurisdictions in Washington have assessed road impact fees.53 Impact fees are not allowed to be used for other transportation modes, such as transit, bicycle and pedestrian improvements, besides roads and streets.
Twenty-eight (28) states have authorized transportation impact fees for use by local cities, counties and/or special districts.54
The state does not itself impose impact fees, yet many developments have an impact on state owned highways. No state is currently imposing transportation impact fees for their own use.
Pennsylvania requires off-site road improvements through its highway permit approval process. WSDOT can also, as part of its access management permit process, require off-site improvements.
Pennsylvania Highway Occupancy Permits (HOP): A highway occupancy permit issued by the Pennsylvania Department of Transportation is required for developments that affect interstate highways, US routes, or state highways in Pennsylvania. Highway Occupancy Permits are typically issued to utility companies, municipal authorities, developers and builders, and private citizens. The Pennsylvania Department of Transportation has the authority to require off-site road improvements through its highway occupancy permit approval process that may be needed to mitigate the traffic impact of a particular land
51 Discussed in Implementing Alternative Transportation Methods: Policy Initiatives Draft White Paper, Sept. 9, 2009, p. 28-29, 36, 58-59. 52 Municipal Services and Research Center of Washington, Transportation Impact Fees. 53 Duncan Associates, National Impact Fee Survey: 2008, p. 6. 54 Ibid., p. 3.
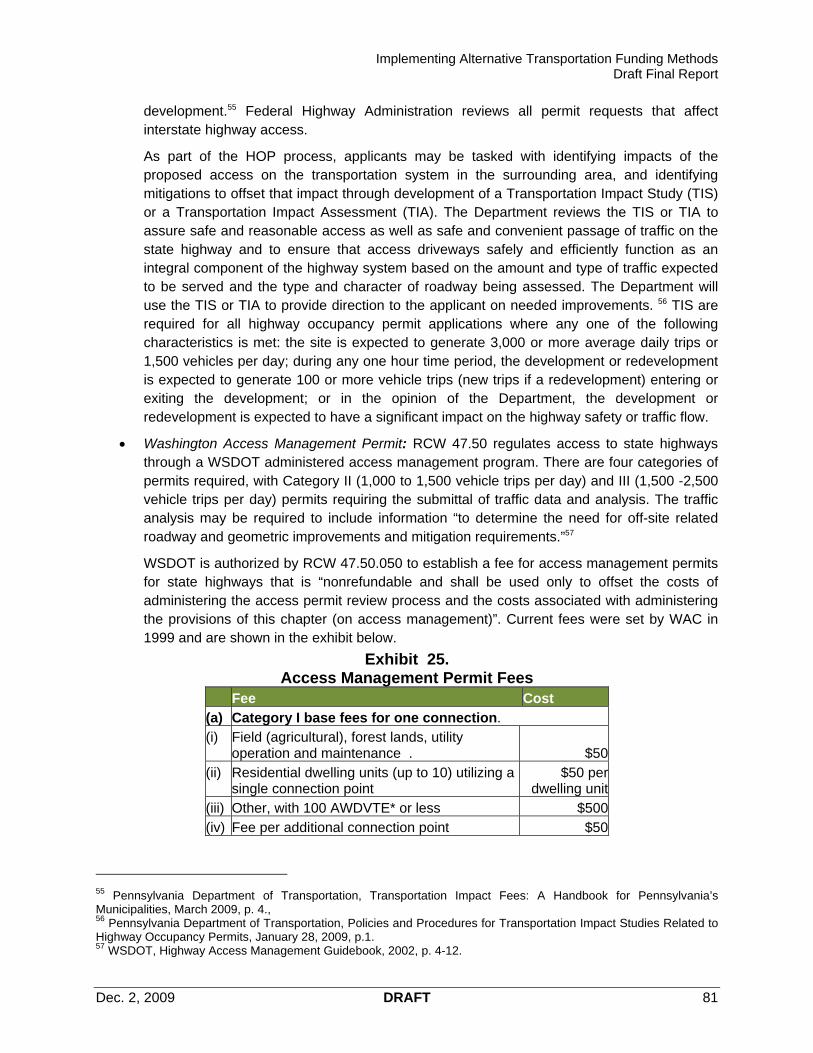
Implementing Alternative Transportation Funding Methods Draft Final Report
Dec. 2, 2009 DRAFT 81
development.55 Federal Highway Administration reviews all permit requests that affect interstate highway access.
As part of the HOP process, applicants may be tasked with identifying impacts of the proposed access on the transportation system in the surrounding area, and identifying mitigations to offset that impact through development of a Transportation Impact Study (TIS) or a Transportation Impact Assessment (TIA). The Department reviews the TIS or TIA to assure safe and reasonable access as well as safe and convenient passage of traffic on the state highway and to ensure that access driveways safely and efficiently function as an integral component of the highway system based on the amount and type of traffic expected to be served and the type and character of roadway being assessed. The Department will use the TIS or TIA to provide direction to the applicant on needed improvements. 56 TIS are required for all highway occupancy permit applications where any one of the following characteristics is met: the site is expected to generate 3,000 or more average daily trips or 1,500 vehicles per day; during any one hour time period, the development or redevelopment is expected to generate 100 or more vehicle trips (new trips if a redevelopment) entering or exiting the development; or in the opinion of the Department, the development or redevelopment is expected to have a significant impact on the highway safety or traffic flow.
Washington Access Management Permit: RCW 47.50 regulates access to state highways through a WSDOT administered access management program. There are four categories of permits required, with Category II (1,000 to 1,500 vehicle trips per day) and III (1,500 -2,500 vehicle trips per day) permits requiring the submittal of traffic data and analysis. The traffic analysis may be required to include information “to determine the need for off-site related roadway and geometric improvements and mitigation requirements.”57
WSDOT is authorized by RCW 47.50.050 to establish a fee for access management permits for state highways that is “nonrefundable and shall be used only to offset the costs of administering the access permit review process and the costs associated with administering the provisions of this chapter (on access management)”. Current fees were set by WAC in 1999 and are shown in the exhibit below.
Exhibit 25. Access Management Permit Fees
Fee Cost (a) Category I base fees for one connection. (i) Field (agricultural), forest lands, utility
operation and maintenance . $50 (ii) Residential dwelling units (up to 10) utilizing a
single connection point $50 per
dwelling unit (iii) Other, with 100 AWDVTE* or less $500 (iv) Fee per additional connection point $50
55 Pennsylvania Department of Transportation, Transportation Impact Fees: A Handbook for Pennsylvania’s Municipalities, March 2009, p. 4., 56 Pennsylvania Department of Transportation, Policies and Procedures for Transportation Impact Studies Related to Highway Occupancy Permits, January 28, 2009, p.1. 57 WSDOT, Highway Access Management Guidebook, 2002, p. 4-12.
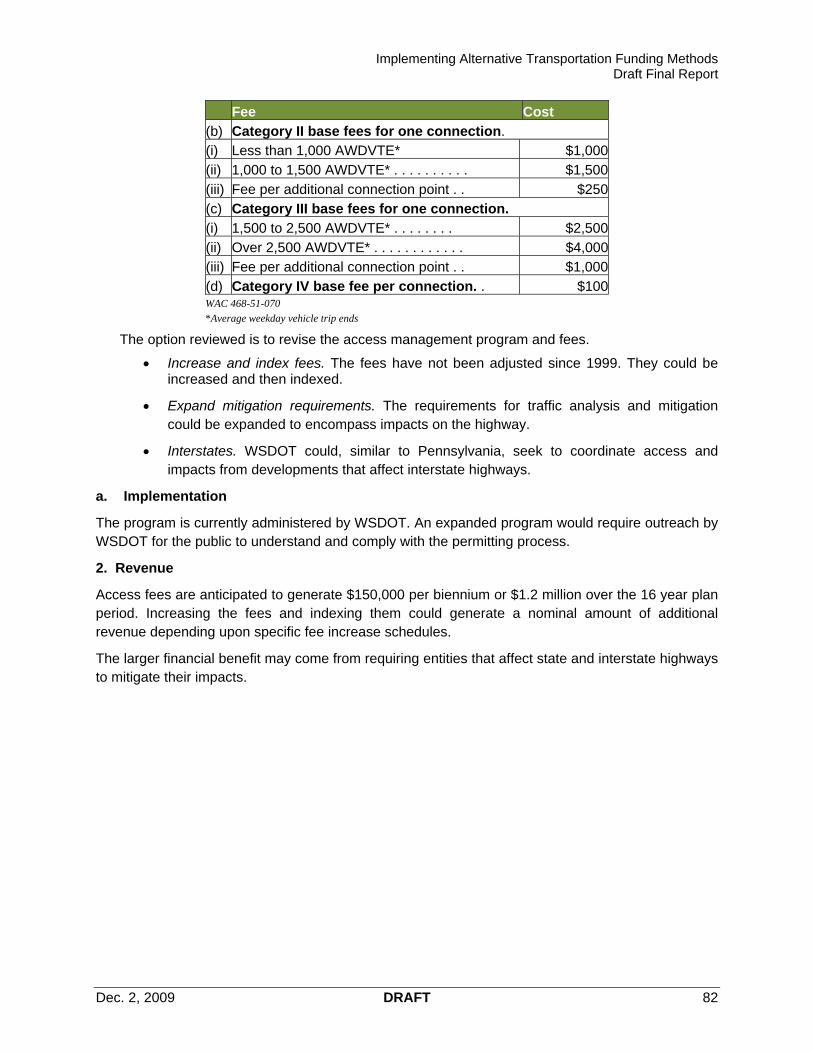
Implementing Alternative Transportation Funding Methods Draft Final Report
Dec. 2, 2009 DRAFT 82
Fee Cost (b) Category II base fees for one connection. (i) Less than 1,000 AWDVTE* $1,000 (ii) 1,000 to 1,500 AWDVTE* . . . . . . . . . . $1,500 (iii) Fee per additional connection point . . $250 (c) Category III base fees for one connection. (i) 1,500 to 2,500 AWDVTE* . . . . . . . . $2,500 (ii) Over 2,500 AWDVTE* . . . . . . . . . . . . $4,000 (iii) Fee per additional connection point . . $1,000 (d) Category IV base fee per connection. . $100 WAC 468-51-070
*Average weekday vehicle trip ends
The option reviewed is to revise the access management program and fees.
Increase and index fees. The fees have not been adjusted since 1999. They could be increased and then indexed.
Expand mitigation requirements. The requirements for traffic analysis and mitigation could be expanded to encompass impacts on the highway.
Interstates. WSDOT could, similar to Pennsylvania, seek to coordinate access and impacts from developments that affect interstate highways.
a. Implementation
The program is currently administered by WSDOT. An expanded program would require outreach by WSDOT for the public to understand and comply with the permitting process.
2. Revenue
Access fees are anticipated to generate $150,000 per biennium or $1.2 million over the 16 year plan period. Increasing the fees and indexing them could generate a nominal amount of additional revenue depending upon specific fee increase schedules.
The larger financial benefit may come from requiring entities that affect state and interstate highways to mitigate their impacts.

Implementing Alternative Transportation Funding Methods Draft Final Report
Dec. 2, 2009 DRAFT 83
VII. STATE FUNDING METHOD RECOMMENDATIONS The consultants’ recommendations on state transportation funding methods are intended, consistent with the evaluation framework, to provide the legislature with a package of funding tools that meet four objectives:
Revenue stream. Provide a stream of revenue consistent with transportation system funding needs.
Public benefits/reflects use. Provide a clear purpose and policy rationale linked to transportation system use, economic development, and other state policies and goals.
Equitable. Funding burden is geographically equitable and equitably allocates the costs to those who benefit.
Local. Allows for viable local transportation options that recognize the distinct needs of different local systems.
The consultants recommend that the legislature consider seven medium-term actions and that other viable funding methods be considered in the longer term as the impact of energy, climate change, mobility, and federal policies are determined. A VMT fee should be considered if the federal government adopts that funding approach and establishes national standards for collection.
A. Recommended Funding Tools Of the funding methods reviewed the consultants recommend the legislature consider those shown in the exhibit below for the 2009-27 16-year financial plans.
Exhibit 26. Recommended Funding Methods - 2009-27 Financial Plans
Fuel Use Vehicle Motor fuel tax options Tolling/Congestion Pricing Retail Sales & Use Tax
Index Expand tolling Change rate
Set increases Expand revenue uses Vehicle Fees
Add special assessment fee Ferries & Cascade Amtrak Rates at 2012 purchasing power Operations funding Index Capital funding Modify weight fees Off-Road Use Fee Extend in lieu of fee to electric &
other high mileage vehicles Rates 2012 purchasing power Tire Fee
Index Add fees for transportation Driver Transportation Business Transportation System Driver Licenses Business Licenses Access Management Fees
Rates 2012 purchasing power Rates 2012 purchasing power Rates 2012 purchasing power
Index Index Index Modify
Reflect impact Extend to interstates
Implementing Alternative Transportation Funding Methods Draft Final Report
Dec. 2, 2009 DRAFT 84
B. Medium Term (5 Year) Recommendations Seven actions are recommended for immediate consideration by the legislature. These actions are designed to conform to the evaluation framework.
Revenue stream. Eighty percent (80%) of the state’s direct transportation revenues are from the motor vehicle fuel tax and fees and licenses applied to vehicles, drivers, transportation businesses, off-road use, and access permits. The consultants recommend that the legislature act to maintain the viability of these funding methods by:
o Indexing them to grow with inflation
o Increasing the motor vehicle fuel tax rate or adding a special assessment fee to motor vehicle fuel retail sales, either of which would offset declines in per capita motor vehicle fuel consumption
Public benefit/reflect use. The following recommended actions would relate funding to transportation system use.
o Extend tolling applications to additional projects
o Apply an additional motor vehicle fuel tax to counties that have large projects, including the potential to provide ferry capital funding
o Develop funding sources for WSF capital (in addition to the distributions from increased motor vehicle fuel taxes), which could include a capital surcharge, directing Capron refunds to the Ferries capital account, distributing some additional motor fuel tax and licenses and permit revenue to the capital account, and/or implementing an additional motor vehicle fuel tax amount in counties that have state ferry service.
o Review Amtrak Cascade service operations and capital funding.
o Revise the WSDOT access management program to mandate that entities impacting the state highways or interstates mitigate their impact
Equitable. The legislature could impose in-lieu of fees on electric vehicles and other high mileage vehicles to distribute more of the costs of the transportation system to these vehicle owners.
Local. As shown in the table below, local jurisdictions would receive ___ in funding under the consultant’s risk scenario from these actions or ___ under the November forecast. Additional local funding options are discussed in the next section.
1. Maintain the viability of licensing and permit fee revenues
The consultants have recommended a review of all transportation related licenses, permits, fees, and abstract charges. Once that review is complete, the consultants recommend the adoption of comprehensive legislation to increase the fees to 2012 purchasing power and index them to maintain future purchasing power. The affected agencies should be given authorization by the legislature through the budget process to adjust the fees annually. In changing the vehicle registration fees, the legislature should consider capping the Capron refunds at the existing fee levels.
Implementing Alternative Transportation Funding Methods Draft Final Report
Dec. 2, 2009 DRAFT 85
Action 1. To maintain the viability of license and permit fee revenues, the legislature should adopt comprehensive legislation increasing the fees to 2012 purchasing power and indexing them to the CPI to maintain purchasing power. The legislature should also provide authorization through the budget process to the affected agencies to modify the fees annually, and direct the resulting Capron refunds to WSF.
2. Maintain the short and medium term viability of motor vehicle fuel tax revenues
The motor vehicle fuel tax will, even under the consultants’ risk scenario, remain a significant revenue source during the 16-year plan period. To maintain its viability as a revenue source the tax should be structured to maintain its purchasing power and to offset decreases in per capita motor vehicle fuel consumption. To achieve these two objectives the legislature should:
Index the motor vehicle fuel tax. Indexing would allow the motor vehicle fuel tax to grow with inflation and,
Increase the tax by a flat rate. Increasing the flat rate would offset declining motor vehicle fuel consumption per capita or
Add a transportation assessment fee. An assessment fee would increase revenues from the sale of motor vehicle fuel by adding a percentage based assessment to the retail price of fuel and would offset declining motor vehicle fuel consumption per capita.
In making these changes, the legislature should consider capping the Capron refunds at the 23.0 cpg rate, which is consistent with the legislature’s decision to direct the Nickel and TPA Capron refunds to the Ferry operations account. A transportation assessment fee would not be subject to the 18th amendment and would not generate Capron refunds.
Action 2. To maintain the viability of the motor vehicle fuel tax, the legislature should index the tax to the CPI to maintain its purchasing power and, to off-set declines in per capita consumption increase the tax rate annually year or add a transportation assessment fee to the retail price of motor vehicle fuel. Any resulting Capron refunds should be directed to WSF.
3. Adopt in-lieu of vehicle fuel tax fees for electric and other high mileage vehicles
The legislature should, as it has for natural gas and propane vehicles, take action to increase the amounts paid by owners of electric and other high mileage vehicles. The legislature could apply the in-lieu of fee on a graduated basis to all vehicles that get over a base number of miles per gallon.
Action 3. The legislature should, consistent with fees adopted for natural gas and propane powered vehicles, adopt in-lieu of fees for electric vehicles and other high mileage vehicles.
4. Extend tolling applications
The legislature has authorized tolling on the 520 Bridge and requested studies of five more potential tolling applications to be presented during the 2010 session. The legislature should, consistent with the WSTC’s 2006 tolling study, continue to review tolling to fund specific projects.
Action 4. The legislature should consider funding additional projects with tolls.
Implementing Alternative Transportation Funding Methods Draft Final Report
Dec. 2, 2009 DRAFT 86
5. Secure WSF capital funding
As shown in the exhibit below, if the legislature adopted the recommendations to increase and index the motor vehicle fuel tax and licenses, permits and fees, Ferries’ operations account would gain $195 million under the consultants’ risk scenario or $236 million under the November forecast, which is more than sufficient to offset the $128.1 million needed to balance the operations account in the 2009-25 financial plan.
The Ferries capital account would gain $64 million under the consultants risk scenario or $96 million under the November forecast of the $936.3 million needed.
The most significant problem for Ferries is to fill the remaining at least $872.3 million capital funding gap (assuming the consultant risk scenario for new revenues) and to secure a source of capital funds to meet the vessel replacement needs that start in the years immediately following the 2023-25 biennium. The consultants recommend that to fill the capital funding gap the legislature should consider:
Capital surcharge on ferry fares. A 10 percent surcharge on all fares starting in the fall of 2010 would generate $200 million over the 16-year plan period.
Direct additional Capron refunds to Ferries’ capital account. Capron refunds from the TPA and Nickel fuel tax have been directed to Ferries’ operations account to help keep fares low. Given the urgency of the capital funding situation, the legislature should consider directing any additional Capron refunds to the capital account. If recommendations were implemented to increase and index motor vehicle fuel taxes and vehicle registration fees, the resulting Capron refunds that could be distributed to the Ferries capital account would be $45 million in the consultants’ risk scenario or $59 million in the November forecast over the 16-year plan period.
Distribute licensing fees to Ferries’ capital account. As the legislature considers adjustments to the fees and permits, it could consider distributing some portion to Ferries capital. For example, the $30.00 vehicle registration fee is distributed $20.35 to the State Patrol, $2.20 to Ferry Operations, and $7.63 to the motor vehicle fund. If the fee is increased and indexed, the portion going to Ferry operations could be capped and the Ferries proportionate increase directed to the capital account.
Change motor vehicle fuel tax distributions between Ferries’ operations and capital accounts. Historically Ferries’ capital requirements were largely met by MVET funding. The distribution between Ferries capital and operations accounts of the motor vehicle fuel tax has not changed since the loss of MVET funding
Action 5. To help secure capital funding for Ferries, the legislature should consider, in addition to increasing and indexing the motor vehicle fuel tax, a capital surcharge on ferry fares, directing the additional Capron refunds to the Ferry capital account, distributing a portion of license fees to ferries capital account, and re-balancing the distribution of the motor vehicle fuel tax between the Ferris operations and capital accounts.
6. Review Amtrak Cascades Service funding
Amtrak Cascades service has a farebox recovery of 54 percent, which is projected to increase to 75 percent over the next 20 years. All of the remaining operations funding is from WSDOT. The
Implementing Alternative Transportation Funding Methods Draft Final Report
Dec. 2, 2009 DRAFT 87
consultants recommend that the legislature consider working with Amtrak to increase rates to reflect improved service from projected capital investments and consider a capital surcharge to help finance capital costs.
Action 6. The legislature should review Amtrak Cascades service farebox recovery and opportunities to decrease the state’s subsidy and for the imposition of a capital surcharge on tickets.
7. Revise the WSDOT Access Management Program
In addition to revising and increasing the permit rates, the legislature should consider authorizing a broader access management program that would require entities that impact state or interstate highways to mitigate that impact.
Action 7. The legislature should consider expanding WSDOT’s access management program to require entities that impact state or interstate highways to mitigate that impact.
C. Longer-Term Recommendations: Shift from Motor Vehicle Fuel Taxes The medium term recommendations continue the state’s reliance on the motor vehicle fuel tax. There are scenarios under which the motor vehicle fuel tax will be reduced even more quickly than projected in the consultants’ risk analysis. Section II of this report reviewed the energy and climate change policies that could affect motor vehicle fuel consumption per capita. Key information that the legislature will need to consider regarding the longer term viability of the motor vehicle fuel tax include:
Fleet composition. The consultants’ risk scenario assumes only modest changes in the composition of the fleet. If there is a much larger increase in Electric vehicles or other high mileage vehicles, then fuel consumption per capita could drop at an even faster rate than projected in the risk analysis.
Fuel prices. The consultants’ risk analysis assumes the fuel prices projected in the November forecast. If fuel prices increase over the projection, then fuel consumption per capita will decline as will motor vehicle fuel revenues.
Climate change. The consultants have not included any projected impact from a state policy to reduce VMT. If the Governor’s mandated review of VMT goals results in concerted state action to reduce VMT per capita, motor fuel consumption per capita would drop faster than projected in the risk analysis.
VMT forecast. WSDOT has suspended forecasting VMT while it reviews its forecasting methodology. The forecast will help refine consideration of funding methods that are reliant on the motor vehicle fuel tax.
In the longer term the legislature should consider the potential of shifting more rapidly from reliance on the motor vehicle fuel tax. The consultants recommend the following considerations in that eventuality.

Implementing Alternative Transportation Funding Methods Draft Final Report
Dec. 2, 2009 DRAFT 88
1. Increase reliance on vehicle fee revenue rather than motor vehicle fuel tax revenue
If fleet composition, the VMT forecast, climate change policies, or other developments in fuel pricing or vehicle technology accelerate the erosion of the motor vehicle fuel tax (or in the event the legislature elects not to index, increase, or add a special assessment to the motor vehicle fuel tax), the legislature should consider increasing the share of transportation revenues generated by fees.
The fees that are most practical to increase or add are:
Weight fee. Passenger vehicle weight fees are reduced by the registration fee, while truck weight fees are not. If the registration fee were not offset and truck weight fees were raised by a corresponding $30.00, the state would gain $3.8 billion in revenue over the 16-year plan period.
Tire fee. Adding a tire fee for transportation that extends to new vehicles and is higher for studded and larger tires would generate $117 million in revenue over the 16-year plan period.
2. Increase the transportation sales and use tax on motor vehicles
Increasing the additional sales and use tax on motor vehicles is another strategy to help shift the balance of transportation revenues away from the motor vehicle fuel tax. If the rate were raised to 0.5 percent from 0.3 percent, the state would gain $400 million in additional revenue over the 16-year plan period.
D. Longer Term Recommendations: Mobility As discussed in Section II mobility is a significant issue for the urban areas of the state. The state is using variable pricing as part of tolling to address mobility issues. Other funding methods that the legislature could consider include:
Expanding use of toll revenue. The legislature could consider allowing the use of toll revenue from HOT lanes or from bridge/highways tolls to be used to improve transit connections in a particular corridor and/or the improve connections to state transportation facilities such as ferries and park and ride lots.
Expanding use of ferry revenue. The legislature could also consider allowing the use of fares collected from ferry walk-on passengers to be used to improve transit service to ferry terminals. Part of WSF’s inability to shift passengers from driving on the ferry to walking-on which makes better use of peak auto deck space is the lack of transit service connections.
E. Other Funding Methods Recommended in the 2007 Study
1. VMT Fee
The consultants recommend that the legislature consider a VMT fee only if the federal government adopts a VMT fee or if there is a multi-state move towards a VMT fee. As discussed in the section on VMT, most states are awaiting federal action and a recent federal study determined that self-reporting, odometer reading, or other low technology ways to implement a VMT would most likely be subject to abuse and fraud.
Implementing Alternative Transportation Funding Methods Draft Final Report
Dec. 2, 2009 DRAFT 89
2. Sales Tax on Motor Vehicle Fuel
A sales tax on motor vehicle fuel would require specific legislative action to benefit transportation. The consultants recommend consideration of a special assessment fee rather than the sales tax.

Implementing Alternative Transportation Funding Methods Draft Final Report
Dec. 2, 2009 DRAFT 90
VIII. LOCAL JURISDICTION TRANSPORTATION FUNDING In Washington State, local transportation systems rely on a blend of federal, state, regional, and local funding mechanisms and shared responsibilities. This section:
Identifies the local jurisdictions responsible for planning, operating, managing, and maintaining transportation systems.
Describes funding sources and mechanisms available for local jurisdiction investment in transportation beyond those distributed by state government, which were discussed under state funding mechanisms.
Assesses the current local transportation funding system, including identifying the current use of available funding mechanisms and key policy trends affecting the system.
Makes recommendations for state legislative action that could assist local jurisdictions.
A. Local Responsibilities in Transportation In Washington State, a host of local jurisdictions, including general purpose governments and more specialized transportation entities, are responsible for the provision of transportation systems.
1. General Purpose Government
Counties. Washington’s 39 counties are responsible for managing 39,828 miles of roads, approximately 3,264 bridges, and four ferry systems in the unincorporated areas of the state. The Washington State County Road Administration Board (CRAB) sets standards and provides oversight and technical assistance to the counties’ road departments. Counties budget on calendar years not the state fiscal year.
Cities and Towns. Washington’s 281 cities and towns are responsible for 16,421 miles of streets and approximately 676 bridges within incorporated municipalities of the state. Cities and towns budget on calendar years not the state fiscal year.
2. Special Purpose Districts
Special purpose districts are limited purpose local governments separate from a municipal or county government. The legislature has enabled more than 80 different special purpose districts, including several related to transportation and transit systems.
Ports. Ports are municipal corporations of the state that are formed with a simple majority approval of voters within the proposed district’s boundary. An elected board of port commissioners sets policies for the port. Ports are engaged in economic development and transportation programs. Specific transportation programs include marine shipping, operation of rail facilities, fishing terminal development, commercial and recreational marina development, and air transport, and other goods movement activities. There are 75 public port districts in 33 Washington counties. The largest port districts in the state are the Ports of Seattle, Tacoma, Vancouver, Everett, Longview, and Bellingham.
Ferry Districts. A county legislative authority can establish a county ferry district to operate passenger-only ferry service within the district, according to RCW 36.54.110. King County established a County Ferry District in May 2008.
Implementing Alternative Transportation Funding Methods Draft Final Report
Dec. 2, 2009 DRAFT 91
Transportation Benefit Districts (TBDs). TBDs are quasi-municipal corporations and independent taxing districts formed solely for the purpose of acquiring, constructing, improving, providing, and funding transportation improvements within the district’s boundaries. Under RCW 36.73 cities or counties may form TBDs and may include other cities, counties, port districts or transit districts through interlocal agreements. The members of the legislative authority (city or county) proposing the TBD is the governing body of the TBD. There are eight existing TBDs in the state: Point Roberts (Whatcom County), Liberty Lake (near Spokane), Ridgefield (Clark County), Des Moines, Lake Forest Park, Edmonds, Olympia, and Prosser.
Public Transportation Systems. Public transportation systems are locally controlled special-purpose governments formed to provide public transit services. In Washington, there are 28 operating systems, using seven different governance structures.
Regional Transportation Investment Districts. RCW 36.120 authorizes the formation of a special district to plan and finance improvements to highways of statewide significance in the King, Pierce, and Snohomish County region. A Planning Committee was formed in 2002 to develop plans for improvements. The plan was then adopted by the counties. However, in November 2007, voters rejected the plan and the RTID was not formed.
B. Current Local Jurisdiction State and Local Funding Sources Local jurisdictions have a toolbox of different funding mechanisms and sources available for transportation systems. Given the number of different jurisdictions, funding mechanisms, and limitations associated with those mechanisms, local transportation funding is complex. Some jurisdictions receive transportation funding from the state through direct distribution or grants. In addition, each local jurisdiction has available mechanisms to generate revenue for transportation purposes. Generally the funding mechanisms in place fall into one of the following categories:
State grants. In addition to the direct distributions of the motor vehicle fuel tax and the Capron refunds discussed in the section on state funding methods, the state also has grant programs through the Transportation Improvement Board, the Freight Mobility Strategic Investment Board, and the County Road Administration Board.
Local option taxes. Local option taxes are “taxes that vary within the state, with revenues controlled at the local or regional level, and earmarked for transportation-related purposes”.58
General purpose funds, available to counties, cities, and towns.
Fees and fares, including mechanisms such as vehicle license fees, impact fees, and farebox revenues.
Other miscellaneous revenue, such as bond proceeds or advertising revenues.
The funding options available to each type of local jurisdiction and the current use of these options are described below.
58 Todd Goldman and Martin Wachs, “A Quiet Revolution in Transportation Finance: The Rise of the Local Option Transportation Taxes,” Transportation Quarterly Vol. 57, No.1 Winter 2003, pp. 19-32.

Implementing Alternative Transportation Funding Methods Draft Final Report
Dec. 2, 2009 DRAFT 92
1. General Purpose Government
Counties, cities, and towns, as general purpose governments, are eligible for state funding sources that are in addition to the state motor fuel tax and Capron distributions discussed in the section on state funding methods
Exhibit 27. Additional State Transportation Funding Sources Available to Counties and Cities
Funding Source Counties Cities
Transportation Improvement Board
Urban Arterial Trust Account x x
Transportation Improvement Program x x
Small Cities Account Programs x
Freight Mobility Strategic Investment Board
Freight Mobility Strategic Investment Program x x
County Road Administration Board
County Arterial Preservation Program (0.45 cpg of state motor vehicle fuel tax, distributed according to percentage of arterial lane miles)
x
Rural Arterial Program (0.58 cpg of state motor vehicle fuel tax, distributed on rural land area and mileage of paved rural arterials and collectors)
x
Source: Berk and Associates, 2009
a. Counties
In 2007, the total amount of county road revenues equaled $887 million. The exhibit below shows the percentage of funding by source. Total revenues generated by the counties, including taxes, licenses, permits, financing proceeds, and other fees and miscellaneous funding (but not operating transfers), equaled 57 percent of total funding. The largest single source for county road revenue is the County Road Property Tax at 43 percent of total funding.

Implementing Alternative Transportation Funding Methods Draft Final Report
Dec. 2, 2009 DRAFT 93
Exhibit 28. 2007 County Road Revenues, Percentage by Source
Source: WSDOT- 2007 FHWA reporting of federal form #536
Washington’s 39 counties are authorized to levy the following taxes for transportation, shown in the exhibit below.59
Exhibit 29. Transportation Tax Options and Fees Available for Counties
Funding Method Allowable Purpose Rate Current Use
Property Tax (RCW 36.82.040)
County roads and bridges in unincorporated areas
Up to $2.25 per $1,000 AV
All counties
Motor Vehicle and Special Fuel Tax (RCW 82.80.010)
“Highway purposes” (18th Amendment)
10% of the state fuel tax (3.75 cpg)
Not enacted, requires voter approval. Defeated twice in Snohomish County.
Commercial Parking Tax (RCW 82.80.030)
General transportation purposes
No rate set No counties have enacted this tax.
Local Option Taxes for High Occupancy Vehicle
HOV lane development and HOV program support
Motor Vehicle Excise Tax up to 0.3%
Only King, Pierce, and Snohomish are eligible. Not enacted.
59 Transportation Resource Manual, 2009: Washington State Department of Revenue
43%
2%13%
1%
16%
8%
14%
3%
County Road Property Taxes
CountySources-
Other
State Fuel Tax
State Sources- Other
Federal Sources
Other Sources
County Operating Transfers County Taxes- Other

Implementing Alternative Transportation Funding Methods Draft Final Report
Dec. 2, 2009 DRAFT 94
Funding Method Allowable Purpose Rate Current Use Systems (RCW 81.100.030, 81.100.060)
Employer Tax up to $2 per employee per month
Real Estate Excise Tax (RCW 82.46.10)
“Public works” capital projects (including streets)
Dependent on size, GMA, and use: 0.1%, 0.3%, 0.5%
All counties
Impact Fees (RCW 82.02)
Facilities (roads, schools, parks, etc) new development/capacity only
Varies by project. Varies by project.
Transportation Benefit District (TBD) Funding Mechanisms (RCW 36.73)
Roadways, high capacity transportation systems, public transit, and other transportation management programs
Up to $100 license fee with voter approval or
Up to $20 license fee councilmanic or voter approved
Sales tax
Tolls
Property tax
Not enacted by any county (acting as the TBD legislative authority).
Other transportation revenue sources include SEPA mitigation, utility assessments, timber harvest tax, and timber sales.
b. Cities
In 2007, the total amount of city transportation revenues equaled $1.3 billion. The exhibit below60 shows the percentage funding by source. Total revenues generated by the cities, including from taxes, fees, permits, licenses, financing proceeds, and other fees and miscellaneous funding (but not operating transfers), equaled 61 percent of total funding. Other city sources, such as charges for goods and services and financing proceeds, account for the largest share of total transportation revenue at 41 percent.
60 WSDOT, 2007.

Implementing Alternative Transportation Funding Methods Draft Final Report
Dec. 2, 2009 DRAFT 95
Exhibit 30. 2007 City Transportation Revenues, Percentage by Source
Source: WSDOT- 2007 FHWA reporting of federal form #536
Cities have the authority to levy certain transportation taxes, as shown in the exhibit below, but unlike counties, do not have a dedicated road revenue source for roads (county road property tax).
Exhibit 31. City Transportation Taxes
Funding Mechanism Allowable Purpose Rate Current Use Commercial Parking Tax (RCW 82.80.030)
General transportation purposes
No rate set SeaTac, Bainbridge Island, Bremerton, Mukilteo, Tukwila, Seattle
Border Area Motor Fuel Tax (RCW 82.47.020)
For street maintenance in cities and towns within 10 miles of the Canadian border
Up to $0.01 Cities of Sumas, Blaine, Nooksack, and Point Roberts TBD
Real Estate Excise Tax (RCW 82.46.10)
“Public works” capital projects (including streets)
Dependent on size, GMA, and use: 0.1%, 0.3%, 0.5%
Several cities across the State have enacted REET
Impact Fees (RCW 82.02)
Facilities (roads, schools, parks, etc) new development/capacity
Dependent on size, GMA, and use: 0.1%, 0.3%, 0.5%
Varies by project
7%
13%
41%
13%
7%
8%
9%2%
City Sources-Other (Permits,
Fees, etc.)
City Taxes-Other
City Operating Transfers
State Fuel Tax
State Sources-
Other
FederalSources
CityProperty
Taxes
Other Sources
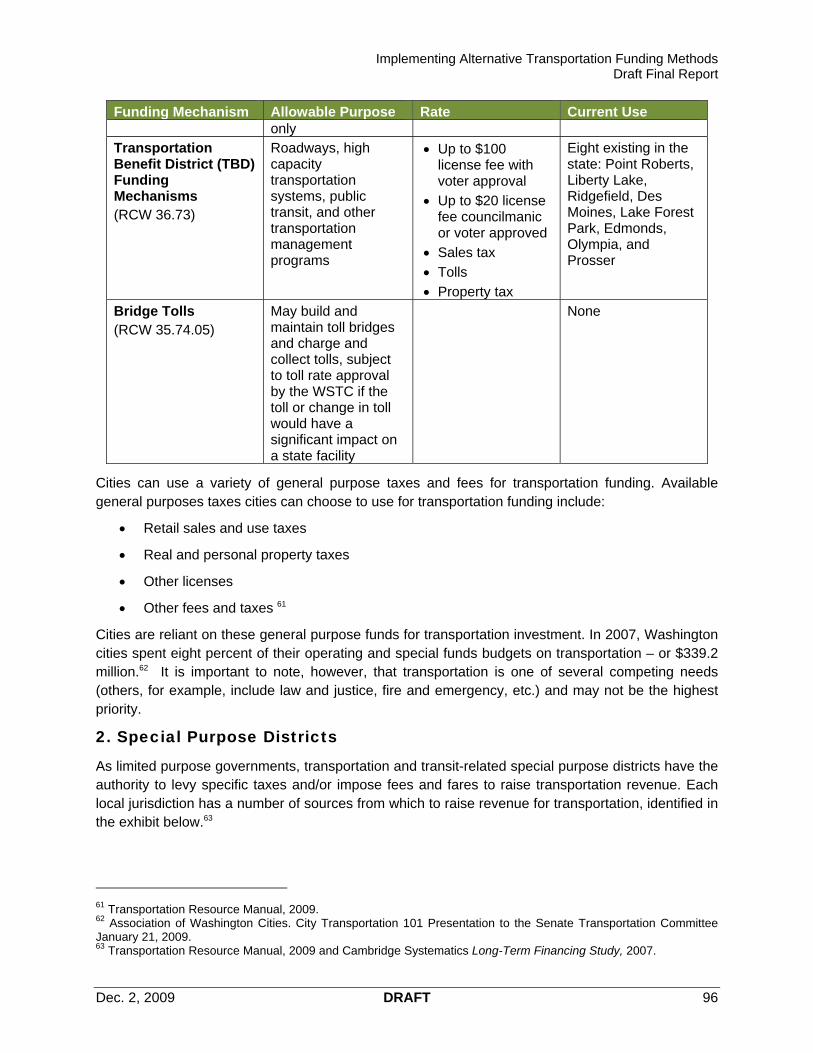
Implementing Alternative Transportation Funding Methods Draft Final Report
Dec. 2, 2009 DRAFT 96
Funding Mechanism Allowable Purpose Rate Current Use only
Transportation Benefit District (TBD) Funding Mechanisms (RCW 36.73)
Roadways, high capacity transportation systems, public transit, and other transportation management programs
Up to $100 license fee with voter approval
Up to $20 license fee councilmanic or voter approved
Sales tax
Tolls
Property tax
Eight existing in the state: Point Roberts, Liberty Lake, Ridgefield, Des Moines, Lake Forest Park, Edmonds, Olympia, and Prosser
Bridge Tolls (RCW 35.74.05)
May build and maintain toll bridges and charge and collect tolls, subject to toll rate approval by the WSTC if the toll or change in toll would have a significant impact on a state facility
None
Cities can use a variety of general purpose taxes and fees for transportation funding. Available general purposes taxes cities can choose to use for transportation funding include:
Retail sales and use taxes
Real and personal property taxes
Other licenses
Other fees and taxes 61
Cities are reliant on these general purpose funds for transportation investment. In 2007, Washington cities spent eight percent of their operating and special funds budgets on transportation – or $339.2 million.62 It is important to note, however, that transportation is one of several competing needs (others, for example, include law and justice, fire and emergency, etc.) and may not be the highest priority.
2. Special Purpose Districts
As limited purpose governments, transportation and transit-related special purpose districts have the authority to levy specific taxes and/or impose fees and fares to raise transportation revenue. Each local jurisdiction has a number of sources from which to raise revenue for transportation, identified in the exhibit below.63
61 Transportation Resource Manual, 2009. 62 Association of Washington Cities. City Transportation 101 Presentation to the Senate Transportation Committee January 21, 2009. 63 Transportation Resource Manual, 2009 and Cambridge Systematics Long-Term Financing Study, 2007.

Implementing Alternative Transportation Funding Methods Draft Final Report
Dec. 2, 2009 DRAFT 97
Washington state has 28 transit districts, including Sound Transit. In 2007, the transit districts other than Sound Transit, received $1.3 billion in operating and capital revenue, of which 64 percent was from sales and other local taxes.
Exhibit 32.
Transit Systems Excluding Sound Transit 2007 Revenue Sources
Source: Summary of Public Transportation 2007
King Country METRO, which had 62 percent of all transit passenger trips in the state in 2007, Community Transit, which had 6 percent, and Sound Transit are the only transit agencies that have used the maximum 0.9 percent sales tax authority. Kitsap Transit, which had 2 percent of passenger trips in 2007, has a local option sales tax of 0.8 percent, with other transit agencies ranging from 0.2 percent to 0.6 percent.
2007 Transit Revenue Total $1.3 billion
Sales or Local Tax64%
Fares/ Van Pool Revenue11%
Federal 11%
State 2%
Other12%

Implementing Alternative Transportation Funding Methods Draft Final Report
Dec. 2, 2009 DRAFT 98
Exhibit 33. Available Funding Sources for Transportation Special Purpose Districts
Funding Mechanisms
Jurisdiction Taxes Fees, Assessments, and Fares Bonds Other
Ports (Title 53 RCW)
Property tax levy up to $0.45 per $1,000 AV User fees Tolls on bridges or tunnels
Bond proceeds
Interest income Federal grants Operating revenues
Ferry Districts Annual ad valorem property tax of up to $0.75 per $1,000 AV,
counties > 1.5 million $.075 (RCW 36.54.130) Voter- approved annual excess property tax (RCW 36.54.140)
TBDs (RCW 36.73)
Border Area Motor Vehicle Fuel and Special Tax (enacted in Point Roberts TBD)
Local Option Taxes: Single-year, voter approved excess property tax levies Multi-year voter approved levies for bond redemption Voter approved sales tax up to 0.2%
Voter-approved motor vehicle license renewal fee up to $100 (or up to $20 without voter approval if TBD-wide, RCW 36.37) $20 fee enacted in Des Moines, Edmonds,
Lake Forest Park, Olympia, and Prosser $100 fee not enacted
Voter approved sales tax up to 0.2% Voter-approved vehicle tolling (administered by
WSDOT) Late-comer fees Commercial and industrial development fees
General Obligation Bonds
Gifts and donations Grants LID formation
Public Transportation Systems
Local Option Taxes (requires voter approval): Sales and use tax up to 0.9% Utility tax: (only City of Pullman authorized) PBTAs may use motor vehicle excise tax (up to 0.4% on renewals);
sales and use tax (up to 0.4%) for passenger ferries with voter approval
High capacity transportation taxes (requires voter approval) (RCW 81.104.140—81.107.170) Sales and use tax up to 0.9-1% (depending on whether criminal
justice tax also applied in county) Employer tax up to $2 per month per employee (RCW 81.100.030)
Farebox and pass revenues Ferry tolls (PBTAs for ferry service)
Revenue bonds
Federal and state grants
Contracts for service to community colleges, universities
Pass programs for schools
Advertising revenues Leasing revenues Other, including sales
of maintenance services, rental of vehicles and parking lots, etc.
RTIDs (Not in use) (RCW 36.120)
Sales and use tax up to 0.1% Local option fuel tax at 10% of the state fuel tax rate Parking Tax Employer tax up to $2 per month per employee
Vehicle registration fee up to $100 per year Tolls on facilities identified by Improvement Plan
and approved by State

Implementing Alternative Transportation Funding Methods Draft Final Report
Dec. 2, 2009 DRAFT 99
3. Other Alternate Funding Mechanisms Available
In addition, the following mechanisms are also available for transportation funding.
Local Improvement Districts (LIDs). LIDs are a special purpose financing mechanism that can be created by local governments (cities, counties, port districts, water districts, transportation benefit districts, and others) to fund improvements in specific areas, as authorized under RCWs 36.94.220, 36.94.300, 35.43, and 35.56. LIDs assess a tax on property owners who benefit from the improvements. LIDs can be initiated by a local government or by petition from property owners. The improvements must directly benefit nearby property owners.
Road Improvement Districts (RIDs). Similar to LIDs, RIDs are a special purpose financing mechanism that can be initiated by the counties to fund road improvements in unincorporated areas (RCW 36.88).
Value capture. Value capture is a method to help pay for a new piece of infrastructure, such as a road, by assessing a property that will benefit from the new infrastructure. The assessment levied on the affected properties tries to “capture” some portion of the increase in value that results from the new infrastructure. Local Revitalization Financing (LRF), as enacted in the Laws of 2009, Chapter 270, is the latest tool developed by the state. Other past Tax Increment Financing (TIF) mechanisms include the Local Infrastructure Financing Tool (LIFT) and the Community Revitalization Financing (CRF). Cities, towns, counties, and port districts are eligible to submit applications on a first-come basis on September 1, 2009.64
C. Assessment of the Local Funding Transportation System While many local funding mechanisms for transportation exist, not all are used to the same extent, if they are used at all. This section summarizes the current use of these tools by jurisdiction, and in particular, highlights mechanisms that are under-used and not used, as well as particular restrictions that may factor into their rates of use.
1. Counties
Property tax/road levy. All counties use the property tax levy (road levy), which is the county’s largest single revenue source for local transportation. The road levy is collected only in the unincorporated parts of counties and revenues must be expended in these areas. As shown in the exhibit below, counties are maximizing their use of the road levy tax, with 97 percent of available capacity. County road levy collections are limited by both the $2.25 per $1,000 AV limit and the 1 percent limit enacted as a result of Initiative-747. As a result, counties are generally limited in their ability to tap unused capacity at a councilmanic level and where they might wish to exceed the 1% levy growth limit they must seek voter approval. Twenty-nine (29) of the 39 counties divert a portion of their road levy taxes to other uses, primarily traffic policing expenses, which is permitted by state law and is similar to the state’s use of transportation revenues to fund the Washington State Patrol.
64 Foster Pepper. Comparison of Tax Increment Financing in Washington.

Implementing Alternative Transportation Funding Methods Draft Final Report
Dec. 2, 2009 DRAFT 100
Exhibit 34. County Road Levy Assessment (Tax Year 2009)
ROAD DISTRICT Percent
LEVY ROAD ROAD LEVY LEVY DISTRICT PERCENT of Road Levy Road levy
COUNTY RATE LEVY DIVERTED RATE LEVY SHIFTED Tota l Avai lable Capaci ty Used Per Capita
Adams 1.42 1,285,496 yes 0.00 0 0.0% 0 0 100% 146.83
Asotin 0.98 855,735 0.00 0 0.0% 600,000 600,000 59% 65.78
Benton 1.75 4,849,397 yes 0.17 460,720 8.7% 277,500 277,500 95% 138.65
Chelan 1.21 6,246,133 0.00 0 0.0% 400,000 400,000 94% 200.49
Clallam 1.12 6,212,691 yes 0.00 0 0.0% 0 0 100% 150.28
Clark 1.31 30,286,269 yes 0.19 4,480,000 12.9% 0 0 100% 143.94
Columbia 1.89 759,176 yes 0.24 95,000 11.1% 0 0 100% 614.72
Cowlitz 1.76 8,571,837 yes 0.00 0 0.0% 1,303,000 1,303,000 87% 204.14
Douglas 1.61 3,884,857 0.00 0 0.0% 0 0 100% 182.47
Ferry 2.25 1,099,137 yes 0.00 0 0.0% 303,000 0 100% 161.76
Franklin 1.79 2,749,680 0.00 0 0.0% 0 0 100% 194.94
Garfield 1.58 220,397 0.00 0 0.0% 29,000 29,000 88% 304.00
Grant 2.10 7,565,877 yes 0.00 0 0.0% 0 0 100% 185.23
Grays Harbor 1.86 4,930,441 yes 0.00 0 0.0% 0 0 100% 174.81
Island 0.61 7,654,735 yes 0.00 0 0.0% 0 0 100% 141.94
Jefferson 0.74 2,895,318 yes 0.17 678,401 19.0% 218,500 218,500 94% 144.01
King 1.59 83,470,166 yes 0.00 0 0.0% 0 0 100% 243.23
Kitsap 1.11 22,823,067 yes 0.07 1,438,344 5.9% 0 0 100% 133.94
Kittitas 1.08 4,628,507 yes 0.02 84,998 1.8% 442,000 442,000 91% 256.28
Klickitat 1.41 2,952,766 0.00 0 0.0% 0 0 100% 217.92
Lewis 1.75 9,366,990 yes 0.00 0 0.0% 90,500 90,500 99% 205.62
Lincoln 1.68 1,335,889 yes 0.31 250,001 15.8% 0 0 100% 280.06
Mason 1.28 8,195,798 yes 0.15 965,751 10.5% 0 0 100% 171.33
Okanogan 1.47 3,806,546 yes 0.00 0 0.0% 0 0 100% 156.10
Pacific 1.46 2,708,653 yes 0.00 0 0.0% 0 0 100% 187.91
Pend Oreille 1.07 1,116,533 yes 0.00 0 0.0% 549,500 549,500 67% 113.87
Pierce 1.41 57,371,887 yes 0.00 0 0.0% 0 0 100% 150.14
San Juan 0.40 2,940,100 yes 0.07 545,990 15.7% 425,500 425,500 89% 209.41
Skagit 1.25 10,445,791 yes 0.14 1,199,781 10.3% 1,405,000 1,405,000 89% 209.27
Skamania 1.26 1,312,378 0.00 0 0.0% 101,000 101,000 93% 155.04
Snohomish 1.13 51,316,065 yes 0.00 0 0.0% 0 0 100% 156.32
Spokane 1.16 15,137,601 yes 0.10 1,325,614 8.1% 8,743,500 8,743,500 65% 112.04
Stevens 1.66 4,325,556 0.00 0 0.0% 292,000 292,000 94% 126.76
Thurston 1.03 16,227,062 yes 0.16 2,500,000 13.3% 0 0 100% 116.73
Wahkiakum 1.05 410,104 0.26 99,997 19.6% 5,000 5,000 99% 116.34
Walla Walla 2.09 4,613,943 0.00 0 0.0% 0 0 100% 271.57
Whatcom 1.29 16,099,767 yes 0.06 706,541 4.2% 1,172,000 1,172,000 93% 190.11
Whitman 1.93 1,937,709 yes 0.00 0 0.0% 0 0 100% 308.31
Yakima 2.04 12,291,244 yes 0.00 0 0.0% 0 0 100% 137.90
GRAND TOTAL 424,901,298 14,831,138 3.4% 16,357,000 16,054,000 96% 166.46
Number of counties:
That divert road levy funds 29
That use the levy shift 14
Counties with banked capacity 17
Counties with useable capacity 16
Counties at their legal l imit 23
Souce: Department of Revenue, Local Property Tax Data for All Counties, 2009
ROAD LEVY SHIFTS TO COUNTY
CURRENT EXPENSE FUND
BANKED CAPACITY
(Unused Legal Capacity)

Implementing Alternative Transportation Funding Methods Draft Final Report
Dec. 2, 2009 DRAFT 101
No counties have implemented:
o Fuel tax, which requires voter approval and is limited to highway purposes.
o Commercial parking tax.
o Local Option Taxes for High Occupancy Vehicle (HOV) Systems. HCT taxes are available to regional transit authorities (RTA) in King, Pierce, and Snohomish Counties and transit agencies in Thurston, Clark, Kitsap, Spokane, and Yakima Counties for the development of HCT, commuter rail, and feeder transportation systems.
2. Cities
General purpose taxes. All cities rely on a combination of general purpose taxes and fees for transportation funding.
Commercial parking tax. Six cities have implemented the commercial parking tax.
Border Area Motor Vehicle Fuel and Special Fuel tax. This is a transportation option limited to cities, towns, and TBDs within ten miles of an international border. Four cities have enacted this tax.
Bridge tolls. No cities have enacted bridge tolls.
3. Special Purpose Districts
Not all special purpose districts authorized by statutes are in frequent use, as highlighted below.
Regional Transportation Investment District. RTID is the only transportation-related special purpose district not being used. Only the King, Snohomish, and Pierce county region was authorized under state statute to form a RTID. In addition, the statute requires voter approval for an RTID plan. In November 2007, voters rejected the RTID Planning Commission Plan.
Transportation Benefit Districts. There are eight TBDs formed in the state. RCW authorizes cities, towns, and counties to form TBDs, with the restriction that no TBDs could be formed in King, Pierce, or Snohomish County prior to December 1, 2007.
Special Purpose Districts. Some SPDs are, by their nature, restricted in use. For example, all counties can form a County Ferry District for the limited use of operating ferries. Only King County has established a County Ferry District.
Public transportation systems. These systems have several local option taxes available for use but some are not used as frequently.
Utility Taxes. The City of Pullman is the only public transportation system levying a utility tax, equivalent to .314 percent sales tax. 65
Local Option Taxes for High Capacity Transportation. Only RTAs in King, Pierce, and Snohomish have enacted a HCT tax.
65 Transportation Resource Manual, 2009.

Implementing Alternative Transportation Funding Methods Draft Final Report
Dec. 2, 2009 DRAFT 102
D. Why Local Funding Options Are Not Being Fully Used Reasons why local transportation funding mechanisms are not fully used fall under four main categories, each explored in greater detail below.
1. There may be significant political hurdles associated with implementing a funding mechanism.
Political considerations in the use of local transportation funding mechanisms are two-fold: (1) voter approval may be an explicit requirement of enacting a funding mechanism and (2) the public’s negative reaction and the subsequent political ramifications to an increase in taxes or fees factor into the decision of whether or not to use a local mechanism.
First, many local funding mechanisms require voter approval to increase taxes or fees for transportation funding. As indicated in earlier sections, examples of mechanisms requiring voter approval include most local tax increases and the license fee of up to $100.
Voter approval for a tax increase is difficult to obtain for a number of reasons. Geography can affect the likelihood of voter approval for transportation taxes. As has been noted in past statewide ballot measures, some parts of the state are more likely to accept tax increases than others. Local jurisdictions in parts of the state with a history of not approving tax increases may be less likely to even consider tax increases as a realistic option.
In addition, local jurisdictions may not have the internal resources to prepare for and implement an effective voter campaign and, particularly for some smaller jurisdictions, the revenue to be gained may not be commensurate with the costs of the election. There are, however, examples across the state where local jurisdictions have received voter approval for transportation funding. For example, King County Metro Transit and Community Transit in Snohomish County are at full capacity of the sales tax rate (0.9%) for transit funding, which required voter approval.
Second, even if voter approval is not technically required, raising local taxes and fees is politically costly. There is a general hesitancy to raise taxes and fees because it is a politically undesirable action to take. In addition, the revenue generated by the mechanism may be small, not be considered worth the political and extra administrative/implementation costs, and may not fully fund a program.
2. The funding mechanism may be restricted in its use or applicability.
Transportation funding mechanisms may be limited in their use by design or may be less applicable to a jurisdiction’s local market conditions.
First, some funding mechanisms are designated for use by specific jurisdictions. Examples include the border area motor fuel tax, authorized for cities and towns within ten miles of the Canadian border; local option taxes for HOV systems, authorized for King, Pierce, and Snohomish Counties (with voter approval); and local option taxes for RTIDs, authorized for King, Pierce, and Snohomish Counties (with voter approval).
Second, the funding mechanism may require funding be used for particular purposes. For example, revenue generated from the local option motor vehicle and special fuel tax for counties is designated for “highway purposes” as defined by the 18th amendment, which includes the construction, maintenance and operation of city streets, county roads, and state highways, and the operation of ferries. Impact and mitigation fees, while not limited to transportation uses, can only be employed for
Implementing Alternative Transportation Funding Methods Draft Final Report
Dec. 2, 2009 DRAFT 103
public improvements for specific development projects. Likewise, LID and RTID assessments must benefit the properties assessed. The total assessment cannot be greater than the demonstrated benefit.
Third, local conditions may make a funding mechanism less desirable, effective, or applicable. A County Ferry District is only applicable to counties where there is a demand for ferry service. The commercial parking tax is a local funding tool that makes sense in areas where there is market for paid parking. In the state, there are a limited number of urban areas where this market for commercial parking exists. No counties have implemented the commercial parking tax. Another rural and urban difference can exist in the case of transit; lower demand for transit in rural areas makes it more difficult for transit agencies to receive voter approval needed to use local transit option taxes.
For local jurisdictions near the borders of Oregon and Idaho, the use of local sales tax may be less desirable than in other parts of the state because of lower sales tax rates in Idaho and no sales tax in Oregon. Local jurisdictions may be less inclined to use the sales and use tax as a transportation funding mechanism because of the closeness of these other markets. In addition, when local sales tax options are used in those areas, the revenues generated may be lower than expected because of access to these other low-sales tax or no sales tax markets.
3. Implementation of a funding mechanism can require a high level of inter-jurisdictional cooperation and coordination, which may be difficult to obtain.
Coordination between local jurisdictions is required to implement some funding methods, including:
The local option motor vehicle and special fuel tax requires greater coordination between a county and cities. Counties are authorized to enact the tax that will benefit all jurisdictions within the county. Gas tax revenues are distributed to the county and the cities contained in the county on a weighted per capita basis.
Cities and counties are authorized to form TBDs through interlocal agreements. These TBDs may contain multiple jurisdictions, including port and transit districts, but all jurisdictions must approve the TBD formation.
Formation of a RTID in the King, Pierce, and Snohomish County area requires the vote of the county councils.
4. In the case of TBDs, the mechanism has only recently become available as a funding tool.
TBDs, under the current authority, are a new tool for cities, towns. The effective dates in which a local jurisdiction could first form a TBD varied as follows:
July 2007: All counties except King, Pierce, and Snohomish counties
December 2007: All counties, including King, Pierce, and Snohomish counties
January 2008: All counties and cities within the 36 counties
May 2008: All cities and counties66
Given the short time that this tool has been available for use, it is not surprising that there are not more TBDs in existence as of August 2009. In fact, given the short time line, there has been a lot of
66 Washington State Association of Counties, 2007.
Implementing Alternative Transportation Funding Methods Draft Final Report
Dec. 2, 2009 DRAFT 104
activity around TBDs. Six of the eight TBDs in existence were formed under the new authority. The City of Sequim’s TBD was narrowly defeated by the voters. Currently, the city of Burien and the city of Bremerton are in the TBD process of formation and seeking voter approval for the TBD’s revenue options.
E. Local Funding Alternatives
1. State Funding
One of the options available to the legislature is to provide increase direct and/or grant funding for general purpose governments and for special districts. Increased state funding would reduce the reliance on local option taxes and provide a comprehensive approach to the local transportation funding needs.
a. General Purpose Government
Distribution of motor vehicle fuel tax. As discussed in the section on state funding mechanisms, recommendations to index the motor vehicle fuel tax will benefit cities and counties which receive distributions from the motor vehicle fuel tax with total additional distributions of $1.4 billion under the consultants’ risk scenario and $2.2 billion using consumption estimates in the November forecast.
Increase cpg distribution of motor vehicle fuel tax. Counties receive 4.92 cpg of the state’s motor vehicle fuel tax and cities 2.96 cpg. The legislature could increase the cpg of the motor vehicle fuel tax distributed to local jurisdictions. For each 1.0 cpg increase, the local jurisdictions would receive an additional $1.1 - $1.3 billion (including revenues received through the urban and rural arterial trusts, TIB, and the county arterial preservation accounts).
Distribute other state revenues. The state could consider distributing some of its other revenue to counties and cities. In the section on state funding method recommendations, the consultants identified fees that might be increased in the longer term, particularly if motor vehicle fuel per capita erodes more quickly than projected. These same funding mechanisms could be enacted with the goal of sharing a portion of the increased revenues with local jurisdictions. For example, if the registration fee deduction for passenger car weight fees is eliminated and corresponding truck fees are increased, the resulting $3.8 billion in additional state revenue could be apportioned in part to local jurisdictions.
Increase grant programs. Cities and counties would benefit from increased state funding for the Transportation Improvement Board, the County Road Administration Board, and the Freight Mobility Strategic Investment Board.
b. Ports
Increase grant programs. Ports would benefit from increased funding for the Freight Mobility Strategic Investment Board.
c. Transit Districts
Increase grant programs. As shown in Exhibit 32 transit districts other than Sound Transit received 2 percent of their funding from the state in 2007. In the 2007-09 biennium WSDOT

Implementing Alternative Transportation Funding Methods Draft Final Report
Dec. 2, 2009 DRAFT 105
awarded 97 public transportation grants totaling $33 million through its Public Transportation Division. State funds provided $14 million and federal funds $19 million.
Expand use of toll revenue. As discussed in the section on state funding method recommendations, the legislature could authorize the use of HOT Lane toll, bridge/highway toll, and/or ferry fares for specific corridor transit service.
3. Cities Local Options
Cities and towns transportation funding issues stem from the lack of a dedicated funding source and the need to compete with other general purpose government needs.
No dedicated fund source. Cities and towns have no dedicated fund source for preservation and maintenance.
Reliance on general fund. Cities and town rely heavily on their general fund for transportation. Increasingly, transportation must compete with essential services such as fire and police for general fund dollars.
Legislative actions that would provide additional local option taxing authority to cities are:
Street utility authority. In 1995 the State Supreme Court ruled that the state authorized street utility fee was unconstitutional in a case involving the City of Seattle's residential street utility fee. The court found that the fee as it then existed was actually a property tax and as such was unconstitutional. In Oregon city street utility fees, unlike the fee as it existed in Washington, are based on land use and trip generation, and can only be used for maintenance. Fees are typically collected monthly with utility bills. The Association of Washington Cities (AWC) joined by several individual cities, is designing a street utility option for Washington State that would be used for “curb-to-curb” basic street maintenance and preservation and would be based on land use and trip generation.67
4. Counties Local Options
While counties have a dedicated source of transportation funding in the road levy property tax limitations have effectively capped that fund source at existing levels. Small counties in particular are limited in their ability to raise additional funds from the property tax given their small land value.
Legislative action that would make existing county option funding more useable are:
Transportation Benefit Districts. TBDs formed by counties are employer to collect up to a $100 license fee with voter approval or up to a $20.00 license fee with councilmanic authority. A modification that would increase the likelihood of this authority being used is:
o Allow councilmanic authority for a $100 license fee. This would eliminate the distinction between a councilmanic versus voter approved license fee authority.
Motor Vehicle and Special Fuel Tax. Counties are authorized by RCW 82.80.010 to impose with voter approval an additional county fuel tax of up to 10 percent of the state fuel tax rate or 3.75 cpg. The tax has been proposed twice in Snohomish County and both times it was defeated. Modifications that would increase the likelihood of this authority being used are:
67 Association of Washington Cities, Street Utility A New Local Option for Cities, September 2009.

Implementing Alternative Transportation Funding Methods Draft Final Report
Dec. 2, 2009 DRAFT 106
o Clarify the tax rate. There is a concern that some voters believe they are being asked to approve a rate of 10 percent of the retail price of fuel rather than 10 percent of the state fuel tax rate. Amending the language to state a specific cost per gallon could clarify exactly what voters are being to approve.
o Councilmanic authority. The legislature could consider giving counties some limited councilmanic authority to impose an additional motor vehicle and special fuel tax.
Legislative action that would add to existing county option funding is:
Rental Vehicle Sales Tax. The state imposes an additional68 5.9 percent sales tax on the retail rental of vehicles, exempting vehicles rented or loaned to customers by automobile repair businesses while the customer’s vehicles are under repair and vehicles licensed and operated as taxicabs. Revenues generated by the additional 5.9 percent sales tax are deposited in the multimodal fund.69 Local jurisdictions are authorized to impose additional70 rental vehicle sales taxes as shown in the exhibit below. Only one of the authorizations is for transportation related purposes. The state could permit other counties to impose an additional motor vehicle rental sales tax of 2 percent for transportation related purposes.
Exhibit 35. Local Jurisdictions Additional Motor Vehicle Rental Sales Tax
Authorizations
Jurisdiction Max. Rate
Rates in Effect RCW/Allowed Use
Regional Transit Authority/Transit Agencies71
2.72% 0.8% (Sound Transit) RCW 81.104.160 High capacity transportation service
King County Stadium Tax 2.00% 2.0% RCW 82.14.360 Baseball stadium
Counties 1.00% 1.0% - Franklin, Pierce, King & Spokane counties
RCW 82.14.049 Amateur or youth sports Sports facilities
4. Ports Local Options
Ports are supported by property taxes and revenue from leases and operations. Ports spend transportation dollars in association with rail which is privately owned. Although the Ports have not identified additional local option authority needs, they are interested in increasing support for freight infrastructure including rail.
68 Additional to the state sales and use tax of 6.5 percent. 69 Revenues from the 6.5 percent sales and use tax on rental vehicles are deposited in the General Fund. 70 Rates allowed are in addition to otherwise authorized local option sales and use taxes. 71 Local option taxes for high capacity transportation are available to regional transit authorities in King, Pierce, and Snohomish counties and transit agencies in Thurston, Clark, Kitsap, Spokane, and Yakima Counties for the development of highway capacity transportation, commuter rail, and feeder transportation systems. Only the Sound Transit RTA in King, Pierce, and Snohomish counties has enacted a high capacity transportation tax.

Implementing Alternative Transportation Funding Methods Draft Final Report
Dec. 2, 2009 DRAFT 107
5. Transit Local Options
For transit districts the largest funding need is for operations. As noted by the Washington State Transit Association in a report to the 2009 legislature, 2008 was a year of change and challenges for most of Washington State’s transit systems with sales tax revenues declining in response to economic conditions, and rising fuel costs and ridership. Transit systems are, at best, maintaining service levels by drawing down some reserve levels, raising fares, and/or deferring capital projects. “Almost every system in the state will face reductions in the 2010-14 timeframe if the economy does not improve or if new revenue is not found.”
Local funding options that the legislature could consider to increase funding for transit are:
Increase sales tax limit. The legislature authorized an additional 0.1 percent sales tax authority for the Regional Transportation Investment District. The legislature could consider transferring that authority to fund transit systems.
Employer tax. The legislature also authorized an employer tax of up to $2.00 per month per employee for the Regional Transportation Investment District. The legislature could consider transferring that authority to fund transit systems.
F. Local Funding Recommendations Cities and counties will, under existing state law, receive increased distributions from the state if the legislature indexes and/or increases the state motor vehicle tax rate. Depending on those decisions and the magnitude of the consequent distributions the state should also consider the following actions:
1. Medium-Term
In the medium term the legislature should consider:
Action 1. Increase if funding permits state grant programs from the Transportation Improvement Board, the County Road Administration Board, the Freight Mobility Strategic Investment Board, and the Public Transportation Division.
Action 2. Authorize cities to create street utilities to provide a dedicated funding source for street maintenance and preservation.
Action 3. Amend the authority for Transportation Benefit Districts to impose license fees so that a fee of up to $100 can be imposed by a councilmanic vote.
Action 4. Amend the authority for counties to impose an additional motor vehicle and special fuel tax to establish the rate as cents per gallon rather than as a percentage of the state motor vehicle fuel tax and provide councilmanic authority.
Action 5. Transfer the increased sales tax limit and employer taxes authorized for RTID to support transit.
2. Longer-Term
In the longer-term the legislature could consider additional state funds distribution to local jurisdictions and additional rental car tax authority.