draft - hampton roads planning district commission impact of the dod in...draft. hampton roads ......
TRANSCRIPT

Economic Impactof the Department of Defense
in Hampton Roads
Economic Impactof the Department of Defense
in Hampton Roads
PDCPDCHAMPTON ROADS
PLANNING DISTRICT COMMISSION
October 2013
E13-02
DRAFT

HAMPTON ROADS PLANNING DISTRICT COMMISSION
DWIGHT L. FARMER EXECUTIVE DIRECTOR/SECRETARY
CHESAPEAKE JAMES E. BAKER AMAR DWARKANATH SCOTT MATHESON DEBBIE RITTER ELLA P. WARD FRANKLIN BARRY CHEATHAM R. RANDY MARTIN
GLOUCESTER COUNTY CARTER BORDEN BRENDA GARTON
HAMPTON
MARY BUNTING WILL J. MOFFETT CHRISTOPHER STUART ISLE OF WIGHT COUNTY ANNE SEWARD DELORES DARDEN JAMES CITY COUNTY MARY K. JONES ROBERT C. MIDDAUGH
NEWPORT NEWS JAMES M. BOUREY McKINLEY L. PRICE SHARON P. SCOTT
NORFOLK ANTHONY L. BURFOOT PAUL D. FRAIM MARCUS JONES THOMAS R. SMIGIEL ANGELIA WILLIAMS Executive Committee Member
POQUOSON W. EUGENE HUNT JR. J. RANDLL WHEELER PORTSMOUTH JOHN L. ROWE JR. KENNETH I. WRIGHT
SOUTHAMPTON COUNTY MICHAEL W. JOHNSON BARRY PORTER
SUFFOLK SELENA CUFFEE-GLENN LINDA T. JOHNSON
SURRY COUNTY TYRONE W. FRANKLIN JOHN M. SEWARD
VIRGINIA BEACH ROBERT M. DYER BARBARA M. HENLEY LOUIS R. JONES JOHN MOSS AMELIA ROSS-HAMMOND JAMES K. SPORE JOHN E. UHRIN
WILLIAMSBURG CLYDE A. HAULMAN JACKSON C. TUTTLE YORK COUNTY JAMES O. McREYNOLDS THOMAS G. SHEPPERD JR.
PROJECT STAFF
RANDY R. KEATON GREG GROOTENDORST JAMES CLARY MICHAEL LONG CHRISTOPHER W. VAIGNEUR JENNIFER COLEMAN
HRPDC DEPUTY EXECUTIVE DIRECTOR CHIEF ECONOMIST SENIOR ECONOMIST GENERAL SERVICES MANAGER ASSISTANT GENERAL SERVICES MANAGER ADMINISTRATIVE ASSISTANT

ECONOMICIMPACTOFTHEDEPARTMENTOFDEFENSE
INHAMPTONROADS
Preparation of this report was included in the HRPDC Unified Planning Work Program for Fiscal Year 2012-2013, approved by the Hampton Roads Planning District Commission at its Quarterly Commission Meeting of April 19, 2012. Additional funds were provided by the HRPDC Unified Planning Work Program for Fiscal Year 2013-2014, approved by the Hampton Roads Planning District Commission at its Quarterly Commission Meeting of April 18, 2013.
Prepared by the staff of the Hampton Roads Planning District Commission
OCTOBER 2013

ReportDocumentation
TITLE:Economic Impact of the Department of Defense In Hampton Roads AUTHORS:James Clary Greg Grootendorst REPORTDATE:October 2013
GRANTS/SPONSORINGAGENCYLocal Funds ORGANIZATIONNAME,ADDRESSANDTELEPHONEHampton Roads Planning District Commission 723 Woodlake Drive Chesapeake, Virginia 23320 (757) 420-8300 http://www.hrpdcva.gov
ABSTRACTThe Department of Defense (DoD) is an integral component of the regional economy. Fluctuations in defense spending and changes in defense strategy can have a significant impact on the region’s economic well-being. To gain a better understanding of the current and potential impact of the defense presence, staff has conducted an in-depth analysis of the DoD’s regional economic footprint. This analysis will enable a more accurate assessment of the economic role of the DoD as well as the impact of future DoD actions. ACKNOWLEDGMENTSPrepared by the staff of the Hampton Roads Planning District Commission. Preparation of this report was included in the HRPDC Unified Planning Work Program for Fiscal Year 2012-2013, approved by the Hampton Roads Planning District Commission at its Quarterly Commission Meeting of April 19, 2012. Additional funds were provided by the HRPDC Unified Planning Work Program for Fiscal Year 2013-2014, approved by the Hampton Roads Planning District Commission at its Quarterly Commission Meeting of April 18, 2013.

TABLE OF CONTENTS Contents Executive Summary ________________________________________________________________ I Introduction _______________________________________________________________________ 1 Literature Review ________________________________________________________________ 7 Impact of Defense Spending ____________________________________________________ 10 Scenarios of Change _____________________________________________________________ 22 Conclusions ______________________________________________________________________ 33 Appendix 1- Bibliography _______________________________________________________ 35


EXECUTIVE SUMMARY
Page | I
Executive Summary STRATEGIC HIGHLIGHTS The Department of Defense (DoD) is an integral component of the Hampton Roads economy. Military spending has proved to be an important catalyst for regional growth by providing high-quality middle-class jobs and supporting numerous local businesses and industries. Changes in the size and scope of defense expenditures, both nationally and regionally, ripple through the economy. This analysis explores the relationship between the defense industry and the region’s economy, and provides insight into the impact of scenarios for changes in defense spending in Hampton Roads. As the nation concerns itself with both the budget deficit and shifting geopolitical realities, it will become increasingly important to understand how changes in defense spending will impact the regional economy. KEY FINDINGS • Current estimates for Hampton Roads indicate military personnel stationed regionally earned $8.3 billion in salary and benefits (CY011) and that federal contracts performed for the DoD, Veterans Affairs, and Homeland Security totaled $10.1 billion (FY2011). Regional contracts performed in FY2012 fell to $7.9 billion; however there is a high degree of variability in defense contracts from year to year. • There were 92,962 military personnel stationed in the region in 2011, and an additional 51,340 federal civilian employees, the majority of which worked in defense functions (44,600). Department of Defense spending on salaries, retirement, and procurement, as well as the indirect and induced account for approximately 393,000 (40%) of the 995,000 employees in the region.
020,00040,00060,00080,000100,000120,000140,000160,000
1970 1973 1976 1979 1982 1985 1988 1991 1994 1997 2000 2003 2006 2009
Hampton Roads Military Personnel
Source: Bureau of Economic Analysis

EXECUTIVE SUMMARY
Page | II
• Defense-related activities and spending account for 41.2% of the region’s economy, generating approximately $35.2 billion in gross regional product (direct, indirect, and induced). • Hampton Roads has experienced periods of decline in military personnel on several occasions. From 1989 to 1998 the region’s military personnel declined from 143,017 to 106,541 (a loss of 34,476); a decline that was somewhat offset by a booming national economy. A decline from 113,193 in 2003 to 98,333 in 2009 was offset by growing defense procurement and increased personnel pay in Hampton Roads. While there will likely be continued decline in the region’s personnel, this is likely to be coupled with both slow growth nationally and declining defense procurement and pay, potentially leading to a difficult period of economic adjustment. • The winding down of the military commitment in Afghanistan as well as cuts that were implemented through the Budget Control Act have reduced the FY2013 Department of Defense budget from $645.8 billion to $616.0 billion. The budget consists of $527.4 billion in baseline spending and an additional $88.5 billion for operations in Afghanistan. While each service had its budget cut from the FY2012 budget, the Navy was relatively less impacted than the Army (5.9% cut versus an 8.9% cut). Funding was projected to have declined further in FY2013. • A major concern with the region’s reliance on the defense industry stems from the fear of being an industrial monoculture that would be susceptible to industry declines. While port related activities and tourism are also basic sector industries, the large size of the defense industry’s impact renders this a very real concern. • With the termination of the Census Bureau’s Consolidated Federal Funds Program, consistent data on direct federal spending in Hampton Roads has become more difficult to acquire. Levels of federal spending must now be pieced together from several sources, increasing the uncertainty and decreasing comparability of federal expenditure data.

INTRODUCTION
Page | 1
The Department of Defense (DoD) is a leading driver of Hampton Roads’ economy, serving as the region’s most significant industral cluster and heavily influencing the region’s economic well-being. While Hampton Roads also possesses an excellent port and a strong tourism economy, the size and breadth of the defense sector’s impact on the region requires additional attention. The extent of DoD impact includes military personnel, DoD civilian employment, government contractors, the ship building and repair industry, as well as the veterans that both boost the Hampton Roads workforce and inject spending into the local economy.
History of National Defense Spending Cycles Defense spending levels have changed significantly over time, driven by wars, efforts to balance the federal budget, and ever changing global conditions. While there has been a general trend of increasing defense spending after the World War II era, these drivers have created large swings in the level of spending. The changes in federal spending, as well as the changing emphasis of spending over time has had a profound impact on the local areas where these expenditures were made.
$0$200$400$600$800
$1,000$1,200
1929 1932 1935 1938 1941 1944 1947 1950 1953 1956 1959 1962 1965 1968 1971 1974 1977 1980 1983 1986 1989 1992 1995 1998 2001 2004 2007 2010
Billi
ons
of D
olla
rs o
f Def
ense
Sp
endi
ng (2
012)
U.S. Defense Spending (Inflation Adjusted)
Source: Bureau of Economic Analysis, HRPDC

INTRODUCTION
Page | 2
In 1929, real U.S. defense spending was only $9.8 billion (2012 dollars).1 Except for during wars, defense spending in the U.S. had never exceeded 1% of the Gross Domestic Product (GDP), but this changed as the economy shrank during the great depression coupled with modest increases in defense outlays; defense spending had only grown to 1.2% of GDP in 1931 and rose to 1.6% of the economy in 1939. Real defense spending only grew to $20.1 billion (2012 dollars) on the eve of World War II in 1939, when the U.S. military consisted of only 250,000 personnel.
The outbreak of World War II permanently altered the defense posture of the United States. During the war, the number of service personnel increased to 12 million, and defense outlays in 2012 dollars grew to one trillion dollars; 43% of the national economy was devoted strictly to the war effort. After the surrender of Japan, a rapid defense draw down commenced with the number of military personnel falling to 1.5 million, and defense spending declining to $144 billion (2012 dollars) in 1948, equivalent to 6.8% of GDP. It is important to note that despite this 1 Bureau of Economic Analysis- Table 1.1.5
0%5%10%15%20%25%30%35%40%45%50%
1929 1932 1935 1938 1941 1944 1947 1950 1953 1956 1959 1962 1965 1968 1971 1974 1977 1980 1983 1986 1989 1992 1995 1998 2001 2004 2007 2010Def
ense
Spe
ndin
g as
Sha
re o
f U.S
. Ec
onom
y
Defense Spending as a Share of GDP
Source: Bureau of Economic Analysis, HRPDC
WWII
Korea Vietnam

INTRODUCTION
Page | 3
large decline in military spending and simultaneous decline in GDP, this was a strong period of economic growth because pent up consumer demand combined with high personal savings and retained profits of businesses were unleashed on the economy. Additionally, the GI Bill2 helped to prevent the labor market from being overwhelmed with new jobseekers, as well as increasing the job skills of those service people who took advantage of the program. The unemployment rate rose from 1.2% in 1944 to 2.9% in the period between 1946 and 1948. The Korean conflict caused another increase in defense spending, with expenditures spiking to $399 billion in 1953 (2012 Dollars), though this was only 40% of the spending levels during World War II, and 14.7% of the economic output versus 43.0%. Unfortunately, the adjustment from the Korean War was much more difficult. While post Korean War spending only fell by $72 billion to $327 billion (11.3% of GDP), the economy did not have the pent up demand to compensate for the fiscal contraction. The defense industry laid off 1.6 million employees between 1953 and 1956, and a further 750,000 exited the military. DoD civilian employment also declined by 150,000 during this period. The economy stalled into recession in 1953, and had a brief recovery until another recession in 1958. Unemployment rates reached 6.8% in 1958. Because the Korean Conflict had minimal impact on domestic consumption, the cuts to federal spending significantly lowered aggregate demand. Further, unlike World War II production, there were companies that had focused on defense production that were unable to pivot to produce goods for private consumption. The workers who lost their jobs from these factories had no government programs to help them adjust to the new economic situation. The companies that suffered the worst were producers of conventional battlefield equipment (guns, ammunition, etc.), as the military shifted to 2 The GI Bill offered unemployment benefits for a full year, government guaranteed loans for homes, farms and business, and financial support for 4 full years of education. This allowed the 11 million veterans to reenter the labor market gradually. Roughly 800,000 took the opportunity to enroll in college in 1946.
Conflict % of GDP World War II...........43.0%Korea…………………14.7%Vietnam……………….8.9%80’s Build Up..….…..7.4%War on Terror………5.6%

INTRODUCTION
Page | 4
higher technology, particularly with regards to military aircraft. By 1955 aircraft purchases accounted for 60% of all defense procurement. Spending patterns during the Vietnam War did not have the extreme peak and valley that occurred with other conflicts, but cutbacks after peak spending of 1968 did affect military suppliers, particularly in the aerospace industry, which had flourished after the Korean conflict. Spending during Vietnam reached $467 billion (2012 Dollars), but represented a much smaller share of the overall economy than spending during Korea, constituting only 9.8% of U.S. economic output. Defense spending fell to 6.4% of economic output by 1975, and continued to decline to 5.7% in 1979, even as real defense spending began to grow. The continued declines reflected not only the disengagement from Vietnam, but also the easing of tensions with the Soviet Union during President Nixon’s second term. While the Johnson administration had plans to combine tax cuts and federal spending to ease the declines in defense expenditures, the Nixon administration favored fiscal restraint in an attempt to curb inflation. Defense spending began to increase in 1979 with increased tensions in the Cold War, highlighted by the Soviet Union’s invasion of Afghanistan. This continued through 1987, culminating in a peak of $623 billion (2012 dollars) spent on defense, or 7.4% of GDP. While this was then followed by a period of declining defense spending through 1998 (and defense spending declining as a share of GDP through 2000), the nation experienced a robust expansion that eased the effects of defense cutbacks. Additionally, even at the lowest level of spending in 1998 ($446.7B in 2012 dollars), real defense spending was higher than every year from 1947 until the 1980s defense buildup (excepting 1968).
As a result of the decline in aircraft orders and reductions to the space program, Seattle based Boeing cut its workforce from 100,000 in the late 1960s to 30,000 by the mid-1970s. This led aerospace engineers to joke, “Last one out of Seattle turn off the lights.”

INTRODUCTION
Page | 5
History of Hampton Roads Defense Spending Cycles
It is significantly more difficult to evaluate periods of growth and decline in Hampton Roads defense spending. The nature of procurement spending for defense leads to significant variance between when the dollars are budgeted, obligated, and spent within an individual region, which tends to smooth out at the national level. Further, the nature of shipbuilding procurement tends to especially accentuate this variability within Hampton Roads. As available data sources have changed over time, there are two data sets that are currently available for federal procurement in Hampton Roads. The Census Bureau’s Consolidated Federal Funds Report (CFFR) covers procurement data from 1985-2010, and data available from the Office of Management and Budget at USASpending.gov, which had quality issues in the period before 2008. The first period of decline in Hampton Roads’ military spending occurred as the U.S. cut troop levels in 1969 both nationally and regionally, and military personnel in Hampton Roads fell from 144,581 in 1969 to 109,102 in 1972. The region’s total employment in 1972 was actually above the 1969 level despite these cuts, as private sector employment and per capita income had performed strongly compared to the nation.
020,00040,00060,00080,000100,000120,000140,000160,0001969 1971 1973 1975 1977 1979 1981 1983 1985 1987 1989 1991 1993 1995 1997 1999 2001 2003 2005 2007 2009 2011M
ilita
ry E
mpl
oym
ent i
n H
ampt
on
Road
s
Hampton Roads Military Employment
Source: Bureau of Economic Analysis

INTRODUCTION
Page | 6
The next regional decline in military employment occurred during the 1989 to 1998 period, also coinciding with a national defense drawdown after the 1980s. The number of military personnel in the region fell from 143,017 in 1989 to 106,541 in 1999. While regional employment continued to grow through this period (except during the 1991 and 1992 recession), this was a time of significant economic expansion across the nation. Per capita income in the region fell from 99.0% of the national level in 1986 to just 88.2% of the national level in 2000. The military’s share of total employment had been on a slow decline since 1974, when it was 19.4% of Hampton Roads’ total employment. This trend was accelerated in 1988 when it went from 17.0% to 11.6% of total employment in 1998. The war on terror featured an interesting dynamic where the number of military personnel never grew significantly in the region (and began declining again in 2007), but rising military pay and increasing procurement actually caused the economy to grow significantly. Per capita income grew from $26,749 in 2000 (88.2% of the national level), to 39,109 in 2009 (101.2% of the national level). The three year moving average of procurement spending grew to $9.05 billion or $5,406 per capita in Hampton Roads (total defense spending was $14.9 billion in Hampton Roads).3 Unfortunately, it appears the national budget issues (particularly driven by the growth of Medicare) will force a decline in national and regional defense spending. Given this region’s economic reliance on the defense industry and the lack of a booming economy nationally (or a booming alternate industry locally), Hampton Roads is likely to experience a period of extreme adjustment.
3 Source: Consolidated Federal Funds Data from 2007 to 2009

LITERATURE REVIEW
Page | 7
Literature Review A substantial body of literature has attempted to estimate the economic and employment impacts in government spending in general, and defense outlays in particular. These efforts encounter the same issues prevalent to all social science research, given the lack of a laboratory or a control group in which to run simulations of these impacts. It is clear that there are two separate questions that relate to the DoD’s impact in a regional economy. First, what is the impact of department of defense spending within the region? This question involves trying to find the multiplier for both defense spending and military employment within a region. Second, what is the long term economic impact of defense spending within a region, especially with regards to the long-term growth rates? This slightly different question is much more difficult to answer, and much of the research on this topic has occurred at the national rather than the regional level. It is especially important when analyzing what the long term impact of reduced DoD spending in a region might be. Lastly, but related to both these questions, is what impact do changes in defense spending at the regional level have on the local economy, and how can a region best adjust to these reductions. Key points that have emerged from the literature are:
• Regions have very little control over defense spending. While levels of defense spending are typically quite stable, large and sudden changes in defense spending result in severe economic shocks when they occur. • As channels of defense spending have changed, it has changed the economic performance of regions that had been tied to the outdated forms of military production. This includes the decline in traditional military production (guns and ammo) impacting the Midwest in the 1950s, and decline in aircraft purchases impacting Seattle in the 1970s. • Defense spending continues to be far more concentrated spatially than most types of government spending, and the regional impact will be noticeably higher than the national impact. This makes political action difficult to arrange.

LITERATURE REVIEW
Page | 8
• There is reason to believe that most spatial estimates understate the concentration of defense spending, as subcontracting appears to be more spatially concentrated than prime contacts. Data from USASpending.gov on contracts by place of performance have allowed researchers to correct for complications that result from subcontracting in current research. Economic multipliers: Economic multipliers fully capture the direct, indirect, and induced employment for any given level of direct employment. A multiplier of 2.0 would imply that for every new job directly supplied, an additional job would be created in the economy through indirect and induced effects.
• Estimates of economic multipliers for defense contracting have changed over time, with early multipliers estimated to be as high as 2.3 in the early 1970s. • Studies of a shipyard in Portsmouth, New Hampshire found an employment multiplier of 1.6 (this study is quite dated), and another one conducted at French shipyards at Brest and Toulon have found multipliers of 1.5 and 2.0, respectively (the Toulon study was conducted in 2005). • More recent studies in European countries of the impact of Naval and Army bases have found that spending has a multiplier of 1.55 and employment has a multiplier of 1.54. These multipliers would tend to be lower than that which we would see in the U.S. due to the relatively more generous benefits of the military versus civilian industries. • A San Diego study conducted in 2012 found an economic multiplier of 1.64 for military personnel and a smaller multiplier of 1.55 for spending. A similar study in San Diego in 2011 found a multiplier of 1.67 for DoD spending and 1.59 for the combination of military and civilian DoD employees.
Economic Growth: • Econometric analysis of expenditures at the regional level over a medium term shows that military expenditure positively impacts regional growth. At the state level, attempts to estimate the impacts of defense on long-term economic growth have been positive, negative, and indeterminate. • At the local level, military expenditures serve as important sources of extra-regional revenues because the goods and services the Pentagon purchases from private producers are effectively ‘exported’ to the rest of the nation, serving as a form of economic ‘base’.
LITERATURE REVIEW
Page | 9
Impact of Defense Drawdown: • DoD personnel typically have a lower employment multiplier than general defense spending, and thus areas that have a relatively higher concentration of personnel to defense spending are in a better position to weather cutbacks, but are also less likely to benefit during periods of growth. This indicates that as Hampton Roads has shifted to become more reliant on contracting, that cutbacks will have a greater impact here than in the past • Considerable disagreement in the literature exists as to whether a base in a smaller or lager jurisdiction has a greater impact per dollar spent, although a base closure in a non-metropolitan area will have a greater impact as a result of its outsized role in the local economy. • Cuts in defense spending are likely to have an outsized impact versus cuts to private industry, as findings suggest that workers follow jobs in the defense industry, rather than vice versa, and indicate that a process of defense-related regional labor pool formation, amplified by interstate migration, adds to the volume of interregional labor flows. • Many regions of the nation remain grossly dependent upon defense expenditures yet there exists no consensus on how to manage the effects of a defense spending build-down. • The health of a state or local economy greatly affects the extent of distress caused by defense cuts. In a healthy economy, increased defense spending will drive up rents, home prices, and crowd out economic activity. Where the economy has stagnated except for defense’s contribution, or where the defense industry is the only ‘export’ industry, evidence suggests that the multiplier may be larger.
IMPACT OF DEFENSE SPENDING
Page | 10
ANALYSIS OF THE IMPACT OF DEFENSE SPENDING INTRODUCTION OF ANALYSIS The economy of Hampton Roads has been impacted by Department of Defense (DoD) activities for many decades. These activities occur at a variety of sites, including military installations, area shipyards, and at facilities of regional defense contractors. This impact also flows through many channels, including salary & benefits, contracts & procurement, grants, and veterans benefits. This region has one of the highest concentrations of military personnel and spending in the world. In terms of absolute military employment, Hampton Roads possesses the second highest concentration with 92,962 in 2011, just behind San Diego’s 107,893. The next highest is Washington D.C. which has ~23,000 fewer military personnel than Hampton Roads. A significant portion (5.5%) of this region’s population serves in the military, the 14th highest rate in the country. In areas with a population greater than 500,000, Hampton Roads stands 3rd behind Colorado Springs (6.2%) and Honolulu (5.7%) (compared with a 0.7% national concentration of military personnel). The region has the second highest concentration of employment coming from military personnel, accounting for 9.4% of total region employment. Colorado Springs military personnel constitute 10.9% of their total employment. DATA SOURCES Consolidated Federal Funds Report: The Consolidated Federal Funds Report (CFFR), produced by the U.S. Census Bureau, was widely considered the best comprehensive source of information on government spending. The Census Bureau released it on an annual basis until budget cuts eliminated CFFR reporting in 2012. The CFFR data presents government expenditures or obligations at the state and county level, and this data was available for the following categories: grants, salaries and wages, procurement contracts, direct payments for individuals, other direct payments, direct loans, guaranteed or insured loans, and insurance. Expenditures were reported by the responsible department or agency, and classified by affected program. The program only

IMPACT OF DEFENSE SPENDING
Page | 11
has data for FY1985 – FY2010, but is useful for providing baseline changes in Hampton Roads federal spending, both for the military and other federal functions. USASpending.gov: USASpending.gov is a public website that was created in response to the Federal Funding Accountability and Transparency Act of 2006, and is maintained by the Office of Management and Budget. It provides raw, low-level records on federal spending. It is available at the county level and is categorized by agency as well as place of performance for the contracted work. It is currently the only government-provided source of data which is both local and program level. Unfortunately, the data from USASpending.gov is both incomplete and inaccurate, only achieving acceptable data level qualities for obligations after its December 2007 launch. Significant effort has been made at the federal level to improve the quality of this data, particularly improving the transfer of data from the Federal Procurement Data System to the website. USASpending.gov only contains information about contracts and direct assistance (there is no information about payrolls or disability/retirement benefits). Bureau of Economic Analysis: As part of its Regional Data Program, the Bureau of Economic Analysis (BEA) calculates data for military employment, military compensation, as well as government transfers to Veterans. This data set currently begins in 1969 and continues through 2011 (it is updated annually, with a 2 year data-lag). Military employment is measured as the number of military personnel assigned to active duty units that are stationed in the area plus the number of reserve unit members. The estimates of active duty employment are based on the annual averages of 12 monthly observations for a given year based on reports from each branch (including the Coast Guard). Employment estimates for reserves are confined to members that meet regularly for training and are based on the amount of time that the reservist and members of the National Guard are in training. Estimates of military salary and wages are conducted at the state level using estimates of cash wages (including allowances) for full-time and reserve personnel as well as estimates of pay-in-kind. While the estimates of salary and wages are not available on a local or regional level, estimates of total personnel income are available. Military personnel income includes healthcare benefits, Tricare, contributions to life insurance, and military pension contributions. Using estimates at the state and national level, salary and wages have ranged from 54.6% to 66.4% of total military personnel income.

IMPACT OF DEFENSE SPENDING
Page | 12
Bureau of Labor Statistics: The Bureau of Labor Statistics (BLS) has estimates of civilian payroll employment, which are helpful in measuring the scope of the military’s regional impact. Particularly useful are the industry employment numbers for those that are associated with military contracting, including professional and business services, and shipbuilding and repair. The BLS collects its payroll employment data from surveys of all businesses that are covered by the Unemployment Insurance Program. ECONOMIC IMPACT OF MILITARY PERSONNEL Military personnel play a vital role through contributing demand to the local economy, and bringing in dollars from outside the economy through wages paid by federal taxes. In addition, military dependents form an important piece of the regional labor force. In general, military families have a larger impact on the local economy than bachelors and married men whose families are not with them. Military families tend to be more involved in the community and spend most of their income locally. Personnel who are single spend less in the local economy with relatively more of their income going to entertainment and travel. One difficulty in assessing the impact of the military personnel in the region comes from developing a reliable estimate for the number and salary of military personnel in the region. One method comes from using the data provided by the economic impact assessments made by both the Navy Command Mid-Atlantic and from the Joint Base Langley-Eustis. The Economic Impact Analysis Joint Base Langley-Eustis FY11 indicates that there were 13,566 active duty (mixture of Air Force and Army personnel), and an additional 2,365 Air Force Reserve/Air National Guard. TheNavyinHamptonRoads, a statistical report for
How many military personnel are in Hampton Roads? Various Sources for 2011 Indicate: Navy Command Mid-Atlantic and Joint Base Langley-Eustis indicate 93,654 Department of Defense Base Structure Report Indicates 71,920 – 88,112 Bureau of Economic Analysis 92,962 Hampton Roads Statistical Digest 90,673

IMPACT OF DEFENSE SPENDING
Page | 13
FY11, indicated that there were 80,088 active duty personnel at its bases and an additional 3,008 students and transients. This would indicate that there were 93,659 active duty personnel in this region. Another estimate is provided by examining the Department of Defense’s Base Structure Report for 2012. This indicates that there are between 71,920 and 88,112 active duty personnel in the region, as well as 10,223 to 18,673 reserves in this region. Yet another estimate is reported by the Hampton Roads Statistical Digest, indicating the region houses 90,673 personnel at its bases. An estimate provided by the Bureau of Economic Analysis, probably the most consistent source of data, indicates that this region contained 92,962 military personnel in 2011.4 There is even greater variability in estimating the wages earned by the military personnel in Hampton Roads. The economic impact studies prepared by the Navy and Joint Base Langley-Eustis suggest that military salaries in the region were $6.0 billion. The Bureau of Economic Analysis earnings data for military employees does not break out salary and wages separately; it includes other forms of earnings including life insurance, retirement contributions & income, and health insurance to name a few.
4 The Bureau of Economic Analysis Data includes Coast Guard Personnel.
$0$2$4$6$8$10$12
Billi
ons o
f Cur
rent
Dol
lars
of W
ages
Military Personnel Earnings in Hampton RoadsSalary and Wages Other Earnings
Source: Bureau of Economic Analysis, HRPDC

IMPACT OF DEFENSE SPENDING
Page | 14
HRPDC staff estimated that since 1990, this share of military earnings derived from salary and wages has gone from 64.0% in 1990 to a high of 66.4% in 1995 and fell to 55.0% in 2011. Regional military earnings were $10.4 billion in 2011, indicating that salaries and wages that year were $5.7 billion.
Another method of evaluating salary and wages was provided by the Consolidated Federal Funds Report, but unfortunately this program concluded with data from FY10. It indicated that salary and wages earned by Department of Defense personnel was $5.4 billion, but this includes both military and civilian employees. When analyzing the impacts of changes in employment and earnings over time, it is important to use a consistent methodology, so Bureau of Economic Analysis military employment, earnings, and HRPDC estimates for salaries and wages will be used for this analysis. While the number of military personnel fell by 17,560 between 2000 and 2011, regional salary and wages increased by 52% to $5.74 billion and total military personnel earnings in Hampton Roads increased by an even greater percentage (76.6%, nominal). The relative importance of incomes for the military increased in significance throughout the decade, driven initially by increasing incomes as a result of recruitment pressures during the war on terror, and during the latter part of the last decade by the economic stress of the recession. Indirect and Induced Impact of Military Personnel Money that comes into the region from military salaries and wages that are spent locally helps to increase the region’s economic output, increase employment, and increase regional salaries to an even greater extent than their direct contribution. An important step in establishing the size of this indirect and induced effect occurs with the correct
2000 2011
Employment (% of Total) 110,522 (11.7%) 92,962 (9.4%) Total Earnings (% of Total) $5.9B (18.9%) $10.4B (19.3%) Salary and Wages $3.8B $5.7B
Hampton Roads Military Personnel’s Direct ImpactSource: Bureau of Economic Analysis, HRPDC

IMPACT OF DEFENSE SPENDING
Page | 15
identification of the multiplier for regional military employment. A variety of multipliers have been used regionally when evaluating the impact of the defense industry, with the Hampton Roads Planning District Commission using a multiplier of 1.4 in 1994, and then a multiplier of 1.694 in an updated study conducted in 2004.5 The HRPDC staff conducted another modeling of the economic multiplier in 2005 for a study conducted by RKG Associates, Inc, where the model identified a multiplier of 1.76 for military personnel. Current estimates for the Hampton Roads economic multiplier for military personnel proved to be higher than those previous estimates, and this is driven by several factors. Most importantly, as military earnings have grown quickly, outpacing the increase in private salaries, the impact of personnel has grown. This being a nationwide effect, one would expect to see a higher multiplier in other recent studies; however, a study prepared for the San Diego Military Economic Impact indicated an employment multiplier of only 1.64. Another important factor driving the multiplier higher in this region relates to the dependence this region has on the military sector, and the relative weakness in the regional economy. Additionally, the HRPDC’s REMI6 model captures demand and population impacts from military personnel. The current multiplier in the model is 1.873, suggesting that for every 1,000 military personnel in the region; an additional 873 people are employed in the region.
5 Hampton Roads Military Impact Study 1994, The Hampton Roads Economy: The Role of the Military 2004. 6 The REMI model combines several analytical models including input-output, general equilibrium, and economic geography. This allows the REMI model to take advantage of each models strengths. The HRPDC’s REMI model is calibrated for the Hampton Roads economy and demographics, and allows for accurate modeling of economic and demographic changes.
Statistic Impact Per 1000 Total Hampton Roads Impact
Direct Employment 1,000 92,962Indirect & Induced Employment 873 81,200Total Employment 1,873 174,162Total Earnings Impact $117M $10.9BGross Regional Product $178M $16.6B
Economic Impact of Hampton Roads Military Personnel

IMPACT OF DEFENSE SPENDING
Page | 16
The task of allocating that economic impact to particular employment sectors using the REMI model produces estimates, which allow planners to understand what industries would be particularly affected by changes in the number of personnel stationed in this region. IMPACT OF MILITARY DEPENDENTS While military families receive praise for the support and sacrifices they make for the military personnel stationed in Hampton Roads, they also perform an important role in our communities serving as nurses, educators, lawyers, and other skilled roles in the labor force. The military personnel that come into this region have achieved education levels and acquired skills that would also likely be associated with their families. Estimates of the number of dependents are highly variable, but data from the Navy indicates that there are 1.28 dependents per active duty personnel on the South Side, while Joint Base Langley-Eustis indicates that they have approximately 1.60 dependents per individual personnel. The HRPDC REMI model indicates that the estimated 134,000 dependents in this region induce an additional 4,400 jobs in this region as a result of the improved labor supply in the region.
INDSUSTRY INDIRECT/INDUCED EMPLOYMENT
INDSUSTRY INDIRECT/INDUCED EMPLOYMENT Retail Trade 12,600 Business Support Services 3,700 Construction 12,200 Wholesale Trade 2,900 Food/Beverage Service 6,500 Real Estate 2,600 Doctors Office & Hospitals 6,000 Employment Services 2,100 Architectural & Engineering 5,400 Other Industries 27,200
Industry Mix of the Indirect and Induced Employment from Hampton Roads Military Personnel in CY2012
Source: HRPDC

IMPACT OF DEFENSE SPENDING
Page | 17
IMPACT OF CIVILIAN DEPARTMENT OF DEFENSE EMPLOYEES Federal civilian employment in the region is also an extremely significant driver of regional economic growth. Earnings per federal civilian employee are lower than earnings per military personnel, but because the federal civilians typically locate in the region for longer periods of time, their impact tends to be equally if not more significant. Federal civilian employment in Hampton Roads rose to 51,340 in 2011, up from 46,942 in 2000.7 This constitutes 5.2% of regional employment. Additionally, earnings for federal civilian employment are higher than the regional average, with the $5.4 billion in employee earnings, accounting for 9.9% of total earnings in the region. When estimating the impact of the DoD specifically, it is important to note a significant portion of the federal civilian employment in the region comes from other departments of the federal government. NASA employees account for 3,815 in the region8, and Department of Energy, Department of Commerce, and Department of Justice all have significant presences in this region. Two non-Defense employers in this report included in the impact of the DoD are the Coast Guard (Department of Homeland Security) and the Department of Veteran Affairs. This indicates that the direct impact of the DoD includes 44,600 civilian employees that earn an estimated $4.7B per year. Indirect and Induced Impact of Federal Civilian Employees The HRPDC REMI Model estimates that the multiplier impact of federal civilian employment in the region is 1.996, which compares to the 1.83 that the HRPDC used in its 2005 modeling for federal civilian employment.9 This indicates that for every 1,000 federal civilian employees, there would be an additional 996 persons employed in this region. The total indirect and induced impact from this employment would be 44,400. 7 Bureau of Economic Analysis. 8 Hampton Roads and Federal Facility Alliance 2012 9 The Economic Impacts of the NAS Oceana BRAC Decision 2005.

IMPACT OF DEFENSE SPENDING
Page | 18
IMPACT OF CONTRACTING The impact of the defense contracting in Hampton Roads is one of the most difficult aspects of the regional economy to quantify. Issues associated with determining the impact stem from many sources within the contracting industry. Precise data about employment of military contractors and salaries of military contractors is unavailable. While there is data about the locality where a contract was granted and the reported final place of performance, the reality is that subcontracting is a significant portion of all these contracts. Additionally, large contractors have offices across the nation and globe, which renders making precise estimates of regional impact difficult.
Previously the HRPDC used the Consolidated Federal Funds Report to gather data on contracting, but that data series concluded with Fiscal Year 2010 data because of federal budget concerns. Since that time the USASpending.gov website has been the best source of information. Unfortunately, because there are only 4 complete years of reliable data, it
$0$1,000$2,000$3,000$4,000$5,000$6,000$7,000$8,000$9,000
1987 1988 1989 1990 1991 1992 1993 1994 1995 1996 1997 1998 1999 2000 2001 2002 2003 2004 2005 2006 2007 2008 2009 2010Mill
ions
of D
olla
rs-5
Yea
r M
ovin
g Av
erag
e Defense Contracting in Hampton Roads
Source: Consolidated Federal Fund Report, HRPDC
IMPACT OF DEFENSE SPENDING
Page | 19
makes it difficult to estimate changes in the economic impact of the defense industry in Hampton Roads. While the five year average of the Consolidated Federal Funds Report increased from 2000 to 2010, the increase stopped at $9.1 billion in 2008 and then contracting fell to $9.0 billion in 2009 and 2010. The Department of Defense data reported by USASpending.gov shows that $9.4 billion of contracts listed a Hampton Roads locality as final place of performance in 2008, falling to $9.2 billion in 2009 and 2010. This data set then shows contracts completed in the region ballooning to $9.8 billion in 2011 before falling to $7.6 billion in FY2012. While USASpending.gov does have data on contracts allocated to the region (rather than performed in the region), that data is highly variable over the period from 2008 to 2012 and thus cannot be used for analysis at this time. Analysis of the industry codes associated with the contracts show that $3.2 billion went directly to companies that are in ship building industries in FY2012, and a significant portion of the rest of these dollars went to companies in the business and professional services categories. There were 26,200 individuals employed directly in the Hampton Roads ship building industry in 2012, and these employees resulted in an indirect and induced impact of an additional 19,400 jobs. The remaining impact, while difficult to model, could be conservatively estimated to provide an additional 45,500 employees to the region from direct, indirect, and induced effects of federal contract spending. Thus the total impact from military contracting in the region would be 50,000 direct and a further 40,000 indirect and induced. IMPACT OF VETERANS Veterans play an important role in the regional economy by both participating in the labor force after they leave their service, but also by collecting and spending retirement benefits in the region. The U.S. Census Bureau 2011 American Community Survey indicated that there are 217,171 veterans in Hampton Roads, constituting 17.8% of the region’s population. Additionally, 68% of this region’s veterans are between 18 and 54 years of age where individuals have a high rate of workforce participation. There are approximately 135,000 veterans in the regional labor force, and veterans in this region are both more likely to participate in the labor force and less likely to be unemployed than the general

IMPACT OF DEFENSE SPENDING
Page | 20
population. The veteran population in Hampton Roads also has a high level of education, with only 5% having less than a high school degree (versus 12% of the non-veteran population). High levels of education likely contribute to the higher above average median income for veterans, who earned $46,371 in 2011 versus the non-veteran median income of $24,772. 10 Veteran’s retirement benefits have a significant impact on the region; there are 58,673 retired military personnel in Hampton Roads who collect $135.6 million in benefits for their service. Additionally, the region has 6,298 military survivors who receive $6.6 million per month.11 The mere presence of the Veterans in the labor market increases regional employment by 20,300 jobs, regional income by $718 million, and regional gross output by $1.4 billion. The annual retirement and survivor payments are $1.7 billion per year, supporting 10,300 positions in the region and $646 million in Gross Regional Product. SUMMARY OF THE CURRENT IMPACT OF THE DEPARTMENT OF DEFENSE The DoD presence in Hampton Roads both brings in new revenue to the region as well as increasing not only the labor supply, but the highly trained workers who are important to this region’s long term growth. Money flows into the region through three main channels- 1. Military personnel and federal civilians who work, live, and play in Hampton Roads, spending new money in the region providing for long term economic growth. 2. Military contracts for building ships, maintaining bases, developing Information Technology infrastructure, etc. These serve the regional economy both by employing workers and through consuming intermediate production in the region. 3. Retirement payments to veterans which create demand/spending in the region. 10 2011 American Community Survey 1-Year Estimates 11 Fiscal Report of the Military Retirement System Fiscal Year 2012

IMPACT OF DEFENSE SPENDING
Page | 21
Additionally, the labor supply provided to the region both through military dependents and veterans that locate in Hampton Roads also induces employment growth as businesses and entrepreneurs take advantage of the talent that the Department of Defense brought to the region. Fully 40.2% of regional employment in Fiscal Year 2011 is attributable to either the DoD or the Coast Guard. Source Direct
Employment Share of
Total Indirect/Induced
Employment Share of
Total Full
Employment Share of
Total Personnel 92,962 9.4% 81,200 8.2% 174,162 17.5% Dependents -- -- 4,400 0.4% 4,400 0.4% Federal Civilians 44,590 4.5% 44,400 4.5% 89,000 8.9%
Contractors 50,000 5.0% 45,000 4.5% 95,000 9.6% Veteran Labor Supply Impact
-- --
20,300
2.0%
20,300
2.0%
Veteran Pension Impact
-- --
10,300
1.0%
10,300
1.0%
Total Impact 187,552 18.9% 205,600 20.7% 393,152 39.6%
2011 Employment Impact of Defense Spending in Hampton Roads
Source: Bureau of Economic Analysis, USASpending.gov, Department of Defense, HRPDC

SCENARIOS OF CHANGE
Page | 22
The defense industry developed a strong presence in Hampton Roads to utilize this region’s natural harbor and take advantage of its strategic location. That presence drove economic growth and development in this region; however, this also leaves Hampton Roads dependent on the defense industry for 39.6% of its employment. This concentration of economic activity puts the regional economy at risk from changes in the size and scope of the defense industry, and this region has almost no control over how those changes will occur. The national defense budget has started to decline from its recent peak in 2010 of $850B, when defense spending constituted 5.64% of GDP. The second half of 2011 and all of 2012 experienced a decline in defense spending, largely as a result of the Budget Control Act of 2011, which mandated cuts to begin in the FY2011 budget and later brought sequestration to the national budget. While it remains impossible forecast what the final defense budget will be, it would be consistent with historical trends for defense spending to decline from its recent peak for several years. Ultimately, it will be the growth of U.S. GDP and the associated tax revenues that will determine the growth of the defense budget. Unfortunately, while the U.S. economy
0%1%2%3%4%5%6%7%8%
$0$100$200$300$400$500$600$700$800$900 Defense Share of N
ational GDP
Billi
ons o
f 201
2 D
olla
rs
U.S. Defense SpendingReal Defense Spending % of GDP
Source: Bureau of Economic Analysis, HRPDC

SCENARIOS OF CHANGE
Page | 23
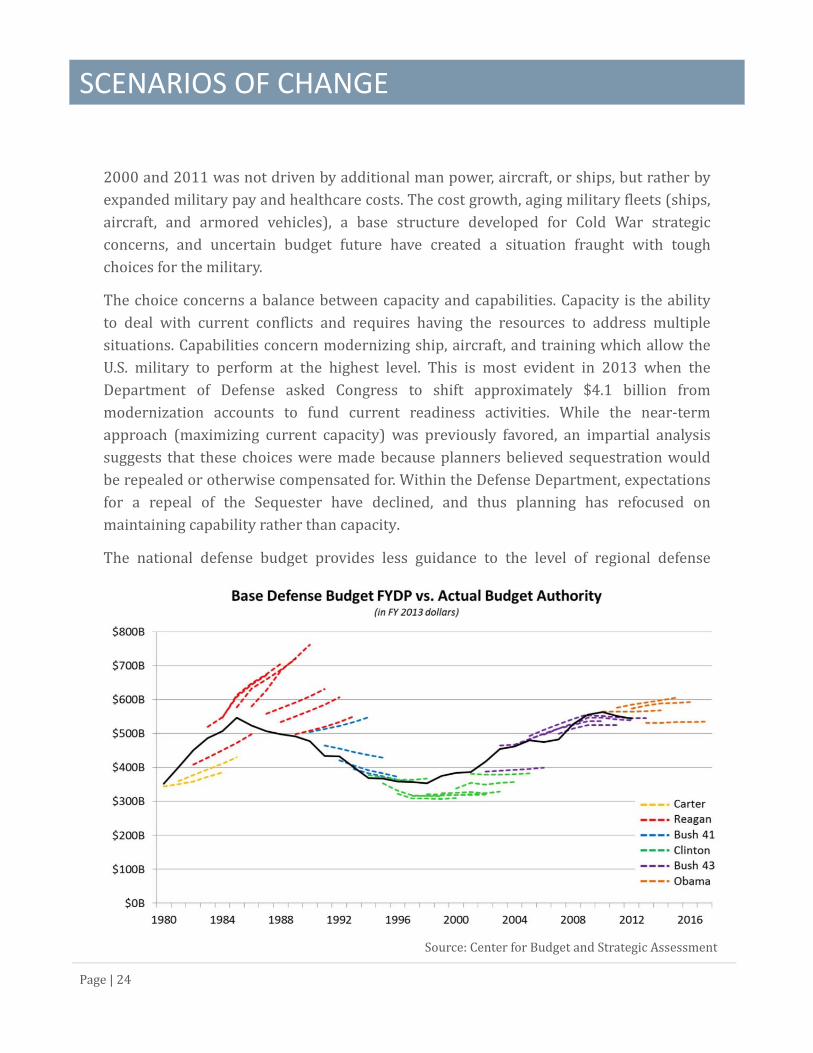
continues to grow, this growth has been at a tepid pace that is unlikely to take pressure off from the budget situation. Additionally, this region risks shrinking as a share of total defense spending for the first time, as a result of both strategic pressures from the pivot to the pacific12, as well as attempts to move assets to other East Coast ports or to forward bases closer to potential conflicts (e.g. Rota, Spain). BUDGET CUTS AND IMPACT Using analysis from the Center for Strategic and Budgetary Assessments, if the Budget Control Act and Sequestration remain in effect through 2021, the real defense budget will have fallen by 33% in real terms, comparable to the 35% decline after the Cold War.13 While the Cold War decline in spending occurred during the internet boom of the 90’s, current forecasts do not predict a similar boom to compensate for the decline in defense. Indeed, it is the weak economic situation that drives the decline in defense spending to a significant extent. It is important to note that the increase in military spending between
12 The Pivot to the Pacific is the term commonly used to describe the new strategic priority that the current administration has placed on deploying the U.S. military so they are able to better respond to threats in the Middle East and Southeast Asia. 13 Harrison 2013. Source: Center for Budget and Strategic Assessment
SCENARIOS OF CHANGE
Page | 24
2000 and 2011 was not driven by additional man power, aircraft, or ships, but rather by expanded military pay and healthcare costs. The cost growth, aging military fleets (ships, aircraft, and armored vehicles), a base structure developed for Cold War strategic concerns, and uncertain budget future have created a situation fraught with tough choices for the military. The choice concerns a balance between capacity and capabilities. Capacity is the ability to deal with current conflicts and requires having the resources to address multiple situations. Capabilities concern modernizing ship, aircraft, and training which allow the U.S. military to perform at the highest level. This is most evident in 2013 when the Department of Defense asked Congress to shift approximately $4.1 billion from modernization accounts to fund current readiness activities. While the near-term approach (maximizing current capacity) was previously favored, an impartial analysis suggests that these choices were made because planners believed sequestration would be repealed or otherwise compensated for. Within the Defense Department, expectations for a repeal of the Sequester have declined, and thus planning has refocused on maintaining capability rather than capacity. The national defense budget provides less guidance to the level of regional defense
Source: Center for Budget and Strategic Assessment

SCENARIOS OF CHANGE
Page | 25
spending than the average year. Hampton Roads has a large Navy presence relative to the national force mix, and each branches will be affected uniquely by national cuts and shifts in strategy. The shipbuilding industry also is uniquely impacted by the federal budget and strategic assessments as compared to other types of contracting (information technology, etc.). Initial projections for the regional impact of sequestration were too high, because they were based on the across the board cuts described in the Budget Control Act. However, during FY2013 the military prioritized near term needs and maintaining the ship building industrial base, so while there were delays to shipbuilding projects, funding was restored for much of the construction and repair work executed in the region. Current projections of cuts by branch have the Army facing the most significant declines (-9.3%), followed by the Air Force (-6.1%), and the Navy (-5.2%); though much of the decline in the Navy will come through cutbacks in the Marines. It is important to note that the Future Years Defense Program (FYDP) tend to follow the budget rather than actually projecting the budget. One projection that does pose a great threat to Hampton Roads is the potential decline in the size of the carrier fleet. Currently, the fleet stands at 11 aircraft carriers, including the decommissioned CVN-65 Enterprise which still has personnel assigned to it. Six of those are assigned to Naval Station Norfolk (again, including the Enterprise). When discussing the cuts due to sequester, Secretary Hagel indicated that the Navy might have to shrink the size of its carrier fleet to 8 ships. Several think tanks have also conducted assessments that indicate the optimal fleet size given the current budget constraints is between 7 and 9 carriers. Each carrier stationed in Hampton Roads produces a significant economic impacts, but this also impacts carrier construction in Hampton Roads. Only Hampton Roads possesses a facility capable of constructing and performing major overhauls on U.S. aircraft carriers. While Secretary Hagel’s comments did not indicate how the Navy would shrink its carrier fleet, the Navy could to choose to either retire older carriers or decrease the construction of Ford class carriers. At the very least, a decline in the number of aircraft carriers would significantly reduce the ship repair conducted in Hampton Roads. If carrier construction declines, it would deliver a significant blow to regional shipbuilding. A recent GAO report estimates the amount

SCENARIOS OF CHANGE
Page | 26
spent to build Ford class carriers at $12.8 billion, equivalent to four years of total contracting in the Hampton Roads’ shipbuilding and repair industry.14 The Navy planned to spend $43 billion to produce three Ford-Class carriers overall, which would be equivalent to 13.4 years at current contracting levels. That would remove 26,200 direct jobs and 19,400 indirect jobs for a period of 13.4 years from the regional economy (in reality this would be fewer jobs over more years, and the lead ship has been more than half constructed making it improbable that the project would be canceled).15 THE IMPACT OF THE BASES While current analysis does not indicate that any of the region’s bases should be under significant threat when another round of Base Realignment and Closure Commission (BRAC) occurs, it is also useful to put the impact of installations in the region in terms of the number of jobs and income. Additionally, it is useful for policy makers to know where centers of employment are situated around the region. The information in this section comes from the Department of Defense Base Structure Report 2013, and the titles of the installations reflect the titles used in this report. Norfolk Naval Base Norfolk Naval Base is the largest installation in Hampton Roads, with 37,223 active duty personnel on base, and an additional 13,667 civilian personnel. This base has 14 piers allowing it to support 75 ships, and along with the deep draft and clear channels of Hampton Roads, make this the most important naval base in the world. Norfolk Naval Base also has a significant air contingent, with 134 aircraft stationed at the base. 14 Government Accountability Office 2013, USASpending.gov 15 This is a worst case scenario estimate. Not all of the dollars contracted to carrier construction have their final place of performance in Hampton Roads, though estimating what percentage is performed where in the country is beyond the scope of this report.
Norfolk Naval Base Active Duty 37,223 Reserves 2,982 Civilians 13,667

SCENARIOS OF CHANGE
Page | 27
Dep
artm
ent o
f Def
ense
Fac
iliti
es in
Ham
pton
Roa
ds
SCENARIOS OF CHANGE
Page | 28
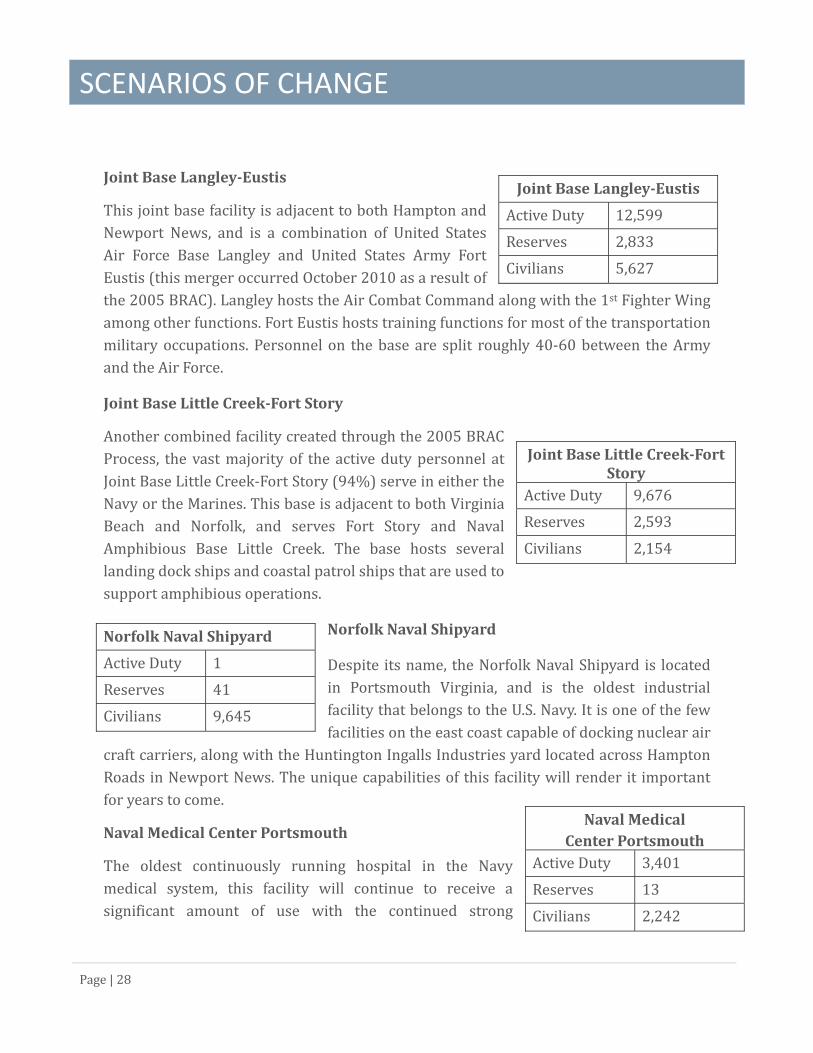
Joint Base Langley-Eustis This joint base facility is adjacent to both Hampton and Newport News, and is a combination of United States Air Force Base Langley and United States Army Fort Eustis (this merger occurred October 2010 as a result of the 2005 BRAC). Langley hosts the Air Combat Command along with the 1st Fighter Wing among other functions. Fort Eustis hosts training functions for most of the transportation military occupations. Personnel on the base are split roughly 40-60 between the Army and the Air Force. Joint Base Little Creek-Fort Story Another combined facility created through the 2005 BRAC Process, the vast majority of the active duty personnel at Joint Base Little Creek-Fort Story (94%) serve in either the Navy or the Marines. This base is adjacent to both Virginia Beach and Norfolk, and serves Fort Story and Naval Amphibious Base Little Creek. The base hosts several landing dock ships and coastal patrol ships that are used to support amphibious operations.
Norfolk Naval Shipyard Despite its name, the Norfolk Naval Shipyard is located in Portsmouth Virginia, and is the oldest industrial facility that belongs to the U.S. Navy. It is one of the few facilities on the east coast capable of docking nuclear air craft carriers, along with the Huntington Ingalls Industries yard located across Hampton Roads in Newport News. The unique capabilities of this facility will render it important for years to come. Naval Medical Center Portsmouth The oldest continuously running hospital in the Navy medical system, this facility will continue to receive a significant amount of use with the continued strong
Joint Base Langley-Eustis Active Duty 12,599 Reserves 2,833 Civilians 5,627
Joint Base Little Creek-Fort Story Active Duty 9,676 Reserves 2,593 Civilians 2,154
Norfolk Naval Shipyard Active Duty 1 Reserves 41 Civilians 9,645 Naval Medical
Center Portsmouth Active Duty 3,401 Reserves 13 Civilians 2,242

SCENARIOS OF CHANGE
Page | 29
presence of the Navy in this region. TRICARE, the health care program of the Department of Defense, provides civilian health benefits as well as benefits for dependents; recently, TRICARE has worked harder to encourage individuals enrolled in its coverage to take services at a military facility, which has increased utilization. Dam Neck Training Center Atlantic Formerly known as Fleet Training Center Dam Neck, it was renamed to Training Support Center Hampton Roads. Located in Virginia Beach and a part of Oceana, Dam Neck hosts an array of training functions including Special Warfare and Military Intelligence.
Oceana NAS Naval Air Station Oceana, a United States Navy Master Jet Base, hosts F/A-18 Hornets and Super Hornets, and is home to almost all of the east coast strike-fighter units. This base was listed for closure during the 2005 BRAC process when it was suggested that Cecil Field outside of Jacksonville would be reopened. The City of Virginia Beach has passed numerous ordinances to ameliorate concerns developed during the BRAC process. With the continued need for an East Coast Master Jet Base, and the lack of a viable alternative, Oceana should remain safe during future iterations of BRAC. Yorktown Naval Weapon Station The Naval Weapons Station Yorktown is adjacent to York County, James City County, and Newport News. It provides weapons, ammunition storage, and loading for ships in the U.S. Atlantic Fleet. Other There are a host of other facilities in the region that are under the Department of Defense that have fewer than 1,000 employed. These include, Norfolk NSC (Norfolk Naval Safety Center), NSGA Northwest (Naval Security Group Northwest), and Engineering District Norfolk. Additionally, there are 1,700 active duty personnel and an additional 200
Dam Neck Training Center Atlantic Active Duty 3,580 Reserves 851 Civilians 1,091
Oceana NAS Active Duty 3,116 Reserves 429 Civilians 1,185
Yorktown Naval Weapon Station Active Duty 1,495 Reserves 149 Civilians 841

SCENARIOS OF CHANGE
Page | 30
civilians that support Fifth District Coast Guard operations from Coast Guard Base- Portsmouth. THE IMPACT OF SHIP MOVEMENTS & STRATEGIC SHIFTS While the chances of the next round of BRAC removing one of the Hampton Roads bases may be judged to have a low probability, there will be both strategic and political pressure to move Hampton Roads assets throughout the U.S. and the globe.
One area that has impacted Hampton Roads is the forward basing of ships in Rota, Spain to have greater access and more rapid response to issues within the Mediterranean. These ships will also serve as part of the administrations European strategy for ballistic missile defense. Most recently this has included sending two Arleigh Burke class destroyers to Rota in 2014, including the USS Ross which has been home-ported at Naval Station Norfolk. Additionally, two more destroyers would move to Spain in 2015 from Norfolk (the Carney and the Porter). One change to forward basing ship is a new requirement that repair work still needs to be done at U.S. shipyards, which should somewhat mitigate the economic impact.
Stationed in H.R. Class of Boat Crew Airwing/ Support Total Employment Direct/Indirect/Induced8 Cyclone Class Patrol Ship 27 50 6 Ticonderoga Class Cruiser 330 607 24 Arleigh Burke Class 276 508 1 Enterprise Class Carrier 3,350 2,000 9,844 5 Nimitz Class Carrier 3,200 2,500 10,488 4 Oliver Hazzard Perry Class Frigate 215 396 6 Los Angeles Class Submarines 143 263 4 Wasp Class Amphibious Assault Ship 1,070 1,969 1 Tarawa Class Amphibious Assault Ship 964 1,774 4 Whidbey Island Class Dock Landing Ship 413 760 2 Harpers Ferry Class Dock Landing Ship 419 771 4 San Antonio Class Amphibious Transport 360 662
Naval Vessels in Hampton Roads FY2012
Source: HRPDC

SCENARIOS OF CHANGE
Page | 31
Each Arleigh Burke class destroyer holds a crew of 27616, which would remove 753 Navy personnel from the region by the end of 2015, and an associated number of support personnel from Naval Station Norfolk. Pivot to the Pacific The current strategic assessment sees far more points of conflict in the Pacific in both South-East Asia and the Middle East. Moving military forces to Pacific bases both moves them closer to the point of conflict, and removes the need for ships to go through choke points such as the Suez Canal. Currently there are five active carriers on each side of the country, but the pivot to the Pacific would shift U.S. military forces from a 50-50 split to a 60-40 split. The new strategic priorities would result in the shift of a carrier from Hampton Roads to one of the Pacific Naval bases. Furthermore, when shifting a carrier, the Department of Defense would most likely take the entire carrier strike group, which would include a carrier air wing (65-70 aircraft), an attack submarine, several cruisers, and a destroyer squadron. In all, the shift of one carrier strike group would remove roughly 8,900 naval personnel from this community, with a total employment impact of 16,400 jobs from the region (military personnel as well as indirect civilian employment), as well as associated ship repair work this region could lose. OUTLOOK There are significant threats to the Hampton Roads defense industry from both the budgetary strain under which the DoD now operates, as well as from the shifting geopolitical situation. Additionally, because the DoD presence in Hampton Roads is large relative to both the size of the population and in absolute dollars and manpower allocated to this region, the politics of defense spending also create a threat for this region. The pivot to the Pacific has been delayed in the short term due to the tight budget preventing the reallocation of manpower, aircraft support, and ships; however, the 16 The Congressional Research Service indicates contrary to these numbers, that each ship has a crew of 301 and there will be a total of 35 support staff moved to the base in Rota, indicating the Hampton Roads Impact would 328. CongressionalResearchService2013.

SCENARIOS OF CHANGE
Page | 32
Secretary of Defense remains committed to this shift and it is likely to happen in the 2017 to 2020 time frame. As noted, this will cost the region at least one carrier, and likely an entire strike group which would subject this region to an employment decline of 13,000 jobs, as well as the associated ship repair work. Ship repair companies have taken note of this as well, with companies suggesting that they were investing in West Coast shipbuilding in anticipation of this strategic shift. Another concern would be that if this region lost one or two air wings, it might drop Oceana’s utilization rate sufficiently low that it would again be a potential candidate for a BRAC adjustment. Sequestration: It is difficult to assess the impact of sequestration on the regional defense industry in 2014. Early estimates by the HRPDC indicated that impacts from a full implementation of sequestration could be as high as 26,400 jobs in Hampton Roads (both DoD and non-DoD). As additional information came out, it decreased the Sequester’s regional economic impact, and current estimates indicate sequestration cost no more than 5,000 jobs in 2013. Initial estimates were inaccurate because staff anticipated that the cuts would be proportional, and would follow the path initially laid out by the DoD. Several procedural changes were made, such as cutting the number of furlough days, holding military pay constant, and preserving shipbuilding. The current understanding suggests that prior actions resulted in a one-year reprieve, and that DoD used money available from the previous year to help 2013 funding. This year will face more drastic cuts as a result of less flexibility and sequester impacting the full fiscal year. Unfortunately, it is difficult to assess the validity of these statements. The automatic reduction required by the Budget Control Act is $53.9 billion per year, which constitutes a national decline in defense spending of 9.8% (though as total spending increase over the next few years, it will only be a 8.4% decline in 2021).17 Applying a 9.7% decline to Hampton Roads Department of Defense related employment would decrease direct employment by 18,192, and indirect and induced employment by a further 15,300 for a total of 33,492. Unfortunately, predicting the outcome of the federal budget discussions would be the triumph of confidence over experience. 17 Congressional Budget Office, 2013

CONCLUSION
Page | 33
Reducing the contributions of the Department of Defense in this region to personal income, labor supply, and economic impact, minimizes the extent of the contribution made to this community and the country at large. In addition to the real sacrifices made by members of the military and their families to perform their duties, regional personnel are members of the Hampton Roads’ community. There are numerous individuals that could be named that have served as friends, co-workers, and mentors throughout this region, and they help to support this region through volunteerism and community spirit. An understanding of the Department of Defense’s role in the economy is crucial for long term planning. While many of these assessments focus on Gross Regional Product contributions, analyzing the employment effects of the DoD provides a clearer understanding of the impact of the military in the region. Direct employment by the Department of Defense constitutes 13.9% of regional employment, and contracting contributes approximately another 5%. Indirect and induced employment from those jobs supports another 170,600 employees constituting 17.2% of regional employment. Induced employment by veterans and military dependents entering the labor force creates 1.4% of the regions’ jobs. Lastly, military retirement pay creates an additional 20,300 jobs, or 2% of regional employment. All-in-all, Department of Defense spending creates or supports 393,152 jobs in this region, or 39.6% of total employment. This leaves the region at the mercy of national budget, strategic, and political concerns, which may cause the regional economy to suffer significantly over the coming years. This raises the question of how does the region diversify its economy away from the Department of Defense. Unfortunately, no panacea exists, and the very goal of diversification often creates poor policy results. As described in the Hampton Roads Regional Competiveness Report (2011), improving regional education outcomes has been the best demonstrated method of improving the regional economic outlook. Often attempts to diversify the economy result in policies that attempt to pick winners in an ever changing global industrial picture; the rare successes in these attempts appear to be the result of serendipity rather than foresight. There are other recommendations in the report that would help to improve the Hampton Roads economic landscape, but unfortunately most of these responses will only bear fruit after an extended period of

CONCLUSION
Page | 34
time, while economic issues stemming from a contracting defense sector are likely to impact the regional economy in the very near-term.

A1. BIBLIOGRAPHY
Page | 35
Alptekin, Aynur and Paul Levine. 2010. Military Expenditure and Economic Growth: A Meta-Analysis. Munich Personal RePEc Archive Paper No. 2885, University of Surrey, UK; October 2010. Atkinson, Robert D. 1992. “Defense Spending Cuts and Regional Economic Impact: An Overview.” Economic Geography 69:107-22 Bacevich, Andrew J. 2011. “The Tyranny of Defense Inc.” The Atlantic, January. Accessed April 17, 2013. WNW.tt-uanlic.com'magazinelprint/2011/01/the-l}<<llny.of-defense-inc/308342/ Campbell, Scott. 1993. “Interregional Migration of Defense Scientists and Engineers to the Gunbelt during the 1980s.” Economic Geography 69:204-223 City of Virginia Beach. 2005 The Economic IUmpacts of the NAS Oceana BRAC Decision. RKG Associates, Inc. The City of Virginia Beach, December 8, 2005. Congressional Budget Office. 2013. Sequestration Update Report: August 2013. By Avi Lerner, Congressional Budget Office, August 2013. Congressional Research Service. 2013. Navy Aegis Ballistic Misslle Defense (BMD) Program:Background and Issues for Congress. Ronald O Rourke (September 11, 2013) http://www.fas.org/sgp/crs/weapons/RL33745.pdf Department of Defense 2013. Statistical Report on theMilitary Retirement System- Fiscal Year2012. DoD Office of the Actuary, May 2013. Ellis, Mark, Richard Barff, and Anne R. Markusen. 1993. “Defense Spending and Interregional Labor Migration.” Economic Geography 69:`81-203 Hampton Roads Military and Federal Facilities Alliance. 2012. DirectEconomicImpactofFederalSpendingwithinHamptonRoadsFY2009-2010. By Marco A. Martin, HRMFFA, July 16, 2012. Hampton Roads Planning District Commission. 1992. Hampton Roads Military Impact Study. October 1992. Hampton Roads Planning District Commission. 1994. Hampton Roads Military Impact Study. February 1994. Hampton Roads Planning District Commission, 1996. Selected Impacts From the 1996-1999OceanaExpansion. June 1996. Hampton Roads Planning District Commission. 2001. TheEconomicImpactsoftheSuperHornets. April 2001.

A1. BIBLIOGRAPHY
Page | 36
Hampton Roads Planning District Commission. 2004. TheHamptonRoadsEconomy,AnalysisandStrategoes:Part1TheRoleoftheMilitary. April 2004. Harrison, Todd. 2012. “Analysis of the FY 2013 Defense Budget and Sequestration.” Center for Strategic and Budget Assessment, August 2012. Harrison, Todd. 2013. “Defense Cuts Conundrum: Weighing the Hard Choices Ahead.” Originally Foreign Affiars, September 29, 2013. http://www.csbaonline.org/2013/09/29/defense-cuts-conundrum-weighing-the-hard-choices-ahead/2/ (Accessed September 29, 2013). Hill, Catherine and Ann Markusen. 2000. “Do Regions Matter? Ecidence on Capabilites and Coalitions from Defense-Dependent Regions,” Berkeley Planning Journal 14 Ireland, Peter, and Christopher Otrok. 1992. “Forecasting the Effects of Reduced Defense Spending.” Economic Review November/December, Federal Reserve Bank of Richmond. Kirby, Andrew Ed. 1992. “The Pentagon and The Citites.” UrbanAffairs Vol 40. Klein, Lawrence Robert, Fu-chen Lo, and Warwick J. McKibbin. 1995. Arms reduction: economic implications in the post-Cold War era. Tokyo: United Nations University Press. Markusen, Ann, and Sam O. Park. 1992. “The State as Industrial Locator and District Builder: The Case of Cangwon, South Korea.” Economic Geography 69:157-81 Mendel, Brock. 2013. “The Local Multiplier: Theory and Evidence,” Working Paper, Harvard University McLean, Beverly M. 1996. “Studying Regional Development: The Regional Context of Economic Development,” EconomicDevelopmentQuarterly. Vol. 10 No. 2, May 1996. North Carolina Advisory Commission on Military Affairs. North Carolina’s Military Footprint:Current Economic Impacts and Projections for 2013. Prepared by The Policy, Research and Strategic Planning Division of the North Carolina Department of Commerce; June 2008. Owyang, Michael T. and Sarah Zubairy. 2009. WhoBenefitsfromIncreasedGovernmentSpending?A State-Level Analysis. Federal Reserve Bank of St. Louis Working Paper 2009-006; March 2009. Pollin, Robert and Heidi Garrett-Peltier. 2007. The U.S. Employment Effects of Military andDomestic Spending Priorities. Political Economy Research Institute, University of Massachusetts, Amherst, October 2007.
A1. BIBLIOGRAPHY
Page | 37
Pollin, Robert and Heidi Garrett-Peltier. 2009. The U.S. Employment Effects of Military andDomestic Spending Priorities: An Updated Analysis. Political Economy Research Institute, University of Massachusetts, Amherst, October 2009. Poppert, Patrick E. and Henry W. Herzog Jr. 2003. “”Force Reduction, Base Closure, and the Indirect Effectos of Military Installations on Local Employment Growth.” JournalofRegionalScience. Vol 43, No. 3. Pudget Sound Regional Council. 2010. RegionalEconomicStrategy:MilitaryCluster. Puget Sound Regional Council; February 2010. President’s Economic Adjustment Committee. 1979. Economic Adjustment Program: LowerPeninsulaofVirginia. The Pentagon, Washington D.C.: December 1979. San Diego Military Advisory Council. 2011. SanDiegoMilitary Economic Impact Study. By the School of International Relations and Pacific Studies, UCSD; San Diego, April 2011. San Diego Military Advisory Council. 2012. SanDiegoMilitary Economic Impact Study. By the Fermanian Business & Economic Institute at PLNU; San Diego, June 2012. Southeastern Virginia Planning District Commission. 1978. Selected Economic Impacts of theNavyinSoutheasternVirginia. November 1978. Southeastern Virginia Planning District Commission. 1981. Implications of Proposed NavyExpansiononSoutheasternVirginia. June 1981. Scott, Allen J. 1992. “Interregional Subcontracting Patterns in the Aerospace Industry.” Economic Geography 69:142-56 Thorpe, Rebecca U. 2010. The Role of Economic Reliance in Defense Procurement Contracting. American Politics Research Vol. 38 Iss. 4. Wachendorf, Ben, Ajay Patel, and Tiffany Chiang. 2011. LoomingDefenseBudgetCuts:SeperatingFactfromSpeculation. Monitor National Security Perspectives (November 10, 2012). Wallace, Gordon. 2012. NewDefensePrioritiesandtheDefenseIndustrialBase. United States Army War College; Philadelphis, PA. March 22, 2012. Warf, Barney. 1992. “The Pentagon and the Service Sector.” Economic Geography 68:123-41 Warf, Barney, and Amy Glasmeier. 1992. “Military Spending, the American Economy, and the End of the Cold War.” Economic Geography 69:103-6

A1. BIBLIOGRAPHY
Page | 38
Zycher, Benjamin. 2012. Economic Effects of Reductions in Defense Outlays. Cato Institute, Washington D.C., August 8, 2012.