draft no - dtf.vic.gov.au€¦ · web viewthe program will allocate a key case manager to...
TRANSCRIPT

Service Delivery2011-12
Presented by
Kim Wells MPTreasurer of the State of Victoria
for the information of Honourable Members
Budget Paper No. 3


TABLE OF CONTENTS
Introduction.................................................................................................1Chapter 1 – Election commitments.............................................................13
Business and Innovation.....................................................................................................14Education and Early Childhood Development....................................................................18Health.................................................................................................................................29Human Services..................................................................................................................47Justice.................................................................................................................................54Planning and Community Development.............................................................................61Premier and Cabinet...........................................................................................................66Primary Industries..............................................................................................................73Sustainability and Environment..........................................................................................76Transport............................................................................................................................80Treasury and Finance.........................................................................................................90Revenue initiatives.............................................................................................................91Savings initiatives...............................................................................................................92
Chapter 2 – Other output, asset investment and revenue initiatives...........93Government-wide initiatives..............................................................................................94Departmental Initiatives...................................................................................................102Business and Innovation...................................................................................................102Education and Early Childhood Development..................................................................105Health...............................................................................................................................112Human Services................................................................................................................119Justice...............................................................................................................................124Planning and Community Development...........................................................................128Premier and Cabinet.........................................................................................................132Primary Industries............................................................................................................137Sustainability and Environment........................................................................................139Transport..........................................................................................................................143Treasury and Finance.......................................................................................................145Parliament........................................................................................................................147Revenue Initiatives...........................................................................................................148
i

Table of contents (continued) Chapter 3 – Departmental output statements..........................................149
Department of Business and Innovation..........................................................................151Department of Education and Early Childhood Development..........................................167Department of Health......................................................................................................187Department of Human Services.......................................................................................216Department of Justice......................................................................................................236Department of Planning and Community Development..................................................260Department of Premier and Cabinet................................................................................277Department of Primary Industries....................................................................................294Department of Sustainability and Environment...............................................................305Department of Transport.................................................................................................326Department of Treasury and Finance...............................................................................351Parliament........................................................................................................................370
Appendix A – Output performance measures for review by the Public Accounts and Estimates Committee..........................................................379
Department of Business and Innovation..........................................................................380Department of Education and Early Childhood Development..........................................382Department of Health......................................................................................................383Department of Human Services.......................................................................................386Department of Justice......................................................................................................389Department of Planning and Community Development..................................................390Department of Premier and Cabinet................................................................................394Department of Primary Industries....................................................................................395Department of Sustainability and Environment...............................................................396Department of Transport.................................................................................................399Department of Treasury and Finance...............................................................................405Parliament........................................................................................................................406
Appendix B – Local government financial relations...................................407Improving service delivery to local communities.............................................................407Creating liveable communities.........................................................................................408Funding sources to local government in Victoria.............................................................4082011-12 Budget initiatives................................................................................................411
Abbreviations and acronmyms.................................................................415Style conventions.....................................................................................419Index..............................................................................................................421
ii

INTRODUCTION
Budget Paper No. 3 Service Delivery provides an overview of the goods and services funded by the Government and delivered by departments in the coming financial year, and describes how these services support the Government’s strategic priorities and objectives. It provides performance targets against which departmental service delivery will be measured, and an appendix that details proposed changes to previously published performance measures. This budget paper outlines initiatives that are being funded in this budget, including commitments made in the Government’s 2010 election platform, renewed funding for programs that were not funded beyond 30 June 2011, and other initiatives to meet current and future service needs. Budget Paper No. 3 also highlights initiatives that contribute funding to local councils together with an overview of state funding arrangements with the local government sector.Budget Paper No. 3 forms part of the suite of budget papers.The Victorian Economic and Financial Statement released on 14 April 2011 highlights the fiscal and economic challenges confronting the Government, including significant cost pressures. The Statement foreshadows the broad direction of reform the Government will pursue in order to address these challenges over time. Budget Paper No. 2 Strategy and Outlook describes the State’s economic and financial position and performance while also outlining the Government’s fiscal and economic reform strategy. Budget Paper No. 4 State Capital Program describes Victoria’s asset investment program.Budget Paper No. 5 Statement of Finances provides the financial details of the aggregated Victorian general government sector as outlined in Budget Paper No. 2.
Government election commitmentsChapter 1 describes delivery of the Government’s election commitments, which address community safety, transport, health, and the cost of living.
Service Delivery 2011-12 Introduction 1

Other output, asset investment and revenue initiativesChapter 2 describes funding for output, asset investment and revenue initiatives which are over and above the Government’s election commitments. This includes funding for a range of emerging priorities, as well as efficiencies and savings.
2 Introduction Service Delivery 2011-12

Continuing service deliveryGovernments may make funding commitments for specified periods of time, either to address a particular service need or to establish or foster a new industry or service. The Government has provided funding to continue a number of programs that would otherwise have ended on 30 June 2011 to meet the ongoing needs of the community. Chapter 3 provides departmental output statements that detail the outputs government departments intend to deliver in 2011-12, which take into account the new initiatives described in Chapters 1 and 2, and government’s continuing core services.
2011 Victorian Families StatementBudget Paper No. 3 Service Delivery is an important document outlining key aspects of the Government’s policies and strategy for service delivery to the wider community. It follows the release in January of the 2011 Victorian Families Statement – Starting the discussion on what matters to families. This statement represents a new approach to the way in which the Victorian Government engages with families and reports on key factors that affect the quality of family life. Future families statements will incorporate key data to enable the Government to better understand how families are managing, which areas of government action help them, and importantly, how the Government can do more to help Victorian families. The information in Budget Paper No. 3 provides a valuable companion to future families statements by informing Victorians about the services to be delivered and providing the performance targets by which successful delivery can be measured.
Service delivery The 2011-12 Budget delivers services to the Victorian community that implement the Government’s election commitments and other priorities. The Government is placing a strong focus on providing a higher standard of living for all Victorians.
Disaster responseVictorians have suffered from the effects of significant flood damage in 2010 and 2011, and continue to deal with the long running impacts of the devastating bushfires of 2009. The 2011-12 Budget includes a range of initiatives across the four key components of emergency management: preparation, prevention, response and recovery.Flood affected people, communities and businesses will be supported through this budget, including through programs to assist people
Service Delivery 2011-12 Introduction 3

suffering from loss of employment, additional health and wellbeing services, and financial advice to farmers and producers.Businesses in areas of extreme damage will receive flood recovery support through grants and concessional loans, mentoring services from a panel of business advisers, and additional tourism, marketing and industry assistance initiatives.Assistance will be delivered through initiatives including the Apprenticeship Retention program, the Community Recovery Fund, the Interim Accommodation Plan and the Business Flood Recovery Fund. Part of this flood recovery package is a voluntary buyback scheme to help irrigators on the Lower Loddon floodplain recover, and protect the region from future flooding.The Government will provide funding to repair damaged infrastructure, including repairs to Victoria’s arterial roads and bridges, and the affected regional rail network. Support will be provided to rebuild community assets, such as public halls, sporting clubrooms, grounds and historic buildings. Funds will also be provided to restore and improve the flood information and warning system. A Bushfire Response Planning Unit will support people rebuilding homes in bushfire prone areas and the Government will implement the Retreat and Resettlement Strategy involving the non-compulsory acquisition of land in high bushfire risk areas. In addition, the Government will provide a mobile rebuilding advisory service.Importantly, the Government will begin work on reducing the risks of bushfires by starting a $50 million Safer Electricity Assets Fund to replace ageing electricity assets with safer technologies as recommended by the Victorian Bushfires Royal Commission.
Cost of livingIn recent years, Victorians have faced significant cost of living pressures. These have included the impact of rising water and electricity bills. This budget takes steps to ease cost of living pressures in a variety of ways.The Government will support homebuyers, pensioners and farmers through a range of land transfer duty cuts. First homebuyers will benefit from the continuation of programs such as the First Home Owner Grant and the First Home Bonus (including the Regional Bonus), and eligible buyers will receive a reduction in land transfer duty rates. The stamp duty concession threshold for pensioners and concession card holders will be extended and young farmers will benefit from land transfer duty exemptions on certain property purchases.The Government has taken important steps to assist families in most need with the cost of essential services, including extending energy
4 Introduction Service Delivery 2011-12

concessions for concession card holders to provide a year-round 17.5 per cent reduction in their electricity bills. The annual cap for water and sewerage concessions will be increased in 2011-12 to compensate households for water and sewerage prices increases.Additional support will include providing better access to kindergarten services for eligible low income families, support for children with disabilities in early childhood settings, and targeted support for small rural kindergartens. Ambulance membership fees will be halved, supporting and encouraging families to obtain this important emergency cover and avoid the significant cost of uninsured ambulance usage.
Community safetyThe Government is investing heavily in a comprehensive community safety strategy. The strategy combines an increased police presence, appropriate sentencing policies and a range of targeted interventions to address the underlying causes of crime. Public safety and crime reduction will be improved with funding of $437 million over four years. This will include the deployment of 940 protective services officers to patrol metropolitan railway stations and four major regional stations, and bringing forward the deployment of 1 700 new police officers by November 2014.
Service Delivery 2011-12 Introduction 5

The addition of 108 beds to the male prison system will enable the effective management of the prison population, while funding for the electronic monitoring of offenders and suspects in the community will improve community safety by reducing the risk of re-offending.The Government will establish the Victorian Responsible Gambling Foundation to reduce the incidence and severity of problem gambling across Victoria and facilitate assistance to problem gamblers.The Government is committed to retaining and supporting the Courts Integrated Services Program in relation to defendants with multiple and complex needs. The budget provides $22 million over four years to continue the provision of case management and offender supervision to reduce re-offending.The Government will provide support for community safety initiatives, including Neighbourhood Watch, the Community Safety Fund and the Public Infrastructure Safety Fund, which will assist the implementation of local crime prevention projects.
Rebuilding our transport systemImproving the transport system is a critical element in the Government’s policy agenda. High quality transport options are of vital importance in improving liveability, encouraging new business and managing population growth. The Government’s strategy encompasses roads, metropolitan and regional trains, trams, freight and taxi services. Funding of more than $1 billion will deliver improvements urgently needed by the Victorian community to the standard and safety of the rail and road transport networks. The Government will invest $484 million for rail network improvements including $222 million for seven new X’Trapolis trains as stage 1 of a rolling stock procurement program for 40 new trains and the establishment of a new Maintaining our Rail Network Fund for rail asset renewal and maintenance; to be overseen by a new independent Victorian Public Transport Development Authority. Road improvement initiatives of more than $600 million include increased funding for local councils to maintain and restore country roads and bridges across Victoria, and the installation of flashing lights and boom barriers at up to 75 country level crossings. The Government will also fund the next stage of the M80 upgrade and road widening, including upgrades to interchanges and a Freeway Management System. The Government has commissioned an inquiry into the performance of the taxi and hire car service industries and will initiate a number of feasibility studies into aspects of the transport system. These studies will include the examination of options for an inter-capital high speed
6 Introduction Service Delivery 2011-12

railway, the construction of rail links to Doncaster and Melbourne Airport, the feasibility of relocating car stevedoring functions from Melbourne (Webb Dock) to Geelong, and the development of a rail link to Rowville.On top of this significant investment to deliver urgent transport system improvements, the Government will provide additional funding for the Regional Rail Link project that will provide vital infrastructure for Melbourne’s western growth corridor and for country Victoria.
Service Delivery 2011-12 Introduction 7

Regional and country VictoriaThe Government has a strong commitment to delivering quality services and strengthening local communities beyond metropolitan Melbourne. This includes Victoria’s key regional centres, but also places a renewed focus on smaller rural communities across the State.The $1 billion Regional Growth Fund will create jobs and build industries in regional Victoria, and the First Farm Grant program will provide planning and development support for young farmers. Funding of more than $313 million will drive prosperity and growth in regional Victoria by supporting regional businesses, tourism, and health services. Funding will allow the Geelong Manufacturing Council to work with Deakin University’s Geelong campus to partner postgraduate students with local businesses.The tourism industry across regional Victoria will be supported through funding to build key events and activities, and to improve skills and service standards, including through the industry supported Victorian Tourism Workforce Development Plan 2010-2016. Other initiatives include showcasing rural and regional areas as potential investment and living destinations, and supporting farming businesses through the Farmers’ Markets Support program.The Government will improve the health of regional Victorians by upgrading and boosting the capacity of rural health services, including additional funding for the new Bendigo Hospital, redevelopment or expansion of hospitals in Echuca, Kerang and Mildura, and providing incentives to medical professionals to work in rural areas.Artistic endeavour in Victoria’s regional communities will benefit from funding through the Regional Arts Transformation program, which will invite artists to develop art on location in small towns and invite towns to develop an artwork of their own, and support major performing arts companies with the costs of touring to regional Victoria.
Health and hospitalsThe Government is committed to delivering efficient and responsive health services with programs that improve health outcomes across the Victorian community. The 2011-12 Budget highlights the Government’s key priorities. Despite difficult fiscal circumstances, substantial hospital operations growth funding has been allocated to the health system, including the first tranche of the 800 new hospital beds promised during the election. To improve the health and wellbeing of Victorians, the Government has provided more than $2.0 billion over four years for new initiatives to improve hospital, mental health, ambulance, aged care, dental health,
8 Introduction Service Delivery 2011-12

and public health services. This funding includes $1.2 billion over four years to deliver election commitments.The funding announced in this budget will provide an immediate boost to health services, will improve access to elective surgery and emergency department services including in regional and country Victoria, and deliver new assets that will grow health services into the future. Capital funding has been provided to deliver election commitments such as the Rural Capital Support Fund, expanding the Box Hill and Bendigo hospitals, and other capital investments including Frankston, Maroondah and Northern Hospitals. The Olivia Newton-John Cancer and Wellness Centre will also be completed.
Education and skillsThe Government has a strong policy agenda across all education settings. In early childhood, the Government recognises the significant returns from early intervention, particularly targeted at those families who might otherwise not benefit from early childhood education and care. In school education, the Government supports a high quality public education system as well as supporting the parental choice of an accessible and affordable alternative through Catholic and independent schools.The Government is making substantial investments to upgrade community based kindergarten and children’s services, to assist small rural kindergartens to meet administrative and operational costs and support young children with disabilities and their families to attend and thrive at kindergarten. In schooling, children with disabilities will benefit from a significant boost in funding for programs and capital investment, including much needed equipment for vision impaired children.New funding of $24 million will provide for mathematics and science specialists in government primary schools to build science and maths skills in the primary teaching profession and lift students’ interest in science and maths from an early age. Science graduates will be attracted into teaching through new scholarships and new partnerships will be forged with science and maths businesses, research institutes, universities and TAFEs. Language education will be enhanced through better resourced community languages schools. Schools will be encouraged, through additional funding, to build areas of specialisation in innovative fields. Safety and wellbeing of young people at government schools will be enhanced, with funding of $124 million to continue existing and increase the number of Primary Welfare Officers, and the powers of principals and teachers to improve discipline and safety in schools will be strengthened. Teachers will be offered the necessary professional development to manage the classroom. Chaplains will be trained to
Service Delivery 2011-12 Introduction 9

provide support services to students. Anti-bullying programs will receive a major funding boost. The Government will increase its investment in schooling and opportunities for vulnerable and disengaged children through an innovative pilot program to transition young people back into effective education. TAFE and other vocational education and training qualifications will be made more accessible with a restoration of concessions for young people undertaking high level courses and expanded eligibility criteria for government subsidised training.
Supporting local communitiesThe Government will encourage vibrant and self-reliant communities built on high levels of voluntary effort and civic participation.In the 2011-12 Budget, the Government has provided more than $50 million to increase participation in Victorian communities, including funding for volunteers, for the sustainability of the not-for-profit sector to meet growing and challenging demands, to boost participation in civic activities, and to contribute to the cost of community infrastructure and amenities.The Government will support access to and participation in the arts, sport and recreation activities by providing $24 million for the Victorian College of the Arts, and funding for a new Community Support and Recreational Sports Package. Sport and recreational facilities will be improved through funding for the State Sports Facilities Project in Albert Park and to support the Skilled Stadium Stage 3 redevelopment in Geelong. Both of these sporting facilities include a commitment to community sporting programs. In addition the Government will continue to deliver funding, through contributions from the Community Support Fund, for sporting facilities that were previously funded through the Community Facilities Funding program, subject to the usual approval processes and capacity.Funding will also be provided to celebrate Victoria’s rich military history through commemorative events, the restoration of memorials, and educational activities.The Government will provide a new Victorian Multicultural Grants Program with funding to develop African community leadership skills in order to increase confidence and self-sufficiency in Victoria’s African community, and establish an annual calendar of major multicultural events throughout regional and metropolitan Victoria. In addition, the Government will establish a South Asian building fund for the construction of new, and the enhancement of existing, community
10 Introduction Service Delivery 2011-12

spaces and facilities within four identified South Asian community organisations.
Protecting families in needThe Government has established a judicial review of Victoria’s child protection system. Additional resources will also be invested in the system, including the employment of an additional 47 child protection staff. Young Victorians will be supported to make better choices and be given opportunities to access better housing and community activities through services including Headspace Communities of Youth Services, and regional offices of the Centre for Multicultural Youth.Victorian Seniors and people with a disability, their families and carers will benefit from increased support for accommodation, respite care, and aids and equipment.
Indigenous VictoriansIndigenous Victorians who have made significant contributions to address Indigenous disadvantage will be recognised through the Honour Roll for Indigenous Victorians, and Indigenous organisations will be supported to build capacity to meet statutory obligations and organisational challenges.
Enhancing urban liveabilityOne of Victoria’s greatest assets is the built form of its cities and towns, and the Government is committed to fostering change and growth in a manner that respects this, and returns fairness and certainty to the urban planning system.
Service Delivery 2011-12 Introduction 11

The Government will provide $9.7 million over four years to deliver a new metropolitan planning strategy for Melbourne, which will be underpinned by substantial community engagement. The strategy will draw on the findings of a liveability audit, activity area boundary definition, audit of green wedge land and open space, and an assessment of the development potential of government owned land. It will also provide for the development of land use adaptation plans for Victoria’s coastal settlements.Funding is also provided to deliver new guidelines and clearer planning policies that will provide greater fairness and certainty for communities, developers and investors in relation to applications for new wind farm development.Funding of $52 million will be provided for urban revitalisation and development, and to support local government activities. Funding will support local development such as the Frankston Activity Area revitalisation and ongoing services to maintain Victoria’s heritage assets. In addition, the Government will contribute to local government initiatives, including support for capital works at public libraries, and energy efficiency initiatives such as the Green Light Plan to save money and cut emissions.
The environmentThrough a range of initiatives, the Government will begin to restore and improve the protection of Victoria’s environment. The Government’s approach includes a focus on facilitating community engagement with, and appreciation of, Victoria’s natural assets.Funding of more than $169 million will support the management of Victoria’s parks and land, continue 65 park ranger positions across Victoria, provide access to recreational opportunities and encourage sustainable use of Victoria’s environmental assets. The Government will provide grants for community groups engaged in managing the environment, continue funding the management of pests and weeds on public land, provide $12 million to restore Landcare in Victoria’s regions, and assist with the management of National Parks, beaches and the foreshore around Port Phillip Bay. Sustainability initiatives totalling $121 million involve water management projects, rebates to encourage water efficiency in households and small businesses, and upgrades to street lighting for energy efficiency.
Integrity of governmentVictorians rightly expect high standards from those in public office. The 2011-12 Budget funds a range of initiatives aimed at strengthening the integrity of Victoria’s democratic and public institutions.
12 Introduction Service Delivery 2011-12

The accountability of the Government will be improved through the establishment of the Independent Broad-based Anti-corruption Commission (IBAC), which will investigate, expose and prevent corruption involving or affecting public authorities and public officials. IBAC will also educate public officials and members of the public about corruption and its harmful effects on public administration and the community. The Government will also establish the Independent Office of the Freedom of Information Commissioner to promote transparency, and an independent review panel to scrutinise and approve government advertising. The Government’s priorities are reflected in its decision to achieve substantial savings in areas such as government advertising, communications budgets and ministerial staff numbers. A new Independent Children’s Commissioner will be appointed and report directly to Parliament. The Commissioner will have the power to initiate reviews regarding the safety of children, the scope of which will extend to children not known to the child protection system who are identified by the Coroner as having suffered from abuse and neglect. Funding will be provided to restore access to local crime statistics by Neighbourhood Watch groups, which will allow communities to learn more about crime in their local area. The Government will also provide funding to review budget reporting measures, which will help improve the usefulness and transparency of performance reporting measures on the Hospital Performance website. Integrity in government includes a commitment to ensuring that taxpayers’ money is spent wisely and efficiently. To this end, the Government is focused on driving efficiencies in service delivery and instituting the most significant Independent Review of State Finances in 20 years. A productivity reform agenda will be implemented that will include initiatives to reduce business costs and improve the efficiency of the public sector, including its provision of infrastructure. The Independent Review of State Finances commissioned earlier in 2011 will also inform this agenda.
BusinessThe Government is committed to driving a stronger, more competitive economy and business environment in Victoria that will assist industries to generate jobs and investment, improve the capacity of business to compete nationally and globally, and reduce business regulatory burdens. These programs will also help business identify skilled migrants needed to fill critical gaps in the workforce, and promote collaboration on research between industry and the education sector to the benefit of the Victorian economy and society.
Service Delivery 2011-12 Introduction 13

Support for the Office of the Victorian Small Business Commissioner will help provide small businesses with practical assistance and access to quick, lower cost dispute resolution. Funding for Export Victoria aims to increase exports into new and growing markets and to ensure Victorian industry has the necessary information to capture emerging export opportunities. The Industry Capability Network and the Investment Support Program will focus on expanding job opportunities and investment in Victoria, including in advanced manufacturing.Victorian science and technology investment will be increased through the establishment of networks between research and industry sectors to promote and enable technology transfer between education and research institutions and business. Further, an Office of the Lead Scientist will aid the development and direction of innovation and science policy and a Victorian Biotechnology Advisory Council will facilitate a long-term and coordinated approach to build on advances in the biotechnology sector.Tourism Victoria will undertake targeted outreach and information services in key markets, and Victoria’s world-class educational institutions will be promoted under the banner of ‘Victoria: Leader in Learning’.The Government’s initiatives will promote Victoria as a destination of choice for people, business and investment.
Budget Paper No. 3 Service Delivery – structure and changesThe Government has implemented some changes in this year’s Budget Paper No. 3 to strengthen the transparency of, and accountability for, the Government’s activities. In implementing these changes, the Government has ensured the overall level of disclosure compared to past budget papers has been maintained or enhanced. The following narrative describes the revised structure and highlights the major changes to Budget Paper No. 3.Information is presented by department with government-wide initiatives listed first. Initiatives are split into output and asset groupings. Where applicable, funding amounts for output and asset initiatives indicate the total gross cost of the initiatives. Funding from reprioritisation, contingencies and other existing funding sources has not been deducted from the total cost of the initiatives. In some instances, figures in tables do not sum exactly, this is due to rounding. Funding provided by the Commonwealth Government is included, together with initiatives funded through National Partnership Agreements.
14 Introduction Service Delivery 2011-12

Structure and changes
Chapter 1 – Election commitments Chapter 1 details the Government’s election commitments,
including summary descriptions of each initiative and cross references to the relevant departmental output(s).
Chapter 2 – Other output, asset investment and revenue initiatives Chapter 2 provides summary descriptions and detailed tables for
all other new outputs, asset investments, revenue and efficiency initiatives for each department, including cross references to the relevant departmental output(s).
Chapter 3 – Departmental output statements Departmental output statements describe each department’s
objectives and strategic priorities, and contain narrative on how service delivery activities are intended to contribute to the achievement of the objectives.
Each departmental output statement lists performance measures and targets (expressed as quantity, quality, timeliness and cost measures) for each output to be delivered in 2011-12. The cost measure for each output is the total output cost, which is derived from all revenue sources including state appropriation.
This year, the departmental output statements include information about the financial resources available for each department to fund the provision of services, additional assets, and payments made on behalf of the State, including appropriations provided in the Appropriation (2011-12) Bill.
The Premier allocates functions between departments and ministers, which are reflected in this budget paper.
Appendix A – Output performance measures for review by the Public Accounts and Estimates Committee Appendix A contains details of previously published performance
measures that are proposed to be discontinued or substantially changed in 2011-12, including reasons for their discontinuation or change.
The Government has introduced a new process where the Public Accounts and Estimates Committee (PAEC) will review proposed changes to output performance measures and targets that would discontinue or substantially change those output performance measures and/or targets.
In this budget, proposals to discontinue or significantly change output performance measures have been highlighted in Appendix A Output performance measures for review by the Public Accounts and Estimates Committee. PAEC will review the proposed changes.
Service Delivery 2011-12 Introduction 15

After receiving the PAEC’s recommendations, the Government will make any changes required to the output performance measures and present these amendments on its budget information website: www.budget.vic.gov.au.
Appendix B – Local government financial relations Appendix B describes activities in the local government sector and
the State’s funding contribution to local government in Victoria. Appendix B also highlights the 2011-12 Budget initiatives that will have a major impact on local government.
16 Introduction Service Delivery 2011-12

Service Delivery 2011-12 Introduction 17
CHAPTER 1 – ELECTION COMMITMENTS
The Government’s 2010 election commitments set out a detailed four-year program to strengthen all Victorians’ quality of life across the full range of portfolio areas. The election commitments comprised output and revenue initiatives that totalled $5.21 billion, and capital investments totalling $2.40 billion. The 2011-12 Budget represents a major step in delivering this program. Funding announced in this budget for the Government’s election commitments over the five years to 2014-15 totals $4.36 billion in output initiatives, $757 million in revenue initiatives, and $1.10 billion total estimated investment (TEI) in asset initiatives. The remaining output and asset commitments will be fully funded in future budgets during this term of government.In the 2011-12 Budget, the Government has also funded further significant policy measures beyond its election commitments. These are listed in detail in Chapter 2. Combined with the election commitments announced in this chapter, the total impact is $7.07 billion over the five years from 2010-11 to 2014-15 in output initiatives and $1.67 billion TEI in asset initiatives.The Government’s election commitments set out total savings of $1.57 billion over five years. These savings have been delivered in the 2011-12 Budget and are detailed at the end of Chapter 1. As a result of the $4.10 billion reduction in Victoria’s GST revenue over five years, additional efficiency savings have been realised in this budget. These savings are listed in Chapter 2 and bring the total savings to $2.21 billion over five years.
Service Delivery 2011-12 Chapter 1 19

BUSINESS AND INNOVATION
Output initiatives($ million)
2010-11 2011-12 2012-13 2013-14 2014-15 5 Yr Total Funding Approved
Industries and innovationCollaborative networks for technology
transfer.. 0.1 0.2 0.1 .. 0.4
Farm debt mediation scheme 0.4 1.1 1.0 0.8 0.7 3.9Geelong Manufacturing Council .. 0.2 0.2 0.2 0.2 0.8Geelong Regional Airport feasibility
study.. 0.2 .. .. .. 0.2
Industry Sustainability Working Committee
.. 0.5 0.5 .. .. 1.0
MoviExperience .. 0.1 0.1 0.1 0.1 0.6Office of the Lead Scientist .. 0.8 1.5 1.5 1.5 5.3Regional Aviation Fund .. 5.0 5.0 5.0 5.0 20.0Textile and Fashion Hub .. 0.1 0.1 .. .. 0.2Victorian Biotechnology Advisory
Council.. 0.3 0.3 0.3 0.3 1.2
Investment and trade2012 Expo in Yeosu South Korea .. 0.7 0.3 .. .. 1.0Victoria – Leader in Learning (VLIL) .. 0.5 0.5 0.5 0.5 2.0Marketing VictoriaRed Bull Air Race for Geelong .. 0.5 .. .. .. 0.5Employment and industrial relationsCulturally and Linguistically Diverse
(CALD) job bank registry.. 0.1 0.1 0.1 0.1 0.4
Major projectsInternational competition to restore
Flinders Street Station.. 1.5 0.1 .. .. 1.6
Other commitmentsMinor community commitments – other .. 0.1 .. .. .. 0.1Total output election commitments 0.4 11.8 9.9 8.6 8.4 39.1 Source: Department of Treasury and Finance
Industries and innovation
Collaborative networks for technology transferFunding is provided to establish networks between industry and the private sector that promote and enable technology transfer and uptake for specific industry needs. A showcase will be developed to further promote commercial technology opportunities identified in Victoria. This initiative contributes to the Department of Business and Innovation’s Innovation output.
20 Chapter 1 Service Delivery 2011-12

Farm debt mediation scheme Funding is provided to allow financial institutions to undertake a mediation process with food and fibre producers before initiating debt recovery proceedings. Mediation will be organised through the Office of the Small Business Commissioner and conducted by approved mediators who will seek to develop a mutually agreed resolution between parties without recourse to other legal measures. This initiative contributes to the Department of Business and Innovation’s Small Business output.Geelong Manufacturing CouncilFunding is provided to the Geelong Manufacturing Council to deliver a program that partners postgraduate students from Deakin University’s Geelong campus with local manufacturing businesses, to provide students with the opportunity to apply their research capability to practical industry-based applications.This initiative contributes to the Department of Business and Innovation’s Sector Development output. Geelong Regional Airport feasibility studyFunding is provided for a feasibility study into the viability of replacing Geelong regional airport, including identifying possible sites. This initiative contributes to the Department of Business and Innovation’s Sector Development output. Industry Sustainability Working CommitteeFunding is provided to establish an Industry Sustainability Working Committee to work with industry, research and educational organisations to review existing environmental measures, including alignment with the future needs of industry and the economy. This will assist to maximise economic opportunities from transitioning to a low carbon and more sustainable economy. This initiative contributes to the Department of Business and Innovation’s Innovation output.MoviExperienceFunding is provided for a one week session of intensive study in filmmaking and post-production for 10 Victorian students in Years 10 to 12 during school holidays. In addition, funding is provided to boost ties with Bollywood and to develop the Indian Film Festival to become a permanent part of Melbourne’s cultural calendar. This initiative contributes to the Department of Business and Innovation’s Sector Development output.
Service Delivery 2011-12 Chapter 1 21

Office of the Lead ScientistFunding is provided to establish an Office of the Lead Scientist to aid the development and direction of innovation and science policy, and provide advice on major science, technology and research infrastructure, and coordinate activities with relevant Commonwealth agencies.This initiative contributes to the Department of Business and Innovation’s Science and Technology output. Regional Aviation FundFunding is provided to establish the Regional Aviation Fund to assist with infrastructure development to increase the viability of regional public-use airports throughout Victoria. A priority will be a new runway and redevelopment of Bendigo Airport to help boost associated transport and communications infrastructure in the Bendigo region. This initiative contributes to the Department of Business and Innovation’s Sector Development output.Textile and Fashion HubFunding is provided to support the Council of Textile and Fashion Industries of Australia to establish a Textile and Fashion Hub at the Kangan Institute. The Hub will house state-of-the-art design and manufacturing equipment. This initiative contributes to the Department of Business and Innovation’s Sector Development output. Victorian Biotechnology Advisory CouncilFunding is provided to establish a Victorian Biotechnology Advisory Council to facilitate a long-term and coordinated approach to biotechnology sector development. The Council will seek to enhance information flows within the private sector and between government and industry. This initiative contributes to the Department of Business and Innovation’s Science and Technology output.
Investment and trade
2012 Expo in Yeosu South KoreaFunding is provided to promote Victoria at Expo 2012 in Yeosu, South Korea. The Expo is scheduled to take place from May to August 2012. Victoria’s involvement will include a program of trade missions and industry-focused activities in South Korea to promote Victorian business and capabilities, and to increase export and job creation opportunities. This initiative contributes to the Department of Business and Innovation’s Investment Attraction and Facilitation output.
22 Chapter 1 Service Delivery 2011-12

Victoria – Leader in Learning (VLIL)Funding is provided for targeted information and outreach services within specific overseas markets, promoting Victoria as an education destination of choice under the Victoria – Leader in Learning banner. This initiative includes stronger community safety policies and stronger focus on specific tertiary education and training opportunities.This initiative contributes to the Department of Business and Innovation’s: Exports output; and Sector Development output.
Marketing Victoria
Red Bull Air Race for GeelongFunding is provided to undertake a detailed feasibility study and analysis for securing the rights to host the Red Bull Air Race in Corio Bay in Geelong at a future date. This initiative contributes to the Department of Business and Innovation’s Tourism output.
Employment and industrial relations
Culturally and Linguistically Diverse (CALD) job bank registryFunding is provided to maintain a registry that can be accessed by potential employers to identify talent and skills of skilled migrants from culturally and linguistically diverse backgrounds and to assist these migrants find employment more rapidly. The registry will assist Victoria’s capacity to attract the skills needed by industry to strengthen and expand.This initiative contributes to the Department of Business and Innovation’s Employment and Industrial Relations output.
Major projects
International competition to restore Flinders Street StationGovernment is committed to restoring Flinders Street Station to be a world class facility and centrepiece of Melbourne’s central business district. Funding is provided for a design competition to generate ideas for the refurbishment and upgrade of the Station. The competition will seek to attract Australia’s and the world’s best architects and designers to retain the heritage integrity and improve the station to maintain it as a Victorian and international icon. This initiative contributes to the Department of Business and Innovation’s Major Projects output.
Service Delivery 2011-12 Chapter 1 23

Other commitments
Minor community commitments – otherFunding is provided for a range of minor tourism initiatives. The program of works include a feasibility study for a tourism centre and a food and wine directory.
Asset initiatives($ million)
2010-11 2011-12 2012-13 2013-14 2014-15 TEI Funding Approved
Minor community commitments – other .. 0.1 .. .. .. 0.1Total asset election commitments .. 0.1 .. .. .. 0.1Source: Department of Treasury and Finance
Minor community commitments – otherFunding is provided for a range of minor tourism initiatives. The program of initiatives includes a business plan for a heritage park and other events.
24 Chapter 1 Service Delivery 2011-12

EDUCATION AND EARLY CHILDHOOD DEVELOPMENT
Output initiatives($ million)
2010-11 2011-12 2012-13 2013-14 2014-15 5 Yr Total Funding Approved
Early ChildhoodFacilities to meet our growing needsChildren’s facilities capital program .. 15.0 .. .. .. 15.0Kindergarten Inclusion Support Services
improvements.. 2.4 2.5 2.5 2.6 10.0
Small rural kindergartens .. 1.5 1.5 1.5 1.5 6.0Support for parents in the early yearsFunding boost for the Victorian branch of
the Australian Breastfeeding Association
.. 0.1 0.1 0.1 0.1 0.2
Maternal and child health nurses scholarship program
.. .. 0.1 0.1 0.1 0.2
Parenting strategy .. 0.4 0.5 0.5 0.6 2.0SchoolingImproving standards and investing in specialist teachingCommunity languages schools 1.3 3.1 2.8 2.9 3.1 13.2Encouraging sister school relationships
and exchanges.. 0.1 0.1 0.1 0.1 0.3
Primary mathematics and science specialists
.. 4.1 5.2 6.8 5.5 21.6
School specialisation grants .. 0.8 0.7 0.6 0.4 2.5Science graduate scholarship program .. 0.4 1.2 1.3 1.3 4.1Science, maths and entrepreneurship –
collaborative network.. 0.1 0.1 0.1 0.1 0.4
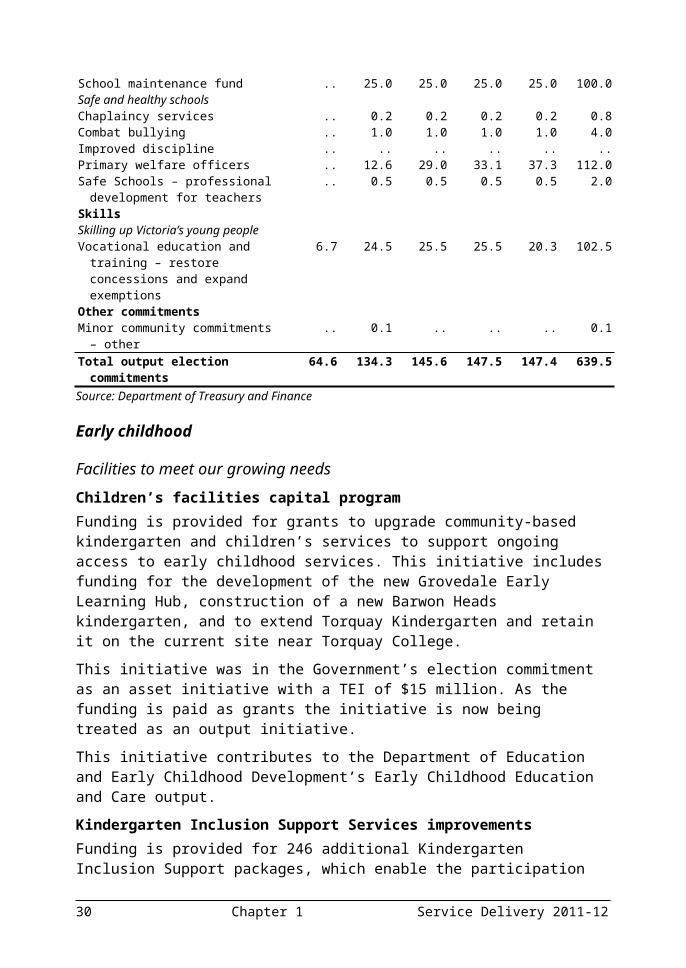
Boosted support for vulnerable young people Equipment for sight impaired children .. .. 2.1 .. .. 2.1Pilot for disengaged students program .. 0.5 0.5 0.1 .. 1.0Supporting the choices of parentsFair funding for non-government schools 56.6 42.2 47.1 45.7 47.9 239.5Building better schoolsFull maintenance audit .. .. .. .. .. ..School maintenance fund .. 25.0 25.0 25.0 25.0 100.0Safe and healthy schoolsChaplaincy services .. 0.2 0.2 0.2 0.2 0.8Combat bullying .. 1.0 1.0 1.0 1.0 4.0Improved discipline .. .. .. .. .. ..Primary welfare officers .. 12.6 29.0 33.1 37.3 112.0Safe Schools – professional development
for teachers.. 0.5 0.5 0.5 0.5 2.0
SkillsSkilling up Victoria’s young peopleVocational education and training – restore
concessions and expand exemptions 6.7 24.5 25.5 25.5 20.3 102.5
Other commitmentsMinor community commitments – other .. 0.1 .. .. .. 0.1Total output election commitments 64.6 134.3 145.6 147.5 147.4 639.5
Service Delivery 2011-12 Chapter 1 25

Source: Department of Treasury and Finance
Early childhood
Facilities to meet our growing needs
Children’s facilities capital programFunding is provided for grants to upgrade community-based kindergarten and children’s services to support ongoing access to early childhood services. This initiative includes funding for the development of the new Grovedale Early Learning Hub, construction of a new Barwon Heads kindergarten, and to extend Torquay Kindergarten and retain it on the current site near Torquay College.This initiative was in the Government’s election commitment as an asset initiative with a TEI of $15 million. As the funding is paid as grants the initiative is now being treated as an output initiative.This initiative contributes to the Department of Education and Early Childhood Development’s Early Childhood Education and Care output. Kindergarten Inclusion Support Services improvementsFunding is provided for 246 additional Kindergarten Inclusion Support packages, which enable the participation of children with severe disabilities in kindergarten, and to expand the Kindergarten Inclusion Support program to support the participation of up to 20 children a year with complex medical needs.This initiative contributes to the Department of Education and Early Childhood Development’s Early Childhood Intervention Services output.Small rural kindergartensFunding is provided for grants for small rural kindergarten services of up to $20 000 to assist with administrative and operational costs. This will help to sustain small rural kindergartens so that services can continue to be provided to the regional families who rely on them. These services will receive grants in addition to the per capita grants, kindergarten fee subsidies and parent fees they currently receive. This initiative contributes to the Department of Education and Early Childhood Development’s Early Childhood Education and Care output.
Support for parents in the early years
Funding boost for the Victorian Branch of the Australian Breastfeeding Association Funding is provided for a significant funding boost to the Victorian branch of the Australian Breastfeeding Association, which seeks to educate the community about the health benefits and importance of breastfeeding for the infant, mother and the family. The funding will
26 Chapter 1 Service Delivery 2011-12

support volunteers in rural Victoria, expand current programs and support parents and infants.These initiatives contribute to the Department of Education and Early Childhood Development’s Child Health and Support Services output.
Service Delivery 2011-12 Chapter 1 27

Maternal and child health nurses scholarship program Funding is provided for additional maternal and child health nurse scholarships. The funding will expand the existing scholarship program for nurses to undertake maternal and child health studies and will provide an extra 50 postgraduate scholarships at $3 500 each. Funding of $30 000 is provided in 2011-12.These initiatives contribute to the Department of Education and Early Childhood Development’s Child Health and Support Services output.Parenting strategy Funding is provided for a parenting strategy to deliver a range of measures designed to assist parents in dealing with children’s behavioural and development challenges. These initiatives contribute to the Department of Education and Early Childhood Development’s Early Childhood Education and Care output.
Schooling
Improving standards and investing in specialist teaching
Community languages schools Funding is provided to support community languages schools by increasing the rate of student funding and negotiating a rental agreement for after-hours use of government school facilities. Per capita funding of $190 will be made available to organisations for all eligible students of school age (5-18 years) enrolled to study in accredited community languages schools. This initiative contributes to the Department of Education and Early Childhood Development’s: Early Years (schools) output; Middle Years (schools); and Later Years and Youth Transitions output.Encouraging sister school relationships and exchanges Funding is provided for greater support to schools in maintaining sister school partnerships. The initiative will strengthen the sister school program by broadening the scope to include relationships between Victorian schools and other Victorian or interstate schools, encouraging more schools to participate, promoting best practice models, and encouraging exchanges for teachers and school leaders.This initiative contributes to the Department of Education and Early Childhood Development’s: Early Years (schools) output;
28 Chapter 1 Service Delivery 2011-12

Middle Years (schools); and Later Years and Youth Transitions output.Primary mathematics and science specialists Funding is provided to employ 100 additional mathematics and science specialists in primary schools to build teacher capacity to increase student interest and achievement in mathematics and science.Funding for this initiative will support the provision of mathematics and science studies and address an area of need in Victorian schools. This initiative includes funding of $2.7 million in 2015-16.This initiative contributes to the Department of Education and Early Childhood Development’s: Early Years (schools) output; and Middle Years (schools) output. School specialisation grantsFunding is provided for grants to government primary and secondary schools to encourage specialisation in fields of learning and increase diversity and choice in education. Grants can be used to invest in staff professional development and for the purchase of equipment to specialise in fields such as robotics, multimedia, fashion, languages, design or horticulture.Funding for this initiative will allow schools to better cater for growing demand for specialised education and will contribute to a more highly skilled specialist workforce in the future. This initiative contributes to the Department of Education and Early Childhood Development’s: Early Years (schools) output; Middle Years (schools) output; and Later Years and Youth Transitions output. Science graduate scholarship program Funding is provided for 400 teaching scholarships to attract science graduates into the primary and secondary teaching profession particularly in areas such as physics and chemistry. Funding for this initiative will address a growing area of need in Victorian schools. This initiative includes funding of $881 000 in 2015-16.This initiative contributes to the Department of Education and Early Childhood Development’s: Early Years (schools) output; Middle Years (schools) output; and
Service Delivery 2011-12 Chapter 1 29

Later Years and Youth Transitions output.Science, maths and entrepreneurship – collaborative networkFunding is provided to support schools to build education partnerships with science and maths-based businesses and research institutions, including universities and TAFEs.This initiative contributes to the Department of Education and Early Childhood Development’s Middle Years (schools) output.
Boosted support for vulnerable young people
The Government will undertake the following initiatives to support vulnerable Victorians in government schools in the context of Victoria’s constrained financial and budget circumstances. These initiatives align with major investments in non-election commitment output and asset investments funded in the current budget to support vulnerable Victorians in government schools.Equipment for sight-impaired children Funding is provided for equipment to assist with the establishment of the Insight Education Centre for blind and vision-impaired children. This initiative was in the Government’s election commitment as an asset initiative with a TEI of $2.1 million. As the funding is paid as a grant the initiative is now being treated as an output initiative. This initiative contributes to the Department of Education and Early Childhood Development’s Services to Students output.Pilot for disengaged students program Funding is provided to pilot and support selected models for re-engaging disengaged students. The pilots will include personalised learning and engaging curricula, wrap-around support services, supported transition arrangements and educational partnerships.This initiative contributes to the Department of Education and Early Childhood Development’s Services to Students output.
Supporting the choices of parents
Fair funding for non-government schools Funding is provided to lift non-government school funding levels for five years, commencing from the 2011 school year, to 25 per cent of the recurrent average cost of educating a student in a Victorian government school. The financial assistance contributes towards the operational costs of non-government schools. Funding will bring Victoria into line with other States, including New South Wales and Queensland, by linking the cost of educating a student in a non-government school with that of a government school.
30 Chapter 1 Service Delivery 2011-12
This initiative contributes to the Department of Education and Early Childhood Development’s: Early Years (schools) output; Middle Years (schools) output; and Later Years and Youth Transitions output.
Service Delivery 2011-12 Chapter 1 31

Building better schools
Full maintenance auditA full audit of the maintenance needs in Victorian schools will be conducted in 2011-12 for the first time since 2005. Once the full audit has been completed the Department of Education and Early Childhood Development will be better able to target increased maintenance funding to schools with the greatest demand.This initiative contributes to the Department of Education and Early Childhood Development’s: Early Years (schools) output; Middle Years (schools) output; and Later Years and Youth Transitions output. School maintenance fund Funding from this initiative will increase the total pool of maintenance funding in response to growing demand from schools. This initiative contributes to the Department of Education and Early Childhood Development’s: Early Years (schools) output; Middle Years (schools) output; and Later Years and Youth Transitions output.
Safe and healthy schools
The government will undertake the following initiatives to address rising instances of anti-social behaviour, behavioural, welfare and health problems as well as disengagement from education among younger Victorians.Chaplaincy servicesFunding is provided to support chaplaincy services to select, train, monitor and place chaplains in Victorian government schools. Chaplains perform a range of support activities for disengaged students and students with welfare and behavioural problems in Victorian schools. Funding from this initiative will assist in providing chaplains in Victorian schools of the highest standard. This initiative contributes to the Department of Education and Early Childhood Development’s Services to Students output.
32 Chapter 1 Service Delivery 2011-12

Combat bullyingFunding is provided to monitor, assess and expand programs aimed at preventing bullying in schools including a range of services to build the capacity of teachers and school leaders.
Service Delivery 2011-12 Chapter 1 33

This initiative will provide professional development for government school teachers to support them in understanding, identifying and responding to incidents of bullying and cyber-bullying. In addition, the initiative will enable schools and the Government to track and report the number and type of bullying incidents occurring in schools. This information will inform research and enable the Government to better support schools. This initiative contributes to the Department of Education and Early Childhood Development’s Services to Students output.Improved discipline
Principals’ powers will be increased to give them discretion over suspensions and expulsions and to ban, search and remove dangerous items including weapons. As these are policy and legislative reforms no funding has been provided.These initiatives contribute to the Department of Education and Early Childhood Development’s: Early Years (schools) output; Middle Years (schools) output; and Later Years and Youth Transitions output. Primary welfare officers Funding is provided to retain the current workforce of 256 primary welfare officers beyond the 2011 school year and to expand the program by an additional 150 primary welfare officers over the next four years. Primary welfare officers develop and implement wellbeing strategies in primary schools at the whole of school level and assist students with behavioural, mental health and welfare problems.This initiative contributes to the Department of Education and Early Childhood Development’s Services to Students output. Safe Schools – professional development for teachersFunding is provided for professional development for teachers in the effective management of classroom behaviours. This professional development is designed to equip teachers in methods of non-violent dispute resolution and strategies to maximise orderly learning environments.This initiative contributes to the Department of Education and Early Childhood Development’s Services to Students output.
34 Chapter 1 Service Delivery 2011-12

Skills
Skilling up Victoria’s young people
Vocational education and training – restore concessions and expand exemptionsFunding is provided to reintroduce concession fee places for young people aged 15-24 years undertaking diploma and advanced diploma courses, and to expand exemptions to the eligibility criteria for students seeking to access government-subsidised vocational education and training. This initiative is designed to address disengagement by providing support to young people who are most likely to experience financial hardship and who are under-represented in the labour market. This initiative contributes to the Department of Education and Early Childhood Development’s Skills output.
Other commitments
Minor community commitments – otherFunding is provided to support Doncaster’s Chinese family playgroup program. This initiative includes funding of $60 000 in 2011-12.
Asset initiatives($ million)
2010-11 2011-12 2012-13 2013-14 2014-15 TEI Funding Approved
SchoolingNew Schools to meet population growthNew Torquay Secondary College .. 5.5 21.0 .. .. 26.5Capital works to existing schools School upgrades .. 21.1 24.3 .. .. 45.4Boosted support for vulnerable young peopleNew Officer Special School .. 1.6 12.3 1.1 .. 15.0Special and autistic school capital
investment.. 1.4 3.4 .. .. 4.8
Other commitmentsMinor community commitments .. .. .. .. .. ..Total asset election commitments .. 29.6 61.0 1.1 .. 91.7Source: Department of Treasury and Finance
Schooling
New schools to meet population growth
The government will undertake the following initiatives to respond to growth in demand for education services in key areas.
Service Delivery 2011-12 Chapter 1 35

New Torquay Secondary College Funding is provided for capital works to complete construction of a new stand-alone secondary school at Torquay. This asset initiative will allow for students residing on the Victorian surf coast to complete their government school education in the local community.Funding for this asset initiative will help to alleviate demand pressures in the community generated by significant population growth in recent years. This initiative contributes to the Department of Education and Early Childhood Development’s: Middle Years (schools) output; and Later Years and Youth Transitions output.
Capital works to existing schools
School upgradesFunding is provided for the first tranche of the Government’s election commitment to upgrade and modernise schools across Victoria. Funding under this initiative will also be provided in future years consistent with the Government’s election commitments.Funding will be provided for major and minor capital works to maintain the quality and amenity of recipient schools. Funding for this initiative will be complemented by asset investments in 2011-12, additional to projects listed in the Government’s election commitments, to further address growing demand.Schools receiving funding under this asset initiative are: Seymour P-12 College – regeneration; Colac Secondary College – regeneration; Eaglehawk Primary School – modernisation; Parkdale Secondary College – modernisation; Toorloo Arm Primary School – modernisation; Brighton Secondary College – modernisation; Pembroke Secondary College – modernisation; Ringwood Heights Primary School – modernisation; Patterson Lakes Primary School – minor works; Narre Warren North Primary School – minor works; Sandringham Primary School – minor works; and Apollo Bay P-12 College – planning.
36 Chapter 1 Service Delivery 2011-12

This initiative contributes to the Department of Education and Early Childhood Development’s: Early Years (schools) output; Middle Years (schools) output; and Later Years and Youth Transitions output.
Boosted support for vulnerable young people
The Government will undertake the following initiatives to support vulnerable Victorians in government schools in the context of Victoria’s constrained financial and budget circumstances. New Officer Special School Funding is provided for capital works to construct a new special school at Officer. This asset initiative will form part of the Government’s broader plan to invest in areas of growing demand and to invest in vulnerable Victorians in government schools.Funding for this asset initiative will address demand for special school services in Melbourne’s south east which has risen sharply in recent years and is predicted to continue rising.This initiative contributes to the Department of Education and Early Childhood Development’s Services to Students output.Special and autistic school capital investmentFunding under this initiative will allow the government to conduct minor and major capital works at special and autistic schools across Victoria to expand capacity, meet rising demand and sustain the amenity and suitability of school facilities for vulnerable Victorians. Funding under this initiative will also be provided in future years consistent with the Government’s election commitments.Projects funded under this initiative include: Belvoir Wodonga Special Developmental School – planning; Western Autistic School – expansion of P-6 facilities to cater for
secondary eduction provision; Nepean Special School – minor works; and Yarrabah School – minor works.This initiative contributes to the Department of Education and Early Childhood Development’s Services to Students output.
Service Delivery 2011-12 Chapter 1 37

Other commitments
Minor community commitments – otherFunding is provided for improvements to lighting at the Traralgon South Primary School car park. This initiative includes funding of $20 000 in 2011-12.
Election commitments to be funded in future yearsThe Government is committed to the delivery of all its election commitments. Funding for the following asset projects will be made available in future budgets to ensure that the Government’s commitments are met: School capital program:
Ashwood Secondary College; Aspendale Primary School; Auburn Primary School; Bairnsdale Secondary College; Beaumaris Primary School; Birralee Primary School; Blackburn Primary School; Boronia Heights College; Castlemaine Secondary College; Dingley Primary School; Emerald Primary School; Fairhills Primary School; Ferntree Gully North Primary School; Gisborne Secondary College; Kingswood Primary School – front fence; Koo Wee Rup Secondary College; Mirboo North Secondary College; Montmorency Primary School; Mount Erin Secondary College; Mount Waverley North Primary School; Mountain Gate Primary School; Officer Secondary College; Pinewood Primary School; Proposed Laurimar Secondary College – feasibility study; Proposed Prahran Secondary – planning; Romsey Secondary College – planning; Ringwood North Primary School;
38 Chapter 1 Service Delivery 2011-12

Rosebud Primary School; Sandringham College; School Improvement Fund; Seaford North Primary School; Seaford Primary School; Sebastopol Secondary College; Somerville Secondary College Technical Centre; Wattle View Primary School; Templestowe College; and Timbarra Secondary College Year 10-12 – planning.
Service Delivery 2011-12 Chapter 1 39

HEALTH
Output initiatives($ million)
40 Chapter 1 Service Delivery 2011-12

2010-11 2011-12 2012-13 2013-14 2014-15 5 Yr Total Funding Approved
Acute Health Services800 new hospital beds .. .. .. .. .. ..Ballan Hospital redevelopment .. 1.0 1.0 .. .. 2.0Boost to Ballarat Health Service .. 0.7 23.7 24.2 24.8 73.4Budget reporting measures
implementation.. 0.1 0.1 0.1 0.1 0.3
Open access board meetings .. .. .. .. .. ..Patient focused work practices .. 0.1 0.1 0.1 0.1 0.4Primary Ciliary Dyskinesia .. 0.2 .. .. .. 0.2Rural and regional health overhaul .. 3.3 3.5 3.7 3.7 14.2Strenthening palliative care .. 8.6 8.6 8.6 8.6 34.4Support and self help groups .. 1.0 1.0 1.0 1.0 4.0Waiting list and emergency department
reform.. 14.7 19.7 26.6 28.6 89.5
Ambulance services340 new ambulance officers 6.1 23.4 40.4 40.1 41.1 151.0Ambulance services – 50 per cent cut to
ambulance fees.. .. .. .. .. ..
Motorcycle paramedic unit .. 0.5 0.6 1.1 .. 2.2Mental HealthCentral coordination of mental health
inpatient beds.. 0.3 0.3 0.3 0.3 1.0
Enhance and redevelop community-based mental health infrastructure
.. 0.5 1.5 1.5 .. 3.5
Expanding psychiatric disability, rehabilitation and support services
.. 3.0 3.0 3.0 2.8 11.8
Headspace Communities of Youth Services
.. 1.0 1.0 1.0 1.0 4.0
Helping people with a severe mental illness access the rental market – Innovative housing
.. 1.3 1.0 1.0 .. 3.2
Improved housing access for people with a severe mental illness – Improved housing access
.. 0.2 0.2 0.3 0.2 0.9
Meeting demand for grief and bereavement services
.. 0.3 0.3 0.3 0.3 1.0
Mental Illness Research Fund .. 2.5 2.5 2.5 2.5 10.0Pathways to economic participation for
people with severe mental illness (education and employment)
.. 0.4 0.5 .. .. 0.9
Same sex attracted and gender questioning youth suicide prevention initiative
.. 1.0 1.0 1.0 1.0 4.0
Specialist mental health support to selected Headspace services
.. 0.5 0.5 0.5 0.5 2.0
Ageing, Aged and Home CareBallarat District Nursing and Healthcare .. 1.3 0.5 .. .. 1.8Participation for culturally and
linguistically diverse (CALD) seniors.. 0.4 0.4 0.4 0.4 1.6
Primary, Community and Dental HealthDental employment program .. 0.3 0.5 1.0 1.5 3.3Early intervention oral hygiene and health .. 0.5 0.5 0.5 0.5 2.0
Service Delivery 2011-12 Chapter 1 41

2010-11 2011-12 2012-13 2013-14 2014-15 5 Yr Total Funding Approved
programMobile dental units .. 1.0 1.2 1.4 1.2 4.8Rural dental practitioners relocation
support.. 0.3 0.3 0.3 0.3 1.1
Public HealthAnti-smoking campaign .. 0.1 0.1 0.1 0.1 0.4Bowel cancer screening .. 0.5 0.5 0.5 0.5 2.0Gay, lesbian, bisexual, transgender and
intersex (GLBTI) HIV research grant.. 0.2 .. .. .. 0.2
Drug ServicesPreventing alcohol and drug abuse –
investing in treatment services.. 5.0 5.0 5.0 5.0 20.0
Other commitmentsMinor community commitments –
Community Support Fund 0.1 .. .. .. .. 0.1
Minor community commitments – other .. 0.1 .. .. .. 0.1Total output election commitments 6.2 74.0 119.4 125.9 125.9 451.4Source: Department of Treasury and Finance
Acute health services
800 new hospital bedsFunding is provided to commence delivery of 800 new hospital beds in the Government’s first term. In combination with the Department of Health initiative Hospital Operations Growth Funding reported in Chapter 2, this investment will support additional acute, sub-acute and mental health bed capacity. Funding for this initiative matches the Government’s election commitment of $448.2 million over four years, and is reported in the output initiative table for the Department of Health in Chapter 2 of Budget Paper No. 3.This initiative contributes to the Department of Health’s: Admitted Services output; Clinical Care output; Emergency Services output; Non-Admitted Services output; and Small Rural Services – Acute Health output.
42 Chapter 1 Service Delivery 2011-12

Ballan Hospital redevelopmentFunding is provided as a grant to redevelop the Ballan Hospital which will deliver an integrated model of health care by providing a range of new health services which will complement and support the delivery of primary health care services at the Ballan GP Specialist Clinic. These services will include transition care, emergency stabilisation and care, medical imaging services, palliative care and sub-acute care. This initiative is funded from the Country Hospital Fund. This initiative contributes to the Department of Health’s: Admitted Services output; and Non-Admitted Services output.Boost to Ballarat Health ServiceFunding is provided for additional health services in Ballarat, including providing an additional 20 doctors and 80 nurses at Ballarat Base Hospital, and the recruitment of 10 General Practitioners to fill vacancies in the Ballarat area. The Government’s election commitments include a capital component for this initiative, which will be funded in a future budget.This initiative contributes towards the Department of Health’s: Admitted Services output; and Non-Admitted Services output.Budget reporting measures implementationFunding is provided for the Department of Health to undertake work to review budget reporting measures, which will facilitate performance reporting measures included on the Hospital Performance website. This work will improve the measures for reporting in the Health portfolio to better reflect the health and wellbeing of the Victorian community.This initiative contributes to the Department of Health’s: Admitted Services output; and Non-Admitted Services output.Open access board meetingsFunding of $10 000 per year is provided for four years to support the public hospital system to enable hospitals to hold at least one open access board meeting a year with members of the public. This initiative contributes to the Department of Health’s Admitted Services output.
Service Delivery 2011-12 Chapter 1 43

Patient focused work practicesFunding is provided to assist hospitals in improving the patient focus of their work practices in emergency departments. Patients will be triaged into two distinct streams, those requiring hospital admission and those to be treated and discharged. This initiative contributes to the Department of Health’s Admitted Services output.Primary Ciliary Dyskinesia Funding is provided to establish a diagnostic centre for Primary Ciliary Dyskinesia, a rare genetic condition that can lead to chronic recurrent respiratory infections.This initiative contributes to the Department of Health’s Non-Admitted Services output.Rural and regional health overhaulThe Government will undertake the following initiatives to support and encourage regional and rural health services and the communities that they serve. Increasing numbers of registered midwives
Funding will assist rural health services to provide clinical placement, support and supervision for undergraduate and postgraduate midwifery students. This will enhance the recruitment and retention of midwives and increase the capacity of rural maternity services, both in the immediate and longer term.This initiative contributes to the Department of Health’s Acute Training and Development output.
Supporting continuing medical educationFunding is provided for grants to offset the costs of medical education for doctors working in rural and regional Victoria and encouraging trainee doctors to complete rural placements. Specific grants will be provided to rural doctors to update their knowledge and skills at metropolitan locations. Trainee doctors who complete a minimum of 13 weeks in a rural placement, will be paid an additional allowance.This initiative contributes to the Department of Health’s Acute Training and Development output.
Improving the collection of rural obstetrics dataFunding is provided to improve the collection of rural obstetrics data to enable better communication between services to assist with referrals, increase the capacity to monitor the outcomes of rural maternity services and inform future maternity care models.
44 Chapter 1 Service Delivery 2011-12

This initiative contributes to the Department of Health’s Admitted Services output.
Specialist rural general pracitionersFunding is provided to establish a General Practitioner (GP) – Rural Generalists Program in the areas of obstetrics, anaesthetics, emergency medicine and surgery. Rural clinical schools will be supported to participate in the program. This program will introduce a training pathway that will support the retention of doctors in rural and regional Victoria that aligns advanced GP procedural training with workforce demands. It will make the career choice as a rural GP more attractive to Australian graduates as it will provide the specific training necessary to provide more complex care for patients in rural Victoria.This initiative contributes to the Department of Health’s Acute Training and Development output.
Service Delivery 2011-12 Chapter 1 45

Rural Relocation FundFunding is provided to create a Rural Relocation Fund, which will assist doctors to relocate from metropolitan locations to regional communities. This initiative will support hospitals that are finding it harder to attract medical staff to work in rural areas and also assist doctors’ families who incur high costs in relocating to rural areas.This initiative contributes to the Department of Health’s Acute Training and Development output.
Rural scholarships programFunding is provided to create a rural scholarships program that will provide grants of $20 000 each for rural medical students. The scholarships (covering living expenses, a tertiary grant, travel and conference assistance) will provide an incentive for students to study medicine in rural and regional Victoria. The scholarships will include a return of service bond that can be discharged during the General Practitioner – Rural Generalist program. This program will help address the shortage of doctors in rural and regional Victoria. This initiative contributes to the Department of Health’s Acute Training and Development output.
Bush nursing support Funding is provided to establish a grants program for Bush Nursing Services, in their centenary year, to implement capital and infrastructure upgrades of facilities and equipment. This initiative will enable Bush Nursing Services across Victoria to respond to current and future demand pressures. It will assist in providing their communities with a strong and sustainable local health service where appropriate care is delivered in the most appropriate setting. This initiative is funded from the Health Infrastructure Fund.This initiative contributes to the Department of Health’s Small Rural Services – Acute Health output.
Strengthening palliative careFunding is provided to improve palliative care services through a range of measures that include establishing a flexible funding pool to assist carers with costs, empowering carers through greater access to up-to-date information on supporting people with palliative care needs, expanding access to after hours palliative care services, providing more funds to community based palliative care services and improving access to grief support and risk assessment. The initiative will also implement a range of workforce initiatives to develop the capacity of the health workforce to meet the growing need for palliative care services.This initiative contributes to the Department of Health’s Non-Admitted Services output.
46 Chapter 1 Service Delivery 2011-12

Support and self help groupsFunding is provided for grants to assist and support self health groups with operational and administration costs. This initiative contributes to the Department of Health’s Admitted Services output.Waiting list and emergency department reformThe Government will undertake the following initiatives to improve access to elective surgery and the way in which health services manage elective surgery waiting lists. Abolish ‘not ready for care’
Funding is provided to assist health services introduce new reporting arrangements for patients who are not ready for care to improve the transparency of elective surgery performance reporting to the community. This initiative will bring to an end the practice of classifying patients as ‘not ready for care’ and replace it with the concept ‘not ready for surgery’. This will give people a greater understanding of their status on elective surgery waiting lists. Required changes to current practice will be developed in consultation with hospitals and clinicians. This initiative contributes to the Department of Health’s Admitted Services output.
Increasing the number and skills of the health workforceOngoing funding is provided to employ more doctors, nurses, diagnostic and allied health professionals on a clinical needs basis. This initiative will also support the provision of the Government’s commitment to 800 new beds over its first term.This initiative contributes towards the Department of Health’s: Admitted Services output; and Non-Admitted Services output.
First on, first off ruleThe Government will work with hospitals and public health institutions to ensure that patients are treated in the same sequential order that they are added to the elective surgery waiting list within their urgency category, except in specific circumstances. This initiative contributes towards the Department of Health’s Admitted Services output.
Outpatient Improvement FundFunding is provided to establish an Outpatient Improvement Fund, to fund additional staffing and equipment in hospital specialist (outpatient) clinics to enable them to treat more patients.
Service Delivery 2011-12 Chapter 1 47

This initiative contributes to the Department of Health’s Non-Admitted Services output.
Outpatient nurse coordinatorsFunding is provided for outpatient nurse coordinators, to provide information and guide patients through their treatment in specialist (outpatient) clinics.This initiative contributes to the Department of Health’s Non-Admitted Services output.
Patient treatment coordinatorsOngoing funding is provided to employ patient treatment coordinators to case manage and coordinate patients’ journeys through health care and treatment.This initiative contributes towards the Department of Health’s Non-Admitted Services output.
Diabetes specialist nursesFunding is provided to support the additional specialist clinic activity relating to diabetes nurse-led education services in public hospitals. This will fund the equivalent of 15 500 appointments with a diabetes nurse educator (3 875 patients per year).This initiative contributes towards the Department of Health’s Admitted Services output.
Hospital Improvement CommissionFunding is provided to the Department of Health to establish the Commission for Hospital Improvement to facilitate hospital improvement in emergency departments, elective surgery management and waiting list reduction. This initiative contributes to the Department of Health’s Non-Admitted Services output.
Health Innovation and Reform Council Funding is provided to establish a Health Innovation and Reform Council to advise on reform measures to drive innovation and reform of health practices and to improve quality and safety in Victorian public hospitals. This will include identifying arrangements to improve patient flow through the health system. The Council will be supported by, and work in conjunction with, a Hospital Improvement Commission. This initiative contributes to the Department of Health’s: Admitted Services output; and Non-Admitted Services output.
48 Chapter 1 Service Delivery 2011-12

Health interpretersFunding is provided to improve the quality of language service provision in the public health system for people whose preferred language is not English. The initiative will provide support for interpreters in rural and regional Victoria to undertake health interpreting and mental health interpreting programs.This initiative contributes to the Department of Health’s Admitted Services output.
Hospital performance website Funding is provided to develop a health performance website that will make the performance of public hospital emergency departments, ambulance services and outpatient services publicly accessible. It will increase transparency and empower patients in making decisions about the health services that they use.This initiative contributes to the Department of Health’s Non-Admitted Services output.
Ambulance services
340 new ambulance officers Funding is provided to recruit an additional 340 new ambulance staff. This will include 310 new ambulance paramedics plus 30 new patient transport officers. The additional paramedic investment will enable initiatives which include: upgrading of the Belgrave, Emerald, Yarra Junction, Maryborough
and Castlemaine branches to 24-hour rostered coverage with professional paramedics;
new 24 hour professionally staffed ambulance stations at Beaufort, Grantville and Wallan; and
establishment of Mobile Intensive Care Single Responder Units in ten major rural towns.
The asset component of these initiatives is included in asset initiative Upgrade and Build Ambulance Stations.
Service Delivery 2011-12 Chapter 1 49

This initiative contributes to the Department of Health’s: Ambulance Emergency Service output; and Ambulance Non-Emergency Services output. Ambulance services – 50 per cent cut to ambulance feesFunding is provided to halve the cost of ambulance membership subscription fees to provide more affordable access to ambulance services for Victorians. Further information on this initiative is reported in the Revenue Initiative table of this chapter.This initiative contributes to the Department of Health’s: Ambulance Emergency Service output; and Ambulance Non-Emergency Services output. Motorcycle paramedic unitFunding is provided for a new motorcycle paramedic unit that will be able to respond rapidly to emergencies in and around inner Melbourne. Motorcycle paramedics will carry emergency drugs and similar equipment as emergency ambulances, including defibrillators for cardiac arrests. These units will be established on a trial basis and their effectiveness will be reviewed at the end of three years.This initiative contributes to the Department of Health’s Ambulance Emergency Service output.
Mental HealthThe Government is taking a comprehensive approach to mental health. This budget includes a range of initiatives, from research to prevention to support and treatment.Central coordination of mental health inpatient bedsFunding is provided to establish a dedicated new function to monitor mental health bed availability in all public and participating private hospitals. Building on existing inpatient and mental health data systems, it will provide health practitioners with accurate and reliable ‘real time’ information on available beds in the specialist mental health service system in order to give patients more rapid and responsive access.This initiative contributes to the Department of Health’s Clinical Care output.Enhance and redevelop community-based mental health infrastructureFunding is provided through a grants process for the first stage of the Government’s commitment to support the expansion and sustainability of community-based mental health services, including psychiatric disability and rehabilitation support services, by undertaking building modifications, refurbishment and redevelopment of facilities. The
50 Chapter 1 Service Delivery 2011-12

initiative will build the capacity of the psychiatric disability and rehabilitation support services system to deliver intensive support to clients with severe and enduring mental illness and high level psychiatric disability. Stage 2 of this project will be funded in a future budget. This initiative is funded from the Health Infrastructure Fund.
Service Delivery 2011-12 Chapter 1 51

This initiative contributes to the Department of Health’s: Clinical Care output; and Psychiatric Disability Rehabilitation and Support Services output.Expanding psychiatric disability, rehabilitation and support servicesFunding is provided to introduce new evidence-based psychosocial rehabilitation service models and system reforms that will improve the efficiency and effectiveness of the Psychiatric Disability Rehabilitation and Support Services sector. This initiative will also improve partnerships with clinical and community services, promoting optimal recovery outcomes for people with severe mental illness and psychiatric disability. The initiative will improve access to care for up to 120 additional people with a severe and enduring mental illness.This initiative contributes to the Department of Health’s Psychiatric Disability and Support Services output.Headspace Communities of Youth ServicesFunding is provided as a grants program, for capital upgrades and modifications to enhance Victorian Headspace outlets to improve services for young people with mental health and substance misuse problems. Headspace provides centre based multidisciplinary services to young people with mental health issues including primary health care services; services to address alcohol and other drug use; and social and vocational support services. This initiative is funded from the Health Infrastructure Fund.This initiative contributes to the Department of Health’s Clinical Care output.Helping people with a severe mental illness access the rental market – Innovative housingFunding is provided for a three year program that will subsidise access to private rental properties for 50 people with a severe mental illness and psychiatric disability. The tenants will be supported to maintain their tenancies, improve their daily living skills and strengthen social participation through the provision of Psychiatric Disability Rehabilitation and Support Services Home Based Outreach Support.This initiative contributes to the Department of Health’s Psychiatric Disability and Support Services output.Improved housing access for people with a severe mental illness – Improving housing accessFunding is provided to support adults aged 16-25 years to access affordable and appropriate long-term housing and improve inter sectoral links between specialist mental health services and local housing services. This four year funding commitment will be delivered
52 Chapter 1 Service Delivery 2011-12

through a dedicated housing officer located in each of two adult area mental health services.This initiative contributes to the Department of Health’s Clinical Care output.Meeting demand for grief and bereavement servicesFunding is provided to expand key grief and bereavement telephone support services to meet growing demand. This will enhance the capacity for people experiencing grief from bereavement to receive support, information and referral via telephone help lines.This initiative contributes to the Department of Health’s Clinical Care output.Mental Illness Research FundFunding is provided to establish the Mental Illness Research Fund. This grants based program will enhance and strengthen mental health research in Victoria. It will fund research to inform evidence based treatment across the mental illness spectrum. The implementation of this initiative will be supported by the development of a strategic mental health research agenda with a focus on applied research.This initiative contributes to the Department of Health’s Clinical Care output.Pathways to economic participation for people with severe mental illness (education and employment)Funding is provided for two years to establish an integrated Pathways to Participation Program to make it easier to complete an education and lift the rate of employment for Victorians with a mental illness. An education officer and an employment officer will be located in each of two area mental health services.This initiative contributes to the Department of Health’s Clinical Care output.Same sex attracted and gender questioning youth suicide prevention initiativeFunding is provided for four years to deliver preventative support and early intervention services. Support is targeted at same sex attracted and gender questioning people aged 10 to 25 years who are at risk of, or experiencing, poor social and emotional wellbeing and significant psychological distress including suicidal thoughts, self harm and high risk behaviours.This initiative contributes to the Department of Health’s Clinical Care output.Specialist mental health support to selected Headspace servicesFunding is provided to expand and enhance the Headspace service network across Victoria. This will improve access to primary and
Service Delivery 2011-12 Chapter 1 53

secondary mental health and drug and alcohol treatment services for young people with mental health and associated substance misuse problems.This initiative contributes to the Department of Health’s Clinical Care output.
Ageing, Aged and Home Care
Ballarat District Nursing and HealthcareFunding is provided as a grant to refurbish and expand the physical facilities of Ballarat District Nursing and Healthcare, including providing increased clinical space and education and training facilities. This will enable services to increase in line with projected demand and help to ensure that Ballarat District Nursing and Healthcare can provide a sustainable community based service to its local community. This initiative is funded from the Health Infrastructure Fund.This initiative contributes to the Department of Health’s HACC Primary Health, Community Care and Support output.
54 Chapter 1 Service Delivery 2011-12

Participation for culturally and linguistically diverse (CALD) seniorsFunding is provided to facilitate increased participation and inclusion of older people from CALD backgrounds. Participation mechanisms include a social inclusion marketing strategy and grants to enable capacity to respond to CALD interests. Facilitating inclusion initiatives comprises of working with the Council on the Ageing and supporting the Department of Health to better respond to CALD needs.This initiative contributes to the Department of Health’s Seniors Programs and Participation output.
Primary, Community and Dental Health
Dental employment program Funding is provided for four years to attract dental clinicians (dental therapists, oral health therapists, dental prothestists and dentists) to the public sector by expanding the Oral Health Therapists graduate program to all graduating dental clinicians and providing training and support for supervising clinicians. The program will focus on placing graduates in areas with the highest workforce shortages, usually rural and regional areas.This initiative contributes to the Department of Health’s Dental Services output.Early intervention oral hygiene and health program Funding is provided for four years to enhance early intervention and promote oral hygiene and health in children aged 0-3 years through the Healthy Families, Healthy Smiles program. The program will target at risk families and build the capacity of health workers working directly with young families to promote good oral health.This initiative contributes to the Department of Health’s Dental Services output.Mobile dental unitsFunding is provided for four years to deliver better access to dental services in rural and regional areas. The initiative comprises of a new investment in three mobile dental clinics, one delivered each year in 2011-12, 2012-13, and 2013-14, with additional investment in service delivery and incentive payments for clinicians to work in the mobile dental clinics over the four years. This initiative contributes to the Department of Health’s Dental Services output.Rural dental practitioners relocation supportFunding is provided for four years to help dental clinicians (dental therapists, oral health therapists, dental prothestists and dentists) relocate from metropolitan locations to rural and regional
Service Delivery 2011-12 Chapter 1 55

communities. This initiative will support clinicians and their families who incur high costs in relocating and establishing a practice in rural and regional areas.This initiative contributes to the Department of Health’s Dental Services output.
56 Chapter 1 Service Delivery 2011-12

Public Health
Anti-smoking campaign Funding is provided for a targeted social media campaign exposing the dangers of tobacco smoking to the health of Victorians living in communities where tobacco smoking is prevalent. This initiative contributes to the Department of Health’s Health Advancement output.Bowel cancer screening Funding is provided to enable the Government to support the improvement or maintenance of bowel cancer screening across Victoria. Funding is to be targeted to enhance the Commonwealth Government bowel cancer screening.This initiative contributes to the Department of Health’s Health Advancement output.Gay, lesbian, bisexual, transgender and intersex (GLBTI) research grant Funding is provided to explore the effects and experience of accelerated ageing in people with HIV, as well as broader social issues related to ageing with HIV.This initiative contributes to the Department of Health’s Health Protection Services output.
Drug Services
Preventing alcohol and drug abuse – investing in treatment servicesFunding is provided to deliver additional therapeutic counselling, consultancy and continuing care services in growth areas, expand pharmacotherapy prescribing and dispensing services to meet current demand, and address shortfalls in access and support of pharmacotherapy services. This initiative contributes to the Department of Health’s: Drug Treatment and Rehabilitation output; and Drug Treatment and Control output.
Other commitments
Minor community commitments – Community Support Fund Funding is provided to support community organisations provide meal services to those in need.Minor community commitments – otherFunding is provided to support community service organisations to deliver community health services.
Service Delivery 2011-12 Chapter 1 57

Asset initiatives($ million)
2010-11 2011-12 2012-13 2013-14 2014-15 TEI
Funding Approved
Health Infrastructure Fund (A dedicated health and hospital infrastructure fund, drawn from electronic gaming machine licensing revenue over ten years)Major Projects
Bendigo Hospital (expanded) .. .. .. .. 20.5 102.0
Box Hill Hospital (expanded) .. .. .. 5.5 14.0 40.0
Monash Children’s Hospital – land acquisition and planning
.. 5.0 3.5 .. .. 8.5
General .. ..
Casey Hospital expansion – planning and development
.. 0.3 0.8 1.0
Maryborough District Health Service – medical imaging
.. 0.6 .. .. .. 0.6
Rural capital support fund .. 5.0 15.3 17.5 18.2 56.0
Mental Health
Eating disorder day program .. 0.4 .. .. .. 0.4
Mental health inpatient beds .. 0.9 0.9 .. .. 1.8
Safety of women in care .. 1.0 1.0 1.0 1.0 4.0
Ambulance services
Mobile Intensive Care Ambulance (MICA) single responder units
.. 0.5 0.5 .. .. 1.0
Motorcycle paramedic unit .. 0.5 0.5 .. .. 1.0
Upgrade and build ambulance stations .. 2.0 5.0 5.0 4.0 16.0
Country Hospital Fund
Echuca Hospital redevelopment .. 3.0 14.0 20.0 3.0 40.0
Kerang District Health residential aged care redevelopment
.. 0.5 9.0 8.4 .. 17.9
Mildura Base Hospital expansion .. 0.3 2.7 2.0 .. 5.0
Warragul Hospital emergency department upgrade
.. 0.5 1.5 .. .. 2.0
Specific commitments
Geelong Hospital Upgrade – enabling and decanting works
.. 1.9 6.4 .. .. 8.3
Geelong residential aged care – retention of surplus public land
.. 1.0 1.0 .. .. 2.0
Other commitments
Minor community commitments – other .. 0.1 .. .. .. 0.1
Total asset election commitments .. 23.5 62.1 59.4 60.7 307.6
Source: Department of Treasury and Finance
58 Chapter 1 Service Delivery 2011-12

A number of the following election commitments will contribute to the delivery of 800 new hospital beds in the Government’s first term.
Service Delivery 2011-12 Chapter 1 59
Health Infrastructure Fund
Major Projects
Bendigo Hospital (expanded)An additional $102 million has been provided to expand the scope of the Bendigo Hospital project. This additional funding will deliver a new Integrated Regional Cancer Centre on the main campus, a new five bed mother-baby unit, a new mental health inpatient facility and expanded educational facilities, including enhanced ICT. This funding adds to the $528 million previously committed to the project. This initiative contributes to the Department of Health’s Admitted Services output.Box Hill Hospital (expanded)An additional $40 million has been provided to expand the redevelopment of the Box Hill Hospital, providing an additional 100 beds, which will be a mix of medical and surgical same day and multi day beds. This will increase the capacity of the hospital’s emergency department and help to address waiting times for access to elective surgery. This funding adds to the $407.5 million previously committed to the project. This initiative contributes to the Department of Health’s Admitted Services output. Monash Children’s Hospital – land acquisition and planningFunding of $8.5 million is provided for the acquisition of land adjoining the existing hospital and development of detailed designs for the new hospital at the Monash Medical Centre Clayton. This is the initial investment in the development of the Monash Children’s Hospital which will provide improved access to children’s health services in the south-east of Melbourne and the Mornington Peninsula. Further funding to complete the project will be provided in a future budget.This initiative contributes to the Department of Health’s Admitted Services output.
General
Casey Hospital expansion – planning and developmentFunding is provided to conduct planning and development work in support of an expansion of Casey Hospital. This initiative contributes to the Department of Health’s Admitted Services output.
60 Chapter 1 Service Delivery 2011-12

Maryborough District Health Service – medical imagingFunding is provided to purchase computed tomography medical imaging services for Maryborough District Health Service. This initiative will provide first class radiography services to the Maryborough area, allowing patients to be treated locally. This initiative contributes to the Department of Health’s Admitted Services outputs.
Service Delivery 2011-12 Chapter 1 61

Rural capital support fundFunding is provided to strengthen and sustain existing rural and regional health services in Victoria through the upgrade of their facilities. This initiative will assist rural and regional health services throughout Victoria decide on local priorities and respond to current and future demand pressures. This initiative contributes to the Department of Health’s: Small Rural Health Services output; and Acute Health Services output.
Mental Health
Eating disorder day programFunding is provided to enable an intensive eating disorder day program at the Royal Children’s Hospital in order to better support young Victorians with an eating disorder and their families. This initiative is funded from the Health Infrastructure Fund. This initiative contributes to the Department of Health’s Admitted Services output.Mental health inpatient beds Funding is provided for the first stage of the Government’s commitment to increasing mental health inpatient beds, with the creation of a Psychiatric Assessment and Planning Unit (four beds per unit). The unit will provide accelerated access to specialist psychiatric assessment and short-term treatment, without requiring admission to general adult acute inpatient units. A total of $9 million has been committed to this project of which $1.8 million is for stage 1. Additional funding will be provided in future budgets.This initiative contributes to the Department of Health’s: Clinical Care output; and Psychiatric Disability Rehabilitation and Support Services output.Safety of women in careFunding is provided to establish gender specific spaces and other improvements in existing psychiatric facilities to enhance safety and practice. Changes will include defined male and female only areas within wards, sensor alarms operating at night and door locking mechanisms to maintain privacy and dignity. This initiative contributes to the Department of Health’s Clinical Care output.
62 Chapter 1 Service Delivery 2011-12
Ambulance services
Mobile Intensive Care Ambulance (MICA) single responder units Funding is provided for 10 MICA units across the major regional centres of Warrnambool, Horsham, Mildura, Shepparton, Wangaratta, Wodonga, Sale, Bairnsdale, Wonthaggi and Swan Hill. MICA units are equipped with specialist equipment and are resourced with life saving specialist paramedics. The additional MICA units will significantly boost ambulance care in regional Victoria. This initiative contributes to the Department of Health’s Ambulance Emergency Services output.Motorcycle paramedic unitRefer to the output initiative for a description of this initiative. This initiative contributes to the Department of Health’s Ambulance Emergency Services output.Upgrade and build ambulance stations Funding is provided to deliver new rural ambulance branches and upgrades to existing rural branches at a number of locations including: Beaufort, Wallan, Grantville, Belgrave, Yarra Junction, Maryborough, Wondonga and Castlemaine. This initiative contributes to the Department of Health’s: Ambulance Emergency Service output; and Ambulance Non-Emergency Services output.
Country Hospital Fund
Echuca Hospital redevelopmentFunding is provided for the redevelopment and expansion of Echuca Hospital, delivering new purpose built acute facilities including an expanded emergency department, new inpatient accommodation, and new front entry to the hospital. This will increase capacity by an additional 22 multi-day beds, six short stay observational beds and 10 treatment spaces in the emergency department. This initiative contributes to the Department of Health’s Admitted Services output. Kerang District Health residential aged care redevelopmentFunding is provided to redevelop Kerang’s residential aged care facility to create an integrated and sophisticated rural health facility. Construction will include a purpose built high care residential aged care facility, a new allied health building, new facilities to accommodate the kitchen services building and the construction of a purpose built ambulance station.
Service Delivery 2011-12 Chapter 1 63

This initiative contributes to the Department of Health’s Residential Aged Care and Small Rural Health Service output.Mildura Base Hospital expansionFunding is provided to increase the capacity of the Mildura Base Hospital, by upgrading the mental health and maternity units, and constructing an additional four emergency department cubicles and additional treatment areas to help the hospital meet demand for emergency services. This initiative contributes to the Department of Health’s Admitted Services output.Warragul Hospital emergency department upgradeFunding is provided to upgrade and expand the emergency department at Warragul Hospital by providing five new additional emergency department cubicles, new staff areas, a relocated entrance and a new emergency bay. This initiative contributes to the Department of Health’s Admitted Services output.
Specific Commitments
Geelong Hospital upgrade – enabling and decanting worksFunding of $8.3 million is provided for planning and development as well as infrastructure works to support the commitment to upgrade the Geelong Hospital. Funding to complete the upgrade will be provided in a future budget. This initiative forms part of the Government’s broader election commitment of $165 million to hospital infrastructure works in the Geelong area.This initiative contributes to the Department of Health’s Admitted Services output.Geelong residential aged care – retention of surplus public landFunding is provided to retain surplus public land, allowing it to be used for community aged care facilities. This initiative will allow for the future provision of residential aged care to help meet emerging local needs. This initiative contributes to the Department of Health’s Residential Aged Care output.
Other commitments
Minor community commitments – otherFunding is provided to conduct planning for upgrades to health service providers in both metropolitan and rural Victoria.
64 Chapter 1 Service Delivery 2011-12

Election Commitments to be funded in future yearsThe Government is committed to the delivery of all its election commitments. Funding for the following asset projects will be made available in future budgets to ensure that the Government’s commitments are met:Health Infrastructure Fund
Major Projects Royal Victorian Eye and Ear Hospital redevelopment
General Ballarat Helipad
Mental Health Secure Step-down Care Mother and Baby Units
Country Hospital Fund Castlemaine Health upgrade Radiotherapy Facilities for south-west Victoria Kilmore and District Hospital redevelopment Seymour District Memorial Hospital chemotherapy chairs
Service Delivery 2011-12 Chapter 1 65

Other Commitments Bairnsdale Mental Health Well-Being Centre Boost to Ballarat Health Service – capital component Waurn Ponds Community Hospital
66 Chapter 1 Service Delivery 2011-12

HUMAN SERVICES
Output initiatives($ million)
2010-11 2011-12 2012-13 2013-14 2014-15 5 Yr TotalFunding Approved
Disability servicesImproving access of people with a disability,
their families and carers to services.. 9.4 11.1 11.8 13.0 45.1
Child protection and family services ..Better outcomes for vulnerable mothers
and their families.. 3.2 4.0 5.1 5.5 17.8
Better outcomes for out-of-home care .. 9.1 6.9 7.5 7.8 31.3Better, more transparent services .. 51.4 51.4 50.4 50.4 203.6Youth services and youth justice ..Diversion and rehabilitation for young
offenders through intensive bail supervision
.. 0.3 0.3 0.3 0.3 1.1
Concessions to pensioners and beneficiaries ..Annual electricity concessions 30.2 71.8 81.6 92.6 105.4 381.6Housing assistance ..Work and learning centres .. 0.5 1.3 1.4 0.9 4.1Empowering individuals and communities ..Promoting youth – opportunities for
social and economic engagement.. 2.9 2.2 1.9 1.2 8.2
Other commitments ..Minor community commitments –
Community Support Fund 0.3 .. .. .. .. 0.3
Minor community commitments – other .. 0.3 .. .. .. 0.3Total output election commitments 30.5 148.8 158.7 171.0 184.4 693.4 Source: Department of Treasury and Finance
Disability services
Improving access of people with a disability, their families and carers to services The Government will undertake the following initiatives to improve access for people with a disability, their families and carers to services. Aids and equipment – families enhancement package
Funding is provided for financial support to access aids and equipment for children through the establishment of a new top-up fund that will ease the financial burden on families. The top-up fund will assist families and children with a disability to obtain additional financial support to meet the gap between the subsidy available through the Aids and Equipment Program and the purchase cost of the aid or equipment. This initiative contributes to the Department of Human Services’ Targeted Services output.
Service Delivery 2011-12 Chapter 1 67

Innovative respite care Funding is provided to improve access to timely respite and carer support to help sustain family care arrangements and give primary caregivers a temporary break from their caring duties. Funding will be provided to community service organisations to offer up to an extra 500 000 hours of additional respite services that are more flexible and tailored to individual needs.This initiative contributes to the Department of Human Services’ Individual Support output.
Investment in new supported accommodation places for people with a disability and/or mental illnessFunding is provided for community service organisations to build and operate 50 new supported accommodation places for people with a disability and/or mental illness. Innovative approaches will be used to create additional choices in supported accommodation for people with complex needs. A specialist group home offering intensive, long term therapeutic support for people with dual diagnosis who have high support needs will be developed as part of this initiative.This initiative contributes to the Department of Human Services’ Residential Accommodation Support output.
School holiday respite fundFunding is provided to increase access to school holiday programs for the families and carers of children and young people with a disability. It will provide families seeking school holiday respite with access to an additional 1 700 days of school holiday respite a year. This initiative contributes to the Department of Human Services’ Individual Support output.
Child protection and family services
Better outcomes for vulnerable mothers and their familiesThe Government will undertake the following initiatives to provide better outcomes for vulnerable mothers and their families. Child care for at-risk kids
Funding is provided for three years to pilot an intensive, specialist early years care and education pilot program for children aged less than three years experiencing significant early childhood disadvantage and who are at risk of abuse and neglect. This program will provide a minimum of 15 additional places each year.This initiative contributes to the Department of Human Services’ Family and Community Services output.
68 Chapter 1 Service Delivery 2011-12

Intensive ante and post-natal supportFunding is provided to deliver vulnerable expectant and existing mothers and families with intensive support and case management from before birth until the child is four years of age. This initiative is aimed at building parenting capability, reducing the risk of child abuse and neglect, and improving opportunities for vulnerable children.This initiative contributes to the Department of Human Services’ Family and Community Services output.
Better outcomes for out-of-home careThe Government will undertake the following initiatives to provide better outcomes for out-of-home care. Foster Care Association of Victoria
This initiative will provide additional funding to deliver the Carer Information Support Service. This initiative will also extend the capacity of the Foster Care Association of Victoria to provide support to foster carers in rural Victoria. Effective, full-time funding of the telephone helpline service will also allow increased support of foster carers, helping to provide a sustainable service across Victoria.This initiative contributes to the Department of Human Services’ Specialist Support and Placement Services output.
Health and education assessments of children entering out-of-home careFunding is provided to establish an effective model of health and educational assessments, and treatment and support for children entering residential care. This will enable early identification of children’s physical development and mental health needs, and provide support to enable sustainable school engagement and educational achievement. This initiative contributes to the Department of Human Services’ Specialist Support and Placement Services output.
Investing in a better future for young people in residential care and care leaversFunding is provided over four years to support young care leavers up to 21 years of age to improve their educational and employment outcomes. This initiative includes the new Leaving Care Employment and Education Access Program, additional brokerage and mentoring, a new statewide support system specifically for young Indigenous people leaving care; and expanded post care support and information services, particularly in rural regions. This initiative contributes to the Department of Human Services’ Specialist Support and Placement Services output.
Service Delivery 2011-12 Chapter 1 69

Longitudinal study on the impact of out-of-home care Funding is provided for a longitudinal research study that tracks a cohort of young people in out-of-home care over a period of four years to assess the impact out-of-home care and the adequacy of support young people receive post care.This initiative contributes to the Department of Human Services’ Specialist Support and Placement Services output.
Better, more transparent servicesThe Government will undertake the following initiatives to provide better, more transparent services. Independent Children’s Commissioner
Funding is provided to appoint an Independent Children’s Commissioner who reports to Parliament with the power to initiate reviews regarding the safety of children.This initiative contributes to the Department of Human Services’ Statutory Child Protection Services output.
Reform case managementFunding is provided to conduct and evaluate a pilot of a new case management approach across services provided by the Departments of Health and Human Services. The program will allocate a key case manager to individuals or families who will be the central point of contact responsible for working with them and advocating on their behalf to improve access to the services they need.This initiative contributes to Department of Human Services’ Information and Planning and Specialist Support Services output.
Social and community services pay equity caseThis initiative provides funding towards the forthcoming decision of Fair Work Australia for the social and community services sector. This initiative contributes to a range of outputs across Government.
Youth services and youth justice
Diversion and rehabilitation for young offenders through intensive bail supervisionFunding is provided for intensive bail supervision to provide the Children’s Court with an alternative option to remand young people in custody. This program will enable young people at risk of being remanded in custody to be released on bail and case managed in the community. This initiative contributes to the Department of Human Services’ Community Based Services output.
70 Chapter 1 Service Delivery 2011-12

Concessions to pensioners and beneficiaries
Annual electricity concessionsFunding is provided to deliver an all year round electricity concession, which will entitle all Victorian concession card holders to a 17.5 per cent discount on electricity bills year round. This initiative contributes to the Department of Human Services’ Concessions to Pensioners and Beneficiaries output.
Service Delivery 2011-12 Chapter 1 71
Housing assistance
Work and learning centresFunding is provided to establish five Work and Learning Centres within selected social housing communities in Victoria. The Centres will be co-located on social housing estates giving residents better access to the services they need to gain employment or vital skills training. The Government is implementing this program in partnership with the Brotherhood of St Laurence. The first two centres will be established in 2011-12, with a further three scheduled for completion in 2012-13.This initiative contributes to the Department of Human Services’ Housing Support and Homelessness Assistance output.
Empowering individuals and communities
Promoting youth – opportunities for social and economic engagementThe Government will undertake the following initiatives to promote opportunities for youth. Regional offices of the Centre for Multicultural Youth
Funding is provided for four years only to enhance the work of the Centre for Multicultural Youth in regional and rural Victoria. Specific program initiatives will include the establishment of two regional Centre for Multicultural Youth offices and employment of two bi-cultural workers. This initiative will provide a one stop shop to support disadvantaged young people from culturally and linguistically diverse backgrounds who are living in regional areas, to actively participate in their communities. This initiative contributes to the Department of Human Services’ Youth Affairs output.
Promoting youth pathways – regional and rural community radio Funding is provided to establish a grant program for community radio stations in rural and regional Victoria, to enable them to provide training workshops in radio broadcasting and mentoring for young people. This initiative will give young people opportunities to develop skills and career pathways in radio broadcasting as well as an effective avenue to promote local youth initiatives which showcase the talents of young people and their contribution to the local community. Funding is also provided to support SYN FM which is operated by volunteers aged 12 to 25 years.This initiative contributes to the Department of Human Services’ Youth Affairs output.
72 Chapter 1 Service Delivery 2011-12

Promoting youth pathways – Rock Eisteddfod Funding is provided for government sponsorship for the school based performance Rock Eisteddfod, which gives young people the opportunity to participate in a statewide performance to learn new skills and showcase their talents. This initiative contributes to the Department of Human Services’ Youth Affairs output.
Service Delivery 2011-12 Chapter 1 73

Funding to support Scouts and Girl Guides Funding is provided for four years to support the Victorian Scouts and Girl Guides organisations to improve the capability of their volunteer leaders and to develop and implement strategies to engage young people from culturally and linguistically diverse backgrounds. A one off capital grant will also be provided to make infrastructure improvements to Gilwell Park camp and a four year grants program will be established to improve the physical conditions of Scout and Girl Guide facilities. This initiative contributes to the Department of Human Services’ Youth Affairs output.
Youth Parliament Funding is provided to the YMCA to enable the celebration of the 25th anniversary of the annual Victorian Youth Parliament. In addition, funding will provide for an increase in the annual funding for Youth Parliament to improve the accessibility of the program to rural and regional young people. This initiative contributes to the Department of Human Services’ Youth Affairs output.
Other commitments
Minor community commitments – Community Support Fund Funding is provided to support community and charitable projects in a range of regional and metropolitan locations. The projects include Men’s Sheds, new equipment and transport for charitable organisations and youth centres.Minor community commitments – otherFunding is provided to deliver respite for carers of the disabled.
Asset initiatives($ million)
2010-11 2011-12 2012-13 2013-14 2014-15 TEI Funding Approved
Housing assistanceWork and learning centres .. 0.2 0.3 .. .. 0.5Youth Foyers to provide safe housing and
support for homeless young people.. 0.5 .. .. .. 0.5
Other commitmentsMinor community commitments – other .. .. .. .. .. ..Total asset election commitments .. 0.7 0.3 .. .. 1.0Source: Department of Treasury and Finance
74 Chapter 1 Service Delivery 2011-12

Housing assistance
Work and learning centresRefer to the output initiative for a description of this initiative.Youth Foyers to provide safe housing and support for homeless young peopleThe Government is delivering on its election commitment to implement a Youth Foyer program by providing first-stage funding in 2011-12 for essential planning and design works of three 40-bed Youth Foyers in Melbourne and regional Victoria.The Youth Foyers will provide education, training and general support to young people who are homeless or at risk of homelessness, to help them participate in education, employment and training, with medium-term accommodation in a safe and supportive environment for up to two years, and both on-site and in-community support.Consistent with its election commitment, the Government is working in partnership with the Brotherhood of St Laurence and Hanover Welfare Services to plan, construct and open the three announced Youth Foyers in the Governments first term. This initiative contributes to the Department of Human Services’: Social Housing output; and Housing Support and Homelessness Assistance output.
Other commitments
Minor community commitments – otherFunding is provided for new equipment for the University of the Third Age.
Service Delivery 2011-12 Chapter 1 75

JUSTICE
Output initiatives($ million)
2010-11 2011-12 2012-13 2013-14 2014-15 5 Yr Total Funding Approved
Emergency services and volunteer organisationsBoost funding to Neigbourhood Watch
and restore access to local crime statistics
.. 0.3 0.1 0.1 0.1 0.6
Bushfire Response – emergency services .. 3.1 .. .. .. 3.1Bushfire Response – Retreat and
Resettlement Strategy.. 5.0 .. .. .. 5.0
Community fire drill pilot program .. .. .. .. .. ..Life Saving Victoria administration grant –
Volunteer Support Network.. 0.3 0.3 0.3 0.3 1.0
Life Saving Victoria clubhouses .. 2.0 2.0 2.0 .. 6.0Victoria State Emergency Service funding
boost – valuing volunteers.. 2.7 2.1 2.2 2.2 9.3
Public safety and crime reduction1 700 new frontline police .. 6.5 16.0 18.5 5.9 46.8940 protective services officers .. 9.1 28.3 74.9 100.1 212.3Additional prison beds .. .. 10.3 10.5 10.7 31.5Community Crime Prevention Program –
Community Safety Fund and Public Infrastructure Safety Fund
.. 6.3 6.3 6.3 6.3 25.0
Global positioning system monitoring for offenders and suspects
.. 0.7 1.3 1.4 1.6 5.0
Removing Graffiti – a zero tolerance approach
.. 1.0 1.0 1.0 1.0 4.0
Step Back, Think Program .. 0.2 0.2 0.2 0.2 0.8Upgrade police stations .. 0.6 0.9 0.9 0.9 3.3Gambling regulation and racing industry developmentEstablish the Victorian Responsible
Gambling Foundation.. 37.5 37.5 37.5 37.5 150.0
Racing industry development .. 21.8 18.8 19.2 19.7 79.5Integrity of governmentIndependent Freedom of Information
Commissioner.. 1.0 2.2 2.3 2.3 7.8
Other commitmentsMinor community commitments –
Community Support Fund 0.2 .. .. .. .. 0.2
Minor community commitments – other .. 0.2 .. .. .. 0.2Total output election commitments 0.2 98.2 127.2 177.2 188.5 591.4Source: Department of Treasury and Finance
76 Chapter 1 Service Delivery 2011-12

Emergency services and volunteer organisations
Boost funding to Neighbourhood Watch and restore access to local crime statisticsFunding is provided to Neighbourhood Watch Victoria to secure accommodation for a Victorian headquarters and to appoint a state manager to provide administrative support and to centrally coordinate activities. Funding will also be used to restore Neighbourhood Watch access to local crime statistics.This initiative contributes to the Department of Justice’s Community Safety and Crime Prevention output. Bushfire response – emergency servicesFunding is provided for the first stage of the Government’s commitment to enhance the capacity of emergency services to respond to bushfires through investment in infrastructure in the Country Fire Authority and Victorian State Emergency Service. Funding is provided for one year to upgrade 60 stations and purchase a total of 101 fire fighting vehicles as part of the Government’s commitment to upgrade more than 250 stations and purchase additional fire fighting equipment over the first term of government. This initiative also includes Neighbourhood Safer Places in bushfire threatened communities to be funded by redirected departmental funds.This initiative contributes to the Department of Justice’s Emergency Management Capability output.Bushfire response – Retreat and Resettlement StrategyFunding is provided to implement the first stage of the Government’s election commitment over the first term for the Retreat and Resettlement Strategy involving the non-compulsory acquisition of land in areas of unacceptably high bushfire risk. Future budget allocations from the $50 million election commitment will be based on community interest in the Retreat and Resettlement Strategy.This initiative contributes to the Department of Justice’s Emergency Management Capability output. Community fire drill pilot program Funding is provided for community fire drills to equip participating communities with the knowledge and confidence to escape a bushfire safely and effectively. This initiative comprises funding of $20 000 in 2011-12.This initiative contributes to the Department of Justice’s Emergency Management Capability output.
Service Delivery 2011-12 Chapter 1 77

Life Saving Victoria administration grant – Volunteer Support NetworkFunding is provided to Life Saving Victoria to employ volunteer support officers to assist life saving clubs with administrative tasks such as grant applications, fundraising, community engagement, recruitment and event management. This initiative contributes to the Department of Justice’s Emergency Management Capability output. Life Saving Victoria clubhousesFunding is provided for Life Saving Victoria to upgrade clubhouses that are in significant need of repair and redevelopment. This will provide facilities that support lifesaving services and ensure clubhouses are open and welcoming to the broader community. This initiative contributes to the Department of Justice’s Emergency Management Capability output. Victoria State Emergency Service funding boost – valuing volunteersFunding is provided to Victoria State Emergency Service to implement a new training model. This aims to prepare volunteers for the rigours of emergency response in a safe learning environment, and introduce a web based training management system. Funding will also provide a Volunteer Support Officer Network to reduce the administrative burden for volunteers. This initiative contributes to the Department of Justice’s Emergency Management Capability output.
Public safety and crime reduction
1 700 new frontline policeFunding is provided to boost frontline policing by an additional 1 700 police (1 600 police and 100 transit safety police) by November 2014, a shorter delivery period than the original target of June 2015. This will bring the Government’s total investment to $602 million from 2010-11 to 2014-15. This initiative contributes to the Department of Justice’s Policing Services output. 940 protective services officersFunding is provided to deploy 940 protective services officers to patrol metropolitan railway stations and four major regional railway stations (Ballarat, Bendigo, Traralgon and Geelong). The protective services officers will provide an initial response to crime and anti-social behaviour occurring in and around railway stations. This initiative contributes to the Department of Justice’s Policing Services output.
78 Chapter 1 Service Delivery 2011-12

Additional prison bedsFunding is provided for 108 additional beds in the male prison system to effectively manage the prison population. Funding is also provided for the development of a detailed business case for a new male prison facility to improve the long-term management of the male prison population.Funding for both initiatives reflects Stage 1 of the delivery of the Government’s election commitment for an additional 500 new prison beds within its first term. This initiative contributes to the Department of Justice’s Prisoner Supervision and Support output.
Service Delivery 2011-12 Chapter 1 79

Community Crime Prevention Program – Community Safety Fund and Public Infrastructure Safety FundFunding is provided to establish the Public Infrastructure Safety Fund and the Community Safety Fund to assist implementation of local crime prevention projects. The Public Infrastructure Safety Fund will provide grants of up to $250 000 to local government to assist implementation of major security infrastructure systems. The Community Safety Fund will provide grants of up to $10 000 to community groups, sporting clubs, businesses and local government to implement practical community safety initiatives.This initiative contributes to the Department of Justice’s Community Safety and Crime Prevention output. Global positioning system monitoring for offenders and suspects Funding is provided to enable global positioning system monitoring of various offenders and suspects to improve community safety and protection as well as reduce the risk of re-offending. This initiative contributes to the Department of Justice’s Community Based Offender Supervision output. Removing graffiti – a zero tolerance approach Funding is provided for the development of partnerships with local councils to facilitate the removal of graffiti from state and local government assets. This removal is to be undertaken by supervised offenders on community orders under the Community Correctional Services Graffiti Removal Program. This initiative will complement the existing Graffiti Prevention and Removal Strategy.This initiative contributes to the Department of Justice’s Community Safety and Crime Prevention output. Step Back, Think programFunding is provided for the Step Back, Think program to address alcohol related violence among young people.This initiative contributes to the Department of Justice’s Promoting and Protecting Consumer Interests output.Upgrade police stations
Funding is provided for the first stage of the Government’s election commitment of $40 million for the construction of new police stations or upgrade of existing stations at Ashburton, Mooroopna, North Ballarat/Sebastapol, Forest Hill, Heywood, Paynesville and Mooroolbark. The funding also provides for land acquisition and planning of police stations located at Emerald, Waurn Ponds, Sale and Somerville and the Essendon Operational Safety and Tactics Training facility.
80 Chapter 1 Service Delivery 2011-12

This initiative contributes to the Department of Justice’s Policing Services output.
Service Delivery 2011-12 Chapter 1 81

Gambling regulation and racing industry development
Establish the Victorian Responsible Gambling FoundationFunding is provided from the Community Support Fund to establish the Victorian Responsible Gambling Foundation which will deliver the Government’s responsible gambling program. The aim of the Foundation is to reduce the incidence and severity of problem gambling across Victoria as well as providing direct assistance to problem gamblers.This initiative contributes to the Department of Justice’s Gambling Regulation and Racing Industry Development output. Racing industry developmentFunding is provided to implement a number of initiatives including the improvement of racing and training infrastructure at racetracks, providing support for breeding industries, and for the promotion of thoroughbred, harness and greyhound racing and measures to increase on-course attendance. These initiatives will be funded by unclaimed wagering dividends and from state taxes from on-course wagering taxes. This initiative contributes to the Department of Justice’s Gambling Regulation and Racing Industry Development output.
Integrity of government
Independent Freedom of Information CommissionerFunding is provided to establish an independent Office of the Freedom of Information (FOI) Commissioner. This will enhance the quality of FOI practices in this State by establishing professional standards for FOI decision makers, providing independent first level review of FOI decisions and improving reporting to Parliament on the operations of the Freedom of Information Act 1982.This initiative contributes to the Department of Justice’s Protecting Community Rights output.
Other commitments
Minor community commitments – Community Support Fund Funding will assist the Point Lonsdale Surf Life Saving Club to support the provision of life saving services to the community.Minor community commitments – otherFunding for a range of initiatives including upgrade works to buildings housing local volunteer organisations such as the Country Fire Authority, Victoria State Emergency Service and Inverloch Surf Life Saving Club, the purchase of an ultra light tanker for Yellingbo Country
82 Chapter 1 Service Delivery 2011-12
Fire Authority, and a scoping study for the redevelopment of the Shepparton Court Complex.
Service Delivery 2011-12 Chapter 1 83

Asset initiatives($ million)
2010-11 2011-12 2012-13 2013-14 2014-15 TEI Funding Approved
Emergency services and volunteer organisationsBushfire response – emergency services .. 62.7 .. .. .. 62.7Public safety and crime reductionAdditional prison beds .. 37.0 .. .. .. 37.0Police brawler vans .. 1.2 .. .. .. 1.2Upgrade police stations .. 19.4 4.8 6.0 .. 30.2Integrity of governmentIndependent Freedom of Information
Commissioner.. 0.1 .. .. .. 0.1
Other commitmentsMinor community commitments – other .. 1.0 .. .. .. 1.0Total asset election commitments .. 121.4 4.8 6.0 .. 132.2Source: Department of Treasury and Finance
Emergency services and volunteer organisations
Bushfire response – emergency servicesRefer to the output initiative for a description.
Public safety and crime reduction
Additional prison bedsRefer to the output initiative for a description.Police brawler vansFunding is provided for the purchase of nine brawler vans to better equip Victoria Police to achieve a more visible presence in preventing and targeting anti-social behaviour and crime at night hotspots in various locations including the central business district and regional locations.This initiative contributes to the Department of Justice’s Policing Services output. Upgrade police stationsRefer to the output initiative for a description.
Integrity of government
Independent Freedom of Information CommissionerRefer to the output initiative for a description.
84 Chapter 1 Service Delivery 2011-12

Other commitments
Minor community commitments – otherFunding is provided to deliver minor community commitments.
Election Commitments to be funded in future yearsThe Government is committed to the delivery of all its election commitments in full. Funding for the following asset projects will be made available in future budgets to ensure that this commitment is met in full: Public Safety and Crime Reduction
Additional prison beds; and Upgrade police stations.
Service Delivery 2011-12 Chapter 1 85

PLANNING AND COMMUNITY DEVELOPMENT
Output initiatives($ million)
2010-11 2011-12 2012-13 2013-14 2014-15 5 Yr Total Funding Approved
Planning and urban developmentFrankston Activities Area revitalisation .. 1.4 1.4 1.4 0.8 5.0Planning for Melbourne and regional
Victoria.. 5.4 3.1 1.1 0.2 9.7
Transparent and efficient planning system .. 0.5 1.0 1.0 .. 2.5Sport and recreationActive Sports Partnership Program .. 0.2 0.2 0.2 0.2 0.8Maximising performance of Victorian
athletes.. 0.5 0.5 0.5 0.5 2.0
Minor sport and recreation grants .. 1.3 1.3 1.3 1.3 5.0Skilled Stadium Stage 3 redevelopment .. 12.5 12.5 .. .. 25.0Stawell Gift .. 0.1 0.2 0.2 0.2 0.5Support for volunteers and coaches .. 0.6 0.5 0.4 0.4 1.8VICSWIM Summer Kidz learn-to-swim
program.. 0.4 0.4 0.4 0.4 1.6
VeteransRedevelopment of the Shrine of
Remembrance website.. 0.1 .. .. .. 0.1
Indigenous VictoriansHonour Roll of Indigenous Victorians .. 0.1 0.1 0.1 0.1 0.5Reconciliation Victoria .. 0.2 0.2 0.2 0.2 0.8Local GovernmentGreen Light Plan to save money and cut
emissions.. 5.0 5.0 5.0 5.0 20.0
Ministerial-Mayors Advisory Panel .. 0.2 0.2 0.2 0.2 0.6Regional growthRegional Growth Fund .. 125.0 125.0 125.0 125.0 500.0Regional Victoria Living Expo .. 1.7 1.7 1.7 1.7 6.8Other commitmentsMinor community commitments –
Community Support Fund 19.7 0.1 0.1 0.1 .. 19.9
Total output election commitments 19.7 155.1 153.1 138.5 136.0 602.6Source: Department of Treasury and Finance
Planning and urban development
Frankston Activities Area revitalisation Funding is provided to develop conceptual designs to upgrade Frankston’s railway station and bus interchange areas. This initiative will also support minor works that will improve pedestrian access, security and open up spaces to attract major employers into the central Frankston activity area. This initiative contributes to the Department of Planning and Community Development’s Planning output.
86 Chapter 1 Service Delivery 2011-12

Planning for Melbourne and regional VictoriaFunding is provided to deliver a new outcomes based metropolitan planning strategy for Melbourne, underpinned by substantial community engagement. The new strategy will draw on the findings of a liveability audit, activity area boundary definition, audit of green wedge land and open space and an assessment of the development potential of government owned land. It will also provide for the development of land use adaptation plans for Victoria’s coastal settlements. This will address a range of election commitments associated with the Government’s planning policy.This initiative contributes to the Department of Planning and Community Development’s Planning output.Transparent and efficient planning systemFunding is provided to deliver new guidelines and clearer planning policies. Funding is also provided to deliver reforms to Victoria’s planning system to provide greater fairness and certainty for communities, developers and investors in relation to applications for new wind farm developments. This initiative contributes to the Department of Planning and Community Development’s Planning output.
Sport and recreation
Active Sports Partnership ProgramFunding is provided to encourage the widest possible participation in sporting activities, including participation by people with a disability and senior Victorians. This program aims to promote a culture of inclusion and assist in building the capacity of sport and recreation organisations.This initiative contributes to the Department of Planning and Community Development’s Sport and Recreation Development output.Maximising performance of Victorian athletesFunding is provided to assist Victorian athletes at all stages of development, including elite athletes, to achieve peak performance and maximise their potential performance. This initiative will also support sporting codes and schools in their efforts to eliminate drugs in sports. This initiative contributes to the Department of Planning and Community Development’s Sport and Recreation Development output.Minor sport and recreation grants Funding is provided for grants to address the backlog of upgrades at smaller sport and recreation facilities, such as change rooms and lighting improvements. In addition, the Government will continue to
Service Delivery 2011-12 Chapter 1 87

deliver funding, through contributions from the Community Support Fund, for sporting facilities that were previously funded through the Community Facilities Funding Program, subject to the usual approval processes and capacity.This initiative contributes to the Department of Planning and Community Development’s Sport and Recreation Development output.
88 Chapter 1 Service Delivery 2011-12

Skilled Stadium Stage 3 redevelopmentFunding is provided for a grant to support the third stage of the redevelopment of the Geelong Football Club’s stadium at Kardinia Park in Geelong. The redevelopment includes improvements to the Stadium’s southern stands, increases in the seating capacity, improved spectator facilities and new facilities for community sports.This initiative contributes to the Department of Planning and Community Development’s Sport and Recreation Development output.Stawell Gift Funding is provided to support the Stawell Gift, a significant event which has been held since 1878 and includes over 1 500 entrants in various footraces. The funding will support the event to 2015. This initiative contributes to the Department of Planning and Community Development’s Sport and Recreation Development output.Support for volunteers and coaches Funding is provided on an ongoing basis to support community sporting clubs attract, retain and build the capacity of volunteers. It will also supplement coach training across Victoria through programs that disseminate information on modern techniques and new developments in sport. Funding will also establish a web-based central source of information for sporting clubs and volunteers.This initiative contributes to the Department of Planning and Community Development’s Sport and Recreation Development output.VICSWIM Summer Kidz learn-to-swim programFunding is provided to support Aquatic Recreation Victoria to operate the VICSWIM Summer Kidz learn-to-swim holiday program. This will introduce Victorian children to swimming while improving water safety.This initiative contributes to the Department of Planning and Community Development’s Sport and Recreation Development output.
Veterans
Redevelopment of the Shrine of Remembrance websiteFunding is provided to modernise and update the Shrine of Remembrance website, supporting commemoration and education activities to bring Victoria’s rich military history to life.This initiative contributes to the Department of Planning and Community Development’s Veterans Affairs output.
Service Delivery 2011-12 Chapter 1 89

Indigenous Victorians
Honour Roll of Indigenous VictoriansFunding is provided for the establishment of an honour roll to recognise Indigenous Victorians who have contributed at the local, state or national level to address Indigenous disadvantage. This initiative contributes to the Department of Planning and Community Development’s Indigenous Community and Cultural Development output.Reconciliation VictoriaFunding is provided on an ongoing basis to restore Reconciliation Victoria which is a state-based organisation that promotes reconciliation between Indigenous and non-Indigenous Victorians. Working with various local reconciliation groups across Victoria, Reconciliation Victoria will work towards fostering an understanding and appreciation of Indigenous culture and history, developing partnerships and increasing opportunities for Indigenous Victorians.This initiative contributes to the Department of Planning and Community Development’s Indigenous Community and Cultural Development output.
Local Government
Green Light Plan to save money and cut emissionsFunding is provided for a new program that will support councils to convert existing outmoded mercury vapour streetlamps to energy efficient fluorescent lighting, so as to reduce greenhouse emissions and reduce costs for councils and local ratepayers. This initiative contributes to the Department of Planning and Community Development’s Local Government output.Ministerial-Mayors Advisory PanelFunding is provided for the establishment of a dedicated Ministerial-Mayors Advisory Panel to provide for greater consultation between Government and metropolitan and regional councils, clarify roles and responsibilities and consider the impacts of decisions. This initiative contributes to the Department of Planning and Community Development’s Local Government output.
Regional growth
Regional Growth FundFunding is provided to support better infrastructure, facilities and services, strengthen the economic and social base of communities, create jobs and improve career opportunities for regional Victorians
90 Chapter 1 Service Delivery 2011-12

and support to local project development and planning. The Regional Growth Fund replaces and expands on the Regional Infrastructure Development Fund.
Service Delivery 2011-12 Chapter 1 91

The fund is divided into Strategic and Local streams. The Strategic Projects stream will support economic projects and the provision of infrastructure that facilitates jobs growth and industry investment, building tourism and diversifying the regional economy. Funding will be available to undertake feasibility studies for larger strategic projects. The Local Projects stream will target key local projects, and is divided into the Local Government Infrastructure and Putting Locals First programs, which will focus on locally identified priority projects.This initiative contributes to the Department of Planning and Community Development’s Regional Development and Regional Cities output.Regional Victoria Living Expo Funding is provided to bring together a variety of exhibitors in an Expo for Victorians to learn about the opportunities to live, work and invest in regional Victoria. The Expo will take place in Melbourne and will also seek to promote lifestyle, employment, education and business opportunities in regional Victoria. In the Government’s election commitments, this initiative was also called ‘Victorian Country Week’. This initiative contributes to the Department of Planning and Community Development’s Regional Development and Regional Cities output.
Other commitments
Minor community commitments – Community Support FundFunding is provided to local councils and community groups for community infrastructure projects including enhancement of the amenity of existing facilities. These facilities include sporting, recreational and youth services.
Asset initiatives ($ million)
2010-11 2011-12 2012-13 2013-14 2014-15 TEI Funding Approved
Minor community commitments – other .. 1.0 .. .. .. 1.0Total asset election commitments .. 1.0 .. .. .. 1.0Source: Department of Treasury and Finance
Minor community commitments – otherFunding is provided to deliver minor community commitments.
92 Chapter 1 Service Delivery 2011-12

PREMIER AND CABINET
Output initiatives ($ million)
2010-11 2011-12 2012-13 2013-14 2014-15 5 Yr Total Funding Approved
Responsible governance and integrityBanning of lobbyist success fees .. .. .. .. .. ..Establishment and operation of an
Independent Broad-based Anti-corruption Commission
1.0 14.0 20.0 24.0 26.0 85.0
Independent Office of the Victorian Government Architect
.. .. .. .. .. ..
Independent panel to scrutinise government advertising
.. 0.1 0.1 0.1 0.1 0.4
Multicultural governance: settlement coordination unit
.. 0.6 0.6 0.6 0.6 2.3
National disability insurance scheme .. 1.4 1.5 .. .. 2.9Natural Disaster Assistance Unit .. 0.3 0.3 0.3 0.3 1.3Pilot of regional Department of Premier
and Cabinet offices.. .. .. .. .. ..
Pilot of the Victorian design review panel .. 0.6 0.8 0.9 .. 2.3Protecting Victoria’s vulnerable children –
child protection judicial review 1.2 1.2 .. .. .. 2.4
Warrnambool Cabinet meeting and Portland Community Cabinet visit
.. .. .. .. .. ..
Multicultural affairs and citizenshipIndependent Victorian Multicultural
Commission.. .. .. .. .. ..
International Student Care Service 0.4 0.8 0.8 0.9 0.9 3.7Migrant and refugee rights and
responsibilities seminar program.. 0.2 0.2 0.2 0.2 0.8
Multicultural language services .. 0.5 0.5 0.5 0.5 2.0New Victorian diversity employment
awards.. 0.1 0.1 0.1 0.1 0.4
New Victorian Multicultural Grants program – African community leadership .. 0.1 0.1 0.1 .. 0.2 – Calendar of major events .. 1.1 1.1 1.1 1.1 4.4 – South Asian building fund .. 0.7 .. .. .. 0.7Victorian Multicultural Honour Roll .. 0.1 0.1 0.1 0.1 0.5Arts and cultural developmentBoost to Multicultural Arts Victoria .. 0.1 0.1 0.1 0.1 0.5International chamber music competitions
at the Melbourne Recital Centre.. 0.1 0.1 0.1 0.1 0.4
Regional arts transformation .. 2.5 0.5 0.5 0.5 4.0Support for the Victorian College of the
Arts.. 6.0 6.0 6.0 6.0 24.0
Victorian sculpture initiative .. 0.3 0.3 0.3 0.3 1.0Other commitmentsMinor community commitments – other .. 0.1 .. .. .. 0.1Total output election commitments 2.6 30.7 33.2 35.8 36.9 139.2Source: Department of Treasury and Finance
Service Delivery 2011-12 Chapter 1 93
Responsible governance and integrity
The Government’s commitment to improving transparency and accountability across all its activities is reflected particularly by its major initiative to operate a new broad-based anti-corruption commission. Other initiatives involve new approval processes for government advertising and architectural design and greater independence in the provision of strategic advice to government.Banning of lobbyist success fees The Department of Premier and Cabinet will redirect funds to implement a ban on lobbyists’ success fees for public or State tenders or projects. This will contribute to higher standards of probity and transparency in Victorian public activities.This initiative contributes to the Department of Premier and Cabinet’s State Services Authority output. Establishment and operation of an Independent Broad-based Anti-corruption Commission This initiative provides funding for the establishment and operation of an Independent Broad-based Anti-corruption Commission, whose primary functions will be to investigate and establish strategies to prevent corruption across the entire Victorian public sector. The Government is committed to fighting corruption across the public sector in Victoria and raising transparency to the highest standard and accountability. The broad scope of operations will extend to the judiciary, police, public servants and local and state government elected positions and their staff. Strategies to prevent corruption will be researched and include improved accountability practices, education and referral for prosecution. The commission will incorporate the current resources, functions, funding ($20 million a year) and authority of the Office of Police Integrity in the Department of Justice, once the Commission’s governance has been formalised. This is consistent with the Government’s election commitment, which provided $170 million over five years to establish and operate the agency.Funding includes $5 million to resource a Secretariat which will prepare and establish the complex legislation, governance and operating frameworks, including staff recruitment, to operate a new commission. Funding will also provide for communications and the lease and fit out of expanded and secure accommodation, incorporating the premises of the Office for Police Integrity. This initiative contributes to the Department of Premier and Cabinet’s Strategic Policy Advice and Projects output.
94 Chapter 1 Service Delivery 2011-12

Independent Office of the Victorian Government ArchitectThe Department of Premier and Cabinet will redirect funds to re-establish the Office of the Victorian Government Architect as an administrative office of the Department of Premier and Cabinet to strengthen the Office as an authoritative source of advice and design review to safeguard and build on Victoria’s architectural legacy. Following an evaluation of the Office of the Victorian Government Architect at the end of an initial two-year period, options for a more permanent body will be considered.This initiative contributes to the Department of Premier and Cabinet’s Government Information Services and Support output.Independent panel to scrutinise government advertisingFunding is provided to establish an independent government advertising review panel, which will have responsibility for the oversight, scrutiny, approval and public reporting of the Government’s advertising campaigns. This initiative contributes to the Department of Premier and Cabinet’s Government Information Services and Support output.Multicultural governance: settlement coordination unitThis initiative will provide funding to establish a settlement coordination unit within the new Office of Multicultural Affairs and Citizenship. The unit will coordinate and facilitate a systemic and improved state, local and federal government response to the needs of newly arrived humanitarian migrant category entrants.This initiative contributes to the Department of Premier and Cabinet’s Multicultural Affairs and Citizenship output.National disability insurance schemeFunding is provided for Victoria to take a national leadership role in the reform of lifetime support for people with permanent or severe disabilities. Funding will support the National Disability Insurance Scheme Taskforce to assess and report on options for a national disability insurance scheme, informed by broad community consultation. This will guide Victoria’s response to recommendations of the Productivity Commission’s inquiry into a Disability Care and Support Scheme due in July 2011. This initiative contributes to the Department of Premier and Cabinet’s Strategic Policy Advice and Projects output. Natural Disaster Assistance UnitFunding is provided to establish a natural disaster assistance unit within the Department of Premier and Cabinet. The unit will provide quality, timely and coordinated whole of government policy advice to the Premier on routine and emergency natural disaster assistance
Service Delivery 2011-12 Chapter 1 95

issues, to help Government deliver better, more timely assistance to those affected by natural disasters.This initiative contributes to the Department of Premier and Cabinet’s Strategic Policy Advice and Projects output.Pilot of regional Department of Premier and Cabinet offices Funding for the initial phase of this program is provided to pilot and evaluate the operation of two regional offices of the Department of Premier and Cabinet in Ballarat and Bendigo, enabling regional Victorians easier access to and participation in government policy making. The pilot will operate for nine months and enable DPC to work more closely with regional government offices, agencies and local government to deliver better services for communities and businesses in regional Victoria. This initiative contributes to the Department of Premier and Cabinet’s Strategic Policy Advice and Projects output.
96 Chapter 1 Service Delivery 2011-12

Pilot of the Victorian design review panelThis initiative will provide funding for a three year trial of a new Victorian design review panel, chaired by the Victorian Government Architect and aimed at further improving Government infrastructure design and delivering high quality outcomes for the built environment. The Victorian design review panel will also conduct two design competitions annually for projects costing approximately $10 million and oversee a design competition for a major public infrastructure project, such as the restoration of the Flinders Street Station.This initiative contributes to the Department of Premier and Cabinet’s Strategic Policy Advice and Projects output. Protecting Victoria’s vulnerable children – child protection judicial reviewFunding is provided to conduct a Judicial Review of the Child Protection Service to advise the Government and the community about how to reduce child abuse and strengthen the protection of Victorian children who have experienced, or are at risk of experiencing, neglect or abuse. This initiative contributes to the Department of Premier and Cabinet’s Strategic Policy Advice and Projects output.Warrnambool Cabinet meeting and Portland community Cabinet visitFunding is provided for the new Government’s first full Cabinet meeting in regional Victoria. This will enable Government to more closely listen, engage and better understand the issues that affect regional Victoria.This initiative contributes to the Department of Premier and Strategic Policy Advice and Projects output.
Multicultural Affairs and Citizenship
The Government is focused on promoting social cohesion and celebrating the many different cultures that help establish Victoria’s identity and make it such a vibrant State. Initiatives in this budget include free seminars across Victoria to provide information to newly arrived migrants and refugees on their rights and responsibilities as citizens of Victoria, a coordinated approach to improve the state, local and federal government response to the needs of newly arrived humanitarian migrants, and improved access to government interpreter and translator services for people with limited English language proficiency.Independent Victorian Multicultural Commission The Department of Premier and Cabinet will redirect funds to amend current portfolio arrangements to establish a more independent Victorian Multicultural Commission, along with a new Office of Multicultural Affairs and Citizenship within the Department of Premier
Service Delivery 2011-12 Chapter 1 97

and Cabinet. This will enable stronger lines of communication between Government and Victoria’s diverse multicultural community.This initiative contributes to the Department of Premier and Cabinet’s Multicultural Affairs and Citizenship output.
98 Chapter 1 Service Delivery 2011-12

International Student Care Service Funding is provided to continue the International Student Care Service, which provides a 24 hour contact point where all international students in need can obtain advice, support and assistance. Funding also supports an evaluation in 2012 to help plan for the future directions of this service. This initiative contributes to the Department of Premier and Cabinet’s Multicultural Affairs and Citizenship output. Migrant and refugee rights and responsibilities seminar programFunding is provided to deliver a new migrant and refugee rights and responsibilities seminar program. The program includes free seminars across Victoria and will provide information to newly arrived migrants and refugees on their rights and responsibilities as citizens of Victoria. This initiative contributes to the Department of Premier and Cabinet’s Multicultural Affairs and Citizenship output. Multicultural language servicesFunding is provided to increase support for multicultural language services to meet the increasing demand for interpreting and translating. This funding will allow the development of the quality of interpreters and translators, increase supply of qualified translators, and optimise the use of language services. This will assist people with limited English language proficiency to access a range of important government services. This initiative contributes to the Department of Premier and Cabinet’s Multicultural Affairs and Citizenship output.New Victorian diversity employment awardsThis initiative provides funding to introduce the Victorian diversity employment awards, which will acknowledge and reward businesses that promote a multilingual workforce in their marketing strategies. This initiative contributes to the Department of Premier and Cabinet’s Multicultural Affairs and Citizenship output. New Victorian multicultural grants program
African community leadershipFunding is provided for an African Community leadership grant to assist in developing confidence and self-sufficiency skills to foster future leaders in Victoria’s African community.This initiative contributes to the Department of Premier and Cabinet’s Multicultural Affairs and Citizenship output.
Service Delivery 2011-12 Chapter 1 99

Calendar of major eventsFunding is provided to support new and expanded multicultural festivals and events and to establish a calendar of major multicultural events which will alternate between Melbourne and regional Victoria. This program which will be administered by the Office of Multicultural Affairs and Citizenship will encourage cross cultural exchanges and mutual respect through broader community participation.This initiative contributes to the Department of Premier and Cabinet’s Multicultural Affairs and Citizenship output.
South Asian building fundFunding is provided for a South Asian building fund for the construction of new, and the enhancement of existing, community spaces and facilities for South Asian community organisations.Funding for this initiative was specified as capital in the Government’s election commitment list, but will be delivered as a capital grant.This initiative contributes to the Department of Premier and Cabinet’s Multicultural Affairs and Citizenship output.
Victorian Multicultural Honour RollFunding is provided to establish the Victorian Multicultural Honour Roll, which will recognise recently arrived migrants and refugees who have played a leadership role in the community. This initiative contributes to the Department of Premier and Cabinet’s Multicultural Affairs and Citizenship output.
Arts and Cultural Development
The Government is committed to supporting the arts as a key contributor to the uniqueness of Victoria. This budget includes initiatives that will foster the development of artists and arts industries, make the arts more accessible and affordable for all Victorians, and support participation in artistic endeavours by people of all ages in metropolitan, rural and regional communities. Boost to Multicultural Arts VictoriaFunding is provided to Multicultural Arts Victoria to support and encourage new and emerging cultural and linguistically diverse artists.This initiative contributes to the Department of Premier and Cabinet’s Arts Development and Access output.
100 Chapter 1 Service Delivery 2011-12

International chamber music competitions at the Melbourne Recital Centre Funding is provided to enable the staging of the final rounds of the Melbourne International Chamber Music competition and the Asia Pacific music competition at the Melbourne Recital Centre. This initiative contributes to the Department of Premier and Cabinet’s Arts Development and Access output. Regional arts transformation Funding is provided to extend the reach of artistic endeavour in Victoria’s regional communities. This includes the transformation of smaller towns through high quality arts projects and the expansion of regional touring programs. This initiative contributes to the Department of Premier and Cabinet’s Arts Development and Access output. Support for the Victorian College of the ArtsFunding is provided to secure the Victorian College of the Arts as a premier arts teaching institution. This includes support for the Victorian College of the Arts’ Foundation, the upgrade of equipment and infrastructure, scholarships to attract outstanding talent, and a regional training program.This initiative contributes to the Department of Premier and Cabinet’s Arts Development and Access output. Victorian sculpture initiativeFunding is provided to increase support for public sculpture in Victoria. This includes annual awards for outstanding works, and support for sculpture in gardens, parks and other public settings around the State. This initiative contributes to the Department of Premier and Cabinet’s Arts Development and Access output.
Other commitments
Minor community commitments – otherFunding is provided to deliver minor arts and community development initiatives.
Asset initiatives($ million)
2010-11 2011-12 2012-13 2013-14 2014-15 TEIFunding Approved
Responsible governance and integrityEstablishment of Independent Broad-
based Anti-corruption Commission.. 5.0 .. .. .. 5.0
Total asset election commitments .. 5.0 .. .. .. 5.0Source: Department of Treasury and Finance
Service Delivery 2011-12 Chapter 1 101

Responsible governance and integrity
Establishment of Independent Broad-based Anti-corruption Commission
Refer to the output initiative for a description of this initiative.
102 Chapter 1 Service Delivery 2011-12

PRIMARY INDUSTRIES
Output initiatives ($ million)
2010-11 2011-12 2012-13 2013-14 2014-15 5 Yr Total Funding Approved
Meeting future energy needsLow emission energy technology program .. .. 12.5 16.0 12.5 41.0Safer electricity assets fund .. 12.5 12.5 12.5 12.5 50.0Agricultural industry supportCentre for expertise – smoke taint in wine .. 1.0 1.0 1.0 1.0 4.0Support for food and fibre marketing
cooperatives.. .. 1.8 1.9 1.6 5.2
Support for Victorian young farmers .. 0.3 0.3 0.3 0.3 1.0Animal welfareClosing illegal puppy farms .. 0.5 0.6 0.3 0.3 1.7Core funding for the Royal Society for the
Prevention of Cruelty to Animals Inspectorate
.. 1.0 1.0 1.0 1.0 4.0
Supporting recreational opportunitiesImproving recreational fishing
opportunities in regional Victoria.. 3.9 4.0 4.1 4.2 16.2
Pest controlVictorian fox and wild dog control
program.. 1.0 1.0 1.0 1.0 4.0
Other commitmentsMinor community commitments – other .. .. .. .. .. ..Total output election commitments .. 20.2 34.6 38.0 34.3 127.1Source: Department of Treasury and Finance
Meeting future energy needs
Low emission energy technology programFunding is provided to double the existing Energy Technology Innovation Strategy competitive grants available for pre-commercial pilot renewable energy plants and technologies projects. This will facilitate the development of low emission energy technology projects in Victoria. This initiative contributes to the Department of Primary Industries’ Primary Industries Policy output.
Service Delivery 2011-12 Chapter 1 103

Safer electricity assets fund Funding is provided to reduce the number of bushfires started by ageing electricity assets by replacing electricity assets. The safer electricity assets fund is being established in response to the 2009 Victorian Bushfires Royal Commission finding that one of the primary causes of catastrophic bushfires in Victoria in the past 40 years has been the failure of electricity assets. This initiative contributes to the Department of Primary Industries’ Primary Industries Policy output.
Agricultural industry support
Centre for expertise – smoke taint in wineFunding is provided to establish a centre for expertise to address smoke taint in wine through a comprehensive research and development program. By undertaking a research and development program, the impact of smoke taint in wine from prescribed burning and wildfire can be minimised.This initiative contributes to the Department of Primary Industries’: Strategic and Applied Scientific Research output; and Sustainable Practice Change output.Support for food and fibre marketing cooperatives Funding is provided to establish marketing cooperatives by local groups of food and fibre producers. Funding has also been allocated to develop a specialist team to provide training and support to producers in marketing and market development. This initiative contributes to the Department of Primary Industries’ Sustainable Practice Change output.Support for Victorian young farmersFunding is provided to support a Victorian rural youth organisation to provide young rural-based men and women with access to support networks, mentoring opportunities, leadership development and social skill growth opportunities. This will also enable support for young Victorian farmers wanting to expand their agricultural knowledge overseas and undertake international work experience. This initiative contributes to the Department of Primary Industries’ Sustainable Practice Change output.
Animal Welfare
Closing illegal puppy farms Funding is provided to improve the standards of operation of commercial dog breeding enterprises (puppy farms) and enhance the
104 Chapter 1 Service Delivery 2011-12

regulation of these businesses, including closing down illegal puppy farms. This initiative contributes to the Department of Primary Industries’ Regulation and Compliance output.Core funding for the Royal Society for the Prevention of Cruelty to Animals InspectorateFunding is provided to allocate ongoing support to the Royal Society for the Prevention of Cruelty to Animals Inspectorate to investigate claims of animal cruelty and progress legal proceedings against the alleged perpetrators of serious cases. This initiative contributes to the Department of Primary Industries’ Regulation and Compliance output.
Supporting recreational opportunities
Improving recreational fishing opportunities in regional Victoria Funding is provided to make improvements to recreational fishing infrastructure, provide additional fish stocking and appropriately manage fisheries resources to support the development of recreational fishing in Victoria. This initiative contributes to the Department of Primary Industries’ Primary Industries Policy output.
Pest control
Victorian fox and wild dog control programFunding is provided to deliver a fox and wild dog bounty program. The bounty will reward hunters for their efforts in controlling these pests. This approach forms part of an integrated strategy for control which includes aerial baiting. This initiative will also investigate effective strategies for wild dog control.This initiative contributes to the Department of Primary Industries’ Regulation and Compliance output.
Other commitments
Minor community commitments – otherFunding is provided to deliver minor community commitments. This initiative includes $4 000 in 2011-12.
AssetsNil
Service Delivery 2011-12 Chapter 1 105

SUSTAINABILITY AND ENVIRONMENT
Output initiatives($ million)
2010-11 2011-12 2012-13 2013-14 2014-15 5 Yr Total Funding Approved
Living VictoriaFeasibility Study – Ballarat (Water) .. 0.8 0.3 .. .. 1.0Leading the Way – Liveable Victoria
Fund – funding for communities to adopt integrated water cycle management
.. 6.2 11.2 16.3 16.3 50.0
Water efficiency rebates for residential and small business customers
.. 10.0 10.0 10.0 10.0 40.0
Communities caring for the environmentCommunity Green Fund Grants Program .. 5.0 5.0 5.0 5.0 20.0Community input to environment –
retaining Victoria’s Catchment Management Authorities
0.3 .. .. .. .. 0.3
Restoring funds for Landcare support .. 2.4 3.1 3.2 3.3 12.0Parks and landManagement of Victoria’s parks 0.5 2.2 2.3 2.3 2.3 9.6Putting the buzz back in agriculture –
public land beekeeping.. 0.2 .. .. .. 0.2
Acting sustainablyBusiness sustainability accreditation
program (Green Tick for Green Businesses)
.. 2.2 2.8 .. .. 5.0
Energy efficiency rebates for low income households
.. 2.5 2.5 .. .. 5.0
Feasibility study – generating green power from Ballarat’s green waste
.. 0.1 .. .. .. 0.1
Supporting recreational opportunitiesFree zoos for children under 16 .. 2.5 2.6 2.7 2.9 10.7Other commitmentsMinor community commitments –
Community Support Fund 0.4 .. .. .. .. 0.4
Total output election commitments 1.2 34.0 39.7 39.4 39.8 154.2Source: Department of Treasury and Finance
Living Victoria
Feasibility study – Ballarat (water) Funding is provided for an integrated water management feasibility study to investigate alternative water supply sources for Ballarat, such as stormwater managed aquifer recharge, stormwater from existing and future drainage systems, and rainwater from rooftops. This initiative contributes to the Department of Sustainability and Environment’s Sustainable Water Management and Supply output.
106 Chapter 1 Service Delivery 2011-12

Leading the Way – Liveable Victoria Fund – Funding for communities to adopt integrated water cycle managementFunding is provided for a grants program to initiate integrated water projects across Victoria to encourage the adoption of water sensitive urban design. The grants program also includes funding for Melbourne City Council to deliver strategies and programs to implement integrated water cycle management in the CBD.This initiative contributes to the Department of Sustainability and Environment’s Sustainable Water Management and Supply output. Water efficiency rebates for residential and small business customers Funding is provided to establish a rebate program for households and small business for the purchase of water efficient products.This initiative contributes to the Department of Sustainability and Environment’s Sustainable Water Management and Supply output.
Communities caring for the environment
Community Green Fund Grants ProgramFunding is provided for an environmental grants program to assist local community groups to undertake on-ground activities, such as weed and pest management, cleaning up of waterways, revegetation and fencing, resource recycling and reuse, and biodiversity and habitat preservation.This initiative contributes to the Department of Sustainability and Environment’s Biodiversity output.Restoring funds for Landcare supportFunding is provided to support 60 Landcare coordinators across Victoria to help community volunteers protect and restore Victoria’s environment.This initiative contributes to the Department of Sustainability and Environment’s Natural Resources output. Community input to environment – retaining Victoria’s Catchment Management AuthoritiesFunding is provided to retain the 10 Catchment Management Authorities, three regional coastal boards and two peak bodies, to discontinue the former Government’s program of amalgamating 15 agencies into six natural resource and catchment authorities.This initiative contributes to the Department of Sustainability and Environment’s Natural Resources output.
Service Delivery 2011-12 Chapter 1 107

Parks and land
Management of Victoria’s parks Funding is provided for more intensive monitoring and management of the Alpine National Park, including research, a feral horse and deer control program and rehabilitation of nationally listed wetlands.This initiative contributes to the Department of Sustainability and Environment’s Forests and Parks output. Putting the buzz back in agriculture – public land beekeepingFunding is provided for a comprehensive review of the policy and regulatory framework for identification and allocation of bee keeping sites on public land.This initiative contributes to the Department of Sustainability and Environment’s Forests and Parks output.
Acting sustainably
Business sustainability accreditation program (Green Tick for Green Businesses)Funding is provided to establish a voluntary accreditation program for environmentally sustainable practices for small and medium enterprises operating in Victoria. This initiative contributes to the Department of Sustainability and Environment’s Environmental Policy and Climate Change output. Energy efficiency rebates for low income households Funding is provided for a rebate program for low income homes purchasing gas space heaters, and energy efficient refrigerators and washing machines. This initiative contributes to the Department of Sustainability and Environment’s Environmental Policy and Climate Change output.Feasibility study – generating green power from Ballarat’s green wasteFunding is provided to conduct a feasibility study into generating green power from Ballarat’s green waste. The study will investigate whether there are opportunities to encourage construction of a purpose built alternative waste treatment plant which will deliver green power.This initiative contributes to the Department of Sustainability and Environment’s Environmental Policy and Climate Change output.
Supporting recreational opportunities
Free zoos for children under 16Funding is provided to subsidise zoo entry for all children under 16 years of age on weekends, public holidays and during school holidays.
108 Chapter 1 Service Delivery 2011-12

This initiative contributes to the Department of Sustainability and Environment’s Public Land output.
Other commitments
Minor community commitments – Community Support Fund Funding is provided for local park improvements in a range of metropolitan and regional locations. The program of works includes walk upgrades, and parkland and recreational reserve development.
Asset initiatives($ million)
2010-11 2011-12 2012-13 2013-14 2014-15 TEIFunding Approved
Minor community commitments – other .. 1.3 .. .. .. 1.3Total asset election commitments .. 1.3 .. .. .. 1.3Source: Department of Treasury and Finance
Minor community commitments – otherFunding is provided for local park improvements in a range of metropolitan and regional locations. The program of works includes walk upgrades, and parkland and recreational reserve development.
Service Delivery 2011-12 Chapter 1 109

TRANSPORT
Output initiatives($ million)
2010-11 2011-12 2012-13 2013-14 2014-15 5 Yr Total Funding Approved
Public transport40 new trains for Melbourne commuters
– stage 1.. .. 0.2 3.8 7.3 11.4
Doncaster rail planning .. 4.9 1.6 .. .. 6.5Establish the Victorian Public Transport
Development Authority.. 2.5 2.5 2.5 2.5 10.0
lnter capital High Speed Rail planning unit .. 1.0 1.0 1.0 1.0 4.0Lara to Avalon Airport Link .. 1.5 1.5 .. .. 3.0Maintaining our Rail Network Fund .. 25.0 25.0 25.0 25.0 100.0Melbourne Airport rail link feasibility
study .. 5.0 1.5 .. .. 6.5
Opening unused railway station buildings to community and sporting groups
.. 1.3 1.3 1.3 1.3 5.0
Preserve W-Class trams .. 2.0 2.0 2.0 2.0 8.0Rowville rail feasibility study .. 1.0 1.0 .. .. 2.0Regional railBallarat trains to Wendouree station .. 0.4 0.4 0.4 0.4 1.6Fix country level crossings – including
Warragul station precinct.. 0.7 1.0 7.0 3.3 12.0
Rail revival in Geelong, Ballarat and Bendigo – planning
.. 2.0 .. .. .. 2.0
Regional roadsCountry roads and bridges initiative .. 40.0 40.0 40.0 40.0 160.0Princes Highway West – overtaking lanes
west of Colac.. .. .. .. .. 0.1
Rural overtaking lanes .. .. .. .. .. ..Other election commitmentsAvalon jet fuel pipeline and logistic
planning.. 4.7 1.0 .. .. 5.7
Better roads – local projects .. .. 0.1 0.3 0.3 0.7Bicycle ferry – port punt .. 0.4 0.4 0.4 0.4 1.4Planning study for relocation of car
import/export trade to Port of Geelong.. 2.0 .. .. .. 2.0
Taxi Services Commission .. 0.3 0.3 0.3 0.3 1.2Minor community commitments – other .. 0.1 .. .. .. 0.1Total output election commitments .. 94.7 80.8 83.9 83.7 343.1Source: Department of Treasury and Finance
110 Chapter 1 Service Delivery 2011-12

Public Transport
40 new trains for Melbourne commuters – stage 1Funding is provided for seven X’Trapolis trains as Stage 1 of a rolling stock procurement program for 40 new trains. The project also includes funding for enabling infrastructure; operations; maintenance of the additional fleet and infrastructure assets; and planning and development for the procurement of an additional 33 trains. This initiative contributes to the Department of Transport’s: Integrated Metropolitan Public Transport Services output; and Public Transport Infrastructure Development output.Doncaster rail planningFunding is provided for a study to plan for the development of a rail link from Melbourne to Doncaster.This initiative contributes to the Department of Transport’s Integrated and Sustainable Transport Development output.Establish the Victorian Public Transport Development AuthorityFunding is provided to establish the Victorian Public Transport Development Authority (VPTDA) which will plan, co-ordinate and manage the public transport system (metropolitan trains, trams, buses and regional trains and buses).This initiative contributes to the Department of Transport’s Integrated and Sustainable Transport Development output.Inter capital High Speed Rail planning unit Funding is provided to establish a unit within the new Victorian Public Transport Development Authority to investigate the potential for High Speed Rail links from Melbourne to Sydney, Canberra, Brisbane and Adelaide and to advocate for cost efficient rail link options.This initiative contributes to the Department of Transport’s Integrated and Sustainable Transport Development output.Lara to Avalon Airport LinkFunding is provided to commence planning and business case development work for a new rail link to Avalon airport. Funding for this initiative is for planning and enabling works, with funding to complete the project to be allocated in a future budget. This initiative contributes to the Department of Transport’s Integrated and Sustainable Transport Development output.Maintaining our Rail Network FundFunding is provided to establish a new Maintaining our Rail Network Fund for rail asset renewal and maintenance to improve the reliability
Service Delivery 2011-12 Chapter 1 111

and punctuality of Victoria’s rail system and ensure its effective and efficient performance. This initiative contributes to the Department of Transport’s: Integrated Metropolitan Public Transport Services output; and Rural and Regional Public Transport Services output.Melbourne Airport rail link feasibility studyFunding is provided for the development of a plan to construct a rail link to Melbourne Airport.This initiative contributes to the Department of Transport’s Integrated and Sustainable Transport Development output.Opening unused railway station buildings to community and sporting groupsFunding is provided to facilitate community use of currently unused buildings on railway stations. The program will identify and restore suitable buildings for a range of community and private uses.This initiative contributes to the Department of Transport’s Public Transport Infrastructure Development output.Preserve W-Class tramsFunding is provided to restore to operating condition a number of W-class trams currently held in storage and to introduce the restored trams on selected tram routes.This initiative contributes to the Department of Transport’s Integrated Metropolitan Public Transport Services output.Rowville rail feasibility studyFunding is provided for a study to plan for the development of a rail link to Rowville via Monash University.This initiative contributes to the Department of Transport’s Integrated and Sustainable Transport Development output.
Regional rail
Ballarat trains to Wendouree stationFunding is provided to increase the number of trains to Wendouree by extending additional Ballarat trains to Wendouree and commencing additional Ballarat trains from Wendouree. This initiative contributes to the Department of Transport’s Rural and Regional Public Transport Services output.Fix country level crossings – including Warragul station precinct Funding is provided to install boom barriers and flashing lights at up to 75 country level crossings across Victoria, and to redevelop the Warragul rail precinct, including planning for the construction of a new
112 Chapter 1 Service Delivery 2011-12

car park and a new rail road underpass. The remaining funding for this initiative will be allocated in a future budget. This initiative contributes to the Department of Transport’s: Public Transport Safety and Regulation output; and Public Transport Infrastructure Development output.
Service Delivery 2011-12 Chapter 1 113

Rail revival in Geelong, Ballarat and Bendigo – planningFunding is provided to undertake a study into the reintroduction of passenger trains on the line between Geelong, Ballarat and Bendigo via Meredith, Maryborough and Castlemaine.This initiative contributes to the Department of Transport’s Integrated and Sustainable Transport Development output.
Regional Roads
Country roads and bridges initiativeFunding is provided for maintenance and restoration of rural roads and bridges. Forty rural councils will be eligible for funding of up to $1 million per year for four years.This initiative contributes to the Department of Transport’s Road Asset Management output.Princes Highway West – overtaking lanes west of ColacRefer to the asset initiative for a description of this initiative.Rural overtaking lanesRefer to the asset initiative for a description of this initiative.
Other election commitments
Avalon jet fuel pipeline and logistic planningFunding is provided to progress development of an airport precinct master plan for Avalon Airport and for a contribution towards a jet fuel pipeline for the Airport. This initiative contributes to the Department of Transport’s Integrated and Sustainable Transport Development output.Better roads – local projectsFunding is provided for local road infrastructure and traffic improvement projects. This initial program of works will increase road traffic throughput, reduce road user delays, improve road safety and improve local area amenity. Funding for this initiative is for the first two years of the program only. This initiative contributes to the Department of Transport’s Road Network Improvements output.Bicycle ferry – port puntThe West Gate Punt provides a connection across the Yarra River for cyclists and pedestrians between Spotswood and Port Melbourne. Funding is provided to introduce a weekday commuter service which will operate in addition to the existing weekend services.
114 Chapter 1 Service Delivery 2011-12

This initiative contributes to the Department of Transport’s Integrated and Sustainable Transport Development output.
Service Delivery 2011-12 Chapter 1 115

Planning study for relocation of car import/export trade to Port of GeelongFunding is provided to examine the feasibility of relocating car stevedoring functions from Melbourne (Webb Dock) to Geelong including an assessment of the ability of the present shipping channel to accommodate car carriers and the availability of suitable land at Geelong to cater for the growth in trade at the port.This initiative contributes to the Department of Transport’s Freight, Logistics, Ports and Marine Development output.Taxi Services CommissionFunding is provided for a comprehensive inquiry into the taxi and hire car service industries in Victoria, and to provide for the establishment of a Taxi Services Commission as a separate statutory agency. The Commission is to become the regulator of taxi and hire car services following the completion of the Taxi Industry Inquiry. This initiative contributes to the Department of Transport’s Vehicle and Driver Regulation output.Minor community commitments – otherFunding is provided for a pre-feasibility study on potential service improvements relating to Frankston rail.
116 Chapter 1 Service Delivery 2011-12

Asset initiatives($ million)
2010-11 2011-12 2012-13 2013-14 2014-15 TEI Funding Approved
Metropolitan roadsDingley Bypass .. 5.0 15.0 .. .. 20.0Outer suburban arterial roads projects –
development and early works.. 4.8 .. .. .. 4.8
Public transport40 new trains for Melbourne commuters –
stage 1.. 37.2 108.9 64.3 .. 210.4
Additional car parking at Merinda Park and Narre Warren stations
.. 0.6 .. .. .. 0.6
Metropolitan level crossings .. 13.1 3.4 .. .. 16.5Opening unused railway station
buildings to community and sporting groups
.. 0.5 1.5 1.5 1.5 5.0
Public Transport Development Program .. 6.5 6.7 4.7 .. 17.9Ringwood Railway station upgrade-
stage 1.. 2.0 .. .. .. 2.0
Regional railSouth West Victorian passing loop .. 2.0 8.0 .. .. 10.0Regional roadsBallarat-Buninyong Road upgrade .. 1.1 2.4 1.0 .. 4.5Ballarat Western Link Road .. 1.0 1.5 .. .. 2.5Fix country level crossings – including
Warragul station precinct.. 9.8 12.7 9.4 3.4 35.3
Geelong Ring Road noise walls .. 3.0 .. .. .. 3.0Kilmore Wallan Bypass 0.6 1.2 1.2 0.4 .. 3.4Koo Wee Rup Bypass .. 2.5 20.3 23.8 3.4 50.0Omeo Highway sealing .. 2.0 6.0 .. .. 8.0Princes Highway West – Colac to
Winchelsea planning.. 0.5 2.5 2.0 .. 5.0
Princes Highway West – overtaking lanes west of Colac
.. 7.0 2.9 5.1 .. 15.0
Rural overtaking lanes .. 2.3 3.8 0.6 .. 6.7Other election commitmentsBetter roads – local projects .. 10.1 10.5 .. .. 20.6Minor community commitments – other .. 5.9 .. .. .. 5.9Total asset election commitments 0.6 118.0 207.3 112.7 8.3 446.9Source: Department of Treasury and Finance
Metropolitan roads
Dingley Bypass Funding is provided for planning, land acquisition, and commencement of construction of the next stage of the Dingley bypass between Warrigal Road and Westall Road. The road will link new residential growth areas to employment opportunities, and serve as an east west route for motorists and freight operators. Funding for this initiative is
Service Delivery 2011-12 Chapter 1 117

for planning and enabling works, with funding to complete the project to be allocated in a future budget.This initiative contributes to the Department of Transport’s Road Network Improvements output.Outer suburban arterial roads projects – development and early worksFunding is provided for development and preconstruction work for the duplication of Cardinia Road, High Street Road, Wantirna South and Stud Road, Bayswater as well as early works for Cardinia Road/Princes Highway intersection. Funding for this initiative is for planning and enabling works, with funding to complete the project to be allocated in a future budget.This initiative contributes to the Department of Transport’s Road Network Improvements output.
Public Transport
40 new trains for Melbourne commuters – stage 1Refer to the output initiative for a description of this initiative.Additional car parking at Merinda Park and Narre Warren stationsFunding is provided to expand free commuter car parking at Narre Warren railway station. Expansion of car parking at Merinda Park is underway.This initiative contributes to the Department of Transport’s Public Transport Infrastructure Development output.Metropolitan level crossingsFunding is provided for planning, project development and preconstruction activity works as the first stage of a program to eliminate level crossings in metropolitan Melbourne. Funding includes preconstruction for Mitcham Road and Rooks Road as well as accelerated project development at Springvale Road, Springvale. Funding for this initiative is for stage 1 works, with funding to complete the project to be allocated in a future budget.This initiative contributes to the Department of Transport’s Public Transport Safety and Regulation output.Opening unused railway station buildings to community and sporting groupsRefer to the output initiative for a description of this initiative.Public Transport Development Program Funding is provided for the development and planning of a series of public transport infrastructure improvements. In regional Victoria, this includes a new station at Epsom (including additional trains to Epsom and Eaglehawk), a new station at Grovedale and upgrade of Ballan station including a crossing loop. Metropolitan area initiatives include
118 Chapter 1 Service Delivery 2011-12

a new station at Southland and additional parking at Syndal. Funding provided is for the first tranche of the initiative, with funding to complete the project to be allocated in a future budget.In addition funding is provided for the re-opening of Talbot station and for the upgrade of Balaclava station to a premium station.This initiative contributes to the Department of Transport’s Integrated and Sustainable Transport Development output.Ringwood Railway station upgrade – stage 1Funding is provided to develop an integrated transport design for the upgrade of the Ringwood railway station and bus interchange. Funding for this initiative is for planning, with funding to complete the project to be allocated in a future budget.This initiative contributes to the Department of Transport’s Integrated and Sustainable Transport Development output.
Regional rail
South West Victorian passing loopFunding is provided for the construction of one passing loop on the Warrnambool rail line and for project development work for a second passing loop.This initiative contributes to the Department of Transport’s Freight, Logistics, Ports and Marine Development output.
Regional roads
Ballarat-Buninyong Road upgradeFunding is provided for the upgrade of Ballarat-Buninyong Road between Grant Street and Fisken Avenue, including improved access at intersections of Whitehorse Road, Gear Avenue and Green Hill Road, and provision of bus and bicycle facilities. This initiative contributes to the Department of Transport’s Road Network Improvements output.Ballarat Western Link Road Funding is provided to commence a new road link for Ballarat between the Western Freeway and Remembrance Drive. The road link will provide a key transport connection to the region. Funding for this initiative is for planning and enabling works, with funding to complete the project to be allocated in a future budget.This initiative contributes to the Department of Transport’s Road Network Improvements output.Fix country level crossings – including Warragul station precinctRefer to the output initiative for a description of this initiative.
Service Delivery 2011-12 Chapter 1 119

Geelong Ring Road noise wallsFunding is provided for the construction of noise walls along a 900 metre stretch of the Geelong Ring Road at Wandana Heights.This initiative contributes to the Department of Transport’s Road Network Improvements output.Kilmore Wallan BypassFunding is provided to undertake a planning study for the Kilmore Wallan bypass.This initiative contributes to the Department of Transport’s Road Network Improvements output.Koo Wee Rup Bypass Funding is provided to construct a new single carriageway road to enable vehicles travelling between the Princes Highway (Pakenham Bypass) and the South Gippsland Highway to bypass the township of Koo Wee Rup. The bypass will provide relief for the local community from congestion and access difficulties and improve travel time and safety for through-traffic.This initiative contributes to the Department of Transport’s Road Network Improvements output.Omeo Highway sealingFunding is provided to seal a 15km section of the Omeo Highway.This initiative contributes to the Department of Transport’s Road Network Improvements output.Princes Highway West – Colac to Winchelsea planningFunding is provided for planning work for the duplication of the Princes Highway West from Winchelsea to Colac. Funding will allow the development of options, community consultation, planning scheme amendments, design and preconstruction work. This initiative contributes to the Department of Transport’s Road Network Improvements output.Princes Highway West – overtaking lanes west of ColacFunding is provided for the construction of overtaking lanes on the Princes Highway at select locations west of Colac. Output funding of $52 000 is also provided for maintenance of the overtaking lanes.This initiative contributes to the Department of Transport’s Road Network Improvements output.Rural overtaking lanesFunding is provided for construction of two overtaking lanes on the Melbourne-Lancefield Road and an overtaking lane on the Strzelecki Highway. Funding is also provided to plan for a further two overtaking
120 Chapter 1 Service Delivery 2011-12

lanes on the Melbourne-Lancefield Road and an overtaking lane on the Hyland Highway. The overtaking lanes are expected to improve safety and traffic flow, and reduce travel times on country roads. Output funding of $46 000 is also provided for maintenance of the new overtaking lanes.This initiative contributes to the Department of Transport’s Road Network Improvements output.
Service Delivery 2011-12 Chapter 1 121

Other election commitments
Better roads – local projectsRefer to the output initiative for a description of this initiative.
Minor community commitments – other
Funding is provided for local public transport infrastructure improvements in a range of metropolitan and regional locations. The program of works includes tram and bus shelters and improvements to railway station ramps, footbridges and crossings.This initiative contributes to the Department of Transport’s Public Transport Infrastructure Development output.
Election commitments to be funded in future yearsThe Government is committed to the delivery of all its election commitments. Funding for the following asset projects will be made available in future budgets to ensure that the Government’s commitments are met in full: 10 new trams; Bus services coordination planning; Freight and logistics plan; Mornington Peninsula Freeway extension study; and Rail Revival: South Geelong/Drysdale: Geelong/Torquay.
122 Chapter 1 Service Delivery 2011-12

TREASURY AND FINANCE
Output initiatives($ million)
2010-11 2011-12 2012-13 2013-14 2014-15 5 Yr TotalFunding Approved
Housing affordabilityExtend the First Home Bonus until 30 June
2012- 13.1 95.3 47.0 0.8 .. 130.1
Total output election commitments - 13.1 95.3 47.0 0.8 .. 130.1Source: Department of Treasury and Finance
Housing affordability
Extend the First Home Bonus until 30 June 2012Funding is provided to maintain assistance currently available to eligible first homebuyers by extending the First Home Bonus, including the Regional Bonus, until 30 June 2012.Eligible applicants will receive the First Home Owner Grant of $7 000 when purchasing homes valued up to $750 000. In addition, first homebuyers may also be eligible for the First Home Bonus of $13 000 if purchasing or constructing a new home worth up to $600 000 in metropolitan Melbourne, or $19 500 if the home is in regional areas.This initiative contributes to the Department of Treasury and Finance’s Revenue Management Services to Government output.
Service Delivery 2011-12 Chapter 1 123

REVENUE INITIATIVES($ million)
2010-11 2011-12 2012-13 2013-14 2014-15 5 Yr Total Revenue Approved
Ambulance servicesAmbulance services – 50 per cent cut to
ambulance membership fees .. - 52.1 - 57.3 - 63.1 - 69.4 - 241.9
Housing affordability50 per cent Land Transfer Duty
concession for first home buyers of properties valued up to $600 000
.. - 71.0 - 86.0 - 121.0 - 166.0 - 444.0
Extend Land Transfer Duty relief for eligible seniors
.. - 10.8 - 10.9 - 11.5 - 12.1 - 45.3
Land Transfer Duty concession for farmers under 35 years of age
.. - 3.0 - 3.0 - 3.0 - 3.0 - 12.0
Reducing the financial burden on small businessLiquor licence fee reduction - 2.3 - 2.5 - 2.7 - 2.9 - 3.1 - 13.5Total revenue election commitments - 2.3 - 139.4 - 159.9 - 201.5 - 253.6 - 756.7Source: Department of Treasury and Finance
Ambulance services
Ambulance services – 50 per cent cut to ambulance membership feesFunding is provided to halve the cost of ambulance membership subscription fees to provide more affordable access to ambulance services for Victorians. Funding to Ambulance Victoria will be increased from the start of the 2011-12 financial year to cover the cost of a 50 per cent reduction in membership fees. The cost of an annual family membership of Ambulance Victoria will be reduced from $150 to $75 and singles will pay $37.50 a year instead of $75. The measure will cover both new memberships and renewals of existing memberships. This initiative contributes to the Department of Health’s: Ambulance Emergency Service output; and Ambulance Non-Emergency Services output.
Housing affordability
50 per cent Land Transfer Duty concession for first homebuyers of properties valued up to $600 000Land Transfer Duty rates will be reduced for eligible first homebuyers purchasing principal places of residence valued up to $600 000. Land Transfer Duty will be cut by 20 per cent in 2011-12, and followed by additional 10 per cent cuts on 1 January 2013, 1 January 2014 and 1 September 2014, totalling a cumulative 50 per cent reduction by 2014-15.
124 Chapter 1 Service Delivery 2011-12

Extend Land Transfer Duty relief for eligible seniors The current pensioners and concession card holders Land Transfer Duty concession threshold will be extended from $440 000 to $750 000 from 1 July 2011, and the concession will be made available to self funded retirees who hold a Commonwealth Seniors Health Card. Eligible pensioners and concession card holders will continue to receive a full Land Transfer Duty exemption for residential properties valued up to $330 000 which are purchased as their principal place of residence.Land Transfer Duty concession for farmers under 35 years of age From 1 July 2011, young farmers aged under 35 buying their first farmland property will receive a Land Transfer Duty exemption on farmland purchases valued up to $300 000. In addition, a concession applies for farmland properties between $300 000 and $400 000.
Reducing the financial burden on small business
Liquor licence fee reductionThe Government is committed to reducing liquor licensing fees to help ease the financial burden on small businesses and community clubs across Victoria that pose a low risk to the community in relation to alcohol related violence.
SAVINGS INITIATIVES($ million)
2010-11 2011-12 2012-13 2013-14 2014-15 5 Yr Total Funding Approved
Reduction of ministerial staff - 3.5 - 7.2 - 7.4 - 7.6 - 7.8 - 33.5Media and marketing positions - 9.0 - 18.5 - 19.0 - 19.4 - 19.9 - 85.8Consultants - 19.3 - 39.9 - 40.9 - 41.9 - 43.0 - 185.0Government advertising - 26.7 - 55.0 - 56.4 - 57.8 - 59.1 - 255.0Political opinion polling - 0.1 - 0.2 - 0.2 - 0.2 - 0.3 - 1.0External legal advice - 7.3 - 15.0 - 15.4 - 15.8 - 16.1 - 69.6Senior public service travel - 0.3 - 0.5 - 0.5 - 0.5 - 0.5 - 2.3Government office floor space .. 0.6 - 10.9 - 11.2 - 11.5 - 33.0Supplies and consumables - 74.1 - 157.3 - 160.0 - 163.6 - 167.3 - 722.3Promoting shared services - 9.5 - 9.8 - 10.0 - 10.3 - 10.6 - 50.2Capping head office staff - 13.8 - 28.2 - 28.9 - 29.7 - 30.4 - 131.0Total election commitment savings - 163.6 - 331.0 - 349.6 - 358.0 - 366.5 -1 568.7Source: Department of Treasury and Finance
Government election commitment savingsThe Government will implement a range of efficiencies across all government departments. Over five years, this will generate $1.569 billion in savings, helping Government deliver its election commitments and other initiatives funded in the 2011-12 Budget.
Service Delivery 2011-12 Chapter 1 125
CHAPTER 2 – OTHER OUTPUT, ASSET INVESTMENT AND REVENUE INITIATIVES
Chapter 2 provides information on all other output, asset investment and revenue initiatives, approved by the Government in addition to election commitments. This includes funding for new and existing programs that will meet current and future service needs. Funding for a number of initiatives was due to end on 30 June 2011 following the decisions of the previous government. The Government has allocated further funding to these programs to ensure that important services continue to be delivered to the community. Government-wide initiatives are shown first including the Government’s flood response. This is followed by departmental initiatives including descriptions and the associated departmental output(s). Revenue initiatives are presented at the end of the chapter.This chapter incorporates the total impact of election commitments and significant new policy measures, totalling $7.07 billion across the five years from 2010-11 to 2014-15, of which $1.88 billion has been provided in 2011-12. The chapter also includes total estimated investment (TEI) funding of $1.67 billion for election commitments assets and other new asset investments.
Service Delivery 2011-12 Chapter 2 127

GOVERNMENT-WIDE INITIATIVESThe Government-wide output and asset investment initiatives include the Government’s flood response initiatives. Government-wide funding is also shown in each departmental funding table.
Output initiatives($ million)2010-11 2011-12 2012-13 2013-14 2014-15
Flood responseApprenticeship Retention Program 0.5 0.5 .. .. ..Assistance to early childhood providers and
families 0.3 .. .. .. ..
Business Flood Recovery Fund .. 7.0 3.0 .. ..Business and industry assistance package 0.8 0.8 .. .. ..Catchment Management Authority flood
employment program 2.0 4.2 .. .. ..
Charlton Hospital 1.0 .. .. .. ..Charlton Primary Health Care Clinic 1.4 .. .. .. ..Community Recovery Fund 4.0 .. .. .. ..Disease Control 0.7 .. .. .. ..Emergency service organisation response and
recovery costs 5.6 .. .. .. ..
Exceptional disaster assistance for primary producers, small and medium businesses
6.0 10.9 7.4 5.2 5.0
Floods Business Recovery Program (Business Mentoring)
0.5 0.2 .. .. ..
Flood recovery community infrastructure fund
.. 30.0 .. .. ..
Flood recovery officers 1.4 .. .. .. ..Flood response and recovery 5.8 3.9 .. .. ..Flood recovery and repair on public land .. 4.6 .. .. ..Flood response support activity 3.9 .. .. ..Flood warning network – repair and
improvement 1.6 1.3 2.4 2.5 2.3
Goulburn-Murray irrigation district flood recovery and floodplain restoration
.. 6.9 .. .. ..
Health and wellbeing .. 0.5 0.3 .. ..Interim Accommodation Plan 2.2 0.1 .. .. ..Local government clean up fund 5.0 .. .. .. ..Lower Loddon floodplain and groundwater
bore works.. 3.4 .. .. ..
Psychosocial Support Package – Department of Health
1.1 1.4 .. .. ..
Psychosocial Support Package – Department of Human Services
0.6 1.9 .. .. ..
Regional recovery coordination 0.9 0.7 .. .. ..Regional tourism long-term flood recovery
package.. 1.5 .. .. ..
Repair of flood damage to arterial roads 42.5 79.0 .. .. ..Repair of flood damage to the regional rail
network 3.3 17.1 .. .. ..
128 Chapter 2 Service Delivery 2011-12

2010-11 2011-12 2012-13 2013-14 2014-15Repair of Wilsons Promontory entrance road
leading to Tidal River 6.0 .. .. .. ..
Restoring and reopening Victoria’s parks 1.7 12.8 .. .. ..Rural coordination officers 0.3 0.3 .. .. ..Rural financial counsellors .. 1.4 2.0 .. ..Tourism fund 1.0 .. .. .. ..Victorian Flood Appeal donation 1.0 .. .. .. ..Victorian State Emergency Service response
and recovery costs 7.0 .. .. .. ..
Whole of government communications 0.3 0.2 .. .. ..Total output initiatives 108.4 190.5 15.1 7.7 7.3Source: Department of Treasury and Finance
Flood response
Apprenticeship Retention ProgramFunding is provided to support apprentices employed in businesses located in flood affected areas and who derive the majority of their income from primary production or servicing primary producers.This initiative contributes to the Department of Primary Industries’ Sustainable Practice Change output.Assistance to early childhood providers and families Funding is provided to support kindergarten and maternal and child health services and families with children at kindergarten. Grants of up to $10 000 will be provided to services that are not eligible for other government grants to offset costs not covered by insurance. Funding is also provided to extend the kindergarten fee subsidy to families that have received emergency or disaster recovery grants.This initiative contributes to the Department of Education and Early Childhood Development’s Early Childhood Education and Care output.Business Flood Recovery FundFunding is provided to support regional companies with strong growth or investment potential in areas affected by the floods of 2010-11. Eligible businesses will be able to access grants to facilitate significant investment or growth opportunities to generate sustainable employment in flood affected areas.This initiative contributes to the Department of Planning and Community Development’s Regional Development and Regional Cities output.Business and industry assistance package Funding is provided for an assistance package to be administered by the Victorian Employers’ Chamber of Commerce and Industry. This package will provide relief for businesses that suffered a loss of trade due to the floods.
Service Delivery 2011-12 Chapter 2 129

This initiative contributes to the Department of Business and Innovation’s Small Business output.Catchment Management Authority flood employment programFunding is provided to establish a program providing local employment to skilled people who have lost their employment on flood affected farms. Undertaken by Catchment Management Authorities, the program will accelerate the repair of river bank fencing, and the restoration of waterways. This initiative contributes to the Department of Sustainability and Environment’s Natural Resources output.Charlton HospitalFunding is provided for the relocation of all bed based services to other health services in the area due to the Charlton Hospital sustaining major damage. This initiative also provides funding for Charlton Hospital staff transition and redeployment arrangements. Refer to asset initiative for Charlton Hospital. This initiative contributes to the Department of Health’s Admitted Services output.Charlton Primary Health Care ClinicFunding is provided to establish and operate a primary health care clinic in Charlton to operate as a temporary base for health practitioners in the area, following flood damage to the Charlton Hospital.This initiative contributes to the Department of Health’s Admitted Services output.Community Recovery FundFunding is provided to assist local councils and community organisations to meet costs associated with repairing or replacing flood-damaged essential community infrastructure and to restore social networks.This initiative contributes to the Department of Planning and Community Development’s Regional Development and Regional Cities output.Disease controlFunding is provided for surveillance and control programs in flood affected areas to reduce the risk of mosquito-related diseases, including Ross River Fever, Barmah Forrest Virus and Murray Valley Encephalitis Virus. This initiative contributes to the Department of Health’s Health Protection output.
130 Chapter 2 Service Delivery 2011-12
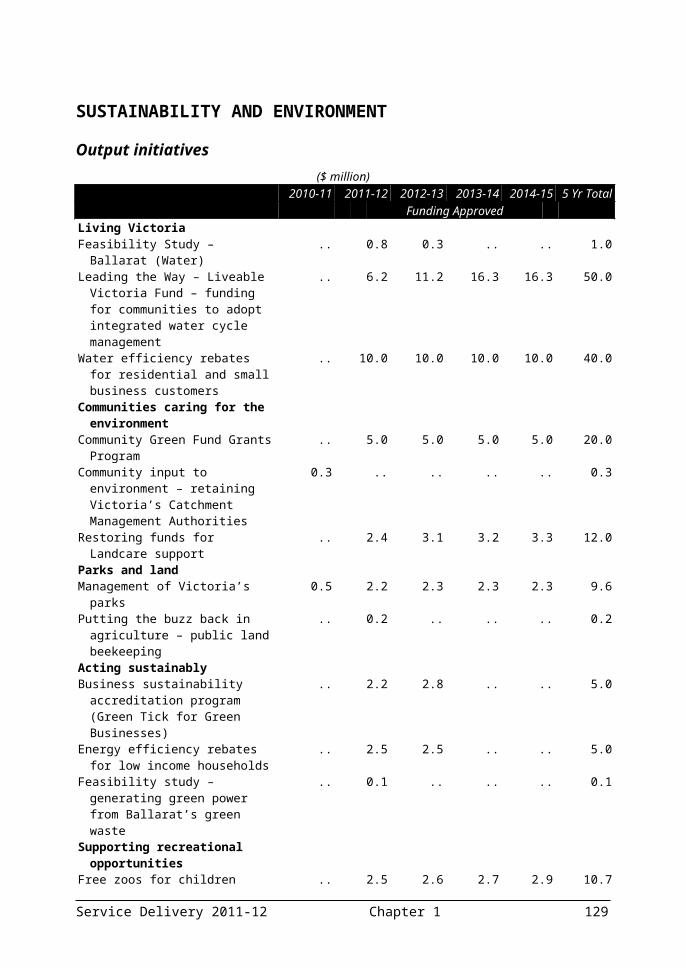
Emergency service organisation response and recovery costsFunding is provided to emergency service organisations and departments to recover the additional costs of responding to the Victorian floods. This includes costs related to the Country Fire Authority, interstate emergency service assistance, the Metropolitan Fire and Emergency Services Board, the Emergency Services Telecommunications Authority, the Department of Sustainability and Environment, the State Aircraft Unit, and the Office of the Emergency Services Commissioner.This initiative contributes to the Department of Justice’s Emergency Management Capability output. Exceptional disaster assistance for primary producers, small and medium businessesFunding is provided for grants (up to $50 000) and concessional loans (up to $600 000) that will be made available to primary producers, small and medium businesses, and not-for-profit organisations to assist with flood recovery in areas of extreme damage. This initiative contributes to the Department of Treasury and Finance’s Economic and Financial Policy output. Floods Business Recovery Program (Business Mentoring) Funding is provided for a business recovery program that offers mentoring services from a panel of business advisers to businesses that have been affected by the floods.This initiative contributes to the Department of Business and Innovation’s Small Business output.Flood recovery community infrastructure fund Funding is provided to develop a program of community asset rebuilding to restore damage resulting from the floods. This includes assets managed by councils and community groups such as public halls, sporting clubrooms, sports grounds, caravan parks, and historic buildings. This initiative contributes to the Department of Sustainability and Environment’s Sustainable Public Land output and the Department of Planning and Community Development’s Regional Development and Regional Cities output.Flood recovery officersFunding is provided to engage provisional flood recovery officers to assist local councils to recover from flood damage and to progress business recovery and community engagement activities.This initiative contributes to the Department of Planning and Community Development’s Regional Development and Regional Cities output.
Service Delivery 2011-12 Chapter 2 131
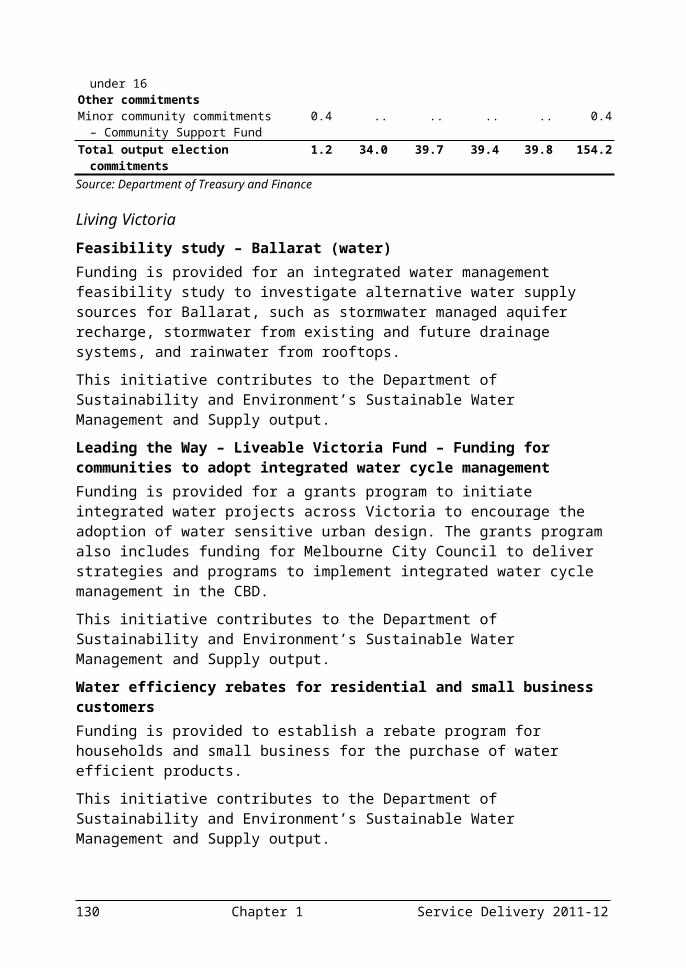
Flood response and recoveryFunding is provided to reimburse the Department of Primary Industries for emergency response activities undertaken during the floods and to deliver recovery services to flood-affected farmers. This initiative contributes to the Department of Primary Industries’ Sustainable Practice Change output. Flood recovery and repair on public landFunding is provided for the recovery and repair costs to public land assets. This includes damage to roads and bridges that ensure safe access for emergency vehicles, recreational sites and visitor facilities in State Forests, and damage to ecological habitats such as rivers and wetlands. This initiative contributes to the Department of Sustainability and Environment’s: Public Land output; and Land and Fire Management output. Flood response support activity Funding is provided in 2010-11 to reimburse the Department of Sustainability and Environment for additional costs incurred in supporting the response to the floods. These included deployment of staff to base camps to undertake field recovery works, plant and equipment required to undertake emergency response, and additional aerial surveillance costs.This initiative contributes to the Department of Sustainability and Environment’s Land and Fire Management output. Flood warning network – repair and improvementFunding is provided to repair and restore parts of Victoria’s flood warning network that was damaged in the floods, and to improve it by developing a web based, computer generated flood intelligence platform that will simulate and depict flood behaviour in geographical information systems format. This will allow for a more effective emergency response to floods for a greater number of communities across the State. This initiative contributes to the Department of Sustainability and Environment’s Sustainable Water Management and Supply output. Goulburn-Murray irrigation district flood recovery and floodplain restorationFunding is provided to assist irrigators in the Goulburn-Murray Irrigation District affected by the floods, and ensure their recovery decisions are integrated with irrigation modernisation objectives. The program includes case management, farm planning services and grants to irrigators in the region. In order to reduce the impact of future
132 Chapter 2 Service Delivery 2011-12

flooding events, a program of floodplain reinstatement will be undertaken including land acquisition and resale. This initiative contributes to the Department of Sustainability and Environment’s Sustainable Water Management and Supply output. Health and wellbeingFunding is provided for the delivery of the Sustainable Farm Families program which will provide additional health and wellbeing support to farmers and producers.This initiative contributes to the Department of Primary Industries’ Sustainable Practice Change output.Interim Accommodation PlanFunding is provided to provide interim accommodation to households in need of medium to longer term housing while their homes are repaired following the floods. This initiative contributes to the Department of Human Services’ Concessions to Pensioners and Beneficiaries output.Local government clean up fundFunding is provided to assist local councils to meet costs associated with providing first response services to flood-affected communities. This initiative will also support the restoration of streetscapes, tipping and waste disposal, provision of emergency livestock feed, recovery of stray livestock and business and tourism support.This initiative contributes to the Department of Planning and Community Development’s Local Government output.Lower Loddon floodplain and groundwater bore works Funding is provided to respond to water inundation in the lower Loddon floodplain including emergency pumping and levee repair works. Funding is also provided to repair water damage to infrastructure across the State’s groundwater monitoring bore network. This initiative contributes to the Department of Sustainability and Environment’s Sustainable Water Management and Supply output. Psychosocial Support Package – Department of HealthFunding is provided for a range of psychosocial support measures to be delivered across communities affected by the floods. The measures include generalist counselling, case work support (service coordination), outreach support and community forums for community capacity building and resilienceThis initiative contributes to Department of Health’s Clinical Care output.
Service Delivery 2011-12 Chapter 2 133

Psychosocial Support Package – Department of Human ServicesRefer to Psychosocial Support Package – Department of Health for a description of this initiative.This initiative contributes to the Department of Human Services’ Concessions to Pensioners and Beneficiaries output.Regional recovery coordinationFunding is provided to support the management of a range of flood relief and recovery services, such as regional recovery managers, and major grants officers in the Loddon Mallee, Grampians and Southern Metropolitan areas.This initiative contributes to the Department of Human Services’ Concessions to Pensioners and Beneficiaries output.Regional tourism long-term flood recovery package Funding is provided for medium-term marketing activities to assist the flood affected regional tourism industry. The initiative includes destination marketing, branding and event development with a focus on the Murray and Grampians areas. This initiative contributes to the Department of Business and Innovation’s Tourism output.Repair of flood damage to arterial roadsFunding is provided for the repair of Victoria’s arterial roads and bridges that were damaged in the floods. This includes funding for the short-term management of the Morwell Princes Highway. This initiative contributes to the Department of Transport’s Road Assets Management output.Repair of flood damage to the regional rail networkFunding is provided for the repair of Victoria’s regional rail network that was damaged in the floods. This includes funding for damage on the lines between Ballarat and Ararat and Ballarat and Maryborough and at Arnold, Teddywaddy and Charlton. This initiative contributes to the Department of Transport’s: Rural and Regional Public Transport Services output; and Freight, Logistics, Ports and Marine Development output.Repair of Wilsons Promontory entrance road leading to Tidal RiverFunding is provided for the repair of the Wilsons Promontory entrance road leading to Tidal River which was damaged during March 2011. This initiative contributes to the Department of Transport’s Road Assets Management output.
134 Chapter 2 Service Delivery 2011-12
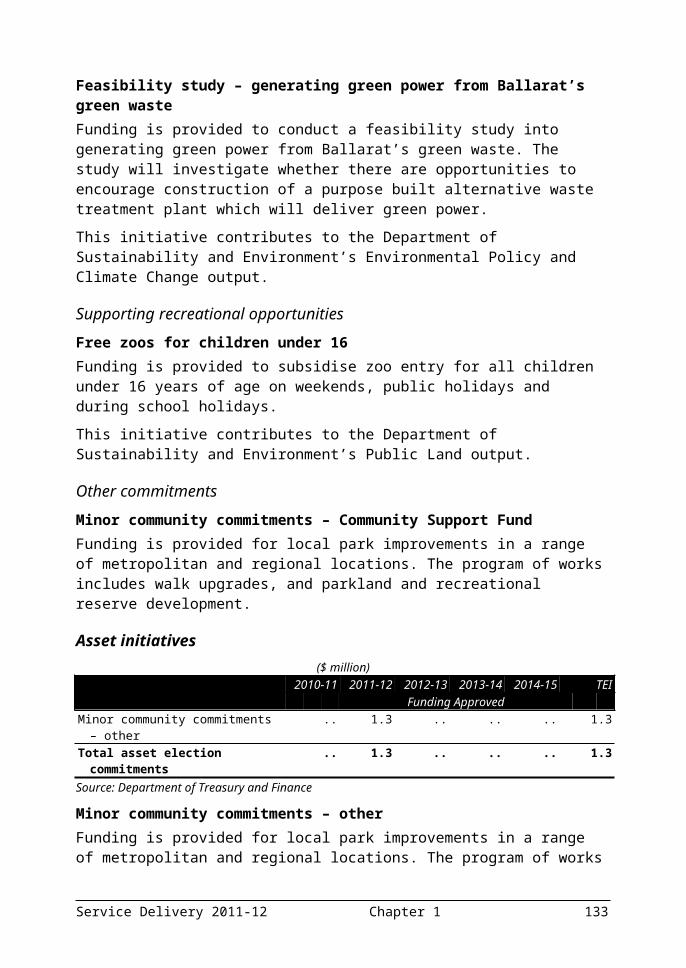
Restoring and reopening Victoria’s parks Funding is provided for the recovery and repair costs at national and regional parks. Damage to Parks Victoria assets included: roads, tracks and crossings, visitor facilities, dams and natural habitats including the stabilisation of rivers, landslips and trees. Funding provided was to ensure Wilsons Promontory National Park reopened prior to the Easter holiday period. This initiative contributes to the Department of Sustainability and Environment’s Forests and Parks output. Rural coordination officers Funding is provided for the engagement of up to nine rural coordination officers for six months to assist in addressing rural issues relating to floods including the coordination of volunteers.This initiative contributes to the Department of Primary Industries’ Sustainable Practice Change output.Rural financial counsellorsFunding is provided for the provision of rural financial counselling services to farmers to provide advice and support to assist flood-affected farmers in making informed decisions about their future.This initiative contributes to the Department of Primary Industries’ Sustainable Practice Change output.Tourism fund Funding is provided to establish a Tourism fund to support businesses in areas affected by the floods that are heavily dependent on tourism. This initiative contributes to the Department of Business and Innovation’s Tourism output.Victorian Flood Appeal donationThe State Government has donated $1 million to the Red Cross Victorian Flood Appeal Fund.This initiative contributes to the Department of Human Services’ Concessions to Pensioners and Beneficiaries output.Victorian State Emergency Service response and recovery costsFunding is provided for the recovery costs incurred by Victorian State Emergency Service in responding to the Victorian floods. This includes purchase and replenishment of operational clothing and equipment, additional operating costs including overtime, accommodation and travel for staff and volunteers, aircraft costs, flood intelligence and community warnings and information. This initiative contributes to the Department of Justice’s Emergency Management Capability output.
Service Delivery 2011-12 Chapter 2 135

Whole of government communicationsFunding is provided to ensure that consistent and comprehensive information is provided to flood-affected communities about available flood assistance and to facilitate access to programs and services. Communications will include printed materials, radio advertising and community events.This initiative contributes to the Department of Human Services’ Concessions to Pensioners and Beneficiaries output.
Asset initiatives($ million)
2010-11 2011-12 2012-13 2013-14 2014-15 TEICharlton Hospital 0.2 0.9 .. .. .. 1.0Flood recovery and repair on public land .. 29.4 .. .. .. 29.4Flood warning network – repair and
improvement 5.3 .. 1.4 1.4 1.1 9.2
Goulburn-Murray irrigation district flood recovery and floodplain restoration
.. 10.6 .. .. .. 10.6
Lower Loddon floodplain and groundwater bore works
.. 1.7 .. .. .. 1.7
Restoring and reopening Victoria’s Parks 9.3 36.4 .. .. .. 45.7Total asset investments 14.7 79.0 1.4 1.4 1.1 97.5Source: Department of Treasury and Finance
Charlton Hospital Funding is provided to commence planning for replacement hospital facilities at Charlton, including potential land acquisition to avoid the risk of future flood inundation.This initiative contributes to the Department of Health’s Admitted Services output.Flood recovery and repair on public landRefer to the output initiative for a description of the initiative.Flood Warning network – repair and improvementRefer to the output initiative for a description of the initiative.Goulburn-Murray irrigation district flood recovery and floodplain restorationRefer to the output initiative for a description of the initiative.Lower Loddon floodplain and groundwater bore works Refer to the output initiative for a description of the initiative.Restoring and reopening Victoria’s parks Refer to the output initiative for a description of the initiative.
136 Chapter 2 Service Delivery 2011-12
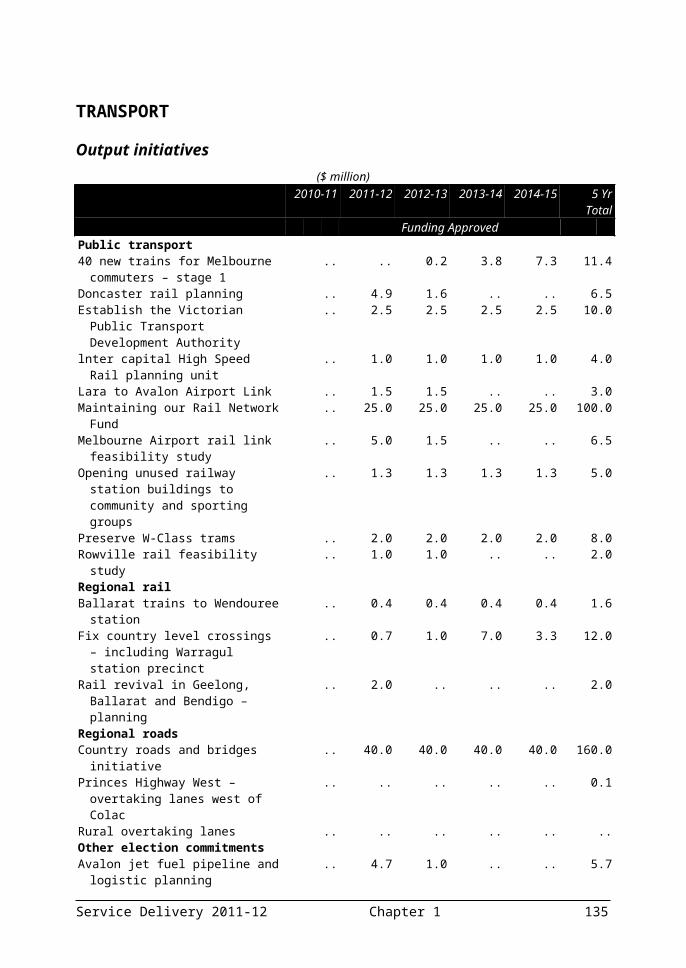
DEPARTMENTAL INITIATIVES
BUSINESS AND INNOVATION
Output initiatives($ million)
2010-11 2011-12 2012-13 2013-14 2014-15Industries and innovationBusiness Victoria Online .. 9.6 .. .. ..Industry Capability Network .. 1.4 1.4 1.5 1.5Olivia Newton-John Cancer and Wellness
Centre – Stage 2b.. 1.5 11.4 .. ..
Victorian Small Business Commissioner .. 2.4 2.5 2.5 2.6Investment and tradeExport Victoria .. 3.1 3.1 3.1 3.1Investment Support Program .. 17.2 .. .. ..Marketing VictoriaImprove skills and service standards .. 0.5 0.5 .. ..Regional tourism .. 0.5 0.5 .. ..Employment and industrial relationsEmployment Start Up .. 2.2 2.2 2.2 2.2Sub-total output initiatives .. 38.4 21.6 9.3 9.4Election commitments 0.4 11.8 9.9 8.6 8.4Government-wide initiatives 2.3 2.4 .. .. ..Election commitment savings - 6.5 - 13.4 - 13.7 - 14.0 - 14.4Measures to offset the GST reduction .. - 10.6 - 9.7 - 10.3 - 13.7Total output initiatives -3.9 28.6 8.1 -6.4 -10.3Source: Department of Treasury and Finance
Industries and innovation
Business Victoria Online Funding is provided for the continued operation of Business Victoria Online. Business Victoria Online provides services for over 100 agencies and local councils, and delivers benefits by reducing regulatory burden and facilitating business productivity. The program will be reviewed to determine the viability of transforming Business Victoria Online into a commercial or not-for-profit entity, and any potential to combine it with other government portals.This initiative contributes to the Department of Business and Innovation’s Small Business output.Industry Capability Network Funding is provided to continue the Industry Capability Network to deliver a range of programs designed to encourage and facilitate import replacement and local sourcing activities.
Service Delivery 2011-12 Chapter 2 137
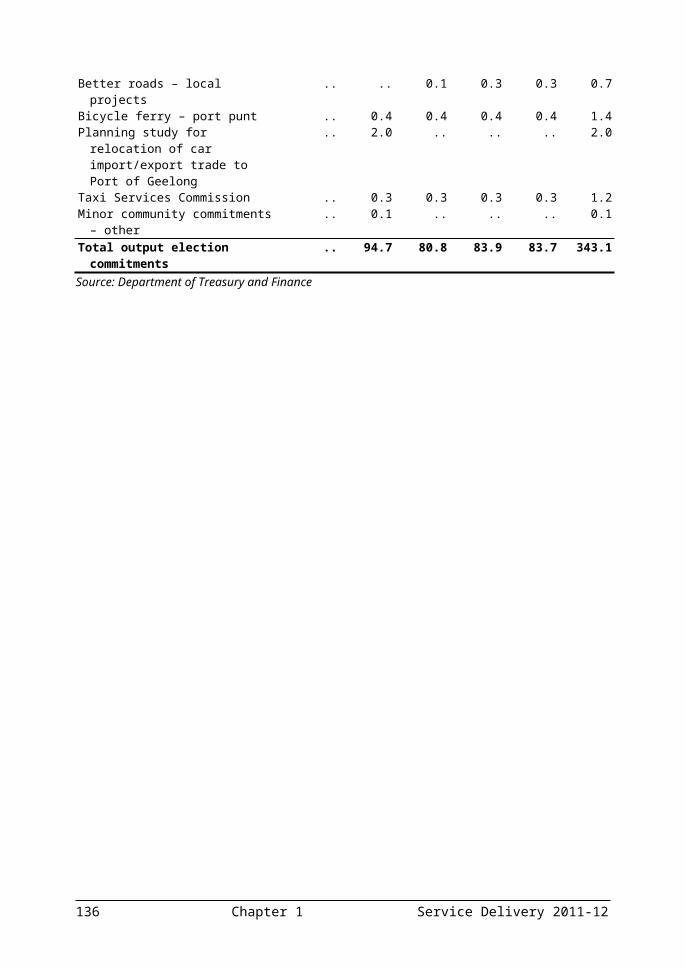
This initiative contributes to the Department of Business and Innovation’s: Exports output; and Sector Development output. Olivia Newton-John Cancer and Wellness Centre Stage 2b The Olivia Newton-John Cancer and Wellness Centre is a purpose built and dedicated cancer treatment centre located at the Austin Hospital. Funding is provided to fit out the research facility. This complements an asset initiative being undertaken by the Department of Health.This initiative contributes to the Department of Business and Innovation’s Science and Technology output.Victorian Small Business Commissioner Funding is provided to enable the Office of the Victorian Small Business Commissioner to continue to fulfil its legislated functions by providing Victorian small businesses with practical support and access to a means of resolving disputes quickly and at low cost.This initiative contributes to the Department of Business and Innovation’s Small Business output.
Investment and trade
Export Victoria Funding is provided to boost a range of initiatives aimed at increasing Victoria’s exports into new and growing markets, promoting Victoria’s export strengths and ensuring Victorian industry has the necessary information to capture new export opportunities. This initiative includes the Government election commitment of an additional $2 million over four years.This initiative contributes to the Department of Business and Innovation’s Exports output.Investment Support Program Funding is provided to continue the Investment Support Program to attract investment projects to Victoria that have a demonstrable net economic benefit to the State. The Investment Support Program will be the subject of a detailed evaluation to determine the most effective method to support investment in Victoria. This program was a commitment of the previous government for which sufficient funding had not been allocated. This initiative contributes to the Department of Business and Innovation’s Investment Attraction and Facilitation output.
138 Chapter 2 Service Delivery 2011-12

Marketing Victoria
Improve skills and service standards Funding is provided to continue to improve skills and service standards in the tourism industry through support of the Tourism Excellence Program, and support for regional tourist operators to embrace the potential of the internet.This initiative contributes to the Department of Business and Innovation Tourism’s output. Regional tourism Funding is provided to continue the support of Victoria’s competitive position as a premier food and wine destination and for a range of key events and activities that encourage visitors to regional Victoria.This initiative contributes to the Department of Business and Innovation’s Tourism output.
Employment and industrial relations
Employment Start Up Funding is provided for Employment Start Up programs to better identify and target those skilled migrants needed by business to fill current and emerging workforce gaps. This initiative is part of a program redesign to strengthen and streamline employment services provided by the Government.This initiative contributes to the Department of Business and Innovation’s Employment and Industrial Relations output.
Asset initiatives Nil
Service Delivery 2011-12 Chapter 2 139

EDUCATION AND EARLY CHILDHOOD DEVELOPMENT
Output initiatives($ million)
2010-11 2011-12 2012-13 2013-14 2014-15Early Childhood KindergartenEarly Childhood Intervention Services .. 2.0 2.0 2.1 2.1Kindergarten cluster management .. 2.2 2.2 2.3 2.3Kindergarten cluster management – additional
160 locations.. 1.3 1.3 1.3 1.4
Kindergarten fee subsidy 0.5 9.8 10.1 10.4 10.6Support for parents in the early yearsMaternal and child health line .. 0.9 0.9 0.9 1.0Victorian Branch of Australian Breastfeeding
Association .. .. 0.1 0.1 0.1
SchoolingInvesting in specialist teachingCommunity languages schools .. 0.8 0.8 0.8 0.8Vocational Education and Training in Schools .. 7.9 8.1 8.3 8.5Boosted support for vulnerable young peopleProgram for Students with Disabilities .. 18.6 38.1 39.0 40.0Program for Students with Disabilities
(increased funding to meet demand).. 1.4 6.2 6.3 6.5
Targeting the School Start Bonus .. 12.4 12.6 12.8 13.0Safe and Healthy schoolsFree Fruit Friday .. 3.5 .. .. ..Primary welfare officers .. 12.5 .. .. ..SkillsSupporting apprenticeship completions .. 22.5 15.5 9.2 8.1Sub-total output initiatives 0.5 95.5 97.9 93.5 94.4Election commitments 64.6 134.3 145.6 147.5 147.4Government-wide initiatives 0.3 .. .. .. ..Election commitment savings - 34.0 - 68.3 - 69.7 - 71.4 - 73.1Measures to offset the GST reduction .. - 27.3 - 46.6 - 44.0 - 46.7Total output initiatives 31.4 134.2 127.2 125.6 122.0Source: Department of Treasury and Finance
Early childhood
Kindergarten
Early Childhood Intervention Services Funding is provided to continue 150 Early Childhood Intervention Services places and 150 flexible support packages. Early Childhood Intervention Services places provide services including special education, therapy, counselling, service planning and coordination. Flexible support packages complement Early Childhood Intervention Services places by providing time limited support for children with a disability or developmental delay and complex needs.
140 Chapter 2 Service Delivery 2011-12

This initiative contributes to the Department of Education and Early Childhood Development’s Early Childhood Intervention Services output. Kindergarten cluster management Funding is provided to continue kindergarten cluster management for up to 700 kindergarten service locations. This initiative contributes to the Department of Education and Early Childhood Development’s Early Childhood Education and Care output.Kindergarten cluster management – additional 160 locationsFunding is provided to expand the kindergarten cluster management program up to an additional 160 locations. This initiative will enable the number of service locations managed in clusters to be expanded to 860 locations, or two-thirds of the community-based services in the State. Kindergarten cluster management provides centralised administration and management services for multiple kindergarten centres in any given area. By relieving these burdens kindergarten services are able to concentrate on the provision of high quality services to children. This initiative contributes to the Department of Education and Early Childhood Development’s Early Childhood Education and Care output.Kindergarten fee subsidy Funding is provided to continue the increased kindergarten fee subsidy, which makes kindergarten free for eligible low-income families. Around 18 300 families are currently eligible for the subsidy, which is designed to increase the affordability and accessibility of services. More broadly any additional kindergarten enrolments will be funded through enrolment-based funding mechanisms once actual enrolment numbers for 2011 are known, with additional funding to be published in the 2011-12 Budget Update. This initiative contributes to the Department of Education and Early Childhood Development’s Early Childhood Education and Care output.
Support for parents in the early years
Maternal and child health line Funding is provided to continue the maternal and child health line. The maternal and child health line is a 24-hour telephone service that provides advice, support and referrals for families with young children. This initiative will maintain the maternal and child health line’s capacity to answer more than 100 000 calls a year. This initiative contributes to the Department of Education and Early Childhood Development’s Child Health and Support Services output.
Service Delivery 2011-12 Chapter 2 141

Victorian Branch of the Australian Breastfeeding Association Funding is provided to continue funding for the Victorian Branch of the Australian Breastfeeding Association, which seeks to educate the community about the health benefits and importance of breastfeeding for the infant, mother and the family. This funding supports Australian Breastfeeding Association volunteers in rural Victoria.This initiative contributes to the Department of Education and Early Childhood Development’s Child Health and Support Services output.
Schooling
Investing in specialist teaching
Community languages schools Funding is provided to maintain an increase in the per capita rate from $100 to $120 for the community languages schools (formerly known as the after hours ethnic schools) program, for which funding was due to cease at the end of 2010-11. The expansion in languages education election commitment raises the per capita grant further to $190.This initiative contributes to the Department of Education and Early Childhood Development’s: Early Years (schools) output; Middle Years (schools) output; and Later Years and Transitions output.Vocational Education and Training in Schools Funding is provided to continue access for government school students to Vocational Education and Training in Schools subjects. Vocational Education and Training in Schools gives young Victorians increased choices for the future and supports young Victorians completing Year 12 or equivalent by providing access for students to nationally accredited vocational subjects as part of their Victorian Certificate of Education and Victorian Certificate of Applied Learning programs. This initiative contributes to the Department of Education and Early Childhood Development’s Later Years and Youth Transitions output.
Boosted support for vulnerable young people
The Government will undertake the following initiatives to support vulnerable Victorians in the context of Victoria’s constrained financial and budget circumstances. These initiatives align with major investments in election commitment output and asset investments funded in the current budget to ensure vulnerable Victorians in government schools are supported.
142 Chapter 2 Service Delivery 2011-12

Program for Students with Disabilities Funding is provided to meet projected 2011 enrolment growth levels in the Program for Students with Disabilities, which was originally funded for 18 months in the 2010-11 Budget. This initiative contributes to the Department of Education and Early Childhood Development’s Services to Students output. Program for Students with Disabilities (increased funding to meet demand) Funding is provided to address growing demand for the Program for Students with Disabilities. Funding for this initiative will guarantee growing numbers of students can access the Program for Students with Disabilities, including extra funding to special and mainstream schools to provide increased resources for students with disabilities. This initiative provides ongoing funding to meet projected growth in 2012. This initiative contributes to the Department of Education and Early Childhood Development’s Services to Students output. Targeting the School Start Bonus Funding is provided to restart the School Start Bonus, which will now be better targeted to provide assistance to those families most in need. Funding will assist eligible families of Prep and Year 7 students to meet the costs of sending their child to school. Eligibility for the payment will be based on eligibility for the Education Maintenance Allowance. This initiative contributes to the Department of Education and Early Childhood Development’s Services to Students output.
Safe and healthy schools
The Government will undertake the following initiatives to address rising instances of anti-social behaviour, behavioural, welfare and health problems as well as disengagement from education among younger Victorians.Free Fruit FridayFunding is provided for an additional year of the Free Fruit Friday program, which gives free fruit and vegetables each week to Prep to Year 2 students in government schools. An evaluation of the program’s effectiveness will be undertaken prior to the 2012-13 budget process.This initiative contributes to the Department of Education and Early Childhood Development’s Services to Students output.Primary welfare officers Funding is provided to continue the employment of 256 primary school welfare officers for the final six months of the 2011 school year. Funding for continuation of the initiative beyond 2011 is outlined in
Service Delivery 2011-12 Chapter 2 143

Chapter 1. Primary school welfare officers develop and implement wellbeing strategies at the whole of school level as well as supporting students with behavioural, mental health and welfare problems.This initiative contributes to the Department of Education and Early Childhood Development’s Services to Students output.
Skills
Supporting apprenticeship completions Funding is provided for bonus payments to employers who support apprentices and trainees to complete their training, including an Early Completion Bonus payable to any employer whose apprentice completes their training more than six months early. Payment of the bonuses will be phased out, although employers of eligible apprentices/trainees who started their apprenticeship/traineeship before 30 June 2011 will remain eligible. This initiative contributes to the Department of Education and Early Childhood Development’s Skills output.
144 Chapter 2 Service Delivery 2011-12

Asset initiatives($ million)
2010-11 2011-12 2012-13 2013-14 2014-15 TEIBoosted support for vulnerable young peopleSpecial and autistic school capital
investment .. 17.5 23.0 .. .. 40.5
Planning school facilities to meet population growthNew school construction and land
acquisition.. 34.5 21.3 .. .. 55.8
School upgrade .. 6.2 13.8 .. .. 20.0Investing in skills for economic growthChisholm Institute of TAFE – Berwick
Trade Careers Centre.. 0.5 8.5 11.0 2.0 22.0
East Gippsland Institute of TAFE – Port of Sale education precinct – planning
.. 1.0 0.5 .. .. 1.5
Gordon Institute of TAFE – Centre for Biotechnology, Sustainability and Living Well – planning
.. 1.0 1.0 .. .. 2.0
TAFE Institute specialist teaching equipment .. 9.5 .. .. .. 9.5Sub-total asset initiatives .. 70.2 68.1 11.0 2.0 151.3Election commitments .. 29.6 61.0 1.1 .. 91.7Government-wide initiatives .. .. .. .. .. ..Total asset initiatives .. 99.8 129.1 12.1 2.0 243.0Source: Department of Treasury and Finance
Boosted support for vulnerable young people
The Government will undertake the following initiatives to support vulnerable Victorians in the context of Victoria’s constrained financial and budget circumstances. These initiatives align with major investments in election commitment output and asset investments funded in the current budget to ensure vulnerable Victorians in government schools are supported.Special and autistic school capital investmentFunding under this asset investment initiative will generate the largest single year commitment to capital works in special and autistic schools in over a decade. Special and autistic schools in the northern, western and eastern metropolitan regions and across regional Victoria will receive funding for major and minor capital works.Funding under this initiative complements election commitments also provided in 2011-12 for new and upgraded special schools at Officer, Wodonga, Yarrabah, Nepean and the Western Autistic School.Funding under this initiative will allow the Government to continue a number of existing regeneration works. Schools to receive funding under this initiative include: Broadmeadows Special Development School – regeneration; Horsham Special School – regeneration;
Service Delivery 2011-12 Chapter 2 145

Hume Valley School – regeneration; Eastern Autistic School (Wantirna Heights School) – modernisation; Northern School for Autism – modernisation; and Rosamond Special School – modernisation. This initiative contributes to the Department of Education and Early Childhood Development’s Services to Students output.
Planning school facilities to meet population growth
The Government will undertake the following initiatives to respond to growth in demand for education services in key areas.New school construction and land acquisitionFunding under this asset initiative will allow the government to meet urgent demand for new schools in Victoria’s major growth areas. Funding under this initiative complements election commitments for new school construction in Officer and Torquay.New school construction and land acquisition projects to be funded under this initiative are: Point Cook South-East P-9 – new school construction (stage 1); Tarneit Central P-9 – new school construction (stage 1); Torquay Primary School – land acquisition; Doreen Secondary School – land acquisition; Melton North West Primary School – land acquisition; Casey Central East Primary School – land acquisition; Officer Special School – land acquisition; and Torquay Secondary School – land acquisition. This initiative contributes to the Department of Education and Early Childhood Development’s: Early Years (schools) output; Middle Years (schools) output; and Later Years and Youth Transitions output.School upgradesFunding under this asset initiative will allow the Government to continue major capital works as part of existing school regeneration projects. Projects funded under this initiative have been identified as high priorities by the Department of Education and Early Childhood
146 Chapter 2 Service Delivery 2011-12

Development and form part of long-term education planning in areas of high need.The projects funded under this initiative are: Dandenong High School – regeneration; and Leongatha Secondary College – regeneration. This initiative contributes to the Department of Education and Early Childhood Development’s: Middle Years (schools) output; and Later Years and Youth Transitions output.
Investing in skills for economic growth
A highly skilled workforce is important to Victoria’s long-term economic productivity and the Government is investing in the following initiatives to provide Victoria with the skills needed to prosper in the global economy.Chisholm Institute of TAFE – Berwick Trade Careers CentreFunding is provided to construct a Trade Careers Centre at the Berwick Campus of Chisholm Institute of TAFE. This facility will accommodate a multi-trade building construction workshop, multifunction laboratories, bricklaying facility, and an industry seminar room. This initiative contributes to the Department of Education and Early Childhood Development’s Skills output.East Gippsland Institute of TAFE – Port of Sale education precinct – planningFunding is provided for the design and planning of the Port of Sale education precinct. Following settlement on the purchase of the site, this funding is provided to allow the project to proceed to tender documentation. The project involves relocating the Fulham campus of East Gippsland Institute of TAFE to the new site at the Port of Sale. This initiative contributes to the Department of Education and Early Childhood Development’s Skills output.Gordon Institute of TAFE – Centre for Biotechnology, Sustainability and Living Well – planningFunding is provided for the design, tendering and site preparation for planned major upgrades at the Geelong campus of the Gordon Institute of TAFE. The centre for Biotechnology, Sustainability and Living Well will accommodate classrooms, workshops and amenities for the faculties of Animal Studies, Nursing, Biotechnology and Pathology. This initiative contributes to the Department of Education and Early Childhood Development’s Skills output.
Service Delivery 2011-12 Chapter 2 147

TAFE institute specialist teaching equipment Funding is provided for TAFE institutes to purchase up-to-date teaching equipment which is aligned to industry standards. This will support TAFE institutes in meeting rapid technological changes and allow students to study on the equipment they will use in the work place. This initiative contributes to the Department of Education and Early Childhood Development’s Skills output.
148 Chapter 2 Service Delivery 2011-12

HEALTH
Output initiatives($ million)
2010-11 2011-12 2012-13 2013-14 2014-15Acute health services Hospital operations growth funding – including
800 new hospital beds election commitment.. 284.2 255.4 261.8 268.3
Neo-natal hearing screening .. 4.1 4.2 4.3 4.4Mental HealthExpansion of psychiatric disability
rehabilitation and support services for people with severe mental illness
.. 2.0 2.1 2.1 2.2
Expansion of specialist clinical community mental health
.. 6.5 6.6 6.8 7.0
Right time right care – network for carers .. 0.1 0.1 0.1 0.1Ageing, aged and home careAssist people with dementia .. 0.9 0.9 0.9 1.0Home and Community Care (HACC) .. 27.0 27.7 28.4 29.1Home and Community Care (HACC) matching .. 15.8 16.2 16.6 17.0Victorian Eyecare Service expansion .. 0.8 0.8 0.8 0.8Primary Community and Dental HealthDental program targeted to areas of high need .. 1.8 1.8 1.8 1.9Oral health capacity building .. 2.0 2.0 2.1 2.1Public healthHealthy Living Victoria – Life! Diabetes and
Cardiovascular Disease Prevention Program.. 5.3 5.5 5.6 5.8
National Partnership Agreement on Preventative Health – chronic disease prevention in Victoria
.. 18.2 33.1 15.2 12.5
Drug servicesAlcohol and other drug (AOD) services –
responding to growth in demand.. 0.9 0.9 0.9 1.0
Alcohol and other drug strategy – treatment services
.. 39.0 39.0 39.0 39.0
Sub-total output initiatives .. 408.4 396.3 386.5 392.1Election commitments 6.2 74.0 119.4 125.9 125.9Government-wide initiatives 4.2 1.4 .. .. ..Election commitment savings - 38.2 - 77.4 - 78.9 - 80.8 - 82.7Measures to offset the GST reduction .. - 37.9 - 28.8 - 28.3 - 28.9Total output initiatives - 27.9 368.6 408.0 403.3 406.4Source: Department of Treasury and Finance
Acute health services
Hospital operations growth funding – including 800 new hospital beds election commitmentFunding is provided to maintain and expand hospital activity including the implementation of elective surgery funding, addressing non-wage price factors, technology and innovation, and to commence the implementation of the Government’s commitment to provide 800 new hospital beds in the Government’s first term. The 2011-12 Budget will
Service Delivery 2011-12 Chapter 2 149

fund the first 100 beds of the Government’s bed growth commitment and additional services to local communities as well as address cost pressures being faced by hospitals and provide for more complex care. This initiative contributes to the Department of Health’s: Admitted Services output; Clinical Care output; Emergency Services output; Non-Admitted Services output; and Small Rural Services – Acute Health output.Neo-natal hearing screeningFunding is provided to continue neo-natal hearing screening tests in Victoria’s public hospitals. This funding will help hospitals to meet demand and provide an important service to families and new born babies.This initiative contributes to the Department of Health’s Admitted Services output.
Mental health
Expansion of psychiatric disability rehabilitation and support services for people with severe mental illness Funding is provided to increase the capacity of the Psychiatric Disability Rehabilitation and Support Service system to meet the growth in demand for proven models of intensive outreach support. This will provide services for clients with severe and enduring mental illness and high level psychiatric disability that have a history of entrenched homelessness or high risk of homelessness. This will be achieved by actively linking these clients to affordable, long-term housing options, tailored to the needs of the individual.This initiative contributes to the Department of Health’s Psychiatric Disability and Support Services output.Expansion of specialist clinical community mental health Funding is provided to targeted Mobile Support and Treatment, and Continuing Care Teams in Area Mental Health Services experiencing high and sustained demand pressures due to rapid population growth. Priority will be given to outer urban growth areas. Increasing access to these services will enable more people experiencing the first onset or relapse of an illness to access appropriate and timely clinical care.This initiative contributes to the Department of Health’s: Clinical Care output; and Psychiatric Disability and Support Services output.
150 Chapter 2 Service Delivery 2011-12

Right time right care – network for carersFunding is provided to continue investment in the Victorian Mental Health Carers Network. This network is the Victorian peak body representing organisations and individuals that support carers of people experiencing mental health issues. This initiative will enable the Victorian Mental Health Carers Network to continue its work to support improvements to the mental health service system.This initiative contributes to the Department of Health’s Clinical Care output.
Ageing, aged and home care
Assist people with dementia Funding is provided to support people with dementia and their families and carers to access cognitive dementia and memory services. This will provide early diagnosis and assessment of cognitive impairment and reduce waiting times for treatment. This initiative will also deliver innovative and creative respite and support for younger people with dementia and their families through the Support for Carers of People with Dementia Program and support dementia-friendly environments in public sector residential aged care services.This initiative contributes to the Department of Health’s Aged Support Services output.Home and Community Care (HACC) Continued funding is provided to support older people in the community through the Victorian Government’s continued contribution to Home and Community Care (HACC) services.This is a joint initiative between the Commonwealth and the State. Funding reported is the State component.This initiative contributes to the Department of Health’s HACC Primary Health, Community Care and Support output.Home and Community Care (HACC) matchingFunding is provided for additional HACC services to support older people in the community through the Government’s contribution to matching new Commonwealth funding for Home and Community Care services in Victoria.This is a joint initiative between the Commonwealth and the State. Funding reported is the State component.This initiative contributes to the Department of Health’s HACC Primary Health, Community Care and Support output.
Service Delivery 2011-12 Chapter 2 151

Victorian Eyecare Service expansion Funding is provided to maintain services at the Victorian Eyecare Service. This initiative will deliver 3 000 pairs of spectacles a year to disadvantaged Victorians, and over one thousand outreach services to residents of Supported Residential Services and public sector residential aged care services a year.This initiative contributes to the Department of Health’s Aged Support Service’s output.
Primary Community and Dental Health
Dental program targeted to areas of high need Funding is provided to enable treatment for 4 000 eligible clients a year who are waiting for dental care. This initiative will continue to be targeted to areas with long waiting times.This initiative contributes to the Department of Health’s Dental Services output
152 Chapter 2 Service Delivery 2011-12

Oral health capacity building Funding is provided for denture care to 1 500 seniors a year who are unable to pay for dentures and unable to access dental care in the public system due to long waiting lists. This will also support oral hygienists to provide services to more than 2 000 residents in pension-level Supported Residential Services across Victoria to improve their oral health.This initiative contributes to the Department of Health’s: Dental Services output; Aged Support Services output; and Health Protection output.
Public health
Healthy Living Victoria – Life! Diabetes and Cardiovascular Disease Prevention Program Funding is provided to deliver the Life! program aimed at individuals with a high risk of diabetes and cardiovascular disease. This program offers a six session course over eight months aimed at improving the participant’s physical activity and dietary habits over the long-term. The program also includes social marketing to increase community awareness of the importance of physical activity and dietary habits to reduce the risks of diabetes and cardiovascular disease.This initiative contributes to the Department of Health’s Health Advancement output.National Partnership Agreement on Preventative Health – chronic disease prevention in VictoriaThe National Partnership on Preventative Health will fund a range of measures aimed at promoting healthy behaviours and addressing lifestyle related chronic diseases. The funding provided will seek to reduce the prevalence of overweight people and obesity, improve nutrition and increase physical activity in children and adults, and reduce tobacco and alcohol use in adults. This follows funding provided in the 2009-10 Budget for the development of an implementation plan for the National Partnership Agreement. Note that this funding is provided to Victoria by the Commonwealth.This initiative contributes to the Department of Health’s Health Advancement output.
Drug services
Alcohol and other drug services – responding to growth in demandFunding is provided to expand the needle and syringe program to meet growth and demand in Footscray and Frankston. The program, through
Service Delivery 2011-12 Chapter 2 153

the provision of sterile injecting equipment, information, education and referral, prevents the spread of HIV and viral hepatitis among people who inject drugs, and in turn protects the wider Victorian community. This initiative contributes to the Department of Health’s Drug Treatment and Rehabilitation output.
154 Chapter 2 Service Delivery 2011-12

Alcohol and other drug strategy – treatment services Funding is provided to continue various alcohol and other drug initiatives that provide treatment and counselling services to people with alcohol and other drug problems. The initiative also funds programs to prevent the use of illicit substances and prevalence of substance abuse within the community. This initiative contributes to the Department of Health’s: Drug Treatment and Control output; and Drug Treatment and Rehabilitation output.
Asset initiatives($ million)
2010-11 2011-12 2012-13 2013-14 2014-15 TEISecuring our health systemRoyal Children’s Hospital ICT investment .. 5.0 7.2 7.4 4.4 23.9Royal Talbot Rehabilitation Centre –
Mellor Ward refurbishment.. 0.2 3.0 2.7 .. 5.9
Securing our health system – medical equipment replacement program
.. 35.0 .. .. .. 35.0
Securing our health system – statewide hospital infrastructure renewal program
.. 20.0 .. .. .. 20.0
Further capital funding to deliver 800 hospital bedsFrankston Hospital inpatient expansion .. 1.0 14.0 20.0 1.0 36.0Increasing critical care capacity .. 1.8 .. .. .. 1.8Maroondah Hospital expansion .. 0.8 8.0 12.8 0.5 22.0Northern Hospital emergency
department expansion.. 2.5 9.8 9.8 2.5 24.5
Olivia Newton-John Cancer and Wellness Centre – Stage 2b
.. 3.8 28.1 32.0
Sub-total asset initiatives .. 70.0 70.1 52.6 8.3 201.0Election commitments .. 23.5 62.1 59.4 60.7 307.6Government-wide initiatives 0.2 0.9 .. .. .. 1.0Total asset initiatives 0.2 94.4 132.2 111.9 69.0 509.6Source: Department of Treasury and Finance
Securing our health system
Royal Children’s Hospital ICT investmentFunding is provided to upgrade the new Royal Children’s Hospital’s information and communications technology. This will include the delivery of a new patient administration system and clinical software system. This new integrated system will help improve outcomes for patients and increase the benefits of the new hospital. This initiative contributes to the Department of Health’s Admitted Services output.
Service Delivery 2011-12 Chapter 2 155

Royal Talbot Rehabilitation Centre – Mellor Ward refurbishmentFunding is provided to refurbish the Mellor Ward at the Royal Talbot Rehabilitation Centre to bring it to a standard that meets present day requirements for the provision of quality rehabilitation care. This initiative contributes to the Department of Health’s Admitted Services output. Securing our health system – Medical equipment replacement programFunding is provided in 2011-12 to replace critical and highest at-risk medical equipment in the health system. This will enable health services to reduce risk to patients and staff and improve service availability. This program supports the integration of technological advances by providing appropriately up-to-date medical equipment to metropolitan and rural health facilities including acute hospitals, dental health services, mental health services and aged care services. This initiative contributes to the Department’s Admitted Services output.Securing our health system – Statewide hospital infrastructure renewal programFunding is provided in 2011-12 to improve the quality and standard of health services assets by addressing immediate infrastructure risks and critical renewal programs across the State.This initiative contributes to the Department of Health’s Admitted Services output.
Further capital funding to deliver 800 new hospital beds
As part of the commitment to deliver 800 new hospital beds in the Government’s first term, the following additional asset projects will be funded. Frankston Hospital inpatient expansionFunding is provided to expand services at the Frankston Hospital to deliver 64 additional acute multi-day medical and surgical beds, and an expansion of critical care services through the addition of two intensive care beds and two special care nursery cots. This will contribute to the delivery of 800 new hospital beds in the Government’s first term.This initiative contributes to the Department of Health’s Admitted Services output.Increasing critical care capacityFunding is provided to deliver an additional six intensive care unit beds and three neo-natal intensive care cots to health services across Victoria that are experiencing high levels of demand. This will provide sophisticated technology and medical management to care for patients with complex illnesses and injuries. This will contribute to the delivery of 800 new hospital beds in the Government’s first term.
156 Chapter 2 Service Delivery 2011-12

This initiative contributes to the Department of Health’s Admitted Services output.Maroondah Hospital expansionFunding is provided to address current demand pressures at Maroondah Hospital, improve patient flow and address ageing infrastructure issues. The project will increase bed capacity through the development of a new 16-bed critical care unit (an increase of six beds) and a new 22-bed inpatient ward. This will contribute to the delivery of 800 new hospital beds in the Government’s first term.This initiative contributes to the Department of Health’s Admitted Services output.
Service Delivery 2011-12 Chapter 2 157

Northern Hospital emergency department expansionFunding is provided to expand and redevelop Northern Hospital’s emergency department by providing an additional 21 treatment spaces and a special care nursery with seven cots. The additional spaces will enable a broadening of the range of acute services provided by Northern Health. This will contribute to the delivery of 800 new hospital beds in the Government’s first term. This initiative contributes to the Department of Health’s Admitted Services output.Olivia Newton-John Cancer and Wellness Centre – Stage 2bFunding is provided for Stage 2b of the Olivia Newton-John Cancer and Wellness Centre to complete and fit-out acute inpatient wards, outpatient clinics, and a palliative care unit. Funding for the fit-out of the research facilities has been provided through a separate initiative under the Department of Business and Innovation. This will contribute to the delivery of 800 new hospital beds in the Government’s first term.This initiative contributes towards the Department of Health’s Admitted Services output.
158 Chapter 2 Service Delivery 2011-12

HUMAN SERVICES
Output initiatives($ million)
2010-11 2011-12 2012-13 2013-14 2014-15Disability servicesImproving access for people with a disability,
their families and carers to services.. 11.5 11.7 12.0 12.3
Child protection and family servicesBetter outcomes for out-of-home care .. 11.2 3.6 3.7 3.8Child protection demand (more specialised and
stable child protection).. 5.0 4.7 4.8 5.0
Early childhood development workers .. 1.7 .. .. ..Strengthening Aboriginal services .. 1.1 1.1 .. ..Youth services and youth justiceImproving youth justice .. 6.2 6.1 6.4 6.4Improving sustainability of Victoria’s human servicesCommunity Services Organisations insurance
premium.. 1.7 1.8 1.8 1.9
Concessions to pensioners and beneficiariesWater and sewerage concessions .. 15.2 15.5 15.9 16.3Empowering individuals and communitiesCreating modernised and inclusive
Neighbourhood Houses .. 0.7 .. .. ..
Helping women’s economic participation .. 0.6 0.6 0.6 0.6Men’s Sheds program .. 1.0 1.0 1.0 1.0Promoting youth – opportunities for social and
economic engagement.. 2.7 2.3 2.3 2.4
Sub-total output initiatives .. 58.5 48.4 48.6 49.6Election commitments 30.5 148.8 158.7 171.0 184.4Government-wide initiatives 4.9 2.9 .. .. ..Election commitment savings - 14.9 - 30.2 - 30.8 - 31.6 - 32.3Measures to offset the GST reduction .. - 4.8 - 11.8 - 11.8 - 11.8Total output initiatives 20.6 175.2 164.5 176.1 189.9Source: Department of Treasury and Finance
Disability services
Improving access for people with a disability, their families and carers to services The Government will undertake the following initiatives to improve access for people with a disability, their families and carers to services. Acquired brain injury
Funding is provided to continue investment in the Acquired Brain Injury Slow to Recover Program, which provides a coordinated response of specialist therapy, allied health support and case management for people with a catastrophic brain injury who have extremely high support needs. This will maximise opportunities for good therapeutic outcomes and reduce the current lengthy wait times for treatment.
Service Delivery 2011-12 Chapter 2 159

This initiative contributes to the Department of Human Services’ Individual Support output.
Aids and equipment – home and vehicle modifications Funding is provided to continue investment in the aids and equipment program to maintain current funding levels for aids and equipment, home and vehicle modifications.This initiative contributes to the Department of Human Services’ Targeted Services output.
Technability program Funding is provided to continue investment in the Video Relay Interpreting Service which supports access to health and community services for Victoria’s deaf, hard of hearing and culturally and linguistically diverse communities in rural and regional Victoria. This funding will continue support for a total of 18 video relay interpreting sites in Victoria, 10 of which are in rural locations. This initiative contributes to the Department of Human Services’ Information, Planning and Capacity Building output.
Child protection and family services
Better outcomes for out-of-home careFunding is provided to enhance placement capacity and care arrangements and address immediate shortages in funded placements in the out-of-home care system. This initiative contributes to the Department of Human Services’ Specialist Support and Placement Services output.Child protection demand (more specialised and stable child protection)Funding is provided to employ an additional 47 Child Protection Staff, made up of 40 Child Protection Workers and seven supervisors to help reduce pressure on frontline workers and to meet demand for child protection services in Victoria.This initiative contributes to the Department of Human Services’ Statutory Child Protection Services output. Early childhood development workers Funding is provided for a further eight months to continue the Early Childhood Development Project, which provides an early childhood development worker in each of the 24 Child and Family Service Alliances across Victoria. These workers will strengthen the service response for vulnerable children aged 0-5 years and their families, through targeted activities that strengthen family services. In addition, this initiative will also support practitioners to upgrade their skills in assessment, planning and service provision. An evaluation of this
160 Chapter 2 Service Delivery 2011-12

program will be completed in December 2011 to inform any future Government commitment.This initiative contributes to the Department of Human Services’ Family and Community Services output.
Service Delivery 2011-12 Chapter 2 161

Strengthening Aboriginal services Funding is provided for a further two years to continue to support Aboriginal Community Controlled Organisations to develop operational and service capabilities so they can deliver quality services to Indigenous children and families. The Department of Human Services will work with Aboriginal Community Controlled Organisations to achieve the required registration, to improve their performance against registration standards, enhance their business and management systems, develop internal workforce strategies and reduce red tape.This initiative contributes to the Department of Human Services’ Family and Community Services output.
Youth services and youth justice
Improving youth justiceThe Government will undertake the following initiatives to improve youth justice. Alcohol and other drug strategy – treatment services
Funding is provided to continue the delivery of alcohol and other drug treatment services to clients in the youth justice system. This is aimed at decreasing the risk of harm associated with substance use including withdrawal, self-harm and seizures.This initiative contributes to the Department of Human Services’ Community Based Services output.
Improving youth justice custodial services and the Parkville youth justice precinct Funding is provided for diversion measures, including group conferencing and statutory supervision, for young people on community based orders. Funding will also improve training for the custodial workforce. The measures are intended to divert young people from the youth justice custodial system.This initiative contributes to the Department of Human Services’: Youth Justice and Custodial Services output; and Community Based Services output.
Improving sustainability of Victoria’s human services
Community Services Organisations insurance premiumFunding is provided so that increased costs in community service organisations’ insurance premiums can be addressed, ensuring that community service organisations retain an appropriate level of service. It will enable them to deliver services on behalf of the Government in an efficient manner.This initiative contributes to the Department of Human Services’:
162 Chapter 2 Service Delivery 2011-12
Residential Accommodation Support output; Specialist Support and Placement Services output; and Youth Justice Custodial Services output.
Concessions to pensioners and beneficiaries
Water and sewerage concessionsFunding is provided to address cost of living pressures for households in most need by raising the annual cap for water and sewerage concessions in 2011-12 to help meet water and sewerage costs. This initiative contributes to the Department of Human Services’ Concessions to Pensioners and Beneficiaries output.
Empowering individuals and communities
Creating modernised and inclusive Neighbourhood HousesFunding is provided in 2011-12 to provide grants to Neighbourhood Houses to improve their infrastructure, accessibility and amenities. Grants will be provided for information, communication and technology upgrades and minor works. This initiative contributes to the Department of Human Services’ Community Participation output. Helping women’s economic participation Funding is provided to support women’s economic participation and leadership through a range of initiatives. This initiative contributes to the Department of Human Services’ Women’s Policy output.Men’s Sheds program Funding is provided to continue investment in the Men’s Sheds program across Victoria. This will enable communities to construct up to 30 new Sheds and refurbish up to 46 existing sites. Grants of up to $30 000 will be provided to assist local Men’s Sheds to implement strategies to ensure their futures as self sufficient community-governed organisations. This initiative contributes to the Department of Human Services’ Community Participation output.Promoting Youth – opportunities for social and economic engagementThe Government will undertake the following initiatives to promote opportunities for youth. Centre for Multicultural Youth core funding
Funding is provided to continue investment in the Centre for Multicultural Youth. The Centre is funded to provide strategic
Service Delivery 2011-12 Chapter 2 163

advice and policy analysis to government and to enable communication and consultation with the youth and community sector to support their capacity to work effectively with culturally and linguistically diverse young people. It will also provide opportunities for culturally and linguistically diverse young people to participate and contribute to their communities.This initiative contributes to the Department of Human Services’ Youth Affairs output.
164 Chapter 2 Service Delivery 2011-12

Promoting youth pathways – Advance Funding is provided to continue investment in the Advance program. This program provides opportunities for young people to volunteer, learn and gain accreditation, and partner with a community organisation to develop a community project in response to local needs. Advance is available to all Victorian Government secondary school campuses for students in Years 7 to 12. This initiative contributes to the Department of Human Services’ Youth Affairs output.
Youth Affairs Council of Victoria core funding (YACVic) Funding is provided in 2011-12 to YACVic to support the delivery of strategic advice and policy analysis on youth affairs to government. YACVic represents all young people and the youth sector in Victoria. This initiative contributes to the Department of Human Services’ Youth Affairs output.
Youth Foundations Victoria Funding is provided in 2011-12 to support the transition of the 15 Youth Foundations across Victoria to full management by the Bendigo and Adelaide Bank. The Youth Foundations provide opportunities for young people to participate in raising funds to match Government and community bank funding and then be involved in making grants to local youth projects with the interest earned by each foundation.This initiative contributes to the Department of Human Services’ Youth Affairs output.
Asset initiatives($ million)
2010-11 2011-12 2012-13 2013-14 2014-15 TEIYouth services and youth justiceAddressing the long-term future for
youth justice custodial services – design and planning
.. 1.0 .. .. .. 1.0
Sub-total asset initiatives .. 1.0 .. .. .. 1.0Election commitments .. 0.7 0.3 .. .. 1.0Government-wide initiatives .. .. .. .. .. ..Total asset initiatives .. 1.7 0.3 .. .. 2.0Source: Department of Treasury and Finance
Service Delivery 2011-12 Chapter 2 165

Youth services and youth justice
Addressing the long-term future for youth justice custodial services – design and planningFunding is provided for early design and planning works to address capacity issues and to establish longer term plans for youth justice centres.This initiative contributes to the Department of Human Services’ Youth Justice Custodial Services output.
166 Chapter 2 Service Delivery 2011-12

JUSTICE
Output initiatives($ million)
2010-11 2011-12 2012-13 2013-14 2014-15Emergency service and volunteer organisationsCommunity Safety Emergency Support
Program .. 0.2 0.2 0.2 0.2
Emergency services communications .. 3.1 2.0 0.7 0.7Life Saving Victoria clubs assistance .. 0.3 0.3 0.3 0.3Life Saving Victoria Multicultural Water Safety
Program.. 0.3 0.3 0.3 0.3
Victoria State Emergency Service command and control and operational capability
.. 1.4 3.5 4.2 3.9
Victoria State Emergency Service emergency response – volunteer support
.. 2.3 2.4 2.4 2.5
Public safety and crime reductionElectronic monitoring .. 1.7 1.7 1.8 1.8Graffiti prevention and removal strategy .. 2.3 2.3 2.4 2.5Serious sex offender management .. 5.5 .. .. ..Upgrade to the Victoria Police Academy .. 0.2 0.6 0.8 0.8Access to the justice systemCommunity Legal Centres .. 2.2 2.3 2.3 2.4Courts Integrated Services Program .. 5.3 5.5 5.6 5.7Improving justice for homeless Victorians .. 0.2 0.2 0.2 0.2Sub-total output initiatives .. 25.0 21.3 21.2 21.4Election commitments 0.2 98.2 127.2 177.2 188.5Government-wide initiatives 12.6 .. .. .. ..Election commitment savings - 19.2 - 38.7 - 39.6 - 40.5 - 41.5Measures to offset the GST reduction .. - 20.7 - 22.0 - 22.1 - 22.2Total output initiatives - 6.4 63.8 86.9 135.8 146.2Source: Department of Treasury and Finance
Emergency service and volunteer organisations
Community Safety Emergency Support Program Funding is provided to continue the Community Safety Emergency Support Program. This grants program assists emergency service volunteer organisations to purchase additional safety equipment. This initiative contributes to the Department of Justice’s Emergency Management Capability output.
Service Delivery 2011-12 Chapter 2 167

Emergency services communicationsFunding is provided to upgrade metropolitan mobile radio equipment used by metropolitan police, fire services and ambulance for emergency communications to ensure compliance with system changes made by the Australian Communications and Media Authority. Equipment upgrades include radio terminals, base stations and replacement transportable repeater kits. This initiative will also upgrade the Emergency Services Telecommunications Authority’s computer aided dispatch software used for emergency call taking.This initiative contributes to the Department of Justice’s Emergency Management Capability output. Life Saving Victoria clubs assistance Funding is provided to Life Saving Victoria clubs across the State to assist them to meet the costs of maintenance, insurance and administration. This will allow volunteers to maintain delivery of volunteer life saving services.This initiative contributes to the Department of Justice’s Emergency Management Capability output. Life Saving Victoria Multicultural Water Safety Program Funding is provided to Life Saving Victoria to continue water safety education, training and swimming activities to culturally and linguistically diverse communities. This program aims to reduce future loss of life and injury by increasing multicultural participation and skills in aquatics and related fields. This initiative contributes to the Department of Justice’s Emergency Management Capability output. Victoria State Emergency Service command and control and operational capabilityFunding is provided to employ additional Victorian State Emergency Service staff to fill key leadership roles in the incident management teams, enabling the Service to control major, sustained events for which it has lead agency responsibility. This initiative contributes to the Department of Justice’s Emergency Management Capability output. Victoria State Emergency Service emergency response – volunteer support Funding is provided to continue the Victoria State Emergency Service Emergency Response Volunteer Support program that provides support for volunteers and assists with administration and operating costs. This includes systems enhancement, improved communications with volunteers, upgrades of unit equipment and employment of a contract financial volunteer support officer.
168 Chapter 2 Service Delivery 2011-12

This initiative contributes to the Department of Justice’s Emergency Management Capability output.
Public safety and crime reduction
Electronic monitoring Funding is provided for the continuation of electronic monitoring to provide capacity for the electronic monitoring of serious offenders, suspects on bail and offenders subject to community correction orders. This initiative contributes to the Department of Justice’s Community Based Offender Supervision output. Graffiti prevention and removal strategyFunding is provided to continue the graffiti prevention and removal strategy. This strategy includes graffiti removal from State and local government assets, support for graffiti prevention, increased public awareness of graffiti, and improved partnerships with graffiti management stakeholders.This initiative contributes to the Department of Justice’s Community Safety and Crime Prevention output. Serious sex offender management Funding is provided for the management of serious sex offenders which aims to reduce the risk of re-offending through identification, management and rehabilitation. A core part of this strategy is to support the legal and operational requirements of the post-sentence detention and supervision scheme for sex offenders where the court is satisfied they pose an unacceptable risk of re-offending.This initiative contributes to the Department of Justice’s Prisoner Supervision and Support output. Upgrade to the Victoria Police Academy Funding is provided for the upgrade and alterations to the Police Academy to support the recruitment and training of 1 700 police and 940 protective service officers, and to develop a police academy business case to respond to expected demand. This initiative contributes to the Department of Justice’s Policing Services output.
Access to the justice system
Community Legal Centres Funding is provided to enable Community Legal Centres to continue the delivery of legal advice and assistance, particularly in rural and regional areas with an emphasis on assistance in family violence matters. As in previous years, Victoria Legal Aid will direct a portion of these funds to continue to meet the legislated requirement to provide
Service Delivery 2011-12 Chapter 2 169
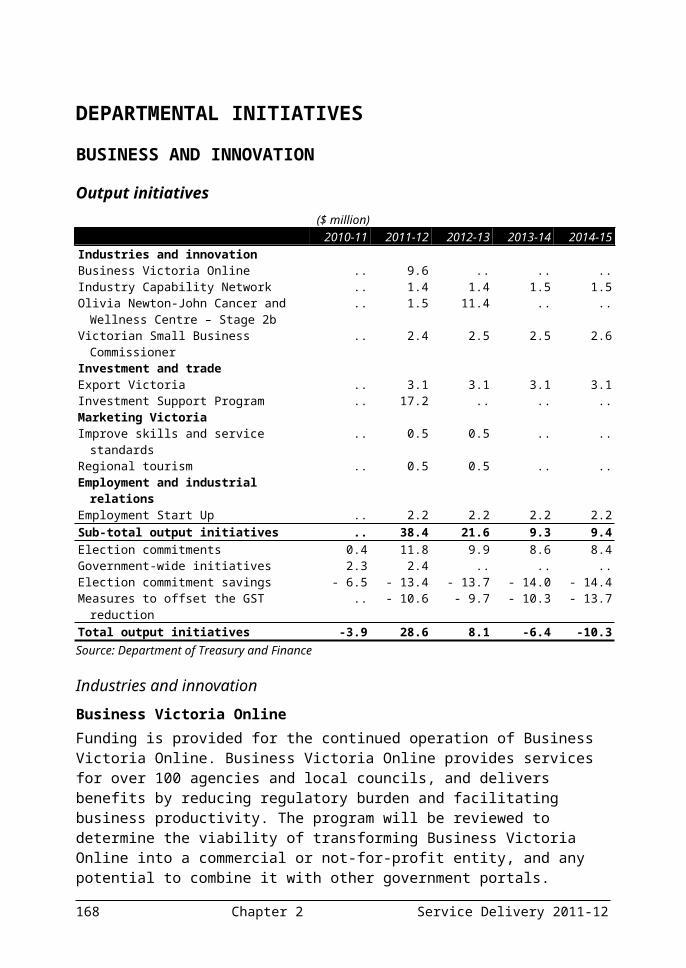
legal representation to respondents for the cross-examination of protected witnesses in family violence matters. This initiative contributes to the Department of Justice’s Supporting the Judicial Process output. Courts Integrated Services Program Funding is provided to continue the Courts Integrated Services Program in relation to defendants with multiple and complex needs. The program provides case management and offender supervision to reduce re-offending through targeted intervention and treatment of underlying causal factors for offending.This initiative contributes to the Department of Justice’s Court Matters and Dispute Resolution output.
170 Chapter 2 Service Delivery 2011-12

Improving justice for homeless Victorians Funding is provided for the continuation of the Homeless Persons Legal Clinic and the Homeless Persons Court Liaison Officer initiative. The Homeless Persons Legal Clinic, in partnership with private sector legal firms, provides legal representation to people experiencing homelessness through the provision of 12 weekly outreach legal clinics. The Homeless Persons Court Liaison Officer initiative focuses on facilitating provision of services for homeless people interacting with the courts system.This initiative contributes to the Department of Justice’s Court Matters and Dispute Resolution output.
Asset initiatives($ million)
2010-11 2011-12 2012-13 2013-14 2014-15 TEIEmergency service and volunteer organisationsEmergency services communications .. 1.8 5.1 1.6 .. 8.5Victoria State Emergency Service
command and control and operational capability
.. 6.0 .. .. .. 6.0
Public safety and crime reductionUpgrade to the Victoria Police Academy .. 5.5 9.9 .. .. 15.4Sub-total asset initiatives .. 13.3 15.0 1.6 .. 29.8Election commitments .. 121.4 4.8 6.0 .. 132.2Government-wide initiatives .. .. .. .. .. ..Total asset initiatives .. 134.7 19.8 7.6 .. 162.1Source: Department of Treasury and Finance
Emergency service and volunteer organisations
Emergency services communicationsRefer to the output initiative for a description.Victoria State Emergency Service command and control and operational capability
Funding is provided to Victoria State Emergency Service to purchase new mobile command and control vehicles and replace critical emergency response assets including communications equipment to enable improved responses to major sustained emergency events. This initiative contributes to the Department of Justice’s Emergency Management Capability output.
Public safety and crime reduction
Upgrade to the Victoria Police Academy Refer to the output initiative for a description.
Service Delivery 2011-12 Chapter 2 171

PLANNING AND COMMUNITY DEVELOPMENT
Output initiatives($ million)
2010-11 2011-12 2012-13 2013-14 2014-15Planning and urban development Bushfire Response Planning Unit .. 1.4 .. .. ..Changing Places Program .. 2.2 2.3 2.4 ..Revitalising Victoria’s heritage .. 2.6 2.6 2.6 2.6Sport and recreationCommunity Support and Recreational Sports
Package – Sport and recreation.. 3.1 3.2 3.2 3.3
State Sports Facilities Project 1.4 1.0 .. .. ..Indigenous VictoriansFacilitating planning approvals – Aboriginal
cultural heritage issues.. 0.5 .. .. ..
Indigenous governance training .. 0.5 0.5 0.6 0.6VeteransPreparing for the ANZAC centenary and
commemorative grants.. 0.5 0.5 0.5 0.6
Local GovernmentPublic Libraries Capital Works Program .. 4.3 4.3 4.3 4.3The Premiers’ Reading Challenge Book Fund .. 1.1 1.1 1.1 1.1Community developmentCommunity Support and Recreational Sports
Package – Community development.. 6.9 6.8 11.8 16.7
Supporting the sustainability of the not-for-profit sector
.. 1.4 1.2 1.0 1.0
Volunteering portal and grants .. 1.2 1.2 1.5 1.3Regional growthFarmers Markets Support Program .. 0.5 0.5 0.5 0.5Sub-total output initiatives 1.4 27.3 24.3 29.5 31.9Election commitments 19.7 155.1 153.1 138.5 136.0Government-wide initiatives 10.4 22.0 3.0 .. ..Election commitment savings - 3.1 - 6.2 - 6.3 - 6.5 - 6.7Measures to offset the GST reduction .. - 9.9 - 10.7 - 11.7 - 11.7Total output initiatives 28.5 188.4 163.4 149.9 149.5Source: Department of Treasury and Finance
Planning and urban development
Bushfire Response Planning UnitFunding is provided to extend the work of the former Bushfire Rebuild Facilitation Unit to support people rebuilding homes in bushfire prone areas. This initiative contributes to the Department of Planning and Community Development’s Planning output.
172 Chapter 2 Service Delivery 2011-12

Changing Places Program Funding is provided to continue activities in partnership with local councils, building on the former Creating Better Places program. It will support physical improvements and planning work to encourage local development and investment in metropolitan and regional activity areas.This initiative contributes to the Department of Planning and Community Development’s Planning output.Revitalising Victoria’s heritage Funding is provided to support Heritage Victoria, the Heritage Council and local governments to meet their regulatory responsibilities on an ongoing basis, in light of increasing demand for heritage services. This initiative includes financial assistance for councils to manage heritage assets. This initiative contributes to the Department of Planning and Community Development’s Planning output.
Sport and recreation
Community Support and Recreation Sports Package – Sport and recreation A number of initiatives have been packaged to improve delivery in funding to increase participation in sport in targeted locations and communities. This package replaces the former Active Families Challenge and Physical Activities Grants programs. It also enables the continuation of the Sporting Uniform Grants program, which provides one-off sporting uniform grants of up to $1 000 to assist grassroots sport and recreation clubs to purchase a wide range of sporting uniforms.This initiative contributes to the Department of Planning and Community Development’s Sport and Recreation Development output.State Sports Facilities ProjectFunding is provided to complete the construction of the State Sports Facilities Project, including a new State Athletics Centre and improved sporting facilities at the Lakeside Oval in Albert Park. It also provides funding for the opening of the modernised facility and the costs to the State Sports Centre Trust associated with the facility’s management.This initiative contributes to the Department of Planning and Community Development’s Sports and Recreation Development output.
Indigenous Victorians
Facilitating planning approvals – Aboriginal cultural heritage issues Funding is provided to continue support to build the statutory capabilities of key Indigenous organisations to meet their requirements
Service Delivery 2011-12 Chapter 2 173

as Registered Aboriginal Parties under the Aboriginal Heritage Act 2006. This will enable effective participation in decision making systems and create positive partnerships with key stakeholders.This initiative contributes to the Department of Planning and Community Development’s Indigenous Community and Cultural Development output.Indigenous governance training Funding is provided to continue providing governance and management training tailored to the needs of Indigenous organisations. This will build their capacity to meet their statutory obligations and organisational challenges. The training program includes the delivery of 12 introductory workshops and eight accredited courses, giving priority to Indigenous organisations experiencing governance difficulties.This initiative contributes to the Department of Planning and Community Development’s Indigenous Community and Cultural Development output.
Veterans
Preparing for the ANZAC centenary and commemorative grantsFunding is provided to support preparations for the commemoration of the centenary of the First World War from 2014. It will also provide for the ongoing continuation of grants for the restoration of war memorials, commemorative events and educational activities.This initiative contributes to the Department of Planning and Community Development’s Veterans Affairs output.
Local government
Public Libraries Capital Works Program Funding is provided for grants on a contributed basis, and usually to local government, for upgrades to existing libraries, the construction of new libraries and the replacement or refurbishment of mobile libraries. This initiative replaces the former Living Libraries program.This initiative contributes to the Department of Planning and Community Development’s Local Government output.The Premiers’ Reading Challenge Book Fund Funding is provided to support public libraries that are involved in the Victorian Premiers’ Reading Challenge to purchase books and materials. This initiative further promotes reading by Victorian students.This initiative contributes to the Department of Planning and Community Development’s Local Government output.
174 Chapter 2 Service Delivery 2011-12

Community development
Community Support and Recreation Sports Package – Community development Funding is provided for small scale grants to boost participation in civic activities and contribute to the cost of community infrastructure and amenities, including those in growing areas. This package replaces the former Victorian Community Support Grants and Supporting Growing Communities programs. This initiative contributes to the Department of Planning and Community Development’s Community Development output.
Service Delivery 2011-12 Chapter 2 175

Supporting the sustainability of the not-for-profit sector Funding is provided to deliver a range of activities to enhance the capacity of Victoria’s not-for-profit sector to meet growing and changing demands on an ongoing basis. Activities include further development and implementation of the Single Funding Agreement with community organisations; and better linking of funding to outcomes and the delivery of tailored governance training. Grants will also be provided to support the implementation of these activities.This initiative contributes to the Department of Planning and Community Development’s Community Development output.Volunteering portal and grants Funding is provided for the ongoing management of Victoria’s volunteering portal, the key online community resource since 2010, for matching volunteering interest with opportunities across a range of sectors. The ongoing funding will also provide for the new Multicultural Volunteer Awards and establishment of a Volunteer Coordination Unit in times of crises, both announced in the Government’s election commitments.This initiative contributes to the Department of Planning and Community Development’s Community Development output.
Regional growth
Farmers Markets Support Program Funding is provided for rural, regional and peri-urban councils to undertake feasibility studies into proposed farmers markets, establish new markets and expand on existing ones. The program will also provide grants to the Victorian Farmers Markets Association to provide advice, training, accreditation, consumer research, consumer information and promotional materials.This initiative contributes to the Department of Planning and Community Development’s Regional Development and Regional Cities output.
Asset initiatives($ million)
2010-11 2011-12 2012-13 2013-14 2014-15 TEISport and recreationState Sports Facilities Project .. 12.9 .. .. .. 12.9Sub-total asset initiatives .. 12.9 .. .. .. 12.9Election commitments .. 1.0 .. .. .. 1.0Government-wide initiatives .. .. .. .. .. ..Total asset initiatives .. 13.9 .. .. .. 13.9Source: Department of Treasury and Finance
176 Chapter 2 Service Delivery 2011-12

Sport and recreation
State Sports Facilities ProjectRefer to the output initiative for a description of this initiative.
Service Delivery 2011-12 Chapter 2 177

PREMIER AND CABINET
Output initiatives($ million)
2010-11 2011-12 2012-13 2013-14 2014-15Multicultural affairs and citizenshipAntipodes Centre redevelopment .. .. 2.0 .. ..Ethnic Communities Council of Victoria .. 0.1 0.1 0.1 0.1Promoting community harmony program .. 1.5 1.5 1.6 1.6Victorian Multicultural Commission community
grants program.. 2.0 2.1 2.1 2.2
Arts and cultural developmentArts audience expansion .. 0.3 0.3 0.3 0.3Blueprint for the development of the arts and
cultural precinct in Southbank.. 0.5 .. .. ..
Community grants: the Local History Grants Program and Community History Awards
.. 0.4 0.4 0.4 0.4
Connecting communities to the arts .. 2.7 2.8 2.8 2.9Melbourne International Comedy Festival .. 1.0 1.1 1.1 1.1Melbourne Recital Centre sustainability .. 0.5 0.5 0.5 0.5Melbourne Symphony Orchestra business
interruption support .. 1.8 .. .. ..
Melbourne Writers Festival: City of Literature .. 0.3 0.3 0.3 0.3Music Victoria .. 0.3 0.3 .. ..Sustaining the State Library of Victoria .. 1.9 3.7 .. ..Supporting local communitiesMobile rebuilding advisory service .. 0.7 .. .. ..Murrindindi Shire Council industry development
package.. 1.2 .. .. ..
Murrindindi Shire Council operating costs for assets
.. 0.4 0.6 .. ..
Relief for the Christchurch communities affected by the February earthquake
2.0 .. .. .. ..
Relief for the Queensland communities affected by the January floods
1.0 .. .. .. ..
Remediation of the Marysville temporary village site
.. 1.1 .. .. ..
Sub-total output initiatives 3.0 16.5 15.4 9.1 9.3Election commitments 2.6 30.7 33.2 35.8 36.9Government-wide initiatives .. .. .. .. ..Election commitment savings - 8.2 - 16.6 - 17.1 - 17.5 - 18.0Measures to offset the GST reduction .. - 2.0 - 2.0 - 2.0 - 2.0Total output initiatives - 2.6 28.6 29.5 25.4 26.2Source: Department of Treasury and Finance
178 Chapter 2 Service Delivery 2011-12

Multicultural affairs and citizenship
The Government is focused on promoting social cohesion and celebrating the many different cultures that help make Victoria a vibrant State. Initiatives in this budget include free seminars across Victoria to provide information to recently arrived migrants and refugees on their rights and responsibilities as citizens of Victoria, a coordinated approach to improve the State, local and federal government response to the needs of newly arrived humanitarian migrants, and improved access to government interpreter and translator services for people with limited English language proficiency.In addition, the functions of the Ethnic Communities Council of Victoria will continue to be supported. The Government will continue to build and enhance current multifaith initiatives and community harmony activities, and support multicultural festivals and events, and communities.Antipodes Centre redevelopment Funding is provided in 2012-13 to fit-out the planned redevelopment of the Greek culture, heritage and language centre in the Lonsdale Street Greek precinct. This initiative contributes to the Department of Premier and Cabinet’s Multicultural Affairs and Citizenship output. Ethnic Communities Council of Victoria Funding is provided to support the functions of the Ethnic Communities Council of Victoria enabling it to continue to provide leadership, governance and advocacy and deliver skills training for community groups. This initiative contributes to the Department of Premier and Cabinet’s Multicultural Affairs and Citizenship output. Promoting community harmony program Funding is provided to continue to build on the current suite of multifaith initiatives and community harmony activities administered by the Office of Multicultural Affairs and Citizenship.This initiative contributes to the Department of Premier and Cabinet’s Multicultural Affairs and Citizenship output. Victorian Multicultural Commission community grants program Funding is provided to continue the level of support for senior citizens, multicultural festivals and events, and multicultural communities.This initiative contributes to the Department of Premier and Cabinet’s Multicultural Affairs and Citizenship output.
Service Delivery 2011-12 Chapter 2 179

Arts and cultural development
The Government is committed to supporting the arts as a key contributor to the uniqueness of Victoria. This initiative will foster the development of artists and arts industries, make the arts more accessible and affordable for all Victorians, and support participation in artistic endeavours by people of all ages in metropolitan, rural and regional communities. Arts audience expansionFunding is provided to continue arts industry marketing support services which make use of newly developed audience profiling technologies to assist arts organisations to expand their reach and build new audiences. This initiative contributes to the Department of Premier and Cabinet’s Arts Development and Access output.Blueprint for the development of the arts and cultural precinct in SouthbankFunding is provided for a blueprint for the Arts in Southbank. This blueprint will guide Government decisions on the future development program of the Southbank Arts and Cultural Precinct.This initiative contributes to the Department of Premier and Cabinet’s Creative Arts Development and Access output. Community grants: the Local History Grants program and Community History Awards Funding is provided to continue the Local History Grants Program, which encourages and fosters community activities to preserve, record and share the local and community history of Victoria. The initiative also supports the annual Victorian Community History Awards.This initiative contributes to the Department of Premier and Cabinet’s Arts Portfolio Agencies output. Connecting communities to the arts Funding is provided to continue operational support for small to medium arts organisations, community and education partnerships, increased touring and expanded access to Victoria’s cultural collections. These programs will support Victoria’s small arts organisations, develop creative talent, expand community participation in arts and cultural activity and grow Victoria’s creative capital. This initiative contributes to the Department of Premier and Cabinet’s Arts Development and Access output. Melbourne International Comedy Festival Funding is provided to support the continuation of increased public programming, including a free outdoor family festival focussed on the
180 Chapter 2 Service Delivery 2011-12

comedy precinct along the Yarra. This will cement the Melbourne International Comedy Festival as a significant major event for Victoria. This initiative contributes to the Department of Premier and Cabinet’s Arts Development and Access output. Melbourne Recital Centre sustainabilityFunding is provided to support the Melbourne Recital Centre to meet business cost pressures so the Centre will be able to continue to deliver high quality music experiences for Victorians and support for artists.This initiative contributes to the Department of Premier and Cabinet’s Arts Development and Access output. Melbourne Symphony Orchestra business interruption support Funding is provided to support the temporary relocation of the Melbourne Symphony Orchestra during the redevelopment of its main performance venue, the Victorian Arts Centre’s Hamer Hall.This initiative contributes to the Department of Premier and Cabinet’s Arts Development and Access output. Melbourne Writers Festival: City of LiteratureFunding is provided to broaden the impact of the Melbourne City of Literature profile across Victoria, maintain the expanded Melbourne Writers Festival programming and refocus the Premier’s Literary Awards. This initiative contributes to the Department of Premier and Cabinet’s Arts Development and Access output. Music VictoriaFunding is provided to support Music Victoria’s operations and assist the industry organisation to become financially self sustaining by the end of 2012-13.This initiative contributes to the Department of Premier and Cabinet’s Arts Development and Access output. Sustaining the State Library of Victoria Funding is provided to complete a strategic framework for the ongoing operation of the State Library of Victoria. This initiative contributes to the Department of Premier and Cabinet’s Portfolio Arts Agencies output.
Supporting Local Communities
The Government seeks to encourage vibrant and self-reliant communities built on high levels of civic participation and voluntary effort. The 2011-12 Budget allocates funding to a range of initiatives to
Service Delivery 2011-12 Chapter 2 181

support local communities, in particular to consolidate and assist recovery efforts in communities affected by the devastating 2009 bushfires.Mobile rebuilding advisory service Funding is provided to continue the mobile rebuilding advisory service until the end of 2011. The service was established after the 2009 Victorian bushfires, and provides information, advice and assistance for rebuilding those areas affected by the fires. This initiative contributes to the Department of Premier and Cabinet’s Strategic Policy Advice and Projects output. Murrindindi Shire Council industry development packageFunding is provided to establish an economic development team targeted at small business growth and capital investment within the Murrindindi Shire. The team will oversee existing government services to small businesses as well as develop a suite of new initiatives to encourage job creation, small business development and capital investment.This initiative contributes to the Department of Premier and Cabinet’s Strategic Policy Advice and Projects output.Murrindindi Shire Council operating costs for assetsFunding is provided to assist with the maintenance and operation of new and renovated community facilities that were established in the Murrindindi Shire to help with community recovery since the 2009 Victorian bushfires.This initiative contributes to the Department of Premier and Cabinet’s Strategic Policy Advice and Projects output.Relief for the Christchurch communities affected by the February earthquake Funding is provided for a State donation to the appeal for communities in Christchurch who were impacted by the severe, magnitude 6.3 earthquake on 22 February 2011.This initiative contributes to the Department of Premier and Cabinet’s Government Information Services and Support output.Relief for the Queensland communities affected by January floodsFunding is provided for a State donation to the Queensland Flood Appeal to help families and communities impacted by the Queensland floods.This initiative contributes to the Department of Premier and Cabinet’s Government Information Services and Support output.
182 Chapter 2 Service Delivery 2011-12

Remediation of the Marysville temporary village site Funding is provided to undertake remediation work on the site of the Marysville temporary village as an important step in assisting the town in its recovery from the 2009 Victorian bushfires.
Asset initiatives($ million)
2010-11 2011-12 2012-13 2013-14 2014-15 TEIContribution Circus Oz relocation .. 5.0 10.0 .. .. 15.0Sub-total asset initiatives .. 5.0 10.0 .. .. 15.0Election commitments .. 5.0 .. .. .. 5.0Government-wide initiatives .. .. .. .. .. ..Total asset initiatives .. 10.0 10.0 .. .. 20.0Source: Department of Treasury and Finance
Contribution to Circus Oz relocation Funding is provided as a contribution towards the establishment of Circus Oz rehearsal and business development spaces suitable for its creative direction and future role within the international and national circus and performing arts sectors. The new facility will be established together with the implementation of a new business model.This initiative contributes to the Department of Premier and Cabinet’s Portfolio Services and Policy output.
Service Delivery 2011-12 Chapter 2 183

PRIMARY INDUSTRIES
Output initiatives($ million)
2010-11 2011-12 2012-13 2013-14 2014-15Biosecurity and pest controlImproved surveillance and preparedness for
the exotic varroa mite pest of bees.. 0.3 .. .. ..
Strengthening priority weed and pest animal control
.. 5.1 5.2 5.4 5.5
Sustainable fisheriesContinuing 13 FISH: fisheries intelligence
reporting line.. 0.9 .. .. ..
Marine Discovery Centre: school and community fisheries education
.. 0.3 0.3 0.3 0.3
Opportunities in primary industriesFirst Farm Grant Program .. 1.2 .. .. ..Rediscover Victoria .. 0.6 .. .. ..Safer communitiesWe are Family – a component of the
Responsible Pet Ownership Program.. 0.1 0.1 0.1 0.1
Sub-total output initiatives .. 8.5 5.7 5.8 6.0Election commitments .. 20.2 34.6 38.0 34.3Government-wide initiatives 6.6 6.6 2.3 .. ..Election commitment savings - 3.1 - 6.3 - 6.4 - 6.6 - 6.7Measures to offset the GST reduction .. - 4.0 - 4.2 - 6.6 - 7.6Total output initiatives 3.5 25.0 32.0 30.6 26.0Source: Department of Treasury and Finance
Biosecurity and pest control
Improved surveillance and preparedness for the exotic varroa mite pest of beesFunding is provided to increase surveillance at Western Port and Port of Melbourne to protect Victoria’s apiculture industry from the varroa parasite of bees. This initiative contributes to the Department of Primary Industries’ Regulation and Compliance output.Strengthening priority weed and pest animal control Funding is provided to maintain and build on the management of weeds and pest animals on private land to protect Victoria’s agricultural and natural assets. This will provide enforcement capability to enable the Department of Primary Industries to target landholders who fail to manage weeds and pest animals and continue current levels of service for the wild dogs control program. This initiative contributes to the Department of Primary Industries’ Regulation and Compliance output.
184 Chapter 2 Service Delivery 2011-12

Sustainable fisheries
Continuing 13 FISH: fisheries intelligence reporting line Funding is provided to continue the fisheries intelligence reporting line (13 FISH) to protect fish stocks from theft, and promote responsible commercial and recreational fishing behaviour. This initiative contributes to the Department of Primary Industries’ Regulation and Compliance output.Marine Discovery Centre: School and community fisheries education Funding is provided to continue the operation of the Marine Discovery Centre. This will enhance the development of agriculture and the marine ecosystem in the education system. The Centre provides educational opportunities to school students and raises public awareness of the fisheries industry and sustainable fishing practices. This initiative contributes to the Department of Primary Industries’ Primary Industries Policy output.
Opportunities in primary industries
First Farm Grant programFunding is provided to continue the First Farm Grant program. The program provides business planning and development support to young farmers who have recently made, or are about to make, a commitment in farming.This initiative contributes to the Department of Primary Industries’ Sustainable Practice Change output.Rediscover Victoria Funding is provided to continue the Rediscover Victoria program. This program will undertake pre-competitive geoscience assessments of the State’s potential for world-class ore deposits and gas supplies. A high priority will be to promote exploration and development opportunities for Victoria’s mineral and energy resources. Rediscover Victoria will also provide new data to improve the 3D geological model of the State. This initiative contributes to the Department of Primary Industries’ Strategic and Applied Scientific Research output.
Safer communities
We are Family – a component of the Responsible Pet Ownership Program Funding is provided to continue the We Are Family Responsible Pet Ownership program. The program seeks to reduce the risk of dog attack injury to children under four years of age through education programs delivered to expectant parents accessing maternity hospital antenatal programs and maternal and child health centres.
Service Delivery 2011-12 Chapter 2 185

This initiative contributes to the Department of Primary Industries’ Sustainable Practice Change output.
Asset initiativesNil
186 Chapter 2 Service Delivery 2011-12

SUSTAINABILITY AND ENVIRONMENT
Output initiatives($ million)2010-11 2011-12 2012-13 2013-14 2014-15
Communities caring for the environmentWildlife rehabilitators grants program .. 0.3 0.3 0.3 0.3Parks and landAsset replacement and renewal at Victoria’s
parks and public land.. .. 0.4 0.4 0.4
Management of weeds and pests to protect environmental values on public land
.. 4.0 4.1 4.2 4.3
Park rangers .. 7.4 7.5 7.7 7.9Parks Victoria financial sustainability 14.1 14.4 5.7 6.1 6.4Positioning Victoria’s farming prosperity for
the future.. 0.6 0.4 0.3 0.3
Protection of Port Phillip Bay beaches and foreshores
.. 2.3 2.4 2.4 2.5
Acting sustainablyMurray-Darling Basin Authority contribution .. 9.1 .. .. ..Sustainable schools .. 2.0 2.1 2.1 2.2Supporting recreational opportunitiesShotgun Education Program .. 0.1 0.6 .. ..Southern alpine resorts .. 3.6 .. .. ..Other Sustainability and Environment Insurance premiums increases .. 7.7 5.1 5.5 5.9Sub-total output initiatives 14.1 51.4 28.6 29.0 30.2Election commitments 1.2 34.0 39.7 39.4 39.8Government-wide initiatives 9.2 48.1 2.4 2.5 2.3Election commitment savings - 9.4 - 19.3 - 19.7 - 20.2 - 20.7Measures to offset the GST reduction .. - 12.5 - 12.0 - 11.9 - 11.9Total output initiatives 15.1 101.7 39.0 38.8 39.7Source: Department of Treasury and Finance
Communities caring for the environment
Wildlife rehabilitators grants program Funding is provided to continue a grants program to volunteer wildlife rehabilitators and institutions involved in the care and rehabilitation of wildlife.This initiative contributes to the Department of Sustainability and Environment’s Biodiversity output.
Parks and land
Asset replacement and renewal at Victoria’s parks and public land Refer to the asset initiative for a description of the initiative.
Service Delivery 2011-12 Chapter 2 187

Management of weeds and pests to protect environmental values on public land Funding is provided to continue weed and pest animal control programs in national parks, state forests and other public land in Victoria.This initiative contributes to the Department of Sustainability and Environment’s Biodiversity output. Park rangers Funding is provided to continue 65 park ranger positions in regional Victoria. The park rangers provide park management services, including management of natural, recreational and cultural assets.This initiative contributes to the Department of Sustainability and Environment’s Forests and Parks output. Parks Victoria financial sustainability Funding is provided to ensure the ongoing financial sustainability of Parks Victoria in light of a number of cost pressures including increasing population and visitation, increasing insurance premiums, and an increasing area of land that is required to be managed. This funding will also ensure continued free entry to Victoria’s national and metropolitan parks. This initiative contributes to the Department of Sustainability and Environment’s Forests and Parks output. Positioning Victoria’s farming prosperity for the futureFunding is provided to consolidate and support the expansion of the Vicmap Position GPSnet network and establish a formal maintenance cycle to ensure continuing network performance reliability.This initiative contributes to the Department of Sustainability and Environment’s Land Administration and Property Information output. Protection of Port Phillip Bay beaches and foreshores Funding is provided to continue the renourishment and protection of beaches around Port Phillip Bay. The program will focus on improving sand renourishment, dune rehabilitation, protection of assets and stormwater management.This initiative contributes to the Department of Sustainability and Environment’s Public Land output.
Acting sustainably
Murray-Darling Basin Authority contribution Additional funding is provided for Victoria’s annual contribution towards the operating costs of the Murray-Darling Basin Authority.
188 Chapter 2 Service Delivery 2011-12

This initiative contributes to the Department of Sustainability and Environment’s Sustainable Water Management and Supply output.
Service Delivery 2011-12 Chapter 2 189

Sustainable schools Funding is provided to continue and build on the existing ResourceSmart Australian Sustainable Schools Initiative (AuSSIVic) program. It will also provide participating schools that are eligible with a one-off Education Facility Energy Efficiency Grant to undertake energy audits or install energy efficient or sustainable infrastructure.This initiative contributes to the Department of Sustainability and Environment’s Environmental Policy and Climate Change output.
Supporting recreational opportunities
Shotgun Education Program Funding is provided for the development of an in-field training module for Victorian hunters to improve their practical shotgun skills and to resource shooting sport complexes throughout the State to support this training.This initiative contributes to the Department of Sustainability and Environment’s Biodiversity output. Southern alpine resorts Funding is provided to continue support of the operations of Mt Baw Baw and Lake Mountain alpine resorts.This initiative contributes to the Department of Sustainability and Environment’s Public Land output.
Other Sustainability and Environment
Insurance premiums increasesFunding is provided to meet the rising cost of insuring public land assets due to higher claims activity following recent bushfires and floods and the requirement to rebuild assets to higher engineering and building standards. This initiative contributes to the Department of Sustainability and Environment’s: Biodiversity output; Natural Resources output; Public Land output; Environmental Policy and Climate Change output; Land and Fire Management output; Land Administration and Property Information output; and Forests and Parks output.
190 Chapter 2 Service Delivery 2011-12

Asset initiatives($ million)
2010-11 2011-12 2012-13 2013-14 2014-15 TEIParks and landAsset Replacement and Renewal at
Victoria’s Parks and Public Land.. 8.4 .. .. .. 8.4
Sub-total asset initiatives .. 8.4 .. .. .. 8.4Election commitments .. 1.3 .. .. .. 1.3Government-wide initiatives 14.5 78.1 1.4 1.4 1.1 96.5Total asset initiatives 14.5 87.8 1.4 1.4 1.1 106.2Source: Department of Treasury and Finance
Parks and land
Asset replacement and renewal at Victoria’s parks and public land Funding is provided to continue renewal and replacement of built assets in priority parks of the Parks Victoria estate.This initiative contributes to the Department of Sustainability and Environment’s Forest and Parks output.
Service Delivery 2011-12 Chapter 2 191
TRANSPORT
Output initiatives($ million)2010-11 2011-12 2012-13 2013-14 2014-15
Boating safety program .. 5.0 5.0 5.0 5.0Graduated Licensing System .. 12.3 .. .. ..Increase in maintenance funding for arterial
roads.. 23.0 .. .. ..
Local ports .. 6.0 .. .. ..Nation Building Program – roads projects .. .. .. 1.0 2.3Port of Hastings development 1.3 1.0 .. .. ..Sub-total output initiatives 1.3 47.3 5.0 6.0 7.3Election commitments .. 94.7 80.8 83.9 83.7Government-wide initiatives 51.8 96.1 .. .. ..Election commitment savings - 22.0 - 44.7 - 45.7 - 46.7 - 47.8Measures to offset the GST reduction .. - 11.2 - 11.2 - 11.0 - 11.0Total output initiatives 31.1 182.2 28.9 32.2 32.2Source: Department of Treasury and Finance
Boating safety program Funding is provided for continuation of the Boating Safety and Facilities Program to support recreational boating through a mixture of statewide initiatives and community grants.This initiative contributes to the Department of Transport’s Marine Safety and Regulation output.Graduated Licensing SystemFunding is provided for the continued delivery of the Graduated Licensing System program to improve young driver safety through increasing the level of driving experience, promoting safe practices and safer vehicle purchase, and providing motivation for safer driving behaviour. Key features of this system include peer passenger restrictions and a two-stage probationary licence system (P1 – red and P2 – green plates).This initiative contributes to the Department of Transport’s Vehicle and Driver Regulation output.Increase in maintenance funding for arterial roadsFunding is provided to invest in road pavement maintenance and rehabilitation to help prevent increasing rates of deterioration in road network conditions. Funds will be directed to the roads with the highest rate of failures or potholing.This initiative contributes to the Department of Transport’s Road Assets Management output.
192 Chapter 2 Service Delivery 2011-12

Local ports Funding is provided for maintenance and renewal of infrastructure for local ports. This initiative contributes to the Department of Transport’s Freight, Logistics, Ports and Marine Development output.Nation Building Program – road projects In partnership with the Commonwealth Government, funding is provided for the next stage of the M80 upgrade – Edgars Road to Plenty Road. Funding will deliver road widening to achieve three through lanes and additional lanes between interchanges, upgrades to interchanges, a Freeway Management System and improvements to the shared user path. In partnership with the Commonwealth Government, funding is provided for the Western Highway duplication between Burrumbeet and Beaufort – this includes the construction of a second carriageway, a bypass, and interchanges at Ballarat-Burrumbeet Road and east of Trawalla.This initiative contributes to the Department of Transport’s Road Network Improvements output.Port of Hastings development Funding is provided to commence planning for the development of the Port of Hastings.This initiative contributes to the Department of Transport’s Freight, Logistics, Ports and Marine Development output.
Asset initiatives($ million)
2010-11 2011-12 2012-13 2013-14 2014-15 TEIDisability Discrimination Act access to
public transport.. 5.0 5.0 5.0 5.0 20.0
Nation Building Program – roads projects
.. 27.0 68.0 47.6 .. 142.6
Sub-total asset initiatives .. 32.0 73.0 52.6 5.0 162.6Election commitments 0.6 118.0 207.3 112.7 8.3 446.9Government-wide initiatives .. .. .. .. .. ..Total asset initiatives 0.6 150.0 280.3 165.3 13.3 609.5Source: Department of Treasury and Finance
Disability Discrimination Act access to public transport Funding is provided to continue to upgrade public transport infrastructure in line with the Commonwealth’s Disability Standards for Accessible Public Transport 2002 legislation. This initiative contributes to the Department of Transport’s Specialist Transport Services output.
Service Delivery 2011-12 Chapter 2 193
Nation Building Program – road projectsRefer to the output initiative for a description of this initiative.
194 Chapter 2 Service Delivery 2011-12
TREASURY AND FINANCE
Output initiatives($ million)
2010-11 2011-12 2012-13 2013-14 2014-15Compliance and taxationEnhanced tax compliance .. 7.0 12.5 12.6 12.7Reform of land rich duty .. .. 1.0 1.0 1.0Other Treasury and Finance initiativesEnergy Saver Incentive (Victorian Energy
Efficiency Target) scheme administration.. 3.0 3.0 3.0 3.0
Improving the planning, management and delivery of infrastructure projects
0.8 4.8 5.0 5.1 5.2
Sub-total output initiatives 0.8 14.8 21.5 21.7 21.9Election commitments - 13.1 95.3 47.0 0.8 ..Government-wide initiatives 6.0 10.9 7.4 5.2 5.0Election commitment savings - 5.1 - 10.5 - 10.7 - 11.0 - 11.2Measures to offset the GST reduction .. - 2.7 - 2.7 - 2.7 - 2.7Total output initiatives - 11.3 107.9 62.5 14.0 13.0Source: Department of Treasury and Finance
Compliance and taxation
Enhanced tax complianceFunding is provided to retain 30 existing staff and to recruit 50 new State Revenue Office staff to undertake increased monitoring and enforcement activities from 1 July 2011 to improve taxpayer compliance. This initiative contributes to the Department of Treasury and Finance’s Revenue Management Services to Government output.Reform of land rich dutyThe Government will reform Victoria’s land rich duty provisions by adopting a landholder duty model that will ensure that transactions that result in changes in ownership or control of entities holding land and other property are brought into the stamp duty base. The landholder duty model will ensure greater consistency in the treatment of direct and indirect acquisitions of land and will considerably reduce complexity and provide greater certainty to taxpayers. This reform is consistent with most other states and territories and will commence on 1 July 2012.Funding is provided to enable the State Revenue Office to undertake consultation with key stakeholders, taxpayers and the community, and ongoing administration.This initiative contributes to the Department of Treasury and Finance’s Revenue Management Services to Government output.
Service Delivery 2011-12 Chapter 2 195

Other Treasury and Finance initiatives
Energy Saver Incentive (Victorian Energy Efficiency Target) scheme administrationFunding is provided to enable the Essential Services Commission to continue to administer the Energy Saver Incentive Scheme (also known as the Victorian Energy Efficiency Target Scheme). This funding will allow the Essential Services Commission to continue to accredit businesses, assess and register certificates, approve efficient products for installation, and ensure compliance with the Victorian Energy Efficiency Target Act 2007.This initiative contributes to the Department of Treasury and Finance’s Economic Regulatory Services output.Improving the planning, management and delivery of infrastructure projects Funding is provided to enable a greater level of strategic advice to departments, agencies and government to assist with project development, procurement, governance and delivery of major infrastructure projects and programs. This includes strengthening the central oversight, planning, delivery and review of high value/high risk projects, particularly ICT projects and those with unique characteristics.This initiative contributes to the Department of Treasury and Finance’s Land and Infrastructure Investment Management output.
Asset initiativesNil
196 Chapter 2 Service Delivery 2011-12

PARLIAMENT
Output initiatives Nil
Asset initiatives($ million)
2010-11 2011-12 2012-13 2013-14 2014-15 TEIHeritage Asset Management Strategy –
phase 3.. 4.0 .. .. .. 4.0
Sub-total asset initiatives .. 4.0 .. .. .. 4.0Election commitments .. .. .. .. .. ..Government-wide initiatives .. .. .. .. .. ..Total asset initiatives .. 4.0 .. .. .. 4.0Source: Department of Treasury and Finance
Heritage Asset Management Strategy – phase 3Funding is provided for the continuation of the Heritage Asset Management Strategy to provide stone restoration works and address the ongoing maintenance needs of Parliament House.This initiative contributes to the Parliament’s Provision of Information and Resources to Parliament output.
Service Delivery 2011-12 Chapter 2 197

REVENUE INITIATIVES($ million)
2010-11 2011-12 2012-13 2013-14 2014-15
Enhanced tax compliance .. 35.0 65.0 66.7 68.5Landfill levy .. 11.9 11.2 10.3 9.9Reform of land rich duty .. .. 51.0 76.0 76.0Total revenue initiatives .. 46.9 127.2 153.0 154.4Source: Department of Treasury and Finance
Enhanced tax complianceThis initiative will recruit 50 new staff to undertake increased monitoring and enforcement activities by the State Revenue Office from 1 July 2011 to improve taxpayer compliance.Landfill levyThe Treasurer will bring forward by 12 months the progressive landfill levy rates that were already announced by the previous government. Reform of land rich dutyThe Government will reform Victoria’s land rich duty provisions by adopting a landholder duty model that will ensure the changes in ownership or control of entities holding land and other property are brought into the stamp duty base. The landholder duty model will ensure greater consistency in the treatment of direct and indirect acquisitions of land and will considerably reduce complexity and provide greater certainty to taxpayers. This reform is consistent with most other states and territories and will commence on 1 July 2012.
198 Chapter 2 Service Delivery 2011-12

CHAPTER 3 – DEPARTMENTAL OUTPUT STATEMENTS
This chapter details the goods and services (outputs) that each government department intends to deliver in 2011-12 and describes how these services are designed to contribute to departmental objectives and strategic priorities. An output represents the aggregate of goods or services which are either produced or delivered by, or on behalf of, a department and its agencies.Departmental output statements are a key accountability mechanism for departmental service delivery as they include performance standards for each output that enable the assessment of departments’ service delivery. Performance measures are provided to describe the cost of each output, the quantity of output units to be delivered, the expected level of quality, and the timeliness of service delivery. Departmental outputs and the performance measures used to evaluate service delivery are assessed annually for their continuing relevance and robustness. Where departments have introduced changes to their outputs, these changes are reflected in a summary table with an explanation as to the nature of the change. The Government has invited the Public Accounts and Estimates Committee (PAEC) to review proposed changes to output performance measures. This is to ensure measures that are substantially changed, or are proposed to be discontinued, are given a high degree of scrutiny. This review also ensures that comparisons of service delivery performance can be maintained from year to year, while recognising the importance of annually evaluating the quality of measures.In the 2011-12 Budget some departments have introduced changes to the outputs and associated performance measures. These changes mainly reflect the impact of machinery of government changes since the 2010-11 Budget as well as the implementation of new organisation/business structures to better facilitate improvements in service delivery. Information about these changes is provided within each department’s output statement.Within the output statements, ‘nm’ refers to a new performance measure and ‘na’ refers to data either not being available or not applicable in the specified year. Where a department has included a
Service Delivery 2011-12 Chapter 3 199

new measure in 2011-12, historical performance data has been provided, where available, to assist with comparability of the department’s performance over time.
200 Chapter 3 Service Delivery 2011-12
Structure and changesThis year, Chapter 3 includes several changes designed to increase transparency in government reporting.
Financial tables
Each departmental output statement includes two new financial tables. One details the amounts available to the department from Parliamentary authority while the other outlines income generated through transactions. These tables were previously found in Budget Paper No. 4 Statement of Finances, now Budget Paper No. 5. The sources of Parliamentary authority available to a department include ‘Annual appropriations’ in the Appropriation (2011-12) Bill to fund the provision of outputs, additions to the net asset base and payments made on behalf of the State. Payments made on behalf of the State include grants for on-passing and superannuation payments. A department’s income from transactions includes appropriations to fund the provision of outputs described in this chapter and other income to fund the operations of the department.Total expenditure for departments can be found in Budget Paper No. 5, Chapter 3 Departmental financial statements.
Changes to performance measures
For some outputs, performance measures that were reported in the 2010-11 departmental output statements may not be reported in 2011-12. This could occur either because the program has ceased, improved measures have been identified or new data sets provide improved performance information. Performance measures that are proposed to no longer be reported in 2011-12 are identified in Appendix A – Output performance measures for review by the Public Accounts and Estimates Committee. Common reasons for the proposed discontinuation of performance measures include the achievement of milestones in a period, project/program completion, the impact of policy decisions, the implementation of different programs, and the development of superior alternative measures.Proposed discontinued or substantially changed measures highlighted in Appendix A will be presented to the PAEC after the release of the 2011-12 Budget for review.
Service Delivery 2011-12 Chapter 3 201

DEPARTMENT OF BUSINESS AND INNOVATION
Departmental mission statementThe Department of Business and Innovation is the Victorian Government’s lead agency for economic development. The Department develops and implements a diverse range of programs, initiatives and projects designed to attract and facilitate investment, encourage exports, generate job opportunities, stimulate innovation, and promote Victoria nationally and internationally.
Departmental objectivesThe Department of Business and Innovation aims to: supply low-cost information and assistance to Victorian businesses
so they are better placed to start up, export and grow; provide market intelligence and assistance to organisations to make
it easy to invest and promote Victoria as an attractive place to invest;
create awareness campaigns to encourage more tourists to visit Victoria;
identify industry requirements for skilled workers, and assist businesses in accessing skilled workers from overseas, to align with Victoria’s industry needs; and
support organisations to undertake collaborative research so knowledge is created and innovation stimulated.
Key strategic priorities for 2011-12In addition to focusing on the delivery of its objectives during 2011-12, the Department will place additional emphasis on the following key strategic priorities: exports – create economic opportunity for Victorian businesses by
providing export development assistance in relation to product, financing, marketing and logistics;
industry assistance – support businesses to maximise jobs growth, business growth and commercial opportunities;
manufacturing – respond to the findings of the Victorian Competition and Efficiency Commission inquiry A More Competitive Victorian Manufacturing Industry;
employment – streamline employment programs with a focus on youth and Indigenous jobseekers and skilled migration; and
202 Business and Innovation Service Delivery 2011-12

regulation reform – tailoring regulation to limit the impact on business.
Ministerial portfoliosThe Department supports the ministerial portfolios of Innovation, Services and Small Business; Tourism and Major Events; Employment and Industrial Relations; Manufacturing, Exports and Trade; Major Projects; Technology; and the Aviation Industry.
Changes to the output structure The Department has made some changes to its output structure for 2011-12, as shown in the table below: 2010-11 Outputs Reason 2011-12 OutputsIndustrial Relations Workforce Participation
Restructure Employment and Industrial Relations
Regional Economic Development, Investment and Promotion (a)
Machinery of government changes
Refer to Department of Planning and Community Development output statements
Regional Economic Development, Investment and Promotion (b)
Restructure Investment Attraction and Facilitation Exports
Regional Infrastructure Development
Machinery of government changes
Refer to Department of Planning and Community Development output statements
Skills Machinery of government changes
Refer to Department of Education and Early Childhood Development output statements
Notes:(a) Components of this output have been moved to the Department of Planning and
Community Development as a result of machinery of government changes.(b) The remaining components of this output have either been moved to the
Investment Attraction and Facilitation or Exports outputs or have been proposed to be discontinued.
All machinery of government changes resulting from the November 2010 election took effect on 1 January 2011.
Service Delivery 2011-12 Business and Innovation 203

The following table summarises the Department’s total output cost.
Table 3.1: Output summary
($ million)2010-11 Budget
2010-11 Revised
2011-12 Budget
Variation (a)
%Industries and Innovation (b) 262.8 253.1 327.9 24.8Investment and Trade (c) 114.7 97.0 119.0 3.7Employment and Industrial Relations (d) 33.9 37.9 23.3 -31.2Marketing Victoria (e) 76.6 152.5 73.8 -3.7Major Projects (f) 11.0 106.8 123.7 1 024.5Total (g)(h) 499.0 647.3 667.7 33.8Source: Department of Business and Innovation
Notes:(a) Variation between 2010-11 Budget and 2011-12 Budget.(b) Variation between 2010-11 Budget and 2011-12 Budget reflects new funding
received for the Regional Aviation Fund, Industry Capability Network, Industry Sustainability Working Committee and the establishment of the Office of the Lead Scientist. In addition, variations in annual funding have occurred for the Industry Transition Fund, Transition to a Global Future, Skills for Growth, Victorian Innovation Statement, the Olivia Newton-John Cancer and Wellness Centre, Biotechnology Grants and the National ICT Australia programs.
(c) The 2010-11 Budget represents the proportion of performance measures transferred from the Regional Economic Development, Investment and Promotion output. Variation between 2010-11 Budget and 2010-11 Revised reflects additional funding received for Transition to a Global Future as well as the impact of the estimated carryover of funding from 2010-11 to 2011-12 for the Victorian Industry and Manufacturing Strategy and the Business Development Program. Variation between 2010-11 Budget and 2011-12 Budget reflects new funding received for Export Victoria, Victoria-Leader in Learning and 2012 Expo in Yeosu, South Korea. In addition, variations in annual funding have occurred for International Airshow, India Strategy, International Education Strategy and Regional Blueprint initiatives.
(d) Variation between 2010-11 Budget and 2010-11 Revised reflects a greater allocation of corporate expenditure as a result of machinery of government changes and the impact of the carryover of funding from 2010-11 to 2011-12 for the New Workforce Partnerships, Return to Earning and other employment initiatives. Variation between 2010-11 Budget and 2011-12 Budget reflects new funding priorities under the Employment Start Up Program.
(e) Variation between 2010-11 Budget and 2010-11 Revised reflects additional funding received for Natural Disaster Recovery and Major Events.
(f) Variation between 2010-11 Budget and 2010-11 Revised reflects the impact of the initial recognition of Kew Residential Development land sales and the estimated carryover from 2010-11 to 2011-12 for Major Projects funding. Variation between 2010-11 Budget and 2011-12 Budget reflects new funding for an international competition to restore Flinders Street Station and the impact of the initial recognition of Kew Residential Development land sales.
(g) The 2010-11 total output cost for the Department is lower than in 2010-11 Budget papers as it includes the full year impact of the machinery of government changes. The changes include the transfer of the Skills output to the Department of Education and Early Childhood Development, and the transfer of the Regional Infrastructure Development and a portion of the Regional Economic Development, Investment and Promotion outputs to the Department of Planning and Community Development.
204 Business and Innovation Service Delivery 2011-12

(h) Total output cost for 2011-12 Budget may not equate to the total expense reported in Budget Paper No. 5, Chapter 3 Departmental financial statements due to additional statements in Budget Paper No. 5 that are not included in departmental output costs. Figures for 2010-11 Budget and 2010-11 Revised have been amended to reflect machinery of government changes and will not equate to total expenses reported in Departmental financial statements.
Service Delivery 2011-12 Business and Innovation 205

Amounts availableThe following tables detail the amounts available to the Department from Parliamentary authority and income generated through transactions. Table 3.2 outlines the Department’s income from transactions and Table 3.3 summarises the sources of Parliamentary authority available to the Department to fund the provision of outputs, additions to net asset base and payments made on behalf of the State.
Table 3.2: Income from transactions($ million)
2009-10 2010-11 2010-11 2010-11 2011-12 Actual Budget Adjusted (a) Revised BudgetOutput appropriations 2 035.0 1 973.3 1 188.5 1 234.2 522.9Interest 39.5 32.3 19.3 22.9 2.5Sale of goods and services 551.1 545.4 320.5 320.5 ..Grants 113.1 19.3 61.5 82.9 16.7Fair value of assets and services
received free of charge or for nominal consideration
16.4 .. .. .. ..
Other income 74.2 26.6 24.2 117.4 109.7Total income from transactions 2 829.2 2 596.9 1 614.0 1 777.9 651.8Source: Department of Business and Innovation and Department of Treasury and Finance
Note:(a) The 2010-11Adjusted estimates include the 2010-11 Budget adjusted for
machinery of government changes.
Table 3.3: Parliamentary authority for resources($ million)
2010-11 2010-11 2010-11 2011-12 Budget Adjusted (a) Revised BudgetAnnual appropriations 1 841.6 1 241.7 1 194.3 581.6 Provision of Outputs 1 609.9 1 010.0 984.7 496.5 Additions to the net asset base 177.7 177.7 155.6 31.1 Payments made on behalf of the State 54.0 54.0 54.0 54.0Receipts credited to appropriations 335.9 151.1 183.0 ..Unapplied previous years appropriation 27.4 27.4 82.2 26.4 Provision of Outputs 27.4 27.4 66.5 26.4 Additions to the net asset base .. .. 15.7 ..Gross annual appropriation 2 204.9 1 420.2 1 459.5 608.0Trust funds 16.6 16.2 79.8 12.6Total parliamentary authority 2 221.5 1 436.4 1 539.3 620.6Source: Department of Business and Innovation and Department of Treasury and Finance
206 Business and Innovation Service Delivery 2011-12

Note:(a) The 2010-11Adjusted estimates include the 2010-11 Budget adjusted for
machinery of government changes.
The following section provides details of the outputs provided to government, including performance measures and costs for each output. Total expenditure for the Department can be found in Budget Paper No. 5, Chapter 3 Departmental financial statements.
Service Delivery 2011-12 Business and Innovation 207

Industries and InnovationIndustries and Innovation outputs drive sustainable and enduring economic growth in industries across Victoria through programs and initiatives that support research, innovation and commercialisation and a thriving small business sector.
Major Outputs/DeliverablesPerformance Measures
Unit of Measure
2011-12 Target
2010-11 Expected Outcome
2010-11 Target
2009-10 Actual
Sector DevelopmentFacilitates the growth and sustainability of Victorian industries through specialised sector engagement to support increased productivity and competitiveness and assist business growth.
Quantity Additional employment from production supported by Film Victoria
number of employees
2 400 2 340 2 340 5 370
Australian views of screen content supported by Film Victoria
number (million)
70 70 38 nm
The 2011-12 Target and the 2010-11 Expected Outcome is higher than the 2010-11 Target due to changed methodology in counting views.
Companies assisted in the financial services sector
number 40 40 40 41
Value of film, television and digital media production supported by Film Victoria production
$ million 80 78 78 179
This performance measure replaces the 2010-11 performance measure ‘Value of film, television and new media production supported by Film Victoria Production’. The 2011-12 performance measure is the same as the 2010-11 measure except for the removal of the word ‘new’ to be replaced with the word ‘digital’ and measures the same activity as per the performance measure in 2010-11.
Quality Percentage of companies that intend to implement new best practice tools and methodologies as a result of participating in the Innovation Insights Program
per cent 90 90 90 78
Cost Total output cost $ million 63.1 46.9 42.2 47.2
Variance between the 2010-11 Target and the 2010-11 Expected Outcome reflects the impact of additional carryover from 2009-10 to 2010-11 primarily for the Industry Transition Fund.Variance between the 2010-11 Target and the 2011-12 Target reflects new funding for the Regional Aviation Fund, Industry Capability Network, Geelong Manufacturing Council and the Feasibility Study for Geelong Regional Airport. In addition, variations in annual funding have occurred for the Industry Transition Fund, Transition to a Global Future program and the Victorian Industry and Manufacturing Strategy.
208 Business and Innovation Service Delivery 2011-12

Major Outputs/DeliverablesPerformance Measures
Unit of Measure
2011-12 Target
2010-11 Expected Outcome
2010-11 Target
2009-10 Actual
Small BusinessProvides business information, advisory and referral services that contribute to the growth and development of small and medium sized enterprises across Victoria.
Quantity Business interactions (call, web, in person)
number 450 000 400 000 285 000 408 940
The 2010-11 Expected Outcome is higher than the 2010-11 Target due to increased demand for services and the increasing use of Smart Forms. The 2011-12 Target is higher than the 2010-11 Target due to increased demand for new Business Victoria Online services expected in 2011-12.
Registration for online services number 90 000 90 000 80 000 74 772The 2011-12 Target is higher than the 2010-11 Target due to increased demand for new Business Victoria Online services expected in 2011-12.The 2010-11 Expected Outcome is higher than the 2010-11 Target due to increased demand in 2010-11 for new Business Victoria Online services.
Skills for Growth: businesses assisted number 7 000 5 500 3 500 2 740The 2010-11 Expected Outcome is higher than the 2010-11 Target due to greater than expected interest for the Skills for Growth program during this period. The 2011-12 Target is higher than the 2010-11 Target as the target measures cumulative performance since the inception of the program, not annual performance.
Skills for Growth: training placements number 55 000 35 000 35 000 12 459The 2011-12 Target is higher than the 2010-11 Target as the target measures cumulative performance since the inception of the program, not annual performance.
Quality Client satisfaction of small business information, referral, mentoring service and business programs
per cent 90 90 90 90
Victorian Small Business Commissioner – client satisfaction with mediation service
per cent 80 80 80 94
Victorian Small Business Commissioner – proportion of business disputes successfully mediated by Commissioner
per cent 75 75 75 77
Cost Total output cost $ million 51.2 35.4 33.4 33.4
Variance between the 2010-11 Target and the 2010-11 Expected Outcome reflects new funding received for the Business and Industry Assistance Package, the Floods Business Recovery Program and also the impact of additional carryover from 2009-10 to 2010-11 for Skills for the Future and Skills for Growth programs.Variance between the 2010-11 Target and the 2011-12 Target reflects new funding for Business Victoria Online and Natural Disaster Recovery programs. In addition, variations in annual funding have occurred for the Skills for Growth program.
Service Delivery 2011-12 Business and Innovation 209

Major Outputs/DeliverablesPerformance Measures
Unit of Measure
2011-12 Target
2010-11 Expected Outcome
2010-11 Target
2009-10 Actual
InnovationSupports innovation across Victorian sectors by providing access to information and building capacity for the effective use of new practices and technologies to support increased productivity and competitiveness in Victoria and assist Victorian businesses to grow.
Quantity Average monthly number of visits to Victoria Online
number 350 000 350 000 270 000 290 007
The 2010-11 Expected Outcome is higher than the 2010-11 Target due to search engine optimisation and user preference of accessing Government information and services online. The 2011-12 Target is higher than the 2010-11 Target due to the past year’s growth in patronage and established user preference.
Information Victoria public contact per contact officer per day
number 41 41 41 44
Quality Customer satisfaction with information services from Information Victoria
per cent 90 90 90 82
Timeliness Timely provision of public information per cent 95 95 95 95
Cost Total output cost $ million 16.5 21.8 14.0 19.3
Variance between the 2010-11 Target and the 2010-11 Expected Outcome reflects new funding for The Conversation and the impact of carryover from 2009-10 to 2010-11 for the Industry Transition Fund.
Variance between the 2010-11 Target and the 2011-12 Target reflects new funding for the Industry Sustainability Working Committee and a variation in annual funding for the Victorian Innovation Statement and Regional Blueprint initiatives.
Science and TechnologySupports increased productivity and competitiveness by facilitating the growth and sustainability of Victoria’s science and technology sector through the development and advanced use of new, emerging and transformative technologies.
Quantity Biotechnology projects and programs underway
number 20 16 16 15
The 2011-12 Target is higher than the 2010-11 Target due to new projects as a result of an increase in funding for biotechnology-related activities.
Contracts for the Innovation Commercialisation program under management
number 5 5 5 2
This performance measure replaces the 2010-11 performance measure ‘Contracts for the Technology Commercialisation program under management’. The 2011-12 performance measure is the same as the 2010-11 measure except for the replacement of the word ‘technology’ with ‘innovation’ and measures the same activity as per the performance measure in 2010-11.
210 Business and Innovation Service Delivery 2011-12

Major Outputs/DeliverablesPerformance Measures
Unit of Measure
2011-12 Target
2010-11 Expected Outcome
2010-11 Target
2009-10 Actual
ICT projects and programs underway number 45 37 37 41The 2011-12 Target is higher than the 2010-11 Target due to the overlap of broadband application projects from 2010-11 to 2011-12.
Operational Infrastructure Support grants under management
number 13 13 13 13
Science projects and programs underway
number 28 28 28 24
Small/Medium Enterprise (SME) research and development projects underway
number 27 28 27 20
Quality Percentage of funded science projects that are industry led
per cent 60 60 60 65
Cost Total output cost $ million 184.8 138.8 164.9 155.8
Variance between the 2010-11 Target and the 2010-11 Expected Outcome reflects the impact of the estimated carryover from 2010-11 to 2011-12, and a transfer of funding to future years, for the Victorian Innovation Statement.
Variance between the 2010-11 Target and the 2011-12 Target reflects new funding for the Office of the Lead Scientist and the Olivia Newton-John Cancer and Wellness Centre. In addition, variations in funding have occurred for the National ICT Australia and Biotechnology programs.
Strategic PolicyProvides research, analysis and advice on issues of strategic importance to Victoria’s economic development to improve competitiveness and support industry across Victoria, and assisting businesses to start-up, export and grow.
Quantity ICT policy reviews underway number 3 3 3 3Number of major research and evaluation projects completed
number 16 16 16 12
Cost Total output cost $ million 12.2 10.3 8.3 7.1
Variance between the 2010-11 Target and the 2010-11 Expected Outcome reflects increased annual funding for Strategic Policy initiatives.Variance between the 2010-11 Target and the 2011-12 Target reflects the increased annual funding for Strategic Policy initiatives and a greater allocation of corporate expenditure as a result of machinery of government changes.
Source: Department of Business and Innovation
Service Delivery 2011-12 Business and Innovation 211

Investment and TradeInvestment and trade outputs position Victoria as a world class investment location and optimise trade opportunities through investment attraction and facilitation services and export development initiatives and assistance.
Major Outputs/DeliverablesPerformance Measures
Unit of Measure
2011-12 Target
2010-11 Expected Outcome
2010-11 Target
2009-10 Actual
Investment Attraction and FacilitationProvides investment attraction and facilitation assistance to attract new international investment and encourage additional investment by companies already operating in Victoria.
Quantity ICT Investment projects under development
number 25 25 25 25
Investment projects under development
number 250 250 250 385
Jobs created in regional Victoria number 1 100 1 100 1 100 1 574This performance measure is transferred directly from the Regional Economic Development, Investment and Promotion output.
Jobs derived from investments facilitated
number 5 000 5 000 5 000 8 094
New financial services sector investment projects under development
number 5 5 5 5
New investment facilitated in regional Victoria
$ million 775 775 775 898
This performance measure is transferred directly from the Regional Economic Development, Investment and Promotion output.
New investments facilitated $ million 1 600 1 600 1 600 2 113
Cost Total output cost $ million 85.8 74.1 92.2 85.3
The 2010-11 Expected Outcome and 2010-11 Target represents the proportion of performance measures transferred from the Regional Economic Development, Investment and Promotion output as part of a restructure due to the machinery of government change.
Variance between the 2010-11 Target and the 2011-12 Target is due to a variation in funding for the Investment Support Program.
Variance between the 2010-11 Target and the 2010-11 Expected Outcome reflects the impact of the anticipated program carryover from 2010-11 to 2011-12 primarily related to the Victorian Industry and Manufacturing Strategy, Industry Support Program and Business Development initiatives.
212 Business and Innovation Service Delivery 2011-12

Major Outputs/DeliverablesPerformance Measures
Unit of Measure
2011-12 Target
2010-11 Expected Outcome
2010-11 Target
2009-10 Actual
ExportsPromotes and facilitates export opportunities for all Victorian businesses by providing export development assistance.
Quantity Companies participating in export programs
number 1 000 nm nm nm
New performance measure for 2011-12 to measure the number of companies participating in the export programs.
Exports facilitated and imports replaced $ million 1 000 739 739 1 328The 2011-12 Target is higher than the 2010-11 Target due to new business engagement processes that are more accurate in capturing departmental export outcomes.
ICT companies provided with export promotion
number 200 200 200 234
ICT Trade Fairs and Missions supported number 6 6 6 9New exports facilitated in regional Victoria
$ million 175 175 175 260
This performance measure is transferred directly from the Regional Economic Development, Investment and Promotion output.
Number of new companies participating in Export Programs
number 250 nm nm nm
New performance measure for 2011-12 to measure the number of companies participating in Export Programs for the first time.
Trade fairs and missions supported number 23 29 29 32The 2011-12 Target is lower than the 2010-11 Target due to the trend towards fewer but larger trade fairs and missions.
Quality Client satisfaction with export assistance offered
per cent 85 80 80 83
The 2011-12 Target is higher than the 2010-11 Target due to previous client feedback informing and improving export program design.
Cost Total output cost $ million 33.3 22.8 22.5 17.3
The 2010-11 Expected Outcome and 2010-11 Target represents the proportion of performance measures transferred from the Regional Economic Development, Investment and Promotion output as part of a restructure due to the machinery of government change.Variance between the 2010-11 Target and the 2011-12 Target reflects new funding received for the Investment Support Program, Industry Capability Network, Export Victoria and Victoria: Leader in Learning.
Source: Department of Business and Innovation
Service Delivery 2011-12 Business and Innovation 213

Employment and Industrial RelationsEmployment and Industrial Relations output responds to the labour needs of industry through the provision of targeted employment initiatives, as well as facilitating cooperative, flexible and productive workplaces.
Major Outputs/DeliverablesPerformance Measures
Unit of Measure
2011-12 Target
2010-11 Expected Outcome
2010-11 Target
2009-10 Actual
Employment and Industrial RelationsProvides programs to link business workforce needs with skilled migration and untapped labour sources to meet Victoria’s skills requirements. In addition, it advocates for and delivers programs aimed at establishing fair, cooperative and dynamic work environments in Victoria in private and public organisations.
Quantity Skilled Migration Victoria – average number of visits per month to the Live in Victoria website
number >75 000 75 000 >75 000 71 435
This performance measure is transferred directly from the Workforce Participation output.This performance measure replaces the 2010-11 performance measure ‘Global Skills for Victoria – average number of visits per month to the Live in Victoria website’. The 2011-12 performance measure is the same as the 2010-11 measure except for the name and measures the same activity as per the performance measure in 2010-11.
Government Youth Employment Scheme – apprenticeships and traineeships commenced
number 450-550 450-550 450-550 476
This performance measure is transferred directly from the Workforce Participation output.
Respond to general workplace enquiries number 11 000 15 000 15 000 16 045The 2011-12 Target is lower than the 2010-11 Target as potential clients are less likely to initiate general workplace enquiries as they will be provided with greater up-front information in 2011-12 from workplace visits, websites and promotional activity than occurred in 2010-11.
This performance measure is transferred directly from the Industrial Relations output.
Quality Client satisfaction with services provided to facilitate innovative and high performing workplaces and major investment projects
per cent 90 90 90 90
This performance measure is transferred directly from the Industrial Relations output.
Skilled Migration Victoria – client satisfaction with services provided
per cent 85 85 85 90.1
This performance measure is transferred directly from the Workforce Participation output.This performance measure replaces the 2010-11 performance measure ‘Global Skills for Victoria – client satisfaction with services provided’. The 2011-12 performance measure is the same as the 2010-11 measure except for the name and measures the same activity as per the performance measure in 2010-11.
214 Business and Innovation Service Delivery 2011-12

Major Outputs/DeliverablesPerformance Measures
Unit of Measure
2011-12 Target
2010-11 Expected Outcome
2010-11 Target
2009-10 Actual
Victoria represented in major industrial relations cases and inquiries
per cent 100 100 100 100
This performance measure was transferred from the 2010-11 Industrial Relations output, and replaces the 2010-11 performance measure ‘Victoria represented in major industrial relations cases and inquiries in accordance with Government policy’. The 2011-12 performance measure measures the same activity as per the performance measure in 2010-11.
Timeliness Skilled Migration Victoria – average processing time for state sponsorship applications
working days
25-30 25-30 25-30 29
This performance measure is transferred directly from the Workforce Participation output.
This performance measure replaces the 2010-11 performance measure ‘Global Skills for Victoria – average processing time for state sponsorship applications’. The 2011-12 performance measure is the same as the 2010-11 measure except for the name and measures the same activity as per the performance measure in 2010-11.
Cost Total output cost $ million 23.3 37.9 33.9 36.1
The 2010-11 Expected Outcome represents the proportion of performance measures transferred from the Workforce Participation and Industrial Relations outputs as part of the machinery of government change.
Variance between the 2010-11 Target and the 2010-11 Expected Outcome reflects a greater allocation of corporate expenditure as a result of machinery of government changes.
Variance between the 2010-11 Target and the 2011-12 Target reflects new funding priorities under the Employment Start Up Program.
Source: Department of Business and Innovation
Service Delivery 2011-12 Business and Innovation 215

Marketing VictoriaMarketing Victoria output promotes Victoria both nationally and internationally as a great place to live, work, invest, visit and learn by positioning Victoria as a distinct, competitive and fair business environment, exporter and tourist destination.
216 Business and Innovation Service Delivery 2011-12

Major Outputs/DeliverablesPerformance Measures
Unit of Measure
2011-12 Target
2010-11 Expected Outcome
2010-11 Target
2009-10 Actual
TourismFacilitates employment and longer term economic benefits of tourism to Victoria by developing and marketing the state as a competitive tourist destination for both domestic and international tourists so more tourists choose to visit Victoria.
Quantity Investment projects facilitated $ million 200-250 215 250-300 396
The 2011-12 Target and 2010-11 Expected Outcome is lower than the 2010-11 Target due to increased global competition.
Number of domestic overnight visitors number (million)
15.9-16.2 nm nm nm
New performance measure for 2011-12 to reflect the focus on tracking domestic visitation to Victoria.
Number of visitors (international) number (million)
1.6-1.8 1.6 1.5-1.7 1.54
The 2011-12 Target is higher that the 2010-11 target due to stronger recent performance.
Visitor Expenditure: domestic $ billion 12.1-13.1 12.3 12.0-13.0 12.2 international $ billion 3.8-4.4 3.9 3.6-4.2 3.8
The 2011-12 Target is higher than the 2010-11 Target due to stronger recent performance.
regional Victoria (domestic) $ billion 5.9-6.5 6.1 5.8-6.3 6The 2011-12 Target is higher than the 2010-11 Target due to stronger recent performance.
regional Victoria (international) $ million 290-330 290 286-331 300
Visitvictoria.com annual visits to site number (‘000)
7 000 6 500 6 500 6 685
The 2011-12 Target is higher than the 2010-11 Target due the increased demand from the China market.
Quality Value of media coverage generated:
domestic $ million 20-30 20-30 20-30 24 international $ million 40-50 40-50 40-50 68.3
Victoria’s share of domestic tourism advertising awareness among target markets: intrastate
per cent 16-21 16-21 16-21 19.2
Victoria’s share of domestic tourism advertising awareness among target markets: interstate
per cent 25-30 21-26 21-26 31.9
The 2011-12 Target is higher than the 2010-11 Target due to improved campaigns driving increased awareness.
Cost Total output cost $ million 73.9 152.5 76.6 90.9
Variance between the 2010-11 Target and the 2010-11 Expected Outcome reflects additional funding received for Natural Disaster Recovery and Major Events.
Source: Department of Business and Innovation
Service Delivery 2011-12 Business and Innovation 217

Major ProjectsInfrastructure investment ensures that future generations of Victorians enjoy improved services, stronger economic growth and increased job opportunities.
Major Outputs/DeliverablesPerformance Measures
Unit of Measure
2011-12 Target
2010-11 Expected Outcome
2010-11 Target
2009-10 Actual
Major ProjectsSupports an increased share of national business investment in Victoria through the management and delivery of nominated public construction and land development projects, the coordination of development projects and associated feasibility studies so Victoria’s infrastructure needs are optimised.
Quality Delivery of nominated Major Projects Victoria projects complies with agreed plans
per cent 100 100 100 100
Timeliness Princes Pier – Completion of the deck works restoration and the refurbishment of the gatehouse programs
date qtr 2 na qtr 4 nm
The 2011-12 Target reflects the extension of the project from qtr 4 in 2010-11 to qtr 2 in 2011-12 to take into account further works required on the gatehouse programs. Therefore the 2010-11 Expected Outcome is not applicable.
Cost Total output cost $ million 123.7 106.8 11.0 46.3
Variance between the 2010-11 Target and the 2010-11 Expected Outcome reflects the impact of the initial recognition of Kew Residential Development land sales and the estimated carryover from 2010-11 to 2011-12 for Major Projects funding.
Variance between the 2010-11 Target and the 2011-12 Target reflects new funding for an international competition to restore Flinders Street Station and the impact of the initial recognition of Kew Residential Development Land Sales.
Source: Department of Business and Innovation
218 Business and Innovation Service Delivery 2011-12
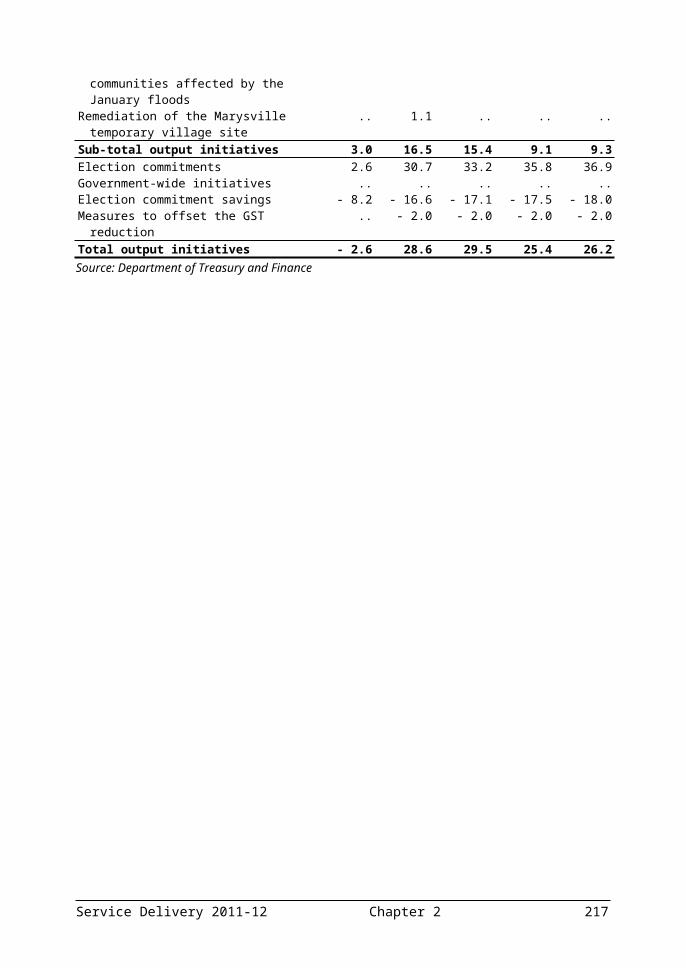
DEPARTMENT OF EDUCATION AND EARLY CHILDHOOD DEVELOPMENT
Departmental mission statementThe Department of Education and Early Childhood Development’s mission is to ensure a high quality and coherent birth-to-adulthood learning and development system to build the capability of every Victorian.
Departmental objectives The Department’s objectives involve providing and improving services to support: the best start in life; quality early childhood education and care; transition to school; engagement in learning; student achievement and improvement; successful youth transitions; effective educational, labour market and social participation; and responsiveness to labour market demand.
Key strategic priorities for 2011-12The Department’s key strategic priorities cover the following areas: early childhood development including capital investment; further
investment in supporting kindergarten children from low socio-economic families and children with disabilities; and supporting early childhood education and care in rural areas;
school education including investment in child welfare and students with special needs; evidence based investment in core literacy and numeracy; better curriculum options including specialisation and languages; and greater freedom for principals and school councils; and
higher education and skills including building skills and improving access to training opportunities for all Victorians; improving the quality of training; improving access to higher education for regional students.
Service Delivery 2011-12 Education and Early Childhood Development 219

Ministerial portfolios The Department supports three ministers across four portfolios – education; children and early childhood development; higher education and skills; and the teaching profession.
220 Education and Early Childhood Development Service Delivery 2011-12

Changes to the output structure The Department has made some changes to its output structure for 2011-12, as shown in the table below:2010-11 Outputs Reason 2011-12 OutputsRefer to Department of Business and Innovation output statements
Machinery of government changes
Skills
Refer to Department of Planning and Community Development output statements
Machinery of government changes
Adult Community and Further Education
All machinery of government changes resulting from the November 2010 election took effect on 1 January 2011.The following table summarises the Department’s total output cost. Table 3.4: Output summary
($ million)2010-11 Budget
2010-11 Revised
2011-12 Budget
Variation (a)
%Early Childhood Services (b) 404.2 415.0 447.7 10.8School Education
Early Years (schools) 2 736.1 2 697.4 2 818.8 3.0Middle Years (schools) 2 792.7 2 770.6 2 869.3 2.7Later Years and Youth Transitions 1 745.1 1 722.0 1 764.5 1.1Services to Students 883.5 885.8 920.1 4.1Adolescent Health Services (schools) (c) 10.6 10.8 11.2 5.7Policy and Regulation (d) 42.8 42.1 40.1 -6.3
Skills Skills 1 976.2 1 992.1 2 011.3 1.8Adult Community and Further Education (e) 58.0 98.3 107.2 84.8
Total (f) 10 649.2 10 634.1 10 990.2 3.2Source: Department of Education and Early Childhood Development
Notes:(a) Variation between 2010-11 Budget and 2011-12 Budget.(b) The higher 2011-12 Budget is due to new initiatives funded as part of the 2011-12
Budget, additional Commonwealth National Partnership funding to be received in 2011-12 and previous budget decisions.
(c) The 2011-12 Budget is greater than the 2010-11 Budget primarily due to price escalation and increased service delivery.
(d) The lower 2011-12 Budget is a result of a decrease in communications funding.(e) The higher 2011-12 Budget relates to increased demand driven funding approved
post the 2010-11 Budget.(f) Total output cost for 2011-12 Budget may not equate to the total expense reported
in Budget Paper No. 5, Chapter 3 Departmental financial statements due to additional statements in Budget Paper No. 5 that are not included in departmental output costs. Figures for 2010-11 Budget and 2010-11 Revised have been amended to reflect machinery of government changes and will not equate to total expenses reported in Departmental financial statements.
Service Delivery 2011-12 Education and Early Childhood Development 221

Amounts availableThe following tables detail the amounts available to the Department from Parliamentary authority and income generated through transactions. Table 3.5 outlines the Department’s income from transactions and Table 3.6 summarises the sources of Parliamentary authority available to the Department to fund the provision of outputs, additions to net asset base and payments made on behalf of the State.
Table 3.5: Income from transactions($ million)
2009-10 2010-11 2010-11 2010-11 2011-12 Actual Budget Adjusted (a) Revised BudgetOutput appropriations 7 342.9 7 898.7 8 681.0 8 625.4 9 787.9Special appropriations 179.2 72.3 72.3 69.3 37.1Interest 25.2 30.7 40.1 37.2 46.7Sale of goods and services 151.8 144.4 410.8 420.6 745.4Grants 72.5 18.0 18.0 5.0 ..Fair value of assets and services
received free of charge or for nominal consideration
0.1 .. .. .. ..
Other income 466.0 514.5 520.6 487.8 532.6Total income from transactions 8 237.9 8 678.5 9 742.7 9 645.2 11 149.6Source: Department of Education and Early Childhood Development and Department of Treasury and Finance
Note:(a) The 2010-11 Adjusted estimates include the 2010-11 Budget adjusted for
machinery of government changes.
Table 3.6: Parliamentary authority for resources($ million)
2010-11 2010-11 2010-11 2011-12 Budget Adjusted (a) Revised BudgetAnnual appropriations 8 007.5 8 605.5 8 396.4 9 215.2 Provision of outputs 7 769.8 8 367.2 8 260.4 9 159.3 Additions to the net asset base 237.7 238.2 136.0 55.9 Payments made on behalf of the State .. .. .. ..Receipts credited to appropriations 1 063.1 1 248.0 1 057.8 694.4Unapplied previous years appropriation 559.1 559.1 1 002.2 281.8 Provision of outputs 112.6 112.6 163.8 80.0 Additions to the net asset base 446.5 446.5 838.3 201.8Accumulated surplus - previously applied
appropriation.. .. .. ..
Gross annual appropriation 9 629.7 10 412.5 10 456.3 10 191.4Special appropriations 72.3 72.3 69.3 37.1Trust funds 2 380.7 2 380.7 2 522.4 2 218.9
222 Education and Early Childhood Development Service Delivery 2011-12

Total parliamentary authority 12 082.7 12 865.5 13 048.0 12 447.4Source: Department of Education and Early Childhood Development and Department of Treasury and Finance
Note:(a) The 2010-11 Adjusted estimates include the 2010-11 Budget adjusted for
machinery of government changes.
Service Delivery 2011-12 Education and Early Childhood Development 223

The following section provides details of the outputs provided to government, including performance measures and costs for each output. Due to the calendar year focus of the delivery of education, early childhood development, skills and adult and community and further education, 2011-12 Targets refer to the 2011 calendar year unless otherwise explicitly indicated. 2010-11 Expected Outcomes and Targets refer to the 2010 calendar year unless otherwise explicitly indicated. 2009-10 Actuals refer to the 2009 calendar year unless otherwise explicitly indicated. Final results are provided for 2010-11 Expected Outcomes where available. School-related measures mainly refer to the government school sector. 2009-10 Actuals reflect those published in the Department of Education and Early Childhood Development’s 2009-10 Annual Report, Department of Innovation, Industry and Regional Development’s 2009-10 Annual Report (for the Skills output) and the Department of Planning and Community Development’s 2009-10 Annual Report (for the Adult Community and Further Education output). Explanations for significant variances from 2009-10 Targets may be found in those reports. Total expenditure for the Department can be found in Budget Paper No. 5, Chapter 3 Departmental financial statements.
224 Education and Early Childhood Development Service Delivery 2011-12

Early Childhood ServicesThis output group provides funding for a range of services that support children in the early years, including kindergarten and child care, maternal and child health, school nursing for primary school aged children, and early intervention services for children with a disability. These outputs make a significant contribution to the key Government outcomes in early childhood services. This output group and its outputs contribute towards providing and improving services to support the following departmental objectives:
the best start in life;
quality early childhood education and care; and
transition to school.
Major Outputs/DeliverablesPerformance Measures
Unit of Measure
2011-12 Target
2010-11 Expected Outcome
2010-11 Target
2009-10 Actual
Child Health and Support ServicesCommunity-based maternal and child health services available to all families with children aged 0 to 6 years, and school nursing services for primary school aged children. This output provides developmental health surveillance, early intervention, parenting support and health education.
Quantity Prep aged students assessed by school nurses
number 56 000 57 007 56 000 55 906
This performance measure includes non-government schools.
Total number of clients (aged 0 to 1 year)
number 70 000 72 618 70 000 70 628
This performance measure refers to the previous financial year.
Quality Maternal and child health clients with children aged 0 to 1 year receiving enhanced maternal and child health services
per cent 10 17.7 10 16.1
This performance measure refers to the previous financial year.The high 2010-11 Expected Outcome and 2009-10 Actual were the result of overachievement by municipal councils.
Timeliness Children aged 0 to 1 month enrolled at maternal and child health services from birth notifications
per cent 98.5 99.6 98.5 99.6
This performance measure refers to the previous financial year.
Cost Total output cost $ million 107.8 106.7 105.1 102.4
This refers to the financial year.
Service Delivery 2011-12 Education and Early Childhood Development 225
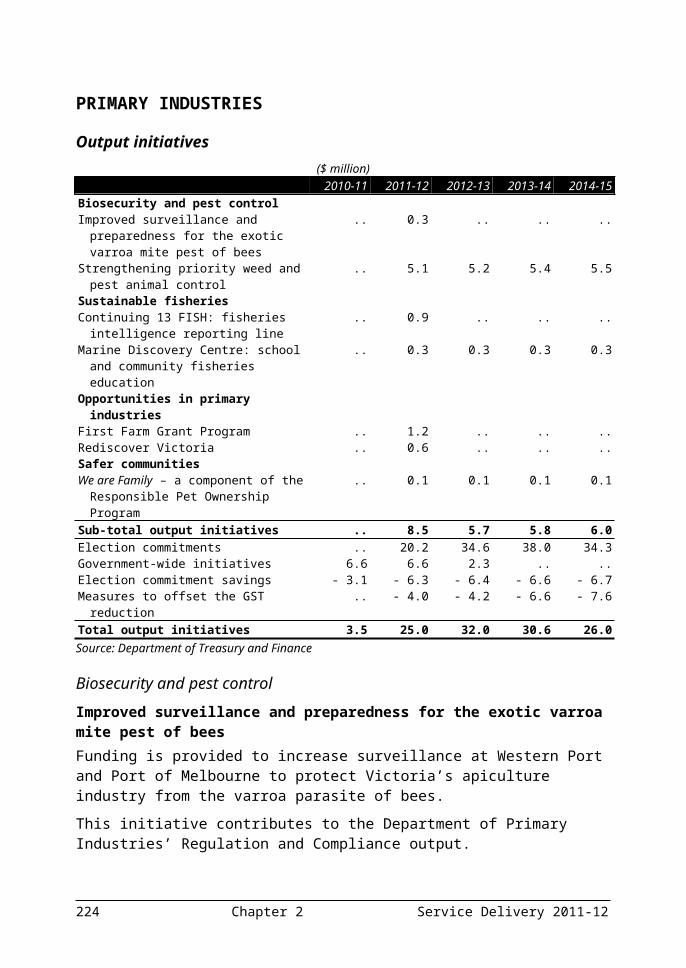
Major Outputs/DeliverablesPerformance Measures
Unit of Measure
2011-12 Target
2010-11 Expected Outcome
2010-11 Target
2009-10 Actual
Early Childhood Education and CareThis output involves the provision of kindergarten and child care services. These services include the licensing and monitoring of centre-based children’s services, and specialist services to improve access to kindergartens for disadvantaged children.
Quantity Children funded to participate in kindergarten
number 68 750 66 651 66 090 62 365
This performance measure includes second year participants and refers to the financial year from 2010-11 onwards. The higher 2011-12 Target reflects projected increased demand for kindergarten.
Kindergarten participation rate per cent 93.5 95.1 92 92.7This performance measure includes first year participants only.
Quality Funded kindergarten services with a quality assurance process
per cent 94 96 94 98
Cost Total output cost $ million 270.8 247.0 237.9 207.9
This refers to the financial year. The higher 2011-12 Target is due to new initiatives funded as part of the 2011-12 Budget and additional Commonwealth National Partnership funding to be received in 2011-12.
Early Childhood Intervention ServicesThis output provides a range of services and support for children with a developmental delay or disability and their families.
Quantity Number of places and packages funded annually
number 10 325 10 325 10 325 10 325
This performance measure refers to the previous financial year.
Total number of children receiving a service
number 12 650 12 650 12 650 12 541
This performance measure refers to the previous financial year.
Quality Families who are satisfied with the service provided
per cent 85 93 85 92
This performance measure refers to the previous financial year.
Cost Total output cost $ million 69.1 61.3 61.2 55.9
This refers to the financial year. The higher 2011-12 Target is a result of previous budget decisions.
Source: Department of Education and Early Childhood Development
226 Education and Early Childhood Development Service Delivery 2011-12

School EducationThe school education output group provides services to support students in schools. It consists of six outputs:
‘Early Years’ provides services to develop essential skills and learning experiences to engage young minds.
‘Middle Years’ consolidates competencies in literacy and numeracy including creative and critical thinking, as well as the physical, social, emotional and intellectual development of early adolescence.
‘Later Years and Youth Transitions’ provides education services as well as varied pathways and support for transition across sectors to further study or employment.
‘Services to Students’ covers student welfare and support, services to students with disabilities, the education maintenance allowance, school start bonus payments, student transport and school-focused youth services.
‘Adolescent Health Services (schools)’ involves the provision of school nursing services for secondary school-aged children.
‘Policy and Regulation’ involves provision of policy, administrative support and strategic advice on school education to the ministers, information services about school education, administrative support services for the statutory authorities in the education portfolio including regulatory and advisory bodies, and international education.
This output group and its outputs contribute towards providing and improving services to support departmental objectives of:
transition to school;
engagement in learning;
student achievement and improvement; and
successful youth transitions.
Major Outputs/DeliverablesPerformance Measures
Unit of Measure
2011-12 Target
2010-11 Expected Outcome
2010-11 Target
2009-10 Actual
Early Years (schools)This output involves provision of education and other associated services designed to improve the quality of student learning of those in Prep to Year 4 in government and non-government schools.
Quantity Average Prep-Year 2 class size number 21 20.5 21 20.5
Service Delivery 2011-12 Education and Early Childhood Development 227

Major Outputs/DeliverablesPerformance Measures
Unit of Measure
2011-12 Target
2010-11 Expected Outcome
2010-11 Target
2009-10 Actual
Investment in non-government schools (Prep-Year 4)
$ million 173.4 142.8 141.9 139.5
This refers to the financial year. The higher 2011-12 Target is due to additional funding to be received under the 2010 to 2013 Non-Government Schools Funding Agreement, and recognises the increase of Prep to Year 4 students enrolled in non-government schools.
The 2011-12 Target excludes the impact of funding announced as part of the 2011-12 Budget for fair funding for non-government schools.
Number of Assistant Principals, aspiring leaders and leadership teams participating in leadership development programs
number 800 865 800 848
The high 2010-11 Expected Outcome and 2009-10 Actual are due to higher than expected demand.
Number of Principals participating in state-wide, centrally funded leadership development programs
number 310 384 310 322
The high 2010-11 Expected Outcome and 2009-10 Actual are due to higher than expected demand.
State-wide computer to student ratio: primary
ratio 1:3 1:3 1:3 1:2.86
This refers to the financial year.
Quality Parent satisfaction with primary schooling on a 100-point scale
100-point scale
80 81 80 81
Percentage of Indigenous students meeting the national minimum standard for reading in Year 3 (National Assessment Program Literacy and Numeracy (NAPLAN) testing)
per cent 87 87 87 87.2
This performance measure, targets, expected outcome and results for NAPLAN measures have 95 per cent confidence intervals as high as +4.5 per cent and -4.5 per cent. For example, the percentage of 2008 Victorian Indigenous students meeting the minimum standard for numeracy in Year 9 was 78.4 per cent +/-4.5 per cent. This means that there is a 95 per cent chance that the true percentage actually lies somewhere between 73.9 per cent and 82.9 per cent.
Percentage of Indigenous students meeting the national minimum standard for numeracy in Year 3 (NAPLAN testing)
per cent 88 86.5 88 89.4
This performance measure, targets, expected outcome and results for NAPLAN measures have 95 per cent confidence intervals as high as +4.5 per cent and -4.5 per cent. The 2010-11 Expected Outcome of 86.5 per cent has a 95 per cent confidence interval of +2.4 per cent. This means that there is a 95 per cent chance that the true result lies somewhere between 84.1 per cent and 88.9 per cent. Consequently, the target of 88 per cent is within the confidence interval range of the result, and the target can be deemed to have been met.
228 Education and Early Childhood Development Service Delivery 2011-12

Major Outputs/DeliverablesPerformance Measures
Unit of Measure
2011-12 Target
2010-11 Expected Outcome
2010-11 Target
2009-10 Actual
Percentage of students meeting the national minimum standard for reading in Year 3 (NAPLAN testing)
per cent 94 95.4 94 95.2
This performance measure, targets, expected outcome and results for NAPLAN measures have 95 per cent confidence intervals as high as +4.5 per cent and -4.5 per cent.
Percentage of students meeting the national minimum standard for numeracy in Year 3 (NAPLAN testing)
per cent 94.5 95.4 94 95.6
These performance measures, targets, expected outcomes and results for NAPLAN measures have 95 per cent confidence intervals as high as +4.5 per cent and -4.5 per cent.
Cost Total output cost $ million 2 818.8 2 697.4 2 736.1 2 620.6
This refers to the financial year.
Middle Years (schools)This output involves provision of education and other associated services designed to improve the quality of student learning of those in Years 5 to 9 in government and non-government schools.
Quantity Average rate of student attendance at Year 5
per cent 94 94 94 93
The attendance rate covers all absences, including those due to illness and family holidays.
Average rate of student attendance at Year 6
per cent 94 94 94 93
The attendance rate covers all absences, including those due to illness and family holidays.
Average rate of student attendance in Years 7-10
per cent 91 91 91 90
The attendance rate covers all absences, including those due to illness and family holidays.
Investment in non-government schools (Year 5-9)
$ million 229.4 221.4 220.0 216.1
This refers to the financial year.
The 2011-12 Target excludes the impact of funding announced as part of the 2011-12 Budget for fair funding for non-government schools.
Statewide computer to student ratio: secondary
ratio 1:2.5 1:3 1:3 1:2.49
This refers to the financial year.
Quality Parent satisfaction with secondary schooling on a 100-point scale
100-point scale
72 72 72 72
Service Delivery 2011-12 Education and Early Childhood Development 229

Major Outputs/DeliverablesPerformance Measures
Unit of Measure
2011-12 Target
2010-11 Expected Outcome
2010-11 Target
2009-10 Actual
Percentage of Indigenous students meeting the national minimum standard for reading in Year 5 (NAPLAN testing)
per cent 83 84.8 83 84.8
This performance measure, targets, expected outcome and results for NAPLAN measures have 95 per cent confidence intervals as high as +4.5 per cent and -4.5 per cent.
Percentage of Indigenous students meeting the national minimum standard for numeracy in Year 5 (NAPLAN testing)
per cent 83 87.4 83 86.9
These performance measures, targets, expected outcomes and results for NAPLAN measures have 95 per cent confidence intervals as high as +4.5 per cent and -4.5 per cent.
Percentage of Indigenous students meeting the national minimum standard for reading in Year 7 (NAPLAN testing)
per cent 83 87.7 83 84.4
This performance measure, targets, expected outcome and results for NAPLAN measures have 95 per cent confidence intervals as high as +4.5 per cent and -4.5 per cent.
Percentage of Indigenous students meeting the national minimum standard for numeracy in Year 7 (NAPLAN testing)
per cent 83 85.5 83 85.4
This performance measure, targets, expected outcome and results for NAPLAN measures have 95 per cent confidence intervals as high as +4.5 per cent and -4.5 per cent.
Percentage of Indigenous students meeting the national minimum standard for reading in Year 9 (NAPLAN testing)
per cent 80 76.6 80 79.3
This performance measure, targets, expected outcome and results for NAPLAN measures have 95 per cent confidence intervals as high as +4.5 per cent and -4.5 per cent.
The 2010-11 Expected Outcome of 76.6 per cent has a 95 per cent confidence interval of +3.8 per cent. This means that there is a 95 per cent chance that the true result lies somewhere between 72.8 per cent and 80.4 per cent. Consequently, the target of 80 per cent is within the confidence interval range of the result, and the target can be deemed to have been met.
Percentage of Indigenous students meeting the national minimum standard for numeracy in Year 9 (NAPLAN testing)
per cent 80 80.9 80 83.8
This performance measure, targets, expected outcome and results for NAPLAN measures have 95 per cent confidence intervals as high as +4.5 per cent and -4.5 per cent.
Percentage of students meeting the national minimum standard for reading in Year 5 (NAPLAN testing)
per cent 93 94.2 93 94.2
This performance measure, targets, expected outcome and results for NAPLAN measures have 95 per cent confidence intervals as high as +4.5 per cent and -4.5 per cent.
230 Education and Early Childhood Development Service Delivery 2011-12

Major Outputs/DeliverablesPerformance Measures
Unit of Measure
2011-12 Target
2010-11 Expected Outcome
2010-11 Target
2009-10 Actual
Percentage of students meeting the national minimum standard for numeracy in Year 5 (NAPLAN testing)
per cent 93.5 95.7 93 95.5
This performance measure, targets, expected outcome and results for NAPLAN measures have 95 per cent confidence intervals as high as +4.5 per cent and -4.5 per cent.
Percentage of students meeting the national minimum standard for reading in Year 7
per cent 94 96.2 93 95.4
This performance measure, targets, expected outcome and results for NAPLAN measures have 95 per cent confidence intervals as high as +4.5 per cent and -4.5 per cent.
Percentage of students meeting the national minimum standard for numeracy in Year 7
per cent 95 96.1 95 96.0
This performance measure, targets, expected outcome and results for NAPLAN measures have 95 per cent confidence intervals as high as +4.5 per cent and -4.5 per cent.
Percentage of students meeting the national minimum standard for reading in Year 9 (NAPLAN testing)
per cent 93 93.3 93 94.3
This performance measure, targets, expected outcome and results for NAPLAN measures have 95 per cent confidence intervals as high as +4.5 per cent and -4.5 per cent.
Percentage of students meeting the national minimum standard for numeracy in Year 9 (NAPLAN testing)
per cent 93.5 94.8 93 96.3
This performance measure, targets, expected outcome and results for NAPLAN measures have 95 per cent confidence intervals as high as +4.5 per cent and -4.5 per cent.
Percentage of Year 9 students reaching the top two Bands (Bands 9 and 10) in NAPLAN Reading
per cent 19 20 19 nm
This performance measure, targets, expected outcome and results for NAPLAN measures have 95 per cent confidence intervals as high as +4.5 per cent and -4.5 per cent. The scale for each domain is divided into ten bands to cover the full range of student achievement in the tests. The bands map the increasing complexity of the skills assessed by NAPLAN.
Percentage of Year 9 students reaching the top two Bands (Bands 9 and 10) in NAPLAN Numeracy
per cent 21 24.9 21 nm
This performance measure, targets, expected outcome and results for NAPLAN measures have 95 per cent confidence intervals as high as +4.5 per cent and -4.5 per cent.
The scale for each domain is divided into ten bands to cover the full range of student achievement in the tests. The bands map the increasing complexity of the skills assessed by NAPLAN.
Years 5-6 students’ opinion of their connectedness with the school
number (1-5)
4.3 4.3 4.3 4.3
Data is drawn from the Attitudes to School survey, where a higher score represents a higher level of connectedness.
Years 7-9 students’ opinion of their connectedness with the school
number (1-5)
3.6 3.6 3.6 3.6
Data is drawn from the Attitudes to School survey, where a higher score represents a higher level of connectedness.
Service Delivery 2011-12 Education and Early Childhood Development 231

Major Outputs/DeliverablesPerformance Measures
Unit of Measure
2011-12 Target
2010-11 Expected Outcome
2010-11 Target
2009-10 Actual
Cost Total output cost $ million 2 869.3 2 770.6 2 792.7 2 678.0
This refers to the financial year.
Later Years and Youth TransitionsThis output involves the provision of education and associated services designed to improve the quality of student educational outcomes of those in Years 10 to 12 in government and non-government schools. It also covers the provision of cross-sectoral services to improve the transition of young people to further education, training and employment.
Quantity Investment in non-government schools (Years 10-12)
$ million 142.7 145.0 144.1 141.6
This refers to the financial year.
The 2011-12 Target excludes the impact of funding announced as part of the 2011-12 Budget for fair funding for non-government schools.
Number of certificate enrolments in accredited vocational programs in schools
number 50 000 54 813 50 000 52 568
This performance measure includes non-government schools.
The higher than anticipated 2010-11 Expected Outcome and 2009-10 Actual compared to their respective 2010-11 and 2009-10 Targets may be due to the impact of successful Youth Transitions initiatives implemented by the Department.
Number of school students enrolled in VCAL
number 14 000 14 998 14 000 14 139
This performance measure includes non-government schools.The higher than anticipated 2010-11 Expected Outcome and 2009-10 Actual compared to their respective 2010-11 and 2009-10 Targets may be due to the impact of successful Youth Transitions initiatives implemented by the Department.
Number of school students participating in accredited vocational programs
number 39 000 43 066 39 000 41 351
This performance measure includes non-government schools.
The higher than anticipated 2010-11 Expected Outcome and 2009-10 Actual compared to their respective 2010-11 and 2009-10 Targets may be due to the impact of successful Youth Transitions initiatives implemented by the Department.
Number of school students satisfactorily completing at least one VCAL certificate
number 7 000 8 551 7 000 7 456
This performance measure includes non-government schools.The higher than anticipated 2010-11 Expected Outcome and 2009-10 Actual compared to their respective 2010-11 and 2009-10 Targets may be due to the impact of successful Youth Transitions initiatives implemented by the Department.
232 Education and Early Childhood Development Service Delivery 2011-12

Major Outputs/DeliverablesPerformance Measures
Unit of Measure
2011-12 Target
2010-11 Expected Outcome
2010-11 Target
2009-10 Actual
Number of school-based apprentices/ trainees
number 3 000 3 349 4 000 4 451
This performance measure includes non-government schools.The lower 2011-12 Target and 2010-11 Expected Outcome are the result of counting rule changes applied by the Victorian Skills Commission where only integrated school based apprentices and trainees are counted and non-integrated school-based apprentices and trainees are no longer accounted for.
Quality Average rate of student attendance in Years 11 and 12
per cent 91 91 91 91
Enrolments in units of accredited vocational programs in schools as a proportion of total VCE unit enrolments in schools
per cent 7.8 8.5 7.8 8.4
This performance measure includes non-government schools.The higher than anticipated 2010-11 Expected Outcome and 2009-10 Actual compared to their respective 2010-11 and 2009-10 Target may be due to the impact of successful Youth Transitions initiatives implemented by the Department.
Median VCE study score number 29 28 29 29Percentage of VCAL Certificates satisfactorily completed by school students
per cent 62 74.5 62 71.3
This performance measure includes non-government schools.The higher than anticipated 2010-11 Expected Outcome and 2009-10 Actual compared to their respective 2010-11 and 2009-10 Target may be due to the impact of successful Youth Transitions initiatives implemented by the Department.
Percentage of school leavers completing a VCE VET certificate program in a school progressing to further education, training or work
per cent 90 90 90 96
This performance measure includes non-government schools.
The high 2009-10 Actual compared to the 2009-10 Target may be due to the impact of successful Youth Transitions initiatives implemented by the Department.
Percentage of school leavers completing an Intermediate or Senior VCAL certificate in a school progressing to further education, training or work
per cent 80 80 80 87
This performance measure includes non-government schools.
Statewide rate of transition from Year 10 to Year 11
per cent 97 97.5 97 97.6
Data based on the February school census. This performance measure captures government schools only.
Cost Total output cost $ million 1 764.5 1 722.0 1 745.1 1 671.9
This refers to the financial year.
Service Delivery 2011-12 Education and Early Childhood Development 233

Major Outputs/DeliverablesPerformance Measures
Unit of Measure
2011-12 Target
2010-11 Expected Outcome
2010-11 Target
2009-10 Actual
Services to StudentsThis output covers student welfare and support, services to students with disabilities, school-focused youth services, education maintenance allowance and student transport.
Quantity Eligible special school students provided with appropriate travel
number 7 562 7 314 6 850 6 894
This refers to the financial year.
The higher 2011-12 Target and the higher than anticipated 2010-11 Expected Outcome compared with the 2010-11 Target are due to the high levels of eligible students attending special schools.
Investment in services to students with disabilities
$ million 605.3 556.7 549.5 508.4
This refers to the financial year.
The higher 2011-12 Target is due to additional funding for enrolment growth, price escalation for anticipated cost increases and increased operating expenses associated with school infrastructure.
Investment in student transport $ million 103.2 102.2 97.3 93.3This refers to the financial year.
The higher 2011-12 Target is due to the increase in demand and price escalation for anticipated cost increase in 2011-12.
The higher 2010-11 Expected Outcome is due to increased demand on services for students with disabilities.
Investment in student welfare and support
$ million 134.1 125.0 128.0 125.1
This refers to the financial year.The higher 2011-12 Target is a result of new initiatives funded from the 2011-12 Budget and price escalation for anticipated cost increases in 2011-12.
Provision of Education Maintenance Allowance
$ million 62.9 62.9 63.5 60.6
This refers to the financial year.
Provision of School Start Bonus payment
$ million 14.6 39.0 40.8 38.6
This refers to the financial year. The lower 2011-12 Target is due to the targeting of the School Start Bonus to assist low income families most in need, as identified by those eligible for the Education Maintenance Allowance.
School students (government) supported by conveyance allowance
number 12 900 13 100 13 300 12 939
This refers to the financial year. The lower 2011-12 Target reflects the use of the ‘Accessibility/Remoteness Index of Australia’ (ARIA) to determine eligibility for conveyance allowance.The lower 2010-11 Expected Outcome is due to the lower than expected number of students eligible for the conveyance allowance.
234 Education and Early Childhood Development Service Delivery 2011-12
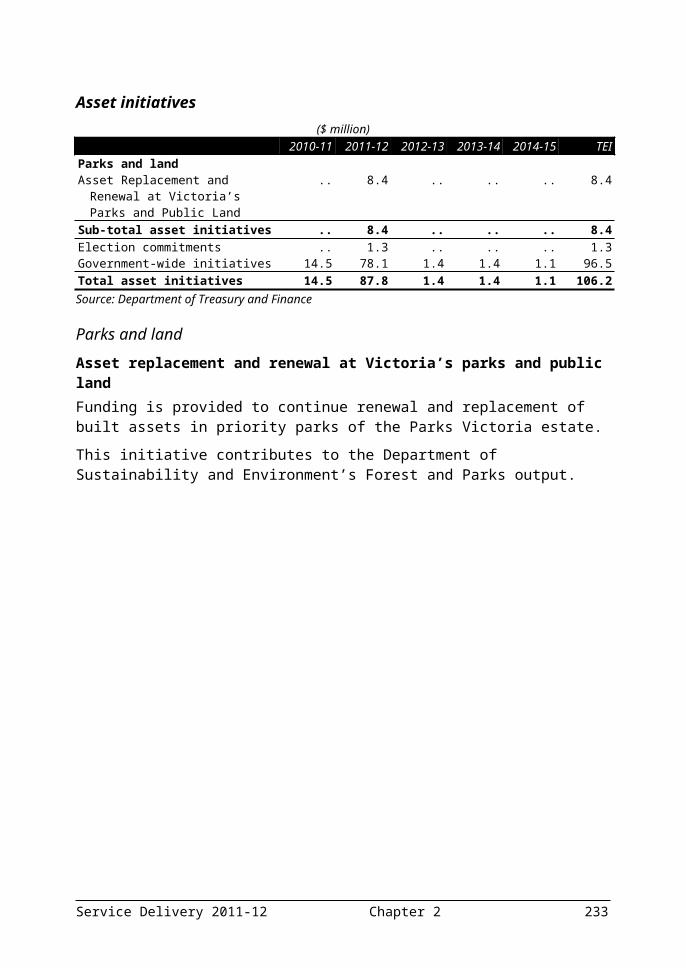
Major Outputs/DeliverablesPerformance Measures
Unit of Measure
2011-12 Target
2010-11 Expected Outcome
2010-11 Target
2009-10 Actual
School students (non-government) supported by conveyance allowance
number 33 830 36 200 34 900 36 635
This refers to the financial year. The lower 2011-12 Target reflects the use of the ‘Accessibility/Remoteness Index of Australia’ (ARIA) to determine eligibility for conveyance allowance.The higher 2010-11 Expected Outcome is due to the high level of students deemed eligible in the non-government sector for conveyance allowances and increased enrolments for eligible students attending special schools.
Schools funded for primary welfare officers
number 580 520 520 543
This refers to the financial year. This performance measure has been transferred directly from the Early Years Output where it was previously reported.The higher 2011-12 Target reflects the 2011-12 Budget initiative to fund additional Primary Welfare Officers. The targets are based on an estimate of the number of schools eligible for primary welfare officer funding. Actual results may vary from year to year due to factors such as funding levels, student enrolments and the student family occupation index.
Students funded under the disabilities program in government schools as a proportion of the total student population
per cent 3.8 3.7 3.6 3.5
Students receiving school start bonus payment
number 39 000 135 000 130 000 131 812
This performance measure replaces the 2010-11 performance measure ‘Students receiving school start-up payment’. The 2011-12 performance measure is the same as the 2010-11 measure except for the name change.The lower 2011-12 Target is due to the targeting of the School Start Bonus to assist low income families most in need, as identified by those eligible for the Education Maintenance Allowance. This refers to the financial year. This performance measure includes non-government schools.
Quality Parent satisfaction with special education on a 100-point scale
100-point scale
85 85 85 85
School satisfaction with student support services
per cent 75 73.2 84 83.6
The lower 2011-12 Target and lower than anticipated 2010-11 Expected Outcome are due to the Student Support Services Program undergoing major reforms during the period of the school surveys. Schools perception of Student Support Services may have been impacted during the introduction of the new model including perceptions that there was a reduced role in determining service priorities and allocating resources under the new model. The service delivery arrangements are currently being reviewed. The current period of review and implementation of the revised model will not be completed until December 2012. It is likely principal satisfaction levels will continue to be affected during the transition period.
Cost Total output cost $ million 920.1 885.8 883.5 826.0
This refers to the financial year.
Service Delivery 2011-12 Education and Early Childhood Development 235

Major Outputs/DeliverablesPerformance Measures
Unit of Measure
2011-12 Target
2010-11 Expected Outcome
2010-11 Target
2009-10 Actual
Adolescent Health Services (schools)This output involves the provision of school nursing services for secondary school-aged children. This output seeks to provide high quality, accessible health and community services.
Quantity Designated schools receiving secondary school nursing services
number 193 198 198 198
The lower 2011-12 Target is due to the amalgamation of schools.
Cost Total output cost $ million 11.2 10.8 10.6 10.4
This refers to the financial year.
The 2011-12 Target is greater than the 2010-11 Target primarily due to price escalation and increased service delivery.
Policy and RegulationThis output involves provision of policy, administrative and strategic advice on school education to the Ministers (including parliamentary and legislative responsibilities). It also covers provision of administrative support services for the various statutory authorities including the Victorian Curriculum and Assessment Authority and Victorian Registration and Qualifications Authority, regulation and advisory bodies and for international education.
Quantity Participants benefiting from initiatives to increase the supply of trained/ qualified teachers
number 630 525 525 533
This refers to the financial year.The 2011-12 Target has been raised due to the 2011-12 Budget initiatives for Primary Mathematics and Science Specialists and Science Graduate Scholarship Program.
Cost Total output cost $ million 40.1 42.1 42.8 41.9
This refers to the financial year. The lower 2011-12 Target is a result of a decrease in communications funding.
Source: Department of Education and Early Childhood Development
236 Education and Early Childhood Development Service Delivery 2011-12

SkillsThis output group consists of two outputs. The Skills and Adult Community and Further Education outputs respond to the labour and skills needs of individuals and industry. These outputs involve the planning and purchasing of vocational education and training services. The output group covers development and implementation of effective strategies for accredited and pre-accredited vocational education and training through adult community education. This output group and its outputs contribute towards providing and improving services to support the departmental objectives of:
successful youth transitions;
effective educational, labour market and social participation; and
responsiveness to labour market demand.
Major Outputs/DeliverablesPerformance Measures
Unit of Measure
2011-12 Target
2010-11 Expected Outcome
2010-11 Target
2009-10 Actual
SkillsEnsuring quality of service and supporting increased participation in training in Victoria by:
developing strategic advice and analysis on Victoria’s skill requirements;
contracting for and monitoring training services provided by TAFE institutes and private registered training organisations; and
building the capability and competitiveness of the vocational education and training system.
Quantity Annual government funded module enrolments
number (million)
3.7 3.5 2.6 2.78
The higher 2011-12 Target reflects an increase in the uptake of higher level courses, which generally involves students undertaking more modules.
Audit of contract compliance by registered training organisations and other State Training Systems organisations
number 250 250 250 173
Government funded student contact hours of training and further education provided
number (million)
127 114 90 95.5
The higher 2011-12 Target and 2010-11 Expected Outcome reflect an increase in the uptake of higher level courses, which generally involves undertaking more contact hours per enrolment.
Number of apprenticeship/traineeship commencements by new employees
number 56 000 54 000 54 000 57 071
This refers to the financial year.
The 2011-12 Target has been raised in line with trend data that indicates an increase in commencements.
Service Delivery 2011-12 Education and Early Childhood Development 237

Major Outputs/DeliverablesPerformance Measures
Unit of Measure
2011-12 Target
2010-11 Expected Outcome
2010-11 Target
2009-10 Actual
Number of apprentices/trainees who qualify for the completion bonus
number 14 000 14 000 14 000 18 945
This performance measure replaces the 2010-11 performance measure ‘Number of apprenticeships trainees completions who qualify for the completion bonus’. The 2011-12 performance measure is the same as the 2010-11 measure except for the name change.This refers to the financial year.
The high 2009-10 Actual is due to the higher than expected level of completions.
Number of government funded course enrolments in Skills Deepening qualifications
number 76 000 71 000 65 000 63 700
The higher 2011-12 Target and 2010-11 Expected Outcome reflect the increased uptake of Skills Deepening qualifications since the introduction of skills reform.
Quality Participation rate of 15-24 year olds in training and further education in Victoria
per cent 28.2 28.1 25.1 25.4
The 2011-12 Target has been increased in line with preliminary data (2010-11 Expected Outcome) that indicates an increase in VET participation among 15-24 year olds.
Participation rate of 25-64 year olds in training and further education in Victoria
per cent 9.8 9.7 9.2 9.4
The 2011-12 Target has been increased in line with preliminary data (2010-11 Expected Outcome) that indicates an increase in VET participation among 25-64 year olds.
Percentage of VET graduates who rate quality of training as four or more out of five
per cent 88.5 87.8 88 88.4
Successful training completions as measured by module load pass rate
per cent 77.9 77.7 77.5 79.3
VET graduates in employment six months following graduation
per cent 78.5 76.3 80 78.5
The lower 2010-11 Expected Outcome and 2011-12 Target reflect the impact of the economic slowdown which had a negative impact on apprenticeship numbers.
Cost Total output cost $ million 2 011.3 1 992.1 1 976.2 2 018.0
This refers to the financial year.
238 Education and Early Childhood Development Service Delivery 2011-12

Major Outputs/DeliverablesPerformance Measures
Unit of Measure
2011-12 Target
2010-11 Expected Outcome
2010-11 Target
2009-10 Actual
Adult Community and Further EducationDevelop and implement effective strategies for accredited and pre-accredited vocational education and training through adult community education to ensure access to and increased participation in life-long skills development.
Quantity Annual delivery of student contact hours government funded – Adult and Community Education (ACE) organisations and Adult Education Institutions (AEIs)
number (million)
8.80 8.20 7.80 nm
The higher 2011-12 Target reflects an increase in the uptake of higher level courses, which generally involves undertaking more contact hours per enrolment
Annual delivery of student contact hours government funded through the Adult Community and Further Education Board (ACFEB) – ACE organisations and AEIs
number (million)
6.80 6.20 5.74 6.99
The higher 2011-12 Target reflects an increase in the uptake of higher level courses, which generally involves undertaking more contact hours per enrolment.
The high 2009-10 Actual represented increased delivery as a result of enhanced entitlement to government funded training places.
Annual Vocational Education and Training (VET) module enrolments government funded through the ACFEB-ACE organisations and AEIs
number 200 000 180 000 170 000 188 437
The higher 2011-12 Target reflects an increase in the uptake of higher level courses, which generally involves undertaking more modules.The high 2009-10 Actual represented increased module enrolments as a result of enhanced entitlement to government funded training places.
Number of government funded Skills Deepening level course enrolments in ACFEB registered ACE organisations and AEIs
number 900 800 600 686
The higher 2011-12 Target reflects the increased uptake of Skills Deepening qualifications since the introduction of skills reform.
The high 2009-10 Actual reflects increased Skill Deepening course enrolments as a result of enhanced entitlement to government supported training places.
Number of pre-accredited module enrolments government funded through the ACFEB-ACE organisations and AEIs
number 38 000 38 000 40 000 38 144
The lower 2011-12 Target reflects the trend in actuals over the last few years.
Service Delivery 2011-12 Education and Early Childhood Development 239

Major Outputs/DeliverablesPerformance Measures
Unit of Measure
2011-12 Target
2010-11 Expected Outcome
2010-11 Target
2009-10 Actual
Participation of 15-24 year olds in Youth Compact as a proportion of government funded delivery in ACFEB registered ACE organisations and AEIs
per cent 20 20 30 nm
The lower 2011-12 Target and 2010-11 Expected Outcome are due to lower than anticipated actual participation rates among 15-24 year olds in ACE.
Quality Student satisfaction with ACE courses meeting overall needs
per cent 80 80 80 82.26
Successful completions as measured by module load completion rate – ACFEB funded ACE organisations and AEIs
per cent 73 72 73 67.54
Cost Total output cost $ million 107.2 98.3 58.0 63.1
This refers to the financial year.
The higher 2010-11 Expected Outcome and 2011-12 Target relate to increased demand driven funding approved post 2010-11 Budget.
Source: Department of Education and Early Childhood Development
240 Education and Early Childhood Development Service Delivery 2011-12

DEPARTMENT OF HEALTH
Departmental mission statementThe Department of Health’s mission is to achieve the best health and wellbeing for all Victorians.
Departmental objectives The Department of Health undertakes planning, policy development and funding of health care activities to promote and protect the health and wellbeing of all Victorians. Hospital services; mental health services; aged care and public health activities are delivered in partnership with public and private health service providers, local government and non-government service providers. The health and hospital system continues to be under pressure from population growth, an ageing population, increasing prevalence of chronic disease, and the escalating costs of health care technology. In this context, the Department, in conjunction with service delivery partners, aims to: improve health service performance; reform mental health and drug and alcohol services to better meet client needs; strengthen prevention and health promotion; develop our health service system and organisation; respond to an ageing population; and enable optimal health outcomes.In 2011-12 these objectives will inform the Department’s work in implementing the Government’s commitment to creating a transparent and accountable approach to health service delivery in Victoria; improved health services performance; and system capacity within a tight fiscal environment.
Key strategic priorities for 2011-12 To support the Government’s commitment to improving health and hospital care for Victorians, key Departmental priorities for 2011-12 are: planning for a better health system – through initiatives including a
Victorian Health Plan 2022, providing policy and planning directions for a Metropolitan Health Plan 2012-2022, Rural and Regional Health Plan 2012-2022, a Health Capital and Resources Plan 2012-2022 and a Victorian Health and Wellbeing Plan 2012-2015; and a whole of government alcohol and other drug strategy to reduce the incidence and impact of drug and alcohol abuse on individuals, families and in the community;
developing service and system capacity – through initiatives that include growth in hospital operations, including provision of 800
Service Delivery 2011-12 Health 241

additional beds into the health system over the forward estimates period; establishment of a health infrastructure fund, training and employing more health professionals, supporting implementation of E-health, expansion of community clinical mental health services and enhanced psychiatric disability rehabilitation and support services;
242 Health Service Delivery 2011-12
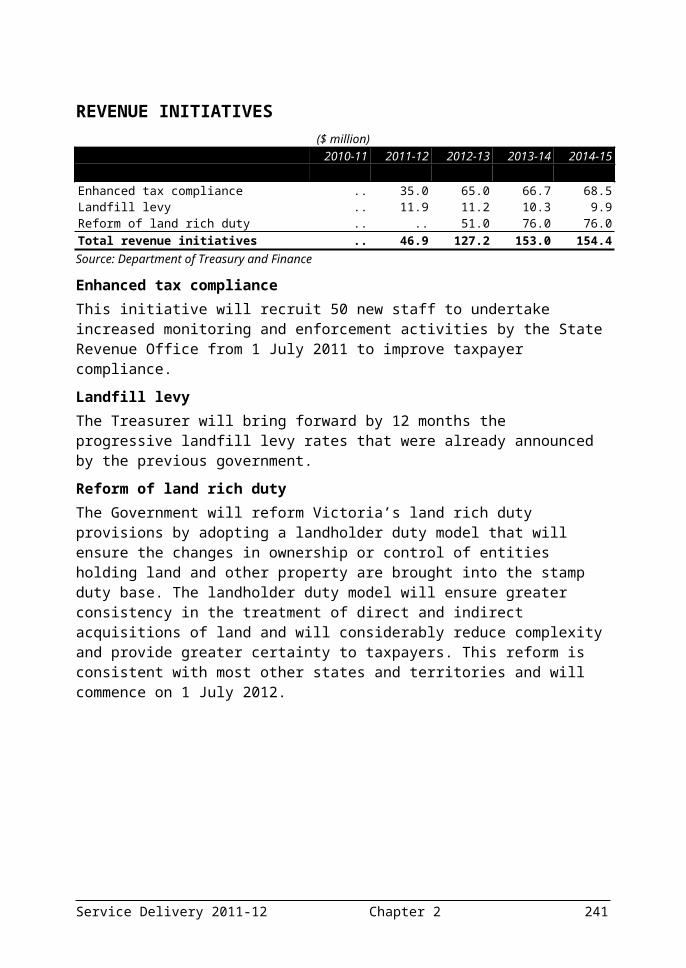
driving improvement and innovation – including establishment of the Commission for Hospital Improvement and a Health Innovation and Reform Council and provision of a new Mental Illness Research Fund to strengthen and coordinate mental health research in Victoria; and
increasing accountability and transparency – including the provision of accurate and relevant information about the state of our hospitals and health system; establishing a hospital performance website that includes reports to the public in real time on hospital emergency data, and increased reporting to the community on the performance of the Victorian health system. A further step in this process commences with the 2011-12 budget papers which include a range of new output measures for hospital quality and safety, hospital emergency services and ambulance response times. Details of these are outlined in the budget tables.
Ministerial portfoliosThe Department supports the ministerial portfolios of Health, Mental Health and Ageing.
Changes to the output structureThe Department has made some changes to its output structure for 2011-12, as shown in the table below:2010-11 Outputs Reason 2011-12 OutputsRefer to Department of Planning and Community Development output statements
Machinery of government changes
Seniors Programs and Participation
All machinery of government changes resulting from the 2010 election took effect on 1 January 2011.
Service Delivery 2011-12 Health 243

The following table summarises the Department’s total output cost.
Table 3.7: Output summary
($ million)2010-11 Budget
2010-11 Revised
2011-12 Budget
Variation (a)(b)
%Acute Health Services 8 391.3 8 553.2 8 956.6 6.7Ambulance Services 564.1 575.3 588.5 4.3Mental Health 1 007.8 1 025.4 1 071.1 6.3Ageing, Aged and Home Care (c) 1 060.1 1 063.9 1 112.0 4.9Primary, Community and Dental Health 396.9 399.6 400.5 0.9Small Rural Services 481.2 487.3 494.3 2.7Public Health (d) 304.3 290.9 299.9 -1.5Drug Services 135.7 136.6 143.2 5.6Total (e) 12 341.4 12 532.3 13 066.1 5.9Source: Department of Health
Notes:(a) Variation between 2010-11 Budget and 2011-12 Budget.(b) The movement in the Department of Health’s 2011-12 Budget compared with the
2010-11 Budget is primarily due to:– funding provided for government policy commitments including the full-year
effect of initiative funding announced in previous years’ budgets;– indexation funding provided for anticipated cost increases in 2011-12;– output price increases for depreciation and capital asset charge costs
associated with the approved asset investment program for 2011-12;– changes to Commonwealth funding for a number of programs; and– increases in income from sales of goods and services, particularly for Public
Hospitals and Ambulance Services; (c) The 2010-11 Target and 2010-11 Expected Outcome reflects a full year
presentation of the Office of Senior Victorians, which transferred from the Department of Planning and Community Development on 1 January 2011.
(d) The 2010-11 Expected Outcome and 2011-12 Target reflects changes to Commonwealth/State agreements including a reduction in Commonwealth vaccine funding resulting from new Commonwealth responsibilities for direct purchasing of flu vaccinations.
(e) Total output cost for 2011-12 Budget may not equate to the total expense reported in Budget Paper No. 5, Chapter 3 Departmental financial statements due to additional statements in Budget Paper No. 5 that are not included in departmental output costs. Figures for 2010-11 Budget and 2010-11 Revised have been amended to reflect machinery of government changes and will not equate to total expenses reported in Departmental financial statements.
Amounts availableThe following tables detail the amounts available to the Department from Parliamentary authority and income generated through transactions. Table 3.8 outlines the Department’s income from transactions and Table 3.9 summarises the sources of Parliamentary authority available to the Department to fund the provision of outputs, additions to net asset base and payments made on behalf of the State.
244 Health Service Delivery 2011-12

Table 3.8: Income from transactions($ million)
2009-10 2010-11 2010-11 2010-11 2011-12 Actual Budget Adjusted (a) Revised BudgetOutput appropriations 6 991.5 9 796.5 9 799.8 9 950.8 10 590.4Special appropriations 941.0 1 252.6 1 252.6 1 251.4 1 265.6Interest 37.3 57.4 57.4 57.4 57.6Sale of goods and services 1 053.2 1 377.2 1 377.2 1 431.3 1 431.0Grants 286.5 224.4 224.4 361.4 478.4Fair value of assets and services
received free of charge or for nominal consideration
0.9 .. .. .. ..
Other income 300.1 330.3 330.3 350.5 351.8Total income from transactions 9 610.5 13 038.3 13 041.6 13 402.8 14 174.8Source: Department of Health and Department of Treasury and Finance
Note:(a) The 2010-11 Adjusted estimates include the 2010-11 Budget adjusted for
machinery of government changes.
Table 3.9: Parliamentary authority for resources($ million)
2010-11 2010-11 2010-11 2011-12 Budget Adjusted (a) Revised BudgetAnnual appropriations 8 751.9 8 755.2 8 727.1 9 610.6 Provision of outputs 8 668.0 8 671.3 8 727.1 9 610.6 Additions to the net asset base 83.9 83.9 .. .. Payments made on behalf of the State .. .. .. ..Receipts credited to appropriations 1 220.9 1 220.9 1 156.3 1 221.0Unapplied previous years appropriation 95.3 95.3 67.4 69.1 Provision of outputs 51.6 51.6 67.4 39.9 Additions to the net asset base 43.7 43.7 .. 29.3Accumulated surplus - previously applied
appropriation.. .. 19.3 15.8
Gross annual appropriation 10 068.1 10 071.4 9 970.1 10 916.5Special appropriations 1 252.6 1 252.6 1 251.4 1 265.6Trust funds 51.4 51.4 66.0 57.2Total parliamentary authority 11 372.2 11 375.4 11 287.5 12 239.4Source: Department of Health and Department of Treasury and Finance
Note:(a) The 2010-11 Adjusted estimates include the 2010-11 Budget adjusted for
machinery of government changes.
The following section provides details of the outputs provided to government, including performance measures and costs for each output. Total expenditure for the Department can be found in Budget Paper No. 5, Chapter 3 Departmental financial statements.
Service Delivery 2011-12 Health 245

246 Health Service Delivery 2011-12

Acute Health ServicesAcute Health Services outputs provide a range of timely and high quality acute hospital inpatient, ambulatory, emergency, community based and specialist services. This output group contributes to the Department’s priority of achieving the best health and wellbeing for all Victorians through developing service and system capacity, increasing accountability and transparency, improving quality and safety and driving improvement and innovation.
Major Outputs/DeliverablesPerformance Measures
Unit of Measure
2011-12 Target
2010-11 Expected Outcome
2010-11 Target
2009-10 Actual
Admitted ServicesAcute and sub-acute patient services (elective and non elective) provided at Victorian metropolitan and rural public hospitals.
Quantity Palliative care bed days number
(‘000)92 85 84 83
The 2010-11 Expected Outcome is higher than the 2010-11 Target due to an increase in funding from COAG. The 2011- 12 Target has also been adjusted accordingly.
The 2009-10 Actual has been updated from the Department of Health’s annual report publication following actual data replacing estimates previously provided as at July 2010.
Sub-acute bed days number (‘000)
702 662 662 670
The 2009-10 Actual has been updated from the Department of Health’s annual report publication following actual data replacing estimates previously provided as at July 2010. The higher 2011-12 Target reflects increased funding for this output.
Total Separations – all hospitals number (‘000)
1 533 1 508 1 500 1 457
Weighted Inlier Equivalent Separations (WIES) – all hospitals except small rural health services
number (‘000)
1 047 1 025 1 003 999
WIES Funded Separations – all hospitals except small rural health services
number (‘000)
1 430 1 405 1 397 1 351
WIES Funded Emergency Separations – all hospitals
number (‘000)
534 523 516 490
Quality Consumer Participation Indicator – score with a range of 20-100
score 75 nm nm nm
New performance measure for 2011-12 to reflect the Government’s commitment to increased transparency, quality and safety, and reflects patient rating of involvement in decision-making.
Perinatal morbidity notices received, processed and reported
per cent 100 100 100 100
Public hospitals accredited per cent 100 100 100 100
Service Delivery 2011-12 Health 247

Major Outputs/DeliverablesPerformance Measures
Unit of Measure
2011-12 Target
2010-11 Expected Outcome
2010-11 Target
2009-10 Actual
Eligible newborns screened for hearing deficit before one month of age
per cent 97 nm nm nm
New performance measure for 2011-12 to reflect the Government’s commitment to increased transparency, quality and safety.
Major trauma patients transferred to a major trauma service
per cent 75 86 75 86
The higher 2010-11 Expected Outcome reflects the patterns of transfer across the system and indicates that patients were transferred appropriately to a trauma service in accordance with trauma triage guidelines.
Hospitals participating in Victorian Hospital Acquired Infection Surveillance System (VICNISS)
per cent 100 100 100 99.5
Intensive Care Unit central line associated blood stream infections (CLABSI) per 1 000 device days
rate <=2.5 nm nm nm
New performance measure for 2011-12 to reflect the Government’s commitment to increased transparency, quality and safety.
Public hospitals meeting cleaning standards, as assessed by external audit
per cent 100 100 100 94
Staphylococcus aureus bacteraemias (SAB) infections per 10 000 patient days
rate <=2.0 nm nm nm
New performance measure for 2011-12 to reflect the Government’s commitment to increased transparency, quality and safety.
Unplanned/unexpected readmission for acute myocardial infarction per 1 000 separations
per cent <3.7 nm nm nm
New performance measure for 2011-12 to reflect the Government’s commitment to increased transparency, quality and safety.
Unplanned/unexpected readmission for heart failure per 1 000 separations
per cent <10.25 nm nm nm
New performance measure for 2011-12 to reflect the Government’s commitment to increased transparency, quality and safety.
Unplanned/unexpected readmission for knee replacement per 1 000 separations
per cent <6.0 nm nm nm
New performance measure for 2011-12 to reflect the Government’s commitment to increased transparency, quality and safety.
Unplanned/unexpected readmission for hip replacement per 1 000 separations
per cent <2.5 nm nm nm
New performance measure for 2011-12 to reflect the Government’s commitment to increased transparency, quality and safety.
248 Health Service Delivery 2011-12

Major Outputs/DeliverablesPerformance Measures
Unit of Measure
2011-12 Target
2010-11 Expected Outcome
2010-11 Target
2009-10 Actual
Unplanned/unexpected readmission for paediatric tonsillectomy and adenoidectomy per 1 000 separations
per cent <2.2 nm nm nm
New performance measure for 2011-12 to reflect the Government’s commitment to increased transparency, quality and safety.
Timeliness Emergency patients transferred to ward within 8 hours
per cent 80 67 80 68
The 2010-11 Expected Outcome reflects health services experiencing higher acuity presentations.
Non-urgent (Category 3) elective surgery patients admitted within 365 days
per cent 90 90 90 92
Semi-urgent (Category 2) elective surgery patients admitted within 90 days
per cent 80 75 80 75
The 2010-11 Expected Outcome reflects the impact of the strategy to treat long waiting patients.The 2009-10 Actual has been updated from the Department of Health’s annual report publication following actual data replacing estimates previously provided as at July 2010.
Urgent (Category 1) elective surgery patients admitted within 30 days
per cent 100 100 100 100
Cost Total output cost $ million 6 943.6 6 641.0 6 570.7 6 228.2
The 2011-12 Target reflects additional funding for (i) indexation; (ii) revised estimates for health services depreciation; (iii) transfer of Hospital Admission Risk Program to Non-Admitted Services; (iv) Government policy initiatives; (v) increase in Private Patient Fees raised.
The 2010-11 Expected Outcome reflects impact of (i) revised estimates for health services depreciation; (ii) transfer of Hospital Admission Risk Program to Non Admitted Services; (iii) one off funding of costs incurred resulting from the declaration of three additional public holidays; and (iv) increase in Private Patient Fees raised.
Non-Admitted ServicesNon-Admitted Services include acute and sub-acute services provided at Victorian metropolitan and rural public hospitals. Access to high quality services allows the right care to be delivered at the right time in the right location. Non admitted sub-acute services improve consumer access to services closer to home by providing models of integrated community care, which significantly reduces the demand for hospital beds and supports the transition from hospital to home in a safe and timely manner. The services improve health outcomes, particularly for older people and people with complex care needs.
Quantity Completed post acute episodes number 42 000 39 000 39 000 41 745
The 2009-10 Actual has been updated from the Department of Health’s annual report publication following actual data replacing estimates previously provided as at July 2010.
Patients treated in specialist outpatient clinics – unweighted
number (‘000)
1 360 1 340 1 340 1 347
Service Delivery 2011-12 Health 249

Major Outputs/DeliverablesPerformance Measures
Unit of Measure
2011-12 Target
2010-11 Expected Outcome
2010-11 Target
2009-10 Actual
Patients treated in specialist outpatient clinics – weighted
number (‘000)
1 484 1 492 1 445 1 491
Sub-acute ambulatory care occasions of service
number 565 000 530 000 530 000 555 844
The 2011-12 Target is higher than the 2010-11 Target due to additional Commonwealth funding under the National Partnership for Improving Public Hospital Services. The 2009-10 Actual has been updated from the Department of Health’s annual report publication following actual data replacing estimates previously provided as at July 2010.
Quality Post-acute clients not readmitted to acute hospital
per cent 90 90 90 92
Timeliness Sub-acute ambulatory care service clients contacted within three days of referral
per cent 80 80 80 78
The 2009-10 Actual has been updated from the Department of Health’s annual report publication following actual data replacing estimates previously provided as at July 2010.
Cost Total output cost $ million 1 279.0 1 219.8 1 140.6 1 072.2
The 2011-12 Target reflects additional funding for (i) indexation; (ii) revised estimates for health services depreciation; (iii) transfer of Hospital Admission Risk Program from Admitted Services; (iv) Government policy initiatives.
The 2010-11 Expected Outcome reflects impact of (i) revised estimates for health services depreciation; and (ii) transfer of Hospital Admission Risk Program from Admitted Services.
Emergency ServicesThis output relates to emergency presentations at reporting hospitals with emergency departments. This output aims to provide high quality, accessible health and community services, specifically in the area of improving waiting times for emergency services.
Quantity Emergency presentations number
(‘000)1 493 1 445 1 420 1 398
The 2011-12 Target reflects anticipated growth in demand.
Quality Time on hospital bypass per cent 3.0 2.0 3.0 1.9
Number of occasions on Hospital Early Warning System (HEWS)
number 11 388 nm nm nm
New performance measure for 2011-12 to reflect the Government’s commitment to increased transparency, quality and safety.
Operating time on HEWS per cent 10 nm nm nmNew performance measure for 2011-12 to reflect the Government’s commitment to increased transparency, quality and safety.
250 Health Service Delivery 2011-12

Major Outputs/DeliverablesPerformance Measures
Unit of Measure
2011-12 Target
2010-11 Expected Outcome
2010-11 Target
2009-10 Actual
Timeliness Emergency Category 1 treated immediately
per cent 100 100 100 100
Emergency Category 2 treated in 10 minutes
per cent 80 81 80 81
Emergency Category 3 treated in 30 minutes
per cent 75 67 75 69
The 2010-11 Expected Outcome has remained consistent despite health services experiencing higher acuity presentations.
Non-admitted emergency patients with a length of stay of less than four hours
per cent 80 70 80 73
The 2010-11 Expected Outcome has remained consistent despite health services experiencing higher acuity presentations.
Proportion of ambulance patient transfers within 40 minutes
per cent 90 nm nm nm
New performance measure for 2011-12 to reflect the Government’s commitment to increased transparency, quality and safety.
Cost Total output cost $ million 409.7 385.3 372.9 353.1
The 2011-12 Target reflects additional funding for (i) indexation; (ii) revised estimates for health services depreciation; (iii) Government policy initiatives.The 2010-11 Expected Outcome reflects impact of revised estimates for health services depreciation.
Acute Training and DevelopmentProvision of grants to hospitals for the training and accreditation of health workers. This output aims to provide career opportunities and contribute towards a stable and accredited workforce in the health sector in Victoria. This output supports the Department’s priority of developing the service system capacity through increasing the skilled medical workforce.
Quantity Post graduate nursing places at Diploma and Certificate level
number 832 832 832 849
Total FTE (early graduate) allied health positions in public system
number 461 470 470 461
Total FTE (early graduate) medical positions in public system
number 1 300 1 159 1 159 1 074
The increased 2011-12 Target reflects increases in approved funding for this output.
Total FTE (early graduate) nursing positions in public system
number 1 305 1 305 1 305 1 330
Cost Total output cost $ million 324.3 307.1 307.1 283.2
The 2011-12 Target reflects additional funding for (i) indexation; (ii) government policy initiatives.
Source: Department of Health
Service Delivery 2011-12 Health 251

Ambulance ServicesAmbulance Services outputs provide emergency and non-emergency ambulance services. Ambulance response times are important to ensure critically ill Victorians receive the care they need. This output group contributes to the Department’s priority of achieving the best health and wellbeing for all Victorians through improved health service performance and developing our health service system and organisation. The output supports the Department’s priority of developing service and system capacity of ambulance services.
252 Health Service Delivery 2011-12
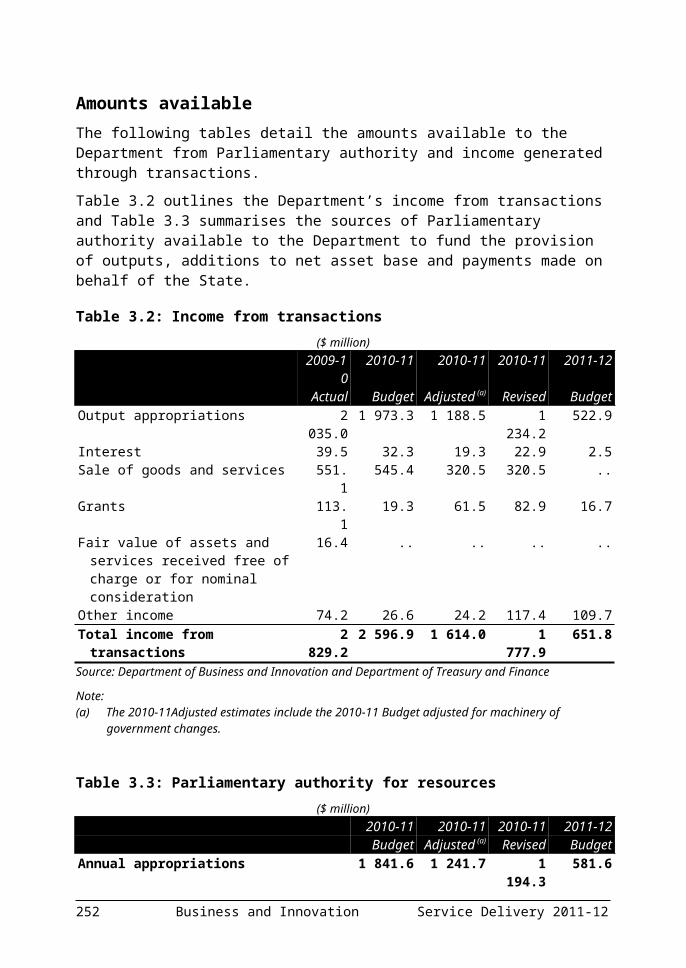
Major Outputs/DeliverablesPerformance Measures
Unit of Measure
2011-12 Target
2010-11 Expected Outcome
2010-11 Target
2009-10 Actual
Ambulance Emergency ServicesEmergency road, rotary and fixed air wing patient treatment and transport services provide timely and high quality emergency ambulance services. Timely and high quality emergency ambulance services contribute to high quality, accessible health and community services for all Victorians.
Quantity Country road cases number 133 200 131 247 128 800 128 890
Metropolitan road cases number 356 900 351 650 325 000 330 741The 2010-11 Expected Outcome and 2011-12 Target reflect increased demand and growth in transports.
Pensioner and concession card holder cases
number 231 900 228 545 215 000 219 832
The 2010-11 Expected Outcome and 2011-12 Target reflect increased demand and growth in transports.
Statewide air cases number 4 500 3 924 2 950 3 199The 2010-11 Expected Outcome and 2011-12 Target reflect increased demand for emergency air cases.
Quality Audited cases attended by Community Emergency Response Teams (CERT) meeting clinical practice standards
per cent 90 97 90 96.2
The 2010-11 Expected Outcome demonstrates high quality service provided by CERT members.
Audited cases statewide meeting clinical practice standards
per cent 95 97.9 95 97.9
Proportion of patients experiencing severe cardiac and traumatic pain whose level of pain is reduced significantly
per cent 90 92.1 90 91.1
Proportion of patients satisfied or very satisfied with quality of care provided by paramedics
per cent 95 98 95 98
Timeliness CERT arrival occurs prior to ambulance per cent 85 87.3 85 85.7Proportion of emergency (Code 1) incidents responded to within 15 minutes – statewide
per cent 85 77 85 80.7
The 2011-12 Target for this measure is appropriate and performance is subject to ongoing service improvement.The 2010-11 Expected Outcome reflects impact of increased demand.
Proportion of emergency (Code 1) incidents responded to within 15 minutes in centres with more than 7 500 population
per cent 90 82.3 90 86.9
The 2011-12 Target for this measure is appropriate and performance is subject to ongoing service improvement.
The 2010-11 Expected Outcome reflects impact of increased demand.
Service Delivery 2011-12 Health 253

Major Outputs/DeliverablesPerformance Measures
Unit of Measure
2011-12 Target
2010-11 Expected Outcome
2010-11 Target
2009-10 Actual
Cost Total output cost $ million 480.2 469.4 460.3 442.0
The 2011-12 Target primarily reflects additional funding for Government policy initiatives
Ambulance Non-Emergency ServicesNon-emergency road, rotary and fixed air wing patient treatment and transport services provide access to timely, high quality non-emergency ambulance services. High quality non-emergency ambulance services contribute to high quality, accessible health and community services for all Victorians. The output supports departmental priorities through provision of patient transport officers to service non-emergency, pre and post hospital patients.
Quantity Country road cases number 60 000 59 147 56 600 56 422
Activity for this measure has been consistently higher than anticipated, with increases in the 2011-12 Target reflecting this trend into the future.
Metropolitan road cases number 236 300 232 826 222 800 226 091The 2011-12 Target reflects increased demand in metropolitan non-emergency patient transport.
Pensioner and concession card holders transported
number 192 500 189 660 174 000 182 750
Activity for this measure has been consistently higher than anticipated, with increases in the 2011-12 Target reflecting this trend into the future.The 2009-10 Actual has been updated from the Department of Health’s annual report publication following actual data replacing estimates previously provided as at July 2010.
Statewide air cases number 2 500 2 790 3 600 3 491The 2011-12 Target reflects decreased demand in metropolitan non-emergency air cases.The 2010-11 Expected Outcome is lower due to the prioritisation of air activity to emergency responses and is matched by a corresponding increase in emergency activity.
Quality Audited cases statewide meeting clinical practice standards
per cent 94 98.3 94 98.7
Cost Total output cost $ million 108.3 105.9 103.8 100.3
The 2011-12 Target primarily reflects additional funding for Government policy initiatives
Source: Department of Health
254 Health Service Delivery 2011-12

Mental HealthMental Health outputs provide a range of inpatient, community-based residential and ambulatory services which treat and support people with a mental illness and their families and carers. This output group contributes to the Department’s priority of achieving the best health and wellbeing for all Victorians through reform to mental health and drug and alcohol services to meet client needs.
Major Outputs/DeliverablesPerformance Measures
Unit of Measure
2011-12 Target
2010-11 Expected Outcome
2010-11 Target
2009-10 Actual
Clinical CareA range of inpatient, residential and community based clinical services provided to people with mental illness and their families so that those experiencing mental health problems can access timely, high quality care and support to recover and live successfully in the community.
Quantity Clinical inpatient separations number 19 980 19 673 19 800 19 248
Community service hours hours (‘000)
1029 nm nm nm
The performance measure ‘Community service hours’ replaces the 2010-11 performance measure ‘Community contact hours’ to ensure consistency with definitions and data entry compliance.
New case index per cent 50 46 50 47The 2010-11 Expected Outcome is a positive result.
Registered community clients number 59 000 60 025 59 000 59 396Residential bed days number 355 000 347 649 351 000 342 743
Quality Clients readmitted (unplanned) within 28 days
per cent 14 13 14 13
New client index per cent 45 46 45 44
Number of area mental health services achieving or maintaining accreditation under the National Standards for Mental Health Services
number 21 21 21 21
Post-discharge community care per cent 75 76 75 73
Pre-admission community care per cent 60 58 60 57.2Timeliness
Emergency patients admitted to a mental health bed within eight hours
per cent 80 68 80 73
The 2010-11 Expected Outcome relates to the acuity and increased demand.
Service Delivery 2011-12 Health 255

Major Outputs/DeliverablesPerformance Measures
Unit of Measure
2011-12 Target
2010-11 Expected Outcome
2010-11 Target
2009-10 Actual
Cost Total output cost $ million 976.1 931.9 917.4 891.9
The 2011-12 Target reflects additional funding for (i) indexation; (ii) revised estimates for health services depreciation; (iii) Government policy initiatives; and (iv) recognition of Department of Justice funding to the Victorian Institute of Forensic Mental Health.The 2010-11 Expected Outcome reflects (i) the impact of revised estimates for health services depreciation and (ii) recognition of Department of Justice funding to the Victorian Institute of Forensic Mental Health.
Psychiatric Disability Rehabilitation and Support Services (PDRSS)A range of rehabilitation and support services provided to people with a psychiatric disability, and their families and carers, so that those experiencing mental health problems can access timely, high quality care and support to recover and reintegrate into the community.
Quantity Bed days number 87 000 82 600 87 000 76 700
The 2010-11 Expected Outcome is lower than the 2010-11 Target reflecting lower than expected bed uptake due to investment in community home based support and the introduction of alternative care models.
Clients receiving psychiatric disability support services
number 12 500 14 076 12 500 13 383
The 2010-11 Expected Outcome is higher than the 2010-11 Target due to increased demand for psychiatric support services.
Contact hours number (‘000)
1 183 1 183 1 175 1 113
Quality Proportion of major agencies accredited against the PDRSS standards
per cent 100 100 100 100
Cost Total output cost $ million 95.1 93.5 90.4 90.3
The 2011-12 Target reflects additional funding for (i) indexation; (ii) revised estimates for health services depreciation; and (iii) Government policy initiatives.
Source: Department of Health
256 Health Service Delivery 2011-12
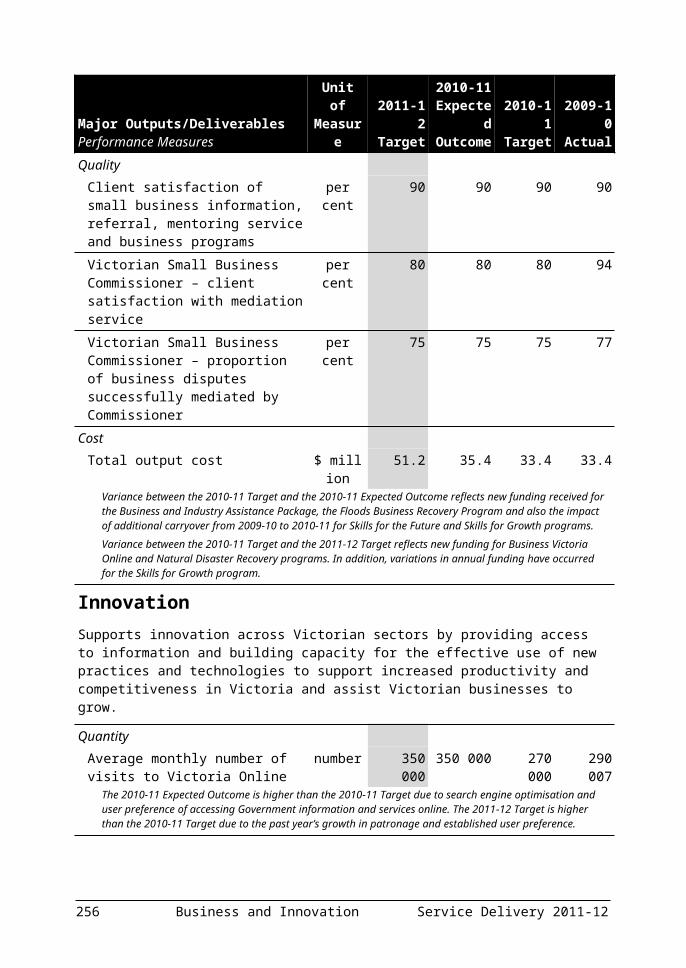
Ageing, Aged and Home CareAgeing, Aged and Home Care outputs lead and coordinate whole of government policy on issues affecting our ageing community, and provide a range of in-home, specialist geriatric and residential care services for older people. This includes Home and Community Care (HACC) services and other programs that are targeted to older people and people with a disability, and to their carers. This output group contributes to the Department’s priority of achieving the best health and wellbeing for all Victorians through responding to an ageing population, developing service and system capacity, and driving improvement and innovation.
Major Outputs/DeliverablesPerformance Measures
Unit of Measure
2011-12 Target
2010-11 Expected Outcome
2010-11 Target
2009-10 Actual
Seniors Programs and ParticipationThis output has been introduced as a result of machinery of government changes that resulted in the transfer of Office of Senior Victorians functions out of the Department of Planning and Community Development into the Department of Health.
Supports broader community planning processes to facilitate an integrated community planning and response approach aimed at encouraging older Victorians to fully participate and engage in the community.
Quantity New University of the Third Age (U3A) programs funded
number 45-60 45-60 45-60 nm
Seniors funded activities and programs: number approved
number 90-100 110-130 110-130 142
The 2011-12 Target is lower due to program delivery changes.
Quality Eligible seniors in the seniors card program
per cent 95 95 95 95
Senior satisfaction with Victorian Seniors Festival events
per cent 90 90 90 90
Cost Total output cost $ million 5.7 5.6 6.0 6.1
The Office of Senior Victorians transferred from the Department of Planning and Community Development on 1 January 2011. The 2009-10 Actual, 2010-11 Target and the 2010-11 Expected Outcome reflect a full year presentation of this output.
Residential Aged CareThis output includes the delivery of services for older Victorians requiring ongoing care and support in a residential aged care setting.
Quantity Bed days in high care places number 922 000 924 000 924 000 896 992
The 2009-10 Actual has been updated from the Department of Health’s annual report publication following actual data replacing estimates previously provided as at July 2010.
Service Delivery 2011-12 Health 257

Major Outputs/DeliverablesPerformance Measures
Unit of Measure
2011-12 Target
2010-11 Expected Outcome
2010-11 Target
2009-10 Actual
Bed days in low care places number 388 000 409 000 409 000 393 484The 2011-12 Target is lower than the 2010-11 Target due to current and projected reduction in low care demand consistent with industry trendsThe 2009-10 Actual has been updated from the Department of Health’s annual report publication following actual data replacing estimates previously provided as at July 2010.
Standard Equivalent Value Units number 486 000 489 000 489 000 485 426
Quality Residential care services certified and accredited
per cent 100 100 100 100
Cost Total output cost $ million 323.2 321.1 309.9 304.2
Aged Care AssessmentThis output includes the delivery of comprehensive assessment of older Victorians’ requirements for treatment and residential aged care services.
Quantity Aged Care Assessments number 59 000 59 000 59 000 53 267
Timeliness Percentage of priority 1 and 2 clients assessed within the appropriate time – community-based assessment
per cent 85 nm nm nm
New performance measure for 2011-12 ‘Percentage of priority 1 and 2 clients assessed within the appropriate time – community-based assessment’ replaces the 2010-11 performance measure ‘Average wait between client registration and ACAS assessment – community-based assessment’ as it aligns with Commonwealth benchmarks and is a better indicator of responsiveness to the urgency of client needs based on information available at the time of assessment. The appropriate time is determined by the priority level as defined in the national ACAP guidelines. For Priority 1 intervention in two days and for Priority 2 intervention in 3-14 days.
Percentage of priority 1 and 2 clients assessed within the appropriate time – hospital-based assessment
per cent 85 nm nm nm
New performance measure for 2011-12 ‘Percentage of priority 1 and 2 clients assessed within the appropriate time – hospital-based assessment’ replaces the 2010-11 performance measure ‘Average wait between client registration and ACAS assessment – hospital-based assessment’ as it aligns with Commonwealth benchmarks and is a better indicator of responsiveness to the urgency of client needs based on information available at the time of assessment. The appropriate time is determined by the priority level as defined in the national ACAP guidelines. For Priority 1 intervention in two days and for Priority 2 intervention in 3-14 days.
Cost Total output cost $ million 44.6 42.9 43.5 54.8
258 Health Service Delivery 2011-12

Major Outputs/DeliverablesPerformance Measures
Unit of Measure
2011-12 Target
2010-11 Expected Outcome
2010-11 Target
2009-10 Actual
Aged Support ServicesThis output includes delivery of a range of community services that support older Victorians and their carers.
Quantity Individuals provided with respite services
number 22 000 22 000 22 000 21 881
Pension-level beds available in assisted Supported Residential Services facilities
number 1 876 1 876 1 916 1 916
The 2011-12 Target and 2010-11 Expected Outcome are lower due to the closure of two Supported Residential Services.
Pension-level Supported Residential Services residents provided with service coordination and support/brokerage services
number 775 775 775 912
Personal alert units allocated number 26 255 25 255 25 255 23 255
Victorian EyeCare Service (occasions of service)
number 75 800 75 800 75 800 69 299
Quality Funded research and service development projects for which satisfactory reports have been received
per cent 100 100 100 100
Cost Total output cost $ million 130.2 129.8 117.1 129.2
The 2011-12 Target primarily reflects revised estimates for health services depreciation.
The 2010-11 Expected Outcome primarily reflects revised estimates for health services depreciation.
HACC Primary Health, Community Care and SupportThis output includes delivery of a range of community based nursing, allied health and support services enabling frail, older people and younger people with disabilities to maintain their independence in the community. This includes Home and Community Care (HACC) services.
Quantity Clients receiving Home and Community Care services
number 295 000 286 000 265 000 273 808
The 2011-12 Target and the 2010-11 Expected Outcome is higher than the 2010-11 Target due to agency initiated renegotiation of service mix and approved growth funding.
Home and Community Care service delivery hours
number 10 355 000 10 008 000 10 008 000 9 531 290
The 2011-12 Target has been revised following agency initiated renegotiation of service mix and approved growth funding.
Service Delivery 2011-12 Health 259

Major Outputs/DeliverablesPerformance Measures
Unit of Measure
2011-12 Target
2010-11 Expected Outcome
2010-11 Target
2009-10 Actual
Standard Equivalent Value Units number 5 695 000 4 849 000 4 849 000 4 735 301The 2011-12 Target has been revised following agency initiated renegotiation of service mix and approved growth funding.
Quality Eligible population receiving Home and Community Care services
per cent 30 30 30 33.8
Cost Total output cost $ million 608.3 564.5 583.6 521.6
The 2010-11 Expected Outcome primarily reflects reduction in Commonwealth funding.
Source: Department of Health
260 Health Service Delivery 2011-12

Primary, Community and Dental HealthPrimary, Community and Dental Health outputs provide a range of in home, community based, community, primary health and dental services designed to promote health and wellbeing and prevent the onset of more serious illnesses. This output group contributes to the Department’s priority of achieving the best health and wellbeing for all Victorians by developing service and system capacity and increasing accountability and transparency.
Major Outputs/DeliverablesPerformance Measures
Unit of Measure
2011-12 Target
2010-11 Expected Outcome
2010-11 Target
2009-10 Actual
Community Health CareThis output includes delivery of a range of community care and support services, including counselling, allied health and nursing, that enable people to continue to live independently in the community.
Quantity Better Health Channel visits number
(‘000)12 000 11 000 14 000 13 000
The 2010-11 Expected Outcome is lower due to the growth in alternative health information websites which has reduced visits to the Better Health Channel. The 2011-12 Target has been adjusted accordingly.
Number of referrals made using secure electronic referral systems
number 100 000 nm nm nm
New performance measure for 2011-12 to reflect the Government’s commitment to increased transparency, quality and safety..
Primary Care Partnerships with reviewed and updated Strategic Plans
per cent 100 100 100 87
Service delivery hours in community health care
number 976 000 982 000 982 000 984 467
The 2009-10 Actual has been updated from the Department of Health’s annual report publication following actual data replacing estimates previously provided as at July 2010.
Standard Equivalent Value Units number 1 047 920 1 051 700 1 051 700 1 068 177The 2009-10 Actual has been updated from the Department of Health’s annual report publication following actual data replacing estimates previously provided as at July 2010.
Quality Agencies with an Integrated Health Promotion (IHP) plan that meets the stipulated planning requirements
per cent 80 nm nm nm
New measure for 2011-12 to reflect the emphasis on an integrated approach to health promotion initiatives.
Cost Total output cost $ million 233.4 234.7 232.6 244.9
Service Delivery 2011-12 Health 261

Major Outputs/DeliverablesPerformance Measures
Unit of Measure
2011-12 Target
2010-11 Expected Outcome
2010-11 Target
2009-10 Actual
Dental ServicesThis output includes delivery of a range of dental health services to support health and wellbeing in the community.
Quantity Persons treated number 332 150 331 000 331 000 329 850
The 2009-10 Actual has been updated from the Department of Health’s annual report publication following actual data replacing estimates previously provided as at July 2010.
Standard Equivalent Value Units number 1 412 745 1 429 800 1 429 800 1 315 105The 2009-10 Actual has been updated from the Department of Health’s annual report publication following actual data replacing estimates previously provided as at July 2010.
Quality Ratio of emergency to general courses of dental care
ratio 53:47 53:47 53:47 44:56
Timeliness Waiting time for dentures months 22 22 22 20
Waiting time for restorative dental care months 23 23 23 19
Cost Total output cost $ million 167.1 164.9 164.3 155.6
Source: Department of Health
262 Health Service Delivery 2011-12

Small Rural ServicesSmall Rural Services includes a range of health and aged care services delivered in small rural towns. The funding and service delivery approach focuses on achieving a sustainable, flexible service mix that is responsive to local needs. Service providers include small rural hospitals, community health services, bush nursing centres, multi purpose services and public sector residential aged care services. This output group contributes to the Department’s priority of achieving the best health and wellbeing for all Victorians by developing service and system capacity.
Major Outputs/DeliverablesPerformance Measures
Unit of Measure
2011-12 Target
2010-11 Expected Outcome
2010-11 Target
2009-10 Actual
Small Rural Services – Acute HealthAdmitted and non-admitted services delivered by small rural services, including elective and non elective surgical and medical care, accident and emergency services, and maternity services.
Quantity Separations number
(‘000)43.7 43.7 43.7 41.5
Standard Equivalent Value Units number (‘000)
1 439 1 439 1 439 1 165
Weighted Inlier Equivalent Separations (WIES)
number (‘000)
28.5 28.5 28.5 25.2
Quality Beds accredited per cent 100 100 100 100
Cost Total output cost $ million 285.1 280.9 280.5 261.0
Small Rural Services – Aged CareThis output includes delivery of in-home, community-based and residential care services for older people, delivered in small rural towns.
Quantity Bed days in high care places number 406 000 403 000 403 000 383 229
The 2009-10 Actual has been updated from the Department of Health’s annual report publication following actual data replacing estimates previously provided as at July 2010.
Bed days in low care places number 317 000 321 000 321 000 306 842The 2009-10 Actual has been updated from the Department of Health’s annual report publication following actual data replacing estimates previously provided as at July 2010.
Standard Equivalent Value Units number 220 000 219 900 219 900 212 148
Quality Residential care services certified and accredited
per cent 100 100 100 100
Service Delivery 2011-12 Health 263

Major Outputs/DeliverablesPerformance Measures
Unit of Measure
2011-12 Target
2010-11 Expected Outcome
2010-11 Target
2009-10 Actual
Cost Total output cost $ million 161.2 158.8 154.9 164.8
Small Rural Services – Home and Community Care ServicesThis output includes delivery of in-home and community-based care services for older people, delivered in small rural towns.
Quantity Home and Community Care (HACC) service delivery hours
number 738 000 747 000 747 000 706 308
Standard Equivalent Value Units number 323 000 330 000 330 000 303 574Cost
Total output cost $ million 30.8 30.5 29.4 29.6
Small Rural Services – Primary HealthThis output includes delivery of in-home, community-based, community and primary health services delivered by small rural services designed to promote health and wellbeing and prevent the onset of more serious illness.
Quantity Service delivery hours in community health care
number 100 700 100 700 100 700 99 534
Standard Equivalent Value Units number 105 470 105 470 105 470 107 685Cost
Total output cost $ million 17.2 17.1 16.4 16.6Source: Department of Health
264 Health Service Delivery 2011-12

Public HealthPublic Health outputs provide leadership, services and support which promote and protect the health and wellbeing of all Victorians in partnership with key stakeholders and communities. This output group contributes to the Department’s priority of achieving the best health and wellbeing for all Victorians through driving improvement and innovation and increased accountability and transparency.
Service Delivery 2011-12 Health 265

Major Outputs/DeliverablesPerformance Measures
Unit of Measure
2011-12 Target
2010-11 Expected Outcome
2010-11 Target
2009-10 Actual
Health ProtectionProtects the health of Victorians through a range of prevention programs including regulation, surveillance and the provision of statutory services.
Quantity Calls to food safety hotlines number 4 500 4 500 5 000 4 409
Over the past two financial years, a lower number of incoming calls has been observed. This is more than likely caused by an increased reliance by consumers on websites for information. The 2011-12 Target has been adjusted accordingly.
Inspections of cooling towers number 1 000 nm nm nmThis performance measure is one of two measures that replaces the 2010-11 performance measure ‘Environmental health inspections undertaken and occasions of technical advice’ as it better reflects the nature of health protection service delivery.
Inspections of radiation safety management licences
number 700 nm nm nm
This performance measure is one of two measures that replaces the 2010-11 performance measure ‘Environmental health inspections undertaken and occasions of technical advice’ as it better reflects the nature of health protection service delivery.
Persons screened for prevention and early detection of health conditions – breast cancer screening
number 215 000 nm nm nm
This performance measure is one of four measures replacing the 2010-11 measure ‘Persons screened for prevention and early detection of health conditions’ by providing a more detailed recording of activity for different types of screening.
Persons screened for prevention and early detection of health conditions – cervical cancer screening
number 550 700 nm nm nm
This performance measure is one of four measures replacing the 2010-11 measure ‘Persons screened for prevention and early detection of health conditions’ by providing a more detailed recording of activity for different types of screening.
Persons screened for prevention and early detection of health conditions – newborn and maternal serum screening
number 77 851 nm nm nm
This performance measure is one of four measures replacing the 2010-11 measure ‘Persons screened for prevention and early detection of health conditions’ by providing a more detailed recording of activity for different types of screening.
Persons screened for prevention and early detection of health conditions – pulmonary tuberculosis (TB) screening
number 2 500 nm nm nm
This performance measure is one of four measures replacing the 2010-11 measure ‘Persons screened for prevention and early detection of health conditions’ by providing a more detailed recording of activity for different types of screening.
Quality Calls to food safety hotlines that are answered
per cent 96 96 96 99
266 Health Service Delivery 2011-12

Major Outputs/DeliverablesPerformance Measures
Unit of Measure
2011-12 Target
2010-11 Expected Outcome
2010-11 Target
2009-10 Actual
Immunisation coverage: Adolescent (Year 10) students fully immunised for DTPa (diptheria, tetanus and pertussis)
per cent 80 80 80 74
Immunisation coverage: At 2 years of age
per cent 92 93 90 93
Immunisation coverage: At 65+ years of age (influenza)
per cent 80 80 80 81
Immunisation coverage: At school entry per cent 90 91 88 87
Timeliness Average time taken from notification of a food complaint to commencement of appropriate action
hours 24 24 24 24
Infectious disease outbreaks responded to within 24 hours
per cent 100 100 100 100
Target population screened within specified timeframe for breast cancer
per cent 54 54 54 53
Target population screened within specified timeframe for cervical cancer
per cent 63 63 63 63
Cost Total output cost $ million 207.0 206.7 227.0 212.4
The 2011-12 Target reflects (i) a reduction in Commonwealth vaccine funding, resulting from new Commonwealth responsibility for direct purchasing of flu vaccinations; and (ii) Government policy initiatives.
The 2010-11 Expected Outcome and 2011-12 Target reflect changes to Commonwealth/State agreements including a reduction in Commonwealth vaccine funding resulting from new Commonwealth responsibilities of direct purchasing flu vaccinations.
Health AdvancementImproves the general health and wellbeing of Victorians through a range of health promotion programs including the provision of community information and the fostering of healthy behaviours.
Quantity Persons completing the Life! Taking Action on Diabetes course
number 5 616 10 246 17 300 2 019
The 2010-11 Expected Outcome is lower due to uptake being lower than expected resulting from delays in external referrals to the program and interruptions to the social marketing program beyond the program’s control. The lower 2011-12 Target follows a realignment of the program based on the experience gained in previous years.
Workplaces and pubs and clubs complying with smoke free environment laws
per cent 99 99 99 99
Service Delivery 2011-12 Health 267

Major Outputs/DeliverablesPerformance Measures
Unit of Measure
2011-12 Target
2010-11 Expected Outcome
2010-11 Target
2009-10 Actual
Quality Local Government Authorities with Municipal Public Health and Wellbeing Plans
per cent 95 85 85 85
This performance measure replaces the 2010-11 performance measure ‘Local Government Authorities with Municipal Public Health Plans’. The 2011-12 performance measure is the same as the 2010-11 performance measure and measures the same activity as the performance measure in 2010-11. The increased 2011-12 Target reflects legislative requirements.
Cost Total output cost $ million 84.1 73.6 68.7 63.6
The 2011-12 Target reflects additional Commonwealth funding provided under the National Partnership on Preventative Health.
Public Health Development, Research and SupportDevelops and advocates for research and development activities, which support evidence-based public health policies.
Quantity Department of Health funded public health training scholarships
number 5 nm nm nm
New performance measure for 2011-12 due to the funding of both Doctoral and Masters level study.
Quality Department of Health funded public health trainees achieving post-graduate qualifications
per cent 95 nm nm nm
New performance measure for 2011-12 due to the funding of both Doctoral and Masters level study.
Cost Total output cost $ million 8.8 10.7 8.6 14.9
The decrease in the 2011-12 Target, compared to the 2010-11 Expected outcome, reflects movements in funding carried over between years.The 2010-11 Expected Outcome has been revised due to program delivery changes.
Source: Department of Health
268 Health Service Delivery 2011-12

Drug ServicesDrug Services outputs provide programs to promote and protect the health and wellbeing of all Victorians by reducing death, disease and social harm caused by the use and misuse of licit and illicit drugs. This output group contributes to the Department’s priority of achieving the best health and wellbeing for all Victorians through reform to mental health and drug and alcohol services to meet client needs.
Major Outputs/DeliverablesPerformance Measures
Unit of Measure
2011-12 Target
2010-11 Expected Outcome
2010-11 Target
2009-10 Actual
Drug Prevention and ControlEncourages all Victorians to minimise the harmful effects of illicit and licit drugs, including alcohol, by providing a comprehensive range of strategies, which focus on enhanced community and professional education, targeted prevention and early intervention, and the use of effective regulation.
Quantity Contacts through Family Drug Help number 5 000 5 000 5 000 5 150
Licences and permits for supply or use of drugs and poisons
number 1 275 1 275 1 275 1 293
Needles and syringes provided through the Needle and Syringe Program
number (‘000)
7 300 7 999 7 200 7 724
The higher 2010-11 Expected Outcome is a result of increased demand.
Number of telephone, email and in person responses to queries and requests for information on alcohol and drug issues (through the Alcohol and Drug Foundation)
number 11 000 nm nm nm
New performance measure for 2011-12 to reflect the Government commitment to increased transparency.
Quality Pharmacotherapy permits processed within designated timeframe
per cent 100 100 100 100
Cost Total output cost $ million 25.6 25.7 25.5 27.3
Service Delivery 2011-12 Health 269

Major Outputs/DeliverablesPerformance Measures
Unit of Measure
2011-12 Target
2010-11 Expected Outcome
2010-11 Target
2009-10 Actual
Drug Treatment and RehabilitationAssists the community and individuals to control and reduce the harmful effects of illicit and licit drugs, including alcohol, in Victoria through the provision of residential and community based services, which include withdrawal services, rehabilitation, supported accommodation, education and training, counselling and support.
Quantity Clients on the pharmacotherapy program
number 13 000 13 561 11 800 13 054
The increased 2011-12 Target reflects additional approved funding.
The higher 2010-11 Expected Outcome is a result of increased demand.
Commenced courses of treatment: community-based drug treatment services
number 36 145 48 200 36 145 43 994
The higher 2010-11 Expected Outcome is a result of improved compliance in data entry and increased demand for community based drug treatment services. As a consequence, the Department is reviewing the target setting process and will adjust the target accordingly next financial year.
Commenced courses of treatment: residential-based drug treatment services
number 6 062 6 062 6 062 5 725
Number of new residential withdrawal clients
number 2 200 nm nm nm
New performance measure for 2011-12 to reflect the Government commitment to increased transparency.
Residential bed days number 107 310 nm nm nmNew performance measure for 2011-12 to reflect the Government commitment to increased transparency.
Quality Drug Treatment Services accredited per cent 100 100 100 98
The 2009-10 Actual has been updated from the Department of Health’s annual report publication following actual data replacing estimates previously provided as at July 2010.
Successful courses of treatment (episodes of care): community-based drug treatment services
number 31 085 45 300 31 085 43 153
The higher 2010-11 Expected Outcome is a result of improved compliance in data entry, increased demand and increased capacity for services to see clients through their treatment to completion. As a consequence, the Department is reviewing the target setting process and will adjust the target accordingly next financial year.
Successful courses of treatment (episodes of care): residential-based drug treatment services
number 5 636 5 636 5 636 5 646
Percentage of residential rehabilitation courses of treatment greater than 65 days
per cent 50 nm nm nm
New performance measure for 2011-12 to reflect the Government’s commitment to increased transparency.
270 Health Service Delivery 2011-12

Major Outputs/DeliverablesPerformance Measures
Unit of Measure
2011-12 Target
2010-11 Expected Outcome
2010-11 Target
2009-10 Actual
Percentage of new clients to existing clients
per cent 50 nm nm nm
New performance measure for 2011-12 to reflect the Government’s commitment to increased transparency.
Trained Alcohol and drug workers per cent 85 85 85 67
Timeliness Average working days between screening of client and commencement of residential-based drug treatment
days 6 8 6 7.9
The 2010-11 Expected Outcome reflects the loss of available treatment beds during the year due to temporary closure of some service providers and the need to improve referral and access protocols for bed based services.
Average working days between screening of client and commencement of community-based drug treatment
days 3 1 3 1.15
The 2010-11 Expected Outcome reflects that the waiting time between identifying clients wanting to address their addiction and accessing support is decreasing.
Cost Total output cost $ million 117.6 110.9 110.2 104.3
The 2011-12 Target reflects additional funding for (i) indexation; and (ii) Government policy initiatives.
Source: Department of Health
Service Delivery 2011-12 Health 271

DEPARTMENT OF HUMAN SERVICES
Departmental mission statementThe Department of Human Services improves people’s lives and reduces their experience of disadvantage, through provision of housing and community services to support and protect Victorians most in need.
Departmental objectivesThe Department’s objectives are: to provide excellent housing and community services that meet the
needs of our clients; and to make a positive difference for Victorians experiencing
disadvantage.
Key strategic priorities for 2011-12The Department’s key strategic priorities for 2011-12 are to: deliver better outcomes for vulnerable children and young people; improve the access of people with a disability, their families and
carers to services they need; plan and deliver forward thinking, responsive housing and
community services; strengthen individual and community capacity; and improve the sustainability of Victoria’s housing and community
services.
Ministerial portfoliosThe Department supports the ministerial portfolios of Community Services, Women’s Policy, Youth Affairs and Housing.
Changes to the output structureThe Department has made some changes to its output structure for 2011-12, as shown in the table below:2010-11 Outputs Reason 2011-12 OutputsRefer to Department of Planning and Community Development output statements
Machinery of government changes
Youth Affairs
Refer to Department of Planning and Community Development output statements
Machinery of government changes
Women’s Policy
272 Human Services Service Delivery 2011-12

2010-11 Outputs Reason 2011-12 OutputsRefer to Department of Planning and Community Development output statements
Machinery of government changes
Office for Disability
Refer to Department of Planning and Community Development output statements
Machinery of government changes
Community Participation
All machinery of government changes resulting from the 2010 election took effect on 1 January 2011.
Service Delivery 2011-12 Human Services 273

The following table summarises the Department’s total output cost.
Table 3.10: Output summary($ million)
2010-11 Budget
2010-11 Revised
2011-12 Budget
Variation (a) (b)
%Disability Services 1 370.4 1 378.9 1 445.4 5.5Child Protection and Family Services 653.1 651.6 702.9 7.6Youth Services and Youth Justice 114.2 116.8 126.4(c) 10.7Concessions to Pensioners and Beneficiaries (d) 493.2 565.7(e) 639.0(f) 29.6Housing Assistance 730.4 441.8 401.9(g) -45.0Empowering Individuals and Communities (h) 56.7 53.2 59.4 4.8Total (i) 3 418.0 3 208.0 3 375.0 -1.3Source: Department of Human Services
Notes:(a) Variation between 2010-11 Budget and 2011-12 Budget.(b) Variations in the Department of Human Services’ 2011-12 Budget compared with
the 2010-11 Budget are primarily due to funding provided for government policy commitments including the full-year effect of initiative funding announced in previous years’ budgets and indexation funding provided for anticipated cost increases in 2011-12.
(c) 2011-12 Budget reflects additional investment in recruitment training and development for youth justice custodial workers, improved safety and security at the Melbourne Juvenile Justice Centre, diversion and rehabilitation of young offenders through intensive bail supervision, additional community based youth services workers and alcohol rehabilitative services for youth justice clients.
(d) The output summary includes funding for transport concessions transferred to the Department of Transport. This funding is reflected in the Department of Transport’s Public Transport Services outputs.
(e) 2010-11 Revised estimate for Concessions to Pensioners and Beneficiaries is higher than the 2010-11 Budget estimate due to an expected increase in concession payments arising from higher utility prices including energy, municipal, water and sewerage and the commencement from 1 March 2011 of the Annual Electricity Concession.
(f) 2011-12 Budget estimate is higher than the 2010-11 Revised estimate primarily due to the full year impact of the Annual Electricity Concessions, which extended the previous Winter Energy Concessions by six months.
(g) The 2011-12 Budget primarily reflects a reduction of fixed term Commonwealth funding for the Social Housing and Nation Building – Economic Stimulus Plan initiatives.
(h) The output costs of Empowering Individuals and Communities reflect the machinery of government transfer of functions of the Office of Women’s Policy, the Office for Disability, the Office for Youth, and Community Programs for disadvantaged groups from the Department of Planning and Community Development to the Department of Human Services.
(i) Total output cost for 2011-12 Budget may not equate to the total expense reported in Budget Paper No. 5, Chapter 3 Departmental financial statements due to additional statements in Budget Paper No. 5 that are not included in departmental output costs. Figures for 2010-11 Budget and 2010-11 Revised have been amended to reflect machinery of government changes and will not equate to total expenses reported in Departmental financial statements.
274 Human Services Service Delivery 2011-12

Amounts availableThe following tables detail the amounts available to the Department from Parliamentary authority and income generated through transactions. Table 3.10 outlines the Department’s income from transactions and Table 3.11 summarises the sources of Parliamentary authority available to the Department to fund the provision of outputs, additions to net asset base and payments made on behalf of the State.
Service Delivery 2011-12 Human Services 275

Table 3.11: Income from transactions($ million)
2009-10 2010-11 2010-11 2010-11 2011-12 Actual Budget Adjusted (a) Revised BudgetOutput appropriations 6 026.6 3 300.6 3 330.7 3 111.1 3 315.1Special appropriations 392.3 63.9 63.9 63.9 63.9Interest 16.7 0.2 0.2 0.4 0.4Sale of goods and services 324.7 15.5 15.5 15.2 15.6Grants 54.1 5.9 5.9 17.1 3.6Fair value of assets and services
received free of charge or for nominal consideration
12.4 .. .. .. ..
Other income 99.0 0.4 0.4 0.6 0.6Total income from transactions 6 925.8 3 386.7 3 416.8 3 208.3 3 399.3Source: Department of Human Services and Department of Treasury and Finance
Note:(a) The 2010-11 Adjusted estimates include the 2010-11 Budget adjusted for
machinery of government changes.(b) The variance between the 2010-11 Revised budget and 2010-11 Adjusted budget
relates to a reduction in revenue from the Commonwealth’s stimulus package for social and community housing initiatives.
Table 3.12: Parliamentary authority for resources($ million)
2010-11 2010-11 2010-11 2011-12 Budget Adjusted (a) Revised BudgetAnnual appropriations 2 529.8 2 559.5 2 626.8 3 349.0 Provision of outputs 2 467.8 2 497.5 2 598.8 3 298.0 Additions to the net asset base 62.0 62.1 28.0 51.1 Payments made on behalf of the State .. .. .. ..Receipts credited to appropriations 1 076.6 1 076.6 707.5 148.8Unapplied previous years appropriation 27.0 27.4 25.9 17.4 Provision of outputs 15.9 16.3 14.2 2.5 Additions to the net asset base 11.1 11.1 11.6 14.9Accumulated surplus – previously applied
appropriation.. .. ( 4.7) ..
Gross annual appropriation 3 633.5 3 663.6 3 355.4 3 515.2Special appropriations 63.9 63.9 68.6 63.9Trust funds 70.3 70.3 81.6 18.4Total parliamentary authority 3 767.7 3 797.9 3 505.6 3 597.5Source: Department of Human Services and Department of Treasury and Finance
Note:(a) The 2010-11 Adjusted estimates include the 2010-11 Budget adjusted for
machinery of government changes.
The following section provides details of the outputs provided to government, including performance measures and costs for each
276 Human Services Service Delivery 2011-12

output. Total expenditure for the Department can be found in Budget Paper No. 5, Chapter 3 Departmental financial statements.
Service Delivery 2011-12 Human Services 277

Disability ServicesDisability Services outputs, through the provision of continuing care and support services for people with disabilities, their carers and their families, aim to make a positive difference for Victorians experiencing disadvantage and provide excellent community services to meet clients’ needs.
Major Outputs/DeliverablesPerformance Measures
Unit of Measure
2011-12 Target
2010-11 Expected Outcome
2010-11 Target
2009-10 Actual
Information, Planning and Capacity BuildingInformation, assistance with planning access to services and coordination of services to maximise independence and participation of people with disabilities.
Quantity Clients receiving case management services
number 5 300 5 300 5 300 4 982
Quality Outlets reporting a minimum of two planned quality improvement activities in the forthcoming year
per cent 90 90 90 89
Timeliness Average case management waiting time days 50 50 50 50
Cost Total output cost $ million 89.5 87.5 87.2 85.4
Targeted ServicesPrograms and services aimed at maintaining and increasing the functional independence of people with disabilities, including support with intervention services for people with complex and challenging behaviours.
Quantity Clients accessing aids and equipment number 29 827 32 429 29 827 30 506
The 2010-11 Expected Outcome is higher than the 2010-11 Target reflecting the impact of non-recurrent funding provided during the year to address waiting lists.
Clients receiving specialist services number 2 420 2 420 2 420 2 080
Quality Clients satisfied with the aids and equipment services system
per cent 85 85 85 90
278 Human Services Service Delivery 2011-12

Major Outputs/DeliverablesPerformance Measures
Unit of Measure
2011-12 Target
2010-11 Expected Outcome
2010-11 Target
2009-10 Actual
Timeliness Clients either in receipt of equipment or sent written acknowledgment of aids and equipment applications within ten working days
per cent 90 70 90 99
The 2010-11 Expected Outcome is lower than the 2010-11 Target reflecting the impact of ASSIST, a new automated reporting system.
Clients waiting less than one month for specialist services
per cent 60 60 60 62
Cost Total output cost $ million 86.6 83.7 83.3 86.5
Individual SupportIndividually tailored packages and supports enabling people with a disability, and families and carers of people with a disability, to access support based on choice.
Quantity Clients receiving individual support number 15 194 14 803 14 803 14 251
The higher 2011-12 Target reflects impact of Commonwealth funding for disability assistance packages.
Clients with day activities number 8 100 8 100 8 100 8 123Episodes of respite provided number 23 027 22 120 22 120 20 913
The higher 2011-12 Target reflects impact of funding for Innovative Respite Care and School Holiday Respite Fund and Commonwealth funding for disability assistance packages.
Quality
Carer households satisfied with quality of respite service provided
per cent 80 80 80 66
Outlets reporting a minimum of two planned quality improvement activities in the forthcoming year
per cent 90 90 90 86
Support plans reviewed at least once during each period of three years commencing from when the support plan was first prepared
per cent 100 100 100 100
Timeliness Support plans prepared within 60 days of the person commencing to regularly access the disability services
per cent 100 100 100 97
Service Delivery 2011-12 Human Services 279

Major Outputs/DeliverablesPerformance Measures
Unit of Measure
2011-12 Target
2010-11 Expected Outcome
2010-11 Target
2009-10 Actual
Cost Total output cost $ million 611.6 562.3 571.9 530.4
The 2010-11 Expected Outcome reflects the movement of funding to address key service demand and cost adjustments.
The 2011-12 Target reflects the full year effect of prior year initiatives and additional investment in individual support packages, respite services and service cost adjustments.
Residential Accommodation SupportAccommodation support provided to groups of clients in community-based settings and centre-based residential institutions which is responsive to individual needs and promotes community participation, relationship building and skill development.
Quantity Clients in residential institutions number 174 174 174 176
Clients in shared supported accommodation
number 5 259 5 224 5 224 5 096
This includes places delivered through the Innovative Housing Options Program.
Quality Outlets reporting a minimum of two planned quality improvement activities in the forthcoming year
per cent 90 90 90 94
Support plans reviewed at least once during each period of 3 years commencing from when the support plan was first prepared
per cent 100 100 100 100
Support plans reviewed every 12 months for persons residing in residential institutions
per cent 100 100 100 100
Timeliness Support plans prepared within 60 days of the person commencing to regularly access the disability services
per cent 100 100 100 96
Cost Total output cost $ million 657.7 645.4 628.0 602.0
The 2010-11 Expected Outcome reflects the movement of funding to address key service demand and cost adjustments.
The 2011-12 Target reflects the full year effect of prior year initiatives and additional investment in new supported accommodation places and adjustments to service costs.
Source: Department of Human Services
280 Human Services Service Delivery 2011-12
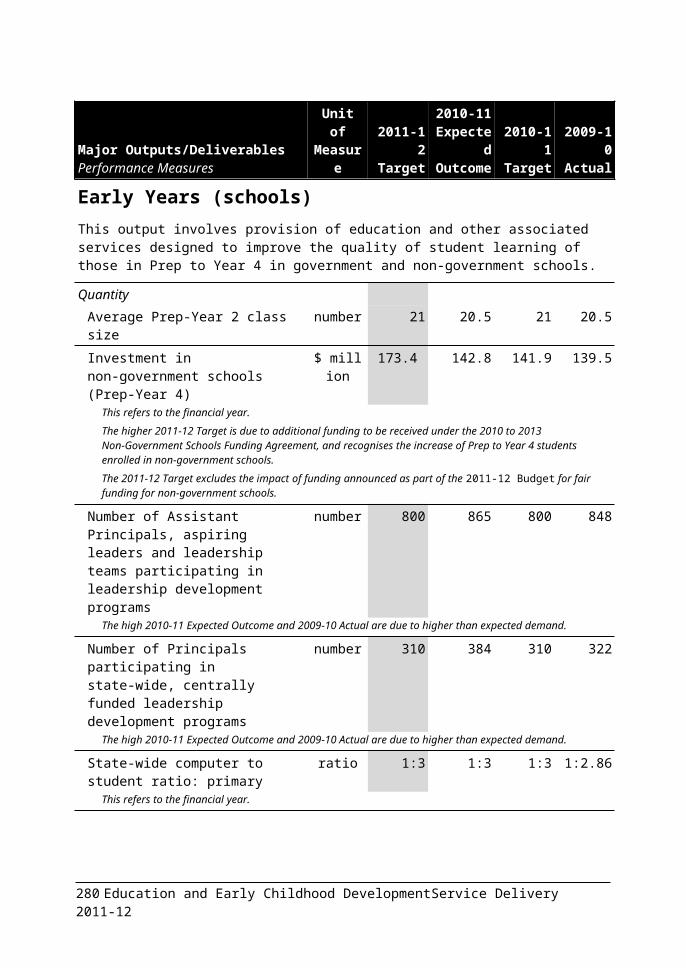
Child Protection and Family ServicesChild Protection and Family Services outputs, through the funding of statutory child protection services, family support and parenting services, family violence and sexual assault, adoption and placement care services and specialist support services to ensure the safety and wellbeing of adolescents and children at risk of harm, abuse and neglect, aim to make a positive difference for Victorians experiencing disadvantage by providing excellent community services to meet clients’ needs.
Major Outputs/DeliverablesPerformance Measures
Unit of Measure
2011-12 Target
2010-11 Expected Outcome
2010-11 Target
2009-10 Actual
Statutory Child Protection ServicesChild protection services to ensure the safety and wellbeing of children and young people at risk of harm, abuse and neglect.
Quantity Child protection reports number 59 700 55 300 50 100 47 481
The 2010-11 Expected Outcome is higher than the 2010-11 Target due to heightened awareness and sensitivity to Child Protection. The higher 2011-12 Target reflects this trend.
Quality Children and young people who were the subject of an investigation which led to a decision not to substantiate, who were subsequently the subject of a substantiation within three months of case closure
per cent 5 3 5 2.62
The 2010-11 Expected Outcome is lower than the 2010-11 Target, this represents a positive outcome and indicates appropriate decision making.
Protective cases re-substantiated within 12 months of case closure
per cent 15 11 17.5 12.11
The 2010-11 Expected Outcome reflects good post-substantiation case planning decision making and the 2011-12 Target has been adjusted accordingly.
Timeliness Percentage of child protection reports requiring an immediate response visited within two days
per cent 97 97 97 94.93
Cost Total output cost $ million 170.8 160.7 161.1 151.1
The 2011-12 Target reflects the full year effect of prior year initiatives and additional investment in the establishment of an Independent Children’s Commissioner and additional child protection workers to respond to the level of demand for services.
Service Delivery 2011-12 Human Services 281

Major Outputs/DeliverablesPerformance Measures
Unit of Measure
2011-12 Target
2010-11 Expected Outcome
2010-11 Target
2009-10 Actual
Specialist Support and Placement ServicesSpecialist Support and Placement services to ensure the safety and wellbeing of children and young people who require support to remain with their family or are placed in out-of-home care.
Quantity Daily average number of placements number 6 500 6 300 6 500 5 951Number of children receiving an intensive support service
number 900 900 900 900
Number of clients receiving funding to support placement stability
number 1 000 1 000 1 000 1 000
Quality Children and young people in out-of-home care who have had three or more placements in the last 12 months (not including placements at home)
per cent 14 13 14 12.09
The 2009-10 Actual and 2010-11 Expected Outcome are lower than the target, demonstrating a positive outcome and reflecting the greater stability in out-of-home care placements
Percentage of community service organisations who have successfully completed a scheduled external review against the registration standards under the Children, Youth and Families Act (2005)
per cent 95 95 95 100
Proportion of placements that are home-based care
per cent 90 90 90 91.1
Cost Total output cost $ million 362.3 330.9 331.7 313.1
The 2011-12 Target reflects the full year effect of prior year initiatives and additional investment in health and education assessments for children entering out-of-home care, funding to address shortages in the number of placements in the out-of-home care system, and additional support services for young people leaving care.
Family and Community ServicesThe provision of a range of early intervention and support services to ensure the safety and wellbeing of children, young people and families.
Quantity Number of family services cases provided to Aboriginal families
number 1 500 1 680 1 500 1 582
The 2010-11 Expected Outcome, based on current data estimates, is higher than the 2010-11 Target. If this trend is confirmed, the target may need to be adjusted in future years.
282 Human Services Service Delivery 2011-12

Major Outputs/DeliverablesPerformance Measures
Unit of Measure
2011-12 Target
2010-11 Expected Outcome
2010-11 Target
2009-10 Actual
Number of referrals to Child FIRST number 9 000 9 190 9 000 8 865
Total number of family services cases provided
number 24 910 24 910 24 910 26 223
Timeliness Sexual assault support services clients receiving an initial response within five working days of referral
per cent 95 95 90 98
The 2010-11 Expected Outcome is higher than the 2010-11 Target, reflecting improvements in performance and the 2011-12 Target has been adjusted accordingly.
Cost Total output cost $ million 169.8 160.0 160.3 147.8
The 2011-12 Target reflects the full year effect of prior year initiatives and additional investment in intensive ante and post natal support for vulnerable mothers and their families, a three year early intervention program to provide child care to at-risk children, funding for Early Childhood Development workers, and funding for Aboriginal Community Controlled Organisations to increase their operational and service capabilities.
Source: Department of Human Services
Service Delivery 2011-12 Human Services 283

Youth Services and Youth JusticeYouth Services and Youth Justice outputs, through the funding of a range of services including the provision of advice to courts, community-based and custodial supervision, and youth services, aims to make a positive difference for Victorians experiencing disadvantage by providing excellent community services to meet clients’ needs.
Major Outputs/DeliverablesPerformance Measures
Unit of Measure
2011-12 Target
2010-11 Expected Outcome
2010-11 Target
2009-10 Actual
Youth Justice Custodial ServicesSupervision and rehabilitation, through the provision of case management, health and education services and the establishment of structured community supports, to assist young people address offending behaviour, develop non-offending lifestyles and support the re-integration of the young person into the community at the completion of their sentence.
Quantity Annual daily average number of young people in custody: males (15 years plus)
number 140-190 164 130-180 155.3
The higher 2011-12 Target reflects policing and sentencing practices impacting on custodial numbers.
Annual daily average number of young people in custody: male (under 15 years) and female
number 15-25 15 15-25 18.7
Average daily custodial centre utilisation rate: males (15 years plus)
per cent 90-95 93.4 70-90 89.8
The 2010-11 Expected Outcome reflects policing and sentencing practices impacting on custodial numbers and the 2011-12 Target is adjusted accordingly.
Average daily custodial centre utilisation rate: males (under 15 years) and female
per cent 40-65 30.5 40-65 48
The 2010-11 Expected Outcome is lower than the 2010-11 Target range, reflecting small client numbers within this cohort that fluctuate.
Quality Clients participating in community re-integration activities
per cent 60 54 70 64
The 2009-10 Actual and 2010-11 Expected Outcome are lower than the target reflecting the changing profile of young people entering the custodial system. The 2011-12 Target has been decreased to account for the changing profile and reductions in eligibility for community reintegration activities.
Timeliness Young people on custodial orders who have a client assessment and plan completed within six weeks of the commencement of the order
per cent 95 95 95 85.7
284 Human Services Service Delivery 2011-12

Major Outputs/DeliverablesPerformance Measures
Unit of Measure
2011-12 Target
2010-11 Expected Outcome
2010-11 Target
2009-10 Actual
Cost Total output cost $ million 61.6 57.8 55.5 56.2
The 2010-11 Expected Outcome reflects additional investment to improve safety and security at the Melbourne Youth Justice Precinct.
The 2011-12 Target reflects the full year effect of prior year initiatives and additional investment in recruitment training and development for youth justice custodial workers, and improved safety and security at the Melbourne Youth Justice Precinct.
Community Based ServicesProvide community based supervision in order to divert young people from the youth justice system and minimise the likelihood of further offending and provide health care and support services for young people.
Quantity Average daily number of clients under community-based supervision
number 1 625 1 450 1 200 1 368
The 2010-11 Expected Outcome is higher than the 2010-11 Target due to additional funding provided in the 2010-11 Budget.
The 2011-12 Target has been increased to reflect additional funding provided in the 2011-12 Budget.
Proportion of Youth Justice Clients under community-based supervision
per cent 85 85 85 88.7
Quality Community-based orders completed successfully
per cent 85 85 85 nm
Timeliness Young people on supervised orders who have a Client Assessment and Plan completed within six weeks of the commencement of the order
per cent 95 95 95 95.7
Cost Total output cost $ million 64.8 59.0 58.7 50.8
The 2011-12 Target reflects the full year effect of prior year initiatives and additional investment in the diversion and rehabilitation of young offenders through intensive bail supervision, additional community based youth services workers and group conferencing diversionary programs.
Source: Department of Human Services
Service Delivery 2011-12 Human Services 285

Concessions to Pensioners and BeneficiariesConcessions to Pensioners and Beneficiaries outputs, through the development and coordination of the delivery of concessions and relief grants to eligible consumers and concession card holders, aim to make a positive difference for Victorians experiencing disadvantage by providing excellent community services to meet clients’ needs.
Major Outputs/DeliverablesPerformance Measures
Unit of Measure
2011-12 Target
2010-11 Expected Outcome
2010-11 Target
2009-10 Actual
Concessions to Pensioners and BeneficiariesProvides reductions in the price of energy, water and municipal rates to eligible consumers and concession card holders. Provision of trustee services for low income people or those who are subject to an order by the Victorian Civil and Administrative Tribunal, and other social and community services, including the provision of emergency relief for individuals or families who are experiencing immediate and personal distress due to a financial or domestic crisis.
Quantity Households receiving mains electricity concessions
number 844 000 806 000 780 000 809 112
The higher 2011-12 Target reflects increases in the number of households that are eligible for the concession.
Households receiving mains gas concessions
number 807 000 750 000 600 000 697 125
The higher 2011-12 Target and the higher 2010-11 Expected Outcome reflect increases in the number of households that are eligible for, and are taking up this concession.
Households receiving non-mains energy concessions
number 22 100 22 000 19 000 21 922
The 2010-11 Expected Outcome is higher than the 2010-11 Target due to increases in demand.
Households receiving pensioner concessions for municipal rates and charges
number 429 000 419 000 420 000 411 499
Households receiving water and sewerage concessions
number 709 000 677 000 625 000 669 776
The 2010-11 Expected Outcome is higher than the 2010-11 Target due to increases in the number of households that are eligible for the concession.
Number of clients receiving trustee services
number 14 600 14 500 13 100 15 202
The 2010-11 Expected Outcome is higher than the 2010-11 Target due to the growth in demand for these services and an increase in State Trustee appointments by the Victorian Civil and Administrative Tribunal (VCAT) and the 2011-12 Target has been adjusted accordingly.
Quality Compliance with standards per cent 90 90 90 81.3
Timeliness Responses and ongoing management within agreed product specific service level
per cent 90 90 90 91.4
286 Human Services Service Delivery 2011-12

Major Outputs/DeliverablesPerformance Measures
Unit of Measure
2011-12 Target
2010-11 Expected Outcome
2010-11 Target
2009-10 Actual
Cost Total output cost $ million 514.8 445.9 373.4 393.3
The 2010-11 Expected Outcome reflects additional government funding to continue to provide concessional rates that are commensurate with the rising costs of utilities, including energy, municipal, water and sewerage.
The 2011-12 Target reflects additional government funding to continue to provide concessional rates that are commensurate with the rising costs of utilities, including energy, municipal, water and sewerage. In addition, funding was also provided to extend the Winter Energy Concession on electricity bills for Victorian concession card holders from six months to all year round.
Source: Department of Human Services
Service Delivery 2011-12 Human Services 287

Housing AssistanceHousing Assistance outputs, through the provision of homelessness services, crisis and transitional accommodation and long term adequate, affordable and accessible housing assistance, coordinated with support services where required, home renovation assistance and the management of the home loan portfolio, aim to make a positive difference for Victorians experiencing disadvantage by providing excellent housing and community services to meet clients’ needs.
Major Outputs/DeliverablesPerformance Measures
Unit of Measure
2011-12 Target
2010-11 Expected Outcome
2010-11 Target
2009-10 Actual
Social HousingThe provision of housing assistance, for low income families, older persons, singles, youth and other households. Responding to the needs of clients through the provision of appropriate accommodation, including short term and long term properties, that assist in reducing and preventing homelessness.
Quantity Number of households assisted with crisis/transitional social housing to prevent and address homelessness
number 10 095 9 939 12 500 12 500
The lower 2010-11 Expected Outcome and 2011-12 Target reflect the lower turnover rates in transitional housing management (THM) properties, decreasing the number of households assisted in these properties.
Lower turnover rates in THM are due to the lack of affordable options in the private rental market, together with low public housing exit rates.
Number of households assisted with long term social housing (public, Indigenous and community long-term tenancies at end of year)
number 77 260 76 322 76 200 73 644
A household is defined as a tenancy agreement; it may include more than one person who is assisted into accommodation.
Number of public housing dwellings with major upgrade during year
number 1 800 1 955 1 900 3 712
Major upgrades are defined as upgrades with expenditure of over $10 000 per dwelling.The lower 2011-12 Target reflects the impact of a planned program of more substantial upgrades, which are expected to be delivered at a higher average cost based on current program estimates.
Total number of social housing dwellings
number 84 785 83 755 83 300 80 955
Social housing includes public rental housing, long term community housing and Indigenous housing.
Total social housing dwellings acquired during the year
number 1 600 3 700 3 800 3 221
Social housing includes public rental housing, long term community housing and Indigenous housing. The 2011-12 Target reflects the winding down of Commonwealth funding under the Nation Building and Jobs Plan.
The 2010-11 Expected Outcome is lower than the 2010-11 Target due to the continued effects of inclement weather which has delayed the construction program.
288 Human Services Service Delivery 2011-12

Major Outputs/DeliverablesPerformance Measures
Unit of Measure
2011-12 Target
2010-11 Expected Outcome
2010-11 Target
2009-10 Actual
Quality Proportion of public housing maintenance contractors completing urgent maintenance jobs that are within timeframes
per cent 95 95 95 95
Urgent maintenance jobs are jobs that need to be completed within 24 hours, for example, an interruption of an essential service such as gas or power.
Timeliness Average waiting time for public rental housing for those clients who have received early housing allocation
months 9.1 9.1 8 8.5
The 2010-11 Expected Outcome and 2011-12 Target are higher than the 2010-11 Target as a result of better management strategies to reassess applications which has resulted in those who have been waiting longer, being housed. Therefore this results in a longer average waiting time.
Cost Total output cost $ million 168.8 218.5 517.6 947.7
The 2010-11 Expected Outcome reduction primarily reflects Commonwealth funding for the Nation Building and Jobs Plan initiative that was budgeted for in 2010-11, however was received in advance in 2009-10.
The 2011-12 Target primarily reflects a reduction in fixed term Commonwealth funding for the Social Housing and Nation Building – Economic Stimulus Plan initiatives.
Housing Support and Homelessness AssistanceHousing support services to people who are homeless or at risk of homelessness, in short term housing or crisis situations. Support will assist clients in accessing and maintaining tenancies in appropriate accommodation. Services provided will assist in the prevention and overall reduction of homelessness and decrease demand for social housing.
Quantity Bond loans provided during year number 10 700 10 700 8 400 9 982
The 2010-11 Expected Outcome is higher than the 2010-11 Target due to the effect of policy changes made to increase bond loan limit amounts which have continued to increase the uptake of bond loans. The 2011-12 Target has been adjusted accordingly.
Clients assisted with support to address and prevent homelessness
number 45 800 45 300 46 000 44 250
Households assisted with housing establishment assistance during year
number 36 000 36 000 36 000 36 000
Housing establishment funds are used to provide direct financial assistance to clients to gain entry or maintain private rental accommodation or access to emergency accommodation.
Initial assessment and planning (occasions of service) provided to address and prevent homelessness
number 80 000 80 000 80 000 80 000
Initial assessment and planning provides people who are homeless, or at risk of homelessness, with assistance to address their housing needs, including access to other housing and support services and information on access to private rental and public housing.
Service Delivery 2011-12 Human Services 289

Major Outputs/DeliverablesPerformance Measures
Unit of Measure
2011-12 Target
2010-11 Expected Outcome
2010-11 Target
2009-10 Actual
Number of new households assisted to maintain or enter home ownership (including home renovation inspections as well as loans)
number 4 300 4 375 4 375 4 346
Quality Percentage of clients with case plans in homelessness support programs with some, most or all of their case plan goals achieved
per cent 85 85 85 nm
Percentage of neighbourhood renewal projects that have achieved active resident participation in governance structures
per cent 100 100 100 100
Proportion of assisted households satisfied with renovation assistance
per cent 95 96 95 99
Timeliness Proportion of homelessness support episodes where an accommodation need was unable to be either provided or referred
per cent 12 12 12 12
Cost Total output cost $ million 233.1 223.3 212.7 191.3
The 2010-11 Expected Outcome and the 2011-12 Target reflect additional investment in the Homelessness 2020 Strategy, Victorian Bushfire Reconstruction and Recovery Authority transition strategy for Accommodation and Support Services, and the National Affordable Housing Agreement population share indexation (funding allocation).
Source: Department of Human Services
290 Human Services Service Delivery 2011-12

Empowering individuals and communitiesEmpowering individuals and communities is delivered through funded programs that support community participation including Neighbourhood Houses, Men’s Sheds and programs for youth, women and people with a disability. Leadership is delivered for whole of government policy on youth, women and disability that will create an environment that encourages equity and improves outcomes in all aspects of life for youth, women and people with a disability.
Major Outputs/DeliverablesPerformance Measures
Unit of Measure
2011-12 Target
2010-11 Expected Outcome
2010-11 Target
2009-10 Actual
Youth AffairsLead and coordinate whole of government policy and deliver targeted programs for young people aged between 12 and 25, particularly from diverse backgrounds or those experiencing disadvantage, to support them to participate confidently in their communities.
Quantity Participation by young people in programs that provide opportunities to be involved in social and economic life in their communities
number 194 680 nm nm nm
New performance measure for 2011-12 reflects funded initiatives. Proposed to replace ‘FReeZA: event attendance’ and ‘Young people participating in the Advance Youth Development Program’. Includes Advance, National Youth Week, FReeZA, Youth Participation and Access, Youthcentral Roving Reporters, MCBI (Mentoring and Capacity Building Initiative), SYN (Student Youth Network) FM, Community Radio and CMY (Centre for Multicultural Youth) Regional Offices.
Participation by young people in programs that support young people to be involved in decision making in their community
number 1 925 nm nm nm
New performance measure for 2011-12 reflects funded initiatives. Previous performance measures did not include this outcome. Includes National Youth Week, Young People Direct, FReeZA, Youth Parliament, Youth Foundations Victoria, CMY core funding and YACVic (Youth Affairs Council Victoria) core funding.
Quality Participants reporting development of transferable skills that support education, training and vocational opportunities
per cent 75 nm nm nm
New performance measure for 2011-12 to better reflect the breadth of work of the Office as well as provide an indication of ‘impact’ or ‘outcome’ of the activities and programs of the Office for Youth.
Timeliness Program delivery meets milestones per cent 85 nm nm nm
This new performance measure for 2011-12 replaces the measure ‘Youth Participation and Access Program: Grants acquitted within the timeframe specified in the terms and conditions of the funding agreement’. The new measure reflects timeliness in the delivery of program milestones, namely that grant payments are acquitted within the timeframe specified in the terms and conditions of relevant funding agreements.
Service Delivery 2011-12 Human Services 291
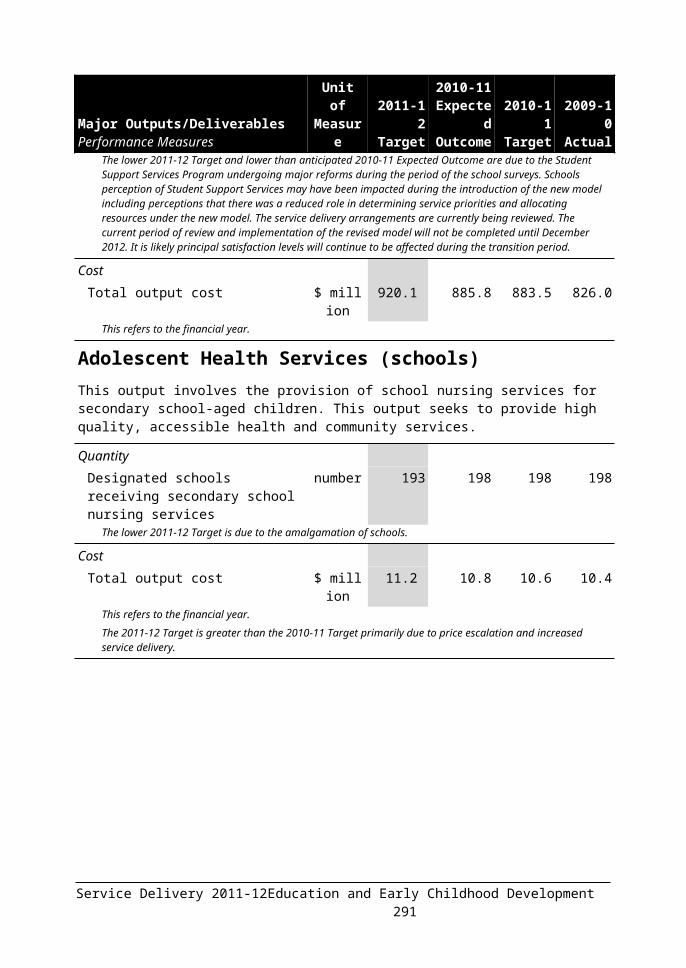
Major Outputs/DeliverablesPerformance Measures
Unit of Measure
2011-12 Target
2010-11 Expected Outcome
2010-11 Target
2009-10 Actual
Cost Total output cost $ million 18.6 14.5 15.8 14.5
The 2010-11 Expected Outcome and the 2011-12 Target of Empowering Individuals and Communities reflect the machinery of government transfer of functions of the Office of Women’s Policy, the Office for Disability, the Office for Youth, and Community Programs for disadvantaged groups from the Department of Planning and Community Development to the Department of Human Services.
Women’s PolicyLead and coordinate whole of government policy, engage with women from diverse backgrounds and deliver initiatives to improve the lives of Victorian women and support their economic, social and civic participation.
Quantity Number of women consulted through OWP programs
number 800 800 800 1 037
This performance measure replaces ‘Women participating in consultations’. The 2011-12 performance measure is the same as the 2010-11 measure, except the wording has been slightly changed to narrow the focus on consultation of women through OWP programs. It measures the same activity as per the measure in 2010-11.
Number of women participating in funded programs
number 625 nm nm na
New performance measure for 2011-12 to reflect the number of women participating in OWP programs and activities throughout the year.
Quality Funded projects meet agreed project objectives
per cent 90 90 90 95
Participant satisfaction with funded programs
per cent 85 nm nm nm
New performance measure for 2011-12 to reflect the satisfaction of women participating in OWP programs and activities throughout the financial year. This performance measure replaces the performance measure ‘User satisfaction with diversity register’ and ‘Participant satisfaction with consultations’.
Timeliness Projects delivered within agreed timeframes
per cent 90 90 90 97
Cost Total output cost $ million 7.9 6.0 7.0 4.8
The 2010-11 Expected Outcome and the 2011-12 Target of Empowering Individuals and Communities reflect the machinery of government transfer of functions of the Office of Women’s Policy, the Office for Disability, the Office for Youth, and Community Programs for disadvantaged groups from the Department of Planning and Community Development to the Department of Human Services.
292 Human Services Service Delivery 2011-12

Major Outputs/DeliverablesPerformance Measures
Unit of Measure
2011-12 Target
2010-11 Expected Outcome
2010-11 Target
2009-10 Actual
Office for DisabilityLead and coordinate whole of government policy, support disability action planning, and provide funding and support to disability advocacy and self advocacy organisations so that people with a disability experience reduced disadvantage, can fully participate in the community, and have their rights upheld.
Quantity Number of Disability Advocacy clients number >1 900 1 900 >1 900 1 995
Number of meetings of the Victorian Disability Advisory Council held
number 6 6 6 6
Quality Client satisfaction with advice provided per cent 100 100 100 100Participant satisfaction with community engagement consultation
per cent 85 85 85 85
Timeliness Projects delivered within agreed timeframes
per cent 100 100 100 100
Cost Total output cost $ million 5.0 6.6 7.2 7.3
The 2010-11 Expected Outcome and the 2011-12 Target of Empowering Individuals and Communities reflect the machinery of government transfer of functions of the Office of Women’s Policy, the Office for Disability, the Office for Youth, and Community Programs for disadvantaged groups from the Department of Planning and Community Development to the Department of Human Services.
Community ParticipationCommunity Participation programs including the Neighbourhood House Coordination Program, Men’s Sheds, Community Renewal and Community Finance initiatives. These programs support the social and economic participation of Victorian communities, particularly vulnerable populations.
Quantity Hours of coordination funding provided to Neighbourhood Houses
number(‘000)
465 465 465 467
Quality Resident participation in community renewal governance structures
per cent 50 50 50 50
Timeliness Grants acquitted within the timeframe specified in the terms and conditions of the funding agreement
per cent >90 90 >90 90.4
Service Delivery 2011-12 Human Services 293

Major Outputs/DeliverablesPerformance Measures
Unit of Measure
2011-12 Target
2010-11 Expected Outcome
2010-11 Target
2009-10 Actual
Cost Total output cost $ million 27.9 26.1 26.7 24.4
The 2010-11 Expected Outcome and the 2011-12 Target of Empowering Individuals and Communities reflect the machinery of government transfer of functions of the Office of Women’s Policy, the Office for Disability, the Office for Youth, and Community Programs for disadvantaged groups from the Department of Planning and Community Development to the Department of Human Services.
The 2010-11 Target reflects the proportion of performance measures transferred from the Department of Planning and Community Development as part of the machinery of government changes.
Source: Department of Human Services
294 Human Services Service Delivery 2011-12

DEPARTMENT OF JUSTICE
Departmental mission statementThe Department of Justice provides a policy and organisational management focus for the vision of a safe, just, innovative and thriving Victoria, where rights are respected and diversity embraced.
Departmental objectivesThe Department of Justice has six key objectives: lead whole of government emergency management; lead whole of government crime prevention; provide excellence in service delivery; ensure responsible regulation; manage the Justice Service portfolio; and manage capacity and demand for correctional services.
Key strategic priorities for 2011-12The Department of Justice’s key strategic priorities for 2011-12 are: creating and transitioning to a new Courts Executive Service; establishing an independent Freedom of Information (FOI)
commissioner; integrating the administration of gambling and liquor licensing
through creation of the Victorian Commission for Gambling and Liquor Regulation (VCGLR);
establishing the Victorian Responsible Gambling Foundation (VRGF);
successfully implementing sentencing reforms; ensuring that correctional services effectively manages prisoners
and offenders; implementing racing industry development initiatives; and addressing public safety and crime.
Ministerial PortfoliosThe Department supports the Ministerial portfolios of the Attorney-General, Police and Emergency Services, Bushfire Response, Crime Prevention, Corrections, Consumer Affairs, Gaming and Racing.
Service Delivery 2011-12 Justice 295

Changes to the output structureThe Department has made some changes to its output structure for 2011-12, as shown in the table below:2010-11 Outputs Reason 2011-12 OutputsGaming and Racing Management and Regulation
Title Change Gambling Regulation and Racing Industry Development
The following table summarises the Department’s total output cost.
Table 3.13: Output summary ($ million)
2010-11 Budget
2010-11 Revised
2011-12 Budget
Variation (a)
%Public Safety and Crime Reduction (b)(c) 2 017.0 1 988.3 2 088.7 3.6Legal Support to Government and Protecting the
Rights of Victorians (d) 299.5 313.5 311.3 3.9
Dispensing Justice 470.2 477.4 485.7 3.3Community Operations (e) 264.8 253.4 276.1 4.3Supporting the State’s Fire and Emergency
Services (f) 232.6 270.9 273.9 17.8
Enforcing Correctional Orders (g) 639.8 641.1 714.8 11.7Protecting Consumers (h) 159.0 165.3 114.2 -28.2Gambling Regulation and Racing Industry
Development (i)(j) 129.6 119.3 165.6 27.8
Total (k) 4 212.5 4 229.2 4 430.3 5.2Source: Department of Justice
Notes:(a) Variation between 2010-11 Budget and 2011-12 Budget.(b) This represents a renaming of the 2011-12 output group ‘Public Safety and Crime
Reduction’ which replaces the 2010-11 output group ‘Providing a Safe and Secure Society’, to better reflect the focus of service delivery.
(c) The increase in the 2011-12 Budget is due to additional funding for frontline policing and protective services officers.
(d) The 2010-11 Budget included an incremental movement in state Victoria Legal Aid funding for 2011-12.
(e) The increase in the 2011-12 Budget is due to additional funding for the Community Crime Prevention Program – Community Safety Fund and Public Infrastructure Safety Fund and Graffiti initiatives.
(f) The increase in the 2011-12 Budget is due to additional funding for Bushfire and Emergency Services Response and incremental funding in response to the Victorian Bushfires Royal Commission.The 2010-11 Revised budget includes funding in response to the Victorian Bushfires Royal Commission provided after the 2010-11 Budget and one off funding for the Victorian Flood Response.
(g) The increase in the 2011-12 Budget is due to funding for Serious Sex Offender Management and Sentencing Reform.
(h) The reduction in the 2011-12 output cost is due to the completion of the housing initiative which provided $200m over four years through the Victorian Property Fund for additional public housing units.
296 Justice Service Delivery 2011-12

(i) The increase in the 2011-12 Budget reflects funding for Racing Industry Development and to establish the Victorian Responsible Gambling Foundation.
(j) This represents a renaming of the 2011-12 output group ‘Gambling Regulation and Racing Industry Development’ which replaces the 2010-11 output group ‘Regulating Gaming and Racing’, to better reflect the focus of service delivery.
(k) Total output cost for 2011-12 Budget may not equate to the total expense reported in Budget Paper No. 5, Chapter 3 Departmental financial statements due to additional expenses in Budget Paper No. 5 that are not included in departmental output costs.
Amounts availableThe following tables detail the amounts available to the Department from Parliamentary authority and income generated through transactions. Table 3.14 outlines the Department’s income from transactions and Table 3.15 summarises the sources of Parliamentary authority available to the Department to fund the provision of outputs, additions to net asset base and payments made on behalf of the State.
Table 3.14: Income from transactions($ million)
2009-10 2010-11 2010-11 2011-12 Actual Budget Revised BudgetOutput appropriations 3 538.2 3 884.4 3 868.2 4 121.7Special appropriations 98.0 143.1 144.9 130.0Interest 80.0 94.1 99.9 99.9Sale of goods and services 4.6 2.8 7.4 6.1Grants 58.9 47.6 71.4 87.4Fair value of assets and services received free of
charge or for nominal consideration 1.2 .. .. ..
Other income 26.3 25.1 22.6 22.4Total income from transactions 3 807.2 4 197.1 4 214.5 4 467.5Source: Department of Justice and Department of Treasury and Finance
Table 3.15: Parliamentary authority for resources($ million)
2010-11 2010-11 2011-12 Budget Revised BudgetAnnual appropriations 3 906.7 3 712.3 4 097.3 Provision of outputs 3 671.6 3 594.2 3 838.8 Additions to the net asset base 182.7 65.7 204.0 Payments made on behalf of the State 52.3 52.3 54.5Receipts credited to appropriations 170.3 216.7 214.2Unapplied previous years appropriation 47.1 92.0 96.7 Provision of outputs 43.9 73.2 73.7 Additions to the net asset base 3.2 18.9 23.0Accumulated surplus – previously applied appropriation 3.2 14.7 4.5
Service Delivery 2011-12 Justice 297
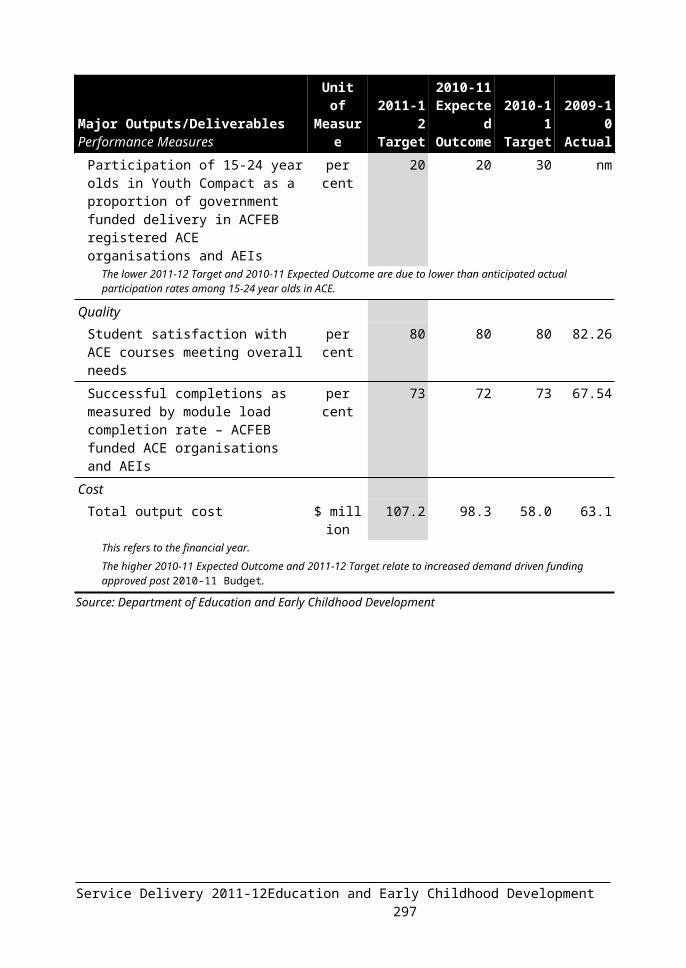
Gross annual appropriation 4 127.2 4 035.7 4 412.8Special appropriations 192.4 208.4 188.2Trust funds 187.4 218.1 233.1Total parliamentary authority 4 507.1 4 462.2 4 834.0Source: Department of Justice and Department of Treasury and Finance
The following section provides details of the outputs provided to government, including performance measures and costs for each output. Total expenditure for the Department can be found in Budget Paper No. 5, Chapter 3 Departmental financial statements.
298 Justice Service Delivery 2011-12

Public Safety and Crime ReductionThese outputs contribute towards enabling individuals and families to undertake their lawful pursuits confidently, safely and without fear of crime.
Victoria Police significantly contributes to this outcome by striving to reduce violence and crime through law enforcement, judicial support, community assistance, guidance and leadership.
The Office of Police Integrity ensures Victoria Police maintains the highest ethical and professional standards at all times.
This output group will contribute to the Department’s objective to lead whole of government crime prevention.
Major Outputs/DeliverablesPerformance Measures
Unit of Measure
2011-12 Target
2010-11 Expected Outcome
2010-11 Target
2009-10 Actual
Policing ServicesVictoria Police delivers a range of services including:
detection and investigation of offences and bringing to justice those responsible for committing them;
supporting the judicial process to achieve efficient and effective court case management, providing safe custody for alleged offenders and ensuring fair and equitable treatment of both victims and alleged offenders;
responding to calls for assistance in matters of personal and public safety, including emergencies, serious incidents and routine response calls;
providing community safety and crime prevention programs such as the authorised release of criminal history information in the interests of public safety; and
promoting safer road user behaviour and enforcing road safety laws.
These range of law enforcement services aim to prevent, detect, investigate and prosecute crime, and promote safer road user behaviour. They reflect the Government’s focus on reducing the overall incidence and fear of crime and enhancing the safety of individuals and families.
Quantity Crime prevention and community safety checks conducted
number 470 000 460 000 410 000 434 171
The higher 2011-12 Target reflects the historic performance for this measure. This approach incorporates 2010-11 demand trends for crime prevention and community safety checks.
The 2010-11 Expected Outcome is higher than the 2010-11 Target due to increased demand for safety checks from other sources.
Events responded to number 750 000 750 000 780 000 753 417Reduction in crimes against the person per cent 2.0 -2.0 2.0 -2.9
The 2010-11 Expected Outcome (2 per cent increase) is higher than the 2010-11 Target (2 per cent decrease) due to a rise in the total number of recorded ‘assaults’. Police attendance at, and recorded assaults, in the context of Family Violence Incidents (FVI) have increased significantly. Victoria Police actively encourages the reporting of FVI, as part of a longer-term strategy to reduce the incidence of family violence in the community.
Service Delivery 2011-12 Justice 299

Major Outputs/DeliverablesPerformance Measures
Unit of Measure
2011-12 Target
2010-11 Expected Outcome
2010-11 Target
2009-10 Actual
Reduction in property crime per cent 3.0 4.5 2.0 7.0The 2010-11 Expected Outcome (4.5 per cent decrease) is higher than the 2010-11 Target (2.0 per cent decrease) due to a significant reduction in theft offences. The decline in property crime is underpinned by a decline in almost all the offence types which make up that category. Theft offences are the most numerous offences within the property crime category and any decline of such offences will have a disproportionate effect on the overall result.
Quality Proportion of community satisfied with policing services (general satisfaction)
per cent 68.0 67.9 66.0 66.1
Proportion of drivers tested who comply with alcohol limits
per cent 99.5 99.7 99.0 99.7
Proportion of drivers tested who comply with posted speed limits
per cent 99.5 99.8 99.0 99.7
Proportion of drivers tested who return clear result for prohibited drugs
per cent 98.0 98.1 97.0 98.9
Proportion of successful prosecution outcomes
per cent 92.0 92.0 92.0 93.6
Proportion of the community who have confidence in police (an integrity indicator)
per cent 82.0 82.6 82.0 81.9
Timeliness Proportion of crimes against the person resolved within 30 days
per cent 54.0 54.0 56.0 52.4
Proportion of property crime resolved within 30 days
per cent 21.0 20.3 20.0 20.4
Cost Total output cost $ million 2061.9 1961.0 1 990.8 1 857.1
The increase in the 2011-12 Target is due to additional funding for frontline policing and protective services officers.
300 Justice Service Delivery 2011-12

Major Outputs/DeliverablesPerformance Measures
Unit of Measure
2011-12 Target
2010-11 Expected Outcome
2010-11 Target
2009-10 Actual
Police IntegrityThe Office of Police Integrity is an independent police anti-corruption and oversight body established to:
ensure Victoria Police maintains the highest ethical and professional standards;
detect, investigate and prevent police corruption and serious misconduct;
educate Victoria Police and the general community regarding police corruption and serious misconduct, including their effects;
make sure Victoria Police members have regard to human rights; and
build a corruption-resistant culture within Victoria Police and advance the delivery of ethical and professional policing services to the Victorian community.
It is anticipated that the performance measures and appropriate funding in the ‘Police Integrity’ output will be incorporated into the future Independent Broad Based Anti Corruption Committee (IBAC) output reporting regime when it is established.
Quantity Corruption prevention initiatives number 50 50 50 94
Parliamentary reports published number 6 6 6 4Quality
OPI investigations resulting in significant outcomes
per cent 75.0 70.0 75.0 74.0
The 2010-11 Expected Outcome is lower than the 2010-11 Target due to the impact of a number of complex investigations.
Timeliness Compliance with complaint handling requirements prescribed in legislation within set timeframes
per cent 100.0 100.0 100.0 100.0
Cost Total output cost $ million 26.8 27.3 26.2 24.2
Source: Department of Justice
Service Delivery 2011-12 Justice 301
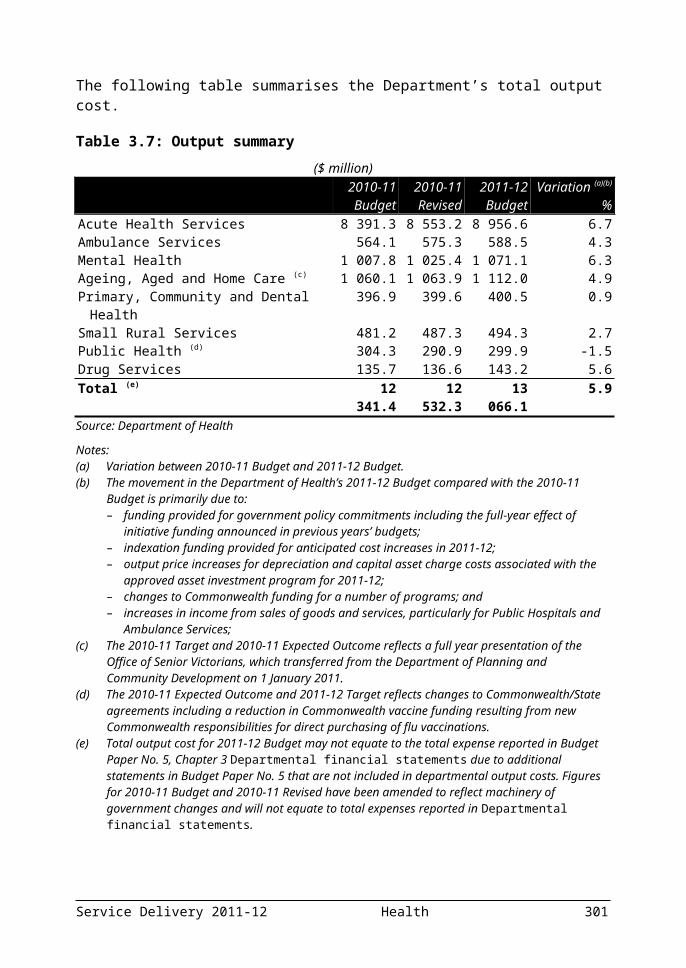
Legal Support to Government and Protecting the Rights of VictoriansThese outputs include a range of activities delivered by the Department including:
legal policy advice to government, law reform and implementation of new or amended legislation and providing legal advice to other departments and agencies;
provision of services relating to rights and equal opportunity, identity protection, and advocacy and guardianship for Victorians with a disability or mental illness;
legal aid to support access to justice, supporting victims of crime, and delivery of independent, expert and credible forensic medical services to the justice system;
privacy protection; and
the administration of the Victorian electoral system.
This output group will contribute to the Department’s objective of managing the Justice Service portfolio.
Major Outputs/DeliverablesPerformance Measures
Unit of Measure
2011-12 Target
2010-11 Expected Outcome
2010-11 Target
2009-10 Actual
Legal Policy, Advice and Law ReformThis output encompasses the provision of legal policy advice to government, law reform and management of Native Title legislation and Native Title claims.
Legal policy advice is delivered jointly through the Department and the Victorian Government Solicitor’s Office (VGSO). The Victorian Law Reform Commission (VLRC) reports and recommends on both issues referred to it by the Attorney-General and on minor changes of the law without a reference.
Quantity Community education and consultation sessions conducted by VLRC
number 50 50 50 50
Law reform projects conducted by VLRC number 4 4 4 4
Native title claims for which evidence has been assessed
number 3 3 3 3
Quality Client satisfaction with quality of legal advice provided (VGSO)
per cent 80.0 80.0 80.0 77.0
Stakeholder satisfaction with consultation/education processes (VLRC)
per cent 85.0 85.0 85.0 85.0
Stakeholder satisfaction with law reform projects, briefings and consultations (Legal Policy)
per cent 80.0 80.0 80.0 80.0
302 Justice Service Delivery 2011-12

Major Outputs/DeliverablesPerformance Measures
Unit of Measure
2011-12 Target
2010-11 Expected Outcome
2010-11 Target
2009-10 Actual
Timeliness Client satisfaction with timeliness of legal advice provided (VGSO)
per cent 80.0 80.0 80.0 83.0
Cost Total output cost $ million 64.6 63.8 54.8 60.3
The increase in the 2011-12 Target reflects an anticipated increase in expenditure against the Law Reform and Research Trust. The increase in 2010-11 Expected Outcome reflects increased one off funds for Native Title settlements.
Protecting Community RightsPromotes non-discrimination and protects community rights through:
the work of the Victorian Equal Opportunity and Human Rights Commission (VEOHRC) in relation to human rights and discrimination through education, engagement, capacity building and actively assisting parties to quickly and effectively resolve disputes;
promoting the rights, interests and dignity of Victorians with a disability or mental illness through the Office of the Public Advocate (OPA); and
providing for the registration of significant life events (i.e. births, deaths, marriages, adoptions, relationships, donor register), protecting personal identity information held on public records and providing access and issuing information from these records in appropriate circumstances.
Quantity Community education/training programs, services and events delivered by VEOHRC
number 80-100 90 80 517
The higher 2011-12 Target reflects anticipated demand for services based on 2010-11 levels.The 2010-11 Expected Outcome is higher than the 2010-11 Target due to high demand for sessions.
Enquiries made by the community to VEOHRC for information and advice
number 6 000-6 500
nm nm nm
The new 2011-12 performance measure reports anticipated community demand for information by phone and email through VEOHRC’s advice and information service.
Public Advocate protective interventions for people with a disability
number 2 510 2 510 2 510 2 486
Quality Births, Deaths and Marriages registration transaction error rate
per cent <1.0 0.5 <1.0 0.4
Customer satisfaction rating: Community education/training programs, services and events delivered by VEOHRC
per cent 85.0 85.0 85.0 90.0
Service Delivery 2011-12 Justice 303

Major Outputs/DeliverablesPerformance Measures
Unit of Measure
2011-12 Target
2010-11 Expected Outcome
2010-11 Target
2009-10 Actual
Timeliness Timely provision of Births, Deaths and Marriages certificates
per cent 90.0 93.5 90.0 94.0
VEOHRC Complaints finalised within agreed timeframe
per cent 85.0 85.0 85.0 90.0
Cost Total output cost $ million 36.6 37.0 36.9 32.6
Privacy RegulationThe Information Privacy Act 2000 regulates the collection and handling of personal information by the Victorian public sector and local government. The Office of the Victorian Privacy Commissioner receives and deals with complaints of alleged breaches of privacy and promotes privacy protection through advocacy, education and training, audit and investigation of breaches of the Act.
Quantity Compliance activities conducted number 2 700 2 670 2 670 2 756
Privacy Awareness activities conducted number 253 253 253 205Quality
Client satisfaction with services provided
level high high high high
Timeliness Statutory or agreed timelines met per cent 90.0 90.0 90.0 90.0
Cost Total output cost $ million 2.6 2.6 2.5 2.3
304 Justice Service Delivery 2011-12

Major Outputs/DeliverablesPerformance Measures
Unit of Measure
2011-12 Target
2010-11 Expected Outcome
2010-11 Target
2009-10 Actual
Supporting the Judicial ProcessThis output supports the judicial process and access to justice by:
providing appropriate, proportionate and directed legal aid services to individuals and families in genuine need;
tailoring legal aid services, processes and pathways that are inclusive, accessible and equitable;
providing independent, expert and credible forensic medical and scientific services;
providing medico-legal support to the justice system by the Victorian Institute of Forensic Medicine (VIFM); and
providing referral to appropriate support agencies for victims of crime, administering a Victims Counselling Scheme and funding community programs to establish victim support networks.
Quantity Clinical forensic medical services number 2 100-
2 500nm nm nm
The new 2011-12 performance measure better reflects the range of services delivered by VIFM.
Duty lawyer services number 80 000 79 500 75 000 70 830The 2011-12 Target is higher than the 2010-11 Target due to continued higher demand.
The 2010-11 Expected Outcome is higher than the 2010-11 Target due to increased demand resulting from changes to the Family Violence Protection Act 2008 and an increase in infringement matters.
Grants of assistance number 45 000 43 000 43 000 36 963
Legal advice to clients number 135 000 134 800 147 000 95 858The lower 2011-12 Target reflects the expectation that 2010-11 service delivery levels will continue. The 2010-11 Expected Outcome is lower than the 2010-11 Target due to an increase in the number of complex client inquiries resulting in an increase in time being spent with individual clients.
Medico-legal death investigations number 4 300-4 600
4 400 4 992 4 550
Results for this performance measure are dependent on coronial requests for medico-legal investigations. Consequently the target for 2011-12 is a range, based on historic service delivery levels, and anticipated impacts of the new Coroners Act 2008. The Act has removed some categories of reportable death and changed others resulting in the reduction in requests.
The 2010-11 Expected Outcome is lower than the 2010-11 Target due to the impact of the new Coroners Act 2008, which reduced requests for investigations.
Number of victims receiving a service number 8 500 9 000 7 500 9 662The 2010-11 Expected Outcome is higher than the 2010-11 Target due to an increase in the number of referrals from Victoria Police and Support Link (a new electronic referral system to assist victims of crime). The 2011-12 Target is higher to reflect the increase in demand accordingly.
Provision of expert forensic medical and scientific evidence in court
number >200 nm nm nm
The new 2011-12 performance measure better reflects the range of services delivered by VIFM.
Service Delivery 2011-12 Justice 305

Major Outputs/DeliverablesPerformance Measures
Unit of Measure
2011-12 Target
2010-11 Expected Outcome
2010-11 Target
2009-10 Actual
Quality Victorian Institute of Forensic Medicine quality audit
per cent 95.0 95.0 95.0 96.0
Timeliness Applications for legal aid processed within 15 days
per cent 95.0 95.0 95.0 96.0
Medical and scientific investigations on the body of the deceased completed within two days
per cent 75.0-85.0 80.0 65.0 76.0
The 2011-12 Target range reflects a continuation of improved performance levels due to procedural changes introduced following the new Coroners Act 2008.
The 2010-11 Expected Outcome is higher than the 2010-11 Target due to procedural changes introduced following the new Coroners Act 2008 which have resulted in significantly improved performance.
Medico-legal death investigation reports issued within agreed period
per cent 65.0-70.0 61.0 70.0 54.0
The 2010-11 Expected Outcome is lower than the 2010-11 Target due to increased case complexity, resulting in longer turn around time for the provision of forensic pathology reports.
Cost Total output cost $ million 172.2 154.8 150.6 145.7
The 2010-11 Budget included an incremental movement in state Victoria Legal Aid funding for 2011-12.
State Electoral Roll and ElectionsThe Victorian Electoral Commission (VEC) maintains a high quality electoral system that supports democracy in Victoria through:
an accurate and secure electoral roll;
encouraging greater participation by education, awareness, and ease of access;
the provision of electoral services to ensure fair and equitable representation; and
the conduct of fair and impartial elections.
Quantity State elections, municipal and statutory elections, by-elections and polls
number 48 126 122 nm
The 2011-12 Target is lower than the 2010-11 Target because the 2010-11 Target reflected the November 2010 Victorian State Election.
Quality Challenges to VEC conduct upheld in Court
number 0 0 0 0
Timeliness Elector enrolment changes and new enrolments processed within set timeframes
per cent 98.0 100.0 98.0 100.0
306 Justice Service Delivery 2011-12
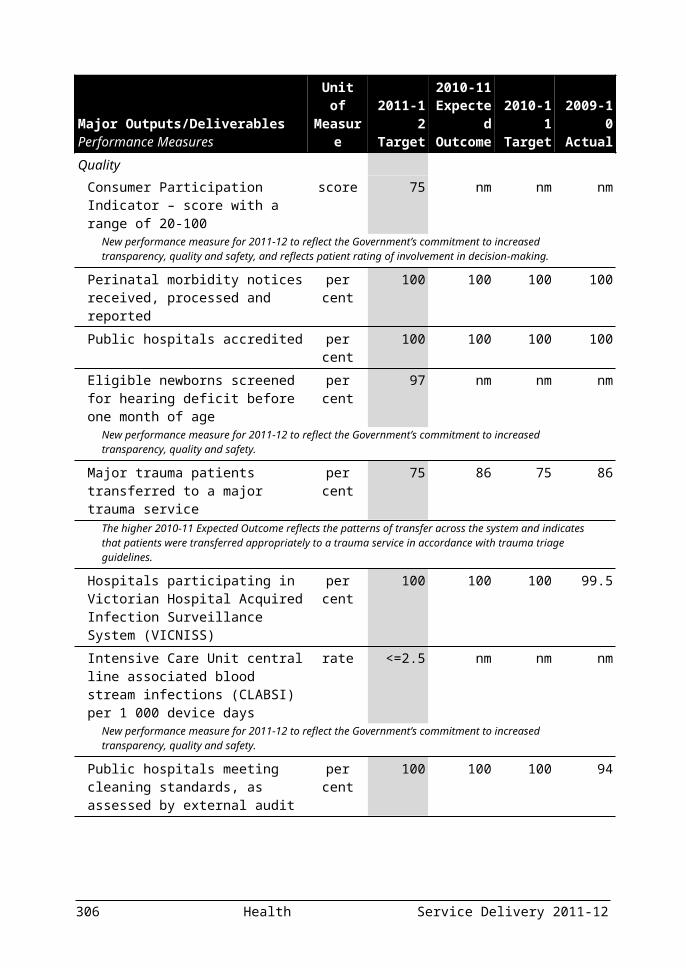
Major Outputs/DeliverablesPerformance Measures
Unit of Measure
2011-12 Target
2010-11 Expected Outcome
2010-11 Target
2009-10 Actual
Cost Total output cost $ million 35.4 55.4 54.7 20.9
The 2010-11 Target included one off funding for the 2010 State Election held in November 2010. The 2011-12 Target has been adjusted accordingly.
Source: Department of Justice
Service Delivery 2011-12 Justice 307

Dispensing JusticeThese outputs involve supporting the State’s judiciary in its dispensation of criminal and civil matters, maintaining the administrative operations of the system of courts and statutory tribunals, and providing appropriate civil dispute resolution mechanisms. These outputs also incorporate the management of criminal prosecutions on behalf of the State.
Through these outputs, the Department aims to:
reduce crime through early intervention;
build the capacity of law enforcement agencies;
divert and rehabilitate offenders;
ensure a more flexible and efficient justice system;
protect the vulnerable;
resolve disputes appropriately; and
engage and consult with the community.
This output group will contribute to the Department’s objective of managing the Justice Service portfolio.
Major Outputs/DeliverablesPerformance Measures
Unit of Measure
2011-12 Target
2010-11 Expected Outcome
2010-11 Target
2009-10 Actual
Court Matters and Dispute ResolutionThis includes services provided by the Supreme Court, County Court, Magistrates’ Court of Victoria, Children’s Court of Victoria, Coroner’s Court, Victorian Civil and Administrative Tribunal, and the Dispute Settlement Centre of Victoria.
Quantity Criminal and non-criminal matters disposed
number 384 000 384 000 389 500 395 892
The lower 2011-12 Target reflects the anticipated complexity of cases to be heard during the reporting period, based on trends in prior years.
Quality Quality of court registry services per cent 85.0 85.0 85.0 98.4
Timeliness Criminal and non-criminal matters disposed within agreed timeframes
per cent 80.0 80.0 80.0 76.0
Cost Total output cost $ million 417.9 415.9 407.7 378.8
308 Justice Service Delivery 2011-12

Major Outputs/DeliverablesPerformance Measures
Unit of Measure
2011-12 Target
2010-11 Expected Outcome
2010-11 Target
2009-10 Actual
Public ProsecutionsThe Office of Public Prosecutions (OPP) strives to provide a high quality, independent prosecution service on behalf of the Director of Public Prosecutions (DPP) in the High Court, Supreme Court, County Court and Magistrates’ Court. The DPP and the OPP have a responsibility to conduct prosecutions in an effective, economic and efficient manner.
Matters prosecuted involve serious crimes, including homicides, major sex offence cases, major drug cases, or matters that are of significance to the fair and effective operation of the Victorian criminal justice system such as corruption cases involving police or lawyers. Matters are prosecuted in Melbourne and regional courts.
To ensure that appropriate consideration is given to the concerns of witnesses and victims of crime, the OPP also provides professional support to prosecution witnesses and victims of crime involved in cases handled by the OPP.
Quantity Judicial Officer sitting days requiring prosecutors
number 9 500-10 500
10 100 10 750 9 960
The level of services delivered reported in these performance measures are linked to court listing practices and the nature and complexity of the cases being heard. Consequently, it is difficult to accurately predict a precise level of activity. Accordingly the 2011-12 Target designates a service delivery range based on historic performance for these measures.The 2010-11 Expected Outcome is lower than the 2010-11 Target due to the nature and complexity of cases being heard, and court listing practices.
Number of briefs prepared and hearings attended
number 68 500-73 500
72 000 72 500 69 465
The 2011-12 Target designates a service delivery range based on historic performance for these measures. Service delivery is linked to court listing practices and the nature and complexity of the cases being heard.
Number of victim and witness consultations
number 5 750-6 500
6 250 6 500 6 166
The 2011-12 Target reflects a service delivery range based on historic performance for this measure.
Quality Guilty outcomes (guilty pleas and trial convictions) as a percentage of case completions
per cent 85.0 87.5 85.0 85.3
Timeliness Proportion of trials listed which did not proceed to adjournment on application of the Crown
per cent 99.0 99.0 99.0 98.4
Cost Total output cost $ million 67.8 61.6 62.5 55.3
The increase in the 2011-12 Target includes a carryover of funds for the Office of Public Prosecutions.
Source: Department of Justice
Service Delivery 2011-12 Justice 309

Community OperationsThese outputs include the fair and effective enforcement of judicial fines, court orders and warrants, and processing of traffic infringement notices.
These outputs include implementation of crime prevention strategies to reduce the propensity to offend such as the Working with Children Check Scheme and the Aboriginal Justice Agreement.
This output group will contribute to the Department’s objective to provide excellence in service delivery.
Major Outputs/DeliverablesPerformance Measures
Unit of Measure
2011-12 Target
2010-11 Expected Outcome
2010-11 Target
2009-10 Actual
Infringement and Orders ManagementEnforcement and management of infringements and orders through:
administering the processing of traffic infringement notices, penalty payments and referral for enforcement action where required;
coordinating confiscations, and the management or conversion of assets obtained through criminal activity; and
supporting enforcement action by the Office of the Sheriff to ensure judicial fines, court orders and warrants are discharged, and delivering fines enforcement services to other state and local government agencies.
These activities serve as an administrative method for dealing with minor criminal offences, where a person alleged to have committed an offence has the option of paying a fixed penalty rather than going to court. The fixed penalty is intended to serve as a deterrent.
Quantity Infringement notices processed number
(million)2.80-3.00 2.90 2.70-
2.902.72
Warrants actioned number 800 000 800 000 770 000 780 770Quality
Prosecutable images per cent 88.0 88.0 88.0 92.0
Timeliness Assets converted within 90 day conversion cycle
per cent 85.0 90.0 80.0 92.0
The 2010-11 Expected Outcome is higher than the 2010-11 Target due to revised contractual arrangements with auction houses. The revised arrangements have significantly reduced the turnaround times for confiscated assets that are presented for disposal.
Clearance of infringements within 180 days
per cent 75.0 75.0 75.0 79.0
Cost Total output cost $ million 230.1 216.5 226.9 171.1
The increase in the 2011-12 Target includes a carryover of funds for Infringements Management initiatives.
310 Justice Service Delivery 2011-12

Major Outputs/DeliverablesPerformance Measures
Unit of Measure
2011-12 Target
2010-11 Expected Outcome
2010-11 Target
2009-10 Actual
Community Safety and Crime PreventionEnsures community safety and crime prevention through:
administering of the Working with Children Act 2005; and
contributing to the implementation of crime prevention initiatives with particular focus on addressing the over representation of the Koori population in the criminal justice system.
The Working with Children checks are intended to reduce the incidence of sexual and physical offences against children by preventing people assessed as not suitable, due to prescribed offences or findings, from working with children thereby enhancing community safety.
By addressing the underlying issues of disadvantage, the intention is to reduce the over representation of the Koori population in the criminal justice system.
Quantity Crime prevention initiatives established to support the Koori community
number 35 36 35 38
Number of Working with Children Checks processed
number(`000)
120-170 132 120-170 152
Quality Issuing of Working with Children Check assessments in accordance with the Working with Children Act 2005
per cent 100.0 100.0 100.0 100.0
Cost Total output cost $ million 46.0 36.9 37.9 30.8
The 2011-12 Budget includes additional funding for the Community Crime Prevention Program – Community Safety Fund and Public Infrastructure Safety Fund and Graffiti initiatives.
Source: Department of Justice
Service Delivery 2011-12 Justice 311

Supporting the State’s Fire and Emergency ServicesThis output supports emergency prevention and response services provided by the Metropolitan Fire and Emergency Services Board, Country Fire Authority and Victoria State Emergency Service, to reduce death and injury rates and to improve emergency response times. Key strategic priorities involve emergency services working together in a coordinated manner, developing common arrangements that apply to a range of hazards facing the community, focusing on prevention and minimising the risk of emergencies and ensuring emergency services work in active partnership with the community.
This output will contribute to the Department’s objective to lead whole of government emergency management.
312 Justice Service Delivery 2011-12

Major Outputs/DeliverablesPerformance Measures
Unit of Measure
2011-12 Target
2010-11 Expected Outcome
2010-11 Target
2009-10 Actual
Emergency Management CapabilityDelivering emergency management through:
provision of fire suppression, emergency prevention and response services in the metropolitan fire district and in rural and regional Victoria including outer metropolitan Melbourne;
management of major natural disasters, provision of road crash rescue and support of local government and communities in disaster prevention and mitigation; and
monitoring performance standards for fire and emergency services and provision of high level emergency management advice.
Key components of this output reduce the level of risk to the community of emergencies occurring and the adverse effects of emergency events, such as death and injury rates.
Quantity Number of emergency service delivery points
number 1 400 1 400 1 400 1 400
Quality Advice meets internal benchmarks per cent 95.0 97.0 95.0 95.0
Municipal customer satisfaction per cent 85.0 85.0 85.0 96.0
Structural fire contained to room or object of origin
per cent 70.0 70.0 70.0 73.0
Timeliness Emergency response times meeting benchmarks
per cent 90.0 90.0 90.0 89.0
Cost Total output cost $ million 273.9 270.9 232.6 206.5
The 2011-12 Target reflects additional funding for Bushfire and Emergency Services Response and incremental funding in response to the Victorian Bushfires Royal Commission.
The 2010-11 Expected Outcome includes funding in response to the Victorian Bushfires Royal Commission provided after the 2010-11 Budget and one off funding for the Victorian Flood Response.
The 2009-10 Actual has been updated from the 2009-10 Department of Justice Annual Report publication due to an adjustment made after July 2010.
Source: Department of Justice
Service Delivery 2011-12 Justice 313

Enforcing Correctional OrdersThese outputs ensure that correctional dispositions of the courts, and orders of the Adult Parole Board, are implemented through the management of the State’s system of correctional facilities and programs for the containment and rehabilitation of prisoners as well as the community-based supervision of offenders.
These outputs reflect the Government’s focus on reducing the overall incidence and fear of crime and enhancing the safety of individuals and families.
This output group will contribute to the Department’s objective to manage capacity and demand for correctional services.
Major Outputs/DeliverablesPerformance Measures
Unit of Measure
2011-12 Target
2010-11 Expected Outcome
2010-11 Target
2009-10 Actual
Prisoner Supervision and SupportA key component of this output is to ensure prisoners are safely and securely contained, and to rehabilitate offenders by addressing the underlying causes of offending behaviour. Positive behavioural change contributes to the Government’s focus on reducing the overall incidence of crime and enhances the safety of all Victorians.
Quantity Average daily prison utilisation rate of total prison capacity
per cent 90.0-95.0
92.0 90.0-95.0
92.3
Total annual daily average numbers of prisoners
number 4 550-4 750
4 580 4 470-4 670
4 492
Quality Proportion of benchmark measures in prison services agreement achieved
per cent 90.0 90.0 90.0 91.3
Rate of prisoner participation in education
per cent > 35.0 nm nm nm
The new 2011-12 performance measure is an indicator of government’s objective of providing program interventions to reduce the risk of re-offending. The annual target is the national average for this performance measure as reported in the 2011 Productivity Commission, Report on Government Services.
Rate of return to prison within two years
per cent < 37.0 nm nm nm
The new 2011-12 performance measure reports on the success of interventions aimed at reducing the rate of re-offending and the prospects of successful reintegration into the community. The annual target is the national average for this performance measure as reported in the 2011 Productivity Commission, Report on Government Services.
Cost Total output cost $ million 593.0 543.3 544.7 492.6
The 2011-12 Target includes new and incremental funding for serious sex offender management and funding for additional prison bed capacity.
314 Justice Service Delivery 2011-12

Major Outputs/DeliverablesPerformance Measures
Unit of Measure
2011-12 Target
2010-11 Expected Outcome
2010-11 Target
2009-10 Actual
Community Based Offender SupervisionProvides for supervision in the community of offenders on court orders. Court orders focus on rehabilitation while ensuring offenders make suitable reparation to the community. This is intended to help break the cycle of re-offending, and contributes to the Government’s focus on reducing the overall incidence of crime and enhancing the safety of all Victorians.
Quantity Average daily offenders under community based supervision
number 6 700 6 765 5 810 6 363
The 2010-11 Expected Outcome is higher than the 2010-11 Target due to several factors. Since 2007-08 the number of criminal cases finalised in the Magistrates Court has increased by almost 13 per cent and Community Correctional Services orders have increased accordingly. The rate of successful order completions has also increased (from 62.6 per cent in 2007-08 to 65.4 per cent in 2009-10). The 2011-12 Target is higher to reflect the continuation of the trend outlined above.
Community work hours performed number(`000)
750-850 793 750-850 807.2
Quality Offenders with a supervised order that has been successfully completed
per cent 68.0 nm nm nm
The new 2011-12 performance measure is a disaggregation of the 2010-11 performance measure ‘Community supervision orders successfully completed’. The disaggregation facilitates better transparency and accountability.
Offenders with an unsupervised order that has been successfully completed
per cent 61.0 nm nm nm
The new 2011-12 performance measure is a disaggregation of the 2010-11 performance measure ‘Community supervision orders successfully completed’. The disaggregation facilitates better transparency and accountability.
Rate of return to corrective services within two years of discharge from a community corrections order
per cent < 27.0 nm nm nm
The new 2011-12 performance measures reports on the success of interventions aimed at reducing the rate of re-offending and the prospects of successful reintegration into the community. The annual target is the national average for this performance measure as reported in the 2011 Productivity Commission, Report on Government Services.
Timeliness Offenders with a treatment or personal development program condition who have been appropriately referred to a program within set timelines
per cent 92.0 94.8 92.0 94.0
Cost Total output cost $ million 121.8 97.7 95.1 74.1
The 2011-12 Target includes incremental funding for sentencing reform.
Source: Department of Justice
Service Delivery 2011-12 Justice 315

Protecting ConsumersThis output promotes informed, confident and protected consumers through appropriate regulation and education that promote awareness and compliance with consumer laws, specifically focusing on the needs of vulnerable and disadvantaged consumers, providing flexible dispute resolution, and fostering business and industry growth.
This output involves developing and administering consumer protection legislation, including legislation relating to misleading and deceptive conduct, unconscionable conduct and unfair contract terms. It informs people of their rights and responsibilities in the marketplace, promotes more informed and educated buying decisions, provides assistance to those seeking redress and promotes compliance by business with the law and ensures that laws are appropriately enforced. Business registers and licences are maintained to ensure minimum standards of transparency and competence and, where necessary, to influence and regulate trading behaviour.
This output will contribute to the Department’s objective to provide excellence in service delivery, and to ensure responsible regulation.
Major Outputs/DeliverablesPerformance Measures
Unit of Measure
2011-12 Target
2010-11 Expected Outcome
2010-11 Target
2009-10 Actual
Promoting and Protecting Consumer InterestsThis output provides information and education to consumers and traders, dispute resolution services, and monitors and takes action to promote and enforce compliance with the law. Increased awareness of consumer and business rights and obligations fosters a marketplace where consumers are more likely to make decisions that promote their interests.
The management of registers or licences for certain occupations or industries, business names, and community organisations is also reported in this output. Product safety services directly contribute to promoting and protecting consumer interests. Licensing for certain occupations and industries contributes to protecting particularly the vulnerable and disadvantaged consumer by identifying suitably qualified providers in the marketplace.
Quantity Information and advice provided to consumers and traders delivered by Responsible Alcohol Victoria (RAV)
number 68 000 nm nm nm
The new 2011-12 performance measure is a disaggregation of the 2010-11 performance measure ‘Information and advice provided to consumers and traders’. The disaggregation facilitates better transparency and accountability.
Information and advice provided to consumers and traders delivered by Consumer Affairs Victoria (CAV)
number 606 350 nm nm nm
The new 2011-12 performance measure is a disaggregation of the 2010-11 performance measure ‘Information and advice provided to consumers and traders’. The disaggregation facilitates better transparency and accountability.
Inspections, compliance monitoring and enforcement activities delivered by RAV
number 16 000 nm nm nm
The new 2011-12 performance measure is a disaggregation of the 2010-11 performance measure ‘Inspections, compliance monitoring and enforcement activities’. The disaggregation facilitates better transparency and accountability.
316 Justice Service Delivery 2011-12
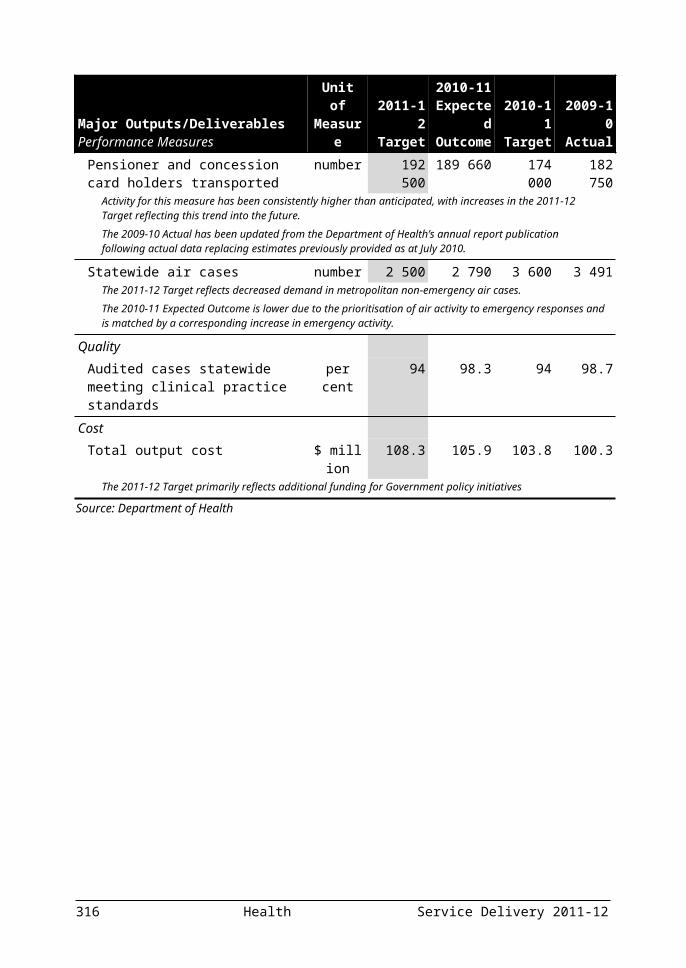
Major Outputs/DeliverablesPerformance Measures
Unit of Measure
2011-12 Target
2010-11 Expected Outcome
2010-11 Target
2009-10 Actual
Inspections, compliance monitoring and enforcement activities delivered by CAV
number 9 075 nm nm nm
The new 2011-12 performance measure is a disaggregation of the 2010-11 performance measure ‘Inspections, compliance monitoring and enforcement activities’. The disaggregation facilitates better transparency and accountability.
Registration and licensing transactions delivered by RAV
number 69 000 nm nm nm
The new 2011-12 performance measure is a disaggregation of the 2010-11 performance measure ‘Registration and licensing transactions’. The disaggregation facilitates better transparency and accountability.
Registration and licensing transactions delivered by CAV
number 600 000 nm nm nm
The new 2011-12 performance measure is a disaggregation of the 2010-11 performance measure ‘Registration and licensing transactions’. The disaggregation facilitates better transparency and accountability.
Quality Customer satisfaction with services provided
per cent 90.0 90.0 90.0 91.0
Timeliness Services provided within agreed timeframes
per cent 90.0 90.0 90.0 95.0
Cost Total output cost $ million 114.2 165.3 159.0 159.9
The reduction in the 2011-12 Target is due to the completion of the housing initiative which provided $200 million over four years through the Victorian Property Fund for additional public housing units.
Source: Department of Justice
Service Delivery 2011-12 Justice 317

Gambling Regulation and Racing Industry DevelopmentThe Victorian community expects a responsible, sustainable and transparent gambling and racing industry. This output provides strategic policy advice to the Minister for Gaming, and leadership on the ongoing enhancement of gambling industry regulation, compliance, and responsible management of problem gambling particularly for the vulnerable and disadvantaged.
The output provides funding support to the racing industry for identified priorities, including racing infrastructure and greater community participation. It also provides strategic advice to the Minister for Racing, on issues of significance to the national racing and wagering industries, industry regulation and compliance.
This output will contribute to the Department’s objective to ensure responsible regulation.
Major Outputs/DeliverablesPerformance Measures
Unit of Measure
2011-12 Target
2010-11 Expected Outcome
2010-11 Target
2009-10 Actual
Gambling Regulation and Racing Industry DevelopmentProvides for monitoring and regulation of gambling activities in Victoria, and leadership and strategic policy advice to the Minister for Gaming and the Minister for Racing on the regulation of the gambling industry, responsible management of problem gambling issues and development support to the racing industry.
Quantity Office of Gaming and Racing briefings processed
number 900 900 900 971
Racing industry development initiatives delivered
number 7 nm nm nm
The new performance measure reports on the Government’s commitment for the delivery of key priorities including Living Legends, Greyhound Adoption Program, Drug Research, Improving Racetracks and Facilities, Breeding and Sales, Jump Racing and Picnic Races.
Racing matters processed (including licences, permits, appeals, registrations and grant applications)
number 225 225 225 183
Regulatory services including licensing and compliance activities
number 29 000 30 000 30 000 26 892
Quality Accuracy of regulatory compliance activities
per cent 100.0 100.0 100.0 100.0
Timeliness Gamblers Help Service clients who receive a service within five days of referral
per cent 90.0 90.0 90.0 96.7
Racing and gaming applications and initiatives completed within elapsed time benchmark
per cent 100.0 100.0 100.0 100.0
318 Justice Service Delivery 2011-12

Major Outputs/DeliverablesPerformance Measures
Unit of Measure
2011-12 Target
2010-11 Expected Outcome
2010-11 Target
2009-10 Actual
Regulatory compliance and licensing activities progressed within set timeframes
per cent 85.0 85.0 85.0 89.0
Cost Total output cost $ million 165.6 119.3 129.6 114.8
The 2011-12 Target reflects funding for Racing Industry Development and to establish the Victorian Responsible Gambling Foundation.
Source: Department of Justice
Service Delivery 2011-12 Justice 319

DEPARTMENT OF PLANNING AND COMMUNITY DEVELOPMENT
Departmental mission statementThe Department of Planning and Community Development’s role is to plan and invest in communities to manage Victoria’s growth and development and to build stronger communities.
Departmental objectivesThe Department has four departmental objectives which link and drive the efforts of the Department’s portfolios and agencies: planning communities for growth and change; investing in communities; growing regional and rural Victoria; and improving organisational performance.
Key strategic priorities for 2011-12The Department’s key strategic priorities for 2011-12 include: implementing planning and regulatory reforms to assist in the
management of population growth and infrastructure planning; developing planning strategies for metropolitan and regional areas
experiencing significant growth and change; driving economic growth in regional and rural Victoria; partnering with business, communities, community and sporting
organisations and councils to improve the way community and sporting facilities and infrastructure are planned and developed;
working with and building the capacity of local governments, community and volunteer organisations in planning, service provision and the recognition and management of cultural heritage; and
delivering whole of government strategies to close the gap between Indigenous and non-Indigenous Victorians and supporting the needs of Victorian veterans.
Ministerial portfoliosThe Department supports five ministers across seven portfolios: Regional and Rural Development; Regional Cities; Planning; Local Government; Aboriginal Affairs; Veterans Affairs; and Sport and Recreation.
320 Planning and Community Development Service Delivery 2011-12

Changes to the output structure The Department has made some changes to its output structure for 2011-12, as shown in the table below:2010-11 Outputs Reason 2011-12 OutputsAdult Community and Further Education
Machinery of government changes
Refer to Department of Education and Early Childhood Development output statements
Women’s PolicyDisabilityYouth Affairs
Machinery of government changes
Refer to Department of Human Services output statements
Seniors and Veterans Machinery of government changes
Veterans(Refer to Department of Health output statements for Seniors output)
All machinery of government changes resulting from the November 2010 election took effect on 1 January 2011.The following table summarises the Department’s total output cost.
Table 3.16: Output summary($ million)
2010-11 Budget (a)
2010-11 Revised
2011-12 Budget
Variation (b)
%Metropolitan and Regional Planning and
Development (c) 209.0 265.2 (d) 314.8 (e) 50.6
Investing in Communities (f) 253.1 282.9 (g) 261.8 3.4Total (h) 462.1 548.1 576.6 24.8Source: Department of Planning and Community Development
(a) The 2010-11 Budget and the 2010-11 Revised Budget reflect the 2011-12 output structure adjusted on a comparative basis for machinery of government changes and other changes which include funding from the Community Support Fund.
(b) Variation between 2010-11 Budget and 2011-12 Budget. (c) The 2011-12 output group name replaces the 2010-11 name ‘Planning
communities for growth and change’ to align with changed departmental corporate responsibilities following the machinery of government changes effective from 1 January 2011.
(d) The increase in the Metropolitan and Regional Planning and Development output price from the 2010-11 Target to the 2010-11 Revised Budget reflects funding received post 2010-11 Budget and announced in the 2010-11 Pre-Election Budget Update.
(e) The increase in the Metropolitan and Regional Planning and Development output price from the 2010-11 Revised Budget to the 2011-12 Budget is largely due to initiatives funded in the 2011-12 Budget.
(f) The 2011-12 output group consolidates the 2010-11 groups ‘Strengthening communities and promoting inclusion’ and ‘Investing in community capacity and infrastructure’ to align with changed departmental corporate objectives following the machinery of government changes effective from 1 January 2011.
Service Delivery 2011-12 Planning and Community Development 321

(g) The increase in the Investing in Communities output price from the 2010-11 Target to the 2010-11 Revised Budget reflects funding received post 2010-11 Budget for flood initiatives and funding announced in the 2010-11 Pre-Election Budget Update.
(h) Total output cost for 2011-12 Budget may not equate to the total expense reported in Budget Paper No. 5, Chapter 3 Departmental financial statements due to additional statements in Budget Paper No. 5 that are not included in departmental output costs. Figures for 2010-11 Budget and 2010-11 Revised have been amended to reflect machinery of government changes and will not equate to total expenses reported in Departmental financial statements.
Amounts availableThe following tables detail the amounts available to the Department from Parliamentary authority and income generated through transactions. Table 3.17 outlines the Department’s income from transactions and Table 3.18 summarises the sources of Parliamentary authority available to the Department to fund the provision of outputs, additions to net asset base and payments made on behalf of the State.
Table 3.17: Income from transactions($ million)
2009-10 2010-11 2010-11 2010-11 2011-12 Actual Budget Adjusted (a) Revised BudgetOutput appropriations 419.4 456.2 422.8 471.0 515.1Special appropriations 97.4 102.6 53.2 59.0 8.5Interest 2.3 2.4 1.4 1.4 8.5Sale of goods and services 2.5 .. .. .. 0.9Grants 60.3 3.8 28.6 65.4 62.2Fair value of assets and services
received free of charge or for nominal consideration
.. .. 218.0 218.0 ..
Other income 1.1 0.5 0.8 0.8 0.3Total income from transactions 582.9 565.5 724.7 815.5 595.4Source: Department of Planning and Community Development and Department of Treasury and Finance
Note:(a) The 2010-11 Adjusted estimates include the 2010-11 Budget adjusted for
machinery of government changes.
Table 3.18: Parliamentary authority for resources($ million)
2010-11 2011 2010-11 2011-12 Budget Adjusted (a) Revised BudgetAnnual appropriations 598.5 565.0 546.5 683.5 Provision of outputs 436.6 403.6 448.7 499.5 Additions to the net asset base 161.1 160.6 96.9 183.1
322 Planning and Community Development Service Delivery 2011-12

Payments made on behalf of the State 0.9 0.9 0.9 0.9Receipts credited to appropriations .. .. 2.1 1.0Unapplied previous years appropriation 24.7 24.2 27.2 23.5 Provision of outputs 19.7 19.2 20.2 15.5 Additions to the net asset base 5.0 5.0 7.0 8.0Accumulated surplus – previously applied
appropriation.. .. 1.4 ..
Gross annual appropriation 623.1 589.2 577.2 708.0Special appropriations 102.6 53.2 59.0 8.5Trust funds 476.3 500.1 436.5 549.4Total parliamentary authority 1 202.1 1 142.5 1 072.6 1 265.9Source: Department of Planning and Community Development and Department of Treasury and Finance
Note:(a) The 2010-11 Adjusted estimates include the 2010-11 Budget adjusted for
machinery of government changes.
The following section provides details of the outputs provided to government, including performance measures and costs for each output. Total expenditure for the Department can be found in Budget Paper No. 5, Chapter 3 Departmental financial statements.
Service Delivery 2011-12 Planning and Community Development 323

Metropolitan and Regional Planning and DevelopmentThis output group aims to address future growth and change and create new prosperity, more opportunity and a better quality of life in metropolitan, regional and rural Victoria by:
strengthening the economic base of regional Victoria to create more jobs and improve career opportunities;
facilitating land supply in growth areas whilst preserving open space and agricultural needs;
providing better infrastructure, facilities and services in regional and rural Victoria;
delivering urban renewal, design and development;
streamlining planning regulation and systems;
administering the planning system and statutory responsibilities of the Minister for Planning;
protecting and managing Victoria’s cultural and natural heritage; and
guiding the development and implementation of regional and metropolitan plans.
Major Outputs/DeliverablesPerformance Measures
Unit of Measure
2011-12 Target
2010-11 Expected Outcome
2010-11 Target
2009-10 Actual
Regional Development and Regional CitiesGuide the development and implementation of regional plans to manage growth and change in regional and rural Victoria. Provide better infrastructure, facilities and services to strengthen the economic base of communities and to create jobs and improve career opportunities for regional Victorians.
This output contributes to the DPCD objectives of growing regional and rural Victoria and planning communities for growth and change.
Quantity Economic development, service delivery and community capacity projects funded
number 140 nm nm nm
This performance measure is proposed to replace the 2010-11 performance measure ‘Number of Regional Events, Economic Development, Investment and Promotion projects supported’ and provides for activity as a result of new budget initiatives. The 2010-11 performance measure has been transferred from the Department of Business and Innovation’s Regional Economic Development, Investment and Promotion output as a result of machinery of government changes.
Energy for the Regions Program: Number of towns included
number 4 nm nm nm
New performance measure for 2011-12 to reflect funding for the new Energy for the Regions Program.
Regional infrastructure projects funded number 100 nm nm nmThis performance measure is proposed to replace the 2010-11 performance measure ‘Regional Infrastructure Development Fund (RIDF) projects funded’. It is also proposed to incorporate the 2010-11 performance measure ‘Small town infrastructure projects funded’ and provides for activity as a result of new budget initiatives. The two 2010-11 performance measures have been transferred from the Department of Business and Innovation’s Regional Infrastructure Development output as a result of machinery of government changes.
324 Planning and Community Development Service Delivery 2011-12

Major Outputs/DeliverablesPerformance Measures
Unit of Measure
2011-12 Target
2010-11 Expected Outcome
2010-11 Target
2009-10 Actual
Rural councils participating in Rural Councils Victoria (RCV) network
number 38 38 38 nm
This performance measure has been transferred from the Department of Business and Innovation’s Regional Economic Development, Investment and Promotion output as a result of machinery of government changes.
Quality Participant satisfaction with implementation of Regional Development Victoria (RDV) programs
per cent 80 80 80 nm
This performance measure has been transferred from the Department of Business and Innovation’s Regional Economic Development, Investment and Promotion output as a result of machinery of government changes.
Putting Locals First Fund projects recommended by Regional Development Committees approved for funding
per cent 85 nm nm nm
New performance measure for 2011-12 to reflect funding for the new Putting Locals First Fund.
Regional councils participating at the regional expo
per cent 80 nm nm nm
New performance measure for 2011-12 to reflect funding for the new regional expo initiative.
Stakeholder satisfaction with RDV support for Regional Strategic Planning
per cent 75 75 75 nm
This performance measure has been transferred from the Department of Business and Innovation’s Regional Economic Development, Investment and Promotion output as a result of machinery of government changes.
Timeliness Advice provided to government about the bushfire reconstruction and recovery process within agreed timelines
per cent 100 100 100 100
This performance measure has been transferred from the Department of Premier and Cabinet’s Strategic Policy Advice and Projects output as a result of machinery of government changes.
Grants acquitted within the timeframe specified in the terms and conditions of the funding agreement: Local Government Infrastructure Account
per cent 75 nm nm nm
New performance measure for 2011-12 to reflect funding for the new Local Government Infrastructure Account.
Cost Total output cost $ million 180.5 99.9 55.0 na
The 2010-11 Expected Outcome is higher than the 2010-11 Target due to funding received post 2010-11 Budget and announced in the 2010-11 Pre-Election Budget Update.The 2011-12 Target is higher than the 2010-11 Target due to funding provided in the 2011-12 Budget which includes the Regional Growth Fund.
Service Delivery 2011-12 Planning and Community Development 325

Major Outputs/DeliverablesPerformance Measures
Unit of Measure
2011-12 Target
2010-11 Expected Outcome
2010-11 Target
2009-10 Actual
PlanningAddress the future growth and change in metropolitan and regional Victoria through the delivery of urban development, design and renewal; facilitate land supply in growth areas whilst preserving open space and agricultural needs; streamline regulatory and statutory planning; support heritage conservation projects; administer the statutory responsibilities of the Minister for Planning; and provide a fair and transparent planning system.
This output contributes to the DPCD objective of planning communities for growth and change.
Quantity Complete annual Urban Development Program analysis of supply, demand and adequacy of residential and industrial land
number 1 1 1 1
Environmental effects statements, referrals and assessments completed in accordance with Ministerial Guidelines
per cent 100 100 100 nm
Implement a program to develop regional land use plans aligned with the Government’s regional priorities
per cent 100 100 100 nm
Number of local governments undertaking work to support strategic planning for coastal settlements and areas
number 9 nm nm nm
New performance measure for 2011-12 to represent the key strategic work in supporting the coastal climate change agenda.
Places or objects assessed for the Victorian Heritage Register
number 80 80 80 105
Regional Urban Development Program projects completed
number 19 5 5 nm
The 2011-12 Target is greater than the 2010-11 Target as it relates to 19 identified projects, covering the remaining large cities and approximately 161 small towns across regional Victoria.
Research published: Demographic trends and residential land
number 5 5 5 5
This performance measure has been reworded as part of a departmental review to achieve a consistent description of performance measures. It measures the same activity as the 2010-11 performance measure ‘Research bulletins on demographic trends and residential land published’.
Quality Appeals lodged against heritage permits per cent 5 5 5 4
326 Planning and Community Development Service Delivery 2011-12

Major Outputs/DeliverablesPerformance Measures
Unit of Measure
2011-12 Target
2010-11 Expected Outcome
2010-11 Target
2009-10 Actual
Central Activities Areas projects delivered against agreed project implementation plans
per cent 80 80 80 85
This performance measure has been reworded to better align with government policies. It measures the same activity as the 2010-11 performance measure ‘Central Activities District projects delivered against agreed project objectives’.
Changes made to zoned land in metropolitan areas consider housing capacity needs
per cent 100 100 100 85
Critical stakeholders effectively engaged in the metropolitan planning strategy
per cent 100 nm nm nm
New performance measure for 2011-12 to reflect government’s commitment to delivering a new outcomes-based metropolitan planning strategy for Melbourne.
Funding committed to eligible projects: Changing Places Program
per cent 100 100 100 100
This performance measure replaces the 2010-11 measure ‘Creating Better Places and Expert Assistance Program funding committed to eligible projects’ and measures the same activity as the 2010-11 performance measure. The Creating Better Places Program has been renamed the Changing Places Program. The 2011-12 measure splits the Changing Places Program from the Expert Assistance Program to better reflect that these two programs are separate and are not inter-related.
Funding committed to eligible projects: Expert Assistance Program
per cent 100 100 100 100
This performance measure replaces the 2010-11 measure ‘Creating Better Places and Expert Assistance Program funding committed to eligible projects’ and measures the same activity as the 2010-11 performance measure. The Creating Better Places Program has been renamed the Changing Places Program. The 2011-12 measure splits the Changing Places Program from the Expert Assistance Program to better reflect that these two programs are separate and not interrelated.
Funding committed to eligible projects: Heritage Grants
per cent 100 100 100 100
This performance measure replaces the 2010-11 timeliness measure ‘Heritage Grants acquitted within the timeframes specified in the terms and conditions of the funding agreements’. It has been revised as a quality measure to best capture the activity it is measuring and to align with other measures in DPCD’s output statements.
Heritage certificates issued accurately and satisfactorily
per cent 100 100 100 99
Regional stakeholders effectively engaged in informing and shaping contents of regional land use plans
per cent 100 100 100 89
Timeliness Authorisations to prepare planning scheme amendments completed in 7 days
per cent 80 nm nm nm
New performance measure for 2011-12 to replace the 2010-11 measure ‘Authorisations completed in 15 days’. This performance measure reflects the Government’s commitment to reducing delays in the planning system.
Owners notified of accepted nominations to the Victorian Heritage Register within 14 days
per cent 100 100 100 99
Service Delivery 2011-12 Planning and Community Development 327
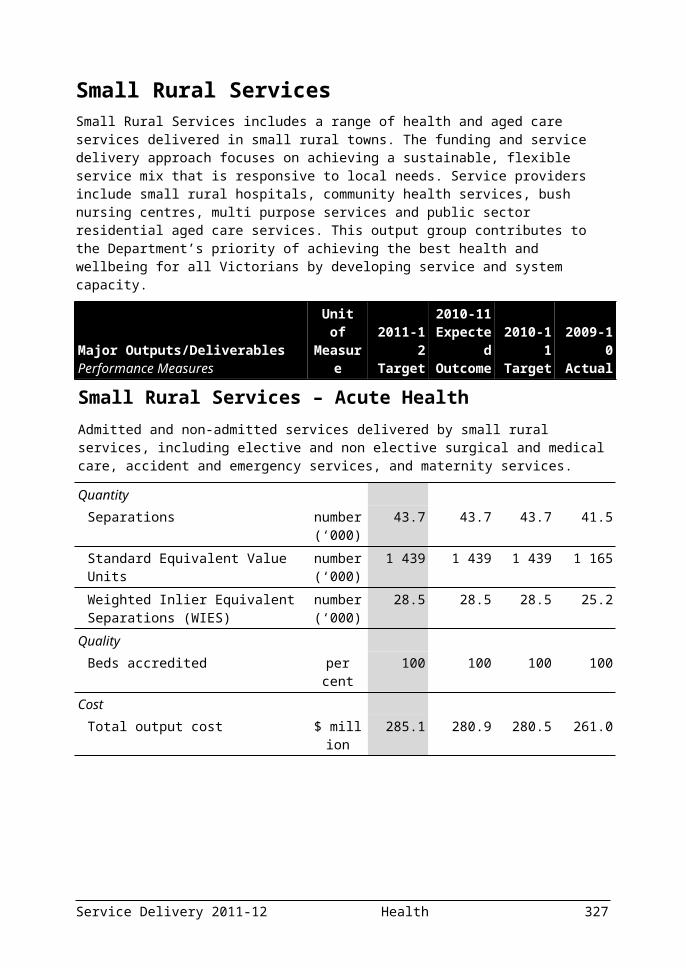
Major Outputs/DeliverablesPerformance Measures
Unit of Measure
2011-12 Target
2010-11 Expected Outcome
2010-11 Target
2009-10 Actual
Planning scheme amendments completed in 30 days
per cent 80 80 80 81
This performance measure replaces the 2010-11 measure ‘Amendments completed in 30 days’. It has been changed to provide greater clarity.
Report annually on housing development activity across metropolitan Melbourne to inform planning strategies
date Jun2012
Jun2011
Jun2011
nm
Bushfire Response Unit completes objectives by January 2012
per cent 100 nm nm nm
New performance measure for 2011-12 to reflect Government’s commitment to providing expert, timely advice to people affected by the 2009 Bushfires.
State population projections reviewed and updated
date Mar2012
Mar2011
Feb2011
Qtr 3
The change to the 2011-12 Target reflects the date of completion of the updated projections, as opposed to the commencement of the review process.The 2010-11 Expected Outcome has been revised from the 2010-11 Target as it reflects the date of completion of the updated projections, as opposed to the commencement of the review process.
Strategic integrated transport and land use planning input to the development of new growth areas is provided within agreed timelines
per cent 100 100 100 100
This performance measure has been transferred from the Department of Transport’s ‘Integrated and Sustainable Transport Development’ output as a result of machinery of government changes. It has been amended to better reflect Government’s commitment to integrated transport and land use planning.
Cost Total output cost $ million 134.3 165.3 154.0 126.7
The 2010-11 Target has been adjusted to reflect machinery of government change. The 2010-11 Expected Outcome is higher than the 2010-11 Target due to funding received post 2010-11 Budget and announced in the 2010-11 Pre-Election Budget Update.The 2011-12 Target is lower than the 2010-11 Target as previous budgets did not allocate funding for some Central Activity Areas programs beyond 30 June 2011.
Source: Department of Planning and Community Development
328 Planning and Community Development Service Delivery 2011-12

Investing in CommunitiesThis output group aims to: strengthen the capacity of communities through investment in
communities and community organisations; support and strengthen the sustainability of Victoria’s community
and not-for-profit community organisations; work in partnership with the local government sector to encourage
and support best practice and continuous development in local governance;
conduct compliance audits and make recommendations for improvement to ensure the local government sector meets the highest standards of accountability and transparency in governance and administration;
lead and coordinate delivery of whole of government policy for Indigenous populations and veterans in Victoria; and
provide funding and coordination to develop and extend sport and recreation opportunities in Victoria.
Service Delivery 2011-12 Planning and Community Development 329

Major Outputs/DeliverablesPerformance Measures
Unit of Measure
2011-12 Target
2010-11 Expected Outcome
2010-11 Target
2009-10 Actual
Community DevelopmentImplement Community Development strategies and strengthen community sector organisations to increase participation and to achieve stronger communities.
This output contributes to the DPCD objectives of investing in communities and growing regional and rural Victoria.
Quality Capacity building programs delivered against agreed program objectives: Community Foundations
per cent 100 100 100 100
This performance measure has been reworded as part of a departmental review to achieve a consistent description of similarly worded performance measures. It measures the same activity as the 2010-11 performance measure ‘Community foundation boards or advisory committees have completed financial and/or governance training.’
Community Support Projects funded through the Community Support and Recreational Sport Package meet agreed project objectives
per cent 90 nm nm nm
New performance measure for 2011-12 to replace the 2010-11 measure ‘Projects funded through the Victorian Community Support Grants Program for the purpose of planning, community strengthening and infrastructure’.
Coordination and implementation of actions within agreed performance targets: Transport Connections Initiatives
per cent 100 nm nm nm
New performance measure for 2011-12 to reflect the continued management of the Transport Connections Initiatives.
Grant projects completed meet agreed project objectives
per cent 90 90 90 100
This performance measure has been reworded as part of a departmental review to achieve a consistent description of similarly worded performance measures. It measures the same activity as the 2010-11 performance measure ‘Grant projects which are completed and have successfully met their objectives’.
Strategy implementation actions within agreed performance targets: Community Organisations
per cent 100 100 100 100
This performance measure has been reworded as part of a departmental review to achieve a consistent description of similarly worded performance measures. It measures the same activity as the 2010-11 performance measure ‘Progress on implementation of actions in Strengthening Community Organisations Action Plan complies with agreed performance targets in the Action Plan’.
Strategy implementation actions within agreed performance targets: Volunteering
per cent 100 100 100 100
This performance measure has been reworded as part of a departmental review to achieve a consistent description of similarly worded performance measures. It measures the same activity as the 2010-11 performance measure ‘Progress on implementation of actions in the volunteering strategy complies with agreed performance targets’.
330 Planning and Community Development Service Delivery 2011-12
Major Outputs/DeliverablesPerformance Measures
Unit of Measure
2011-12 Target
2010-11 Expected Outcome
2010-11 Target
2009-10 Actual
Timeliness Grant payments made against completion of milestones in funding agreement
per cent 100 100 100 100
This performance measure has been reworded as part of a departmental review to achieve a consistent description of similarly worded performance measures. It measures the same activity as the 2010-11 performance measure ‘Grant payments paid against completion of funding agreement milestones’.
Grants acquitted within the timeframe specified in the terms and conditions of the funding agreement
per cent >90 >90 >90 90.4
Cost Total output cost $ million 55.6 68.4 62.8 69.5
The 2010-11 Target has been adjusted to reflect machinery of government changes and other changes which include funding from the Community Support Fund.The 2010-11 Expected Outcome is higher than the 2010-11 Target due to funding announced post 2010-11 Budget for minor election commitments.The 2011-12 Target is lower than the 2010-11 Target due to the expiration of some initiatives.
Indigenous Community and Cultural DevelopmentWork in partnership with Victorian Indigenous communities and their organisations to protect and manage Aboriginal cultural heritage, strengthen governance and leadership, and establish new community engagement and capacity development initiatives to improve the long term social and economic outcomes for Indigenous Victorians.
This output contributes to the DPCD objective of investing in communities and growing regional and rural Victoria.
Quantity Awards Conducted: Victorian Indigenous Honour Roll
number 1 nm nm nm
New performance measure for 2011-12 to reflect Government priority to establish the Victorian Indigenous Honour Roll.
Capacity building activities undertaken with community groups: cultural heritage management
number 16 16 16 16
This performance measure has been reworded as part of a departmental review to achieve a consistent description of similarly worded performance measures. It measures the same activity as the 2010-11 performance measure ‘Cultural heritage management capacity building activities undertaken with community groups’.
Governance training programs implemented
number 7 7 7 7
Increase in client service contacts for members of the Stolen Generations with Connecting Home Limited
per cent 5 5 5 nm
Service Delivery 2011-12 Planning and Community Development 331

Major Outputs/DeliverablesPerformance Measures
Unit of Measure
2011-12 Target
2010-11 Expected Outcome
2010-11 Target
2009-10 Actual
Number of trained mentor bank participants available to support Aboriginal people
number 75 nm nm nm
New performance measure for 2011-12 to reflect funding provided as part of the Victorian Aboriginal Economic Development Agenda announced in May 2010.
Participants who complete governance training
number 120 120 120 126
Quality Governance training initiatives participant completion rate
per cent 80 80 80 88.3
Local Indigenous representation groups completed stage two of community plans
per cent 100 nm nm nm
This performance measure replaces the 2010-11 performance measure ‘Local Indigenous representation groups completed stage one of community plans’. It has been amended to reflect progress in the program to stage two community planning.
Timeliness Assessments completed by Aboriginal Affairs Victoria (AAV) within legislative timeframe: cultural heritage management plans
per cent 100 100 100 100
This performance measure has been reworded as part of a departmental review to achieve a consistent description of similarly worded performance measures. It measures the same activity as the 2010-11 performance measure ‘Cultural heritage management plans assessed by AAV within legislative timeframes’.
High priority infrastructure projects completed within stipulated timeframes
per cent 100 nm nm nm
New performance measure for 2011-12 to reflect the funding provided in the 2010-11 Budget for rebuilding Victoria’s Indigenous service delivery infrastructure.
Payments made against completion of milestones in funding agreement: Reconciliation Victoria
per cent 100 nm nm nm
New performance measure for 2011-12 to reflect the government priority to provide funding to Reconciliation Victoria.
Cost Total output cost $ million 25.1 22.6 22.1 19.9
The 2010-11 Target has been adjusted to reflect machinery of government changes and other changes which include funding from the Community Support Fund.The 2010-11 Expected Outcome is higher than the 2010-11 Target due to additional funding for Indigenous initiatives.
332 Planning and Community Development Service Delivery 2011-12
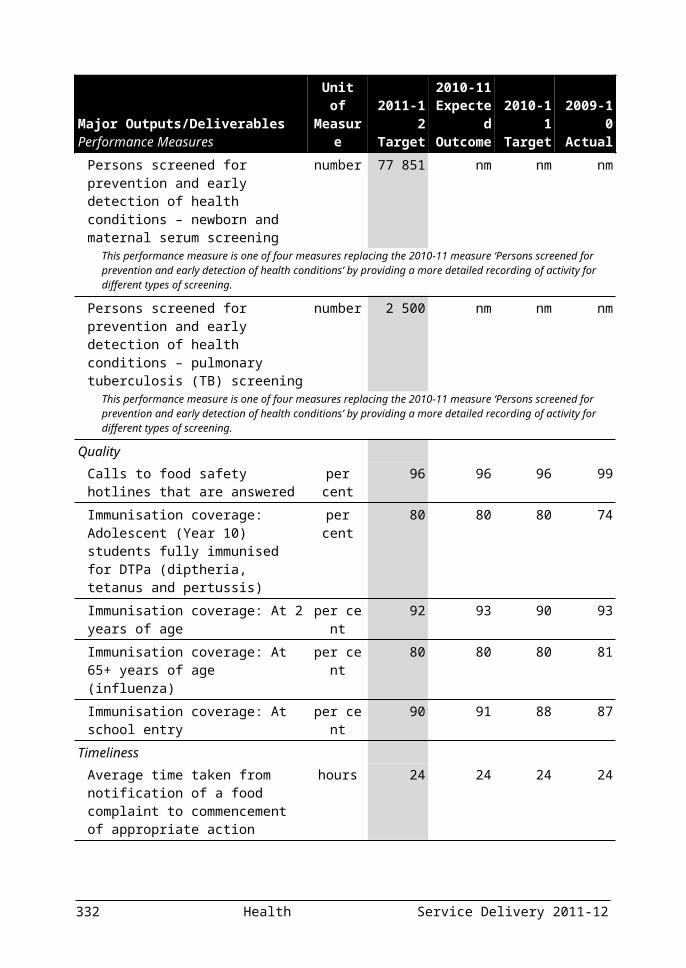
Major Outputs/DeliverablesPerformance Measures
Unit of Measure
2011-12 Target
2010-11 Expected Outcome
2010-11 Target
2009-10 Actual
Veterans AffairsCoordinate veteran-related issues at a state level. Strengthen commemoration and promotion of community understanding of services for veterans, especially among younger people.
This output contributes to the DPCD objective of investing in communities.
Quantity Digitised veterans’ histories completed number 60 60 60 60
Entries received: Premier’s Spirit of ANZAC prize
number >170 174 150 144
This performance measure has been reworded as part of a departmental review to achieve a consistent description of similarly worded performance measures. It measures the same activity as the 2010-11 performance measure ‘Premier’s Spirit of ANZAC Prize: number of entries received’.The 2010-11 Expected Outcome and 2011-12 Target are higher than the 2010-11 Target due to the implementation of a strategy to attract more entries through more proactive marketing.
Event attendance: Student participation in Shrine of Remembrance programs
number >40 000 nm nm nm
New performance measure for 2011-12 to reflect the government’s priorities regarding school-based programs for the Shrine of Remembrance.
Restoring community war memorial grants: projects approved
number >40 50 35 45
The 2011-12 Target reflects a higher number of smaller value grants than anticipated in 2010-11 and an expectation that this will continue in 2011-12.
Quality Commemorative and educative projects meet agreed project objectives
per cent 100 100 100 100
Timeliness Commemorative and Education program: Grants acquitted within the timeframe specified in the terms and conditions of the funding agreement
per cent 100 100 100 100
Cost Total output cost $ million 3.3 4.4 3.2 na
The 2010-11 Target has been adjusted to reflect machinery of government changes.The 2010-11 Expected Outcome is higher than the 2010-11 Target due to one off funding for additional grants (Seymour Vietnam Veterans Walk). As this expenditure is expected to occur by 30 June 2011, the 2011-12 Target is lower than the 2010-11 Expected Outcome.
Service Delivery 2011-12 Planning and Community Development 333

Major Outputs/DeliverablesPerformance Measures
Unit of Measure
2011-12 Target
2010-11 Expected Outcome
2010-11 Target
2009-10 Actual
Local Government Local Government Victoria
Local Government Victoria (LGV) works in partnership with the local government sector to encourage and support best practice and continuous development in local governance; administer programs that assist in delivering public library services; and support the Victoria Grants Commission to achieve more accountable government, sustainable service delivery and asset management policies and practices; and stronger democracy.
Local Government Investigations and Compliance Inspectorate
The Local Government Investigations and Compliance Inspectorate (LGI) conducts compliance audits and makes recommendations for improvement to ensure the local government sector meets the highest standards of accountability and transparency in governance and administration.
The Local Government output contributes to the DPCD objectives of planning communities for growth and change and growing regional and rural Victoria.
Quantity Audits undertaken as part of the Local Government Investigations and Compliance Inspectorate planned audit program
number 27 27 27 nm
Grants provided to improve public library services
number 10 15 8 19
This performance measure has been reworded as part of a departmental review to achieve a consistent description of similarly worded performance measures. It measures the same activity as the 2010-11 measure ‘LGV’s Living Libraries Grants provided to improve public library services’.
The higher 2011-12 Target reflects renewed funding.The 2010-11 Expected Outcome is higher than the Target as a result of greater collaboration between Local Government Victoria and Library Services which allowed for the funding of more projects than previously anticipated. This was also attributed to a decrease in the average amount of funding requested per project.
LGI newsletters provided to local government sector
number 4 4 4 nm
LGI recommendations accepted by local council
per cent 95 95 90 nm
The higher 2011-12 Target reflects the Expected Outcome in 2010-11.The 2010-11 Expected Outcome is higher than the 2010-11 Target due to a high level of willingness by local councils to accept recommendations to achieve compliance requirements.
Meetings held with Ministerial Mayors Advisory Panel
number 3 nm nm nm
New performance measure for 2011-12 to reflect Government’s commitment to engage with local government.
Street lights upgraded in accordance with established target
per cent 95 nm nm nm
New performance measure for 2011-12 to reflect Government’s commitment to supporting local government to reduce its carbon footprint.
334 Planning and Community Development Service Delivery 2011-12

Major Outputs/DeliverablesPerformance Measures
Unit of Measure
2011-12 Target
2010-11 Expected Outcome
2010-11 Target
2009-10 Actual
Quality LGV’s legislative and regulatory change considers stakeholder feedback and consultation with local government
per cent 100 100 100 nm
LGV’s policy and program development considers stakeholder feedback and consultation with local government
per cent 100 100 100 nm
Timeliness Complaints received by the LGI assessed and actioned within five working days of receipt
percent 100 100 100 nm
Victoria Grants Commission allocations determined and consultation program completed within agreed timeframes
per cent 100 100 100 100
Cost Total output cost $ million 58.5 63.6 58.2 45.9
The 2010-11 Target has been adjusted to reflect machinery of government changes and other changes which include funding from the Community Support Fund.
The 2010-11 Expected Outcome is higher than the 2010-11 Target due to one off funding for flood related activities (Local Government Clean Up fund). As this expenditure is expected to occur by 30 June 2011, the 2011-12 Target is lower than the 2010-11 Expected Outcome.
Sport and Recreation Development Provide strategic leadership, funding and support to the sport and recreation industry to improve facilities and increase community participation in sport and active recreation.
This output contributes to the DPCD objective of investing in communities.
Quantity Athletes on Victorian Institute of Sport (VIS) scholarships
number >330 350 >350 353
The 2011-12 Target is lower than the 2010-11 Target as the VIS has advised that to better support key athletes a greater level of funding will be provided to individual scholarship holders, thereby reducing the total number of scholarships.
Combat sports licences, registrations and permits issued
number >500 750 400-500 701
The higher 2010-11 Expected Outcome reflects a continued high rate of growth in the professional boxing and combat sports industry.
Community Facility Grants: number approved
number >160 195 >160 237
Events facilitated: Sport and recreation number >40 12 10-12 13This performance measure replaces the 2010-11 measure ‘Major events facilitated’ as this measure now includes the Significant Sporting Events Program and major events, and the 2011-12 Target reflects this.
Service Delivery 2011-12 Planning and Community Development 335
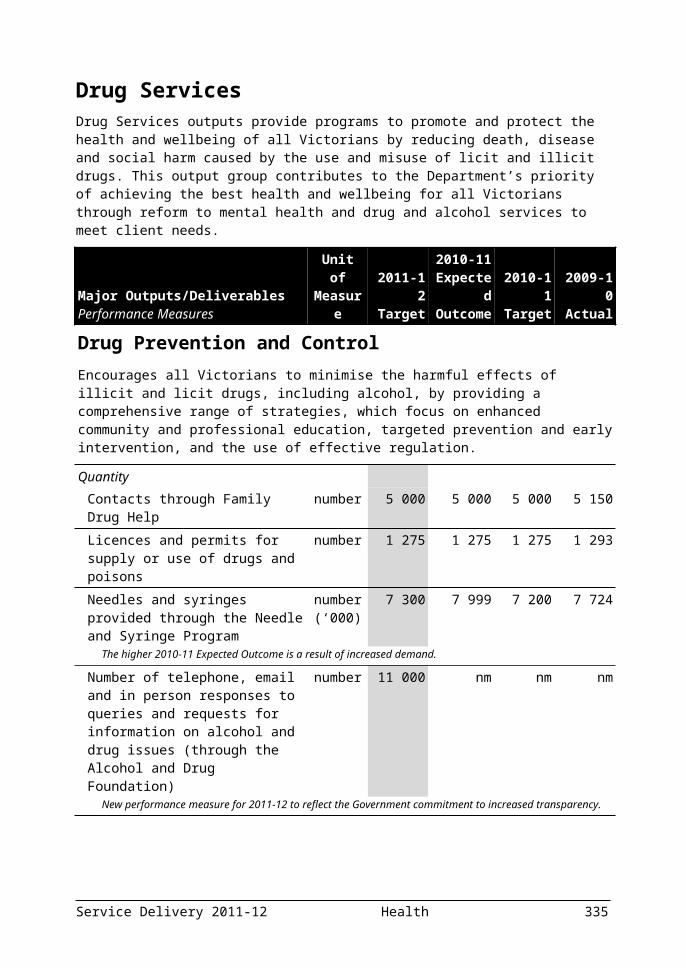
Major Outputs/DeliverablesPerformance Measures
Unit of Measure
2011-12 Target
2010-11 Expected Outcome
2010-11 Target
2009-10 Actual
Projects related to state level facilities in progress
number >8 12 8-12 8
Sport and recreation organisations undertaking programs or activities to enhance community involvement
number >85 91 >85 93
This performance measure has been reworded as part of a departmental review to achieve a consistent description of performance measures. It measures the same activity as the 2010-11 performance measure ‘Key sport and recreation organisations undertaking projects or activities, or providing services or strategic advice’.
Sporting uniform grants: number approved
number >600 nm nm nm
New performance measure for 2011-12 to reflect a key sport and recreation element of the Community Support and Recreational Sports Package.
Victorian Institute of Sport scholarship holders on national teams/squads
per cent >55 64 >55 64
QualityContract management of outdoor recreation camps meets agreed key performance indicators
per cent >90 95 >90 95
This performance measure has been reworded as part of a departmental review to achieve a consistent description of performance measures. It measures the same activity as the 2010-11 performance measure ‘Outdoor recreation camps contract management key performance indicators met’.
Major events facilitated with a business plan, budget, branding and promotional activities
per cent 100 100 100 100
This performance measure is proposed to consolidate the 2010-11 performance measures ‘Completion of an approved business plan and ongoing operational and budget reports for each event’ and ‘Government branding and promotion requirements undertaken at each event’ and measures the same activities as in 2010-11.
Timeliness Awards conducted: Sporting date Aug-Nov
201127 Oct
2010Aug-Nov
201023 Nov
2009This performance measure has been reworded as part of a departmental review to achieve a consistent description of similarly worded performance measures. It measures the same activity as per the 2010-11 performance measure ‘Awards Conducted’
Continuation of works for the State Sports Facilities Project
date Jun 2012 nm nm nm
New performance measure for 2011-12 to reflect funding provided in the 2011-12 Budget to continue works for the State Sports Facilities Project
Completion of post-event reports and economic impact assessments of each event (where required)
per cent 100 100 100 100
This performance measure has been reworded as part of a departmental review to achieve a consistent description of performance measures. It measures the same activity as per the 2010-11 performance measure ‘Completion of appropriate post event reports and formal economic impact assessment (where required) at the completion of each event’.
336 Planning and Community Development Service Delivery 2011-12

Major Outputs/DeliverablesPerformance Measures
Unit of Measure
2011-12 Target
2010-11 Expected Outcome
2010-11 Target
2009-10 Actual
Cost Total output cost $ million 119.3 123.8 106.8 88.6
The 2010-11 Target has been adjusted to reflect machinery of government changes and other changes which include funding from the Community Support Fund.
The 2010-11 Expected Outcome is higher than the 2010-11 Target due to funding announced post 2010-11 Budget for small scale election commitments.
The 2011-12 Target is higher than the 2010-11 Target due to new budget initiatives.
Source: Department of Planning and Community Development
Service Delivery 2011-12 Planning and Community Development 337

DEPARTMENT OF PREMIER AND CABINET
Departmental mission statementThe Department’s of Premier and Cabinet’s mission is to display exemplary leadership and innovation in the development of high quality and timely policy advice and the delivery of services. It achieves this through: advising and supporting the Premier as head of Government and
Cabinet and the Minister for the Arts, the Deputy Premier, and the Minister for Multicultural Affairs and Citizenship;
providing strategic public policy leadership and direction across the public service in Victoria;
developing and monitoring whole of government initiatives; delivering whole of government services and programs in relation to
government information, communications and multicultural affairs and citizenship;
making the arts available and accessible to all Victorians, and supporting and developing Victoria’s artists and creative industries; and
providing independent support and services to ensure public participation and accountability in public sector governance.
Departmental objectivesThe Department will assist the Government to create a stronger, fairer and safer Victoria by providing strategic policy advice and support aimed at: building a stronger Victorian economy with expanded opportunity
and greater certainty; delivering services that work in the areas of transport, community
safety, planning, health, education and community services; fostering strong families and vibrant communities by investing in a
multicultural Victoria, the arts and bushfire response; providing a range of practical measures to deliver environmental
improvements relating to water, energy and resources, agriculture, and the environment; and
building trust in government through high standards of integrity, accountability and transparency.
338 Premier and Cabinet Service Delivery 2011-12

Key strategic priorities for 2011-12To achieve the Department’s medium term objectives the following key strategic priorities for 2011-12 have been identified: establishing the first comprehensive integrity and anti-corruption
commission in Victoria’s history; creating a number of independent offices and panels to ensure both
independent advice to, and the accountability of, government; increasing opportunities in regional Victoria, including greater
access to Government, and an increased focus on regional arts development and access;
supporting the judicial review of the Child Protection system and playing a national leadership role in the establishment of a National Disability Insurance Scheme; and
delivering a new Victorian multicultural grants program and supporting innovative new arts initiatives.
Ministerial portfoliosThe Department supports the ministerial portfolios of the Premier, Arts, and Multicultural Affairs and Citizenship.
Changes to the output structureThe Department has made some changes to its output structure for 2011-12, as shown in the table below:2010-11 Outputs Reason 2011-12 OutputsMulticultural Affairs Title Change Multicultural Affairs and
Citizenship
The following table summarises the Department’s total output cost.
Table 3.19: Output Summary($ million)
2010-11 Budget
2010-11 Revised
2011-12 Budget
Variation (a)
%Strategic Policy Advice and Support (b) 113.8 129.3 117.4 3.2Public Sector Management, Governance and
Support 34.0 34.3 33.3 -2.1
Multicultural Affairs and Citizenship (c) 13.8 14.5 19.6 42.0Arts and Cultural Development 449.4 458.8 461.1 2.6Total (d) 611.0 636.9 631.4 3.3Source: Department of Premier and Cabinet
Notes:(a) Variation between 2010-11 Budget and 2011-12 Budget.
Service Delivery 2011-12 Premier and Cabinet 339

(b) The 2010-11 Revised is higher that the 2010-11 Budget due to increased funding provided to the Victorian Bushfire Reconstruction and Recovery Authority during 2010-11.
(c) The 2011-12 Budget is higher than the 2010-11 Budget due to new funding provided for the Victorian Multicultural Grants Program; Migrant and Refugee Rights and Responsibilities Seminar Program; International Student Care Service; and Multicultural Language Services.
(d) Total output cost for 2011-12 Budget may not equate to the total expense reported in Budget Paper No. 5, Chapter 3 Departmental financial statements due to additional expenses in Budget Paper No. 5 that are not included in departmental output costs.
340 Premier and Cabinet Service Delivery 2011-12

Amounts availableThe following tables detail the amounts available to the Department from Parliamentary authority and income generated through transactions. Table 3.20 outlines the Department’s income from transactions and Table 3.21 summarises the sources of Parliamentary authority available to the Department to fund the provision of outputs, additions to net asset base and payments made on behalf of the State.
Table 3.20: Income from transactions($ million)
2009-10 2010-11 2010-11 2011-12 Actual Budget Revised BudgetOutput appropriations 558.1 532.6 548.5 555.2Special appropriations 6.7 6.6 6.6 6.6Interest 5.7 2.2 2.4 2.7Sale of goods and services 48.3 44.2 44.8 39.8Grants 25.8 16.3 15.7 9.1Fair value of assets and services received free of
charge or for nominal consideration 2.9 0.5 1.3 1.3
Other income 42.8 48.3 45.1 35.5Total income from transactions 690.3 650.7 664.4 650.0Source: Department of Premier and Cabinet and Department of Treasury and Finance
Table 3.21: Parliamentary authority for resources($ million)
2010-11 2010-11 2011-12 Budget Revised BudgetAnnual appropriations 565.3 582.3 618.1 Provision of outputs 521.3 538.4 549.7 Additions to the net asset base 43.9 43.8 68.4Receipts credited to appropriations 4.0 1.0 0.6Unapplied previous years appropriation 10.2 20.9 7.1 Provision of outputs 7.3 9.1 5.0 Additions to the net asset base 2.9 2.5 2.1 Payments made on behalf of the State .. 9.3 ..Accumulated surplus - previously applied appropriation .. 4.9 5.6Gross annual appropriation 579.4 609.0 631.3Special appropriations 6.6 6.6 6.6Trust funds 21.0 22.0 10.0Total parliamentary authority 606.9 637.6 648.0Source: Department of Premier and Cabinet and Department of Treasury and Finance
Service Delivery 2011-12 Premier and Cabinet 341

The following section provides details of the outputs provided to government, including performance measures and costs for each output. Total expenditure for the Department can be found in Budget Paper No. 5, Chapter 3 Departmental financial statements.
342 Premier and Cabinet Service Delivery 2011-12

Strategic Policy Advice and SupportProvision of advice and support to the Premier and Cabinet on all aspects of policy including the Government’s medium term strategic directions. This involves advice on issues as they arise, policy coordination and analysis, consultation with key internal and external stakeholders and leadership in long term policy development and research.
These outputs contribute to all departmental objectives by providing quality advice and support across a broad range of policy issues.
Service Delivery 2011-12 Premier and Cabinet 343
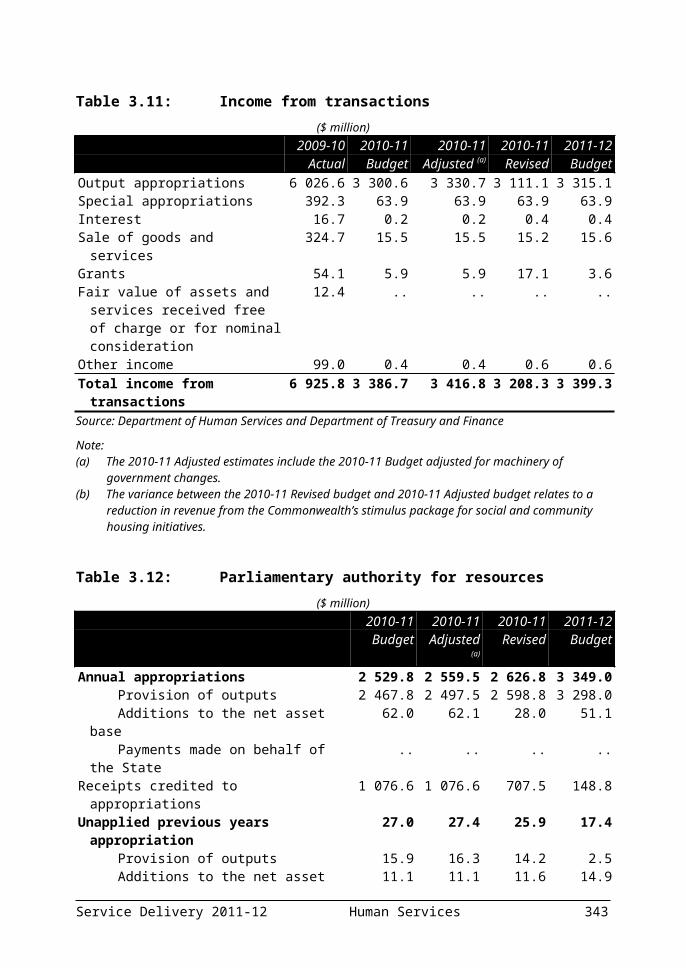
Major Outputs/DeliverablesPerformance Measures
Unit of Measure
2011-12 Target
2010-11 Expected Outcome
2010-11 Target
2009-10 Actual
Strategic Policy Advice and ProjectsProvide strategic policy analysis and advice to the Premier on all matters affecting the Premier’s role as head of Government; and assist the Premier in identifying emerging issues, carrying out practical forward planning, reviewing policy, and assessing the impact of government decisions and actions.
On behalf of the Premier, lead and participate in policy projects including development and coordination of new initiatives; and manage the implementation of strategic policy initiatives.
Quantity Government funded infrastructure projects of architectural significance reviewed by the Design Review Panel
per cent 100 nm nm nm
New performance measure for 2011-12 to reflect new funding provided for a pilot of the Victorian Design Review Panel.
Policy briefs prepared number 2 900 1 900 3 500 3 563The 2010-11 Expected Outcome is lower than the 2010-11 Target due to a reduction in policy briefs during the caretaker period of the 2010 State Election, and the use of a new brief management system that more accurately records the number of policy briefs generated by the Department. The 2011-12 Target has been lowered to reflect the use of the new brief management system.
Whole of government strategic policy projects
number 31 30 31 31
Quality Architectural design and procurement advice provided to Government
per cent 86 nm nm nm
New performance measure for 2011-12 to reflect the service provided by the new Independent Office of the Victorian Government Architect.
Policy services rating per cent 86 86 86 85
Timeliness Policy projects completed within required timelines
per cent 100 100 100 100
Policy services rating per cent 95 91 95 92
Cost Total output cost $ million 78.0 74.6 66.0 105.9
The 2010-11 Expected Output cost is higher than the 2010-11 Target predominantly due to increased funding provided to the Victorian Bushfire Reconstruction and Recovery Authority during 2010-11. The 2011-12 Target output cost is higher than the 2010-11 Target predominantly due to funding provided for the Independent Broad-based Anti-corruption Commission (IBAC) in 2011-12. A new performance measure related to IBAC has not been included for 2011-12 as the precise nature, timing of establishment and extent of outputs will be finalised during the 2011-12 financial year.
344 Premier and Cabinet Service Delivery 2011-12
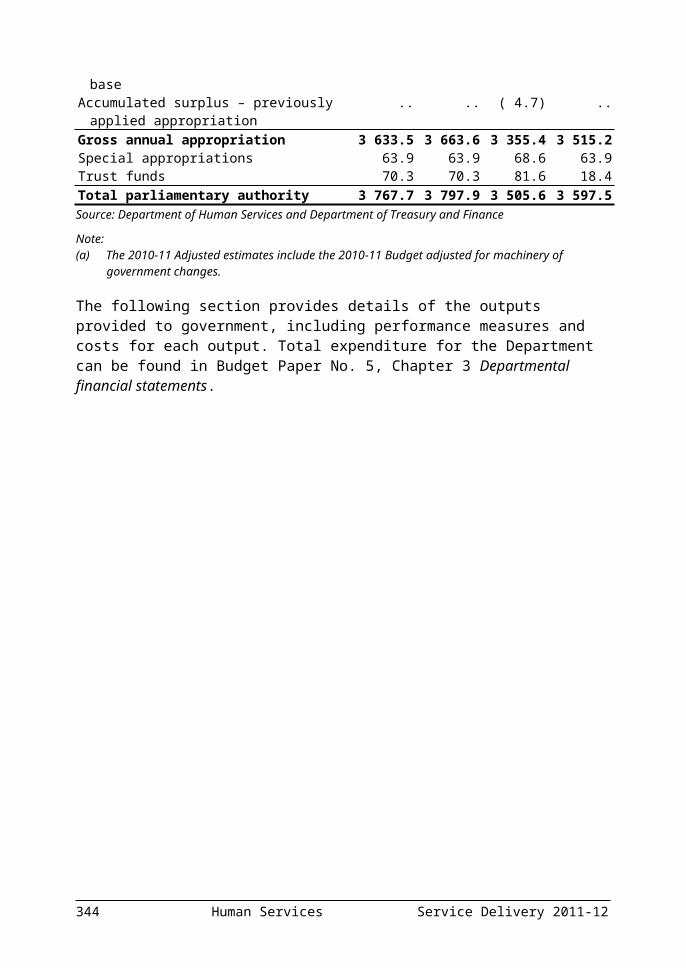
Major Outputs/DeliverablesPerformance Measures
Unit of Measure
2011-12 Target
2010-11 Expected Outcome
2010-11 Target
2009-10 Actual
Government Information Services and SupportContinuously improve Victorian Government communication with the Victorian public and across government, including the provision of information about government policies, programs and services.
Quantity Communication activities/products reviewed by the Advertising and Communications Review Group (ACRG)
number 250 100 250 199
This performance measure replaces the performance measure ‘Communication activities/ products reviewed by the Government Communications Review Group (GCRG)’. The GCRG has been discontinued and will be replaced by a new Advertising and Communications Review Group (ACRG). The 2010-11 Expected Outcome is lower than the 2010-11 Target due to the caretaker period at the time of the 2010 State Election.
Develop communications resource products, standards and guidelines in response to identified Government requirements
number 3 3 3 3
Policy briefs prepared number 70 50 70 66The 2010-11 Expected Outcome is lower than the 2010-11 Target due to the caretaker period at the time of the 2010 State Election.
Quality Policy services rating per cent 86 86 86 83
TimelinessCommunication activities/products reviewed by ACRG by due date
per cent 95 95 95 95
This performance measure replaces the performance measure ‘Communication activities/ requests reviewed by the Government Communications Review Group (GCRG) by due date’ because the GCRG has been discontinued and will be replaced by the new Advertising and Communications Review Group (ACRG).
Cost Total output cost $ million 36.2 51.4 44.6 43.8
The 2010-11 Expected output cost for Government Information Services and Support is higher than 2010-11 Target due to one-off payments resulting from the change in Government. The 2011-12 Target output cost is lower than the 2010-11 Target due to a reduction in office expenses.
Protocol and Special EventsInitiate, plan, coordinate and implement ceremonial, visit and event programs that enhance and uphold the effectiveness of the Office of Premier and the reputation of the State.
Quantity Annual special events number 7 7 6 6
The 2010-11 Expected Outcome is higher than the 2010-11 Target due to the addition of the Melbourne Cup Carnival to the 2010 special events programme. The 2011-12 Target has been revised to reflect this addition.
Official visitors to Victoria number 20 20 20 20
Service Delivery 2011-12 Premier and Cabinet 345

Major Outputs/DeliverablesPerformance Measures
Unit of Measure
2011-12 Target
2010-11 Expected Outcome
2010-11 Target
2009-10 Actual
Quality Policy services rating per cent 86 89 86 93
Timeliness Timely delivery of events, functions and visit arrangements
per cent 100 100 100 100
Cost Total output cost $ million 3.2 3.3 3.2 2.9
Source: Department of Premier and Cabinet
346 Premier and Cabinet Service Delivery 2011-12

Public Sector Management, Governance and SupportThese outputs relate to the provision of independent services and aim to ensure effective management, governance and support of the public sector.
These outputs contribute to the departmental objective of building trust in government through high standards of integrity, accountability and transparency.
Major Outputs/DeliverablesPerformance Measures
Unit of Measure
2011-12 Target
2010-11 Expected Outcome
2010-11 Target
2009-10 Actual
Advice and Support to the GovernorProvide advice and support to the Governor, and maintain Government House and its collections as a heritage asset of national importance.
Quantity Events and services arranged in response to requests by the Governor and the Premier
per cent 100 100 100 100
Quality Maintenance of assets in accordance with asset management strategy
per cent 100 100 100 100
Management of the program of events and services meets the expectations of the Governor
per cent 95 95 95 95
Standard, physical appearance and security of Government House, the gardens and grounds meet appropriate standards as per the asset management strategy
per cent 95 95 95 95
Timeliness Contract milestones are met per cent 100 100 100 100
Timely arrangement of events and services
per cent 100 100 100 100
Cost Total output cost $ million 8.9 9.2 9.2 9.0
Service Delivery 2011-12 Premier and Cabinet 347

Major Outputs/DeliverablesPerformance Measures
Unit of Measure
2011-12 Target
2010-11 Expected Outcome
2010-11 Target
2009-10 Actual
State Services AuthorityProvide recommendations and advice to Government to improve delivery and integration of government services; promote key public sector conduct values and employment principles; undertake independent investigations of complaints; develop public administration capability; and promote high standards of governance, accountability and performance in public entities.
Quantity Formal events and activities delivered across the public sector that promote values and employment principles; effective workforce planning and development; good governance in public sector entities; and effectiveness in public administration
number 100 100 100 177
Referred reviews underway or completed, aimed at improving service delivery, governance, and/or public administration efficiency and effectiveness
number 12 12 12 13
Quality Recommendations arising from reviews of actions (Section 64) implemented by the public service
per cent 100 100 100 100
Timeliness Referred reviews completed within agreed timelines
per cent 90 90 90 92
Cost Total output cost $ million 11.7 11.9 12.2 12.1
Ombudsman ServicesResponsible for independent investigation of complaints concerning administrative actions taken in Government departments, statutory bodies, or by officers and employees of municipal councils.
Quantity Internal reviews of complaint investigations conducted at the request of the complainant
number 70 70 80 54
The 2010-11 Expected Outcome is lower than the 2010-11 Target due to fewer internal reviews of completed investigations required than anticipated. The 2011-12 Target has been reduced to reflect this trend.
348 Premier and Cabinet Service Delivery 2011-12
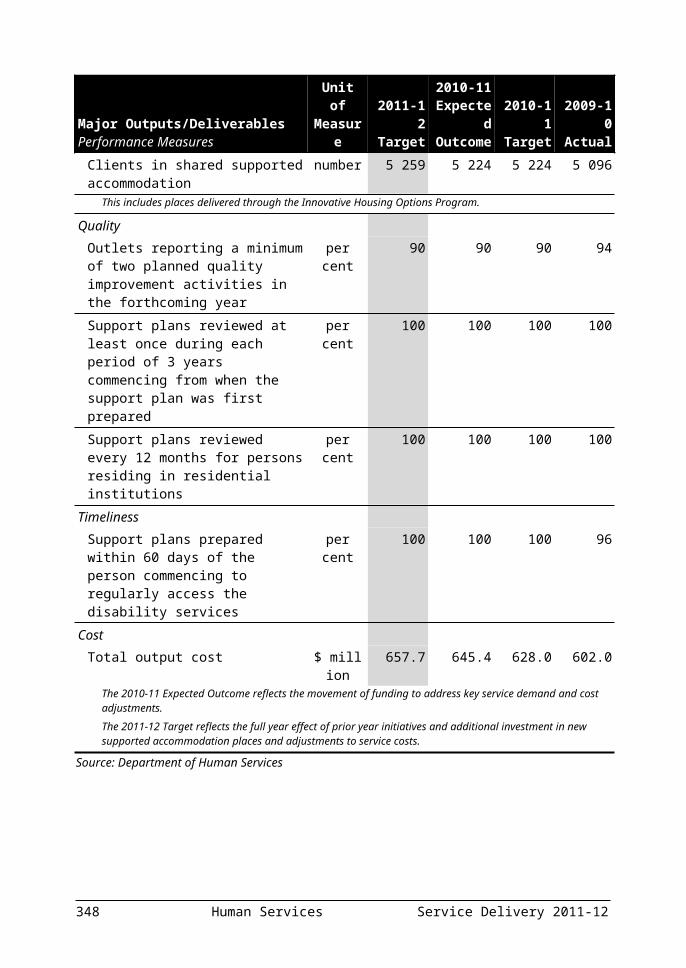
Major Outputs/DeliverablesPerformance Measures
Unit of Measure
2011-12 Target
2010-11 Expected Outcome
2010-11 Target
2009-10 Actual
Jurisdictional complaints finalised, including general, Freedom of Information and Whistleblower complaints
number 11 000 11 500 10 000 11 784
The 2010-11 Expected Outcome is higher than the 2010-11 Target because the number of jurisdictional complaints continues to increase which is in line with trends over several years. The 2011-12 Target has been increased accordingly.
Outreach initiatives delivered under the Outreach program
number 115 115 100 79
The 2010-11 Expected Outcome is higher than the 2010-11 Target as an increased focus on communications and learning/development has resulted in delivery of a greater quantity of Outreach initiatives. The 2011-12 Target has been increased to reflect this.
Reports tabled in Parliament number 6 9 4 11The 2010-11 Expected Outcome is higher than the 2010-11 Target because the number of reports tabled is unpredictable and was greater than anticipated in 2010-11. The 2011-12 Target has been revised in accordance with anticipated requirements.
Quality Proportion of complaint investigations reviewed at the request of complainants (by a fresh, senior investigator) where the original findings were found to be sound and well founded
per cent 80 80 80 96
Recommendations made in jurisdictional complaint investigations that are accepted by respondent agencies
per cent 80 80 80 97
Recommendations made in reports tabled in Parliament which respondent agencies agreed to implement
per cent 90 90 80 97
The 2010-11 Expected Outcome is higher than the 2010-11 Target due to a higher proportion of parliamentary report recommendations accepted by respondent agencies than anticipated. The 2011-12 Target has been increased in anticipation of this trend continuing.
Timeliness Complaints resolved within required timelines
per cent 95 95 93 99
Cost Total output cost $ million 7.9 8.4 7.7 7.9
The 2010-11 Expected output cost for Ombudsman services is higher than the 2010-11 Target due to a realignment of operating costs across outputs in 2010-11.
Service Delivery 2011-12 Premier and Cabinet 349
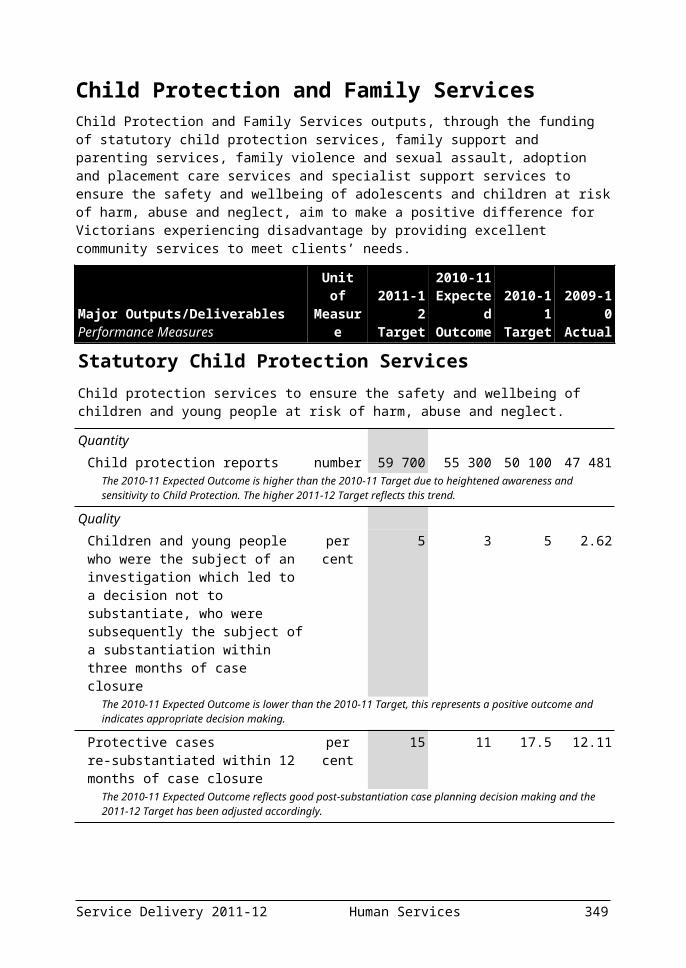
Major Outputs/DeliverablesPerformance Measures
Unit of Measure
2011-12 Target
2010-11 Expected Outcome
2010-11 Target
2009-10 Actual
Chief Parliamentary Counsel ServicesPreparation of Bills for introduction in Parliament, including: provision of advice on proposed Statutory Rules and other subordinate legislation; publishing and reprinting of Acts and Statutory Rules; and maintenance of a database of Victorian legislation.
Quantity Advice given on legislation in response to written requests
number 400 300 400 399
The 2010-11 Expected Outcome is lower than the 2010-11 Target due to the caretaker period at the time of the 2010 State Election and the subsequent change in government resulting in reduced demand for advice on legislation.
Statutory Rules made and Bills prepared and introduced into Parliament
number 290 250 260 276
Versions of Acts and Statutory Rules published electronically
number 800 1 000 800 982
The 2010-11 Expected Outcome is higher than the 2010-11 Target due to major legislation which amended a large number of Acts. This resulted in a higher than anticipated number of consolidated versions of legislation.
Quality Accuracy levels maintained in terms of document management, printing and publishing
per cent 96 98 96 99
Bills drafted, Statutory Rules drafted or settled, and advice provided is to the required standard
per cent 96 98 96 98
Timeliness Bills drafted, Statutory Rules drafted or settled, and advice provided within required timelines
per cent 96 98 96 99
Electronic versions published within required timelines
per cent 96 94 96 99
Cost Total output cost $ million 4.8 4.8 4.9 4.8
Source: Department of Premier and Cabinet
350 Premier and Cabinet Service Delivery 2011-12

Multicultural Affairs and CitizenshipThis output contributes to the provision of world-class services to Victoria’s unique culturally, linguistically and religiously diverse community in a culturally sensitive and appropriate manner. It promotes a united, socially cohesive community with shared laws, values, aspirations and responsibilities within which all Victorians have the freedom and opportunity to participate and contribute to the social, cultural, economic and political life of Victoria.
This output contributes to the departmental objective of fostering strong families and vibrant communities.
Major Outputs/DeliverablesPerformance Measures
Unit of Measure
2011-12 Target
2010-11 Expected Outcome
2010-11 Target
2009-10 Actual
Multicultural Affairs and CitizenshipOversee the provision of policy advice on settlement coordination for newly arrived migrants and refugees and the whole of government approach to Multicultural Affairs and Citizenship, and deliver programs to support Victoria’s approach to multiculturalism. Coordinate the monitoring of government departments’ responsiveness to Victorians from culturally, linguistically and religiously diverse backgrounds. Provide independent advice to the Government on systemic community issues affecting culturally, linguistically and religiously diverse communities’ participation in Victoria.
Quantity Active refugee support service agreements
number 9 9 9 8
Awareness seminars delivered to migrants and people from a refugee background
number 10 nm nm nm
New performance measure for 2011-12 to reflect new funding provided for the Migrant and Refugee Rights and Responsibilities Seminar program.
Celebrate our Cultural Diversity Week events held
number 200 200 200 200
Consultations with cultural and linguistically diverse (CALD) communities
number 60 60 60 65
Language services projects implemented
number 15 10 10 10
This performance measure replaces the performance measure ‘Language services partnerships implemented’. The word ‘projects’ has replaced ‘partnerships’ because this is a more accurate description of the service delivery model. The 2011-12 Target has been increased to reflect new funding provided for Multicultural Language Services.
Metropolitan grants approved number 2400 2450 2 400 2 190
Regional/rural grants approved number 370 280 370 342The 2010-11 Expected Outcome is lower than the 2010-11 Target due to a lower than anticipated number of applications for regional/rural grants received over the year.
Service Delivery 2011-12 Premier and Cabinet 351

Major Outputs/DeliverablesPerformance Measures
Unit of Measure
2011-12 Target
2010-11 Expected Outcome
2010-11 Target
2009-10 Actual
Quality Community satisfaction with Celebrate our Cultural Diversity Week events
per cent 100 100 100 100
Cultural precinct enhancement projects completed against milestones in the strategic plan
per cent 100 100 100 60
Local refugee communities developing local plans
per cent 100 100 100 100
Victorian multicultural grants: grants paid against milestones of funding agreements
per cent 100 100 100 100
Timeliness Multicultural projects completed within the required timeframe
per cent 85 85 85 85
Cost Total output cost $ million 19.6 14.5 13.8 13.5
The 2011-12 Target output cost is higher than the 2010-11 Target due to new funding provided for the Victorian Multicultural Grants Program; Migrant and Refugee Rights and Responsibilities Seminar Program; and Multicultural Language Services.
Source: Department of Premier and Cabinet
352 Premier and Cabinet Service Delivery 2011-12
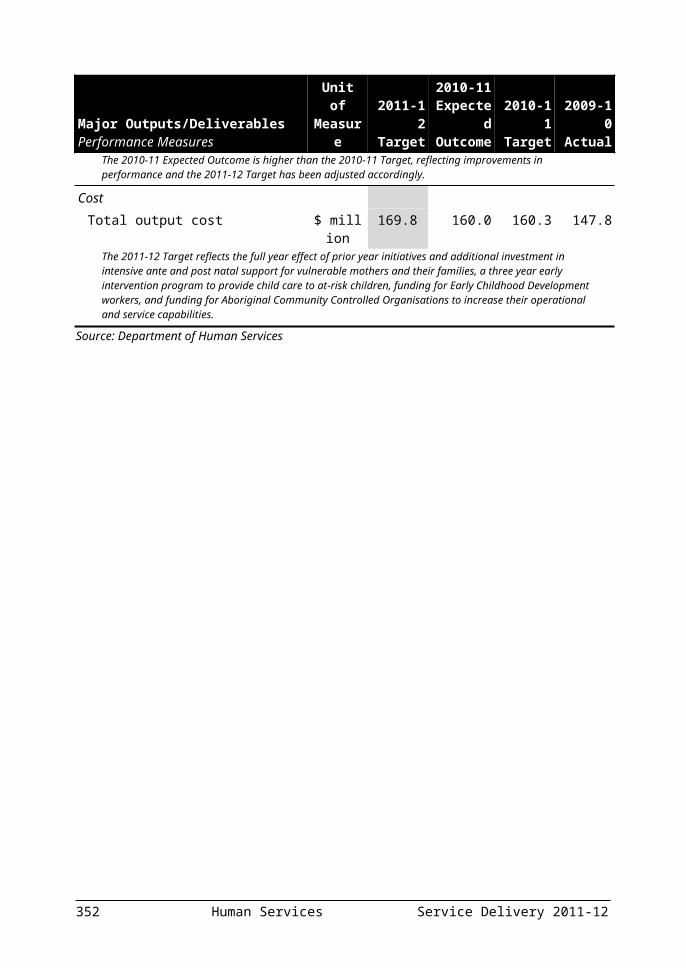
Arts and Cultural DevelopmentThese outputs contribute to the development of the Victorian arts and cultural sector through the provision of industry assistance programs, infrastructure development and policy advice.
These outputs contribute to the departmental objectives of fostering vibrant communities and building a stronger Victorian economy with expanded opportunity.
Major Outputs/DeliverablesPerformance Measures
Unit of Measure
2011-12 Target
2010-11 Expected Outcome
2010-11 Target
2009-10 Actual
Arts Development and AccessSupport for artists and arts organisations, expanding access to a diverse range of arts products. These services enhance Victoria’s arts and cultural sector.
Quantity Access to a diverse range of supported projects: artist residencies in schools
number 26 37 39 38
The 2010-11 Expected Outcome is lower than the 2010-11 Target due to a change in the program model during the year, whereby fewer residencies are supported but at an increased grant level. The 2011-12 Target has been reduced to reflect the new program model.
Access to a diverse range of supported projects: local festivals funded
number 19 22 19 21
The 2010-11 Expected Outcome is higher than the 2010-11 Target due to a larger than expected number of strong applications for local festival funding received in the first half of 2010-11.
Access to a diverse range of supported projects: regional Touring Victoria destinations
number 40 40 45 43
The 2010-11 Expected Outcome is lower than the 2010-11 Target due to increased touring costs which have prompted producers to tour to larger regional centres. The 2011-12 Target has been reduced in anticipation that this trend will continue in 2011-12.
Attendances at major festivals number (‘000)
2 200 2 200 2 200 2 200
Attendances at major performing arts organisations
number (‘000)
960 951 960 1 010
Diverse range of product, producers and cultural venues supported:
organisations recurrently funded number 107 107 107 106 regionally based organisations recurrently funded
number 45 46 45 45
project companies and artists funded
number 350 350 300 347
The 2010-11 Expected Outcome is higher than the 2010-11 Target due to the inclusion of Victoria Rocks projects in the number of projects funded. The 2011-12 Target has been increased to reflect the continuation of funding for the Victoria Rocks Program.
Service Delivery 2011-12 Premier and Cabinet 353

Major Outputs/DeliverablesPerformance Measures
Unit of Measure
2011-12 Target
2010-11 Expected Outcome
2010-11 Target
2009-10 Actual
project companies and artists funded which are regionally based
per cent 23 22 22 21
The 2011-12 Target has been increased to reflect new funding provided in 2011-12 for the Regional Arts Transformation initiative.
International markets accessed number 20 20 20 24
Quality Grant recipients who met or exceeded agreed outcomes
per cent 85 85 85 91
Timeliness All other applications processed for Ministerial consideration
days 40 40 40 39
Arts Development applications processed for Ministerial consideration
days 60 60 60 56
Performance and grant agreements acquitted within timeframes specified in the funding agreement
per cent 80 80 80 86
Cost Total output cost $ million 57.2 43.2 43.2 45.9
The 2011-12 Target output cost is higher than the 2010-11 Target due to funding provided for a number of new initiatives including Regional Arts Transformation, the Victorian Sculpture initiative and Support for the Victorian College of the Arts.
Creating Place and SpaceSupport for Victorian cultural venues and state owned facilities. Provides strategic assessment and advice on portfolio infrastructure proposals and projects. Consolidates portfolio asset management plans and manages funding programs for maintenance and minor capital works.
Quantity Infrastructure development projects number 4 5 4 4
The 2010-11 Expected Outcome is higher than the 2010-11 Target due to the addition of the St Martins Youth Arts Centre project. The 2011-12 Target has not been increased as this project is scheduled to be completed during the second half of 2010-11.
Risk management projects number 3 3 3 3
State owned cultural facilities maintained to meet service and statutory standards
number 27 27 27 27
Quality Success measures of projects achieved per cent 90 90 90 95
354 Premier and Cabinet Service Delivery 2011-12

Major Outputs/DeliverablesPerformance Measures
Unit of Measure
2011-12 Target
2010-11 Expected Outcome
2010-11 Target
2009-10 Actual
Timeliness Performance and grant agreements completed within agreed timeframes
per cent 90 90 90 85
Cost Total output cost $ million 97.7 96.6 96.6 97.8
Portfolio Services and PolicyProvision of governance, policy implementation and advice, research, planning and communications services across the arts portfolio.
Quantity Agency service agreements in place number 6 6 6 6Ministerial briefs number 500 600 600 678
The 2011-12 Target has been revised downward due to plans for the Cultural Ministers Council to wind up at the end of 2010-11, which will reduce the number of ministerial briefs prepared.
Planning and research projects number 13 13 13 13
Quality Level of satisfaction with policy advice per cent 95 95 95 97
Public information rated ‘Informative’ or ‘Very Informative’
per cent 90 88 90 93
Timeliness Arts portfolio public body annual reports tabled in Parliament by the required statutory dates
per cent 100 100 100 100
Cost Total output cost $ million 3.8 3.7 3.7 4.4
Arts Portfolio AgenciesPromotion, presentation and preservation of our heritage and the arts through Victoria’s cultural agencies: Australian Centre for the Moving Image (ACMI), Geelong Performing Arts Centre, Museum Victoria, National Gallery of Victoria, Public Record Office Victoria (PROV), State Library of Victoria, Melbourne Recital Centre and the Victorian Arts Centre Trust.
Quantity Access: agency website visitation number
(‘000)11 000 12 623 9 630 nm
The 2010-11 Expected Outcome is higher than the 2010-11 Target due to the increasing use of online ticketing, web facilities and online services. A new method of measurement (browser-based web analytics tool) has also been used to assess agency website visitation for the first time, which has provided more accurate information. The 2011-12 Target has been increased to account for this new method of measurement.
Service Delivery 2011-12 Premier and Cabinet 355

Major Outputs/DeliverablesPerformance Measures
Unit of Measure
2011-12 Target
2010-11 Expected Outcome
2010-11 Target
2009-10 Actual
Access: users/attendances at all agencies
number (‘000)
8 000 8 637 7 770 9 394
The 2010-11 Expected Outcome is higher than the 2010-11 Target due to the success of the Tim Burton (ACMI) and Titanic (Museum Victoria) exhibitions, along with the ongoing success of ACMI’s Screen Worlds and film/public programs. The 2011-12 Target has been increased in anticipation of this trend continuing.
Community engagement: members and friends of agencies
number 37 500 40 352 35 000 43 448
The 2010-11 Expected Outcome is higher than the 2010-11 Target due to the introduction of a new member scheme by ACMI in June 2010. The 2011-12 Target has been increased to reflect the success of ACMI’s new member scheme.
Community engagement: volunteer hours
number 95 000 104 200 93 850 91 162
The 2010-11 Expected Outcome is higher than the 2010-11 Target due to greater than anticipated volunteer assistance at the Arts Portfolio Agencies, particularly at the PROV and ACMI’s Tim Burton exhibition. The 2011-12 Target has been increased in anticipation of this trend continuing.
Education – students participating in agency education programs
number 500 000 518 820 490 000 580 295
The 2010-11 Expected Outcome is higher than the 2010-11 Target due to greater than expected school attendances at ACMI’s Tim Burton exhibition and Screen Worlds, and at Museum Victoria (Scienceworks). The 2011-12 Target has been increased in anticipation of this trend continuing.
Public Record Office Victoria: digital records preserved
number 100 000 100 000 100 000 68 274
Public Record Office Victoria: records transferred
shelf metres
1 000 1 000 1 200 nm
The 2010-11 Expected Outcome is lower than the 2010-11 Target due to the decline in hardcopy records transferred to PROV over recent years, which is mainly the result of an increasing number of records taking on a digital rather than hardcopy form. The 2011-12 Target has been decreased to reflect this trend.
Public Record Office Victoria: Victorian Electronic Records Strategy departmental consultations
number 100 100 100 114
Quality Agency collections stored to industry standard
per cent 85 85 85 85
Visitors satisfied with visit: Australian Centre for the Moving Image
per cent 90 92 90 94
Geelong Performing Arts Centre per cent 98 98 98 98 Melbourne Recital Centre per cent 90 90 90 nm Museum Victoria per cent 95 95 95 94 National Gallery of Victoria per cent 95 95 95 98 Public Record Office Victoria per cent 90 90 90 83 State Library of Victoria per cent 90 90 90 97 Victorian Arts Centre Trust per cent 95 98 95 98
356 Premier and Cabinet Service Delivery 2011-12

Major Outputs/DeliverablesPerformance Measures
Unit of Measure
2011-12 Target
2010-11 Expected Outcome
2010-11 Target
2009-10 Actual
Timeliness Public Record Office Victoria records issued within specified timeframes
per cent 95 95 95 95
Cost Total output cost $ million 302.4 315.3 305.9 286.1
Source: Department of Premier and Cabinet
Service Delivery 2011-12 Premier and Cabinet 357

DEPARTMENT OF PRIMARY INDUSTRIES
Departmental mission statementThe Department of Primary Industries is responsible for agriculture, earth resources, energy, fisheries and forestry in Victoria, and designs and delivers government policies and programs which enable Victoria’s primary industries to sustainably maximise employment, wealth and wellbeing for Victorian families, regions and communities.
Departmental objectives The Department has three main objectives: competitive businesses and efficient markets through increased
productivity, access to global trade and investment, and improved market structure and function;
sustainably managed natural resources through efficient and sustainable allocation, and use and management of natural resources; and
engaged, safe and responsible communities through improved community engagement, recreation and capacity building, and enhanced human safety and animal welfare.
Key strategic priorities for 2011-12The Department’s key strategic priorities for 2011-12 include: Driving productivity and enable adjustment in agriculture – by
developing new technologies and farm practices, early detection and management of biosecurity threats and developing policy settings, research, and practice change to enable farm businesses to adapt to change and remove barriers to careers for young people in food and fibre production.
Securing investment and jobs in forestry – by providing long-term security for the forest industry, maximising the value of Victoria’s timber resources.
Sustainably managing the fisheries resource – by improving fisheries management decisions through research into sustainable management of Victorian fisheries, developing national reforms, improving consultation with industry and improving recreational opportunities from fishing.
Enabling transformation of Victoria’s energy sector under carbon constraints – by ensuring a policy environment conducive to investment, achieving an efficient national energy market and facilitating greater energy use efficiency, as well as quantifying the
358 Primary Industries Service Delivery 2011-12

costs and benefits for a full range of options to reduce the risks of catastrophic bushfires from electricity infrastructure.
Capturing the value of Victoria’s earth resources – by building Victoria’s international profile as a highly prospective state, and moderating cost of living pressures, through competitively priced and secure energy sources.
Ministerial portfoliosThe Department of Primary Industries supports the ministerial portfolios of Energy and Resources, and Agriculture and Food Security.
Changes to the output structureThe Department has made no changes to the output structure for 2011-12. The following table summarises the Department’s total output cost.
Table 3.22: Output summary($ million)
2010-11 Budget
2010-11 Revised
2011-12 Budget
Variation (a)
%Primary Industries Policy (b) 66.9 63.9 83.9 25.4Regulation and Compliance (c) 116.2 155.2 111.3 -4.2Strategic and Applied Scientific Research(d)(e) 208.1 227.5 254.0 22.1Sustainable Practice Change (f) 119.7 125.4 81.5 -31.9Total (g) 510.9 572.0 530.7 3.9Source: Department of Primary Industries
Notes:(a) Variation between 2010-11 Budget and 2011-12 Budget.(b) The 2011-12 output cost is higher than the 2010-11 output cost due to additional
funding received for CarbonNet to explore the development of an integrated network to capture and transport carbon to storage sites.
(c) The 2010-11 revised output cost is higher than the 2010-11 output cost due to additional funding allocated in 2010-11 to meet the costs of undertaking urgent locust control activities in Victoria.
(d) The 2010-11 revised output cost is higher than the 2010-11output cost as a result of an increase in contracted activities with external parties on research into agricultural solutions.
(e) The 2011-12 output cost is higher than the 2010-11revised output cost primarily due to the commencement of quarterly service payments for the Biosciences Research Centre project in accordance with the Partnerships Victoria contractual arrangements.
(f) The 2011-12 output cost is lower than the 2010-11 revised output cost due to the completion of the existing Exceptional Circumstances Interest Rate Subsidy scheme.
(g) Total output cost for 2011-12 Budget may not equate to the total expense reported in Budget Paper No. 5, Chapter 3 Departmental financial statements due to additional expenses in Budget Paper No. 5 that are not included in departmental output costs..
Service Delivery 2011-12 Primary Industries 359

Amounts availableThe following tables detail the amounts available to the Department from Parliamentary authority and income generated through transactions. Table 3.23 outlines the Department’s income from transactions and Table 3.24 summarises the sources of Parliamentary authority available to the Department to fund the provision of outputs, additions to net asset base and payments made on behalf of the State.
360 Primary Industries Service Delivery 2011-12

Table 3.23: Income from transactions($ million)
2009-10 2010-11 2010-11 2011-12 Actual Budget Revised BudgetOutput appropriations 501.7 467.9 512.6 486.4Special appropriations .. .. 15.0 ..Interest 4.0 1.1 0.7 0.7Sale of goods and services 35.2 30.9 19.8 13.7Grants 0.2 .. 11.1 17.3Fair value of assets and services received free of
charge or for nominal consideration.. .. .. ..
Other income 10.1 10.0 9.8 10.2Total income from transactions 551.2 509.9 569.0 528.4Source: Department of Primary Industries and Department of Treasury and Finance
Table 3.24: Parliamentary authority for resources($ million)
2010-11 2010-11 2011-12 Budget Revised BudgetAnnual appropriations 371.4 388.1 435.8 Provision of outputs 351.9 380.0 405.9 Additions to the net asset base 19.5 8.1 29.9 Payments made on behalf of the State .. .. ..Receipts credited to appropriations 97.7 111.4 63.4Unapplied previous years appropriation 21.6 25.4 29.3 Provision of outputs 18.2 21.2 17.1 Additions to the net asset base 3.4 4.3 12.1Accumulated surplus – previously applied appropriation .. 2.0 ..Gross annual appropriation 490.7 526.9 528.4Special appropriations .. 15.0 ..Trust funds 42.3 41.7 42.3Total parliamentary authority 533.1 583.6 570.7Source: Department of Primary Industries and Department of Treasury and Finance
The following section provides details of the outputs provided to government, including performance measures and costs for each output. Total expenditure for the department can be found in Budget Paper No. 5, Chapter 3 Departmental financial statements.
Service Delivery 2011-12 Primary Industries 361

Sustainable Development of Primary and Energy IndustriesThe Department works with energy companies, research partners, primary producers, mineral explorers and rural communities across Victoria, as well as other government departments and national and international research associates, to address the major and emerging challenges in sustainability and productivity.
The Department’s services are delivered through four outputs encompassing innovative policy, world class science and technology, leading edge protection and regulation practices, and sustainable practice change.
Major Outputs/DeliverablesPerformance Measures
Unit of Measure
2011-12 Target
2010-11 Expected Outcome
2010-11 Target
2009-10 Actual
Primary Industries PolicyDevelop policy frameworks and legislative reforms that aim to improve investment in, and protection of, energy, resources and primary industries. It does this through the establishment of efficient and equitable resource definition, allocation and management processes leading to improved market access, industry performance, efficiency of resource use and reduced adverse impacts on the environment.
This output contributes to all of the Department’s objectives.
Quantity Exercise strategies for maintaining security of electricity and gas supply
number 4 4 4 8
Industry information packages released targeted at minerals and petroleum
number 12 12 12 14
Major strategic policy briefings to government
number 10 10 10 17
Number of native and salmonid fish stocked
number 340 000 nm nm nm
The new 2011-12 performance measure reflects funding received for the ‘Improving Recreational Fishing Opportunities in Regional Victoria’ initiative.
Number of structured management arrangements in place for fisheries
number 23 20 24 20
The 2010-11 Expected Outcome is lower than the 2010-11 Target due to the re-scheduling of work on three fishery management plans to 2011-12 following the consolidation of working groups and changes to staffing.
The lower 2011-12 Target is due to the deferral in the development of a further management plan pending the completion of an independent review of that fishery.
Powerline relocation grants approved number 12 16 20 20The 2010-11 Expected Outcome is lower than the 2010-11 Target due to a reduced program for 2010-11 to address national energy market priorities. The lower 2011-12 Target reflects variations to the 2011-12 work plan.
Strategic policy briefings on energy matters to portfolio minister
number 210 210 210 223
362 Primary Industries Service Delivery 2011-12

Major Outputs/DeliverablesPerformance Measures
Unit of Measure
2011-12 Target
2010-11 Expected Outcome
2010-11 Target
2009-10 Actual
Quality Compliance with criteria for approval of powerline relocation grants
per cent 100 100 100 100
Proportion of minerals and petroleum publications and packages requiring post-release correction or recall
per cent <5 <5 <5 0
Timeliness Delivery of milestones facilitated in line with grant agreements for the brown coal R&D grants and sustainable energy R&D grants that form part of the Energy Technology Innovation Strategy initiative
per cent 100 95 100 93
The 2010-11 Expected Outcome is lower than the 2010-11 Target due to delays in the receipt of an approved project plan by a brown coal Research and Development proponent.
Facilitate delivery of milestones in line with grant agreements for Energy Technology Innovation Strategy Sustainable Energy Programs
per cent 100 100 100 nm
The 2011-12 performance measure is the same as the 2010-11 performance measure except for the addition of ‘Energy Technology Innovation Strategy Sustainable Energy Programs’ and removal of ‘Large-scale Sustainable Energy demonstration program’ and measures the same activity. The wording has been amended to better reflect the current scope of the program.
Facilitate delivery of milestones in line with grant agreements for Energy Technology Innovation Strategy large-scale demonstration projects
per cent 100 100 100 51
The 2009-10 Actual is lower than the 2009-10 Target due to a combination of difficult economic conditions and technical issues leading to the delay of two large-scale demonstration projects.
Facilitate delivery of milestones in line with grant agreements for large-scale Carbon Capture and Storage demonstration program
per cent 100 100 100 nm
Fisheries management plans actions implemented within agreed timelines
per cent >90 >90 >90 93
Minerals and petroleum input to Environment Effects Statements (EES) completed according to EES panel timelines
per cent 100 100 100 100
Cost Total output cost $ million 83.9 63.9 66.9 76.1
Service Delivery 2011-12 Primary Industries 363

Major Outputs/DeliverablesPerformance Measures
Unit of Measure
2011-12 Target
2010-11 Expected Outcome
2010-11 Target
2009-10 Actual
Regulation and ComplianceProtect the sustainability of Victoria’s primary and energy industries by regulating natural resource use in the public interest. Encourage best practice behaviours through a pro-active approach to self-regulation, while undertaking education, inspection and enforcement services to ensure industry and community compliance with legislation and regulations. Protect the quality and safety of Victoria’s primary products by building and maintaining Victoria’s capability to monitor, detect and respond to disease, pest and residue incidents outbreaks and other biosecurity threats.
This output contributes to all of the Department’s objectives.
Quantity Animal pest, disease and residue control programs maintained to assist industry to access markets
number 5 5 5 5
Audits completed at mineral and petroleum sites on specific high risk issues
number 100 100 100 101
Develop, implement and review overarching fisheries compliance strategy
number 1 3 3 3
This performance measure amends the 2010-11 performance measure ‘Fisheries compliance strategies implemented’. The wording of this performance measure and the 2011-12 Target have been adjusted to reflect the consolidation of three previously separate compliance strategies for marine, inland and aquaculture into a single overarching strategy for all fisheries.
Enhance levels of community participation in achieving fisheries compliance through calls to the 13FISH reporting line
number 1 700 nm nm nm
The new 2011-12 performance measure reflects funding received for the ‘Continuing 13 FISH: Fisheries Intelligence Reporting Line’ initiative.
Environmental and compliance audits of critical minerals and petroleum sites completed
number 60 60 60 87
Formal agreements with land managers (public and private) and peak body organisations to undertake agreed pest management practices
number 60 60 60 76
Minerals and petroleum licences, permits and authorities under administration
number 1 800 1 800 1 800 1 748
Plant pest, disease and residue control programs maintained to assist industry to access markets
number 6 6 6 6
364 Primary Industries Service Delivery 2011-12

Major Outputs/DeliverablesPerformance Measures
Unit of Measure
2011-12 Target
2010-11 Expected Outcome
2010-11 Target
2009-10 Actual
Properties inspected for invasive plant and animal priority species
number 4 800 3 800 3 800 6 686
This performance measure now incorporates activity (e.g. inspection of properties) undertaken under the 2010-11 performance measure ‘Landholders complying with pest plant and animal control requirements under the Catchment and Land Protection Act 1994 within agreed timeframes and in targeted areas’. The higher 2009-10 actual figure (compared with the 2009-10 target of 3 800) is due to a significant increase in inspections performed in Spring 2009 due to favourable seasonal conditions and increased activity related to Mexican Feather Grass incursion (MFG) response. The 2011-12 Target has been increased to reflect the planned increase in the work program for the next year.
State prohibited weeds monitored and where present, treated
per cent 95 95 95 98
Technical Review Board to complete the review of stability reports for Latrobe Valley coal mines
number 6 6 6 6
Quality Compliance with relevant industry standards for animal welfare
per cent >95 >95 >95 94
Exploration and mining licences which are not active
per cent <20 <20 <20 21
Compliance with international and national quality assurance standards by meeting certification authorities required performance audits on animal and plant health programs and agriculture/veterinary chemical use
number 3 3 3 2
Enhance or maintain levels of community compliance to achieve sustainability within a fisheries resource and/or area
per cent >90 88 >90 91
Levels of compliance are maintained to ensure the sustainability of priority fish species
per cent >90 77 >90 96
The 2010-11 Expected Outcome is lower than the 2010-11 Target due to the implementation of targeted compliance operations across the State specifically addressing areas of non-compliance. Compliance rates are expected to improve over time as a result of this intervention.
Timeliness Minerals and petroleum exploration license applications not determined after three months
per cent <5 <5 <5 0
Mining industry work-plans not processed in one month
per cent <5 <5 <5 0
Mining licence applications not determined after four months
per cent <5 <5 <5 0
Service Delivery 2011-12 Primary Industries 365

Major Outputs/DeliverablesPerformance Measures
Unit of Measure
2011-12 Target
2010-11 Expected Outcome
2010-11 Target
2009-10 Actual
National quality assurance and animal welfare programs implemented within required timelines
per cent >95 >95 >95 100
Response time to emergency animal, pest, disease, residue and disaster incidents
hours <24 <24 <24 <24
Response time to emergency plant pest, disease, residue and disaster incidents
hours <24 <24 <24 <24
Cost Total output cost $ million 111.3 155.2 116.2 116.8
Strategic and Applied Scientific Research Use science and innovation to increase the productivity, profitability, sustainability, international competitiveness and export value of primary and energy industries by investing in research and development, new technologies and practices, knowledge and science based tools, and resource information.
This output contributes to all of the Department’s objectives.
Quantity Applications for intellectual property protection
number 8 8 8 12
Commercial technology licence agreements finalised
number 20 20 20 28
Genetic improvement of dairy cows achieved through breeding contributing to increased milk production and dairy productivity
per cent 1 1 1 1
International scientific workshops/conferences led/organised by DPI to promote science leadership among peers
number 5 6 5 6
The 2010-11 Expected Outcome is higher than the 2010-11 Target due to an extra conference led/organised by the Future Farming Systems Research Division.
New key enabling technologies and core science capacity competencies established/upgraded by DPI
number 2 2 2 2
Postgraduate level/PhD students in training by DPI
number 64 87 77 100
The 2010-11 Expected Outcome is higher than the 2010-11 Target due to the Future Farming Systems Research Division improving its relationships with universities, providing increased opportunities for PhD students to be involved in the Department’s work. The lower 2011-12 Target reflects a high number of students that will be finishing in 2010-11 that were aligned to a significant Fisheries Research and Development Corporation project.
366 Primary Industries Service Delivery 2011-12

Major Outputs/DeliverablesPerformance Measures
Unit of Measure
2011-12 Target
2010-11 Expected Outcome
2010-11 Target
2009-10 Actual
Scientific and technical publications in international and/or peer review journals that promote productive and sustainable farming (including aquaculture) and fisheries systems
number 358 375 375 603
The lower 2011-12 Target is due to the completion of a number of Port Phillip Bay Channel Deepening Bay Wide monitoring projects in 2010-11.
Value of external (non-state) funding contribution to research projects that support productive and sustainable farming (including aquaculture) and fisheries systems
$ million 40.5 57 37 54.6
The 2010-11 Expected Outcome is higher than the 2010-11 Target due to additional funding contributions from industry to the BioSciences Research Division as a result of expanded Research and Development programs in crop innovation.
The 2011-12 Target has also been increased to reflect the increased funding contribution.
Timeliness Agrifood, fisheries and natural resource management research and development project milestones and reports completed on time
per cent 85 85 85 85.2
Provision of technical advice, diagnostic identification tests on pests and diseases including suspected exotics within agreed timeframes
per cent 90 95 90 97.5
The 2010-11 Expected Outcome is higher than the 2010-11 Target due to reduced time and costs driven by efficient diagnostic processes and improved client communication.
Victorian Initiatives for Minerals and Petroleum (VIMP) data releases meeting timetable
per cent >95 >95 >95 100
Cost Total output cost $ million 254.0 227.5 208.1 188.7
Sustainable Practice ChangeFacilitate the adoption of new ideas and practices, and assist industries and communities to understand, manage and adapt to change driven by economic, social and environmental pressures. Promote trade by enhancing access to markets and securing market opportunities for Victoria.
This output contributes to all of the Department’s objectives.
Quantity Farmers facing significant adjustment pressures supported to make better informed decisions
number 2 000 1 800 1 800 2 060
Service Delivery 2011-12 Primary Industries 367

Major Outputs/DeliverablesPerformance Measures
Unit of Measure
2011-12 Target
2010-11 Expected Outcome
2010-11 Target
2009-10 Actual
The higher 2011-12 Target is due to an expected increase in demand as a result of the Flood Recovery response and the continuation of the Rural Financial Counsellor program.
Farming families participating in DPI preventative health program
number 330 330 330 900
Formal evaluations that demonstrate contribution to increased industry productivity growth
number 4 4 4 nm
Significant customer interactions to facilitate export outcomes
number 90 90 90 94
Significant stakeholder interactions on climate variability and emission management
number 3 300 4 000 1 500 2 334
The increase in 2010-11 Expected Outcome is due to higher than expected demand generated in particular by an innovative new climate communications product (The Climatedogs). It is expected that demand will continue to increase and the 2011-12 Target has been increased to reflect this. The 2011-12 performance measure is the same as the 2010-11 measure except for the removal of ‘climate change’ to better reflect the intent of the measure, and measures the same activity as per the performance measure in 2010-11.
Targeted areas provided with information through Ag Futures Forums about the key drivers of change for agriculture to guide local decision making
number 12 12 12 12
Trade barriers identified and strategies developed to overcome them
number 3 3 3 3
Water Savings Plans progressed in the Goulburn Murray Irrigation District
number 300 300 300 nm
The 2011-12 performance measure is the same as the 2010-11 performance measure except for the addition of ‘progressed’ and removal of ‘completed’ and measures the same activity.
Quality Clients are satisfied that services are accessible and relevant
per cent >80 >80 >80 89
Proportion of practice change and technical publications submitted to conference proceedings and peer review journals that are accepted for publication
per cent 90 90 90 83
Timeliness Evaluation activities completed for key projects
per cent 100 100 100 100
Project milestone reports completed on time
per cent 85 75 85 85
The 2010-11 Expected Outcome is lower than the 2010-11 Target due to re-prioritisation of resources to Emergency Response activities, principally the Locust and Flood Recovery response.
368 Primary Industries Service Delivery 2011-12
Major Outputs/DeliverablesPerformance Measures
Unit of Measure
2011-12 Target
2010-11 Expected Outcome
2010-11 Target
2009-10 Actual
Cost Total output cost $ million 81.5 125.4 119.7 178.4
Source: Department of Primary Industries
Service Delivery 2011-12 Primary Industries 369

DEPARTMENT OF SUSTAINABILITY AND ENVIRONMENT
Departmental mission statementThe Department of Sustainability and Environment is Victoria’s primary government agency responsible for promoting and managing the sustainability of the natural environment. The Department’s primary functions are: water management; public land fire management; climate change policy; ecosystem and biodiversity conservation; public land stewardship across forests, parks, coasts, alpine resorts
and Crown land reserves; and promotion of sustainable resource use and management practices
by industry and the general community.
Departmental objectives
The Department is delivering on the following four key objectives: delivering sustainable water management and supply (including
improving the response to future flood events); reducing the threat of fire; promoting new standards for protecting the natural environment;
and adapting to the impacts of climate change.
Key strategic priorities for 2011-12The Department has identified four key strategic priorities for 2011-12: responding to flood and bushfire events; delivering election commitments; implementing a new regional service delivery model; and increasing the level of planned burning on public land consistent
with the recommendations of the Victorian Bushfire Royal Commission.
Policies and programs will be implemented that: address the impacts of extreme weather events, including bushfires
and floods;
370 Sustainability and Environment Service Delivery 2011-12

ease cost of living pressures; support regional development; and make significant capital investments that deliver better
environmental outcomes.
Ministerial portfoliosThe Department supports the ministerial portfolios of Environment and Climate Change and the ministerial portfolio for Water.
Changes to the output structure The Department has made no changes to its output structure for 2011-12. The following table summarises the Department’s total output cost.
Table 3.25: Output summary($ million)
2010-11 Budget
2010-11 Revised
2011-12 Budget
Variation (a)
%Sustainable Water Management and Supply (b) 327.7 356.7 285.2 -13.0 (c)
Healthy and Productive Land (d) 303.9 336.6 341.6 12.4 (e)
A healthy and resilient natural environment (d) 174.4 173.7 197.4 13.2 (f)
Effective management of fire (d) 216.8 321.9 325.5 50.1 (g)
Effective adaptation to the impacts of climate change (h)
190.5 195.3 241.8 26.9 (i)
Land Administration and Property Information 132.7 125.5 124.1 -6.5 (j)
Total (k) 1 346.0 1 509.7 1 515.6 12.6Source: Department of Sustainability and Environment
Notes:(a) Variation between 2010-11 Budget and 2011-12 Budget.(b) The 2010-11 output grouping name has been changed from ‘Healthy and
Productive Water Systems’ to ‘Sustainable Water Management and Supply’. (c) The variation between 2010-11 Budget and 2011-12 Budget is largely due to the
cessation of various projects under the Environmental Contribution Levy 2 program and program carryovers between 2009-10 and 2010-11.
(d) The 2011-12 output grouping name ‘Healthy and Productive Land; Healthy, Productive and Accessible Marine, Coastal and Estuarine Systems; and Flourishing Biodiversity in Healthy Ecosystems’ has been separated into three output grouping names ‘Healthy and Productive Land’, ‘A healthy and resilient natural environment’, and ‘Effective management of fire’.
(e) The variation between 2010-11 Budget and 2011-12 Budget is due to increased funding as a result of the late 2010 and early 2011 floods and the outcomes of the Parks Victoria Financial Sustainability initiative.
(f) The variation between 2010-11 Budget and 2011-12 Budget largely reflects increased revenue and expenditure associated with the Bushbroker Native Vegetation Offsets Program, and additional funding for the Integrated Planning and Building Hazard Mapping and Risk Response program.
(g) The variation between 2010-11 Budget and 2011-12 Budget reflects additional funding for Improved Bushfire Prevention, Preparedness, Response and Recovery.
Service Delivery 2011-12 Sustainability and Environment 371

(h) The 2010-11 output grouping name has been changed from ‘Less waste, Less Pollution; and Clean Air, Liveable Climate’ to ‘Effective adaptation to the impacts of climate change’.
(i) The variation between 2010-11 Budget and 2011-12 Budget is due to the implementation of election commitments, including Business sustainability accreditation program and Energy efficiency rebates for low income households, and an increase in the level of grant payments from the Sustainability Fund and HazWaste fund grants to help industry reductions in hazardous waste (or prescribed industrial waste) and to increase remediation of contaminated soils.
(j) The variation between 2010-11 Budget and 2011-12 Budget is due to the implementation of efficiencies consistent with Government election commitments.
(k) Total output cost for 2011-12 Budget may not equate to the total expense reported in Budget Paper No. 5, Chapter 3 Departmental financial statements due to additional expenses in Budget Paper No. 5 that are not included in departmental output costs.
Amounts availableThe following tables detail the amounts available to the Department from Parliamentary authority and income generated through transactions. Table 3.26 outlines the Department’s income from transactions and Table 3.27 summarises the sources of Parliamentary authority available to the Department to fund the provision of outputs, additions to net asset base and payments made on behalf of the State.
Table 3.26: Income from transactions($ million)
2009-10 2010-11 2010-11 2011-12 Actual Budget Revised BudgetOutput appropriations 1 117.3 1 045.5 1 104.4 1 164.5Special appropriations 3.7 .. .. ..Interest 5.7 4.0 5.8 6.6Sale of goods and services 73.9 31.5 76.0 41.6Grants 67.0 24.1 52.9 96.8Fair value of assets and services received free of
charge or for nominal consideration 0.2 .. .. ..
Other income 249.1 233.5 261.0 305.1Total income from transactions 1 516.9 1 338.6 1 500.1 1 614.6 Source: Department of Sustainability and Environment and Department of Treasury and Finance
Table 3.27: Parliamentary authority for resources($ million)
2010-11 2010-11 2011-12 Budget Revised BudgetAnnual appropriations 1 074.2 1 106.5 1 397.0 Provision of outputs 802.1 901.9 986.9 Additions to the net asset base 242.6 175.0 128.2
372 Sustainability and Environment Service Delivery 2011-12

Payments made on behalf of the State 29.5 29.5 281.9Receipts credited to appropriations 221.0 206.8 184.0Unapplied previous years appropriation 93.5 16.7 110.1 Provision of outputs 53.7 7.1 45.8 Additions to the net asset base 39.8 9.6 64.3Accumulated surplus – previously applied appropriation 0.3 7.6 2.4Gross annual appropriation 1 389.0 1 337.6 1 693.5Special appropriations .. .. ..Trust funds 299.9 396.1 450.1Total parliamentary authority 1 688.9 1 733.7 2 143.6Source: Department of Sustainability and Environment and Department of Treasury and Finance
The following section provides details of the outputs provided to government, including performance measures and costs for each output. Total expenditure for the Department can be found in Budget Paper No. 5, Chapter 3 Departmental financial statements.
Service Delivery 2011-12 Sustainability and Environment 373

Sustainable Water Management and SupplyEffective management of Victoria’s water supply and its quality is fundamental to our economy, society and environment. Issues requiring continued attention include salinity, the health of rivers and estuaries, reliable water supply and water quality and pricing.
These issues cannot be addressed and managed in isolation. Strong partnerships and understanding between all levels of government, the community, major users, water authorities, Catchment Management Authorities and private investors are vital to delivery of healthy and productive water systems.
The Department will work with the Victorian community and organisations to deliver effective water management and allocation, and healthy rivers and aquifers.
This output contributes to the departmental objective of delivering sustainable water management and supply.
Major Outputs/DeliverablesPerformance Measures
Unit of Measure
2011-12 Target
2010-11 Expected Outcome
2010-11 Target
2009-10 Actual
Sustainable Water Management and SupplyThis output develops policies, provides oversight of, and strategic advice on, regulatory systems and institutional arrangements to drive the sustainable management and efficient use of Victoria’s water resources. Key areas include river health, sustainable irrigation, ground and surface water, water reuse and recycling, and water sector agency governance and pricing.
A key component of Sustainable Water Management and Supply is to ensure efficient management and use of water, water industry performance oversight, governance and the availability of information to enable informed decision making. This is intended to ensure a safe, reliable and sustainable supply of water for the future and lead to efficient use of natural resources over the long term.
QuantityCompliance with the Murray Darling Basin Agreement to maintain a balance in the Salinity Register such that the total of salinity credits is in excess of, or equal to, the total of salinity debits
number >0 28.4 >0 19.3
Cumulative water savings realised through water recovery projects
mega litres
609 900 551 900 554 600 439 308
The 2011-12 Target represents the cumulative water savings realised through water recovery projects.
The 2009-10 Actual has been revised downwards following the completion of the annual water savings audit which was completed in November 2010, following the publication of the annual report. The 2009-10 annual report had reported an actual of 507 000 mega litres.
Estimated net reduction in total load of nitrogen and phosphorus in urban and rural water systems
number (tonnes)
17.5 20.1 14.6 11.4
The 2010-11 Expected Outcome and 2011-12 Target are higher than the 2010-11 Target, reflecting a reprioritisation of regional works towards the ‘Length of river where works have been undertaken to stabilise bank erosion’ performance measure due to flooding events, which directly contributes towards the total reduction of phosphorus and nitrogen in the urban and rural water systems.
374 Sustainability and Environment Service Delivery 2011-12

Major Outputs/DeliverablesPerformance Measures
Unit of Measure
2011-12 Target
2010-11 Expected Outcome
2010-11 Target
2009-10 Actual
Expected water savings through water recovery projects currently being implemented
mega litres
58 000 112 592 50 000 144 715
The 2011-12 Target is lower than the 2010-11 Expected Outcome due to most water recovery projects with the exception of the Northern Victorian Irrigation Renewal Project (NVIRP) Stage 1 program, being completed in 2010-11.
The 2010-11 Expected Outcome is higher than the 2010-11 Target due to the revised expectation that water savings from the Shepparton and Central Goulburn 1-4 projects will be realised as part of the 2010-11 water savings audit.
The 2009-10 Actual has been revised downwards following the completion of the annual water savings audit which was completed in November 2010 and following the publication of the annual report. The 2009-10 annual report had reported an actual of 159 700 mega litres.
Length of river where works have been undertaken to stabilise bank erosion
km 127 135 57 163
The 2010-11 Expected Outcome and 2011-12 Target are higher than the 2010-11 Target, reflecting a prioritisation of regional works towards this performance measure due to flooding events.
Length of river where works have been undertaken, or river frontage protected, to improve the vegetation in the streamside zone
km 1 434 1 357 2 126 2 255
The 2010-11 Expected Outcome and the 2011-12 Target are lower than the 2010-11 Target reflecting a reprioritisation of regional works away from the streamside zone to the performance measures of ‘Length of rivers where works have been undertaken to improve instream health’ and ‘Length of river where works have been undertaken to stabilise bank erosion’ to deal with flood response actions in affected catchments.
Length of rivers where works have been undertaken to improve instream health
km 69 87 30 82
The 2010-11 Expected Outcome and the 2011-12 Target are higher than the 2010-11 Target reflecting a reprioritisation of regional works away from the ‘Length of river where works have been undertaken, or river frontage protected, to improve the vegetation in the streamside zone’ to this performance measure and the ‘Length of rivers where works have been undertaken to stabilise bank erosion’ performance measure to deal with flood response actions in affected catchments.
Other Victorian retail water entitlements authoritatively housed in the water register
per cent 65 nm nm nm
New performance measure for 2011-12 to reflect that currently some entitlements are paper based and this work being undertaken will confirm details in the water register so that the register becomes the authoritative record.
Rebates approved for small business for improved water efficiency
number 5 000 nm nm nm
New performance measure for 2011-12 to reflect the new water efficiency rebate program that now includes grants to small business customers.
Rebates approved to households for improved water efficiency in the house and garden
number 30 000 35 000 43 000 36 127
The 2010-11 Expected Outcome is lower than the 2010-11 Target due to reduced advertising of the program prior to the peak rebate uptake period of summer during the caretaker period.
The 2011-12 Target is lower than the 2010-11 Target and 2010-11 Expected Outcome reflecting the new water efficiency rebate program that now includes grants for small business customers.
Service Delivery 2011-12 Sustainability and Environment 375

Major Outputs/DeliverablesPerformance Measures
Unit of Measure
2011-12 Target
2010-11 Expected Outcome
2010-11 Target
2009-10 Actual
Rivers and wetland systems with improved environmental flows being delivered
number 32 20 20 20
This performance measure amends the 2010-11 performance measure of ‘Rivers with improved environmental flow regimes being delivered’. The 2011-12 performance measure is the same as the 2010-11 measure except that it now incorporates the inclusion of wetlands.
Victorian ‘water shares’ authoritatively housed in the water register
per cent 100 nm nm nm
New performance measure for 2011-12 to reflect that currently some entitlements are paper-based and this work being undertaken will confirm details in the water register so that the register becomes the authoritative record.
Water information products delivered for greater accountability in sustainable water resource management
number 5 5 5 5
This performance measure amends the 2010-11 performance measure ‘Water information products delivered to support Government’s priorities for sustainable water management’. The 2011-12 performance measure reflects the 2010-11 measure, however it now better aligns with the Government’s priorities and improves alignment with the Plan for Water.
Quality Bulk water entitlements/environmental entitlements being complied with to ensure security of supply, environmental flows and compliance with caps
per cent 100 100 100 100
Timeliness Statutory obligations of Water Corporations complied with, including annual reports and audits, corporate plans, and exercises under the Terrorism (Community Protection) Act 2003
per cent 100 100 100 93
Cost Total output cost $ million 285.2 356.7 327.7 380.6
The decrease in the 2011-12 Target largely reflects the cessation of various projects under the Environmental Contribution Levy 2 program and program carryovers between 2009-10 and 2010-11.
Source: Department of Sustainability and Environment
376 Sustainability and Environment Service Delivery 2011-12

Healthy and Productive LandVictoria’s public land including its parks, forests and coasts have significant cultural and recreational value and are pivotal in protecting biodiversity values. Victoria’s diverse public land estate also supports tourism and other important industries.
Through this output, the Department is working towards ensuring:
land is productive and is used in a sustainable manner;
infrastructure on public land and in coastal environments is appropriate and well managed;
the condition of marine, coastal and estuarine environments is protected, maintained and improved; and
key biodiversity assets, priority habitats and ecological processes are healthy and secure.
This output contributes to the departmental objective of promoting new standards for protecting the natural environment.
Service Delivery 2011-12 Sustainability and Environment 377

Major Outputs/DeliverablesPerformance Measures
Unit of Measure
2011-12 target
2010-11 expected outcome
2010-11 target
2009-10 actual
Public LandThis output provides for the management of Victoria’s Crown land, including the coast and marine environment. It works towards the improved stewardship of natural, built and historic assets, and incorporates management of public land in partnership with statutory agencies, committees and local government. It recognises the value of a public land estate that can adapt to climate change and cater for community expectations.
The outcomes for public land are to have land managers that are supported with clear policies, legislation and advice, and build opportunities for Indigenous and local community partnerships in public land management.
Quantity Beach protection assets repaired number 2 3 3 5
The 2011-12 Target is lower than the 2010-11 Target and 2010-11 Expected Outcome as a result of initiative funding for this project being reprofiled. This performance measure now appears as a quantity measure rather than a quality measure under the Public Land output.
Crown land leases directly managed by the Department of Sustainability and Environment
number 684 684 684 684
Crown land licenses directly managed by the Department of Sustainability and Environment
number (‘000)
43 43 43 43
Participants in Coast Action/Coastcare activities
number (‘000)
25 25 25 25
Threatened native species and communities for which specifically targeted conservation measures are in place at Royal Botanic Gardens
number 8 15 15 15.5
The 2011-12 Target is lower than the 2010-11 Expected Outcome and 2010-11 Target as initiative funding for the Victorian Conservation Seedbank program, which directly funds part of the overall program for the delivery of conservation measures at the Royal Botanic Gardens, will conclude at the end of 2010-11.
Visitors to Zoos Victoria at Melbourne, Werribee and Healesville
number (million)
1.6 1.3 1.3 1.8
The 2011-12 Target is higher than the 2010-11 Target due to the combination of the Government’s ‘Free entry for under 16s’ policy and a change in the method of calculating the performance measure. The performance measure now includes all visitors including those who enter at no cost.
Quality Publicly elected Committees of Management that have a current statutory appointment
per cent 95 nm nm nm
This performance measure replaces the 2010-11 performance measure of ‘Crown land reserves that have appointed delegated managers’. The 2011-12 performance measure reflects the same activity as the 2010-11 performance measure, however it focuses on the work DSE undertakes to ensure that appointments of land managers are made once the current appointment period of three years has lapsed. It measures the sometimes difficult and or challenging work required to engage the community to take up these roles in an unpaid capacity or to identify an alternative management regime.
378 Sustainability and Environment Service Delivery 2011-12

Major Outputs/DeliverablesPerformance Measures
Unit of Measure
2011-12 target
2010-11 expected outcome
2010-11 target
2009-10 actual
Timeliness Rent reviews of Crown land leases undertaken within specified time frames
per cent 95 95 95 95
Cost Total output cost $ million 125.3 129.6 116.5 133.3
The increase in the 2011-12 Target largely reflects increased funding as a result of the late 2010 and early 2011 Victorian floods.
Forests and ParksThis output provides for the management of Victoria’s state run parks and forests. Through this output, the Department manages the balance between development and protection of natural, cultural and community assets for enjoyment and sustainable use. This output works towards the improved stewardship of Victoria’s parks and forests and incorporates direct and delegated management of public land.
The outcome for forests and parks is the continued enhancement of Victoria’s parks and forests. This outcome is achieved by securing and improving forests and parks habitat, enriching forests and parks biodiversity, and by using forests and parks to support regional wellbeing and wealth creation.
Quantity Number of hectares treated to minimise the impact of pest plants, pest animals and overabundant native animals in parks managed by Parks Victoria
hectares 1 100 nm nm nm
This performance measure replaces the 2010-11 performance measure of ‘Parks managed by Parks Victoria assessed as high priority for weeds and pest control’. The 2011-12 performance measure reflects the same activity as the 2010-11 performance measure, however it more clearly reflects the management activity and effectiveness of the weeds and pest programs.
Number of visits to Parks Victoria managed estate
number (million)
88-92 88.5 88-92 76
Total area of estate managed by Parks Victoria
hectares (‘000)
4 084 4 084 3 970 4 041
Quality Bay assets rated in average to excellent condition
per cent 65-70 68 65-70 66
Level of compliance with environmental regulatory framework for commercial timber operations as required by the Forest Audit Program
per cent 90 nm nm nm
Service Delivery 2011-12 Sustainability and Environment 379

Major Outputs/DeliverablesPerformance Measures
Unit of Measure
2011-12 target
2010-11 expected outcome
2010-11 target
2009-10 actual
This performance measure replaces the 2010-11 performance measure of ‘Commercial timber harvesting operations consistent with timber release plans and wood utilisation plans’. The 2011-12 performance measure reflects the same activity as the 2010-11 performance measure, however the 2010-11 measure related to VicForests, while the 2011-12 measure focuses on the Department as an environmental regulator as directed by the timber industry strategy.
Park assets rated in average to excellent condition
per cent 75-80 80 75-80 78
Recreational facilities in state forests with a life expectancy greater than five years
per cent 70 70 70 75
Cost Total output cost $ million 216.3 207.0 187.4 180.2
The increase in the 2011-12 Target largely reflects increased funding as a result of the Parks Victoria Financial Sustainability initiative.
Source: Department of Sustainability and Environment
380 Sustainability and Environment Service Delivery 2011-12
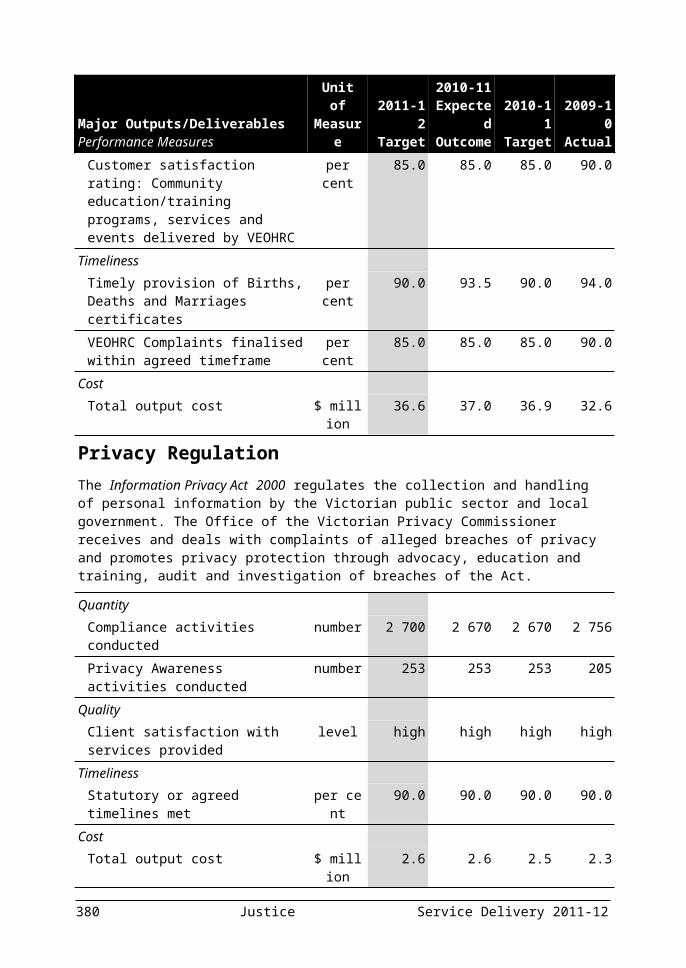
A healthy and resilient natural environmentVictoria’s land, water and biodiversity are under pressure as a result of climate change, a growing population, changing land use patterns, changes to fire regimes, habitat loss and degradation, invasive species and other threatening processes. Native vegetation on private land is still experiencing a net loss in area and quality, with nearly a third of rivers and streams in poor or very poor condition. In addition, more than 1 000 species native to Victoria are known to be threatened with extinction. The Department has developed a number of innovative approaches for protecting natural assets, including the use of market-based instruments such as EcoTender.
This output contributes to the departmental objective of promoting new standards for protecting the natural environment.
Service Delivery 2011-12 Sustainability and Environment 381

Major Outputs/DeliverablesPerformance Measures
Unit of Measure
2011-12 target
2010-11 expected outcome
2010-11 target
2009-10 actual
BiodiversityThe Department works with land managers and a range of other organisations to protect, enhance and restore biodiversity assets, maintain ecological assets and provide for the sustainable use of Victoria’s flora and fauna. The Department also improves the understanding of ecosystem services to better inform land use decisions. The Department also conducts terrestrial and freshwater ecological research to support the management and protection of biodiversity assets across the State.
The outcome is to assist in providing information to land users in maintaining the State’s ecological assets and in providing sustainable use of Victoria’s flora and fauna. This will be achieved through better management and protection of biodiversity assets, giving Victorians a healthier environment to enjoy.
Quantity Native Vegetation Credit Trading Agreements signed through the BushBroker program
number 50 51 45 55
The 2011-12 Target and 2010-11 Expected Outcome are higher than the 2010-11 Target as a result of additional funding made available via the Victorian Desalination Project and fuelbreak offsets.
Quality Presentations made and scientific publications in peer reviewed journals
number 60 61 60 62
Timeliness Game and Wildlife Licence renewals processed by target dates
per cent 96 96 96 98
Planning referrals relating to native vegetation processed within statutory timeframes
per cent 90 75 90 nm
The 2010-11 Expected Outcome is lower than the 2010-11 Target due to refinements made to the system during the first year of the performance measure (2010-11).
Cost Total output cost $ million 88.4 64.5 53.2 46.7
The variation between 2010-11 Budget and 2011-12 Budget largely reflects increased revenue and expenditure associated with the Bushbroker Native Vegetation Offsets program, and additional funding for the Integrated Planning and Building Hazard Mapping and Risk Response program.
382 Sustainability and Environment Service Delivery 2011-12
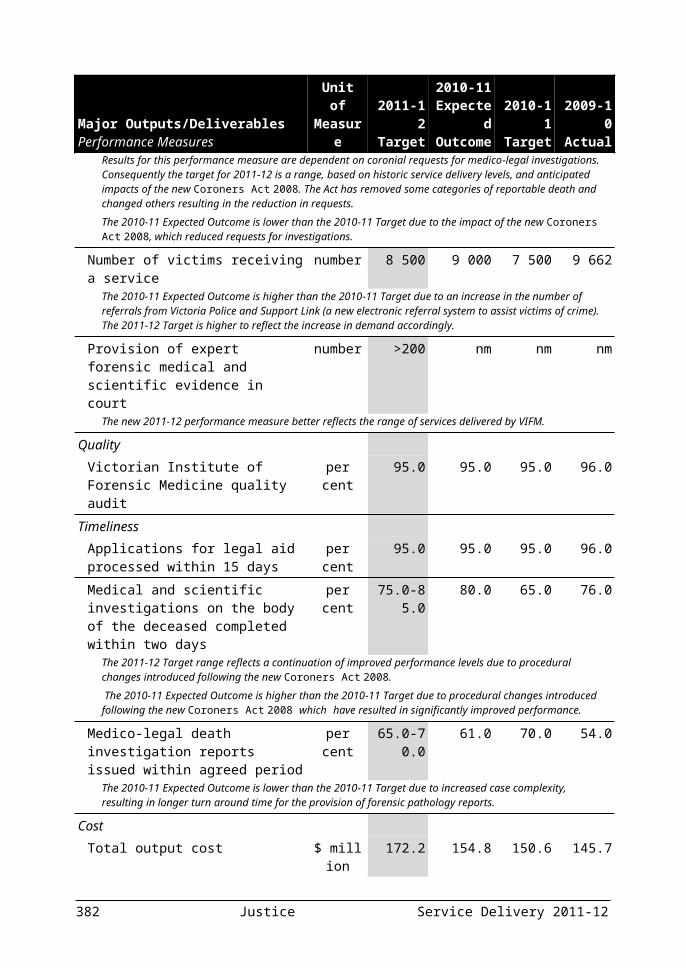
Major Outputs/DeliverablesPerformance Measures
Unit of Measure
2011-12 target
2010-11 expected outcome
2010-11 target
2009-10 actual
Natural ResourcesThis output leads policy and investment in research for the achievement of highly productive and sustainable landscapes. It provides a partnership approach with communities, Catchment Management Authorities, other government agencies and research institutes for improvement in the condition of our state’s natural assets through policy implementation, program design, project investment, monitoring and reporting.
Policy, research and partnering with communities to develop and implement natural asset protection and rehabilitation will improve the condition of our land, water and biodiversity. This will assist to identify and introduce more sustainable land management practices, and contribute to the protection of the natural environment for future generations.
Quantity Area covered by the regional land health projects
hectares (million)
1.42 1.42 1.87 1.90
This performance measure has been amended to replace the 2010-11 wording of ‘regional landscape change projects’ with ‘regional land health projects’. Natural Resources Division allocates a proportion of its budget to the Land Health program which, in turn, invests in regional projects. The terminology being replaced is now outdated and was associated with co-investment in regional projects by Natural Resources Division with now-completed Australian Government investment programs for a broader range of outcomes.The 2010-11 Expected Outcome and 2011-12 Target are lower than the 2010-11 Target due to an over-estimation in the original target based on an incorrect project area size, resulting in an inflated overall target of 1.87 million hectares for 12 months.
Landcare members and community volunteers participating in Landcare activities
number 81 000 81 000 46 000 81 100
This performance measure amends the 2010-11 performance measure of ‘Community members participating in Landcare activities’ to improve the clarity. The annual census conducted by Natural Resources Division measures two categories of participation in Landcare: members who have paid an annual subscription with a Landcare group or network in Victoria, and non-members who volunteer to assist with Landcare activities. The proposed terminology will more specifically describe the participation that is being measured.
The 2010-11 Expected Outcome and the 2011-12 Target are higher than the 2010-11 Target due to a change in reporting to capture all community participants in Landcare activities.
Regional Investment Plans proposing natural resources improvement projects submitted, assessed and recommended to responsible Minister(s) for funding
number 10 10 10 10
This performance measure has been amended to replace the 2010-11 wording of ‘regional catchment investment plans’ with ‘regional investment plans’. The term ‘regional investment plan’ is the currently used term in the Victorian Investment Framework (VIF) to refer to the documentation assembled by catchment management authorities on behalf of their catchment region. The terminology being replaced is now outdated and is associated with previous VIF arrangements.
Service Delivery 2011-12 Sustainability and Environment 383

Major Outputs/DeliverablesPerformance Measures
Unit of Measure
2011-12 target
2010-11 expected outcome
2010-11 target
2009-10 actual
Regional land health projects being implemented
number 15-18 15-18 10 10
This performance measure has been amended to replace the 2010-11 wording of ‘regional landscape change projects’ with ‘regional land health projects’. Natural Resources allocates a proportion of its budget to the Land Health program.
The 2010-11 Expected Outcome and the 2011-12 Target are higher than the 2010-11 Target due to improved accuracy of reporting and accountability of investment, ensuring a better understanding of project effectiveness.
Quality Corporate plans submitted by Catchment Management Authorities are aligned with Ministerial guidelines and template, and meet the requirement of relevant Acts
per cent 100 100 100 70
Regional investment plans align with Government directions
per cent 100 100 100 100
This performance measure has been amended to replace the 2010-11 wording of ‘regional catchment investment plans’ with ‘regional investment plans’. The term ‘regional investment plan’ is currently used in the VIF to refer to the documentation assembled by Catchment Management Authorities on behalf of their catchment region. The terminology that this will replace is now outdated and associated with previous VIF arrangements.
Timeliness All regional investment plans submitted to Minister/s for approval by the prescribed date
date Jun 2012
Jun 2011
Jun 2011
Jul 2010
This performance measure has been amended to replace the 2010-11 wording of ‘regional catchment investment plans’ with ‘regional investment plans’. The term ‘regional investment plan’ is the currently used term in the VIF to refer to the documentation assembled by catchment management authorities on behalf of their catchment region. The terminology being replaced is now outdated and associated with previous VIF arrangements.
Catchment Management Authority corporate plans submitted to the Minister by the prescribed date
number 10 10 10 5
Cost Total output cost $ million 109.0 109.2 121.2 106.6
The decrease in the 2011-12 Target largely reflects changes in the Natural Resources Investment program funding profile.
Source: Department of Sustainability and Environment
384 Sustainability and Environment Service Delivery 2011-12

Effective management of fireThe Department will work with its Networked Emergency Organisation partners (including Parks Victoria, Department of Primary Industries, Department of Planning and Community Development, Melbourne Water and VicForests) to further improve our response to fire risk and make adjustments to land management, fire suppression, planned burning and recovery activities. The Department will also refine how fire management is understood and translated into operational policies and procedures.
Using the additional resources provided to the Department following the 2009 Victorian Bushfires Royal Commission, the Department will increase investment in the development of new management processes, implement an improved training and accreditation framework, enhance information technology and communications systems, secure additional aircraft and improve infrared detection and aircraft dispatch systems, amend command and control arrangements and ensure pre-placement of incident management teams on high fire danger days.
The Department will continue to provide a skilled, professional, experienced and dedicated workforce that delivers firefighting and fire management capability across Victoria.
This output contributes to the departmental objective of reducing the threat of fire.
Major Outputs/DeliverablesPerformance Measures
Unit of Measure
2011-12 target
2010-11 expected outcome
2010-11 target
2009-10 actual
Land and Fire ManagementThis output covers activities under an integrated land and fire management framework, for the effective planning and management of fire across public land.
The outcomes of this work are intended to lead to a reduction in bushfire risk through the use of fuel reduction burning, other fuel management activities and the maintenance of firebreaks to protect communities. This will result in an engaged, informed and fire-ready community. These outcomes are achieved by ensuring that the workforce is effectively trained and prepared for fire suppression events and fuel management activities. Accompanying those efforts is a road network capable of facilitating fire-related activities and providing access to fire agencies, tourists, the general public and the timber industry. Overall, the outcomes of this work will be to deliver the recommendations of the 2009 Victorian Bushfires Royal Commission.
Quantity Bridges and stream crossings to be replaced or repaired to enable safe access for rapid bushfire response, tourism and commercial operators during the current reporting period
number 95 102 100 98
The 2011-12 Target is lower than the 2010-11 Target and 2010-11 Expected Outcome as this is the final year of the program which began in 2008-09 and only 95 bridge and stream crossing remain to be repaired to reach the overall program target of 300.
Service Delivery 2011-12 Sustainability and Environment 385
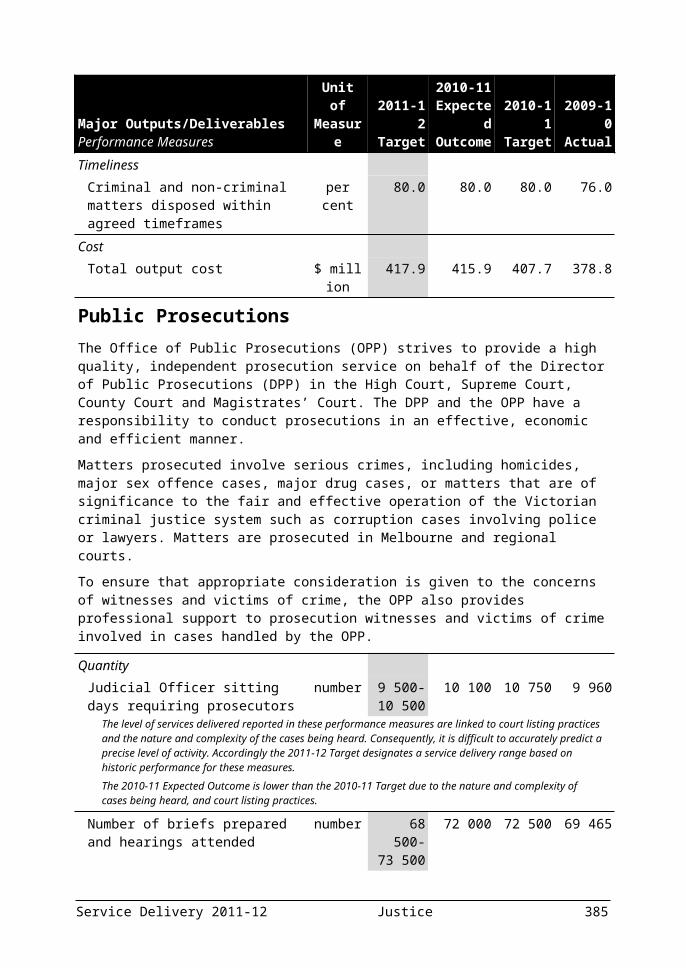
Major Outputs/DeliverablesPerformance Measures
Unit of Measure
2011-12 target
2010-11 expected outcome
2010-11 target
2009-10 actual
Cumulative number of bridges replaced or repaired to enable safe access for rapid bushfire response, tourism and commercial operators
number 300 205 205 103
The 2011-12 Target reflects the total number of bridges replaced or repaired to enable safe access for rapid bushfire response, tourism and commercial operators since the program’s inception in 2008-09.
Fuel reduction burning completed to protect key assets
hectares 225 000 200 000 200 000 146 106
The 2011-12 Target is higher than the 2010-11 Target and 2010-11 Expected outcome in line with the Victorian Bushfire Royal Commission recommendations.
Personnel with accreditation in a fire role
number 1 500 1 500 1 500 1 871
State forests bridges (on Category 1 roads) with documented inspections
per cent 100 100 100 97
State forests roads (Category 1) with documented inspection and maintenance programs
per cent 100 100 100 98
Strategic engagement forums held number 8 nm nm nmThis performance measure replaces the 2010-11 performance measure of ‘Community engagement plans developed and implemented’. The 2011-12 performance measure measures the same activities as the 2010-11 performance measure, however while Community Engagement Plans are still developed each year, the community engagement function is now focussing on strategic engagement forums. These forums bring a range of stakeholders together to share perspectives and facilitate interaction, improving overall levels of understanding, trust and engagement within the community.
Quality Fire controlled at less than five hectares per cent 80 75 75 85
The 2011-12 Target is higher than the 2010-11 Target as a result of additional funding being made available for aircraft flying time, personnel standby and detection measures.
Personnel accredited to serve in a senior capacity (level 2 or 3) in a fire role
number 300 300 230 nm
The 2010-11 Expected Outcome and 2011-12 Target are higher than the 2010-11 Target as a result of previously unaccredited roles having been passed through an accreditation process, bringing online additional Level 2 and 3 officers who now meet accreditation standards.The 2011-12 Target is higher than the 2010-11 Target in line with the Victorian Bushfire Royal Commission recommendations.
Timeliness Assessments of standards of cover completed prior to fire season
date Nov2011
Dec2010
Nov2010
Jan2010
District fire operations plans completed date Oct2011
Oct2010
Oct2010
Oct2009
Fires controlled at first attack per cent 80 75 75 88The 2011-12 Target is higher than the 2010-11 Target as a result of additional funding being made available for aircraft flying time, personnel standby and detection measures.
386 Sustainability and Environment Service Delivery 2011-12

Major Outputs/DeliverablesPerformance Measures
Unit of Measure
2011-12 target
2010-11 expected outcome
2010-11 target
2009-10 actual
Readiness and response plans completed prior to fire season
date Dec2011
Dec2010
Dec2010
Jan2010
Cost Total output cost $ million 325.5 321.9 216.8 275.5
The increase in the 2011-12 Target largely reflects additional funding for improved Bushfire Prevention, Preparedness, Response and Recovery.
Source: Department of Sustainability and Environment
Service Delivery 2011-12 Sustainability and Environment 387

Effective adaptation to the impacts of climate changeClimate change is an evolving policy area for all levels of government. At a national level, the focus is on reducing Australia’s greenhouse gas emissions, helping communities, industries and governments adapt to a changing climate and working with other countries to find a global solution. The Commonwealth Government has a policy to reduce greenhouse gas emissions by at least 5 per cent below 2000 levels by 2020. For State agencies like the Department a key focus is on implementing policies that will be complementary to national action, maximise the potential for the ‘green economy’ in Victoria and help communities and businesses adapt to the impact of climate change.
This output contributes to the departmental objective of adapting to the impacts of climate change.
388 Sustainability and Environment Service Delivery 2011-12

Major Outputs/DeliverablesPerformance Measures
Unit of Measure
2011-12 target
2010-11 expected outcome
2010-11 target
2009-10 actual
Environmental Policy and Climate ChangeThrough this output, the Department leads the development and implementation of strategic, whole of government responses to issues around environmental sustainability and climate change.
A key component of these Environmental Policy and Climate Change outputs is to provide research and information on a range of environmentally efficient and sustainable measures so that communities are better informed about resource usage. The Department also leads research on climate change and the adaptation of mitigation strategies which is intended to encourage better usage of resources leading to a healthier environment for all Victorians to enjoy.
Quantity Major policy papers, strategy reviews or research papers completed
number 7 7 7 7
Total number of councils participating in the Victorian Local Sustainability Accord
number 79 79 72 73
The 2010-11 Expected Outcome and 2011-12 Target are higher than the 2010-11 Target reflecting full participation by councils in the Victorian Local Sustainability Accord.
Cost Total output cost $ million 60.7 51.1 46.8 76.2
The increase in the 2011-12 Target largely reflects increased funding for the implementation of election commitments, including Business sustainability accreditation program and Energy efficiency rebates for low income households.
Statutory Activities and Environment ProtectionThe purpose of this output is to protect, care for and improve beneficial uses of the environment by developing statutory and non-statutory processes, setting and enforcing goals and standards, and undertaking monitoring and research. The monitoring and research activities help ensure that the beneficial uses of water are protected, waste management occurs, noise in the community is managed, contamination of land and groundwater is prevented, better management of air quality is promoted and global air quality issues are addressed. Through collaboration, communication and information programs greater community involvement and ownership of environmental issues are also promoted.
Dedication in delivering the best environmental outcomes for Victoria requires understanding and responding to the changing environment. Outcomes will include reducing local pollution problems, helping clients ensure significant resource efficiency gains and responding to our changing environmental needs.
Quantity Environmental condition research reports issued, improvement tools, guidelines, policies, systems and plans completed and issued
number 54 54 54 59
Service Delivery 2011-12 Sustainability and Environment 389

Major Outputs/DeliverablesPerformance Measures
Unit of Measure
2011-12 target
2010-11 expected outcome
2010-11 target
2009-10 actual
Increase in EPA notices issued for illegal dumping of waste
per cent 15 100 15 nm
The 2010-11 Expected Outcome is higher than the 2010-11 Target as the commencement of the new illegal dumping Striking Force has had a higher and earlier than anticipated impact on notices issued.
Quality Hours during which air quality standards were met, as a proportion of hours in the reporting cycle
per cent 99 99 99 98
Land audits complying with statutory requirements and system guidelines
per cent 90 90 90 94
Notices complied with by due date or escalation in line with Compliance and Enforcement policy
per cent 95 nm nm nm
This performance measure replaces the 2010-11 performance measure of ‘Compliance with statutory requirements, as a proportion of assessments of discharge licences and enforcement notices’. The 2011-12 performance measure is the same as the 2010-11 performance measure except that it better reflects EPA’s risk-based approach to compliance.
Timeliness Pollution incident reports acted on within three days
per cent 92 92 92 94
Statutory actions completed within required timelines
per cent 96 96 96 95
Cost Total output cost $ million 181.1 144.2 143.7 113.2
The increase in the 2011-12 Target largely reflects an increase in the level of grant payments from the Sustainability Fund and HazWaste fund grants to help industry reductions in hazardous waste (or prescribed industrial waste) and to increase remediation of contaminated soils.
Source: Department of Sustainability and Environment
390 Sustainability and Environment Service Delivery 2011-12

Land Administration and Property InformationEffective property markets are of fundamental importance to economic development in Victoria. Trusted systems and information services ensure confidence and security in ownership, property boundaries and valuation. Emerging markets, such as those relating to water, can capitalise on the systems and infrastructure already established in Victoria for management of land transactions.
Service Delivery 2011-12 Sustainability and Environment 391

Major Outputs/DeliverablesPerformance Measures
Unit of Measure
2011-12 target
2010-11 expected outcome
2010-11 target
2009-10 actual
Land Administration and Property InformationThrough this output, the Department is working towards ensuring: confidence in the integrity and efficiency of the property system; accessible and transparent property markets; established and accepted natural resource markets; and comprehensive and accessible spatial information to support planning and decision making.
This output contributes to the departmental objective of promoting new standards for protecting the natural environment, and supports a thriving Victorian economy by providing secure, accurate and guaranteed land administration and information provision services.
Quantity Land dealings registered number
(‘000)760 760 720 742
The 2010-11 Expected Outcome is higher than the 2010-11 Target as a result of increased property dealings during the year. The 2011-12 Target also reflects the higher number of property dealings anticipated during 2011-12.
Maps generated on Land Channel number (‘000)
18 000 17 852 17 000 15 270
The 2010-11 Expected Outcome and 2011-12 Target are higher than the 2010-11 Target as a result of increased public awareness of the service’s availability.
Planning certificates issued number (‘000)
35 35 35 37.7
Proportion of title searches supplied (remotely) online
per cent 96 97 96 97
Reports generated on Land Channel number (‘000)
1 400 1 428 1 100 1 150
The 2010-11 Expected Outcome and 2011-12 Target are higher than the 2010-11 Target as a result of increased public awareness of the service’s availability.
Title searches supplied number (‘000)
2 180 2 180 2 180 2 207
Quality Audited Vicmap digital map base not requiring correction
per cent 97 99 97 99
Properties sold, bought or leased within 10 per cent of valuation
per cent 80 80 80 80
Timeliness Land dealings registered within five days
per cent 95 98 95 99
New titles (subdivisions) created within three weeks
per cent 95 97 95 97
Update transactions for the Vicmap digital map base processed within the required timeframes
per cent 97 99 97 98
392 Sustainability and Environment Service Delivery 2011-12

Major Outputs/DeliverablesPerformance Measures
Unit of Measure
2011-12 target
2010-11 expected outcome
2010-11 target
2009-10 actual
Cost Total output cost $ million 124.1 125.5 132.7 124.9
The decrease in the 2011-12 Target largely reflects the implementation of efficiencies consistent with Government election commitments.
Source: Department of Sustainability and Environment
Service Delivery 2011-12 Sustainability and Environment 393

DEPARTMENT OF TRANSPORT
Departmental mission statement
The Department of Transport and its agencies aim to provide a safe and reliable transport system that contributes to a prosperous, inclusive and environmentally responsible State.
Departmental objectives
The Department of Transport is committed to delivering the Government’s election commitments, which will achieve significant results against the following objectives: efficiency and reliability: facilitate network wide efficient, reliable
and free flowing movement of people and goods. safety: provide a transport system which is safe and continually
improve the safety of the system. economic prosperity: enable efficient access for people and goods to
employment, markets and services. integration: integrate transport and land use planning to reduce the
amount and distance of travel. social inclusion: provide tailored infrastructure and services to
enable people to access opportunities. sustainability: provide effective public transport services and
sustainable travel options to minimise transport’s impact on the environment.
Key strategic priorities for 2011-12The key strategic priorities for the Department in 2011-12 are: improving transport network capacity and efficiency to address
current and future transport demand; improving public transport punctuality and reliability; improving personal safety on the transport network; and improving regional and rural transport infrastructure and services.
Ministerial portfoliosThe Department supports the ministerial portfolios of Public Transport, Roads, and Ports.
394 Transport Service Delivery 2011-12
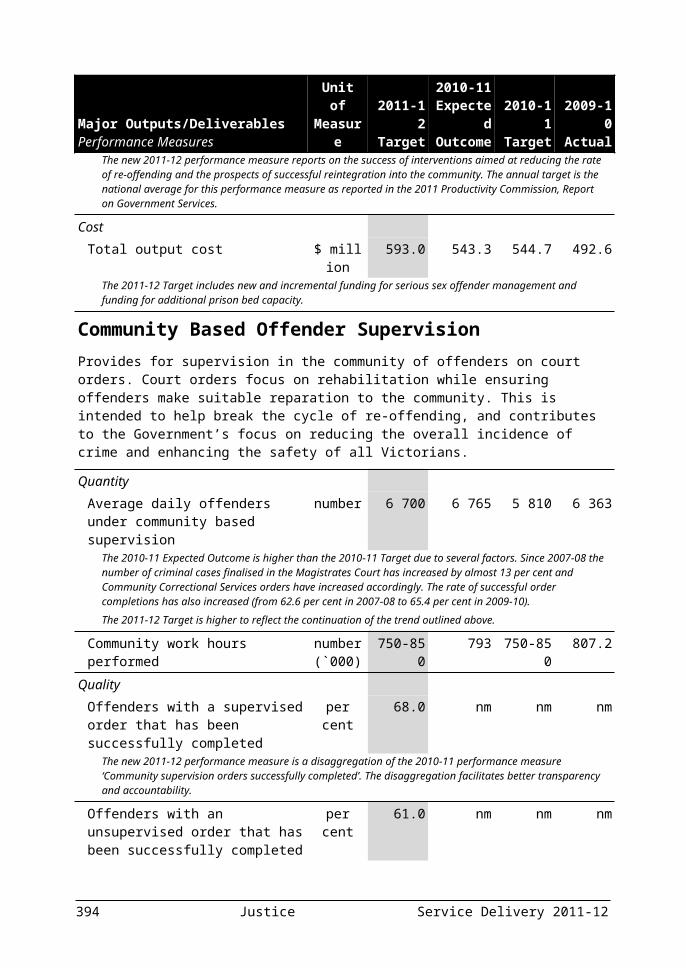
Changes to the output structureThe Department made no changes to its output structure for 2011-12. The following table summarises the Department’s total output cost.
Table 3.28: Output summary($ million)
2010-11 Budget
2010-11 Revised
2011-12 Budget
Variation (a)
%Transport Safety and Security (b) 342.9 325.0 319.6 -6.8Public Transport Services (c) 3 805.6 3 839.8 4 131.3 8.6Integrated Transport Planning Delivery and
Management (d)1 380.6 1 411.0 1 513.0 9.6
Total (e) 5 529.1 5 575.8 5 963.9 7.9Source: Department of Transport
Notes:(a) Variation between 2010-11 Budget and 2011-12 Budget.(b) The 2011-12 Budget primarily reflects a higher proportion of projects being
undertaken as capital works rather than operating activities.(c) The 2011-12 Budget includes funding for new initiatives and expanded services.(d) The 2011-12 Budget includes funding for new initiatives.(e) Total output cost for 2011-12 Budget may not equate to the total expense reported
in Budget Paper No. 5, Chapter 3 Departmental financial statements due to additional expenses in Budget Paper No. 5 that are not included in departmental output costs.
Amounts availableThe following tables detail the amounts available to the Department from Parliamentary authority and income generated through transactions. Table 3.29 outlines the Department’s income from transactions and Table 3.30 summarises the sources of Parliamentary authority available to the Department to fund the provision of outputs, additions to net asset base and payments made on behalf of the State.
Table 3.29: Income from transactions($ million)
2009-10 2010-11 2010-11 2011-12 Actual Budget Revised BudgetOutput appropriations 4 461.5 4 801.9 4 739.4 5 240.1Special appropriations 1.3 2.0 2.0 2.0Interest 4.0 1.4 1.5 1.5Sale of goods and services 507.5 703.2 691.3 744.0Grants 298.5 231.2 269.7 282.5Fair value of assets and services received free of
charge or for nominal consideration 19.9 .. .. ..
Other income 111.9 101.5 134.0 165.7
Service Delivery 2011-12 Transport 395

Total income from transactions 5 404.6 5 841.2 5 837.9 6 435.8Source: Department of Transport and Department of Treasury and Finance
Table 3.30: Parliamentary authority for resources($ million)
2010-11 2010-11 2011-12 Budget Revised BudgetAnnual appropriations 5 606.1 5 508.7 6 120.1 Provision of outputs 4 271.2 4 212.7 4 535.9 Additions to the net asset base 1 334.9 1 296.0 1 584.3 Payments made on behalf of the State .. .. ..Receipts credited to appropriations 942.5 551.3 1 176.3Unapplied previous years appropriation 162.2 670.9 160.7 Provision of outputs 19.3 239.4 25.0 Additions to the net asset base 142.9 431.6 135.7Accumulated surplus – previously applied appropriation 22.5 69.1 10.8Gross annual appropriation 6 733.4 6 800.0 7 467.8Special appropriations 109.5 96.8 2.0Trust funds 728.9 737.4 839.3Total parliamentary authority 7 571.8 7 634.2 8 309.1Source: Department of Transport and Department of Treasury and Finance
The following section provides details of the outputs provided to government, including performance measures and costs for each output. Total expenditure for the department can be found in Budget Paper No. 5, Chapter 3 Departmental financial statements.
396 Transport Service Delivery 2011-12
Transport Safety and SecurityThese outputs will deliver initiatives and regulatory activities that will improve safety on Victoria’s roads, public transport and waterways. These outputs also include activities aimed at maintaining the security of critical transport infrastructure and ensuring the preparedness to respond to emergencies involving this infrastructure.
These outputs will make the transport system safer by reducing the frequency, severity and cost of incidents and accidents and supports the Department’s objective of ensuring safety, health and wellbeing for all transport users.
Major Outputs/DeliverablesPerformance Measures
Unit of Measure
2011-12 Target
2010-11 Expected Outcome
2010-11 Target
2009-10 Actual
Public Transport Safety and RegulationThis output provides programs and initiatives to achieve the highest standards of safety practicable for public transport services in Victoria. Activity in this output includes public transport infrastructure improvements, monitoring compliance with public transport operators’ safety management systems and implementing corrective actions. A safe public transport network is an important part of encouraging greater use, in turn reducing road congestion and transport emissions.
Quantity Audits conducted to identify gaps between currently deemed accredited operators systems and the Bus Safety Act 2009 (Vic) requirements
per cent 20 nm nm nm
The Bus Safety Act 2009 (Vic) (BSA) requires all applicable operators accredited under the Public Transport Competition Act 1995 (Vic) to transition to accreditation under the BSA by 2015. The new performance measure for 2011-12 reflects the five year transition plan by Transport Safety Victoria (TSV) to ensure all operators meet this timeframe.
Existing operators requiring registration under the Bus Safety Act 2009 (Vic) registered within legislative timeframes
per cent 100 nm nm nm
New performance measure as a result of the Bus Safety Act 2009 (Vic) requiring the registration of all existing operators that do not operate commercial or local bus services by 31 December 2011.
Public railway crossings upgraded number 40 20 20 44The higher 2011-12 Target reflects additional funding for level crossing upgrades.
Rail safety audits/compliance inspections conducted in accordance with legislative requirements
number 60 50 50 74
The higher 2011-12 Target reflects the organisation’s capacity to deliver this function.
Quality Bus safety improvement notices addressed within specified timeframes by accredited bus operators
per cent 100 100 100 nm
Service Delivery 2011-12 Transport 397

Major Outputs/DeliverablesPerformance Measures
Unit of Measure
2011-12 Target
2010-11 Expected Outcome
2010-11 Target
2009-10 Actual
Rail safety improvement notices addressed within specified timeframes by accredited rail operators
per cent 100 100 100 100
This performance measure replaces the 2010-11 performance measure ‘Rail safety improvement notices addressed within agreed timeframes by accredited rail operators’. The 2011-12 measure is the same as the 2010-11 measure except that the terminology has been amended for consistency with the Rail Safety Act 2009 (Vic) and measures the same activity as per the performance measure in 2010-11.
Timeliness Applications for bus safety accreditation processed on time
per cent 100 100 100 94
Applications for rail accreditation processed on time
per cent 100 100 100 97
Cost Total output cost $ million 29.1 30.6 29.2 28.1
Additional funding in 2011-12 under the Fix Country Level Crossings initiative is of a capital nature.
Road Safety and RegulationThis output provides a road safety program that incorporates the ‘safe system’ approach with initiatives to improve the safety of roads and roadsides, increase the safety of vehicles on Victoria’s roads and promote safer behaviour from Victoria’s road users. A well designed road network, safer vehicles and safer road users will reduce road incidents and accidents.
Quantity Road Safety projects/initiatives completed: safe roads
number 112 195 226 278
The lower 2011-12 Target is due to a number of larger projects planned in 2011-12.
The 2010-11 Expected Outcome is lower than the 2010-11 Target following a review of project priorities.
Road Safety projects/initiatives completed: safe road users
number 38 95 62 21
The lower 2011-12 Target reflects currently approved projects. The number of projects will likely increase during the year once projects funded under the Motorcycle Levy program are approved.
The 2010-11 Expected Outcome is higher than the 2010-11 Target due to both the completion of projects that were rescheduled from 2009-10 and additional approved projects during the year.
Road Safety projects/initiatives completed: safe vehicles
number 6 24 24 10
The lower 2011-12 Target reflects the number of projects that are expected to be delivered under the existing program in 2011-12.
Quality Road safety projects completed within agreed scope and standards
per cent 100 100 100 100
This performance measure replaces the 2010-11 performance measure ‘Projects completed within agreed scope and standards’. The 2011-12 performance measure is the same as the 2010-11 measure except that it has been reworded to provide clarity on the activity measured and measures the same activity as per the performance measure in 2010-11.
398 Transport Service Delivery 2011-12
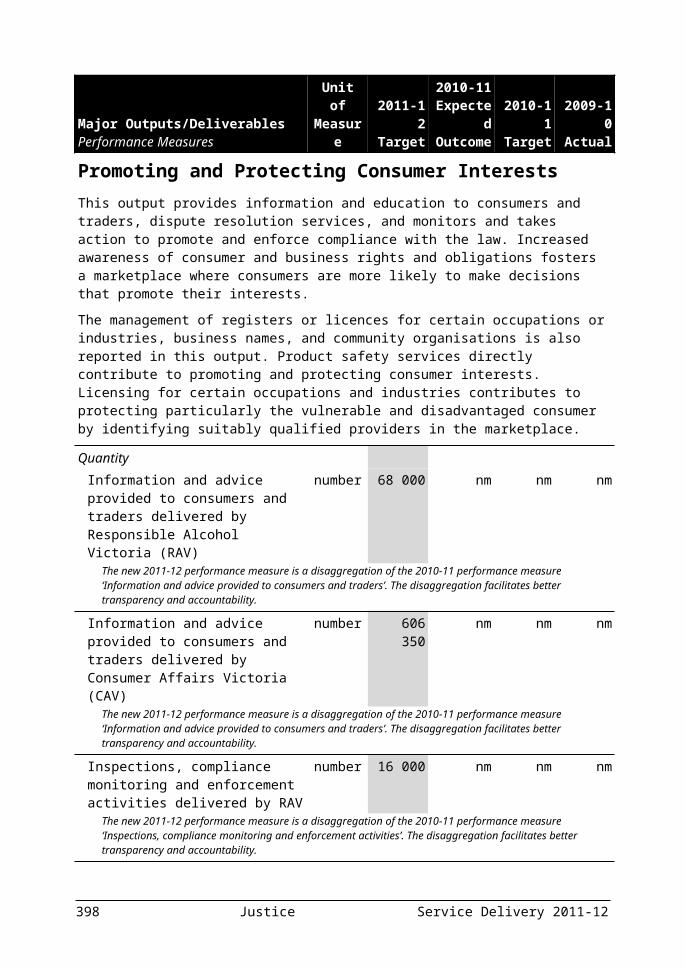
Major Outputs/DeliverablesPerformance Measures
Unit of Measure
2011-12 Target
2010-11 Expected Outcome
2010-11 Target
2009-10 Actual
Timeliness Road safety programmed works completed within agreed timeframes
per cent 100 100 100 78
This performance measure replaces the 2010-11 performance measure ‘Programmed works completed within agreed timeframes’. The 2011-12 performance measure is the same as the 2010-11 measure except that it has been reworded to provide clarity on the activity measured and measures the same activity as per the performance measure in 2010-11.
Cost Total output cost $ million 87.4 98.8 119.7 158.0
The 2011-12 Target and 2010-11 Expected Outcome primarily reflect the higher proportion of road safety projects being undertaken as capital works rather than operating activities.
Vehicle and Driver RegulationThis output provides vehicle registration and driver licensing that ensures vehicles meet minimum safety standards and drivers meet competency requirements. This output also administers, regulates and monitors taxis, hire cars, special purpose vehicles and tow trucks. A roadworthy vehicle fleet and safer road users will reduce road incidents and accidents.
Quantity Calls to the Victorian Taxi Directorate (VTD) call centre
number (‘000)
160 150 >150 nm
The higher 2011-12 Target reflects an increase in calls to VTD as a result of the call centre extending the hours of operation. In addition, public commentary with regards to the Taxi Industry Inquiry is expected to lead to an increased number of calls coming through to VTD.
Driver licences renewed number (‘000)
780 600 560 389
The higher 2011-12 Target reflects the increase in licence renewal volumes due to the additional licence terms available to customers (i.e. 3, 6 and 10 year licences).
New driver licences issued number (‘000)
170 165 153 162
The 2010-11 Target excluded motorcycle licences issued. The 2009-10 Actual, 2010-11 Expected Outcome and 2011-12 Target all include motorcycle licences issued.
New vehicle registrations issued number (‘000)
540 535 500 510
Taxi and hire vehicle inspections number 35 000 39 000 14 500 18 270The 2011-12 Target and 2010-11 Expected Outcome is higher than the 2010-11 Target due to the introduction of a range of issue specific inspections, in addition to the full vehicle inspections. The 2010-11 Target was based only on the full vehicle inspections.
Taxi driver accreditation requests processed
number 4 950 4 300 >4 000 nm
The 2011-12 Target is forecast to increase following the release of additional taxi vehicle licences within the industry.
Vehicle and driver information requests processed
number (‘000)
4 150 4 060 4 800 4 714
The 2010-11 Expected Outcome is lower than the 2010-11 Target due to fewer registration search requests by both road toll operators ConnectEast and CityLink.
Service Delivery 2011-12 Transport 399

Major Outputs/DeliverablesPerformance Measures
Unit of Measure
2011-12 Target
2010-11 Expected Outcome
2010-11 Target
2009-10 Actual
Vehicle registration transfers number (‘000)
810 810 820 812
Vehicle registrations renewed number (‘000)
5 010 4 870 4 870 4 680
Quality Currency of registration and licensing records
per cent 99 99 99 99
Customer satisfaction index: Taxi services
score 66.0 66.0 66.0 56.4
The reported 2009-10 Actual result was based on a different scale. The 2009-10 result calculated using the current scale would be 63.7.
Taxi and hire vehicle complaints assessed
number 3 000 3 100 3 000 3 518
Taxis and hire vehicles conform to quality standards
per cent 85 85 >80 77
The 2011-12 Target reflects an increased focus on full vehicle inspections.
User satisfaction with registration and licensing
per cent >85 90 >85 91
Timeliness Calls answered within 30 seconds in VicRoads call centres
per cent 80 80 80 65
Customers served within 10 minutes in VicRoads licensing and registration offices
per cent 80 80 80 68
Taxi and hire vehicle complaints investigated and closed within 45 days
per cent >85 90 >85 nm
Taxi Industry Inquiry – preliminary report completed
date qtr 4 nm nm nm
The new 2011-12 performance measure reflects the activity and project to be undertaken in 2011-12.
Cost Total output cost $ million 177.9 169.5 170.2 169.7
400 Transport Service Delivery 2011-12
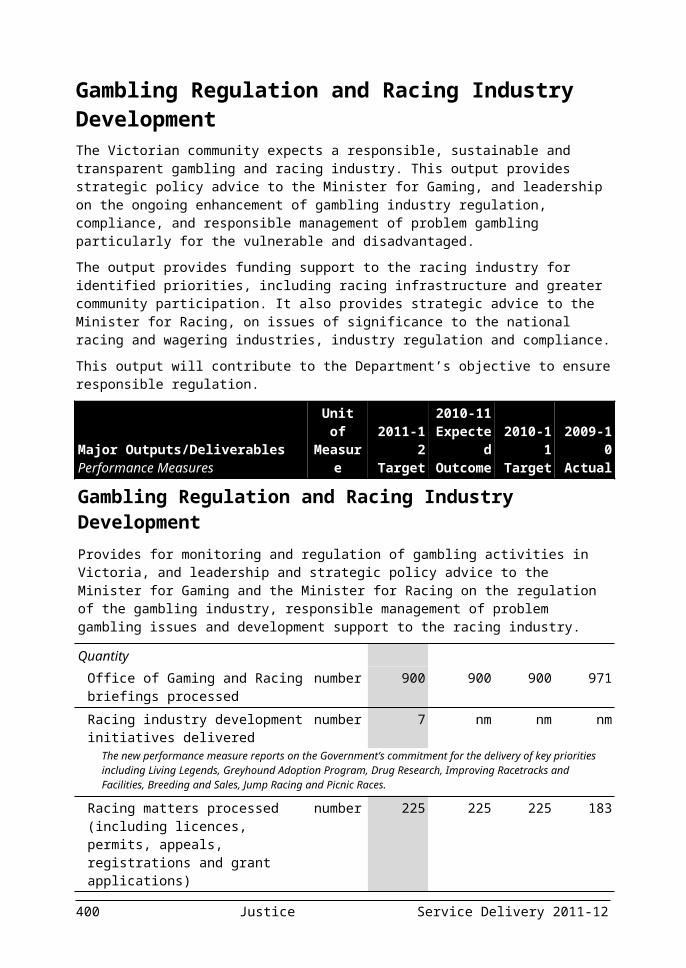
Major Outputs/DeliverablesPerformance Measures
Unit of Measure
2011-12 Target
2010-11 Expected Outcome
2010-11 Target
2009-10 Actual
Marine Safety and RegulationThis output provides a program to administer the policy and regulatory framework for the safe and efficient operation of commercial and recreational vessels in Victoria. Activity in this output includes registration and licensing that ensures vessels meet safety standards and operators meet competency requirements as well as monitoring compliance through rigorous audits and inspections. Safer vessels and safer operators will reduce marine incidents and accidents.
Quantity Commercial registered training organisations and training providers audited
per cent 100 100 100 nm
Commercial vessels requesting annual survey are surveyed
per cent 100 100 100 100
The 2011-12 Target is based on the current marine safety regulations and may change when the Marine Safety Regulations 2011 is implemented.
Delivery of recreational boating safety education seminars
number 25 20 12 nm
The 2011-12 Target and the 2010-11 Expected Outcome are higher than 2010-11 Target due to increasing interest from recreational boating clubs in having customised safety seminars.
Operational safety audits performed on commercial vessels
per cent 15 15 15 15
This performance measure replaces the 2010-11 performance measure ‘Safety audits performed on commercial vessels’. The 2011-12 measure is the same as the 2010-11 measure except that the terminology has been amended for consistency with the Marine Safety Act 2010 (Vic) and measures the same activity as per the performance measure in 2010-11.
The 2011-12 Target is based on the current marine safety regulations and may change when the Marine Safety Regulations 2011 is implemented.
Quality Designated waterways audited to determine compliance with vessel operating and zoning rules
per cent 15 15 15 15
This performance measure replaces the 2010-11 performance measure ‘Designated waterways audited to access adequacy of vessel operating and zoning rules’. The 2011-12 measure is the same as the 2010-11 measure except that the terminology has been amended for consistency with the Marine Safety Act 2010 (Vic) and measures the same activity as per the performance measure in 2010-11.
Cost Total output cost $ million 18.8 19.9 18.1 16.4
The 2010-11 Expected Outcome includes additional one-off marine safety activities approved post 2010-11 Budget.
Service Delivery 2011-12 Transport 401

Major Outputs/DeliverablesPerformance Measures
Unit of Measure
2011-12 Target
2010-11 Expected Outcome
2010-11 Target
2009-10 Actual
Transport and Marine Safety InvestigationsThis output provides independent safety investigations of public transport and marine incidents and accidents to determine causal factors and identify systemic issues. Reviewing, monitoring and acting on these factors and issues will result in safer transport infrastructure and improved transport user behaviour which will reduce incidents and accidents.
QuantityProportion of accidents/incidents involving identified multiple safety system failures investigated
per cent 100 100 100 100
Proportion of notified accidents with passenger fatalities and serious passenger injuries investigated
per cent 100 100 100 100
Timeliness Accidents/incidents assessed within two days of notification to determine need for detailed investigation
per cent 100 100 100 100
Completion of investigations measured against benchmark timeframes
Index 1 0.88 1 0.93
The 2010-11 Expected Outcome is lower than the 2010-11 Target due to a number of investigations requiring extensive research.
Cost Total output cost $ million 2.2 2.1 2.0 1.6
Transport Security and Emergency Management This output provides services and strategic advice to ensure that there is adequate management of security risks to transport services and sufficient capacity and preparedness to respond to emergency situations within the transport sector. These services will ensure continuity of transport services and make the transport system safer for all Victorians.
QuantityContribution to multi agency exercise management and coordinate Department of Transport portfolio involvement
number 3 3 3 3
Coordination of Victorian marine pollution response exercises and incidents
number 2 nm nm nm
New performance measure to better reflect the departmental outcomes and business objectives.
402 Transport Service Delivery 2011-12

Major Outputs/DeliverablesPerformance Measures
Unit of Measure
2011-12 Target
2010-11 Expected Outcome
2010-11 Target
2009-10 Actual
Infrastructure security and emergency management exercises coordinated by Department of Transport consistent with the required standards
number 4 nm nm nm
The new 2011-12 performance measure consolidates the 2010-11 performance measures ‘Major infrastructure security and emergency management exercises coordinated by Department of Transport consistent with the required standards’ and ‘Minor infrastructure security and emergency management exercises coordinated by Department of Transport consistent with the required standards’ into a new measure for 2011-12 called ‘Infrastructure security and emergency management exercises coordinated by Department of Transport consistent with the required standards’.
Quality Implementation plans developed for agreed recommendations in response to infrastructure security and/or emergency management reviews
per cent 100 100 100 100
Monitor all reported marine pollution incidents in accordance with Victorian State Marine Pollution Response Plan
per cent 100 100 100 100
The new performance measure replaces the 2010-11 performance measure ‘Reported marine pollution incidents responded to and resolved in accordance with the Victorian State Marine Pollution Response Plan’. The 2011-12 performance measure is the same as the 2010-11 measure except that it has been reworded to provide clarity on the activity measured and measures the same activity as per the performance measure in 2010-11.
Review of risk management plans of declared essential services for terrorism
per cent 100 90 85 85
Supervision of exercises to test declared essential services risk management plans for terrorism
per cent 100 100 100 100
Timeliness All reported marine pollution response action initiated within one hour of notification of an incident
per cent 100 nm nm nm
This performance measure replaces the 2010-11 performance measure ‘Marine pollution response action initiated within four hours of notification of an incident’. It has been replaced to more accurately reflect the activity measured.
Provide advice to the portfolio ministers on policy issues within required timeframes
per cent 100 100 100 100
Cost Total output cost $ million 4.2 4.1 3.8 3.7
The 2010-11 Expected Outcome includes activities approved post 2010-11 Budget.
Source: Department of Transport
Service Delivery 2011-12 Transport 403

Public Transport ServicesThese outputs oversee the delivery of quality, sustainable and cost effective passenger train, tram and bus services to metropolitan Melbourne and regional Victoria, in partnership with operators and in accordance with contractual arrangements, providing services that are safe, on time and accommodate passengers. These outputs also include the provision of specialist transport services that provide mobility for those unable to use other forms of public transport.
Dependable and accessible public transport services will reduce reliance on private motor vehicles and reduce social exclusion caused by lack of transport options. These outputs support the Department’s objectives to provide an efficient and reliable transport network that supports economic prosperity, social inclusion and environmental sustainability.
Major Outputs/DeliverablesPerformance Measures
Unit of Measure
2011-12 Target
2010-11 Expected Outcome
2010-11 Target
2009-10 Actual
Integrated Metropolitan Public Transport ServicesThis output provides the delivery of quality, sustainable and cost effective passenger train, tram and bus services to metropolitan Melbourne through contractual arrangements with private operators. Dependable and accessible public transport services provide more travel options to Victorians so that they are less reliant on private motor vehicles, which contribute to reducing road congestion and transport emissions.
Quantity Passengers carried: bus services number
(million)106.8 103.1 105.5 102.1
Passengers carried: train services number (million)
256.8 238 226.9 219.3
The 2011-12 Target is based on the most recent growth trends and long-term projections.
Passengers carried: tram services number (million)
189.2 181.2 189.5 175.6
Payments made for: bus services $ million 579 527 542 461The higher 2011-12 Target reflects the full implementation of SmartBus Yellow Orbital Stage 2 and Doncaster Area Rapid Transit Services.
Payments made for: train services $ million 900 830 821 691The higher 2011-12 Target includes additional maintenance funding provided under the Maintaining our Rail Network Fund initiative and the introduction of new rolling stock and additional train services.
Payments made for: tram services $ million 376 356 357 263The higher 2011-12 Target includes funding provided under the Preserve W-Class Trams initiative.
Scheduled services delivered: bus per cent 99.9 99.9 99.9 >99.9
Scheduled services delivered: train per cent 98.0 98.8 98.0 nmScheduled services delivered: tram per cent 98.0 99.2 98.0 nm
Total kilometres scheduled: bus km (million)
108.8 108.8 108.0 101.3
404 Transport Service Delivery 2011-12

Major Outputs/DeliverablesPerformance Measures
Unit of Measure
2011-12 Target
2010-11 Expected Outcome
2010-11 Target
2009-10 Actual
Total kilometres scheduled: train km (million)
21.0 19.7 19.3 18.9
The higher 2011-12 Target reflects the introduction of additional train services.
Total kilometres scheduled: tram km (million)
23.6 23.6 23.3 23.3
W-Class Trams fully restored number 1 nm nm nmNew performance measure for 2011-12 reflects the activity and project to be undertaken in 2011-12.
Quality Customer satisfaction index: bus services
score 77.0 75.0 77.0 69.0
The reported 2009-10 Actual result was based on a different scale. The 2009-10 result calculated using the current scale would be 74.3.
Customer satisfaction index: train services
score 67.0 65.0 65.0 59.6
The reported 2009-10 Actual result was based on a different scale. The 2009-10 result calculated using the current scale would be 62.7.
Customer satisfaction index: tram services
score 72.0 71.0 72.0 69.4
The reported 2009-10 Actual result was based on a different scale. The 2009-10 result calculated using the current scale would be 71.0.
Rolling Stock Management Plan meets specifications in Franchise Agreements for: train services
per cent 100 100 100 100
Rolling Stock Management Plan meets specifications in Franchise Agreements for: tram services
per cent 100 100 100 100
Timeliness Service punctuality for: bus services per cent 95.0 94.0 95.0 94.1
Service punctuality for: train services per cent 88.0 86.0 88.0 nm
Service punctuality for: tram services per cent 77.0 81.6 77.0 nmCost
Total output cost $ million 3 061.7 2 830.1 2 822.8 2 419.0The 2011-12 Target includes additional maintenance funding under the Maintaining Our Rail Network Fund initiative and funding for the introduction of new rolling stock and additional train and bus services. It also reflects increases in the capital asset charge as a result of investments in rail infrastructure projects.
Service Delivery 2011-12 Transport 405

Major Outputs/DeliverablesPerformance Measures
Unit of Measure
2011-12 Target
2010-11 Expected Outcome
2010-11 Target
2009-10 Actual
Rural and Regional Public Transport ServicesThis output provides the delivery of quality, sustainable and cost effective passenger train, coach and bus services to rural and regional Victoria through contractual arrangements with V/Line and private operators. Dependable and accessible public transport services provide more travel options to Victorians so that they are less reliant on private motor vehicles, which contribute to reducing road congestion and transport emissions.
Quantity Passengers carried: regional bus services
number (million)
13.6 13.5 13.5 13.5
Passengers carried: regional train and coach services
number (million)
15.4 14.4 14.0 13.7
The higher 2011-12 Target is based on the most recent growth trends and long-term projections.
Payments made for: regional bus services
$ million 116 113 106 97
The higher 2011-12 Target includes funding for bus service improvements in regional Victoria.
Payments made for: regional train services
$ million 352 313 302 300
The higher 2011-12 Target includes additional maintenance funding provided under the Maintaining our Rail Network Fund initiative and funding for the repair of flood damage.
Scheduled services delivered: regional bus
per cent 99.0 99.0 99.0 99.0
Scheduled services delivered: regional train
per cent 99.0 98.8 99.0 98.5
Total kilometres scheduled: regional bus
km (million)
20.9 20.9 18.9 18.8
The higher 2011-12 Target and 2010-11 Expected Outcome reflects bus service improvements in regional Victoria, particularly in the Geelong area.
Total kilometres scheduled: regional train and coach
km (million)
21.2 21.2 21.5 21.2
Quality Customer satisfaction index: regional coach services
score 80.0 81.0 80.0 75.4
The reported 2009-10 Actual result was based on a different scale. The 2009-10 result calculated using the current scale would be 81.8.
Customer satisfaction index: regional train services
score 80.0 77.0 80.0 74.5
The reported 2009-10 Actual result was based on a different scale. The 2009-10 result calculated using the current scale would be 77.3.
406 Transport Service Delivery 2011-12

Major Outputs/DeliverablesPerformance Measures
Unit of Measure
2011-12 Target
2010-11 Expected Outcome
2010-11 Target
2009-10 Actual
Rolling Stock Management Plan meets specifications in Franchise Agreement for regional train services
per cent 100 100 100 100
This performance measure replaces the 2010-11 performance measure ‘Rolling Stock Management Plan meets specifications in the Franchise Agreement for: V/Line trains’. The 2011-12 performance measure is the same as the 2010-11 performance measure except that it has been reworded to provide clarity on the activity measured and measures the same activity as per the performance measure in 2010-11.
Timeliness Service punctuality for: regional bus services
per cent 99.0 96.9 99.0 98.5
Service punctuality for: regional train services
per cent 92.0 84.4 92.0 85.2
The 2010-11 Expected Outcome is lower than the 2010-11 Target due to a combination of infrastructure and train faults, and congestion on the metropolitan train network.
Cost Total output cost $ million 814.5 757.9 732.3 691.0
The 2011-12 Target includes additional maintenance funding under the Maintaining Our Rail Network Fund initiative and for the repair of flood damage. It also reflects increases in the capital asset charge as a result of investments in rail infrastructure projects.
Specialist Transport ServicesThis output provides programs to improve accessibility to public transport for people with a disability, programs to provide specialist transport services for those unable to use other forms of public transport and provides the delivery of school bus services through contractual arrangements with private operators. Specialist public transport services increase the mobility of Victorians that are transport disadvantaged and reduce dependency on private motor vehicles. This contributes to improving social inclusion.
Quantity Disability Discrimination Act (DDA) compliance for public transport infrastructure: level access tram stops built
number 16 25 20 6
The lower 2011-12 Target reflects the continuation of the current program of level access tram stop projects.
The 2010-11 Expected Outcome is higher than the 2010-11 Target due to better than expected project timelines.
Multi Purpose Taxi Program: passenger only trips
number (‘000)
3 700 3 720 3 700 3 631
Multi Purpose Taxi Program: total members
number (‘000)
155 155 192 nm
The 2011-12 Target and 2010-11 Expected Outcome is lower than the 2010-11 Target due to the removal of inactive members from the Multi Purpose Taxi Program database.
Multi Purpose Taxi Program: with wheelchair trips
number (‘000)
760 750 735 692
Service Delivery 2011-12 Transport 407
Major Outputs/DeliverablesPerformance Measures
Unit of Measure
2011-12 Target
2010-11 Expected Outcome
2010-11 Target
2009-10 Actual
Scheduled school bus services delivered per cent 99.0 99.0 99.0 98.8
Total kilometres scheduled: school bus km (million)
33.5 33.5 33.4 33.5
Timeliness Multi Purpose Taxi Program applications assessed and completed within 10 working days
per cent 95 98 90 88
The higher 2010-11 Target and 2010-11 Expected Outcome is attributable to improved business processes in the Victorian Taxi Directorate to administer the Multi Purpose Taxi Program.
Service punctuality for school bus services
per cent 99.0 99.0 99.0 98.7
Cost Total output cost $ million 255.1 251.8 250.6 240.7
Source: Department of Transport
408 Transport Service Delivery 2011-12

Integrated Transport Planning, Delivery and ManagementThese outputs deliver strategic policy guidance to improve integrated transport and land use planning. Integrated transport and land use planning identifies current and future access needs – for people to employment, goods to markets and services to businesses – and ensures that land use and transport development are coordinated to best address these needs. These outputs deliver strategic transport infrastructure planning, development and improvements to increase the capacity and reliability of the transport system and increase the efficiency of existing transport infrastructure to improve the movement of people, goods and services throughout Victoria. These outputs deliver projects to develop sustainable transport solutions, including promoting sustainable travel modes and increasing the use of public transport. An integrated and sustainable transport system will sustain economic growth and support social inclusion and improved quality of life, while conserving the environment for current and future generations.
These outputs support the Department’s objectives to integrate transport and land use planning and deliver an efficient and reliable transport network that supports economic prosperity, social inclusion and environmental sustainability.
Service Delivery 2011-12 Transport 409

Major Outputs/DeliverablesPerformance Measures
Unit of Measure
2011-12 Target
2010-11 Expected Outcome
2010-11 Target
2009-10 Actual
Integrated and Sustainable Transport DevelopmentThis output provides projects and programs that plan and develop improvements in the transport system. This output also provides for the integration of transport and land use planning to support the concentration of jobs and services closer to where people live, reducing the distance and time Victorians need to access them. This output also implements programs aimed at supporting more sustainable forms of transport. An integrated and sustainable transport system will help reduce reliance on private motor vehicles for transport needs, reduce road congestion and increase trips that are made on public transport, or by walking and cycling.
QuantityCycling projects completed number 20 13 13 17
The higher 2011-12 Target reflects the number of projects that are expected to be delivered under the existing program in 2011-12.
Low Emission Vehicles program: Commercial fleets engaged
number 115 65 65 0
The higher 2011-12 Target reflects the ramping up of the program following the availability of the commercial fleets program framework and tools.
Planning and coordination of transport infrastructure projects in Central Activity Areas
number 7 7 6 6
This performance measure replaces the 2010-11 performance measure ‘Planning and coordination of transport infrastructure projects in Central Activity Districts’. The 2011-12 performance measure is the same as the 2010-11 measure except that the terminology has been amended for consistency and measures the same activity as per the performance measure in 2010-11.
Public transport planning and development: feasibility studies commenced
number 3 1 nm nm
New performance measure reflects the commencement of feasibility studies into rail services to Doncaster, Melbourne Airport, and between Geelong, Ballarat and Bendigo in 2011-12, and the commencement of a feasibility study for Rowville in 2010-11.
Public transport planning and development: planning commenced for new or upgraded railway stations and services
number 8 nm nm nm
New performance measure for 2011-12 to reflect commencement of planning for rail station developments at Balaclava, Ballan, Epsom, Grovedale, Ringwood, Southland, Syndal and Talbot.
Timeliness Avalon airport rail link: commence preliminary design including service planning
date qtr 3 nm nm nm
New performance measure reflects the activity and project to be undertaken in 2011-12.
Avalon airport rail link: identification of preferred option(s)
date qtr 2 nm nm nm
New performance measure reflects the activity and project to be undertaken in 2011-12.
410 Transport Service Delivery 2011-12

Major Outputs/DeliverablesPerformance Measures
Unit of Measure
2011-12 Target
2010-11 Expected Outcome
2010-11 Target
2009-10 Actual
Avalon Jet Fuel Pipeline: finalisation of funding grant agreement
date qtr 3 nm nm nm
New performance measure reflects the activity and project to be undertaken in 2011-12.
Establishment of the Victorian Public Transport Development Authority
date qtr 2 nm nm nm
New performance measure reflects the activity and project to be undertaken in 2011-12.
Low Emission Vehicles Program: Public Report delivered for first year of trial
date qtr 1 nm nm nm
New performance measure to reflect the next phase of the project.
Policy advice including COAG National Reform Agenda provided to agreed timelines
per cent 100 100 100 100
Projects in Central Activity Areas progressed to agreed plans and timeframes
per cent 100 100 100 100
This performance measure replaces the 2010-11 performance measure ‘Projects in Central Activity Districts progressed to agreed plans and timeframes’. The 2011-12 performance measure is the same as the 2010-11 measure except that the terminology has been amended for consistency and measures the same activity as per the performance measure in 2010-11.
West Gate Punt: completion of procurement process including award of tender
date qtr 4 nm nm nm
New performance measure reflects the activity and project to be undertaken in 2011-12.
Cost Total output cost $ million 51.9 39.9 48.5 54.2
The 2011-12 Target includes funding for new planning and feasibility studies.The 2010-11 Target included pedestrian project costs under this output. This is now reported under the Road Network Improvement output.
Public Transport Infrastructure DevelopmentThis output provides capital initiatives that will increase the capacity and efficiency of the public transport network. Dependable and accessible public transport will provide more travel options to Victorians and reduce reliance on private motor vehicles. Victorians who shift their travel from private motor vehicles to public transport will contribute to reducing road congestion and transport emissions.
Quantity Growth Area Stations – completion of design and construction work
per cent 80 40 40 nm
Metro Train – procurement of new rolling stock
per cent 100 60 55 nm
Service Delivery 2011-12 Transport 411

Major Outputs/DeliverablesPerformance Measures
Unit of Measure
2011-12 Target
2010-11 Expected Outcome
2010-11 Target
2009-10 Actual
This performance measure relates to the existing 38 X’Trapolis train sets currently in the delivery phase. A new performance measure titled ‘Metro Trains: new trains for Melbourne commuters: Stage 1 – procurement of seven new train sets – contract awarded’, relating to the procurement of the 40 new metropolitan train sets, has been introduced.
Projects continuing: Country rail services: Mildura
number 1 1 1 1
Public submissions for the Mildura Rail Feasibility Study report closed on 14 March 2011. Analysis of the submissions and further investigation will be undertaken for government consideration.
Regional Rail Link per cent tba tba 12 nmProject timelines are being revised due to cost pressures and re-profiling of Commonwealth funding.
Regional Train – procurement of new Vlocity train rolling stock
per cent 100 70 60 nm
South Morang: construction of Epping Corridor
per cent 90 nm nm nm
New performance measure to reflect the next phase of the project.
South Morang: construction of Hurstbridge Corridor
per cent 50 nm nm nm
New performance measure to reflect the next phase of the project.
Tram – procurement of new rolling stock
per cent 5 nm nm nm
New performance measure reflects the procurement of the 50 new trams based on tram construction and delivery timelines.
Quality myki customer satisfaction score (statewide)
score tba tba 70.0 nm
This project is under review.
The methodology of this measure is identical to previous measure but with unit of measurement to be out of 100 (previously out of 10).
Projects progressed to agreed plans and timeframes
per cent 100 tba 100 63
Timeliness Development of new integrated public transport ticketing solution: complete implementation of metropolitan live operations
date tba tba qtr 2 nm
This project is under review.
Development of new integrated public transport ticketing solution: start regional rail and coach live operations
date tba tba qtr 2 na
This project is under review.
Doncaster Area Rapid Transit (DART): construction works completed for all on-road bus priority treatments
date qtr 4 nm nm nm
412 Transport Service Delivery 2011-12

Major Outputs/DeliverablesPerformance Measures
Unit of Measure
2011-12 Target
2010-11 Expected Outcome
2010-11 Target
2009-10 Actual
New performance measure to reflect the next phase of the project.
Major periodic maintenance works completed against plan: metropolitan train network
per cent 100 100 100 96
Major periodic maintenance works completed against plan: regional train network
per cent 100 95 100 83
This performance measure replaces the 2010-11 performance measure ‘Major periodic maintenance works completed against plan: country passenger rail network’. The 2011-12 performance measure is the same as the 2010-11 performance measure except that it has been reworded to provide clarity on the activity measured and measures the same activity as per the performance measure in 2010-11.
The 2010-11 Expected Outcome is lower than the 2010-11 Target due to flood damage in early 2011.
Major periodic maintenance works completed against plan: tram network
per cent 100 98 100 90
Metrol replacement: existing reporting Train Operation Performance System (TOPS) replaced
date qtr 4 na qtr 3 nm
This performance measure replaces the 2010-11 performance measure ‘Metrol Replacement: existing reporting (TOPS) system replaced’. The 2011-12 performance measure is the same as the 2010-11 performance measure except that it has been reworded to provide clarity on the activity measured and measures the same activity as per the performance measure in 2010-11.The 2011-12 Target and 2010-11 Expected Outcome are based on the revised target completion date due to the change in software delivery method.
Metrol replacement: Train Control and Monitoring System (TCMS) commence operational testing
date qtr 2 nm nm nm
New performance measure to reflect the next phase of the project.
Metropolitan Train Communications System replacement: 50 per cent of on-train equipment installed
date qtr 3 nm nm nm
New performance measure to reflect the next phase of the project.
Metropolitan Train Communications System replacement: commence installation of equipment in train driver cabin
date qtr 2 nm nm nm
New performance measure to reflect the next phase of the project.
Metropolitan Train Communications System replacement: network coverage testing complete
date qtr 1 nm nm nm
New performance measure to reflect the next phase of the project.
Metropolitan Train Communications System replacement: provisional system acceptance
date na na qtr 3 nm
The 2011-12 Target and 2010-11 Expected Outcome reflect the additional time required for software development.This performance measure is expected to be completed by qtr 1 2012-13 due to the revised schedule.
Service Delivery 2011-12 Transport 413

Major Outputs/DeliverablesPerformance Measures
Unit of Measure
2011-12 Target
2010-11 Expected Outcome
2010-11 Target
2009-10 Actual
Metro Trains: new trains for Melbourne commuters: Stage 1 – procurement of seven new train sets – contract awarded
date qtr 2 nm nm nm
New performance measure reflects new funding in the 2011-12 Budget. This is in addition to the existing 38 X’Trapolis train sets currently in the delivery phase.
Regional Rail Link: approval of first alliance proponent by Regional Rail Link Authority Board
date qtr 3 nm nm nm
New performance measure to reflect the next phase of the project.
Regional Rail Link: complete issuing Notices of Acquisition for affected properties in Greenfields corridor
date qtr 4 nm nm nm
New performance measure to reflect the next phase of the project.
SmartBus: Yellow Orbital Stage 2 – Ringwood to Melbourne Airport: completion of on-road bus priority treatments
date qtr 2 na qtr 4 nm
The 2011-12 Target and 2010-11 Expected Outcome reflect the additional time required for the design process.
South Morang: construction complete: Epping Corridor – Operation of duplicated section Keon Park to Epping
date qtr 2 nm nm nm
New performance measure to reflect the next phase of the project.
Sunbury Electrification: construction completed
date qtr 4 nm nm nm
New performance measure to reflect the next phase of the project.
Tram – procurement of new rolling stock: design complete
date qtr 2 nm nm nm
New performance measure to reflect the next phase of the project.
Vigilance Control and Event Recording System (VICERS): commence installation on Siemens fleet
date qtr 4 na qtr 4 na
This performance measure replaces the 2010-11 performance measure ‘Vigilance Control and Event Recording System (VICERS): commence installation on Siemens’. The 2011-12 performance measure is the same as the 2010-11 performance measure except that it has been reworded to provide clarity on the activity measured and measures the same activity as per the performance measure in 2010-11.VICERS installation on Siemens trains to commence after completion of VICERS installation on the X’Trapolis fleet that is planned for qtr 4 2011-12.
Vigilance Control and Event Recording System (VICERS): completion of commissioning on X’Trapolis fleet
date qtr 4 na qtr 4 nm
VICERS installation on the X’Trapolis fleet is expected to commence in qtr 4 2010-11. The completion is not expected until qtr 4 2011-12 because of the need to align the installation schedule with operational train fleet service requirements.
414 Transport Service Delivery 2011-12

Major Outputs/DeliverablesPerformance Measures
Unit of Measure
2011-12 Target
2010-11 Expected Outcome
2010-11 Target
2009-10 Actual
Cost Total output cost $ million 106.5 143.2 143.1 135.9
The 2011-12 Target and 2010-11 Expected Outcome may change as they are subject to the outcome of the Government’s review of myki.
Road Network ImprovementsEnhance the performance of Victoria’s road network to improve access and efficiency by developing road transport links, lowering transport operating costs and upgrading the quality of roads with respect to safety, and delivering cost effective projects to reduce congestion and improve reliability and travel times for all road users including public transport and freight vehicles.
Quantity Bridge strengthening and replacement projects completed: metropolitan
number 3 3 3 2
Bridge strengthening and replacement projects completed: regional
number 23 22 22 11
Bus/tram route and other high occupancy vehicle improvements
number 11 16 16 25
The 2011-12 Target reflects the number of projects that are expected to be delivered under the existing program in 2011-12.
Congestion projects completed number 1 5 2 19The lower 2011-12 Target reflects the number of projects that are expected to be delivered under the existing program in 2011-12.
The 2010-11 Expected Outcome is higher than the 2010-11 Target due to projects which were not originally targeted to be completed in 2010-11, are now expected to be completed in 2010-11.
Local road projects completed: regional number 3 13 18 15The 2011-12 Target and 2010-11 Expected Outcome reflect the number of projects that are expected to be delivered under the existing program in 2011-12.
Major road improvement projects completed: metropolitan
number 1 1 1 2
Major road improvement projects completed: regional
number 1 1 1 0
Other road improvement projects completed: metropolitan
number 6 2 1 6
The 2011-12 Target reflects a rolling program with project durations that span multiple years.
Other road improvement projects completed: regional
number 6 3 4 3
The 2011-12 Target reflects a rolling program with project durations that span multiple years.
Pedestrian projects completed number 7 11 11 17This performance measure is transferred directly from the ‘Integrated and Sustainable Transport Development’ output.
The 2011-12 Target reflects the number of projects that are expected to be delivered under the existing program in 2011-12.
Service Delivery 2011-12 Transport 415

Major Outputs/DeliverablesPerformance Measures
Unit of Measure
2011-12 Target
2010-11 Expected Outcome
2010-11 Target
2009-10 Actual
Transport access site treatments completed by VicRoads
number 43 44 44 45
This performance measure is transferred directly from the ‘Specialist Transport Services’ output.
Quality Road projects completed within agreed scope and standards: metropolitan
per cent 98 98 98 99
Road projects completed within agreed scope and standards: regional
per cent 98 98 98 100
Transport treatments completed within agreed scope or standards
per cent 100 100 100 78
This performance measure is transferred directly from the ‘Specialist Transport Services’ output.
Timeliness Peninsula Link: major design and construction milestones reviewed and reported
per cent 100 100 100 100
Programmed transport access works completed within agreed timeframes
per cent 100 100 100 100
This performance measure is transferred directly from the ‘Specialist Transport Services’ output.
Programmed works completed within agreed timeframes: metropolitan
per cent 95 95 95 100
Programmed works completed within agreed timeframes: regional
per cent 95 95 95 100
Cost Total output cost $ million 789.0 712.4 733.2 721.3
The 2011-12 Target includes higher depreciation costs and other expenses relating to capital projects.
Road Asset ManagementThis output provides programs to maintain the quality of Victoria’s road network. This includes resurfacing damaged pavements, ensuring the integrity of bridges and maintaining roadsides. These activities improve the safety and reliability of the road network for all road users, including on road public transport and freight carriers.
QuantityBridges maintained: metropolitan number 909 898 898 902
Bridges maintained: regional number 2 249 2 235 2 235 2 238
Pavement resurfaced: metropolitan m2 (‘000)
1 500 1 959 1 959 1 945
The lower 2011-12 Target for metropolitan pavement resurfaced reflects the current needs between metropolitan and regional roads across the Victorian network, with increased coverage for regional roads due to flood damage.
Pavement resurfaced: regional m2 (‘000)
10700 10 248 10 248 9 007
416 Transport Service Delivery 2011-12

Major Outputs/DeliverablesPerformance Measures
Unit of Measure
2011-12 Target
2010-11 Expected Outcome
2010-11 Target
2009-10 Actual
Road network maintained: metropolitan
lane-km 11 714 11 391 11 391 11 391
Road network maintained: regional lane-km 41 549 41 480 41 480 41 480
Quality Bridges that are acceptable for legal load vehicles: metropolitan
per cent 99.6 99.6 99.6 99.6
Bridges that are acceptable for legal load vehicles: regional
per cent 99.6 99.5 99.5 99.5
Proportion of distressed road pavements: metropolitan
per cent 7.1 nm nm nm
New performance measure is proposed to replace the 2010-11 performance measure ‘Proportion of travel on smooth roads: metropolitan’. It has been replaced to more accurately reflect the actual condition of road pavement.
Proportion of distressed road pavements: regional
per cent 6.6 nm nm nm
New performance measure is proposed to replace the 2010-11 performance measure ‘Proportion of travel on smooth roads: regional’. It has been replaced to more accurately reflect the actual condition of road pavement.
Timeliness Annual road maintenance program completed within agreed timeframes: metropolitan
per cent 100 100 100 100
This performance measure replaces the 2010-11 performance measure ‘Annual maintenance program completed within agreed timeframes: metropolitan’. The 2011-12 performance measure is the same as the 2010-11 measure except that it has been reworded to provide clarity on the activity measured and measures the same activity as per the performance measure in 2010-11.
Annual road maintenance program completed within agreed timeframes: regional
per cent 100 100 100 100
This performance measure replaces the 2010-11 performance measure ‘Annual maintenance program completed within agreed timeframes: regional’. The 2011-12 performance measure is the same as the 2010-11 measure except that it has been reworded to provide clarity on the activity measured and measures the same activity as per the performance measure in 2010-11.
Cost Total output cost $ million 490.0 434.0 383.5 380.4
The 2011-12 Target and 2010-11 Expected Outcome include funding for the repair of flood damage. In addition the 2011-12 Target includes funding under the Country Roads and Bridges initiative.
Service Delivery 2011-12 Transport 417
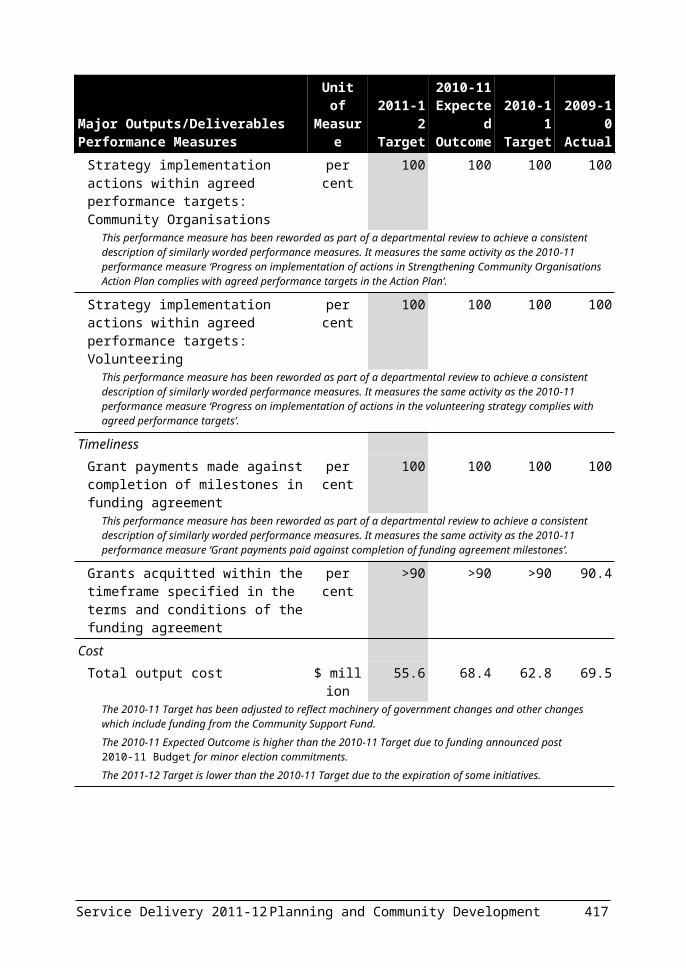
Major Outputs/DeliverablesPerformance Measures
Unit of Measure
2011-12 Target
2010-11 Expected Outcome
2010-11 Target
2009-10 Actual
Freight, Logistics, Ports and Marine DevelopmentThis output provides strategic freight infrastructure improvements, regulations and policy to improve the efficiency and safety of the freight and logistics sector, including road and rail based freight and Victoria’s ports and marine environment. This output delivers activities to concentrate freight activities into freight activity centres, reduce barriers to moving freight on rail and reduce the environmental and social impacts caused by the movement of freight. Increasing the concentration, efficiency and accessibility of the freight network will reduce freight movements on local roads, increase the amount of freight carried by rail and maintain the competitiveness of Victoria’s ports and industry.
Quantity Altona/Laverton Intermodal Terminal works
per cent 100 50 50 25
Number of accessible local ports number 14 14 14 nmRoad-based freight accessibility and reliability improvement projects completed
number 2 1 1 11
The higher 2011-12 Target reflects a rolling program with project durations that span multiple years.
South West Passing Loop works completed
per cent 20 nm nm nm
New performance measure reflects the activity and project to be undertaken in 2011-12.
Quality Road-based freight accessibility and reliability projects completed within specified scope and standards
per cent 100 100 100 100
Timeliness Road-based freight accessibility and reliability projects completed within agreed timeframes
per cent 100 100 100 100
Cost Total output cost $ million 75.6 81.5 72.4 64.5
Variance between the 2010-11 Target, the 2010-11 Expected Outcome and the 2011-12 Target reflects changes in initiative funding over this period including for the Rail Freight Support Package and Sand Management at Lakes Entrance initiative.
Source: Department of Transport
418 Transport Service Delivery 2011-12

DEPARTMENT OF TREASURY AND FINANCE
Departmental mission statementThe Department of Treasury and Finance’s mission is to provide leadership in economic, financial and resource management.
Departmental objectives The Department has three objectives, which guide its policy directions: sound financial management of the State’s fiscal resources with an
emphasis on maintenance of a substantial budget surplus; guide government actions to best increase living standards for all
Victorians; and champion an integrated whole of government ‘value for money’
approach to ensure optimal service delivery and the provision of world class infrastructure to benefit all Victorians.
Key strategic priorities for 2011-12In addition to focusing on the delivery of its objectives during 2011-12, the Department will place additional emphasis on the following priorities: leading financial reform across the public sector; improving Victoria’s productivity through greater competition,
lower business costs and more efficient regulation; increasing the use of market based solutions across the Victorian
economy; facilitating continued improvement in the planning and delivery of
major projects undertaken across Government; and continual improvement to maintain the Department’s high quality
advice to Government.
Ministerial portfoliosThe Department supports the ministerial portfolios of Treasurer, Assistant Treasurer and Finance.
Changes to the output structureThe Department has not made any changes to its output structure for 2011-12.
Service Delivery 2011-12 Treasury and Finance 419

The following table summarises the Department’s total output cost.
Table 3.31: Output summary($ million)
2010-11 Budget
2010-11 Revised
2011-12 Budget
Variation (a)
%Strategic Policy Advice (b) 46.9 48.2 37.9 -19.2Financial Management Services (c) 19.0 30.8 21.1 11.1Risk Management Services (d) 20.7 20.7 23.9 15.5Resource Management Services (e) 64.4 74.4 52.9 -17.9Regulatory Services 21.2 21.9 21.1 -0.5Revenue Management Services (f) 64.4 64.9 82.4 28.0Total (g) 236.6 260.9 239.3 1.1Source: Department of Treasury and Finance
Notes:(a) Variation between 2010-11 Budget and 2011-12 Budget. (b) The 2011-12 Budget decrease reflects the reduction in funding for the Council of
Australian Government’s National Partnership Agreement to implement the Seamless Economy National Partnership Project.
(c) The 2011-12 Budget increase reflects the transfer of the Housing Registrar to the Department and the internal reallocation of resources for the implementation of the State Resource Information Management System.
(d) The 2011-12 Budget increase reflects the improving the planning, management and delivery of infrastructure projects initiative to be undertaken by the Department.
(e) The 2011-12 Budget decrease is due to the lower output funding required for the implementation of the Efficient Technology Services initiative.
(f) The 2011-12 Budget increase reflects the bi-annual purchase of municipal valuations resulting in higher amortisation expense in the second year as well as additional funding received for the enhanced tax compliance initiative.
(g) Total output cost for 2011-12 Budget may not equate to the total expense reported in Budget Paper No. 5, Chapter 3 Departmental financial statements due to additional expenses in Budget Paper No. 5 that are not included in departmental output costs.
Amounts availableThe following tables detail the amounts available to the Department from Parliamentary authority and income generated through transactions. Table 3.32 outlines the Department’s income from transactions and Table 3.33 summarises the sources of Parliamentary authority available to the Department to fund the provision of outputs, additions to net asset base and payments made on behalf of the State.
420 Treasury and Finance Service Delivery 2011-12

Table 3.32: Income from transactions($ million)
2009-10 2010-11 2010-11 2010-11 2011-12 Actual Budget Adjusted (a) Revised BudgetOutput appropriations 280.5 234.8 235.7 254.5 240.8Special appropriations .. .. 49.4 49.4 109.6Interest 15.6 12.5 13.9 13.4 14.6Sale of goods and services 105.4 94.5 94.5 123.4 135.1Grants 2.0 .. .. .. ..Fair value of assets and services received free of charge or for nominal consideration
2.9 .. .. .. ..
Other income 15.6 24.3 24.0 28.4 28.4Total income from transactions 422.0 366.1 417.6 469.2 528.5 Source: Department of Treasury and Finance
Note:(a) The 2010-11 Adjusted estimates include the 2010-11 Budget adjusted for
machinery of government changes.
Table 3.33: Parliamentary authority for resources
($ million) 2010-11 2010-11 2010-11 2011-12 Budget Adjusted (a) Revised BudgetAnnual appropriations 2 781.5 2 782.4 2 395.9 3 048.5 Provision of outputs 227.0 227.9 223.6 235.1 Additions to the net asset base 21.7 21.7 60.2 30.1 Payments made on behalf of the State 2 532.8 2 532.8 2 112.1 2 783.3Receipts credited to appropriations 5.2 5.2 5.9 5.7Unapplied previous years appropriation 14.5 14.5 27.2 .. Provision of outputs 2.6 2.6 9.5 .. Additions to the net asset base 11.9 11.9 12.5 .. Payments made on behalf of the State .. .. 5.2 ..Accumulated surplus – previously applied
appropriation 3.9 3.9 20.8 1.2
Gross annual appropriation 2 805.1 2 806.0 2 449.8 3 055.4Special appropriations 2 167.0 2 216.4 2 229.5 3 778.1Trust funds 2 397.2 2 398.7 2 528.5 2 228.7Total parliamentary authority 7 369.3 7 421.1 7 207.8 9 062.2Source: Department of Treasury and Finance
Note:(a) The 2010-11 Adjusted estimates include the 2010-11 Budget adjusted for
machinery of government changes.
The following section provides details of the outputs provided to government, including performance measures and costs for each output. Total expenditure for the Department can be found in Budget Paper No. 5, Chapter 3 Departmental financial statements.
Service Delivery 2011-12 Treasury and Finance 421

422 Treasury and Finance Service Delivery 2011-12

Strategic Policy AdviceThese outputs provide strategic policy advice to Ministers on all aspects of Government activity. This includes advice on:
the State’s overall financial and aggregate budget strategy;
taxation policy;
the State’s insurance schemes;
accounting policies and performance management;
economic, social and environmental monitoring and analysis;
managing various state based taxes;
financial accounting and reporting;
strategic research focusing on developing greater understanding of factors affecting long term living standards for Victorians; and
intergovernmental financial analysis and advice in relation to the level of Commonwealth funding to the States and Territories.
By assisting the Government’s strategic policy decisions, these outputs contribute to the Departmental objectives of:
sound financial management of the State’s fiscal resources with an emphasis on maintenance of a substantial budget surplus; and
guiding Government actions to best increase living standards for all Victorians.
Major Outputs/DeliverablesPerformance Measures
Unit of Measure
2011-12 Target
2010-11 Expected Outcome
2010-11 Target
2009-10 Actual
Financial and Resource Management FrameworksThis output develops and maintains cohesive financial and resource management frameworks that drive sound financial and resource management practices within the Victorian Public Sector. This includes: leading, coordinating and implementing public finance reforms; ensuring compliance with legislative requirements and endorsed reforms; and advising Government and key stakeholders on compliance, accounting policy, resource management and tax issues.
Quantity Annual review of whole of government compliance framework
number 1 1 1 1
Coordinating reporting requirements in relations to GST Determinations and Auditor-General Reports
number 5 5 5 5
Delivery of updates, guides and newsletters
number 10 16 16 17
The lower 2011-12 Target reflects the increased use of web-based information dissemination as opposed to newsletter-style information sharing.
Service Delivery 2011-12 Treasury and Finance 423

Major Outputs/DeliverablesPerformance Measures
Unit of Measure
2011-12 Target
2010-11 Expected Outcome
2010-11 Target
2009-10 Actual
Major resource management policy reviews and refinements
number 2 2 2 2
Quality Material and adverse whole of government issues identified by Victorian Auditor-General’s Office and Australian Taxation Office requiring rectification that are addressed
per cent 100 100 100 100
Service Provision Rating (Ministerial survey data)
per cent 80 80 80 81.3
Timeliness Compliance assurance reports report
datesBy end
Aug 2011By end
Feb 2012
31 Aug 2010
3 Mar 2011
By end Aug 2010
By end Feb 2011
26 Aug 2009
22 Feb 2010
The 2010-11 Expected Outcome differs to the 2010-11 Target due to delays in completing a report.
Cost Total output cost $ million 5.0 4.8 4.3 4.1
The 2011-12 Target is higher than the 2010-11 Target due to the internal reallocation of resources for financial reform activities.
Budget and Financial Policy AdviceThis output provides strategic, timely and comprehensive analysis and advice to Ministers, Cabinet and Cabinet Sub-Committees on resource allocation, departmental financial, output and asset delivery performance to support the Government in making decisions on the allocation of the State’s fiscal resources. The output also provides public sector industrial relations advice to Ministers with the aim of facilitating cooperative, flexible and productive public sector workplaces. This is intended to assist Government to deliver responsible budgets and operating surpluses.
Quantity Budget and financial policy advice through Ministerial briefs, Budget and Expenditure Review Committee and Cabinet and Sub-Committee briefs
number 1 250 2 000 1 700 1 930
This performance measure replaces the 2010-11 performance measure ‘Budget and financial policy advice through Ministerial briefs, Expenditure Review Committee and Cabinet and Sub Committee briefs’. It has been amended to reflect the new Government’s budget process.The lower 2011-12 Target is based on the expected number of briefings required.
The 2010-11 Expected Outcome is higher than the 2010-11 Target due to additional briefings required as part of the 2010 election process.
Output Evaluation and Price Reviews number 3 3 3 2
424 Treasury and Finance Service Delivery 2011-12

Major Outputs/DeliverablesPerformance Measures
Unit of Measure
2011-12 Target
2010-11 Expected Outcome
2010-11 Target
2009-10 Actual
Quality Service Provision Rating (Ministerial survey data)
per cent 80 80 80 97.5
Timeliness Delivery of Output Evaluation and Price Review Reports within agreed timeframes
per cent 100 100 100 100
Delivery of output performance and asset investment performance reports within agreed timeframes
per cent 100 100 100 100
Cost Total output cost $ million 12.3 11.8 11.6 11.4
The 2011-12 Target is higher than the 2010-11 Target due to the machinery of government changes that resulted in the transfer of public sector industrial relations to the Department.
Economic and Financial PolicyThis output provides strategic policy advice to Government on a range of current economic and financial policy issues, including:
advice on medium and longer-term strategies to strengthen productivity, participation and the State’s overall competitiveness;
research and advice on key economic, social and environmental policy and infrastructure issues;
advice in relation to State revenue policy, insurance policy, and intergovernmental financial relations;
production of the economic and revenue estimates that underpin the State Budget; and
advice on best practice regulatory frameworks for the delivery of whole of government red tape reduction objectives.
Quantity Briefings on Cabinet Submissions number 200 170 250 447
The lower 2011-12 Target is based on the expected number of briefings required. The 2010-11 Expected Outcome is lower than the 2010-11 Target due to no briefings being prepared during the 2010 election caretaker period.
Number of written Ministerial briefs number 300 280 400 359The lower 2011-12 Target is based on the expected number of briefings required. The 2010-11 Expected Outcome is lower than the 2010-11 Target due to no briefings being prepared during the 2010 election caretaker period.
Program of long-term research projects completed
number 10 10 10 11
Service Delivery 2011-12 Treasury and Finance 425

Major Outputs/DeliverablesPerformance Measures
Unit of Measure
2011-12 Target
2010-11 Expected Outcome
2010-11 Target
2009-10 Actual
Quality Accuracy of estimating State taxation revenue
per cent =<5.0 =<5.0 =<5.0 4.3
Service provision rating (Ministerial survey data)
per cent 80 80 80 85
Timeliness Briefings on key Australian Bureau of Statistics economic data on day of release
per cent 100 100 100 100
Long-term research projects managed on time
per cent 100 100 100 100
Meet financial reporting deadlines per cent 100 100 100 100
Response to correspondence within agreed deadlines
per cent 80 80 80 84
Cost Total output cost $ million 20.6 31.6 31.0 35.9
The 2011-12 Target is lower than the 2010-11 Target due to the reduction in funding for the Council of Australian Government’s National Partnership Agreement to implement the Seamless Economy National Partnership Project.
Source: Department of Treasury and Finance
426 Treasury and Finance Service Delivery 2011-12

Financial Management ServicesThese outputs provide financial management services to departments, agencies, Government Business Enterprises (GBEs) and Registered Housing Agencies. These services include:
managing and forecasting cash balances and central Government cash transactions;
the management of the liabilities of Victoria’s public sector superannuation schemes;
monitoring the performance of GBEs;
preparing the State’s consolidated financial and budget related reports;
providing financial risk management and advice to manage the State’s financial risks;
reviewing and analysing the performance of departments, with a focus on delivering value for money services to the community; and
reviewing Registered Housing Agencies.
By assisting Government to make sound and informed financial management decisions, these outputs contribute to the Departmental objective of sound financial management of the State’s fiscal resources with an emphasis on maintenance of a substantial budget surplus.
Major Outputs/DeliverablesPerformance Measures
Unit of Measure
2011-12 Target
2010-11 Expected Outcome
2010-11 Target
2009-10 Actual
Financial ReportingThis output maintains the integrity of systems and information for financial planning, management, monitoring and reporting of the State of Victoria with respect to:
publication of the State Budget and budget related documents;
reporting, monitoring and publication of financial and non financial performance in the Victorian Public Sector; and
management of the daily cash requirements including investments and borrowings of the Public Account.
Quantity Acceptable (no material weaknesses in financial systems and reporting) Financial Report for the State of Victoria and Estimated Financial Statements audit opinions by the Auditor-General
number 2 2 2 2
Estimates reporting – Budget and Budget Update
number 2 3 3 2
This performance measure replaces the 2010-11 performance measure ‘Estimates reporting – Budget, Budget Update and Pre-Election Budget Update’ to reflect the exclusion of the Pre-Election Budget Update, which is only required during an election year.
The lower 2011-12 Target reflects the exclusion of the Pre-Election Budget Update.
Service Delivery 2011-12 Treasury and Finance 427

Major Outputs/DeliverablesPerformance Measures
Unit of Measure
2011-12 Target
2010-11 Expected Outcome
2010-11 Target
2009-10 Actual
Financial Performance Reporting – Annual Financial Report, Mid-Year Financial Report and Quarterly Financial Reports
number 6 6 6 6
Quality Service Provision Rating (Ministerial survey data)
per cent 80 80 80 85
Timeliness Annual Budget published by date agreed by Treasurer
date May 2012
May 2011
May 2011
4 May 2010
Budget Update date 15 Dec 2011
21 Dec 2010
15 Dec 2010
26 Nov 2009
The 2010-11 Expected Outcome differs from the 2010-11 Target as the first sitting day of the new Parliament was 21 December 2010.
Daily management of the Public Account bank account and set-off pool balances
daily daily daily daily daily
Financial Report for the State of Victoria report date
15 Oct 2011
16 Sep 2010
30 Sep 2010
14 Oct 2009
The 2011-12 Target differs to the 2010-11 Target to reflect the legislative tabling date.
Mid-Year Financial Report report date
15 Mar 2012
15 Mar 2011
15 Mar 2011
11 Mar 2010
Quarterly Financial Reports report date
15 Oct 2011
15 Nov 2011
15 Mar 2012
15 May 2012
15 Oct 2010
21 Dec 2010*
15 Mar 2011
3 May 2011
15 Oct 2010
15 Nov 2010
15 Mar 2011
15 May 2011
14 Oct 2009
11 Nov 2009
11 Mar 2010
4 May 2010
*The 2010-11 Expected Outcome differs from the 2010-11 Target as the first sitting day of the new Parliament was 21 December 2010.
Cost Total output cost $ million 13.7 13.2 12.6 12.3
The 2011-12 Target is higher than the 2010-11 Target due to the internal reallocation of resources for the implementation of the State Resource Information Management System.
428 Treasury and Finance Service Delivery 2011-12

Major Outputs/DeliverablesPerformance Measures
Unit of Measure
2011-12 Target
2010-11 Expected Outcome
2010-11 Target
2009-10 Actual
GBE Performance Monitoring and Financial Risk ManagementThis output monitors and provides advice on the financial and operational performance of Government Business Enterprises (GBEs) and Registered Housing Agencies. It develops and implements a prudential risk management and reporting framework in respect of public financial corporations (PFCs) and strategies to manage the State’s financial risks. It oversees policy and strategies to manage the State’s investment borrowing and unfunded superannuation obligations and the management of the associated risks. It produces budget and financial reporting data for the public non-financial corporation (PNFC) and PFC sectors.
Quantity Annual review of registered housing agencies
number 40 nm nm nm
This performance measure has been introduced as a result of machinery of government changes that resulted in the transfer of the registered housing agency functions to the Department.
Board appointments number 123 35 40 107The higher 2011-12 Target reflects the number of board positions requiring appointment during 2011-12.
The 2010-11 Expected Outcome is lower than the 2010-11 Target due to the streamlining of board recruitment processes for entities in the metropolitan and regional water sectors into one process. This will result in the recruitment process occurring in the first quarter of 2011-12, rather than in the 2010-11 year.
Corporate plans reviewed and assessed and quarterly performance reports
number 198 188 190 193
Dividends negotiated number 37 37 37 39Manage the review process for the State’s credit rating
number 2 2 2 2
Provide financial policy advice on borrowings, investments and superannuation issues
number 105 101 109 108
The 2010-11 Expected Outcome is lower than the 2010-11 Target due to a reduction in correspondence and associated briefings during the 2010 election caretaker period.
Provision of Budget Sector debt, public authority income and superannuation estimates and analysis and commentary on the PNFC and PFC Sectors for published financial reports
number 7 8 8 7
The lower 2011-12 Target reflects the exclusion of the Pre-Election Budget Update, which is only required during an election year.
Review of financial position of business entities
number 12 12 12 63
Quality Service provision rating (Ministerial survey data)
per cent 80 80 80 81.4
Service Delivery 2011-12 Treasury and Finance 429

Major Outputs/DeliverablesPerformance Measures
Unit of Measure
2011-12 Target
2010-11 Expected Outcome
2010-11 Target
2009-10 Actual
Timeliness Analysis and review of corporate plans, quarterly performance reports to agreed schedule
per cent 90 90 90 90
Board appointments approved within agreed timelines
per cent 100 100 100 100
Dates met for dividend payments per cent 100 100 100 97
Cost Total output cost $ million 7.4 17.6 6.4 6.5
The 2011-12 Target is higher than the 2010-11 Target as a result of machinery of government changes that resulted in the transfer of the Housing Registrar to the Department. The 2010-11 Expected Outcome is higher than the 2010-11 Target due to additional funding received for the introduction of the Government underwritten Domestic Building Insurance scheme.
Source: Department of Treasury and Finance
430 Treasury and Finance Service Delivery 2011-12

Risk Management ServicesThis output provides risk management advice, frameworks and information to Ministers, departments, and private infrastructure partners to manage the Government’s exposure to commercial and infrastructure project risks.
By providing advice and frameworks to manage commercial and infrastructure project risks, this output contributes to the Departmental objective to champion an integrated whole of government ‘value for money’ approach to ensure optimal service delivery and the provision of world class infrastructure to benefit all Victorians.
Major Outputs/DeliverablesPerformance Measures
Unit of Measure
2011-12 Target
2010-11 Expected Outcome
2010-11 Target
2009-10 Actual
Land and Infrastructure Investment ManagementThis output provides advice and assistance to departments, Ministers and senior Departmental management on:
land purchases, sales, facilitation, leasing and remediation;
feasibility studies, business cases, procurement processes and contractual management of major projects and commercial transactions;
policy to support project delivery; and
medium to long term asset investment planning and processes for investment decision making.
Quantity Commercial and risk management advice on projects which facilitate infrastructure and which minimise Governments exposure to risk
number 320 268 300 276
The higher 2011-12 Target reflects the output becoming more involved in the scoping, cost/benefit analysis, business case development, cost control and procurement of major projects undertaken by all departments and agencies.
The 2010-11 Expected Outcome is lower than the 2010-11 Target due to lower than forecast project development and commercial issues subject to advice and review, including Gateway reviews.
Gateway reviews undertaken to minimise Government’s exposure to project risks
number 70 39 70 74
This performance measure replaces the 2010-11 performance measure ‘Promoting the Gateway process to minimise Governments exposure to project risks’. It has been amended to more accurately describe the output’s activities.The 2010-11 Expected Outcome is lower than the 2010-11 Target due to lower than forecast project development and commercial issues subject to advice and review, including Gateway reviews.
Revenue from sale of surplus Government land including Crown land
$ million 50 50 50 37.63
Service Delivery 2011-12 Treasury and Finance 431

Major Outputs/DeliverablesPerformance Measures
Unit of Measure
2011-12 Target
2010-11 Expected Outcome
2010-11 Target
2009-10 Actual
Services (including policy, procedures and training) which facilitate new infrastructure investment
number 41 74 30 32
The higher 2011-12 Target reflects the output becoming more involved in the scoping, cost/benefit analysis, business case development, cost control and procurement of major projects undertaken by all departments and agencies.
The 2010-11 Expected Outcome is higher than the 2010-11 Target due to a greater than anticipated demand for new policy and related training.
Quality Service provision rating (Ministerial survey data)
per cent 80 80 80 79.8
Cost Total output cost $ million 23.9 20.7 20.7 23.7
The 2011-12 Target is higher than the 2010-11 Target due to additional funding received for the improving the planning, management and delivery of infrastructure projects initiative.
Source: Department of Treasury and Finance
432 Treasury and Finance Service Delivery 2011-12

Resource Management ServicesThis output assists the Government to administer and coordinate the provision of whole of government services.
By maximising value in purchasing decisions and providing professional management of substantial Government assets, this output contributes to the Departmental objectives of:
sound financial management of the State’s fiscal resources with an emphasis on maintenance of a substantial budget surplus; and
champion an integrated whole of government ‘value for money’ approach to ensure optimal service delivery and the provision of world class infrastructure to benefit all Victorians.
Major Outputs/DeliverablesPerformance Measures
Unit of Measure
2011-12 Target
2010-11 Expected Outcome
2010-11 Target
2009-10 Actual
Government ServicesThis output delivers effective and efficient whole of government services and reform initiatives in areas including procurement, fleet, facilities and accommodation, library services, car pool services and information and communications technology.
It also provides strategic leadership in the implementation of the Better Financial Management policy.
Quantity Briefs provided on services to Government
number 70 88 70 87
The 2010-11 Expected Outcome is higher than the 2010-11 Target due to greater anticipated demand for briefs.
Deliver or renew whole of government policy, standards and guidelines
number 20 25 20 28
The 2010-11 Expected Outcome is higher than the 2010-11 Target due to the development and publication of policies in relation to procurement and technology ahead of schedule.
Establishment or renewal of whole of government contracts
number 22 13 13 15
The higher 2011-12 Target is due to the renewal cycle for several whole of government contracts under management.
Quality Service Provision Rating (Ministerial survey data)
per cent 80 80 80 70
Total accommodation cost $ per square
metre per year
350 321 335 333
The 2010-11 Expected Outcome is lower than the 2010-11 Target due to an increase in the number of non-metropolitan properties being managed.
Workspace ratio square metre per
FTE
15 15 15.5 14.4
Service Delivery 2011-12 Treasury and Finance 433
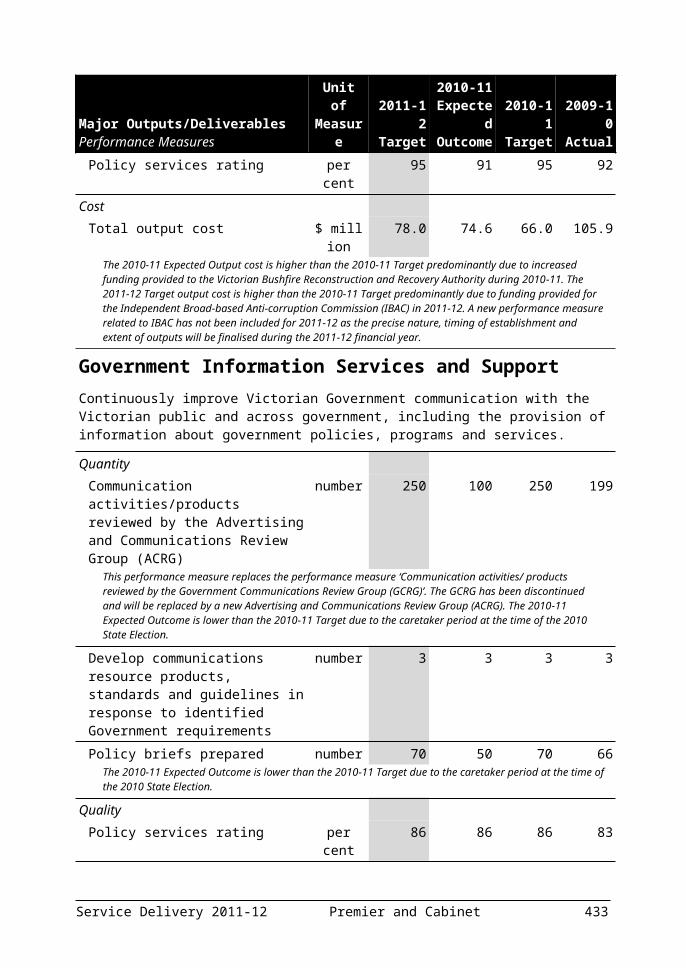
Major Outputs/DeliverablesPerformance Measures
Unit of Measure
2011-12 Target
2010-11 Expected Outcome
2010-11 Target
2009-10 Actual
Timeliness Whole of government contracts renewed within agreed timelines
per cent 95 82 95 100
The 2010-11 Expected Outcome is lower than the 2010-11 Target due to delays of contracts not being executed during the 2010 election caretaker period.
Cost Total output cost $ million 52.9 74.4 64.4 101.0
The 2011-12 Target is lower than the 2010-11 Target due to the lower output funding required for the implementation of the Efficient Technology Services initiative.
Source: Department of Treasury and Finance
434 Treasury and Finance Service Delivery 2011-12

Regulatory ServicesThese outputs regulate utilities and other regulated markets in Victoria and provide advice on ways the Government can improve the business environment.
By informing Government on ways to create a competitive business environment and by efficiently regulating utilities and other specified markets to protect the long-term interests of Victorian consumers with regard to price, quality and reliability of essential services, these outputs contribute to the Departmental objective of guiding Government actions to best increase living standards for all Victorians.
Major Outputs/DeliverablesPerformance Measures
Unit of Measure
2011-12 Target
2010-11 Expected Outcome
2010-11 Target
2009-10 Actual
Economic Regulatory ServicesThis output provides economic regulation of utilities and other specified markets in Victoria to protect the long-term interests of Victorian consumers with regard to price, quality and reliability of essential services.
Quantity Company performance reviews and audits
number 93 109 80 108
The higher 2011-12 Target reflects annual variations to the output’s work plan. The 2010-11 Expected Outcome is higher than the 2010-11 Target due to additional reviews being undertaken as part of the Victorian Energy Efficiency Target (VEET) scheme.
Industry performance reports number 3 7 4 5The lower 2011-12 Target reflects annual variations to the output’s work plan. The 2010-11 Expected Outcome is higher than the 2010-11 Target due to an increase in the number of industry performance reports requested.
New or revised regulatory instruments number 2 2 0 2The higher 2011-12 Target reflects annual variations to the output’s work plan. The 2010-11 Expected Outcome is higher than the 2010-11 Target due to changes to the output’s annual workplan.
Price Approvals number 22 20 19 19The higher 2011-12 Target reflects annual variations to the output’s work plan.
The 2010-11 Expected Outcome is higher than the 2010-11 Target due to changes to the output’s annual workplan.
Registration and accreditation decisions/approvals
number 400 521 300 857
The higher 2011-12 Target reflects an upgrading to the processing system and streamlining of the submission process of the VEET scheme which allows for decisions/approvals to occur more frequently.
The 2010-11 Expected Outcome is higher than the 2010-11 Target due to the upgrading to the processing system and the streamlining of the submission process of the VEET scheme, allowing for decisions/approvals to occur more frequently.
Reviews, investigations or advisory projects
number 6 3 2 12
The higher 2011-12 Target reflects annual variations to the output’s work plan. The 2010-11 Expected Outcome is higher than the 2010-11 Target due to changes to the output’s annual workplan.
Service Delivery 2011-12 Treasury and Finance 435

Major Outputs/DeliverablesPerformance Measures
Unit of Measure
2011-12 Target
2010-11 Expected Outcome
2010-11 Target
2009-10 Actual
Quality Decisions upheld where subject to review, appeal or disallowance
per cent 100 100 100 100
Timeliness Deadlines met for major milestones per cent 100 100 100 100
Cost Total output cost $ million 15.2 15.9 15.3 13.9
Business Environment Policy AdviceThis output provides advice on ways the Government can improve the business environment. In particular this output: reviews regulatory impact statements, business impact assessments and regulatory change measurement assessments; undertakes inquiries into matters referred to it by the Government; and operates Victoria’s competitive neutrality unit.
Quantity Public inquiries number 3 4 3 4
The 2010-11 Expected Outcome is higher than the 2010-11 Target due to changes to the output’s annual workplan.
Reviews of Regulatory Impact Statements (RISs) and Business Impact Assessments (BIAs) and Regulatory Change Measurements
number 45 16 45 48
This performance measure replaces the 2010-11 performance measure ‘Reviews of Regulatory Impact Statements (RIS) and Business Impact Assessments (BIA) and Standard Cost Model assessments’ to reflect the revised description of the functions undertaken by the output. The 2010-11 Expected Outcome is lower than the 2010-11 Target due to the number of reviews of RIS’s and BIA’s and Regulatory Change Measurements received by the output being lower than anticipated.
Quality Service provision rating (Commissioner assessment of Secretariat performance)
per cent 80 80 80 78.8
Timeliness Complete the initial assessment phase of Business Impact Assessments within 10 working days of receipt
per cent 90 95 90 100
The 2010-11 Expected Outcome is higher than the 2010-11 Target due to more initial assessments being completed within ten working days of receipt than forecast.
Complete the initial assessment phase of Regulatory Change Measurements within 10 working days of receipt
per cent 90 90 90 100
This performance measure replaces the 2010-11 performance measure ‘Complete the initial assessment phase of Standard Cost Model assessments within 10 working days of receipt’ to reflect the revised description of the functions undertaken by the output.
436 Treasury and Finance Service Delivery 2011-12

Major Outputs/DeliverablesPerformance Measures
Unit of Measure
2011-12 Target
2010-11 Expected Outcome
2010-11 Target
2009-10 Actual
Complete the initial assessment phase of Regulatory Impact Statements within 10 working days of receipt
per cent 90 95 90 100
The 2010-11 Expected Outcome is higher than the 2010-11 Target due to more initial assessments being completed within ten working days of receipt than forecast.
Completion of inquiry reports by due date
per cent 100 100 100 100
Cost Total output cost $ million 5.9 6.0 5.9 6.0
Source: Department of Treasury and Finance
Service Delivery 2011-12 Treasury and Finance 437

Revenue Management ServicesThis output administers revenue collections of major taxes and duties on behalf of the Government. It also assesses and processes unclaimed monies applications.
By efficiently delivering revenue management services in Victoria, this output contributes to the Departmental objective of sound financial management of the State’s fiscal resources with an emphasis on maintenance of a substantial budget surplus.
Major Outputs/DeliverablesPerformance Measures
Unit of Measure
2011-12 Target
2010-11 Expected Outcome
2010-11 Target
2009-10 Actual
Revenue Management Services to GovernmentThis output provides revenue management services across the various state-based taxes in a fair and efficient manner for the benefit of all Victorians.
Quantity Revenue banked on day of receipt per cent >=99 99.65 >=99 99.65
Revenue collected as a percentage of budget target
per cent >=99 100 >=99 101
Revenue detected from compliance projects meets estimates
per cent >=90 100 >=90 112
Quality Customer satisfaction level per cent >=80 90 >=80 90Maintain ISO 9001 and ISO/IEC 20000-1:2005 (ITIL) Certification
number 3 4 3 2
The 2010-11 Expected Outcome is higher than the 2010-11 Target due to an audit review that was originally scheduled for 2009-10 being undertaken in 2010-11.
Ratio of outstanding debt to total revenue
per cent <2 <2 <2 1.52
Timeliness Court timelines met per cent 100 100 100 100
Meet Cabinet and Parliamentary time lines
per cent 100 100 100 100
Timely handling of objections (within 90 days)
per cent >=80 80 >=80 92
Timely handling of private rulings (within 90 days)
per cent >=80 80 >=80 92
Cost Total output cost $ million 82.4 64.9 64.4 73.2
The 2011-12 Target is higher than the 2010-11 Target due to the bi-annual purchase of municipal valuations resulting in higher amortisation expense in the second year as well as additional funding received for the enhanced tax compliance initiative.
Source: Department of Treasury and Finance
438 Treasury and Finance Service Delivery 2011-12

PARLIAMENT
Departmental mission statementThe Parliament of Victoria, through its elected representatives, is accountable to the Victorian community for the provision and conduct of representative government in the interests of Victorians.The Departments of the Parliament of Victoria deliver apolitical, professional and innovative services to support our elected representatives and the Parliament as an institution. Victoria’s Constitution Act 1975 provides that the Auditor-General is an independent officer of Parliament. For budgetary purposes, the Victorian Auditor-General’s Office is included as an output classification within Parliament.The main purpose of the Victorian Auditor-General’s Office is to provide assurance to Parliament on the accountability and performance of the Victorian public sector.
Departmental objectives
ParliamentThe Departments of the Parliament of Victoria aim to: provide services to the Members of Parliament as our primary
clients; proactively engage with, and respond to, our communities; become an employer of choice by developing a strategy to employ
and retain the best people; meet the information and knowledge needs of our stakeholder
groups; and ensure the longevity and integrity of the Parliamentary Precinct,
and the sustainability of the electorate offices.
Victorian Auditor-General’s OfficeThe Victorian Auditor-General’s Office aims to: provide assurance to Parliament about the accountability and
performance of the Victorian public sector through the provision of audits;
be authoritative and relevant and be highly regarded by Parliament; leverage our systems and processes to improve organisational
performance;
Service Delivery 2011-12 Parliament 439

foster a stimulating working environment; and foster productive relationships with audit clients.
440 Parliament Service Delivery 2011-12

Key strategic priorities for 2011-12 The key strategic priorities for the Parliament, including the Victorian Auditor-General’s Office for 2011-12 are: establishment of the 57th Parliament including Parliamentary
Committees, electorate offices and other support infrastructure; enhance citizen participation by expanding the Community
Engagement program; final commissioning of video broadcasting systems; ensuring that Parliament House remains a functional contemporary
working location within the constraints imposed by its heritage characteristics; and
recruitment and retention of staff with specialised audit and investigative skills in the Victorian Auditor-General’s Office to meet the increasing complexity of audit effort within a competitive recruitment market.
Changes to the output structureThe Parliament has not made any changes to its output structure for 2011-12. The following table summarises Parliament’s total output cost.
Table 3.34: Output summary($ million)
2010-11 Budget
2010-11 Revised
2011-12 Budget
Variation (a)
%Legislative Council (b) 16.3 16.7 10.9 -33.1Legislative Assembly (b) 30.7 31.3 20.0 -34.9Parliamentary Services 77.8 69.8 80.1 3.0Parliamentary Investigatory Committees 6.9 6.9 6.9 0.0Victorian Auditor-General’s Office 34.4 34.3 34.9 1.5Total (c) 166.1 159.0 152.8 -8.0Source: Parliament of Victoria
Notes:(a) Variation between 2010-11 Budget and 2011-12 Budget.(b) The total output cost for both the Legislative Council and Legislative Assembly for
2011-12 Budget has decreased. This is due to a three year actuarial assessment of members defined benefits superannuation costs, required under the Parliamentary Salaries and Superannuation Act 1968, which has not yet been completed.
(c) Total output cost for 2011-12 Budget may not equate to the total expense reported in Budget Paper No. 5, Chapter 3 Departmental financial statements due to additional expenses in Budget Paper No. 5 that are not included in departmental output costs.
Service Delivery 2011-12 Parliament 441

Amounts availableThe following tables detail the amounts available to the Department from Parliamentary authority and income generated through transactions. Table 3.35 outlines the Department’s income from transactions and Table 3.36 summarises the sources of Parliamentary authority available to the Department to fund the provision of outputs, additions to net asset base and payments made on behalf of the State.
442 Parliament Service Delivery 2011-12

Table 3.35: Income from transactions($ million)
2009-10 2010-11 2010-11 2011-12 Actual Budget Revised BudgetOutput appropriations 118.9 125.5 117.4 129.2Special appropriations 39.6 40.1 41.3 23.9Interest .. .. .. ..Sale of goods and services 1.3 .. .. ..Grants 0.1 0.1 0.1 0.1Fair value of assets and services received free of
charge or for nominal consideration 0.1 0.3 0.3 ..
Other income .. .. .. ..Total income from transactions 160.1 165.9 159.0 153.2Source: Parliament of Victoria and Department of Treasury and Finance
Table 3.36: Parliamentary authority for resources($ million)
2010-11 2010-11 2011-12 Budget Revised BudgetAnnual appropriations 101.4 95.4 106.5 Provision of outputs 99.4 93.4 102.5 Additions to the net asset base 2.0 2.0 4.0 Payments made on behalf of the State .. .. ..Receipts credited to appropriations 20.0 20.0 20.5Unapplied previous years appropriation 6.1 4.0 6.2 Provision of outputs 6.1 4.0 6.2 Additions to the net asset base .. .. ..Accumulated surplus – previously applied appropriation .. 2.9 0.6Gross annual appropriation 127.5 122.3 133.8Special appropriations 40.1 41.3 23.9Trust funds 0.1 0.1 0.1Total parliamentary authority 167.6 163.6 157.8Source: Parliament of Victoria and Department of Treasury and Finance
The following section provides details of the outputs provided to government, including performance measures and costs for each output. Total expenditure for the department can be found in Budget Paper No. 5, Chapter 3 Departmental financial statements.
Service Delivery 2011-12 Parliament 443

Legislative CouncilThis output involves the provision of procedural advice to Members of the Legislative Council including: processing of legislation, preparation of the records of the proceedings and documentation required for the sittings of the Council, provision of assistance to Parliamentary committees, provision of information relating to the proceedings of the Council, and the enhancement of public awareness of Parliament.
Major Outputs/DeliverablesPerformance Measures
Unit of Measure
2011-12 Target
2010-11 Expected Outcome
2010-11 Target
2009-10 Actual
Procedural Support, Documentation Preparation and Provision of Information for CouncilQuantity
Procedural References updated biannually
number 2 2 2 2
Quality Bills and amendments processed accurately through all relevant stages and other business of the House conducted according to law, Standing and Sessional Orders
per cent 100 100 100 100
Member satisfaction with accuracy, clarity and timeliness of advice
per cent 90 90 90 87
Timeliness Documents tabled within time guidelines
per cent 95 95 95 100
House documents and other Sitting related information available online one day after sitting day
per cent 98 98 98 100
Cost Total output cost $ million 10.9 16.7 16.3 16.2
The 2011-12 Target has decreased due to a three year actuarial assessment of member’s defined benefits superannuation costs, required under the Parliamentary Salaries and Superannuation Act 1968, which has not yet been completed.
Source: Parliament of Victoria
444 Parliament Service Delivery 2011-12

Legislative AssemblyThis output involves the provision of procedural advice to Members of the Legislative Assembly including: processing of legislation, preparation of the records of the proceedings and documentation required for the sittings of the Assembly, provision of assistance to Parliamentary Committees, provision of information relating to the proceedings of the Assembly, and the enhancement of public awareness of Parliament.
Major Outputs/DeliverablesPerformance Measures
Unit of Measure
2011-12 Target
2010-11 Expected Outcome
2010-11 Target
2009-10 Actual
Procedural Support, Documentation Preparation and Provision of Information for AssemblyQuantity
Procedural References updated biannually
number 2 2 2 2
Regional visits to schools to conduct Parliamentary information talks and Parliamentary role plays
number 5 5 5 nm
Quality Bills and amendments processed accurately through all relevant stages in compliance with constitutional requirements and standing orders
per cent 100 100 100 100
Member satisfaction that advice is responsive, prompt, clear and objective
per cent 80 80 80 83
Teacher satisfaction with tours of Parliament for school groups
per cent 90 90 90 nm
Timeliness Documents tabled within time guidelines
per cent 90 90 90 100
House documents available one day after sitting day
per cent 100 100 100 100
Online information relating to bills updated within one day
per cent 95 95 95 nm
Cost Total output cost $ million 20.0 31.3 30.7 30.5
The 2011-12 Target has decreased due to a three year actuarial assessment of member’s defined benefits superannuation costs, required under the Parliamentary Salaries and Superannuation Act 1968, which has not yet been completed.
Source: Parliament of Victoria
Service Delivery 2011-12 Parliament 445
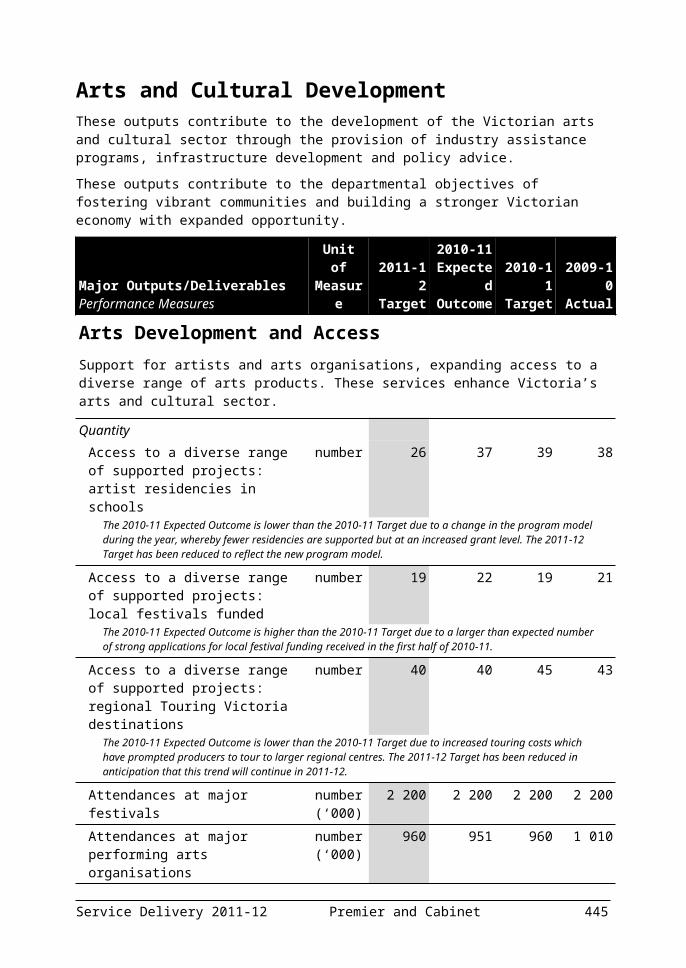
Parliamentary ServicesParliamentary Services provides consultancy, advisory and support services in the areas of library, Hansard, education, human resources, finance, information technology (IT), maintenance, grounds and facilities for the Parliament of Victoria.
Major Outputs/DeliverablesPerformance Measures
Unit of Measure
2011-12 Target
2010-11 Expected Outcome
2010-11 Target
2009-10 Actual
Provision of Information and Resources to ParliamentQuantity
IT systems availability – (Parliament and electorate offices)
per cent 99 99 99 97
Monthly management reports to MPs and departments
number 12 12 12 nm
Parliamentary audio system transmission availability
per cent 99 99 99 99
Provide MPs with a functional electorate office
per cent 95 95 95 nm
Quality Clear audit opinion on Parliamentary financial statements (previous year)
per cent 100 100 100 nm
Clients satisfied with quality of information provided by Library reference desk staff
per cent 85 85 85 90
Maintain and secure the parliamentary precinct and have it available for legislative program
per cent 95 95 95 nm
Timeliness Indexes, records and speeches and transcripts provided within agreed timeframes
per cent 90 90 90 nm
Payroll processing completed accurately and within agreed timeframes
per cent 99 99 99 nm
Cost Total output cost $ million 80.1 69.8 77.8 70.8
The 2010-11 Expected Outcome is lower that the 2010-11 Target due to lower than expected expenditure in relation to Members’ electorate office and communication costs.
Source: Parliament of Victoria
446 Parliament Service Delivery 2011-12

Parliamentary Investigatory CommitteesJoint investigatory committees are appointed pursuant to the Parliamentary Committees Act 2003 to inquire into and report on matters referred by either House or the Governor in Council, or which may be self generated by a committee.
Major Outputs/DeliverablesPerformance Measures
Unit of Measure
2011-12 Target
2010-11 Expected Outcome
2010-11 Target
2009-10 Actual
Reports tabled and papers publishedQuantity
Reports tabled per annum number 25 27 15 43The 2011-12 Target is higher than the 2010-11 Target to reflect normal Committee activity after an election year.The 2010-11 Expected Outcome is higher than the 2010-11 Target as the joint investigatory committees received more inquiries from the Houses of Parliament than anticipated and have therefore tabled a greater number of reports than expected.
Quality Committee members satisfied that advice about procedure, research and administration is responsive, clear, objective and prompt
per cent 80 80 80 90
Inquiries conducted and reports produced in compliance with procedural and legislative requirements
per cent 95 95 95 100
Timeliness Reports tabled in compliance with procedural and legislative deadlines
per cent 95 95 95 100
Cost Total output cost $ million 6.9 6.9 6.9 6.6
Source: Parliament of Victoria
Service Delivery 2011-12 Parliament 447

Victorian Auditor-General’s OfficeThe purpose of the Victorian Auditor-General’s Office is to provide assurance to Parliament on the accountability and performance of the Victorian public sector.
Under the Audit Act 1994, the Auditor-General audits financial statements prepared by Victorian public sector agencies and issues audit reports. In addition, the Auditor-General carries out performance audits to determine whether authorities, operations or activities are operating effectively, economically and efficiently in compliance with all relevant Acts.
448 Parliament Service Delivery 2011-12

Major Outputs/DeliverablesPerformance Measures
Unit of Measure
2011-12 Target
2010-11 Expected Outcome
2010-11 Target
2009-10 Actual
Parliamentary Reports and ServicesQuantity
Auditor-Generals Reports number 36 40 37 34The 2010-11 Expected Outcome is higher than the 2010-11 Target due to three reports carried over from 2009-10 plus the newly commissioned Electronic Gaming Machines report, less one report carried back into 2009-10.
Quality Average score of audit reports by external assessors
(per cent) 80 nm nm nm
New performance measure for 2011-12 which more directly reflects the quality of the audit report.
Overall level of external satisfaction with audit reports and services – Parliamentarians
per cent 85 92 85 nm
The 2010-11 Expected Outcome is higher than the 2010-11 Target due to the measure being new for 2010-11. The target was informed by results received in earlier years
Overall level of external satisfaction with audits – audit clients
score 75 75 75 69
The score is a rating out of 100, and represents the average rating by all respondents.
Timeliness Inquiries from Members of Parliament and the public responded to within 28 days
per cent 95 95 95 93
Reports completed on time per cent 90 90 90 81
Cost Total output cost $ million 14.1 14.1 14.1 14.5
Audit reports on Financial StatementsQuantity
Audit opinions issued on non-financial performance indicators
number 113 113 114 113
Audit opinions issued on the financial statements of agencies
number 567 551 541 557
Quality External/peer reviews finding no material departures from professional and regulatory standards
per cent 100 nm nm nm
New performance measure for 2011-12 which more directly reflects the quality of audit reports.
Overall level of external satisfaction with audits – audit clients
score 75 75 75 75
The score is a rating out of 100, and represents the average rating by all respondents
Service Delivery 2011-12 Parliament 449
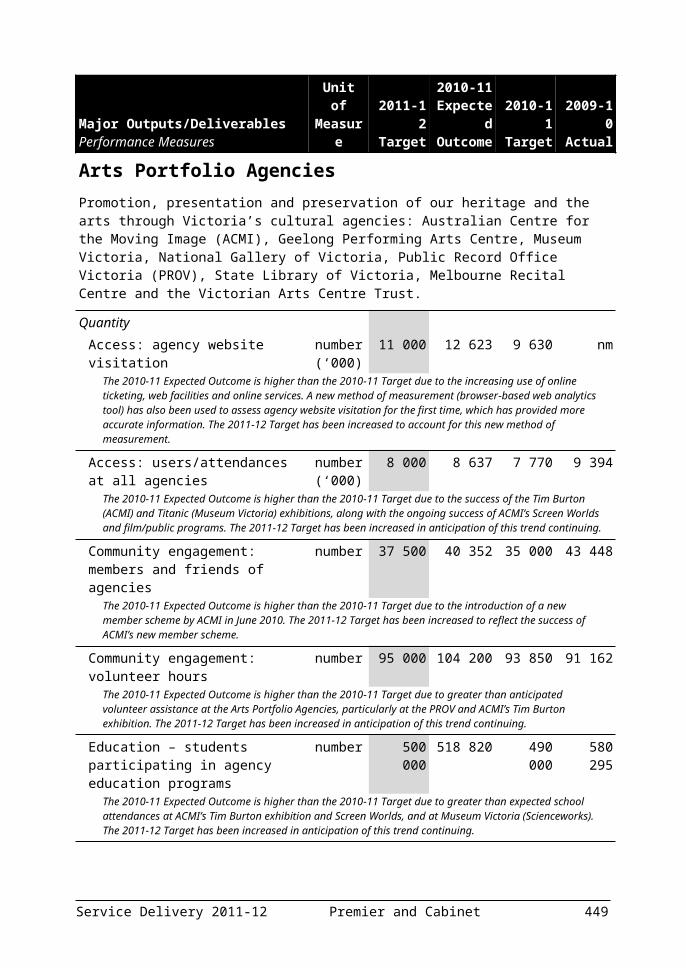
Major Outputs/DeliverablesPerformance Measures
Unit of Measure
2011-12 Target
2010-11 Expected Outcome
2010-11 Target
2009-10 Actual
Timeliness Audit opinions issued within statutory deadlines
per cent 98 99 98 100
Management letters and reports to Ministers issued within established timeframes
per cent 90 88 90 94
Cost Total output cost $ million 20.8 20.3 20.3 20.4
Source: Parliament of Victoria
450 Parliament Service Delivery 2011-12
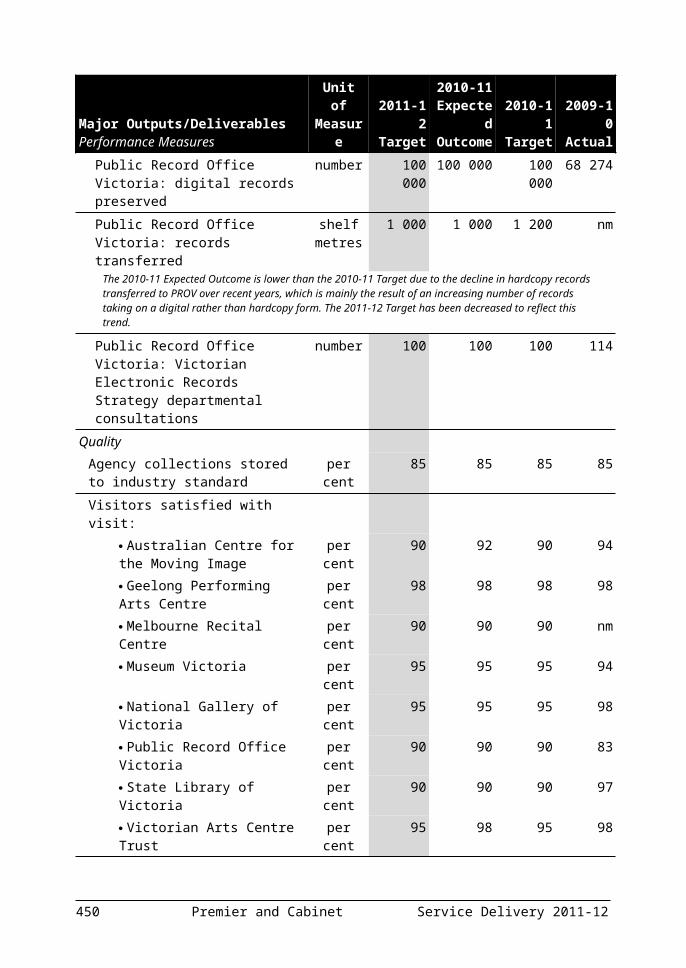
APPENDIX A – OUTPUT PERFORMANCE MEASURES FOR REVIEW BY THE PUBLIC ACCOUNTS AND ESTIMATES COMMITTEE
This appendix provides details of performance measures that departments have either proposed to discontinue for 2011-12, or have substantially changed from the previous year. Measures can be discontinued because a program has ceased, milestones have been met or improved measures have been identified. Measures may change substantially due to a shift in focus for the service, development of improved measures or new data sets which can collect different information. Substantial changes to performance measures affect the ability to compare the measure over time. Each performance measure included here is accompanied by an explanatory footnote providing reasons for its discontinuation or change.To strengthen accountability and transparency associated with output performance management, the Public Accounts and Estimates Committee (PAEC) has been invited to review these performance measures to ensure that measures that are substantially changed or proposed to be discontinued receive a high level of scrutiny. After receiving the PAEC’s recommendations on the measures in this appendix the Government will make any changes required. Amendments will be presented on the Government’s budget website www.budget.vic.gov.au and changes will take effect from 2011-12.In the event that a measure listed in this Appendix is continued, a 2011-12 target has been identified to ensure continuity of reporting and transparency in the publication of performance information.
Service Delivery 2011-12 Appendix A Page 451

DEPARTMENT OF BUSINESS AND INNOVATION
Major Outputs/DeliverablesPerformance Measures
Unit of Measure
2011-12 Target
2010-11 Expected Outcome
2010-11 Target
2009-10 Actual
ExportsQuantity
Companies provided with export assistance
number 4 050 4 050 4 050 4 872
This performance measure has been proposed to be discontinued as it is no longer relevant due to a greater focus on measuring companies participating in export programs.
InnovationQuantity
Design Sector Initiative: Business immersions completed
number na 12 12 8
This performance measure has been proposed to be discontinued as previous budgets did not allocate funding for the program beyond 30 June 2011.
Design Sector Initiative: People participating in lectures, seminars and workshops
number na 4 480 4 480 5 883
This performance measure has been proposed to be discontinued as previous budgets did not allocate funding for the program beyond 30 June 2011.
Industrial RelationsQuality
Client satisfaction with the programs and activities delivered under the Working Families agenda
per cent na 90 90 90
This performance measure has been proposed to be discontinued as previous budgets did not allocate funding for the program beyond 30 June 2011.
Workforce ParticipationQuantity
New Workforce Partnerships – jobseekers who achieve sustainable employment outcomes (minimum of 16 weeks)
number na 925-975 925-975 553
This performance measure has been proposed to be discontinued as previous budgets did not allocate funding for the program beyond 30 June 2011.
People assisted by Returning to Earning Program
number na 2 500-3 500
2 500-3 500
3 500
This performance measure has been proposed to be discontinued as previous budgets did not allocate funding for the program beyond 30 June 2011.
Page 452 Appendix A Service Delivery 2011-12

Major Outputs/DeliverablesPerformance Measures
Unit of Measure
2011-12 Target
2010-11 Expected Outcome
2010-11 Target
2009-10 Actual
Quality Client satisfaction with targeted employment initiatives
per cent na 80 80 81.4
This performance measure has been proposed to be discontinued as previous budgets did not allocate funding for the program beyond 30 June 2011.
Regional Economic Development, Investment and PromotionQuantityCompanies in regional Victoria provided with assistance for growth opportunities
number 160 160 160 169
This performance measure has been proposed to be discontinued as it is no longer relevant due to a greater focus on investment and job outcomes rather than the amount of individual businesses assisted.
Source: Department of Business and Innovation
Service Delivery 2011-12 Appendix A Page 453

DEPARTMENT OF EDUCATION AND EARLY CHILDHOOD DEVELOPMENT There are no proposed discontinued or substantially changed measures for the Department of Education and Early Childhood Development.
Page 454 Appendix A Service Delivery 2011-12

DEPARTMENT OF HEALTH
Service Delivery 2011-12 Appendix A Page 455

Major Outputs/DeliverablesPerformance Measures
Unit of Measure
2011-12 Target
2010-11 Expected Outcome
2010-11 Target
2009-10 Actual
Clinical CareQuantity
Community contact hours hours (‘000)
na 1 066 1 040 1 035
This performance measure has been proposed to be discontinued as it has been replaced by ‘Community service hours’ to ensure consistency with definitions and data entry compliance.
Health ProtectionQuantity
Environmental health inspections undertaken and occasions of technical advice.
number na 3 500 3 500 4 955
This performance measure has been proposed to be discontinued as it is proposed to be replaced by ‘Inspections of cooling towers’ and ‘Inspections of radiation safety management licences’ as they better reflect the nature of health promotion service delivery.
Persons screened for prevention and early detection of health conditions
number na 851 907 835 486 nm
This performance measure has been proposed to be discontinued as it is proposed to be replaced by four measures to provide a more detailed recording of activity for different types of screening.
Quality Public Health emergency response calls dealt with within designated plans and procedure timelines
per cent 100 100 100 100
This performance measure has been proposed to be discontinued as it is proposed to be replaced by the performance measures ‘Inspections of cooling towers’ and ‘Inspections of radiation safety management licences’ as they better reflect the nature of health promotion service delivery.
Health AdvancementQuantity
Primary schools in Victoria signed up as members of Kids – Go for your life!
per cent 100 100 72 65
This performance measure has been proposed to be discontinued as previous budgets did not allocate funding beyond 30 June 2011.
Public Health Development, Research and SupportQuantity
Department of Health funded public health training positions
per cent na 9 9 9
This performance measure has been proposed to be discontinued as it is proposed to be replaced by the performance measure ‘Department of Health funded public health training scholarships’, to better reflect the current format of the program.
Funded public health projects for which satisfactory reports have been received
per cent na 90 90 90
Page 456 Appendix A Service Delivery 2011-12

Major Outputs/DeliverablesPerformance Measures
Unit of Measure
2011-12 Target
2010-11 Expected Outcome
2010-11 Target
2009-10 Actual
This performance measure has been proposed to be discontinued as the program has been finalised.
Number of people trained in emergency response
number 2 000 2 000 2 000 2 101
This performance measure has been proposed to be discontinued as performance related to this measure is captured within new and existing Health Protection and Health Advancement measures, and as this measure does not reflect the accountability split between Department of Health and Human Services.
Quality Graduating public health trainees achieving Master of Health Science (Monash University) qualification
per cent na 100 100 100
This performance measure has been proposed to be discontinued as it is proposed to be replaced with the performance measure ‘Department of Health funded public health trainees achieving postgraduate qualifications’. The change reflects that the program now allows students to complete qualifications to the level of both Masters and Doctorate.
Drug Prevention and ControlQuantity
Participants in peer education programs of injecting drug users
number na 200 250 220
This performance measure has been proposed to be discontinued as it is no longer relevant and relates to a single program within one agency, reducing the opportunity for innovation.The 2010-11 Expected Outcome is lower than the 2010-11 Target due to a decline in client attendance at workshops.
Drug Treatment and RehabilitationQuality
Evaluation, research and development projects satisfactorily completed
per cent na 100 100 100
This performance measure has been proposed to be discontinued as it is no longer relevant and does not refer to the quality of the service delivered.
Community Health CareQualityAgencies with satisfactorily completed health protection plans
per cent na 100 100 100
This performance measure has been proposed to be discontinued as it is proposed to be replaced by the performance measure ‘Agencies with an Integrated Health Promotion (IHP) plan that meets the stipulated planning requirements’.
Aged Care AssessmentTimeliness
Average wait between client registration and ACAS assessment: community-based assessment
days 15 17 15 19.6
Service Delivery 2011-12 Appendix A Page 457

Major Outputs/DeliverablesPerformance Measures
Unit of Measure
2011-12 Target
2010-11 Expected Outcome
2010-11 Target
2009-10 Actual
This performance measure has been proposed to be discontinued as it is proposed to be replaced by the performance measure ‘Percentage of priority 1 and 2 clients assessed within the appropriate time – community-based assessment’ as it is a better indicator of responsiveness to the urgency of client needs based on information available at the time of assessment.
Average wait between client registration and ACAS assessment: hospital-based assessment
days 2.5 1.8 2.5 2
This performance measure has been proposed to be discontinued as it is proposed to be replaced by the performance measure ‘Percentage of priority 1 and 2 clients assessed within the appropriate time – hospital-based assessment’ as it is a better indicator of responsiveness to the urgency of client needs based on information available at the time of assessment.
Source: Department of Health
Page 458 Appendix A Service Delivery 2011-12

DEPARTMENT OF HUMAN SERVICES
Major Outputs/DeliverablesPerformance Measures
Unit of Measure
2011-12 Target
2010-11 Expected Outcome
2010-11 Target
2009-10 Actual
Community Based Services
QualityYouth Justice clients participating in post release support activities
per cent na 95 95 85
This performance measure has been proposed to be discontinued as the existing measure ‘Community-based orders completed successfully’ is an accurate indicator of the quality of the services provided.
Social HousingQuantity
Total number of social housing dwelling constructions commenced for projects funded under the Nation Building and Jobs Plan during the year
number na 1 091 750 3 456
This performance measure has been proposed to be discontinued as it is no longer relevant. This performance measure was introduced as a temporary measure in 2010-11 to report on progress under the Nation Building and Jobs Plan. The Nation Building and Jobs Plan is a time limited program and all projects are expected to commence before 30 June 2011.
The 2010-11 Expected Outcome is higher than the 2010-11 Target due to 244 dwellings being carried over into 2010-11 that were scheduled to commence in 2009-10. In addition, due to savings measures, the Nation Building program has grown by approximately 97 dwellings.
Office for DisabilityQuantity
Number of agencies supported to develop Disability Action Plans
number na 150 150 150
This measure has been proposed to be discontinued as funding in 2010-2011 is for evaluation.
Youth AffairsQuantity
FReeZA: event attendance number 130 000 130 000 130 000 154 442 This performance measure has been proposed to be discontinued as it is proposed to be replaced by ‘Participation by young people in programs that provide opportunities to be involved in social and economic life in their communities’ to better reflect the overall purpose and work of the Office for Youth (OFY). The new measure records activity across a range of OFY programs including Advance, National Youth Week, FReeZA, Youth Participation and Access, youthcentral Roving Reporters, MCBI (Mentoring and Capacity Building Initiative), SYN (Student Youth Network) FM, Community Radio and CMY (Centre for Multicultural Youth) Regional Offices.
Service Delivery 2011-12 Appendix A Page 459

Major Outputs/DeliverablesPerformance Measures
Unit of Measure
2011-12 Target
2010-11 Expected Outcome
2010-11 Target
2009-10 Actual
Number of organisations funded through Youth Participation and Access Program and Mentoring and Capacity Building Initiative
number 112 112 112 112
This performance measure has been proposed to be discontinued as it is proposed to be replaced by ‘Program delivery meets milestones’ to better reflect the overall purpose and work of the Office for Youth. The new measure records activity across all OFY programs measuring the timeliness of and the delivery of program milestones.
Number of young people attending FReeZA Central intensive workshops
number na 500 500 556
This performance measure has been proposed to be discontinued as funding has not been allocated for the program beyond 30 June 2011.
Young people participating in the Advance Youth Development Program
number 10 500-10 750
10 500-10 750
10 500-10 750
16 166
This performance measure has been proposed to be discontinued as it is proposed to be replaced by ‘Participation by young people in programs that provide opportunities to be involved in social and economic life in their communities’ to better reflect the overall purpose and work of the Office for Youth. The new measure records activity across a range of Office for Youth programs including Advance, National Youth Week, FReeZA, Youth Participation and Access, Youth Central Roving Reporters, Mentoring and Capacity Building Initiative, SynFM Community Radio and Centre for Multicultural Youth regional offices.
Youthcentral website total page impressions
number(‘000)
1 900 1 900 1 900 2 500
This performance measure has been proposed to be discontinued because it is no longer relevant as the focus is solely on outputs rather than providing a more fulsome assessment of the efficacy or impact of Office for Youth outputs and does not provide an indication of the overall purpose and work of the Office for Youth
Quality Participant completion rate: Advance Youth Development Program
per cent 85 85 85 nm
This performance measure has been proposed to be discontinued as it is proposed to be replaced by ‘Participants reporting development of transferrable skills that support education, training and vocational opportunities’ to better reflect the overall purpose and work of the Office for Youth. The new measure records activity across a range of OFY programs including Advance, Youth Central Roving Reporters and Youth Foundations Victoria.
TimelinessYouth Participation and Access Program: Grants acquitted within the timeframe specified in the terms and conditions of the funding agreement
number 90 90 90 97
This performance measure has been proposed to be discontinued as it is proposed to be replaced by ‘Program delivery meets milestones ‘ to better reflect the overall purpose and work of the Office for Youth. The new measure records activity across all OFY programs measuring the timeliness and of the delivery of program milestones.
Page 460 Appendix A Service Delivery 2011-12

Major Outputs/DeliverablesPerformance Measures
Unit of Measure
2011-12 Target
2010-11 Expected Outcome
2010-11 Target
2009-10 Actual
Women’s PolicyQuality
Participant satisfaction with consultation forums
per cent 85 85 85 89
This performance measure has been proposed to be discontinued as it does not reflect the breadth of work undertaken by OWP, and is proposed to be replaced by ‘Participant satisfaction with funded programs’ in 2011-12 which is a more meaningful measure.
Queen Victoria Women’s Centre occupancy rate
per cent 85 85 85 95
This performance measure has been proposed to be discontinued as it does not accurately reflect the work of OWP. It relates only to one Key Performance Indicator for the Queen Victoria Women’s Centre, which OWP funds but does not manage.
User satisfaction with diversity register per cent 85 85 85 88This performance measure has been proposed to be discontinued as it is proposed to be replaced by ‘Participant satisfaction with funded programs.’ This measure captures satisfaction with all OWP programs, including the diversity register.
Source: Department of Human Services
Service Delivery 2011-12 Appendix A Page 461

DEPARTMENT OF JUSTICE
Major Outputs/DeliverablesPerformance Measures
Unit of Measure
2011-12 Target
2010-11 Expected Outcome
2010-11 Target
2009-10 Actual
Community Safety and Crime PreventionTimeliness
Timely commencement of occupational phasing for Working with Children checks
per cent na 100.0 100.0 100
This performance measure has been proposed to be discontinued because it is no longer relevant. The Working With Children Checks phasing plan will expire as at 30 June 2011.
Community Based Offender SupervisionQuality
Community supervision orders successfully completed
per cent 68.0 68.5 65.0 65.4
This performance measure has been proposed to be discontinued as it is proposed to be replaced by two new performance measures: ‘Offenders with a supervised order that has been successfully completed’ and ‘Offenders with an unsupervised order that has been successfully completed’.
Promoting and Protecting Consumer InterestsQuantity
Information and advice provided to consumers and traders
number 674 350 680 000 668 000 711 708
This performance measure has been proposed to be discontinued as it is proposed to be replaced by new performance measures reporting the same activity but showing the detail of Consumer Affairs Victoria (CAV) and Responsible Alcohol Victoria (RAV) service delivery separately. The 2010-11 measure reports on aggregates of services delivered by CAV and RAV.
Inspections, compliance monitoring and enforcement activities
number 25 075 25 075 25 000 35 561
This performance measure has been proposed to be discontinued as it is proposed to be replaced by a new performance measure which is a disaggregation of the 2010-11 performance measure ‘Inspections, compliance monitoring and enforcement activities’. The disaggregation facilitates better transparency and accountability.
Registration and licensing transactions number 669 000 678 000 664 000 674 018This performance measure has been proposed to be discontinued as it is proposed to be replaced by a new performance measure which is a disaggregation of the 2010-11 performance measure ‘Inspections, compliance monitoring and enforcement activities’. The disaggregation facilitates better transparency and accountability.
Source: Department of Justice
Page 462 Appendix A Service Delivery 2011-12

DEPARTMENT OF PLANNING AND COMMUNITY DEVELOPMENT
Major Outputs/DeliverablesPerformance Measures
Unit of Measure
2011-12 Target
2010-11 Expected Outcome
2010-11 Target
2009-10 Actual
PlanningQuantity
Co-ordination and implementation of Victoria’s Heritage Strategy
per cent 100 100 100 100
This performance measure has been proposed to be discontinued because it is no longer relevant as the activity has been delivered in 2010-11.
Development Assessment Committees (DACs) established in priority activity centres to make decisions on significant development applications
number na 1 7 nm
This performance measure has been proposed to be discontinued as it is no longer relevant due to a change in Government policy.Amendments to the Planning and Environment Act (1987) to enable the establishment of Development Assessment Committees (DACs) were made in September 2010. The Doncaster Hill DAC within the City of Manningham was established in October 2010. Following the November 2010 Election DACs are no longer a Government priority.
Development facilitation priority projects considered
number na 13 50 81
This performance measure has been proposed to be discontinued as it is no longer relevant due to a change in Government policy.The 2010-11 Expected Outcome is lower than the 2010-11 Target due to the Development Facilitation Unit ceasing operation at the end of 2010. In addition to this the number of projects that are considered is dependent on the number of requests for assistance received.
TimelinessAuthorisations completed in 15 days per cent 80 80 80 79
This performance measure has been proposed to be discontinued as it is proposed to be replaced by the 2011-12 measure ‘Authorisations to prepare planning scheme amendments completed in seven days’ to reflect Government’s commitment to reducing delays in the planning system.
Community DevelopmentQuantity
Projects funded through the Victorian Community Support Grants Program for the purpose of planning, community strengthening and infrastructure
number na 58 90-100 93
This performance measure has been proposed to be discontinued as it is proposed to be replaced by the 2011-12 measure ‘Community Support Projects funded through the Community Support and Recreational sports package meet agreed project objectives’ to reflect renewed funding for the Victorian Community Support Grants program through the Community Support and Recreational sports package.
The 2010-11 Expected Outcome is lower than the 2010-11 Target as individual grants amounts were larger than expected resulting in fewer grants approved.
Service Delivery 2011-12 Appendix A Page 463

Major Outputs/DeliverablesPerformance Measures
Unit of Measure
2011-12 Target
2010-11 Expected Outcome
2010-11 Target
2009-10 Actual
Community enterprises supported number na 10 10 6This performance measure has been proposed to be discontinued as previous budgets did not allocate funding for the program beyond 30 June 2011.
Respect partnership projects funded number na 6 5 nmThis performance measure has been proposed to be discontinued as it is no longer relevant due to a change in Government policy.
The 2010-11 Expected Outcome is higher than the 2010-11 Target as the Target was set prior to the commencement of discussions with potential partners.
Transport connections initiatives supported
number na 34 32 nm
This measure has been proposed to be discontinued as it is proposed to be replaced by the 2011-12 measure ‘Coordination and implementation of actions within agreed performance targets: Transport Connections Initiatives’ to reflect the continued management of the Transport Connections Initiatives and to ensure the program meets its objectives.The 2010-11 Expected Outcome is higher than the 2010-11 Target as a number of Transport Connections initiatives were disaggregated.
Indigenous Community and Cultural DevelopmentQuality
Local Indigenous representation groups completed stage one of community plans
per cent na 100 100 80
This performance measure has been proposed to be discontinued as it is proposed to be replaced by the 2011-12 measure ‘Local Indigenous representation groups completed stage two of community plans’. The 2010-11 performance measure is no longer relevant as this activity was completed in 2010-11.
Proportion of Indigenous community organisations receiving funding from multiple departments on a single funding agreement
per cent na 10 20 10
This performance measure has been proposed to be discontinued as previous budgets did not allocate funding for the program beyond 30 June 2011.The 2010-11 Expected Outcome is lower than the 2010-11 Target due to the need for the development of a single IT platform to support single funding agreements across the Victorian Government.
Veterans’ AffairsTimeliness
Commemorative and Education program: Grants acquitted within the timeframe specified in the terms and conditions of the funding agreement
per cent 100 100 100 100
This performance measure has been proposed to be discontinued as it is proposed to be consolidated with the 2010-11 measure ‘Restoring Community War memorials grants: projects approved’ into a new measure for 2011-12 called ‘Restoring Community War memorials grants: projects approved by Anzac Day’.
Page 464 Appendix A Service Delivery 2011-12

Major Outputs/DeliverablesPerformance Measures
Unit of Measure
2011-12 Target
2010-11 Expected Outcome
2010-11 Target
2009-10 Actual
Local Government Quantity
Councils participating in practices to reduce administrative and regulatory burden to business in response to LGV’s Reducing the Regulatory Burden initiative
number 79 79 79 nm
This performance measure has been proposed to be discontinued as it is no longer relevant as the activity has been delivered in 2010-11.
Funding paid to LGV to local government within agreed timeframes
per cent 100 100 100 100
This performance measure has been proposed to be discontinued as it is no longer relevant since funding agreements with local councils require funding to be paid within agreed timeframes. LGV will continue to ensure timely payments.
Sport and Recreation DevelopmentQuantity
International teams/sports: sports visits facilitated
number >100 160 100-200 157
This performance measure has been proposed to be discontinued because it is no longer relevant as it relates to major events such as the Melbourne 2006 Commonwealth Games, 2007 FINA World Championships and 2010 UCI Road World Championships, which are not held every year.
Quality Completion of an approved business plan and ongoing operational and budget reports for each event
per cent 100 100 100 100
This performance measure has been proposed to be discontinued as it is proposed to be replaced by the 2011-12 measure ‘Major events facilitated with a business plan, budget, branding and promotional activities’.
Government branding and promotion requirements undertaken at each event
per cent 100 100 100 100
This performance measure has been proposed to be discontinued as it is proposed to be replaced by the 2011-12 measure ‘Major events facilitated with a business plan, budget, branding and promotional activities’.
TimelinessCompletion of Capital Works at the State Sports Centres Trust’s Facilities
date na qtr 4 qtr 4 nm
This performance measure has been proposed to be discontinued as the project is expected to be completed in 2010-11.
Completion of pavilion and fields works and continuation of Lakeside Oval works at the State Sports Facility Project in Albert Park
date na qtr 4 qtr 4 nm
This performance measure has been proposed to be discontinued as the pavilion and fields works is expected to be completed in 2010-11.
Service Delivery 2011-12 Appendix A Page 465

Major Outputs/DeliverablesPerformance Measures
Unit of Measure
2011-12 Target
2010-11 Expected Outcome
2010-11 Target
2009-10 Actual
Regional Infrastructure DevelopmentQuantity
Regional Infrastructure Development Fund (RIDF) projects funded
number na 20 0 129
This performance measure has been proposed to be discontinued because it is no longer relevant as the RIDF has been replaced by the Regional Growth Fund. This measure has been proposed to be replaced by the 2011-12 performance measure ‘Regional Infrastructure Projects Funded’.
The 2010-11 Target of zero reflected that the new appropriation for RIDF funding was not included in the output at the time of the budget. The 2010-11 Expected Outcome reflects activities during the year through budget subsequently provided.
Small town infrastructure projects funded
number na 50 0 85
This performance measure has been proposed to be discontinued as it is proposed to be consolidated with the 2011-12 performance measure ‘Regional Infrastructure Projects Funded’.
The 2010-11 Target of zero reflected that the new appropriation for Sustainable Small Towns Development Fund (SSTDF) funding was not included in the output at the time of the budget. The 2010-11 Expected Outcome reflects activities during the year through budgets subsequently provided.
QualityRIDF Committee recommendations accepted by Ministers
per cent na 95 90 100
This performance measure has been proposed to be discontinued as it is no longer relevant as the RIDF has been replaced by the Regional Growth Fund.
TimelinessAdvice to RIDF applicants- after receipt of applications
days na 90 90 71
This performance measure has been proposed to be discontinued as it is no longer relevant as the RIDF has been replaced by the Regional Growth Fund.
Regional Economic Development, Investment and PromotionQuantity
Number of Regional Events, Economic Development, Investment and Promotion projects supported
number na 85 85 nm
This performance measure has been proposed to be discontinued as it is proposed to be replaced by the 2011-12 performance measure ‘Economic development, service delivery and community capacity projects funded’.
Source: Department of Planning and Community Development
Page 466 Appendix A Service Delivery 2011-12
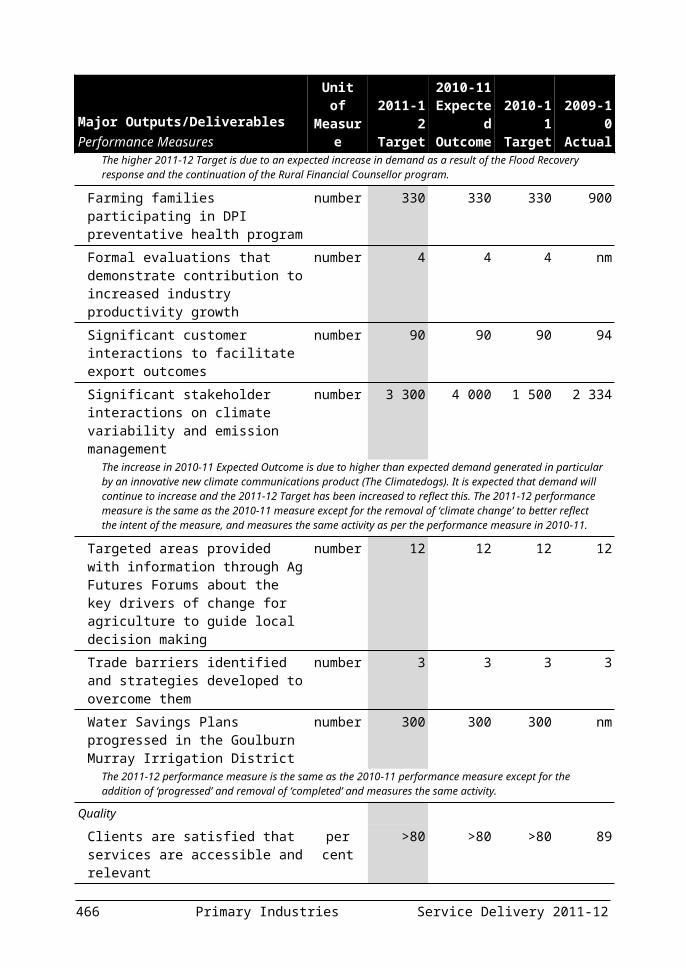
DEPARTMENT OF PREMIER AND CABINET
Major Outputs/DeliverablesPerformance Measures
Unit of Measure
2011-12 Target
2010-11 Expected Outcome
2010-11 Target
2009-10 Actual
Strategic Policy Advice and ProjectsQuantity
Development of the Growing Victoria Together outcomes report for the public
number na 0 1 1
Due to the change in Government, a progress report on Growing Victoria Together has not been developed for the 2011-12 State Budget.
Timeliness Advice provided to government about the bushfire reconstruction and recovery process within agreed timelines
per cent 100 100 100 100
The Victorian Bushfire Reconstruction and Recovery Authority is scheduled to close in June 2011. Responsibility for advice to government about the bushfire reconstruction and recovery process will be transferred to Regional Development Victoria.
Delivery of bushfire reconstruction and recovery projects within agreed timelines
per cent 85 41 85 71
The Victorian Bushfire Reconstruction and Recovery Authority is scheduled to close in June 2011. The 2010-11 Expected Outcome is lower than the 2010-11 Target due to delays caused largely by adverse weather conditions and planning and environmental compliance issues.
Development of the Growing Victoria Together outcomes report within required timeframe
yes/no na no yes yes
Due to the change in Government, a progress report on Growing Victoria Together has not been developed for the 2011-12 State Budget.
Source: Department of Premier and Cabinet
Service Delivery 2011-12 Appendix A Page 467

DEPARTMENT OF PRIMARY INDUSTRIES
Major Outputs/DeliverablesPerformance Measures
Unit of Measure
2011-12 Target
2010-11 Expected Outcome
2010-11 Target
2009-10 Actual
Primary Industries PolicyQuality
Enhanced Fishing Grants: program components meet agreed milestones for delivery
per cent na 90 100 100
This performance measure has been proposed to be discontinued, reflecting the cessation of funding for the program. A new fisheries performance measure ‘Number of native salmonid fish stocked’ will be introduced in line with new funding received for the ‘Improving Recreational Fishing Opportunities in Regional Victoria’ initiative. The lower 2010-11 Expected Outcome is due to the final 10 per cent delivery of on-ground works and final payments to contractors expected to occur in early 2011-12 due to contractual agreements.
Timeliness Completion of a 3D attributed geological model of the Gippsland Basin
per cent na 100 100 nm
This performance measure has been proposed to be discontinued as it is no longer relevant as the 3D attributed geological model of the Gippsland Basin is to be completed in 2010-11.
Strategic and Applied Scientific ResearchQuantity
Area of the State for which first generation regional 3D geological models are available
per cent na 100 100 80
This performance measure has been proposed to be discontinued as the work program associated with this measure will be completed in 2010-11.
Regulation and ComplianceQuantity
Landholders complying with pest plant and animal control requirements under the Catchment and Land Protection Act 1994 within agreed timeframes and in targeted areas
per cent 85 85 85 90
This performance measure has been proposed to be discontinued as it is to be consolidated with the existing measure ‘Properties inspected for invasive plant and animal priority species’ which is a more meaningful indicator of activity undertaken by the department in regards to Invasive Plant and Animal priority species compliance programs. This performance measure has continually met its target in past years but is no longer meaningful as a standalone annual measure due to the impact of uncontrolled external factors on treatment timeframes and the high level of voluntary compliance by landholders.
Source: Department of Primary Industries
Page 468 Appendix A Service Delivery 2011-12

DEPARTMENT OF SUSTAINABILITY AND ENVIRONMENT
Major Outputs/DeliverablesPerformance Measures
Unit of Measure
2011-12 Target
2010-11 Expected Outcome
2010-11 Target
2009-10 Actual
Sustainable Water Management and SupplyQuantity
Unconfirmed water shares on the water register
per cent <1 <2 <2 1.2
This performance measure has been proposed to be discontinued as the project in relation to confirming water shares on the water register will be completed at the conclusion of 2010-11 with approximately 99 per cent of the water shares having their ownership confirmed.
Upgrade or construction of additional bore sites
number na 50 50 81
This performance measure has been proposed to be discontinued as the previous program of the State Observation Bore Network will conclude at the end of 2010-11. The Department is now focusing on the repair and replacement of the bore network in response to the late 2010 and early 2011 floods.
Timeliness Posting of the monthly water report to the Our Water Our Future website within agreed timeframes
per cent 100 100 100 100
This performance measure has been proposed to be discontinued as the posting of the monthly water report to the Our Water Our Future website is currently reported within ‘Water information products delivered for greater accountability in sustainable water resource management’ performance measure.
Urban water reform policy projects completed within agreed timeframes
per cent 90 90 90 90
This performance measure has been proposed to be discontinued due to the implementation of the Government’s Living Melbourne/Living Victoria policy and the establishment of the associated Ministerial Advisory Council. After further water policy reform work is undertaken in 2011-12, the Department will include a relevant performance measure in the 2012-13 budget to better reflect Government priorities on water policy projects.
Water markets and regulatory reform policy projects completed within agreed timeframes
per cent 90 90 90 90
This performance measure has been proposed to be discontinued due to the implementation of the Government’s Living Melbourne/Living Victoria policy and the establishment of the associated Ministerial Advisory Council. After further water policy reform work is undertaken in 2011-12, the Department will include a relevant performance measure in the 2012-13 budget to better reflect Government priorities on water policy projects.
Service Delivery 2011-12 Appendix A Page 469

Major Outputs/DeliverablesPerformance Measures
Unit of Measure
2011-12 Target
2010-11 Expected Outcome
2010-11 Target
2009-10 Actual
Public LandQuality
Crown land reserves that have appointed delegated managers
per cent 90 90 90 90
This performance measure has been proposed to be discontinued as it is proposed to be replaced by the 2011-12 performance measure of ‘Publicly elected Committees of Management that have a current statutory appointment’. The 2011-12 performance measure measures the same activity as the 2010-11 performance measure, however it focuses on the work DSE undertakes to ensure that appointments of land managers are made once the current appointment period of three years has lapsed. It measures the sometimes difficult and/or challenging work required to engage the community to take up these roles in an unpaid capacity or to identify an alternative management regime.
Forests and ParksQuantity
Parks managed by Parks Victoria, assessed as high priority for weeds and pest control
per cent 70 70 70 75
This performance measure has been proposed to be discontinued as it is proposed to be replaced by the performance measure of ‘Number of hectares treated to minimise the impact of pest plants, pest animals and overabundant native animals in parks managed by Parks Victoria’. The 2011-12 performance measure reflects the same activity as the 2010-11 performance measure, however it more clearly reflects the management activity and effectiveness of the weeds and pest programs.
Quality Commercial timber harvesting operations consistent with timber release plans and wood utilisation plans
per cent na 100 100 98
This performance measure has been proposed to be discontinued as it is proposed to be replaced by the 2011-12 performance measure of ‘Level of compliance with environmental regulatory framework for commercial timber operations as required by the Forest Audit Program’. The 2011-12 performance measure reflects the same activity as the 2010-11 performance measure, however whilst the 2010-11 measure related to VicForests, the 2011-12 measure focuses on the Department as an environmental regulator as directed by the timber industry strategy.
Land and Fire ManagementQuantity
Community engagement plans developed and implemented
number 5 5 5 5
This performance measure has been proposed to be discontinued as it is proposed to be replaced by the performance measure of ‘Strategic engagement forums held’. The 2011-12 performance measure reports on the same activities as the 2010-11 performance measure, however while Community Engagement Plans are still developed each year, the Community Engagement function is now focussing on strategic engagement forums. These forums bring a range of stakeholders together to share perspectives and facilitate interaction, improving overall levels of understanding, trust and engagement within the community.
Page 470 Appendix A Service Delivery 2011-12

Major Outputs/DeliverablesPerformance Measures
Unit of Measure
2011-12 Target
2010-11 Expected Outcome
2010-11 Target
2009-10 Actual
Environmental Policy and Climate ChangeQuality
Greenhouse response actions managed and administered
per cent 100 95 95 95
This performance measure has been proposed to be discontinued as whilst formal completion of the program was 30 June 2010, during 2010-11 some initiative programs were still being completed. This performance measure relates to the management and administration of the Our Environment Our Future Sustainability Action Statement.
Statutory Activities and Environment ProtectionQuality
Compliance with statutory requirements, as a proportion of assessments of discharge licences and enforcement notices
per cent 87 87 87 80
This performance measure has been proposed to be discontinued as it proposed to be replaced by the performance measure of ‘Notices complied with by due date or escalation in line with Compliance and Enforcement Policy’. The 2011-12 performance measure is the same as the 2010-11 performance measure, however it better reflects EPA’s risk based approach to compliance.
Source: Department of Sustainability and Environment
Service Delivery 2011-12 Appendix A Page 471

DEPARTMENT OF TRANSPORT
Major Outputs/DeliverablesPerformance Measures
Unit of Measure
2011-12 Target
2010-11 Expected Outcome
2010-11 Target
2009-10 Actual
Public Transport Safety and RegulationQuantity
Annual bus safety mechanical inspections conducted
number na 50 50 61
This performance measure has been proposed to be discontinued as it is no longer relevant with the introduction of the Bus Safety Act 2009. New performance measures have been introduced based on the new Act.
Bus safety audits conducted in accordance with regulatory policy
per cent na 100 100 100
This performance measure has been proposed to be discontinued as it is no longer relevant with the introduction of the Bus Safety Act 2009. New performance measures have been introduced based on the new Act.
Transport Security and Emergency ManagementQuantity
Leadership of, or contribution to, strategic security and emergency management coordination sessions and workshops
number na 50 50 81
This performance measure has been proposed to be discontinued as the combination of the other existing performance measures and new performance measures being introduced this year better reflects the key activities related to the achievement of the objectives of this output.The 2011-12 Target for this proposed discontinued measure is not applicable as the information previously provided by this measure will now be provided in newly developed and amalgamated measures.
Major infrastructure security and emergency management exercises coordinated by the Department of Transport (DOT) consistent with the required standards
number na 1 1 1
This performance measure has been proposed to be discontinued and replaced by the new performance measure ‘Infrastructure security and emergency management exercises coordinated by DOT consistent with the required standards’ that combines both major and minor infrastructure security and emergency management exercises coordinated by DOT. The new performance measure reflects the output of both previous measures and simplifies the method of managing emergency management exercises coordinated by DOT.
Minor infrastructure security and emergency management exercises coordinated by DOT consistent with the required standards
number na 3 3 9
This performance measure has been proposed to be discontinued and replaced by the new performance measure ‘Infrastructure security and emergency management exercises coordinated by DOT consistent with the required standards’ that combines both major and minor infrastructure security and emergency management exercises coordinated by DOT. The new performance measure reflects the output of both previous measures and simplifies the method of managing emergency management exercises coordinated by DOT.
Page 472 Appendix A Service Delivery 2011-12

Major Outputs/DeliverablesPerformance Measures
Unit of Measure
2011-12 Target
2010-11 Expected Outcome
2010-11 Target
2009-10 Actual
Timeliness Marine pollution response action initiated within four hours of notification of an incident
per cent na 100 100 100
This performance measure has been proposed to be discontinued and replaced by the new performance measure ‘All reported marine pollution response action initiated within one hour of notification of an incident’.The 2011-12 Target for this proposed discontinued measure is not applicable as an improved measure that will result in action being initiated within one hour of notification of an incident has been developed.
Specialist Transport ServicesQuantity
Disability Discrimination Act (DDA) compliance for public transport infrastructure: metropolitan train station upgrades
number na 2 2 nm
This performance measure has been proposed to be discontinued as it is expected that no metropolitan train station upgrades will be completed in 2011-12. However, incremental improvements on components of DDA access at train stations will occur across the network in 2011-12.
Disability Discrimination Act (DDA) compliance for public transport infrastructure: regional train station upgrade
number na 2 2 nm
This performance measure has been proposed to be discontinued as it is expected that no regional train station upgrades will be completed in 2011-12. However, incremental improvements on components of DDA access at train stations will occur across the network in 2011-12.
Integrated and Sustainable Transport DevelopmentQuantity
Carpooling program participants number na na 36 10This performance measure has been proposed to be discontinued as the carpooling program will not continue in 2011-12.The carpooling program was under development and review in 2010-11.
Local Area Access Program grant funding committed within agreed timelines
per cent na 100 100 100
This performance measure has been proposed to be discontinued as it is expected to be completed in 2010-11.
Quality Carpooling program progressed within agreed scope or standards
per cent na na 100 100
This performance measure has been proposed to be discontinued as the carpooling program will not continue in 2011-12.The carpooling program was under development and review in 2010-11.
Service Delivery 2011-12 Appendix A Page 473

Major Outputs/DeliverablesPerformance Measures
Unit of Measure
2011-12 Target
2010-11 Expected Outcome
2010-11 Target
2009-10 Actual
Local Area Access Program assessments, monitoring reports and payments undertaken according to grant agreements
per cent na 100 100 100
This performance measure has been proposed to be discontinued as it is expected to be completed in 2010-11.
Timeliness Local Area Access Program activities completed within agreed timelines
per cent na 100 100 100
This performance measure has been proposed to be discontinued as it is expected to be completed in 2010-11.
Low Emission Vehicles Program: All Electric Vehicle Trial grant agreements completed
date na qtr 1 qtr 1 nm
This performance measure has been proposed to be discontinued as it has been completed in 2010-11.
Public Bicycle Hire Scheme: all stations operational
date na qtr 1 qtr 1 nm
This performance measure has been proposed to be discontinued as it has been completed in 2010-11.
Public Transport Infrastructure DevelopmentQuantity
Dandenong Rail Corridor – Westall Station and Stabling Upgrade
per cent na 100 100 49
This performance measure has been proposed to be discontinued as it is expected to be completed in 2010-11.
Laverton Rail Upgrade per cent na 100 100 73This performance measure has been proposed to be discontinued as it is expected to be completed in 2010-11.
Wodonga Rail Bypass per cent na 100 100 78This performance measure has been proposed to be discontinued as it is expected to be completed in 2010-11.
Timeliness Dandenong Rail Corridor Stage 2 – Westall Rail Upgrade: completion of stabling
date na qtr 3 qtr 3 nm
This performance measure has been proposed to be discontinued as it has been completed in 2010-11.
Dandenong Rail Corridor Stage 2 – Westall Rail Upgrade: completion of third track
date na qtr 3 qtr 3 nm
This performance measure has been proposed to be discontinued as it has been completed in 2010-11.
Doncaster Area Rapid Transit (DART): construction works completed for bus stop upgrade works
date na qtr 3 qtr 2 nm
This performance measure has been proposed to be discontinued as it has been completed in 2010-11.
The 2010-11 Expected Outcome differs to the 2010-11 Target due to rescheduling of road works at sites.
Page 474 Appendix A Service Delivery 2011-12
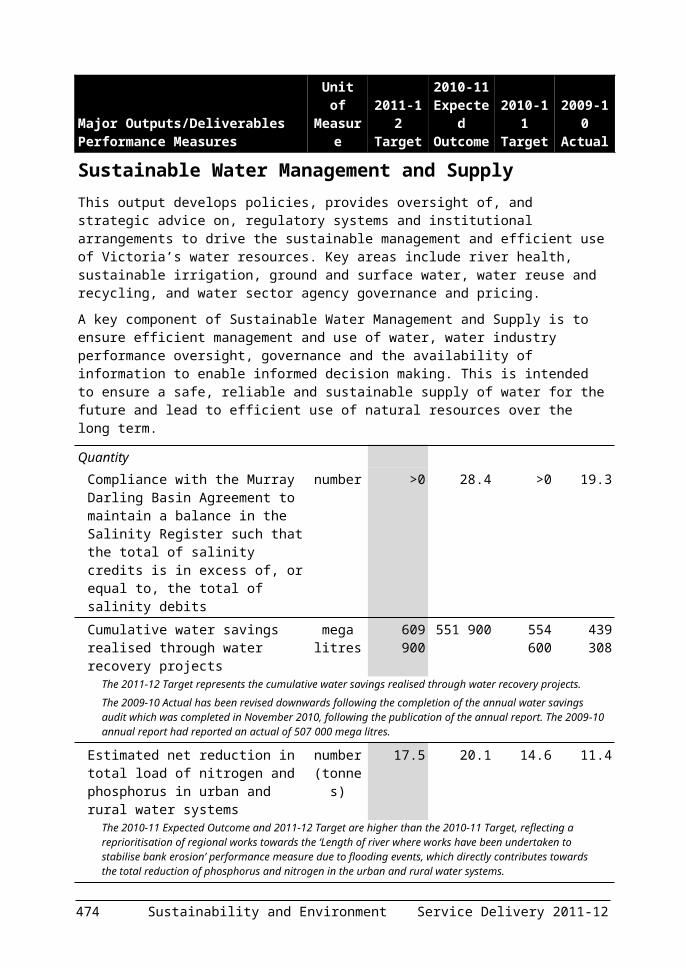
Major Outputs/DeliverablesPerformance Measures
Unit of Measure
2011-12 Target
2010-11 Expected Outcome
2010-11 Target
2009-10 Actual
Doncaster Area Rapid Transit (DART): construction works completed for two on road bus priority treatments
date na qtr 4 qtr 4 nm
This performance measure has been proposed to be discontinued as it is expected to be completed in 2010-11.
Doncaster Area Rapid Transit (DART): start operations
date na qtr 2 qtr 3 nm
This performance measure has been proposed to be discontinued as it has been completed in 2010-11.
The 2010-11 Expected Outcome differs to the 2010-11 Target due to the early availability of buses.
Maryborough Rail Services: services commence
date na qtr 1 qtr 1 nm
This performance measure has been proposed to be discontinued as it has been completed in 2010-11.
Metrol Replacement: existing passenger information system (PRIDE) central computers replaced
date na qtr 2 qtr 2 nm
This performance measure has been proposed to be discontinued as it has been completed in 2010-11.
Metrol Replacement: Train Control and Monitoring System (TCMS) in new main control site installed
date na qtr 3 qtr 3 nm
This performance measure has been proposed to be discontinued as it has been completed in 2010-11.
Metropolitan Train Communications System replacement: system infrastructure installed
per cent na 100 100 50
This performance measure has been proposed to be discontinued as it is expected to be completed in 2010-11.
Procurement of 50 new trams – contract awarded
date na qtr 1 qtr 1 nm
This performance measure has been proposed to be discontinued as it has been completed in 2010-11.
Regional Rail Link: commence land acquisition process
date na qtr 2 qtr 2 nm
This performance measure has been proposed to be discontinued as it has been completed in 2010-11.
Regional Rail Link: tenders sought for first works package
date na qtr 1 qtr 2 nm
This performance measure has been proposed to be discontinued as it has been completed in 2010-11.
SmartBus: Yellow Orbital Stage 2 – Ringwood to Melbourne Airport: completion of bus stop upgrade works
date na qtr 3 qtr 2 nm
This performance measure has been proposed to be discontinued as it has been completed in 2010-11.The 2010-11 Expected Outcome differs to the 2010-11 Target due to rescheduling of road works at sites.
SmartBus: Yellow Orbital Stage 2 – Ringwood to Melbourne Airport: services commence
date na qtr 1 qtr 3 nm
This performance measure has been proposed to be discontinued as it has been completed in 2010-11.
The 2010-11 Expected Outcome differs to the 2010-11 Target due to the early availability of buses.
Service Delivery 2011-12 Appendix A Page 475

Major Outputs/DeliverablesPerformance Measures
Unit of Measure
2011-12 Target
2010-11 Expected Outcome
2010-11 Target
2009-10 Actual
South Morang: commence construction early works
date na qtr 1 qtr 1 nm
This performance measure has been proposed to be discontinued as it has been completed in 2010-11.
South Morang: commence construction main works
date na qtr 2 qtr 3 nm
This performance measure has been proposed to be discontinued as it has been completed in 2010-11.
South Morang: completion of design date na qtr 2 qtr 2 nmThis performance measure has been proposed to be discontinued as it has been completed in 2010-11.
Sunbury Electrification: commence early works
date na qtr 1 qtr 2 nm
This performance measure has been proposed to be discontinued as it has been completed in 2010-11.
Vigilance Control and Event Recording System (VICERS): commence installation on X’Trapolis fleet
date na qtr 4 qtr 2 na
This performance measure has been proposed to be discontinued as it is expected to be completed in 2010-11.
The commencement of VICERS installation on X’Trapolis trains is not expected till qtr 4 2010-11 due to additional time required to resolve industrial testing issues and the need to align the installation schedule with operational train fleet service requirements.
Road Network ImprovementsTimeliness
WestLink: investigations completed and planning documentation finalised
date na qtr 4 qtr 4 nm
This performance measure has been proposed to be discontinued as it is expected to be completed in 2010-11.
WestLink: preferred route identified date na qtr 2 qtr 2 nmThis performance measure has been proposed to be discontinued as it has been completed in 2010-11.
Road Asset ManagementQuality
Proportion of travel on smooth roads: metropolitan
per cent na 91 91 91
This performance measure has been proposed to be discontinued and replaced by the new performance measure ‘Proportion of distressed road pavements: metropolitan’. It has been replaced to more accurately reflect the measure of the actual condition of road pavement and the state of the network, and better supports the management of risks associated with sustaining the network and prioritising the work required.
Proportion of travel on smooth roads: regional
per cent na 93 93 93
This performance measure has been proposed to be discontinued and replaced by the new performance measure ‘Proportion of distressed road pavements: regional’. It has been replaced to more accurately reflect the measure of the actual condition of road pavement and the state of the network, and better supports the management of risks associated with sustaining the network and prioritising the work required.
Page 476 Appendix A Service Delivery 2011-12

Major Outputs/DeliverablesPerformance Measures
Unit of Measure
2011-12 Target
2010-11 Expected Outcome
2010-11 Target
2009-10 Actual
Freight, Logistics, Ports and Marine DevelopmentQuantity
North East Rail Gauge Standardisation per cent na 100 100 70This performance measure has been proposed to be discontinued as it is expected to be completed in 2010-11.
Timeliness Major periodic maintenance works completed: country freight rail network
per cent na 100 100 100
This performance measure has been proposed to be discontinued as it is expected to be completed in 2010-11.
Source: Department of Transport
Service Delivery 2011-12 Appendix A Page 477

DEPARTMENT OF TREASURY AND FINANCE
Major Outputs/DeliverablesPerformance Measures
Unit of Measure
2011-12 Target
2010-11 Expected Outcome
2010-11 Target
2009-10 Actual
Government ServicesQuantity
Significant projects completed number 5 10 13 17This performance measure has been proposed to be discontinued as it primarily relates to the implementation of major Information Technology projects across government, which is now the responsibility of CenITex.
The 2010-11 Expected Outcome is lower than the 2010-2011 Target due to variances in the outputs annual workplan.
Quality Products and services meet service commitments
per cent 90 98 90 100
This performance measure has been proposed to be discontinued as it is no longer relevant primarily due to the establishment of a new service delivery model for procurement.The 2010-11 Expected Outcome is higher than the 2010-11 Target due to the completion of work ahead of schedule.
Significant projects meet critical success factors
per cent 90 100 90 100
This performance measure has been proposed to be discontinued as it primarily relates to the implementation of major Information Technology projects across Government, which is now the responsibility of CenITex.The 2010-11 Expected Outcome is higher than the 2010-11 Target due to the completion of work ahead of schedule.
Timeliness Significant projects delivered within agreed timelines
per cent 90 100 90 100
This performance measure has been proposed to be discontinued as it primarily relates to the implementation of major Information Technology projects across Government, which is now the responsibility of CenITex.The 2010-11 Expected Outcome is higher than the 2010-11 Target due to the completion of work ahead of schedule.
Source: Department of Treasury and Finance
Page 478 Appendix A Service Delivery 2011-12

PARLIAMENTThere are no proposed discontinued or substantially changed measures for Parliament or the Victorian Auditor-General’s Office.
Service Delivery 2011-12 Appendix A Page 479

APPENDIX B – LOCAL GOVERNMENT FINANCIAL RELATIONS
This appendix provides an overview of the local government sector in Victoria and highlights the 2011-12 Budget initiatives that impact on councils. Local government is an essential tier of government in Australia, enshrined in the State’s Constitution. Victoria has 79 councils providing a wide range of services. Many state government programs are either delivered by, or in partnership with, local government. In many cases, state government programs operate in a specific local government area, with in-kind support from and collaboration with, local government.
IMPROVING SERVICE DELIVERY TO LOCAL COMMUNITIESThe Government sees local councils as a key partner in delivering responsive and tailored services. This partnership will be enhanced by opening up better communication channels between the two levels of government and establishing greater clarity regarding their respective roles. This in turn will facilitate the delivery of services to local communities in a more coordinated and consultative manner.A local government Ministerial-Mayors Advisory Panel is being established to consult with local governments and provide high level advice on the impact of state government decisions and legislation to ensure that unfunded responsibilities are not imposed on councils without consultation. In addition, an annual local government Ministerial forum involving all mayors and chief executive officers will provide a mechanism for consultation and sharing of ideas on key issues impacting on the local government sector.Research and projects to address the impact of councils’ asset management requirements on their overall financial viability are underway. These efforts promote the successful integration of asset management into service planning and resource allocation. Access to financial and asset management capacity and expertise by councils and regional councils is an important component of this work.
Service Delivery 2011-12 Appendix B 481

Local governments face significant challenges in managing infrastructure such as roads, bridges, drains and community buildings. A number of programs have been established to address this issue. They include the Regional Growth Fund which includes a $100 million Local Government Infrastructure program to support a range of council initiatives and community assets. Forty rural councils will also be able to apply for a share of $160 million of funding from the Country Roads and Bridges initiative over the next four years to ensure regional roads and bridges are renewed and maintained.
482 Appendix B Service Delivery 2011-12
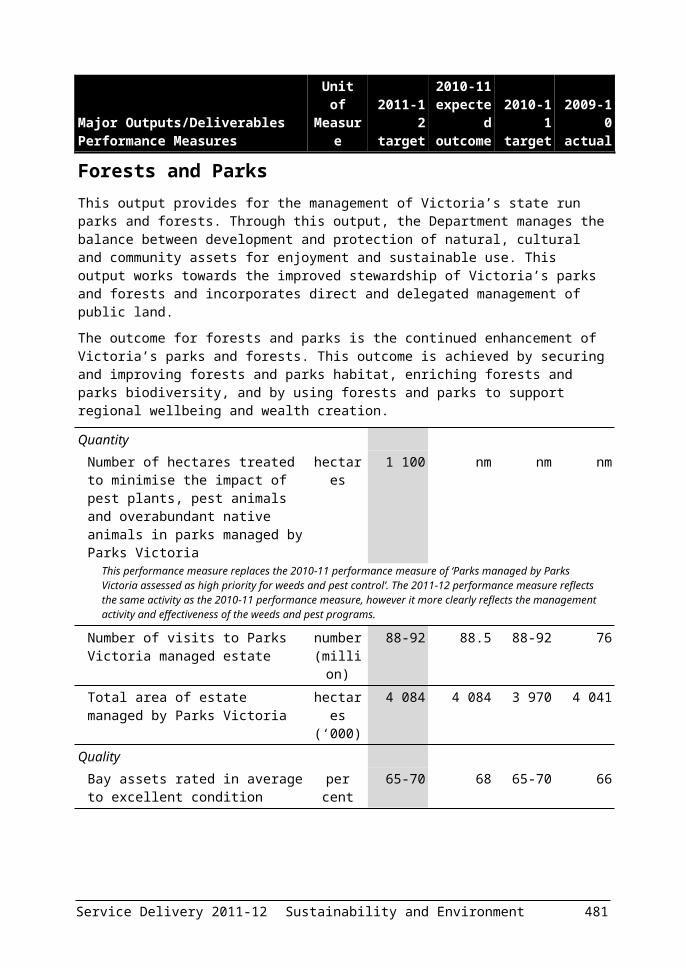
The Government will reform legislation to support local government elections. Legislation will be presented to Parliament to bring forward the date of council elections from November to October to allow incoming councillors to meet the budgeting and corporate planning timetable. Legislation will also be introduced to give the voters of the Greater Geelong City Council the opportunity to directly elect their Mayor for a four year term.The Victorian Competition and Efficiency Commission’s (VCEC) report into streamlining local government regulation identified opportunities to strengthen economic, financial and resource management at the local government level. The Government is committed to supporting councils through a continuous improvement approach. The Government is also considering other reform opportunities identified by VCEC, including harmonisation of building site requirements and enhanced state–local government consultation. The Government will adopt an approach that cuts red tape, undertakes careful analysis and consultation and evaluates the impact of regulations to reduce burden on local government and business.
CREATING LIVEABLE COMMUNITIESThe Government supports local government through the development and maintenance of local infrastructure and facilities. This includes funding under the Green Light Plan to achieve savings through energy efficiency. In addition, new grants will be introduced and a number of existing grants continued to assist councils in the construction of new or enhanced library facilities, delivery of community hubs, improvements to local sporting facilities and heritage protection. Local government is also a key partner in the implementation of the State’s planning policies which shape the future growth of Melbourne and Victoria’s regional cities. A new outcomes based metropolitan planning strategy will be developed with the input of local governments to provide greater certainty and focus development in appropriate locations and at an appropriate scale. Revitalisation of metropolitan and regional activity areas also continues as a priority, including through investment in the Frankston Activities Area.
FUNDING SOURCES TO LOCAL GOVERNMENT IN VICTORIAVictorian local governments spend around $6.1 billion a year1. This expenditure is equivalent to around 2 per cent of Victoria’s gross state product in 2009-10. Councils fulfil vital responsibilities which include community services, local roads, waste management, recreation and cultural activities.
1 According to the most recent Victorian Grants Commission data for the 2009-10 year.
Service Delivery 2011-12 Appendix B 483
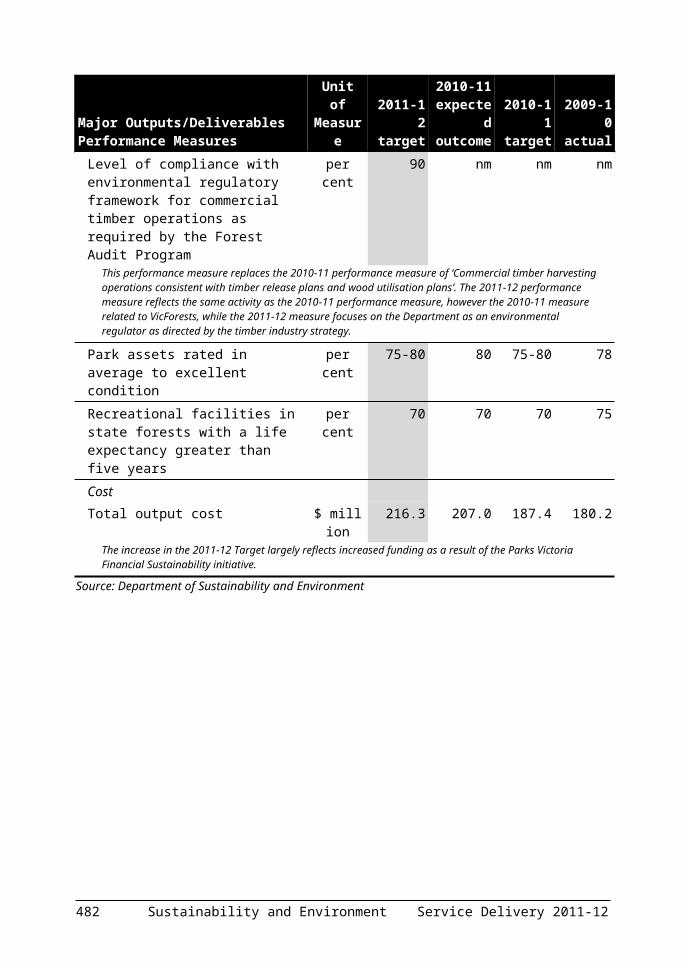
In 2009-10 around 69 per cent of local government recurrent revenue was obtained from rates and charges levied by councils. Around 7 per cent of council recurrent revenue was provided by the Victorian Grants Commission as financial assistance grants which include general purpose grants and local roads grants. Other Commonwealth and Victorian grants comprised approximately a further 9 per cent of ongoing revenue. The remaining 15 per cent of ongoing revenue comes from Maternal Child Health (MCH) and Home and Community Care program (HACC) payments as well as revenues from interest on bank deposits and rental income from assets owned by local government.The Government also provides land and payroll tax exemptions to local government, which benefit Victorian councils by more than $260 million a year (refer to Tables 5.2 and 5.4 in Budget Paper No. 5).
Table B.1: Grants and transfers to local government ($ thousands)
2010-11 Budget
2010-11 Revised
2011-12 Budget
Department of Business Innovation 42 866.2 17 902.3 1 517.3Department of Education and Early Childhood
Development (a) 481.0 481.0 491.2
Department of Health .. .. ..Department of Human Services (b) .. .. ..Department of Justice 1 060.0 5 970.4 11 688.4 Country Fire Authority 800.5 800.5 840.6Department of Planning and Community Development 574 606.8 532 778.9 654 508.2Department of Premier and Cabinet 10 510.0 10 510.0 7 792.1Department of Primary Industries 6 256.2 6 906.2 6 348.2Department of Sustainability and Environment 6 861.2 11 978.0 6 866.6 Parks Victoria 1 110.2 1 110.2 1 110.2 Catchment Management Authorities 765.0 31.7 755.5 Other Environment Agencies 28.0 .. ..Department of Transport 13 305.0 16 987.0 62 356.0Department of Treasury and Finance 13 500.0 121 752.2 218 924.0Total grants 672 150.1 727 208.4 973 198.4Notes: (a) Excludes funds provided to local government from the Maternal Child and Health
Care program as this is for service delivery rather than provided as a grant.(b) Excludes funds provided to local government from the Home and Community Care
(HACC) program as this is for service delivery rather than provided as a grant.
As shown in Table B.1, grants and transfers to local governments are expected to increase from $672 million in the 2010-11 Budget to $973 million in the 2011-12 Budget. This is primarily due to increased funding to local government under the Natural Disaster Relief and Recovery Arrangements and a suite of new initiatives such as the Department of Transport’s Country Roads and Bridges initiative.
484 Appendix B Service Delivery 2011-12

The Department of Planning and Community Development (DPCD) provides the majority of funds to assist local government. Around 73 per cent are Commonwealth financial assistance grants, including road and general purpose grants that are passed on to local government. Grants made to local government by DPCD varied from the original $574.6 million in the 2010-11 Budget to a revised $532.8 million. This variance is mainly due to the Commonwealth bringing forward payments for 2010-11 to June 2010 (2009-10 financial year). This is however, offset by the machinery of government transfer of Regional Development Victoria and the Regional Infrastructure Development Fund into DPCD. Grants and transfers are expected to increase to $654.5 million in the 2011-12 Budget due to the machinery of government change as well as a number of new initiatives in the 2011-12 Budget including funding from the Regional Growth Fund.
Service Delivery 2011-12 Appendix B 485
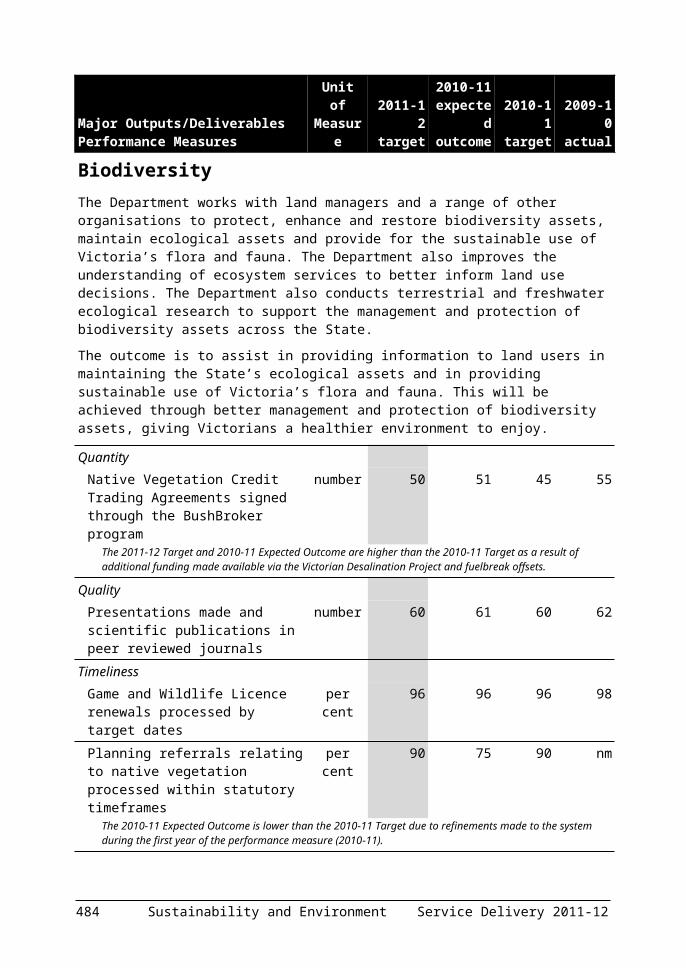
The variance in payments by the Department of Business and Innovation (DBI) to local government is primarily the result of the machinery of government transfer of Regional Development Victoria to the DPCD and a number of programs for which funding ceases in 2010-11.Grants made to local government by the Department of Justice are expected to increase in the 2011-12 Budget from $1.1 million in the 2010-11 Budget to a revised estimate of $6.0 million mainly due to funding provided for the Neighbourhood Safer Places initiative that formed part of the bushfire response. Funding is expected to increase to $11.7 million in the 2011-12 Budget due to the continuation of the Neighbourhood Safer Places funding, Community Crime Prevention Program – Community Safety Fund and Public Safety, which will provide local councils with grants to implement major security infrastructure systems.Grants made to local government by the Department of Sustainability and Environment increased from $6.8 million in the 2010-11 Budget to a revised estimate of $12 million. This variation is mainly due to an increase in projects that work with local government such as Pricing for Sustainability, Small Towns Water Quality Fund, and Weeds and Pests on Public Land.Grants made to local government by the Department of Transport are expected to increase from $13.3 million in the 2010-11 Budget to $62.4 million in the 2011-12 Budget primarily due to the introduction of the Country roads and bridges initiative which provides funding to local councils. Grants made to local government by the Department of Treasury and Finance have increased from $13.5 million in the 2010-11 Budget to a revised estimate of $122 million due to additional funding being provided to local councils under the Natural Disaster Relief and Recovery Arrangements. Funding is principally to reimburse for expenses incurred by local government to restore access and services to affected communities, and to repair pothole and road pavements on sections of the arterial road network damaged by flood waters and storms. Although this funding clearly represents an exceptional situation brought about by the floods, the increase in grant payments is expected to remain high into the 2011-12 Budget as flood repair work continues.
Community Support Fund The Government funds a range of initiatives through the Community Support Fund (CSF), many of which are delivered by local government. These funds are in addition to those specified in Table B.1 outlining Grants and Transfers to Local Government, noting that funding to local
486 Appendix B Service Delivery 2011-12

government can not always be estimated until grant programs are complete. During 2010-11, local governments received funding from a number of government programs which were funded from the CSF. This included the Victorian Community Support Grants program which is administered by the DPCD and which provided grants towards community infrastructure and community participation activities. Some examples of funded projects delivered by local government include: funding of $150 000 to Pyrenees Shire Council as part of a
$575 000 project to establish a Community Resource Centre in Avoca. This project will enable activities such as formal and informal adult education classes, self help groups, community meetings, social interaction, cultural and community activities. The broader project will also refurbish the library and information centre;
funding of $663 000 to Mornington Peninsula Shire Council as part of a $2.08 million project to construct a new Rosebud West Family and Children’s Hub. The new community facility will deliver integrated and joined-up service delivery as well as a variety of meeting spaces and learning areas;
funding of $148 000 to the City of Casey as part of a $978 000 project for the Berwick Springs Park Pavilion and Community Room. The project will establish a community room which includes a new multi purpose space to be utilised by a range of groups in this growing community; and
funding of $250 000 to Corangamite Shire Council as part of a $426 000 project to support community planning in Corangamite Shire. The project will support community members to initiate township improvements to assist their economies, resilience, prosperity and capacity to drive change.
Flood and natural disaster responseThe Department of Treasury and Finance administers the Natural Disaster Relief and Recovery Arrangements (NDRRA), which provide financial assistance to councils affected by natural disasters, such as bushfires, floods and severe storms. This funding is largely used to reimburse costs incurred by local councils in emergency protection and asset restoration works, paying clean up and recovery grants to small business, primary producers and not-for-profit organisations and personal hardship and distress grants to individuals and households. Actual expenditure fluctuates each year depending on the number and magnitude of natural disasters that have occurred and the funding needs of councils.
Service Delivery 2011-12 Appendix B 487

2011-12 BUDGET INITIATIVESThis section outlines the key 2011-12 Budget initiatives by department that will be undertaken in partnership with local government. This section includes initiatives where local government is the recipient of grants and transfers and other initiatives which broadly impact on local government. Funding details for each of these initiatives are provided in Chapters 1 and 2 of this budget paper.
Department of Education and Early Childhood DevelopmentLocal governments enter into joint use agreements with schools to contribute to the building of new schools and school facilities (such as libraries and sports facilities) to enable broader use by the community. In addition, many local governments plan, provide or facilitate kindergarten and child care services. The Department of Education and Early Childhood Development’s 2011-12 Budget initiatives that affect local government are: Children’s facilities capital program; and Small rural kindergartens.
488 Appendix B Service Delivery 2011-12
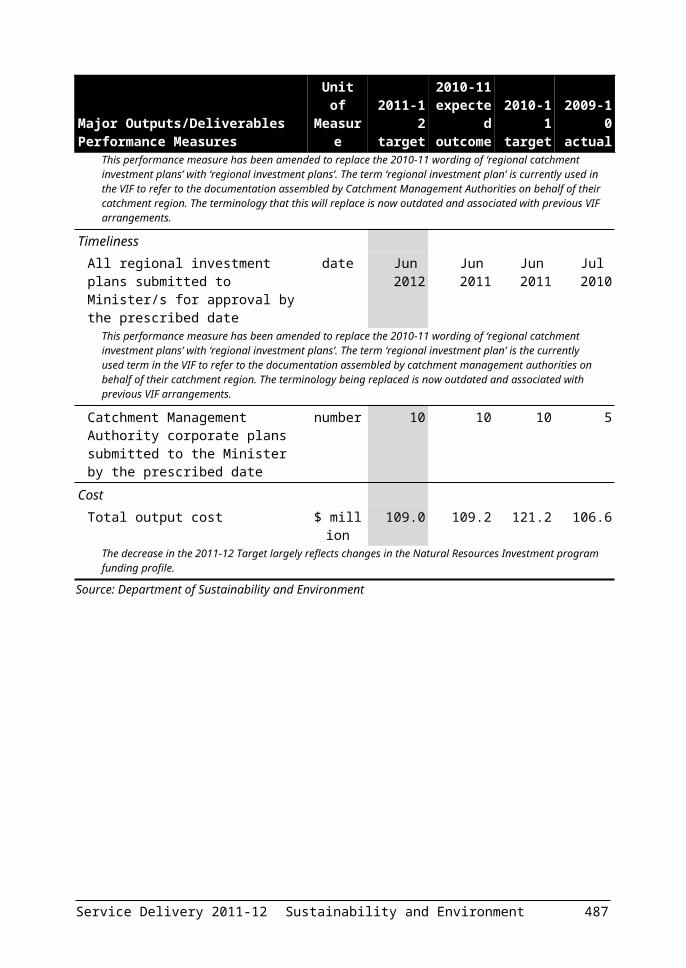
Department of HealthThe Department of Health partners with local government in delivering Home and Community Services and assists in delivering public health services including immunisation and health education programs. The Department of Health’s 2011-12 Budget initiatives that affect local government are: Participation for culturally and linguistically diverse (CALD) seniors;
and Same sex attracted and gender questioning youth suicide
prevention initiative.
Department of Human ServicesThe Department of Human Services partners with local government in a range of areas including disability services. The Department also works with local government to promote a number of community programs such as youth foundations. The Department of Human Services’ 2011-12 Budget initiatives that affect local government are: Intensive ante and post-natal support; Work and learning centres; Creating modernised and inclusive neighbourhood houses; Men’s Sheds program; and Youth Foundations Victoria.
Department of JusticeThe Department of Justice works with local government across a range of programs including emergency management capability, improving community safety and protecting consumers. The Department provides funding to local government for volunteer units of the Victoria State Emergency Service and assists with emergency planning. The Country Fire Authority and local government work closely to provide fire prevention and mitigation programs that reflect local needs.The Department assists with local community safety programs including graffiti removal and prevention and Consumer Affairs Victoria coordinates the delivery of some activities such as inspections and compliance monitoring with local government. The Department of Justice 2011-12 Budget initiatives that affect local government are:
Service Delivery 2011-12 Appendix B 489

Victoria State Emergency Service Command and Control Operational Capability;
Community Crime Prevention Program – Community Safety Fund and Public Infrastructure Safety Fund;
Graffiti prevention and removal strategy; Removing Graffiti –a zero tolerance approach; and Community fire drill pilot program.
Department of Planning and Community DevelopmentThe Department of Planning and Community Development provides a range of grants to local government for libraries, sporting and community assets and provides support for planning. The Department operates programs across Victoria and provides in kind and collaborative support to these programs. The Department of Planning and Community Development’s 2011-12 Budget initiatives that affect local government are: Regional Growth Fund; Green Light Plan to save money and cut emissions; Minor sport and recreation grants; Public libraries capital works program; Revitalising Victoria’s heritage; Changing Places Program; and Community Support and Recreational Package.
Department of Premier and CabinetThe Department of Premier and Cabinet works with local government at various levels, including through Arts Victoria. The Department of Premier and Cabinet’s 2010-11 Budget initiatives that affect local government are: multicultural governance: Settlement Coordination Unit; and Victorian sculpture grants.
Department of Primary IndustriesThe Department of Primary Industries 2011-12 Budget works in partnership with local government across a range of programs including removal of weeds and pests on roadsides, a range of strategic investments to make improvements to boat ramps, and fishing tables to improve recreational fishing experiences in Victoria.
490 Appendix B Service Delivery 2011-12

The Department of Primary Industries initiatives that affect local government are: management of weeds and pests to protect environmental values on
private land in conjunction with the Department of Sustainability and Environment;
enhanced recreational fishing opportunities; and continuation of the Responsible Pet Ownership program.
Department of Sustainability and EnvironmentMany of the Department of Sustainability and Environment’s programs are jointly managed and delivered by local government. In addition, the Department provides a range of materials and information to help assist local government in undertaking its responsibilities, for example, building environmental sustainability through Victoria’s Environmental Sustainability Framework.The Department of Sustainability and Environment’s 2011-12 Budget initiatives that affect local government are: Restoring funds for Landcare support; Protection of beaches and foreshores – beach renourishment in Port
Phillip Bay; Management of weeds and pests to protect environmental values on
public land; Leading the Way – Liveable Victoria Fund – funding for communities
to adopt integrated water cycle management; and Community Green Fund grants program.
Department of Transport The Department of Transport, as the provider of essential public transport, roads and ports infrastructure in Victoria, works closely with local government to deliver the broad range of infrastructure initiatives that benefit Victorian communities. Local government contributes to the Department’s activities by receiving funding, delivering projects, providing in kind support and consulting with the State. The Department of Transport’s 2011-12 Budget initiatives that affect local government are: Country roads and bridges initiative; Fixing country level crossings, including Warragul station precinct;
and Opening unused railway station buildings to community and
sporting groups.
Service Delivery 2011-12 Appendix B 491

Flood responseThere are a range of 2011-12 Budget initiatives relating to the floods which transcend departmental boundaries and are managed on a government wide basis and affect local government: Regional recovery coordination (DHS); Psychosocial support package (DHS); Disease control (DH); Community Infrastructure Fund (DPCD and DSE); Assistance to early childhood providers and families (DEECD); Local government cleanup fund (DPCD); Community recovery fund (DPCD); and Flood recovery officers (DPCD).
492 Appendix B Service Delivery 2011-12

ABBREVIATIONS AND ACRONMYMS
AAS Australian Accounting StandardAASB Australian Accounting Standards BoardABS Australian Bureau of StatisticsACAP Aged Care Assessment ProgramAEMO Australian Energy Market OperatorASEAN Association of Southeast Asian NationsATNAB Addition to Net Asset BaseAuSSIVic Australian Sustainable Schools Initiative Victoria
BRC Biosciences Research Centre
CACP Community Aged Care PackagesCALD Culturally and Linguistically DiverseCBD Central business districtCFA Country Fire AuthorityCGC Commonwealth Grants CommissionCML CityLink Melbourne LimitedCOAG Council of Australian GovernmentsCPI Consumer Price IndexCSF Community Support Fund
DBI Department of Business and InnovationDEECD Department of Education and Early Childhood
DevelopmentDH Department of HealthDHS Department of Human ServicesDPC Department of Premier and CabinetDPCD Department of Planning and Community DevelopmentDPI Department of Primary IndustriesDSE Department of Sustainability and EnvironmentDTF Department of Treasury and Finance
EACH Extended Aged Care at HomeEACHD Extended Aged Care at Home DementiaECIRS Exceptional Circumstances Interest Rate SubsidyEGM Electronic Gaming MachinesESSS Emergency Services and State SuperESTA Emergency Services Telecommunications Authority
Service Delivery 2011-12 Abbreviations and acronyms 493

494 Abbreviations and acronyms Service Delivery 2011-12

FAL Financial accommodation levyFIRS Federal Interstate Registration SchemeFMA Financial Management Act 1994FOI Freedom of InformationFRS Financial Reporting Standard
GAIC Growth Areas Infrastructure ContributionGFS Government Finance StatisticsGLBTI Gay, lesbian, bisexual, transgender and intersexGP General PractitionerGSP Gross state productGST Goods and services taxHACC Home and Community CareHAF Housing Affordability FundHFE Horizontal fiscal equalisationHIV Human immunodeficiency virus
IBAC Independent Broad-based Anti-corruption CommissionICT Information and communications technologyIMF International Monetary FundIT Information technologyITE Income tax equivalent
LCA Loan Council Allocation
MCH Maternal Child HealthMICA Mobile Intensive Care AmbulanceMYEFO Mid-Year Economic and Fiscal Outlook 2010-11
NDRRA National Disaster Relief and Recovery ArrangementsNECA National Electricity Code AdministratorNFPS Non-financial public sectorNP National PartnershipsNPAPH National Partnership Agreement on Preventative HealthNSW New South WalesNVIRP Northern Victoria Irrigation Renewal Project
OVGA Office of the Victorian Government Architect
PAEC Public Accounts and Estimates CommitteePEBU Pre-Election Budget UpdatePFC Public financial corporationPNFC Public non-financial corporationsPPP Public private partnershipPPRR Preparation, prevention, response and recovery
Service Delivery 2011-12 Abbreviations and acronyms 495

RASV Royal Agricultural Society of VictoriaRBA Reserve Bank of AustraliaRCH Royal Children’s HospitalRCHF Royal Children’s Hospital FoundationRFC Rural Finance CorporationRRL Regional Rail Link
S&P Standard & Poor’sSECV State Electricity Commission of VictoriaSPP Specific purpose paymentsTAC Transport Accident CommissionTAFE Technical and Further EducationTCV Treasury Corporation of VictoriaTEI Total estimated investmentTIML Transurban Infrastructure Melbourne Limited
UPF Uniform Presentation FrameworkUS United States of AmericaVAGO Victorian Auditor-General’s Office
VCA Victorian College of the ArtsVCEC Victorian Competition and Efficiency CommissionVCGLR Victorian Commission for Gambling and Liquor RegulationVICSES Victorian State and Emergency ServiceVicTrack Victorian Rail TrackVLIL Victoria – Leader in LearningVMIA Victorian Managed Insurance AuthorityVPS Victorian Public ServiceVPTDA Victorian Public Transport Development AuthorityVRGF Victorian Responsible Gambling FoundationVWA Victorian WorkCover Authority
YACVic Youth Affairs Council of VictoriaYMCA Young Men’s Christian Association
496 Abbreviations and acronyms Service Delivery 2011-12

Service Delivery 2011-12 Abbreviations and acronyms 497

STYLE CONVENTIONS
Figures in the tables and in the text have been rounded. Discrepancies in tables between totals and sums of components reflect rounding. percentage changes in all tables are based on the underlying unrounded amounts.The notation used in the tables and charts is as follows:
LHS left-hand-sideRHS right-hand-sides.a. seasonally adjustedn.a. or na not available or not applicableCat. No. catalogue number1 billion 1 000 million1 basis point 0.01 per centnm new measure.. zero, or rounded to zerotbd to be determinedongoing continuing output, program, project etc.(xxx.x) negative numbers
Service Delivery 2011-12 Style conventions 499

500 Style conventions Service Delivery 2011-12

INDEX
22011 Victorian Families Statement, 2
AAboriginal. See IndigenousAgriculture, 74
First Farm Grant, 138Animal Welfare, 74–75Arts, 71–72, 133–35, 136
Regional, 5, 72
BBusiness, 9
Collaboration, 9Economy, 9Employment and Industrial
Relations, 17, 104Exports, 9Industries and Innovation, 14–16,
102–3Investment, 9Investment and trade, 16, 103Jobs, 9Major projects, 17Marketing Victoria, 17, 103–4Research, 9Science and technology, 9Tourism, 9
CChild Protection, 7, 48–50, 69, 120Community development, 130Community safety, 3Community service organisations, 121Community Support Fund, 79Concessions
Electricity, 3, 50Stamp duty, 3, 91, 92Water and sewerage, 122
DDental health. See HealthDepartment of Business and Innovation. See also Budget Paper No. 5
Asset initiatives, 17, 104Employment and Industrial
Relations, 162–63Income from transactions, 154Industries and Innovation, 156–59Investment and Trade, 160–61Major Projects, 166Marketing Victoria, 164–65Output initiatives, 14, 102Output performance measures for
review, 380–81
Output summary, 153Parliamentary authority for
resources, 154Department of Education and Early Childhood Development. See also Budget Paper No. 5
Asset initiatives, 25, 109Early Childhood Services, 171–72Income from transactions, 169Output initiatives, 18, 105Output performance measures for
review, 382Output summary, 168Parliamentary authority for
resources, 169School Education, 173–82Skills and Adult Community, 183–86
Department of Health. See also Budget Paper No. 5
Acute Health Services, 191–95Ageing, Aged and Home Care, 201–
4Ambulance Services, 196–98Asset initiatives, 41, 116Drug Services, 213–15
Service Delivery 2011-12 Index 501
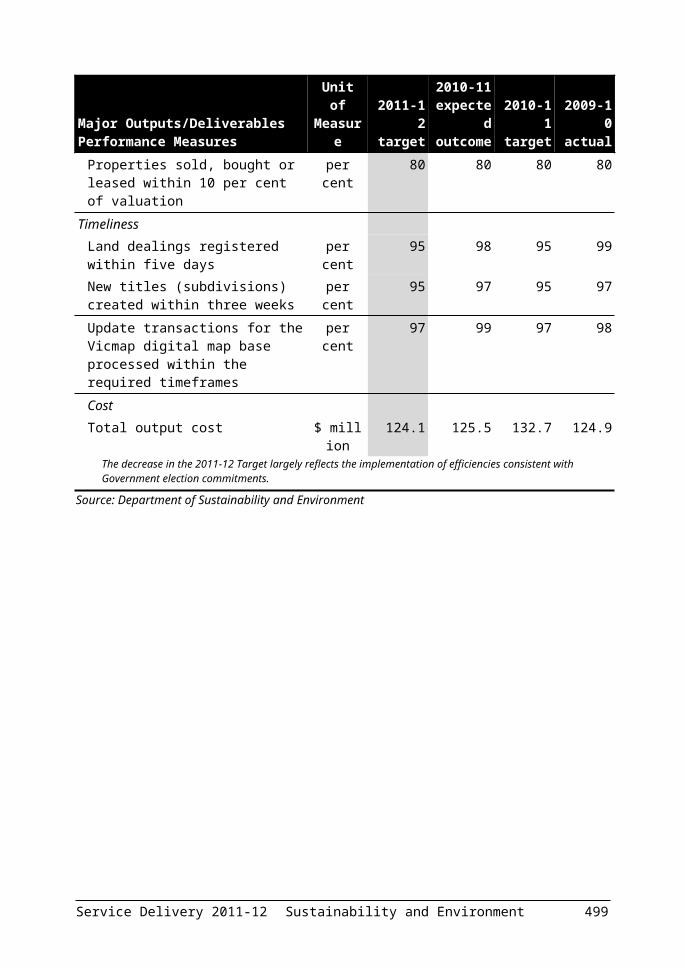
Income from transactions, 190Mental Health, 199–200Output initiatives, 29, 112Output performance measures for
review, 383–85
Output summary, 189Parliamentary authority for
resources, 190Primary, Community and Dental
Health, 205–6Public Health, 209–12Small Rural Services, 207–8
Department of Human Services. See also Budget Paper No. 5
Asset initiatives, 52, 123Child Protection and Family
Services, 222–24Concessions to Pensioners and
Beneficiaries, 227–28Disability Services, 219–21Empowering individuals and
communities, 232–35Housing Assistance, 229–31Income from transactions, 218Output initiatives, 47, 119Output performance measures for
review, 386–88
Output summary, 217Parliamentary authority for
resources, 218Youth Services and Youth Justice,
225–26Department of Justice. See also Budget Paper No. 5
Asset initiatives, 59, 127Community Operations, 248–49Dispensing Justice, 248–49Enforcing Correctional Orders, 254–
55Gambling Regulation and Racing
Industry Development, 258–59Income from transactions, 238Legal Support to Government and
Protecting the Rights of Victorians, 242–47
Output initiatives, 54, 124Output performance measures for
review, 389Output summary, 237Parliamentary authority for
resources, 238Protecting Consumers, 256–57Public Safety and Crime Reduction,
239–41Supporting the State’s Fire and
Emergency Services, 252–53Department of Planning and Community Development. See also Budget Paper No. 5
Asset initiatives, 65, 131Income from transactions, 262Investing in Communities, 269–76Metropolitan and Regional Planning
and Development, 264–68Output initiatives, 61, 128Output performance measures for
review, 390–93
Output summary, 261
502 Index Service Delivery 2011-12

Parliamentary authority for resources, 262
Department of Premier and Cabinet. See also Budget Paper No. 5
Arts and Cultural Development, 289–93
Asset initiatives, 72, 136Income from transactions, 279Multicultural Affairs and
Citizenship, 287–88Output initiatives, 66, 132Output performance measures for
review, 394Output summary, 278Parliamentary authority for
resources, 279Public Sector Management,
Governance and Support, 283–86Strategic Policy Advice and
Support, 280–82Department of Primary Industries. See also Budget Paper No. 5
Asset initiatives, 75, 138Income from transactions, 296Output initiatives, 73, 137Output performance measures for
review, 395Output summary, 295Parliamentary authority for
resources, 296Sustainable Development of
Primary and Energy Industries, 297–304
Department of Sustainability and Environment. See also Budget Paper No. 5
A healthy and resilient natural environment, 315–17
Asset initiatives, 79, 142Effective adaptation to the impacts
of climate change, 321–23Effective management of fire, 318–
20Healthy and Productive Land, 311–
14Income from transactions, 307Land Administration and Property
Information, 324–25Output initiatives, 76, 139Output performance measures for
review, 396–98
Output summary, 306Parliamentary authority for
resources, 307Sustainable Water Management and
Supply, 308–10
Department of Transport. See also Budget Paper No. 5
Asset initiatives, 85, 144Income from transactions, 327Integrated Transport Planning,
Delivery and Management, 341–50
Output initiatives, 80, 143Output performance measures for
review, 399–404
Output summary, 327Parliamentary authority for
resources, 328Public Transport Services, 336–40Transport Safety and Security, 329–
35Department of Treasury and Finance. See also Budget Paper No. 5
Asset initiatives, 146Financial Management Services,
358–61Income from transactions, 353Output initiatives, 90, 145Output performance measures for
review, 405Output summary, 352Parliamentary authority for
resources, 353Regulatory Services, 366–68Resource Management Services,
364–65Revenue Management Services, 369Risk Management Services, 362–63Strategic Policy Advice, 354–57
Disability services, 47, 48, 119–20
Service Delivery 2011-12 Index 503

Disaster response, 2–3Bushfires, 2, 55, 59, 135, 136Emergency management, 2Flood damage, 2Flood response, 95–101, 101Infrastructure, 3, 74Interstate/International, 136Natural Disaster Assistance Unit,
68
EEducation. See Department of Education and Early Childhood Development
Education and skills, 6Anti-bullying, 6, 23Children’s services, 6Disabilities, 6, 22, 109–10Disability, 107–8Early childhood, 6, 19–20Early intervention, 6, 105Kindergarten, 6, 106Kindergartens, 19Rural kindergartens, 6, 19School education, 6, 20–24, 25–27,
107–8Schools, 110Technical and Further Education, 6,
25, 108, 111
Efficiencies, 1Election commitments, 1, 11Emergency services and volunteer organisations, 55–56, 58, 100, 124–25, 127
Energy Technology Innovation Strategy, 73
Environment, 8, 141, See also Department of Sustainability and Environment; Department of Primary Industries
Communities caring for the environment, 77
Park rangers, 8, 140Pests and weeds, 8, 75, 137, 140Wildlife rehabilitators, 139
FFirst Home Buyers
First Home Bonus, 90Land Transfer Duty concession, 91
Forests and parks, 77–78, 79, 100, 139–40, 142
GGovernment election commitment savings, 92
Government-wide initiativesAsset initiatives, 101Output initiatives, 94
504 Index Service Delivery 2011-12

HHealth. See also Department of Health
Aged care, 38Aged Care, 114–15Ambulance, 5, 35–36, 43–44, 91Dental, 39Dental health, 5Drug services, 40, 115, 121Hospital beds, 5Hospitals, 5, 30–31, 112–13, 116–18Major projects, 42Maternal and child health line, 106Mental health, 5, 36–38, 43, 113Public health, 5, 40, 115Rural and regional health, 32–33,
42–43, 44–45Heritage Asset Management Strategy, 147
Hospitals. See HealthHousing, 51
IIndigenous, 7, 63–64, 121, 129Initiatives, 1Integrity of government, 8–9, 67–69
Anti-corruption Commission, 8, 67, 72
Freedom of Information, 8Hospital Performance website, 9
JJustice. See also Department of Justice
Additional prison beds, 56, 59Community Legal Centres, 126Community Safety Fund, 4Gambling, 4, 58Neighbourhood Watch, 4Police, 3, 56, 57, 59, 126, 127Protective Services Officers, 56Public Infrastructure Safety Fund,
4, 57Public safety and crime reduction,
56–57Serious sex offender management,
126
KKindergartens. See EducationKoorie. See Indigenous
LLapsing programs, 2Liquor licence fee reduction, 92Local communities, 6–7
Skilled Stadium, 7Victorian Collect of the Arts, 7
Local councils, 1Local government, 1, 11, 64, 130
Community Support Fund, 410–11Flood and natural disaster
response, 411Flood response, 414Funding sources to local
government, 408–10Land tax, 409Local communities, 407–8
MMental health. See HealthMulticultural, 7, 69–71, 132–33
NNeighbourhood houses, 122Neighbourhood Watch, 4, 9
OObjectives, 1, 11Olivia Newton-John Cancer and Wellness Centre, 5, 103, 118
Operating surplus, 1Out-of-home care, 49, 120
PParliament
Asset initiatives, 147Income from transactions, 372Legislative Assembly, 374Legislative Council, 373Output initiatives, 147Output performance measures for
review, 406Output summary, 371Parliamentary authority for
resources, 372Parliamentary Investigatory
Committees, 376Parliamentary Services, 375Victorian Auditor-General’s Office,
377–78Police. See Justice
Service Delivery 2011-12 Index 505

Public Accounts and Estimates Committee, 11
Public health. See HealthPublic transport. See Transport
RRebates
Energy efficiency rebates, 78Water efficiency rebates, 77
Regional and country Victoria, 4–5, 64–65, 68, 69
Ballarat Health Service, 31Bendigo Hospital, 5Centre for Multicultural Youth, 51Farm debt mediation scheme, 15Geelong Manufacturing Council, 15Geelong Regional Airport feasibility
study, 15Local communities, 5Regional Aviation Fund, 16Regional growth, 131Regional tourism, 99Transport, 82–83, 87–88, 86, 87
Regional Growth Fund, 5, 64Regional Rail Link. See Transport, Regional Rail Link
Responsible Pet Ownership Program, 138
Revenue initiatives, 91, 148Rural and country Victoria
Bendigo Hospital, 42Rural and regional health, 32–33
SSchools. See EducationSeniors, 7, 53, 92Shotgun Education Program, 141Skills. See Education and skillsSport and recreation, 7, 62–63, 78, 129, 131
Strategic priorities, 1, 11Sustainability, 78, 140–41Sustainable fisheries, 138
TTargets, 1, 11Taxation and compliance, 145, 148Transport, 4, See also Department of Transport
Boating safety program, 143Graduated Licensing System, 143Maintaining our Rail Network Fund,
4, 81Metropolitan roads, 85–86Ports, 84, 143, 144Regional Rail, 82–83, 87Regional Rail Link, 4Regional rail network, 99Regional Roads, 83, 87–88
506 Index Service Delivery 2011-12

Road safety, 4, 83, 89Roads, 143, 144Taxi Services Commission, 84Trains, 4, 81–82, 86–87
UUrban planning, 7–8, 61–62, 128
Metropolitan, 8
VVeterans, 63, 130Victoria Police. See JusticeVictorian Economic and Financial Statement, 1
Victorian Energy Efficiency Target, 145
WWater, 76–77, 140, See also Department of Sustainability and Environment
YYouth, 51, 122–23
Promoting Youth Pathways, 51, 123Youth Affairs Council of Victoria,
123Youth Foyers, 52Youth justice, 50, 121, 123
Service Delivery 2011-12 Index 507

508 Index Service Delivery 2011-12