draft - port of los angeles pedro bay ports clean air action plan draft - clean diesel & alt...
TRANSCRIPT

DRAFT June 2006
DRAFT
SAN PEDRO BAY PORTS CLEAN AIR ACTION PLAN TECHNICAL REPORT
APPENDIX A
June 2006

San Pedro Bay Ports Clean Air Action PlanDRAFT - Scenarios for Policy DiscussionHeavy-Duty Vehicles (Trucks)DRAFT DRAFT
Total DPM NOx Scenairo Costs(tpy) (tpy) (US$)
Budget Scenario 1 (1) 98 823 $194,000,000Budget Scenario 1 (3) 241 461 $194,000,000Budget Scenario 2 (1) 80 666 $194,000,000Budget Scenario 2 (3) 191 518 $194,000,000Budget Scenario 3 259 604 $194,000,000Budget Scenario 4 255 591 $194,000,000Budget Scenario 5 252 532 $194,000,000Budget Scenario 6 789 6,219 $2,097,600,000Budget Scenario 7 782 6,228 $1,789,300,000Budget Scenario 8 779 6,281 $1,476,500,000Budget Scenario 9 387 2,885 $998,000,000Budget Scenario 10 487 3,679 $998,000,000Budget Scenario 11 699 6,059 $998,000,000Budget Scenario 12 858 7,181 $2,678,400,000
Reductions (5th Year)
823 858
255 252
789 782 779
98 19180 259241387 487
699
7,181
6,219
461 666 518 604 591
6,2816,228
532
3,679
2,885
6,059
$2,678$194 $194 $194 $194 $194 $194 $194 $2,098 $1,477$1,789 $998 $998 $998
0
1,000
2,000
3,000
4,000
5,000
6,000
7,000
8,000
Budget S
cenar
io 1
(1)
Budget S
cenar
io 1
(3)
Budget S
cenar
io 2
(1)
Budget S
cenar
io 2
(3)
Budget S
cenar
io 3
Budget S
cenar
io 4
Budget S
cenar
io 5
Budget S
cenar
io 6
Budget S
cenar
io 7
Budget S
cenar
io 8
Budget S
cenar
io 9
Budget S
cenar
io 10
Budget S
cenar
io 11
Budget S
cenar
io 12
(tpy
Red
ucte
d (5
th Y
ear)
)
DPM NOx Total Scenairo Costs ($ Millions)
(Scenario Total Funding in $ Millions)
Page 1 of 83

San Pedro Bay Ports Clean Air Action PlanDRAFT - Scenarios for Policy DiscussionHeavy-Duty Vehicles (Trucks)DRAFT DRAFT
DPM NOx Total Scenairo Costs Ports & SCAQMD Bond or Other Funding(tpy) (tpy) (US$) (US$) (US$)
Budget Scenario 6 789 6,219 $2,097,600,000 $204,000,000 $1,893,600,000Budget Scenario 7 782 6,228 $1,789,300,000 $206,000,000 $1,583,300,000Budget Scenario 8 779 6,281 $1,476,500,000 $204,000,000 $1,272,500,000
Reductions (5th Year)
$204,000,000$206,000,000$204,000,000
$1,272,500,000
$1,583,300,000
$1,893,600,000
$0
$500,000,000
$1,000,000,000
$1,500,000,000
$2,000,000,000
$2,500,000,000
Budget Scenario 6 Budget Scenario 7 Budget Scenario 8
Ports & SCAQMD Bond or Other Funding
Total Costs Over 5-Year Period
Page 2 of 83

San Pedro Bay Ports Clean Air Action PlanDRAFT - Scenarios for Policy DiscussionHeavy-Duty Vehicles (Trucks)
Totals Over 5 FY DRAFT
< PRELIMINARY DRAFT RESULTS >
Tot
al C
lean
Air
Act
ion
Pla
n C
lean
Die
sel (
CD
) In
cen
t ive
s
Tot
al C
lean
Air
Act
ion
Pla
n A
lt F
uel
Sp
endi
n g
Tot
al 5
Fis
cal Y
ear
Ince
nt i
ves
< PRELIMINARY DRAFT RESULTS >Budget Scenario 1 $140,000,000 $54,000,000 $194,000,000 HDV Fleet Truck Characteristic (from work on 2005 EI Update)Budget Scenario 2 $36,000,000 $158,000,000 $194,000,000 ~40,000+ Individual Trucks Serving San Pedro Bay PortsBudget Scenario 3 $152,000,000 $42,000,000 $194,000,000
Budget Scenario 4 $142,000,000 $52,000,000 $194,000,000Budget Scenario 5 $104,000,000 $90,000,000 $194,000,000 ~7,000 Frequent Callers (7 trips/wk or more) = 50% of All CallsBudget Scenario 6 $102,300,000 $1,995,300,000 $2,097,600,000 ~9,800 Semi-Frequent Callers (3.5 to <7 trips/wk) = 30% of All CallsBudget Scenario 7 $784,100,000 $1,005,200,000 $1,789,300,000 ~16,800 Frequent/Semi-Frequent Callers Make 80% of All CallsBudget Scenario 8 $1,444,500,000 $32,000,000 $1,476,500,000
Budget Scenario 9 $6,000,000 $992,000,000 $998,000,000
Budget Scenario 10 $486,000,000 $512,000,000 $998,000,000Budget Scenario 11 $966,000,000 $32,000,000 $998,000,000 Note: $1M/year is included in Tech Adv Program for electric/hybrid trucks (not shown)Budget Scenario 12 $1,072,800,000 $1,605,600,000 $2,678,400,000
Budget Scenario 1 Deployment Combination 1 DPM NOx Deployment Combination 2 DPM NOxFunding Mostly CD New Trucks 100% CD Funding New Trucks 1,081 trucks 77 653 100% CD Funding New Trucks 1,081 trucks 77 653
100% Alt Fuel Funding New LNG 276 trucks 20 170 100% Alt Fuel Funding Westport LNG 276 trucks 20 1851,357 trucks 98 298 Total 823 2,378 Total 1,357 trucks 98 298 Total 838 2,422 Total
Deployment Combination 3 DPM NOx Deployment Combination 4 DPM NOxFunding Mostly CD DPFs 100% CD Funding DPFs 5,700 DPFs 186 0 100% CD Funding DPFs 5,700 DPFs 186 0
100% Alt Fuel Funding New LNG 746 trucks 55 461 100% Alt Fuel Funding Westport LNG 746 trucks 54 501241 814 Total 461 1,217 Total 241 814 Total 501 1,337 Total
Budget Scenario 2 Deployment Combination 1 DPM NOx Deployment Combination 2 DPM NOxFunding Mostly Alt Fuel New Trucks 100% CD Funding New Trucks 278 trucks 20 148 100% CD Funding New Trucks 278 trucks 20 148
100% Alt Fuel Funding New LNG 828 trucks 61 518 100% Alt Fuel Funding Westport LNG 828 trucks 60 5601,106 trucks 80 254 Total 666 2,057 Total 1,106 trucks 80 254 Total 708 2,170 Total
Deployment Combination 3 DPM NOx Deployment Combination 4 DPM NOxFunding Mostly CD DPFs 100% CD Funding DPFs 4,000 DPFs 131 0 100% CD Funding DPFs 4,000 DPFs 131 0
100% Alt Fuel Funding New LNG 828 trucks 61 518 100% Alt Fuel Funding Westport LNG 828 trucks 60 560191 796 Total 518 1,332 Total 191 796 Total 560 1,445 Total
Budget Scenario 3 Deployment Combination 1 DPM NOx Deployment Combination 2 DPM NOxFunding Mostly CD CD Funding New Trucks 66% 775 trucks 56 473 CD Funding New Trucks 66% 775 trucks 56 473
CD Funding DPFs 34% 5,742 DPFs 188 0 CD Funding DPFs 34% 5,742 DPFs 188 0Alt Fuel Funding New LNG 212 trucks 16 130 Alt Fuel Funding Westport LNG 212 trucks 15 142
987 trucks 259 783 Total 604 1,724 Total 987 trucks 259 783 Total 615 1,763 Total5,742 DPFs 5,742 DPFs
Budget Scenario 4 Deployment Combination 1 DPM NOx Deployment Combination 2 DPM NOxFudning Mostly CD CD Funding New Trucks 64% 702 trucks 50 429 CD Funding New Trucks 0% 702 trucks 50 429
CD Funding DPFs 36% 5,680 DPFs 186 0 CD Funding DPFs 0% 5,680 DPFs 186 0Alt Fuel Funding New LNG 265 trucks 19 163 Alt Fuel Funding Westport LNG 0 trucks 19 178
967 trucks 255 773 Total 591 1,694 Total 702 trucks 255 773 Total 606 1,743 Total5,680 DPFs 5,680 DPFs
Budget Scenario 5 Deployment Combination 1 DPM NOx Deployment Combination 2 DPM NOxFudning Mostly Alt Fuels Alt Fuel Funding New LNG 467 trucks 34 287 Alt Fuel Funding Westport LNG 467 trucks 34 313
CD Funding New Trucks 50% 402 trucks 29 245 CD Funding New Trucks 50% 402 trucks 29 245CD Funding DPFs 50% 5,778 DPFs 189 0 CD Funding DPFs 50% 5,778 DPFs 189 0
868 trucks 252 771 Total 532 1,538 Total 868 trucks 252 771 Total 558 1,621 Total5,778 DPFs 5,778 DPFs
#'s
#'s
#'sReductions (tpy) - 5th Year & Total Reductions Reductions (tpy) - 5th Year & Total Reductions
Reductions (tpy) - 5th Year & Total Reductions
Reductions (tpy) - 5th Year & Total Reductions Reductions (tpy) - 5th Year & Total Reductions
Total #'s
#'s
#'s #'s
#'sReductions (tpy) - 5th Year & Total Reductions
Reductions (tpy) - 5th Year & Total Reductions Reductions (tpy) - 5th Year & Total Reductions
Reductions (tpy) - 5th Year & Total Reductions#'s
#'sReductions (tpy) - 5th Year & Total ReductionsReductions (tpy) - 5th Year & Total Reductions
#'s
Reductions (tpy) - 5th Year & Total Reductions
Of Those,
#'s #'sReductions (tpy) - 5th Year & Total Reductions Reductions (tpy) - 5th Year & Total Reductions
#'s
Draft 37 Common Days Frequent Truck MY Distribution 2005 EI for POLA & POLB
0%
2%
4%
6%
8%
10%
12%
2006
2004
2002
2000
1998
1996
1994
1992
1990
1988
1986
1984
1982
1980
1978
1976
1974
Model Year
Per
cen
tag
e
Average 2005 EI MY for trucks that make one or more trips per day : 1994
No
Bon
d F
un
din
gB
ond
Fu
nd
ing
Page 3 of 83

San Pedro Bay Ports Clean Air Action PlanDRAFT - Scenarios for Policy DiscussionHeavy-Duty Vehicles (Trucks)
Totals Over 5 FY DRAFT
< PRELIMINARY DRAFT RESULTS >
Tot
al C
lean
Air
Act
ion
Pla
n C
lean
Die
sel (
CD
) In
cen
t ive
s
Tot
al C
lean
Air
Act
ion
Pla
n A
lt F
uel
Sp
endi
n g
Tot
al 5
Fis
cal Y
ear
Ince
nt i
ves
< PRELIMINARY DRAFT RESULTS >Budget Scenario 1 $140,000,000 $54,000,000 $194,000,000 HDV Fleet Truck Characteristic (from work on 2005 EI Update)Budget Scenario 2 $36,000,000 $158,000,000 $194,000,000 ~40,000+ Individual Trucks Serving San Pedro Bay PortsBudget Scenario 3 $152,000,000 $42,000,000 $194,000,000
Budget Scenario 4 $142,000,000 $52,000,000 $194,000,000Budget Scenario 5 $104,000,000 $90,000,000 $194,000,000 ~7,000 Frequent Callers (7 trips/wk or more) = 50% of All CallsBudget Scenario 6 $102,300,000 $1,995,300,000 $2,097,600,000 ~9,800 Semi-Frequent Callers (3.5 to <7 trips/wk) = 30% of All CallsBudget Scenario 7 $784,100,000 $1,005,200,000 $1,789,300,000 ~16,800 Frequent/Semi-Frequent Callers Make 80% of All CallsBudget Scenario 8 $1,444,500,000 $32,000,000 $1,476,500,000
Budget Scenario 9 $6,000,000 $992,000,000 $998,000,000
Budget Scenario 10 $486,000,000 $512,000,000 $998,000,000Budget Scenario 11 $966,000,000 $32,000,000 $998,000,000 Note: $1M/year is included in Tech Adv Program for electric/hybrid trucks (not shown)Budget Scenario 12 $1,072,800,000 $1,605,600,000 $2,678,400,000
Of Those,
Draft 37 Common Days Frequent Truck MY Distribution 2005 EI for POLA & POLB
0%
2%
4%
6%
8%
10%
12%
2006
2004
2002
2000
1998
1996
1994
1992
1990
1988
1986
1984
1982
1980
1978
1976
1974
Model Year
Per
cen
tag
e
Average 2005 EI MY for trucks that make one or more trips per day : 1994
No
Bon
d F
un
din
gB
ond
Fu
nd
ing
Budget Scenario 6 Deployment Combination 1 DPM NOx Deployment Combination 2 DPM NOxFunding Targets 80% of All Truck Alt Fuel Funding New LNG 10,575 trucks 697 5,444 Alt Fuel Funding Westport LNG 10,575 trucks 696 5,874Calls. CD Funding New Trucks 46 trucks 3 25 CD Funding New Trucks 46 trucks 3 25
CD Funding Cleaire + Chip Reflash 5,112 DPFs 82 705 CD Funding Cleaire + Chip Reflash 5,112 DPFs 82 705Mostly Alt Fuel Replacments CD Fudning Cleaire 844 DPFs 7 45 CD Fudning Cleaire 844 DPFs 7 45+ Retrofits 10,622 trucks 789 2,112 Total 6,219 16,644 Total 10,622 trucks 788 2,108 Total 6,649 17,757 Total
5,956 DPFs 5,956 DPFs
Budget Scenario 7 Deployment Combination 1 DPM NOx Deployment Combination 2 DPM NOxFunding Targets 80% of All Truck Alt Fuel Funding New LNG 5,311 trucks 350 2,728 Alt Fuel Funding Westport LNG 5,311 trucks 350 3,148Calls. CD Funding New Trucks 5,311 trucks 344 2,750 CD Funding New Trucks 5,311 trucks 344 2,750
CD Funding Cleaire + Chip Reflash 5,112 DPFs 82 705 CD Funding Cleaire + Chip Reflash 5,112 DPFs 82 70550/50 Alt Fuel & CD Replacments CD Fudning Cleaire 844 DPFs 7 45 CD Fudning Cleaire 844 DPFs 7 45+ Retrofits 10,622 trucks 782 2,097 Total 6,228 16,297 Total 10,622 trucks 782 2,097 Total 6,648 17,266 Total
5,956 DPFs 5,956 DPFs
Budget Scenario 8 Deployment Combination 1 DPM NOx Deployment Combination 2 DPM NOxFunding Targets 80% of All Truck Alt Fuel Funding New LNG 159 trucks 11 80 Alt Fuel Funding Westport LNG 159 trucks 10 88Calls. CD Funding New Trucks 10,463 trucks 679 5,450 CD Funding New Trucks 10,463 trucks 679 5,450
CD Funding Cleaire + Chip Reflash 5,112 DPFs 82 705 CD Funding Cleaire + Chip Reflash 5,112 DPFs 82 705Mostly CD Replacements + Retrofits CD Fudning Cleaire 844 DPFs 7 45 CD Fudning Cleaire 844 DPFs 7 45
10,622 trucks 779 2,104 Total 6,281 16,162 Total 10,622 trucks 778 2,104 Total 6,288 16,186 Total5,956 DPFs 5,956 DPFs
Budget Scenario 9 Deployment Combination 1 DPM NOx Deployment Combination 2 DPM NOxFunding Targets 80% of All Truck Alt Fuel Funding New LNG 5,252 trucks 384 2,860 Alt Fuel Funding Westport LNG 5,252 trucks 382 3,310Calls. CD Funding New Trucks 46 trucks 3 25 CD Funding New Trucks 46 trucks 3 25
CD Funding Cleaire + Chip Reflash 0 DPFs 0 0 CD Funding Cleaire + Chip Reflash 0 DPFs 0 0Mostly Alt Fuel Replacments CD Fudning Cleaire 0 DPFs 0 0 CD Fudning Cleaire 0 DPFs 0 0
5,298 trucks 387 1,013 Total 2,885 7,548 Total 5,298 trucks 386 1,009 Total 3,335 8,716 Total0 DPFs 0 DPFs
#'s #'s
Reductions (tpy) - 5th Year & Total Reductions#'s #'s
Reductions (tpy) - 5th Year & Total Reductions Reductions (tpy) - 5th Year & Total Reductions
Reductions (tpy) - 5th Year & Total Reductions
Reductions (tpy) - 5th Year & Total Reductions Reductions (tpy) - 5th Year & Total Reductions#'s #'s
Reductions (tpy) - 5th Year & Total Reductions Reductions (tpy) - 5th Year & Total Reductions#'s #'s
Page 4 of 83

San Pedro Bay Ports Clean Air Action PlanDRAFT - Scenarios for Policy DiscussionHeavy-Duty Vehicles (Trucks)
Totals Over 5 FY DRAFT
< PRELIMINARY DRAFT RESULTS >
Tot
al C
lean
Air
Act
ion
Pla
n C
lean
Die
sel (
CD
) In
cen
t ive
s
Tot
al C
lean
Air
Act
ion
Pla
n A
lt F
uel
Sp
endi
n g
Tot
al 5
Fis
cal Y
ear
Ince
nt i
ves
< PRELIMINARY DRAFT RESULTS >Budget Scenario 1 $140,000,000 $54,000,000 $194,000,000 HDV Fleet Truck Characteristic (from work on 2005 EI Update)Budget Scenario 2 $36,000,000 $158,000,000 $194,000,000 ~40,000+ Individual Trucks Serving San Pedro Bay PortsBudget Scenario 3 $152,000,000 $42,000,000 $194,000,000
Budget Scenario 4 $142,000,000 $52,000,000 $194,000,000Budget Scenario 5 $104,000,000 $90,000,000 $194,000,000 ~7,000 Frequent Callers (7 trips/wk or more) = 50% of All CallsBudget Scenario 6 $102,300,000 $1,995,300,000 $2,097,600,000 ~9,800 Semi-Frequent Callers (3.5 to <7 trips/wk) = 30% of All CallsBudget Scenario 7 $784,100,000 $1,005,200,000 $1,789,300,000 ~16,800 Frequent/Semi-Frequent Callers Make 80% of All CallsBudget Scenario 8 $1,444,500,000 $32,000,000 $1,476,500,000
Budget Scenario 9 $6,000,000 $992,000,000 $998,000,000
Budget Scenario 10 $486,000,000 $512,000,000 $998,000,000Budget Scenario 11 $966,000,000 $32,000,000 $998,000,000 Note: $1M/year is included in Tech Adv Program for electric/hybrid trucks (not shown)Budget Scenario 12 $1,072,800,000 $1,605,600,000 $2,678,400,000
Of Those,
Draft 37 Common Days Frequent Truck MY Distribution 2005 EI for POLA & POLB
0%
2%
4%
6%
8%
10%
12%
2006
2004
2002
2000
1998
1996
1994
1992
1990
1988
1986
1984
1982
1980
1978
1976
1974
Model Year
Per
cen
tag
e
Average 2005 EI MY for trucks that make one or more trips per day : 1994
No
Bon
d F
un
din
gB
ond
Fu
nd
ing
Budget Scenario 10 Deployment Combination 1 DPM NOx Deployment Combination 2 DPM NOxFunding Targets 80% of All Truck Alt Fuel Funding New LNG 2,706 trucks 198 1,473 Alt Fuel Funding Westport LNG 2,706 trucks 197 1,705Calls. CD Funding New Trucks 3,273 trucks 234 1,746 CD Funding New Trucks 3,273 trucks 234 1,746
CD Funding Cleaire + Chip Reflash 3,000 DPFs 48 414 CD Funding Cleaire + Chip Reflash 3,000 DPFs 48 41450/50 Alt Fuel & CD Replacments CD Fudning Cleaire 844 DPFs 7 45 CD Fudning Cleaire 844 DPFs 7 45+ Retrofits 5,979 trucks 487 1,273 Total 3,679 9,591 Total 5,979 trucks 487 1,270 Total 3,910 10,195 Total
3,844 DPFs 3,844 DPFs
Budget Scenario 11 Deployment Combination 1 DPM NOx Deployment Combination 2 DPM NOxFunding Targets 80% of All Truck Alt Fuel Funding New LNG 159 trucks 11 86 Alt Fuel Funding Westport LNG 159 trucks 11 94Calls. CD Funding New Trucks 8,900 trucks 599 5,222 CD Funding New Trucks 8,900 trucks 599 5,222
CD Funding Cleaire + Chip Reflash 5,112 DPFs 82 705 CD Funding Cleaire + Chip Reflash 5,112 DPFs 82 705Mostly CD Replacements + Retrofits CD Fudning Cleaire 844 DPFs 7 45 CD Fudning Cleaire 844 DPFs 7 45
9,059 trucks 699 1,633 Total 6,059 13,330 Total 9,059 trucks 699 1,633 Total 6,067 13,356 Total5,956 DPFs 5,956 DPFs
Budget Scenario 12 Deployment Combination 1 DPM NOx Deployment Combination 2 DPM NOxFunding Targets 80% of All Truck Alt Fuel Funding New LNG 8,517 trucks 439.52 3,775 Alt Fuel Funding Westport LNG 326 trucks 11 94Calls. Bond CD Funding New Trucks 8,283 trucks 418.98 3,407 CD Funding New Trucks 8,283 trucks 419 3,407
Bond CD Funding Cleaire + Chip Reflash 0 DPFs 0.00 0 CD Funding Cleaire + Chip Reflash 0 DPFs 0 0Bond Funding CD Retro/Replace Bond CD Fudning Cleaire 0 DPFs 0.00 0 CD Fudning Cleaire 0 DPFs 0 0Ports/SCAQMD Alt Fuel Replacements 16,800 trucks 858 2,176 Total 7,181 18,033 Total 8,609 trucks 430 1,633 Total 3,501 13,356 Total
0 DPFs 0 DPFsAssumptionsMileage Accrual rate for Ports trucks is same as in EMFAC2002 ver 2.2 SCAQMD will commit $12 million first year then minimum of $6 million per year over the last four fiscal yearsReplaced trucks VMT is same as of the original trucks ARB & EPA funding not identified at this time
Reductions (tpy) - 5th Year & Total Reductions Reductions (tpy) - 5th Year & Total Reductions#'s #'s
Reductions (tpy) - 5th Year & Total Reductions Reductions (tpy) - 5th Year & Total Reductions#'s #'s
Reductions (tpy) - 5th Year & Total Reductions Reductions (tpy) - 5th Year & Total Reductions#'s #'s
Page 5 of 83

San Pedro Bay Ports Clean Air Action PlanDRAFT - Clean Diesel & Alt Fuel Options for Policy DiscussionHeavy-Duty Vehicles (Trucks)
Budget Scenario 1 - Funding Focused on Greatest DPM Emissions Reductions
Budget OverviewMeasure # Measure Description Notes
SBP-HDV1 HDV Incentives (Clean Diesel) FY 2006/2007 FY 2007/2008 FY 2008/2009 FY 2009/2010 FY 2010/2011 Total Funding TypeClean Diesel - POLA $13,000,000 $15,000,000 $14,000,000 $13,000,000 $12,000,000 $67,000,000 OperationalClean Diesel - POLB $13,000,000 $15,000,000 $14,000,000 $13,000,000 $12,000,000 $67,000,000Clean Diesel - SCAQMD $6,000,000 $0 $0 $0 $0 $6,000,000 Assumes SC annual $Clean Diesel - ARB $0 $0 $0 $0 $0 $0Clean Diesel - EPA $0 $0 $0 $0 $0 $0Clean Diesel - Bond Funding $0 $0 $0 $0 $0 $0 Assumes no bond $
$32,000,000 $30,000,000 $28,000,000 $26,000,000 $24,000,000 $140,000,000
HDV Incentives (Alt Fuels)LNG - POLA $1,000,000 $1,000,000 $2,000,000 $3,000,000 $4,000,000 $11,000,000 OperationalLNG - POLB $1,000,000 $1,000,000 $2,000,000 $3,000,000 $4,000,000 $11,000,000LNG - SCAQMD $6,000,000 $6,000,000 $6,000,000 $6,000,000 $6,000,000 $30,000,000 Assumes SCAQMD $6M/yLNG - ARB $0 $0 $0 $0 $0 $0LNG - EPA $0 $0 $0 $0 $0 $0LNG - Bond Funding $0 $0 $0 $0 $0 $0 Assumes no bond $
$8,000,000 $8,000,000 $10,000,000 $12,000,000 $14,000,000 $52,000,000
Measure FY Totals $40,000,000 $38,000,000 $38,000,000 $38,000,000 $38,000,000 $192,000,000
SBP-HDV2 Alternate Fuel Infrastructure FY 2006/2007 FY 2007/2008 FY 2008/2009 FY 2009/2010 FY 2010/2011 TotalPOLA $1,000,000 $0 $0 $0 $0 $1,000,000POLB $1,000,000 $0 $0 $0 $0 $1,000,000SCAQMD $0 $0 $0 $0 $0 $0ARB $0 $0 $0 $0 $0 $0EPA $0 $0 $0 $0 $0 $0Bond Funding $0 $0 $0 $0 $0 $0
Measure FY Totals $2,000,000 $0 $0 $0 $0 $2,000,000
TOTAL HDV COSTS $42,000,000 $38,000,000 $38,000,000 $38,000,000 $38,000,000 $194,000,000
Budget by Measure
Page 6 of 83

San Pedro Bay Ports Clean Air Action PlanDRAFT - Clean Diesel & Alt Fuel Options for Policy DiscussionHeavy-Duty Vehicles (Trucks)
Budget Scenario 1 - Funding Focused on Greatest DPM Emissions Reductions
Budget Scenario 1 - Options for Clean Diesel (CD)
Measure # Measure DescriptionSBP-HDV1 HDV Incentives (Clean Diesel) FY 2006/2007 FY 2007/2008 FY 2008/2009 FY 2009/2010 FY 2010/2011 Total Notes
$32,000,000 $30,000,000 $28,000,000 $26,000,000 $24,000,000 $140,000,000
CD Option 1 - Cleaner Diesel Trucks MY2007+$129,500 /truck ($126k O/Op, $1.3k AVL, $2.2k admin)$126K based on ARB's Por
Number of total trucks/year 247 232 216 201 185 1,081
Total DPM Emis Red tpy 18 34 50 64 77 243Total NOx Emis Red tpy 132 255 371 517 653 1,928
CD Option 2 - Purchase of DPFs for 1994+ Trucks$9,000 /truck ($8k DPF, $500 Installation, $500 Incentive)
Number of total DPFs/year 1,500 1,500 1,500 1,200 0 5,700Assumes that this would put a DPF on all 1994+ trucks; If ARB rule comes out requiring this then money moves another scenario
Total DPM Emis Red tpy 49 98 147 186 186 667
Budget by Measure
Page 7 of 83

San Pedro Bay Ports Clean Air Action PlanDRAFT - Clean Diesel & Alt Fuel Options for Policy DiscussionHeavy-Duty Vehicles (Trucks)
Budget Scenario 1 - Funding Focused on Greatest DPM Emissions Reductions
Budget Scenario 1 - Options for Alt Fuels
Alt Fuel Option 1 - Purchase of New LNG Trucks $188,500 /truck ($185k O/Op, $1.3k AVL, $2.2k admin) see note belowMeasure # Measure Description
SBP-HDV1 HDV Incentives (Alt Fuel) FY 2006/2007 FY 2007/2008 FY 2008/2009 FY 2009/2010 FY 2010/2011 Total Notes$8,000,000 $8,000,000 $10,000,000 $12,000,000 $14,000,000 $52,000,000
Number of total trucks/year 42 42 53 64 74 276
Total DPM Emis Red tpy 3.1 6.2 10.1 14.7 20.2 54Total NOx Emis Red tpy 23 50 83 123 170 450
Alt Fuel Option 2 - Purchase of Westport LNG Trucks $188,500 /truck ($185k O/Op, $1.3k AVL, $2.2k admin) see note belowMeasure # Measure Description
SBP-HDV1 HDV Incentives (Alt Fuel) FY 2006/2007 FY 2007/2008 FY 2008/2009 FY 2009/2010 FY 2010/2011 Total Notes$8,000,000 $8,000,000 $10,000,000 $12,000,000 $14,000,000 $52,000,000
Number of total trucks/year 42 42 53 64 74 276
Total DPM Emis Red tpy 3.1 6.2 10.1 14.7 20.1 54Total NOx Emis Red tpy 26.7 55.6 91.6 134.8 185.3 494
SBP-HDV1 FY 2006/2007 FY 2007/2008 FY 2008/2009 FY 2009/2010 FY 2010/2011 TotalTotal DPM Reduction (tpy) 70 229 342 443 469 1,553Total NOx Reduction (tpy) 155 377 558 735 908 2,732Total SOx Reduction (tpy) 0.020 0.020 0.025 0.029 0.034 0.13
NoteBased on April 18, 2006 meeting between Westport, POLA, POLB and Starcrest
Budget by Measure
Budget by Measure
Page 8 of 83

San Pedro Bay Ports Clean Air Action PlanDRAFT - Clean Diesel & Alt Fuel Options for Policy DiscussionHeavy-Duty Vehicles (Trucks)
Budget Scenario 2 - Funding Focused on Quickest POLA Movement to Alt Fuels
Budget OverviewMeasure # Measure Description
SBP-HDV1 HDV Incentives (Clean Diesel) FY 2006/2007 FY 2007/2008 FY 2008/2009 FY 2009/2010 FY 2010/2011 Total NotesClean Diesel - POLA $13,000,000 $2,000,000 $0 $0 $0 $15,000,000 OperationalClean Diesel - POLB $13,000,000 $2,000,000 $0 $0 $0 $15,000,000Clean Diesel - SCAQMD $6,000,000 $0 $0 $0 $0 $6,000,000 Assumes SC annual $Clean Diesel - ARB $0 $0 $0 $0 $0 $0Clean Diesel - EPA $0 $0 $0 $0 $0 $0Clean Diesel - Bond Funding $0 $0 $0 $0 $0 $0 Assumes no bond $
$32,000,000 $4,000,000 $0 $0 $0 $36,000,000
HDV Incentives (Alt Fuels)LNG - POLA $1,000,000 $14,000,000 $16,000,000 $16,000,000 $16,000,000 $63,000,000 OperationalLNG - POLB $1,000,000 $14,000,000 $16,000,000 $16,000,000 $16,000,000 $63,000,000LNG - SCAQMD $6,000,000 $6,000,000 $6,000,000 $6,000,000 $6,000,000 $30,000,000 Assumes SCAQMD $6M/yr MatchLNG - ARB $0 $0 $0 $0 $0 $0LNG - EPA $0 $0 $0 $0 $0 $0LNG - Bond Funding $0 $0 $0 $0 $0 $0 Assumes no bond $
$8,000,000 $34,000,000 $38,000,000 $38,000,000 $38,000,000 $156,000,000
Measure FY Totals $40,000,000 $38,000,000 $38,000,000 $38,000,000 $38,000,000 $192,000,000
SBP-HDV2 Alternate Fuel Infrastructure FY 2006/2007 FY 2007/2008 FY 2008/2009 FY 2009/2010 FY 2010/2011 TotalPOLA $1,000,000 $0 $0 $0 $0 $1,000,000POLB $1,000,000 $0 $0 $0 $0 $1,000,000SCAQMD $0 $0 $0 $0 $0 $0ARB $0 $0 $0 $0 $0 $0EPA $0 $0 $0 $0 $0 $0Bond Funding $0 $0 $0 $0 $0 $0
Measure FY Totals $2,000,000 $0 $0 $0 $0 $2,000,000
TOTAL HDV COSTS $42,000,000 $38,000,000 $38,000,000 $38,000,000 $38,000,000 $194,000,000
Budget by Measure
Page 9 of 83

San Pedro Bay Ports Clean Air Action PlanDRAFT - Clean Diesel & Alt Fuel Options for Policy DiscussionHeavy-Duty Vehicles (Trucks)
Budget Scenario 2 - Funding Focused on Quickest POLA Movement to Alt Fuels
Budget Scenario 2 - Options for Clean Diesel (CD)
Measure # Measure DescriptionSBP-HDV1 HDV Incentives (Clean Diesel) FY 2006/2007 FY 2007/2008 FY 2008/2009 FY 2009/2010 FY 2010/2011 Total Notes
$32,000,000 $4,000,000 $0 $0 $0 $36,000,000
CD Option 1 - New Cleaner Diesel Trucks$129,500 /truck ($126k O/Op, $1.3k AVL, $2.2k adminsee note below
Number of total trucks/year 247 31 0 0 0 278
Total DPM Emis Red tpy 18 20 20 20 20 97Total NOx Emis Red tpy 132 148 148 148 148 725
CD Option 2 - Purchase of DPFs for 1994+ Trucks$9,000 /truck ($8k DPF, $500 Installation, $500 Incentive)
Number of total DPFs/year 3,556 444 0 0 0 4,000Assumes that this would put a DPF on all 1994+ trucks; If ARB rule comes out requiring this then money moves another scenario
Total DPM Emis Red tpy 116 131 131 131 131 640
Budget by Measure
Page 10 of 83

San Pedro Bay Ports Clean Air Action PlanDRAFT - Clean Diesel & Alt Fuel Options for Policy DiscussionHeavy-Duty Vehicles (Trucks)
Budget Scenario 2 - Funding Focused on Quickest POLA Movement to Alt Fuels
Budget Scenario 2 - Options for Alt Fuels
Alt Fuel Option 1 - Purchase of New LNG Trucks $188,500 /truck ($185k O/Op, $1.3k AVL, $2.2k admin) see note below Measure # Measure Description
SBP-HDV1 HDV Incentives (Alt Fuel) FY 2006/2007 FY 2007/2008 FY 2008/2009 FY 2009/2010 FY 2010/2011 Total Notes$8,000,000 $34,000,000 $38,000,000 $38,000,000 $38,000,000 $156,000,000
Number of total trucks/year 42 180 202 202 202 828
Total DPM Emis Red tpy 3.1 16.3 31.0 45.8 60.5 157Total NOx Emis Red tpy 23 137 264 391 518 1,332
Alt Fuel Option 2 - Purchase of Westport LNG Trucks $188,500 /truck ($185k O/Op, $1.3k AVL, $2.2k admin) see note below Based on AMeasure # Measure Description
SBP-HDV1 HDV Incentives (Alt Fuel) FY 2006/2007 FY 2007/2008 FY 2008/2009 FY 2009/2010 FY 2010/2011 Total Notes$8,000,000 $34,000,000 $38,000,000 $38,000,000 $38,000,000 $156,000,000
Number of total trucks/year 42 180 202 202 202 828
Total DPM Emis Red tpy 3.1 16.2 30.9 45.7 60.4 156Total NOx Emis Red tpy 26.7 149.2 286.2 423.1 560.0 1,445
SBP-HDV1 FY 2006/2007 FY 2007/2008 FY 2008/2009 FY 2009/2010 FY 2010/2011 TotalTotal DPM Reduction (tpy) 137 167 182 197 211 894Total NOx Reduction (tpy) 155 285 412 539 666 2,057Total SOx Reduction (tpy) 0.020 0.083 0.093 0.093 0.093 0.38
NotesDiesel Truck Cost - Based on ARB's Ports Truck Report, page B-16LNG Truck Cost - Based on April 18, 2006 meeting between Westport, POLA, POLB and Starcrest
Budget by Measure
Budget by Measure
Page 11 of 83

San Pedro Bay Ports Clean Air Action PlanDRAFT - Clean Diesel & Alt Fuel Options for Policy DiscussionHeavy-Duty Vehicles (Trucks)
Budget Scenario 3 - Funding Focused on DPM w/Alt Fuel Funding $1M/yr (Replacement, Infrastructure, & R&D)
Budget OverviewMeasure # Measure Description
SBP-HDV1 HDV Incentives (Clean Diesel) FY 2006/2007 FY 2007/2008 FY 2008/2009 FY 2009/2010 FY 2010/2011 Total NotesClean Diesel - POLA $13,000,000 $15,000,000 $15,000,000 $15,000,000 $15,000,000 $73,000,000 OperationalClean Diesel - POLB $13,000,000 $15,000,000 $15,000,000 $15,000,000 $15,000,000 $73,000,000Clean Diesel - SCAQMD $6,000,000 $0 $0 $0 $0 $6,000,000 Assumes SCAQMD 1 Time $6MClean Diesel - ARB $0 $0 $0 $0 $0 $0Clean Diesel - EPA $0 $0 $0 $0 $0 $0Clean Diesel - Bond Funding $0 $0 $0 $0 $0 $0 Assumes no bond $
$32,000,000 $30,000,000 $30,000,000 $30,000,000 $30,000,000 $152,000,000
HDV Incentives (Alt Fuels)LNG - POLA $1,000,000 $1,000,000 $1,000,000 $1,000,000 $1,000,000 $5,000,000 OperationalLNG - POLB $1,000,000 $1,000,000 $1,000,000 $1,000,000 $1,000,000 $5,000,000LNG - SCAQMD $6,000,000 $6,000,000 $6,000,000 $6,000,000 $6,000,000 $30,000,000 Assumes SCAQMD $6M/yr MatchLNG - ARB $0 $0 $0 $0 $0 $0LNG - EPA $0 $0 $0 $0 $0 $0LNG - Bond Funding $0 $0 $0 $0 $0 $0 Assumes no bond $
$8,000,000 $8,000,000 $8,000,000 $8,000,000 $8,000,000 $40,000,000
Measure FY Totals $40,000,000 $38,000,000 $38,000,000 $38,000,000 $38,000,000 $192,000,000
SBP-HDV2 Alternate Fuel Infrastructure FY 2006/2007 FY 2007/2008 FY 2008/2009 FY 2009/2010 FY 2010/2011 Total NotesPOLA $1,000,000 $0 $0 $0 $0 $1,000,000POLB $1,000,000 $0 $0 $0 $0 $1,000,000SCAQMD $0 $0 $0 $0 $0 $0ARB $0 $0 $0 $0 $0 $0EPA $0 $0 $0 $0 $0 $0Bond Funding $0 $0 $0 $0 $0 $0
Measure FY Totals $2,000,000 $0 $0 $0 $0 $2,000,000
TOTAL HDV COSTS $42,000,000 $38,000,000 $38,000,000 $38,000,000 $38,000,000 $194,000,000
Budget by Measure
Page 12 of 83

San Pedro Bay Ports Clean Air Action PlanDRAFT - Clean Diesel & Alt Fuel Options for Policy DiscussionHeavy-Duty Vehicles (Trucks)
Budget Scenario 3 - Funding Focused on DPM w/Alt Fuel Funding $1M/yr (Replacement, Infrastructure, & R&D)
Budget Scenario 3 - Options for Clean Diesel (CD)
Measure # Measure DescriptionSBP-HDV1 HDV Incentives (Clean Diesel) FY 2006/2007 FY 2007/2008 FY 2008/2009 FY 2009/2010 FY 2010/2011 Total Notes
$32,000,000 $30,000,000 $30,000,000 $30,000,000 $30,000,000 $152,000,000
CD Option 1 - Cleaner Diesel Trucks MY 2007+66% CD Funding $129,500 /truck ($126k O/Op, $1.3k AVL, $2.2k admin)see note below
Number of total trucks/year 163 153 153 153 153 775
Total DPM Emis Red tpy 12 23 34 45 56 168Total NOx Emis Red tpy 87 169 250 362 473 1,341
34% CD Funding $9,000 /truck ($8k DPF, $500 Installation, $500 Incentive)Number of total DPFs/year 1,209 1,133 1,133 1,133 1,133 5,742
Assumes that this would put a DPF on all 1994+ trucks; If ARB rule comes out requiring this then money moves another scenario
Total DPM Emis Red tpy 40 77 114 151 188 568
Budget by Measure
Page 13 of 83

San Pedro Bay Ports Clean Air Action PlanDRAFT - Clean Diesel & Alt Fuel Options for Policy DiscussionHeavy-Duty Vehicles (Trucks)
Budget Scenario 3 - Funding Focused on DPM w/Alt Fuel Funding $1M/yr (Replacement, Infrastructure, & R&D)
Budget Scenario 3 - Options for Alt Fuels
Alt Fuel Option 1 - Purchase of New LNG Trucks $188,500 /truck ($185k O/Op, $1.3k AVL, $2.2k admin) see note belowMeasure # Measure Description
SBP-HDV1 HDV Incentives (Alt Fuel) FY 2006/2007 FY 2007/2008 FY 2008/2009 FY 2009/2010 FY 2010/2011 Total Notes$8,000,000 $8,000,000 $8,000,000 $8,000,000 $8,000,000 $40,000,000
Number of total trucks/year 42 42 42 42 42 212
Total DPM Emis Red tpy 3.1 6.2 9.3 12.4 15.5 47Total NOx Emis Red tpy 23 50 77 103 130 383
Alt Fuel Option 2 - Purchase of Westport LNG Trucks $188,500 /truck ($185k O/Op, $1.3k AVL, $2.2k admin) see note belowMeasure # Measure Description
SBP-HDV1 HDV Incentives (Alt Fuel) FY 2006/2007 FY 2007/2008 FY 2008/2009 FY 2009/2010 FY 2010/2011 Total Notes$8,000,000 $8,000,000 $8,000,000 $8,000,000 $8,000,000 $40,000,000
Number of total trucks/year 42 42 42 42 42 212
Total DPM Emis Red tpy 3.1 6.2 9.3 12.4 15.5 46Total NOx Emis Red tpy 26.7 55.6 84.4 113.2 142.0 422
SBP-HDV1 FY 2006/2007 FY 2007/2008 FY 2008/2009 FY 2009/2010 FY 2010/2011 TotalTotal DPM Reduction (tpy) 54 105 157 208 259 783Total NOx Reduction (tpy) 110 218 327 465 604 1,724Total SOx Reduction (tpy) 0.020 0.020 0.020 0.020 0.020 0.10
NotesDiesel Truck Cost - Based on ARB's Ports Truck Report, page B-16LNG Truck Cost - Based on April 18, 2006 meeting between Westport, POLA, POLB and Starcrest
Budget by Measure
Budget by Measure
Page 14 of 83
San Pedro Bay Ports Clean Air Action PlanDRAFT - Clean Diesel & Alt Fuel Options for Policy DiscussionHeavy-Duty Vehicles (Trucks)
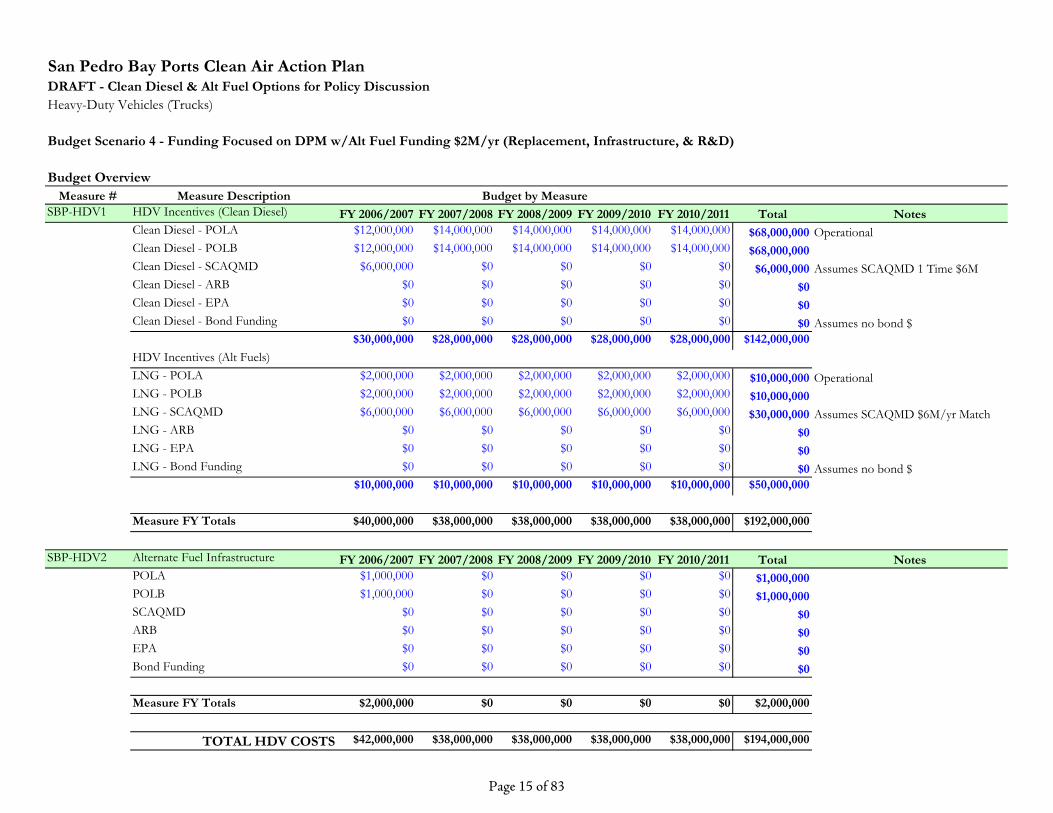
Budget Scenario 4 - Funding Focused on DPM w/Alt Fuel Funding $2M/yr (Replacement, Infrastructure, & R&D)
Budget OverviewMeasure # Measure Description
SBP-HDV1 HDV Incentives (Clean Diesel) FY 2006/2007 FY 2007/2008 FY 2008/2009 FY 2009/2010 FY 2010/2011 Total NotesClean Diesel - POLA $12,000,000 $14,000,000 $14,000,000 $14,000,000 $14,000,000 $68,000,000 OperationalClean Diesel - POLB $12,000,000 $14,000,000 $14,000,000 $14,000,000 $14,000,000 $68,000,000Clean Diesel - SCAQMD $6,000,000 $0 $0 $0 $0 $6,000,000 Assumes SCAQMD 1 Time $6MClean Diesel - ARB $0 $0 $0 $0 $0 $0Clean Diesel - EPA $0 $0 $0 $0 $0 $0Clean Diesel - Bond Funding $0 $0 $0 $0 $0 $0 Assumes no bond $
$30,000,000 $28,000,000 $28,000,000 $28,000,000 $28,000,000 $142,000,000
HDV Incentives (Alt Fuels)LNG - POLA $2,000,000 $2,000,000 $2,000,000 $2,000,000 $2,000,000 $10,000,000 OperationalLNG - POLB $2,000,000 $2,000,000 $2,000,000 $2,000,000 $2,000,000 $10,000,000LNG - SCAQMD $6,000,000 $6,000,000 $6,000,000 $6,000,000 $6,000,000 $30,000,000 Assumes SCAQMD $6M/yr MatchLNG - ARB $0 $0 $0 $0 $0 $0LNG - EPA $0 $0 $0 $0 $0 $0LNG - Bond Funding $0 $0 $0 $0 $0 $0 Assumes no bond $
$10,000,000 $10,000,000 $10,000,000 $10,000,000 $10,000,000 $50,000,000
Measure FY Totals $40,000,000 $38,000,000 $38,000,000 $38,000,000 $38,000,000 $192,000,000
SBP-HDV2 Alternate Fuel Infrastructure FY 2006/2007 FY 2007/2008 FY 2008/2009 FY 2009/2010 FY 2010/2011 Total NotesPOLA $1,000,000 $0 $0 $0 $0 $1,000,000POLB $1,000,000 $0 $0 $0 $0 $1,000,000SCAQMD $0 $0 $0 $0 $0 $0ARB $0 $0 $0 $0 $0 $0EPA $0 $0 $0 $0 $0 $0Bond Funding $0 $0 $0 $0 $0 $0
Measure FY Totals $2,000,000 $0 $0 $0 $0 $2,000,000
TOTAL HDV COSTS $42,000,000 $38,000,000 $38,000,000 $38,000,000 $38,000,000 $194,000,000
Budget by Measure
Page 15 of 83

San Pedro Bay Ports Clean Air Action PlanDRAFT - Clean Diesel & Alt Fuel Options for Policy DiscussionHeavy-Duty Vehicles (Trucks)
Budget Scenario 4 - Funding Focused on DPM w/Alt Fuel Funding $2M/yr (Replacement, Infrastructure, & R&D)
Budget Scenario 4 - Options for Cleaner Diesel (CD)
Measure # Measure DescriptionSBP-HDV1 HDV Incentives (Clean Diesel) FY 2006/2007 FY 2007/2008 FY 2008/2009 FY 2009/2010 FY 2010/2011 Total Notes
$30,000,000 $28,000,000 $28,000,000 $28,000,000 $28,000,000 $142,000,000
CD Option 1 - Clean Diesel Trucks MY2004+ w/DPF & DPFs64% CD Funding $129,500 /truck ($126k O/Op, $1.3k AVL, $2.2k admin)see note below
Number of total trucks/year 148 138 138 138 138 702
Total DPM Emis Red (tpy) 11 21 30 40 50 152Total NOx Emis Red (tpy) 79 153 227 328 429 1,215
36% CD Funding $9,000 /truck ($8k DPF, $500 Installation, $500 Incentive)Number of total DPFs/year 1,200 1,120 1,120 1,120 1,120 5,680
Assumes that this would put a DPF on all 1994+ trucks; If ARB rule comes out requiring this then money moves another scenario
Total DPM Emis Red (tpy) 39 76 113 149 186 563
Budget by Measure
Page 16 of 83

San Pedro Bay Ports Clean Air Action PlanDRAFT - Clean Diesel & Alt Fuel Options for Policy DiscussionHeavy-Duty Vehicles (Trucks)
Budget Scenario 4 - Funding Focused on DPM w/Alt Fuel Funding $2M/yr (Replacement, Infrastructure, & R&D)
Budget Scenario 4 - Options for Alt Fuels
Alt Fuel Option 1 - Purchase of New LNG Trucks $188,500 /truck ($185k O/Op, $1.3k AVL, $2.2k admin) see note belowMeasure # Measure Description
SBP-HDV1 HDV Incentives (Alt Fuel) FY 2006/2007 FY 2007/2008 FY 2008/2009 FY 2009/2010 FY 2010/2011 Total Notes$10,000,000 $10,000,000 $10,000,000 $10,000,000 $10,000,000 $50,000,000
Number of total trucks/year 53 53 53 53 53 265
Total DPM Emis Red (tpy) 3.9 7.8 11.6 15.5 19.4 58Total NOx Emis Red (tpy) 29 62 96 129 163 479
Alt Fuel Option 2 - Purchase of Westport LNG Trucks $188,500 /truck ($185k O/Op, $1.3k AVL, $2.2k admin) see note belowMeasure # Measure Description
SBP-HDV1 HDV Incentives (Alt Fuel) FY 2006/2007 FY 2007/2008 FY 2008/2009 FY 2009/2010 FY 2010/2011 Total Notes$10,000,000 $10,000,000 $10,000,000 $10,000,000 $10,000,000 $50,000,000
Number of total trucks/year 53 53 53 53 53 265
Total DPM Emis Red (tpy) 3.9 7.7 11.6 15.5 19.3 58Total NOx Emis Red (tpy) 33.4 69.5 105.5 141.5 177.6 527
SBP-HDV1 FY 2006/2007 FY 2007/2008 FY 2008/2009 FY 2009/2010 FY 2010/2011 TotalTotal DPM Reduction (tpy) 54 104 155 205 255 773Total NOx Reduction (tpy) 108 215 322 457 591 1,694Total SOx Reduction (tpy) 0.025 0.025 0.025 0.025 0.025 0.12
NotesDiesel Truck Cost - Based on ARB's Ports Truck Report, page B-16LNG Truck Cost - Based on April 18, 2006 meeting between Westport, POLA, POLB and Starcrest
Budget by Measure
Budget by Measure
Page 17 of 83

San Pedro Bay Ports Clean Air Action PlanDRAFT - Clean Diesel & Alt Fuel Options for Policy DiscussionHeavy-Duty Vehicles (Trucks)
Budget Scenario 5 - Funding Focused Matching SCAQMD Alt Fuel Funding of $6M/yr (Replacement, Infrastructure, & R&D)
Budget OverviewMeasure # Measure Description
SBP-HDV1 HDV Incentives (Clean Diesel) FY 2006/2007 FY 2007/2008 FY 2008/2009 FY 2009/2010 FY 2010/2011 Total NotesClean Diesel - POLA $9,000,000 $10,000,000 $10,000,000 $10,000,000 $10,000,000 $49,000,000 OperationalClean Diesel - POLB $9,000,000 $10,000,000 $10,000,000 $10,000,000 $10,000,000 $49,000,000Clean Diesel - SCAQMD $6,000,000 $0 $0 $0 $0 $6,000,000 Assumes SCAQMD 1 Time $6MClean Diesel - ARB $0 $0 $0 $0 $0 $0Clean Diesel - EPA $0 $0 $0 $0 $0 $0Clean Diesel - Bond Funding $0 $0 $0 $0 $0 $0 Assumes no bond $
$24,000,000 $20,000,000 $20,000,000 $20,000,000 $20,000,000 $104,000,000
HDV Incentives (Alt Fuels)LNG - POLA $5,000,000 $6,000,000 $6,000,000 $6,000,000 $6,000,000 $29,000,000 OperationalLNG - POLB $5,000,000 $6,000,000 $6,000,000 $6,000,000 $6,000,000 $29,000,000LNG - SCAQMD $6,000,000 $6,000,000 $6,000,000 $6,000,000 $6,000,000 $30,000,000 Assumes SCAQMD $6M/yr MatchLNG - ARB $0 $0 $0 $0 $0 $0LNG - EPA $0 $0 $0 $0 $0 $0LNG - Bond Funding $0 $0 $0 $0 $0 $0 Assumes no bond $
$16,000,000 $18,000,000 $18,000,000 $18,000,000 $18,000,000 $88,000,000
Measure FY Totals $40,000,000 $38,000,000 $38,000,000 $38,000,000 $38,000,000 $192,000,000
SBP-HDV2 Alternate Fuel Infrastructure FY 2006/2007 FY 2007/2008 FY 2008/2009 FY 2009/2010 FY 2010/2011 Total NotesPOLA $1,000,000 $0 $0 $0 $0 $1,000,000POLB $1,000,000 $0 $0 $0 $0 $1,000,000SCAQMD $0 $0 $0 $0 $0 $0ARB $0 $0 $0 $0 $0 $0EPA $0 $0 $0 $0 $0 $0Bond Funding $0 $0 $0 $0 $0 $0
Measure FY Totals $2,000,000 $0 $0 $0 $0 $2,000,000
TOTAL HDV COSTS $42,000,000 $38,000,000 $38,000,000 $38,000,000 $38,000,000 $194,000,000
Budget by Measure
Page 18 of 83

San Pedro Bay Ports Clean Air Action PlanDRAFT - Clean Diesel & Alt Fuel Options for Policy DiscussionHeavy-Duty Vehicles (Trucks)
Budget Scenario 5 - Funding Focused Matching SCAQMD Alt Fuel Funding of $6M/yr (Replacement, Infrastructure, & R&D)
Budget Scenario 5 - Options for Cleaner Diesel (CD)
Measure # Measure DescriptionSBP-HDV1 HDV Incentives (Clean Diesel) FY 2006/2007 FY 2007/2008 FY 2008/2009 FY 2009/2010 FY 2010/2011 Total Notes
$24,000,000 $20,000,000 $20,000,000 $20,000,000 $20,000,000 $104,000,000
CD Option 1 - Clean Diesel Trucks MY2004+ w/DPF & DPFs50% CD Funding $129,500 /truck ($126k O/Op, $1.3k AVL, $2.2k admin)see note below
Number of total trucks/year 93 77 77 77 77 402
Total DPM Emis Red tpy 7 12 18 23 29 89Total NOx Emis Red tpy 49 91 132 188 245 705
50% CD Funding $9,000 /truck ($8k DPF, $500 Installation, $500 Incentive)Number of total DPFs/year 1,333 1,111 1,111 1,111 1,111 5,778
Assumes that this would put a DPF on all 1994+ trucks; If ARB rule comes out requiring this then money moves another scenario
Total DPM Emis Red tpy 44 80 116 153 189 582Budget Scenario 5 - Options for Alt Fuels
Budget by Measure
Page 19 of 83

San Pedro Bay Ports Clean Air Action PlanDRAFT - Clean Diesel & Alt Fuel Options for Policy DiscussionHeavy-Duty Vehicles (Trucks)
Budget Scenario 5 - Funding Focused Matching SCAQMD Alt Fuel Funding of $6M/yr (Replacement, Infrastructure, & R&D)
Alt Fuel Option 1 - Purchase of New LNG Trucks $188,500 /truck ($185k O/Op, $1.3k AVL, $2.2k admin) see note belowMeasure # Measure Description
SBP-HDV1 HDV Incentives (Alt Fuel) FY 2006/2007 FY 2007/2008 FY 2008/2009 FY 2009/2010 FY 2010/2011 Total Notes$16,000,000 $18,000,000 $18,000,000 $18,000,000 $18,000,000 $88,000,000
Number of total trucks/year 85 95 95 95 95 467
Total DPM Emis Red tpy 6.2 13.2 20.2 27.1 34.1 101Total NOx Emis Red tpy 46 106 167 227 287 833
Alt Fuel Option 2 - Purchase of Westport LNG Trucks $188,500 /truck ($185k O/Op, $1.3k AVL, $2.2k admin) see note belowMeasure # Measure Description
SBP-HDV1 HDV Incentives (Alt Fuel) FY 2006/2007 FY 2007/2008 FY 2008/2009 FY 2009/2010 FY 2010/2011 Total Notes$16,000,000 $18,000,000 $18,000,000 $18,000,000 $18,000,000 $88,000,000
Number of total trucks/year 85 95 95 95 95 467
Total DPM Emis Red tpy 6.2 13.1 20.1 27.1 34.0 101Total NOx Emis Red tpy 53.5 118.3 183.2 248.1 312.9 916
SBP-HDV1 FY 2006/2007 FY 2007/2008 FY 2008/2009 FY 2009/2010 FY 2010/2011 TotalTotal DPM Reduction (tpy) 56 105 154 203 252 771Total NOx Reduction (tpy) 96 197 298 415 532 1,538Total SOx Reduction (tpy) 0.039 0.044 0.044 0.044 0.044 0.22
NotesDiesel Truck Cost - Based on ARB's Ports Truck Report, page B-16LNG Truck Cost - Based on April 18, 2006 meeting between Westport, POLA, POLB and Starcrest
Budget by Measure
Budget by Measure
Page 20 of 83

San Pedro Bay Ports Clean Air Action PlanDRAFT - Clean Diesel & Alt Fuel Options for Policy DiscussionHeavy-Duty Vehicles (Trucks)
Budget Scenario 6 - Focus on Replacements w/Focus On Alt Fuels + Retrofits7,000 Frequent Trucks (preliminary 2005 EI data) 9,800 Semi-Frequent Trucks (preliminary 2005 EI data)7,000 Frequent Caller Trucks Alt Fuel Replaced 5,112 Cleaire + Chip Reflash 1993 to 1998 MY trucks; 4 to 5 years useful life3,575 Semi-Freq Caller Trucks Alt Fuel Replaced 844 Cleaire 1999 to 2003 MY trucks; to 5 years useful life
46 Semi-Freq Caller Trucks CD Replaced 3,622 Cannot be Cleaire'd or DPF'd Pre 1993 MY trucks10,622 Total Trucks Replaced
Budget Overview Measure # Measure Description
SBP-HDV1 HDV Incentives (Clean Diesel) FY 2006/2007 FY 2007/2008 FY 2008/2009 FY 2009/2010 FY 2010/2011 Total NotesClean Diesel - POLA $0 $0 $0 $0 $0 $0 OperationalClean Diesel - POLB $0 $0 $0 $0 $0 $0Clean Diesel - SCAQMD $6,000,000 $0 $0 $0 $0 $6,000,000 Assumes SCAQMD 1 Time $6MClean Diesel - ARB $0 $0 $0 $0 $0 $0Clean Diesel - EPA $0 $0 $0 $0 $0 $0Clean Diesel - Bond Funding $0 $54,900,000 $41,400,000 $0 $0 $96,300,000 Assumes Bond Funding
$6,000,000 $54,900,000 $41,400,000 $0 $0 $102,300,000
HDV Incentives (Alt Fuels)LNG - POLA $16,000,000 $16,000,000 $18,000,000 $18,000,000 $18,000,000 $86,000,000 OperationalLNG - POLB $16,000,000 $16,000,000 $16,000,000 $16,000,000 $16,000,000 $80,000,000LNG - SCAQMD $6,000,000 $6,000,000 $6,000,000 $6,000,000 $6,000,000 $30,000,000 Assumes SCAQMD $6M/yr MatchLNG - ARB $0 $0 $0 $0 $0 $0LNG - EPA $0 $0 $0 $0 $0 $0LNG - Bond Funding $0 $453,000,000 $451,000,000 $451,000,000 $442,300,000 $1,797,300,000 Assumes Bond Funding
$38,000,000 $491,000,000 $491,000,000 $491,000,000 $482,300,000 $1,993,300,000
Measure FY Totals $44,000,000 $545,900,000 $532,400,000 $491,000,000 $482,300,000 $2,095,600,000
Budget by Measure
Page 21 of 83

San Pedro Bay Ports Clean Air Action PlanDRAFT - Clean Diesel & Alt Fuel Options for Policy DiscussionHeavy-Duty Vehicles (Trucks)
Budget Scenario 6 - Focus on Replacements w/Focus On Alt Fuels + Retrofits7,000 Frequent Trucks (preliminary 2005 EI data) 9,800 Semi-Frequent Trucks (preliminary 2005 EI data)7,000 Frequent Caller Trucks Alt Fuel Replaced 5,112 Cleaire + Chip Reflash 1993 to 1998 MY trucks; 4 to 5 years useful life3,575 Semi-Freq Caller Trucks Alt Fuel Replaced 844 Cleaire 1999 to 2003 MY trucks; to 5 years useful life
46 Semi-Freq Caller Trucks CD Replaced 3,622 Cannot be Cleaire'd or DPF'd Pre 1993 MY trucks10,622 Total Trucks Replaced
SBP-HDV2 Alternate Fuel Infrastructure FY 2006/2007 FY 2007/2008 FY 2008/2009 FY 2009/2010 FY 2010/2011 Total NotesPOLA $1,000,000 $0 $0 $0 $0 $1,000,000POLB $1,000,000 $0 $0 $0 $0 $1,000,000SCAQMD $0 $0 $0 $0 $0 $0ARB $0 $0 $0 $0 $0 $0EPA $0 $0 $0 $0 $0 $0Bond Funding $0 $0 $0 $0 $0 $0
Measure FY Totals $2,000,000 $0 $0 $0 $0 $2,000,000
TOTAL HDV COSTS $46,000,000 $545,900,000 $532,400,000 $491,000,000 $482,300,000 $2,097,600,000
Page 22 of 83

San Pedro Bay Ports Clean Air Action PlanDRAFT - Clean Diesel & Alt Fuel Options for Policy DiscussionHeavy-Duty Vehicles (Trucks)
Budget Scenario 6 - Focus on Replacements w/Focus On Alt Fuels + Retrofits7,000 Frequent Trucks (preliminary 2005 EI data) 9,800 Semi-Frequent Trucks (preliminary 2005 EI data)7,000 Frequent Caller Trucks Alt Fuel Replaced 5,112 Cleaire + Chip Reflash 1993 to 1998 MY trucks; 4 to 5 years useful life3,575 Semi-Freq Caller Trucks Alt Fuel Replaced 844 Cleaire 1999 to 2003 MY trucks; to 5 years useful life
46 Semi-Freq Caller Trucks CD Replaced 3,622 Cannot be Cleaire'd or DPF'd Pre 1993 MY trucks10,622 Total Trucks Replaced
Budget Scenario 6 - Options for Cleaner Diesel (CD)
Measure # Measure DescriptionSBP-HDV1 HDV Incentives (Clean Diesel) FY 2006/2007 FY 2007/2008 FY 2008/2009 FY 2009/2010 FY 2010/2011 Total Notes
$6,000,000 $54,900,000 $41,400,000 $0 $0 $102,300,000
CD Option 1 - Clean Diesel Trucks MY2007+50% CD Funding $129,500 /truck ($126k O/Op, $1.3k AVL, $2.2k admin) see note below
Number of total trucks/year 46 0 0 0 0 46
Total DPM Emis Red tpy 3 3 3 3 3 17Total NOx Emis Red tpy 25 25 25 25 25 124
50% CD Funding $16,200 /truck ($14.5k Cleaire, $200 Chip Reflash, $1,000 Installation, $500 Incentive)# of Cleaire + Chip Units/year 0 2,556 2,556 0 0 5,112
Total DPM Emis Red tpy 0 41 82 82 82 285Total NOx Emis Red tpy 0 353 705 705 705 2,468
# of Cleaire 0 844 0 0 0 844
Total DPM Emis Red tpy 0 7 7 7 7 30Total NOx Emis Red tpy 0 45 45 45 45 182
Budget by Measure
Page 23 of 83

San Pedro Bay Ports Clean Air Action PlanDRAFT - Clean Diesel & Alt Fuel Options for Policy DiscussionHeavy-Duty Vehicles (Trucks)
Budget Scenario 6 - Focus on Replacements w/Focus On Alt Fuels + Retrofits7,000 Frequent Trucks (preliminary 2005 EI data) 9,800 Semi-Frequent Trucks (preliminary 2005 EI data)7,000 Frequent Caller Trucks Alt Fuel Replaced 5,112 Cleaire + Chip Reflash 1993 to 1998 MY trucks; 4 to 5 years useful life3,575 Semi-Freq Caller Trucks Alt Fuel Replaced 844 Cleaire 1999 to 2003 MY trucks; to 5 years useful life
46 Semi-Freq Caller Trucks CD Replaced 3,622 Cannot be Cleaire'd or DPF'd Pre 1993 MY trucks10,622 Total Trucks Replaced
Budget Scenario 6 - Options for Alt Fuels
Alt Fuel Option 1 - Purchase of New LNG Trucks $188,500 /truck ($185k O/Op, $1.3k AVL, $2.2k admin) see note belowMeasure # Measure Description
SBP-HDV1 HDV Incentives (Alt Fuel) FY 2006/2007 FY 2007/2008 FY 2008/2009 FY 2009/2010 FY 2010/2011 Total Notes$38,000,000 $491,000,000 $491,000,000 $491,000,000 $482,300,000 $1,993,300,000
Number of total trucks/year 202 2,605 2,605 2,605 2,559 10,575
Total DPM Emis Red tpy 13 185 357 529 697 1,781Total NOx Emis Red tpy 90 1,434 2,779 4,123 5,444 13,870
Alt Fuel Option 2 - Purchase of Westport LNG Trucks $188,500 /truck ($185k O/Op, $1.3k AVL, $2.2k admin) see note belowMeasure # Measure Description
SBP-HDV1 HDV Incentives (Alt Fuel) FY 2006/2007 FY 2007/2008 FY 2008/2009 FY 2009/2010 FY 2010/2011 Total Notes$38,000,000 $491,000,000 $491,000,000 $491,000,000 $482,300,000 $1,993,300,000
Number of total trucks/year 202 2,605 2,605 2,605 2,559 10,575
Total DPM Emis Red tpy 13 185 356 527 696 1,777Total NOx Emis Red tpy 104 1,553 3,002 4,451 5,874 14,984
SBP-HDV1 FY 2006/2007 FY 2007/2008 FY 2008/2009 FY 2009/2010 FY 2010/2011 TotalTotal DPM Reduction (tpy) 17 236 449 621 789 2,112Total NOx Reduction (tpy) 115 1,857 3,554 4,899 6,219 16,644Total SOx Reduction (tpy) 0.1 1.2 1.2 1.2 1.2 5
NotesDiesel Truck Cost - Based on ARB's Ports Truck Report, page B-16LNG Truck Cost - Based on April 18, 2006 meeting between Westport, POLA, POLB and Starcrest
Budget by Measure
Budget by Measure
Page 24 of 83

San Pedro Bay Ports Clean Air Action PlanDRAFT - Clean Diesel & Alt Fuel Options for Policy DiscussionHeavy-Duty Vehicles (Trucks)
Budget Scenario 7 - Focus on Replacements w/Focus on 50/50 Alt Fuels & Clean Diesel (CD) + Retrofits7,000 Frequent Trucks (preliminary 2005 EI data) 9,800 Semi-Frequent Trucks (preliminary 2005 EI data)3,500 Frequent Caller Trucks Alt Fuel Replaced 5,112 Cleaire + Chip Reflash 1993 to 1998 MY trucks; 4 to 5 years useful life3,500 Frequent Caller Trucks CD Replaced 844 Cleaire 1999 to 2003 MY trucks; to 5 years useful life1,811 Semi-Freq Caller Trucks Alt Fuel Replaced 3,622 Cannot be Cleaire'd or DPF'd Pre 1993 MY trucks1,811 Semi-Freq Caller Trucks CD Replaced
10,622 Total Trucks Replaced Budget Overview
Measure # Measure DescriptionSBP-HDV1 HDV Incentives (Clean Diesel) FY 2006/2007 FY 2007/2008 FY 2008/2009 FY 2009/2010 FY 2010/2011 Total Notes
Clean Diesel - POLA $8,000,000 $8,000,000 $9,000,000 $9,000,000 $9,000,000 $43,000,000 OperationalClean Diesel - POLB $8,000,000 $8,000,000 $8,000,000 $8,000,000 $8,000,000 $40,000,000Clean Diesel - SCAQMD $6,000,000 $0 $0 $0 $0 $6,000,000 Assumes SCAQMD 1 Time $6MClean Diesel - Bond/Other Funding $0 $202,600,000 $188,100,000 $152,200,000 $152,200,000 $695,100,000
$22,000,000 $218,600,000 $205,100,000 $169,200,000 $169,200,000 $784,100,000
HDV Incentives (Alt Fuels) `LNG - POLA $8,000,000 $8,000,000 $9,000,000 $9,000,000 $9,000,000 $43,000,000 OperationalLNG - POLB $8,000,000 $8,000,000 $8,000,000 $8,000,000 $8,000,000 $40,000,000LNG - SCAQMD $6,000,000 $6,000,000 $6,000,000 $6,000,000 $6,000,000 $30,000,000 Assumes SCAQMD $6M/yr MatchLNG - Bond/Other Funding $0 $222,800,000 $221,800,000 $221,800,000 $221,800,000 $888,200,000 Assumes Bond Funding
$22,000,000 $244,800,000 $244,800,000 $244,800,000 $244,800,000 $1,001,200,000
Measure FY Totals $44,000,000 $463,400,000 $449,900,000 $414,000,000 $414,000,000 $1,785,300,000
SBP-HDV2 Alternate Fuel Infrastructure FY 2006/2007 FY 2007/2008 FY 2008/2009 FY 2009/2010 FY 2010/2011 Total NotesPOLA $1,000,000 $1,000,000 $0 $0 $0 $2,000,000POLB $1,000,000 $1,000,000 $0 $0 $0 $2,000,000SCAQMD tbd tbd $0 $0 $0 $0Bond Funding $0 $0 $0 $0 $0 $0
Measure FY Totals $2,000,000 $2,000,000 $0 $0 $0 $4,000,000
TOTAL HDV COSTS $46,000,000 $465,400,000 $449,900,000 $414,000,000 $414,000,000 $1,789,300,000
Budget by Measure
Page 25 of 83

San Pedro Bay Ports Clean Air Action PlanDRAFT - Clean Diesel & Alt Fuel Options for Policy DiscussionHeavy-Duty Vehicles (Trucks)
Budget Scenario 7 - Focus on Replacements w/Focus on 50/50 Alt Fuels & Clean Diesel (CD) + Retrofits7,000 Frequent Trucks (preliminary 2005 EI data) 9,800 Semi-Frequent Trucks (preliminary 2005 EI data)3,500 Frequent Caller Trucks Alt Fuel Replaced 5,112 Cleaire + Chip Reflash 1993 to 1998 MY trucks; 4 to 5 years useful life3,500 Frequent Caller Trucks CD Replaced 844 Cleaire 1999 to 2003 MY trucks; to 5 years useful life1,811 Semi-Freq Caller Trucks Alt Fuel Replaced 3,622 Cannot be Cleaire'd or DPF'd Pre 1993 MY trucks1,811 Semi-Freq Caller Trucks CD Replaced
10,622 Total Trucks Replaced
Budget Scenario 7 - Options for Cleaner Diesel (CD)
Measure # Measure DescriptionSBP-HDV1 HDV Incentives (Cleaner Diesel) FY 2006/2007 FY 2007/2008 FY 2008/2009 FY 2009/2010 FY 2010/2011 Total Notes
$22,000,000 $218,600,000 $205,100,000 $169,200,000 $169,200,000 $784,100,000
CD Option 1 - Clean Diesel Trucks MY2007+50% CD Funding $129,500 /truck ($126k O/Op, $1.3k AVL, $2.2k admin)see note below
Number of total trucks/year 85 1,306 1,306 1,306 1,306 5,311Ratio FF to total0.66 Baseline DPM in tpy 6 92 178 264 350 888
Total DPM Emis Red tpy 5 90 174 259 344 873
Baseline NOx in tpy 54 884 1,714 2,544 3,373 8,568Total NOx Emis Red tpy 37 613 1,188 1,969 2,750 6,557
50% CD Funding $16,200 /truck ($14.5k Cleaire $200 Chip Reflash, $1,000 Installation, $500 Incentive)# of Cleaire + Chip Units/year 679 2,217 2,217 0 0 5,112
Baseline DPM in tpy 13 54 96 96 96 355Total DPM Emis Red tpy 11 46 82 82 82 302
Baseline NOx in tpy 214 913 1,612 1,612 1,612 5,963Total NOx Emis Red tpy 94 399 705 705 705 2,609
# of Cleaire 0 844 0 0 0 844
Total DPM Emis Red tpy 0 7 7 7 7 30Total NOx Emis Red tpy 0 45 45 45 45 182
Budget by Measure
Page 26 of 83

San Pedro Bay Ports Clean Air Action PlanDRAFT - Clean Diesel & Alt Fuel Options for Policy DiscussionHeavy-Duty Vehicles (Trucks)
Budget Scenario 7 - Focus on Replacements w/Focus on 50/50 Alt Fuels & Clean Diesel (CD) + Retrofits7,000 Frequent Trucks (preliminary 2005 EI data) 9,800 Semi-Frequent Trucks (preliminary 2005 EI data)3,500 Frequent Caller Trucks Alt Fuel Replaced 5,112 Cleaire + Chip Reflash 1993 to 1998 MY trucks; 4 to 5 years useful life3,500 Frequent Caller Trucks CD Replaced 844 Cleaire 1999 to 2003 MY trucks; to 5 years useful life1,811 Semi-Freq Caller Trucks Alt Fuel Replaced 3,622 Cannot be Cleaire'd or DPF'd Pre 1993 MY trucks1,811 Semi-Freq Caller Trucks CD Replaced
10,622 Total Trucks Replaced Budget Scenario 7 - Options for Alt Fuels
Alt Fuel Option 1 - Purchase of New LNG Trucks $188,500 /truck ($185k O/Op, $1.3k AVL, $2.2k admin) see note belowMeasure # Measure Description
SBP-HDV1 HDV Incentives (Alt Fuel) FY 2006/2007 FY 2007/2008 FY 2008/2009 FY 2009/2010 FY 2010/2011 Total Notes$22,000,000 $244,800,000 $244,800,000 $244,800,000 $244,800,000 $1,001,200,000
Number of total trucks/year 117 1,299 1,299 1,299 1,299 5,311
Baseline DPM in tpy 7.7 93.2 178.7 264.3 349.8 894Total DPM Emis Red tpy 7.7 93.2 178.7 264.3 349.8 894
Baseline NOx in tpy 74 899 1724 2549 3373 8,619Total NOx Emis Red tpy 52 721 1390 2059 2728 6,949
Budget by Measure
Page 27 of 83

San Pedro Bay Ports Clean Air Action PlanDRAFT - Clean Diesel & Alt Fuel Options for Policy DiscussionHeavy-Duty Vehicles (Trucks)
Budget Scenario 7 - Focus on Replacements w/Focus on 50/50 Alt Fuels & Clean Diesel (CD) + Retrofits7,000 Frequent Trucks (preliminary 2005 EI data) 9,800 Semi-Frequent Trucks (preliminary 2005 EI data)3,500 Frequent Caller Trucks Alt Fuel Replaced 5,112 Cleaire + Chip Reflash 1993 to 1998 MY trucks; 4 to 5 years useful life3,500 Frequent Caller Trucks CD Replaced 844 Cleaire 1999 to 2003 MY trucks; to 5 years useful life1,811 Semi-Freq Caller Trucks Alt Fuel Replaced 3,622 Cannot be Cleaire'd or DPF'd Pre 1993 MY trucks1,811 Semi-Freq Caller Trucks CD Replaced
10,622 Total Trucks Replaced Alt Fuel Option 2 - Purchase of Westport LNG Trucks $188,500 /truck ($185k O/Op, $1.3k AVL, $2.2k admin) see note below
Measure # Measure DescriptionSBP-HDV1 HDV Incentives (Alt Fuel) FY 2006/2007 FY 2007/2008 FY 2008/2009 FY 2009/2010 FY 2010/2011 Total Notes
$22,000,000 $244,800,000 $244,800,000 $244,800,000 $244,800,000 $1,001,200,000
Number of total trucks/year 117 1,299 1,299 1,299 1,299 5,311
Baseline DPM tpy 7.7 93.2 178.7 264.3 349.8 894Total DPM Emis Red tpy 7.7 93.0 178.3 263.6 349.0 892
Baseline NOx in tpy 74 899 1785 2671 3557 8,987Total NOx Emis Red tpy 60 781 1604 2325 3148 7,918
SBP-HDV1 FY 2006/2007 FY 2007/2008 FY 2008/2009 FY 2009/2010 FY 2010/2011 TotalTotal DPM Reduction (tpy) 24 237 442 612 782 2,097Total NOx Reduction (tpy) 183 1,779 3,329 4,778 6,228 16,297Total SOx Reduction (tpy) 0.1 0.7 1.3 1.9 2.5 6
NotesDiesel Truck Cost - Based on ARB's Ports Truck Report, page B-16LNG Truck Cost - Based on April 18, 2006 meeting between Westport, POLA, POLB and Starcrest
Budget by Measure
Page 28 of 83

San Pedro Bay Ports Clean Air Action PlanDRAFT - Clean Diesel & Alt Fuel Options for Policy DiscussionHeavy-Duty Vehicles (Trucks)
Budget Scenario 8 - Focus on Replacements w/Focus On Clean Diesel (CD) + Retrofits7,000 Frequent Trucks (preliminary 2005 EI data) 9,800 Semi-Frequent Trucks (preliminary 2005 EI data)7,000 Frequent Caller Trucks CD Fuel Replaced 5,112 Cleaire + Chip Reflash 1994 to 1998 MY trucks; 4 to 5 years useful life3,463 Semi-Freq Caller Trucks CD Replaced 844 Cleaire 1999 to 2002 MY trucks; to 5 years useful life
159 Semi-Freq Caller Trucks Alt Replaced 3,622 Cannot be Cleaire'd or DPF'd Pre 1994 MY trucks10,622 Total Trucks Replaced
Budget Overview Measure # Measure Description
SBP-HDV1 HDV Incentives (Clean Diesel) FY 2006/2007 FY 2007/2008 FY 2008/2009 FY 2009/2010 FY 2010/2011 Total NotesClean Diesel - POLA $16,000,000 $16,000,000 $18,000,000 $18,000,000 $18,000,000 $86,000,000 OperationalClean Diesel - POLB $16,000,000 $16,000,000 $16,000,000 $16,000,000 $16,000,000 $80,000,000Clean Diesel - SCAQMD $6,000,000 $0 $0 $0 $0 $6,000,000 Assumes SCAQMD 1 Time $6MClean Diesel - ARB $0 $0 $0 $0 $0 $0Clean Diesel - EPA $0 $0 $0 $0 $0 $0Clean Diesel - Bond Funding $0 $345,700,000 $330,200,000 $298,300,000 $298,300,000 $1,272,500,000 Assumes Bond Funding
$38,000,000 $377,700,000 $364,200,000 $332,300,000 $332,300,000 $1,444,500,000
HDV Incentives (Alt Fuels)LNG - POLA $0 $0 $0 $0 $0 $0 OperationalLNG - POLB $0 $0 $0 $0 $0 $0LNG - SCAQMD $6,000,000 $6,000,000 $6,000,000 $6,000,000 $6,000,000 $30,000,000 Assumes SCAQMD $6M/yr MatchLNG - ARB $0 $0 $0 $0 $0 $0LNG - EPA $0 $0 $0 $0 $0 $0LNG - Bond Funding $0 $0 $0 $0 $0 $0 Assumes No Bond Funding
$6,000,000 $6,000,000 $6,000,000 $6,000,000 $6,000,000 $30,000,000
Measure FY Totals $44,000,000 $383,700,000 $370,200,000 $338,300,000 $338,300,000 $1,474,500,000
Budget by Measure
Page 29 of 83

San Pedro Bay Ports Clean Air Action PlanDRAFT - Clean Diesel & Alt Fuel Options for Policy DiscussionHeavy-Duty Vehicles (Trucks)
Budget Scenario 8 - Focus on Replacements w/Focus On Clean Diesel (CD) + Retrofits7,000 Frequent Trucks (preliminary 2005 EI data) 9,800 Semi-Frequent Trucks (preliminary 2005 EI data)7,000 Frequent Caller Trucks CD Fuel Replaced 5,112 Cleaire + Chip Reflash 1994 to 1998 MY trucks; 4 to 5 years useful life3,463 Semi-Freq Caller Trucks CD Replaced 844 Cleaire 1999 to 2002 MY trucks; to 5 years useful life
159 Semi-Freq Caller Trucks Alt Replaced 3,622 Cannot be Cleaire'd or DPF'd Pre 1994 MY trucks10,622 Total Trucks Replaced
SBP-HDV2 Alternate Fuel Infrastructure FY 2006/2007 FY 2007/2008 FY 2008/2009 FY 2009/2010 FY 2010/2011 Total NotesPOLA $1,000,000 $0 $0 $0 $0 $1,000,000POLB $1,000,000 $0 $0 $0 $0 $1,000,000SCAQMD $0 $0 $0 $0 $0 $0ARB $0 $0 $0 $0 $0 $0EPA $0 $0 $0 $0 $0 $0Bond Funding $0 $0 $0 $0 $0 $0
Measure FY Totals $2,000,000 $0 $0 $0 $0 $2,000,000
TOTAL HDV COSTS $46,000,000 $383,700,000 $370,200,000 $338,300,000 $338,300,000 $1,476,500,000
Page 30 of 83

San Pedro Bay Ports Clean Air Action PlanDRAFT - Clean Diesel & Alt Fuel Options for Policy DiscussionHeavy-Duty Vehicles (Trucks)
Budget Scenario 8 - Focus on Replacements w/Focus On Clean Diesel (CD) + Retrofits7,000 Frequent Trucks (preliminary 2005 EI data) 9,800 Semi-Frequent Trucks (preliminary 2005 EI data)7,000 Frequent Caller Trucks CD Fuel Replaced 5,112 Cleaire + Chip Reflash 1994 to 1998 MY trucks; 4 to 5 years useful life3,463 Semi-Freq Caller Trucks CD Replaced 844 Cleaire 1999 to 2002 MY trucks; to 5 years useful life
159 Semi-Freq Caller Trucks Alt Replaced 3,622 Cannot be Cleaire'd or DPF'd Pre 1994 MY trucks10,622 Total Trucks Replaced
Budget Scenario 8 - Options for Clean Diesel (CD)
Measure # Measure DescriptionSBP-HDV1 HDV Incentives (Clean Diesel) FY 2006/2007 FY 2007/2008 FY 2008/2009 FY 2009/2010 FY 2010/2011 Total Notes
$44,900,000 $377,700,000 $364,200,000 $332,300,000 $332,300,000 $1,451,400,000
CD Option 1 - Cleaner Diesel Trucks MY2007+50% CD Funding $129,500 /truck ($126k O/Op, $1.3k AVL, $2.2k admin)see note below
Number of total trucks/year 200 2,566 2,566 2,566 2,566 10,463
Total DPM Emis Red tpy 13 179 346 512 679 1,730Total NOx Emis Red tpy 89 1,225 2,362 3,906 5,450 13,032
50% CD Funding $16,200 /truck ($14.5k Cleaire, $200 Chip Reflash, $1,000 Installation, $500 Incentive)# of Cleaire + Chip Units/year 1,173 1,970 1,970 0 0 5,112
Total DPM Emis Red tpy 19 50 82 82 82 313Total NOx Emis Red tpy 162 433 705 705 705 2,711
# of Cleaire 0 844 0 0 0 844
Total DPM Emis Red tpy 0 7 7 7 7 30Total NOx Emis Red tpy 0 45 45 45 45 182
Budget by Measure
Page 31 of 83

San Pedro Bay Ports Clean Air Action PlanDRAFT - Clean Diesel & Alt Fuel Options for Policy DiscussionHeavy-Duty Vehicles (Trucks)
Budget Scenario 8 - Focus on Replacements w/Focus On Clean Diesel (CD) + Retrofits7,000 Frequent Trucks (preliminary 2005 EI data) 9,800 Semi-Frequent Trucks (preliminary 2005 EI data)7,000 Frequent Caller Trucks CD Fuel Replaced 5,112 Cleaire + Chip Reflash 1994 to 1998 MY trucks; 4 to 5 years useful life3,463 Semi-Freq Caller Trucks CD Replaced 844 Cleaire 1999 to 2002 MY trucks; to 5 years useful life
159 Semi-Freq Caller Trucks Alt Replaced 3,622 Cannot be Cleaire'd or DPF'd Pre 1994 MY trucks10,622 Total Trucks Replaced
Budget Scenario 8 - Options for Alt Fuels
Alt Fuel Option 1 - Purchase of New LNG Trucks $188,500 /truck ($185k O/Op, $1.3k AVL, $2.2k admin) see note belowMeasure # Measure Description
SBP-HDV1 HDV Incentives (Alt Fuel) FY 2006/2007 FY 2007/2008 FY 2008/2009 FY 2009/2010 FY 2010/2011 Total Notes$6,000,000 $6,000,000 $6,000,000 $6,000,000 $6,000,000 $30,000,000
Number of total trucks/year 32 32 32 32 32 159
Total DPM Emis Red tpy 2 4 6 8 11 32Total NOx Emis Red tpy 14 31 47 64 80 236
Alt Fuel Option 2 - Purchase of Westport LNG Trucks $188,500 /truck ($185k O/Op, $1.3k AVL, $2.2k admin) see note belowMeasure # Measure Description
SBP-HDV1 HDV Incentives (Alt Fuel) FY 2006/2007 FY 2007/2008 FY 2008/2009 FY 2009/2010 FY 2010/2011 Total Notes$6,000,000 $6,000,000 $6,000,000 $6,000,000 $6,000,000 $30,000,000
Number of total trucks/year 32 32 32 32 32 159
Total DPM Emis Red tpy 2 4 6 8 10 31Total NOx Emis Red tpy 17 34 52 70 88 260
SBP-HDV1 FY 2006/2007 FY 2007/2008 FY 2008/2009 FY 2009/2010 FY 2010/2011 TotalTotal DPM Reduction (tpy) 34 42 54 64 74 268Total NOx Reduction (tpy) 265 1,735 3,160 4,721 6,281 16,162Total SOx Reduction (tpy) 0.015 0.015 0.015 0.015 0.015 0.074
NotesDiesel Truck Cost - Based on ARB's Ports Truck Report, page B-16LNG Truck Cost - Based on April 18, 2006 meeting between Westport, POLA, POLB and Starcrest
Budget by Measure
Budget by Measure
Page 32 of 83

San Pedro Bay Ports Clean Air Action PlanDRAFT - Clean Diesel & Alt Fuel Options for Policy DiscussionHeavy-Duty Vehicles (Trucks)
Budget Scenario 9 - Focus on Replacements w/Focus On Alt Fuels 7,000 Frequent Trucks (preliminary 2005 EI data) 9,800 Semi-Frequent Trucks (preliminary 2005 EI data)5,252 Frequent Caller Trucks Alt Fuel Replace 5,112 Cleaire + Chip Reflash 1993 to 1998 MY trucks; 4 to 5 years useful life
844 Cleaire 1999 to 2003 MY trucks; to 5 years useful life46 Frequent Caller Trucks CD Replaced 3,622 Cannot be Cleaire'd or DPF'd Pre 1993 MY trucks
5,298 Total Trucks Replaced Budget Overview
Measure # Measure DescriptionSBP-HDV1 HDV Incentives (Clean Diesel) FY 2006/2007 FY 2007/2008 FY 2008/2009 FY 2009/2010 FY 2010/2011 Total Notes
Clean Diesel - POLA $0 $0 $0 $0 $0 $0 OperationalClean Diesel - POLB $0 $0 $0 $0 $0 $0Clean Diesel - SCAQMD $6,000,000 $0 $0 $0 $0 $6,000,000 Assumes SCAQMD 1 Time $6MClean Diesel - ARB $0 $0 $0 $0 $0 $0Clean Diesel - EPA $0 $0 $0 $0 $0 $0Clean Diesel - Bond Funding $0 $0 $0 $0 $0 $0 Assumes No Bond Funding
$6,000,000 $0 $0 $0 $0 $6,000,000
HDV Incentives (Alt Fuels)LNG - POLA $16,000,000 $16,000,000 $16,000,000 $16,000,000 $16,000,000 $80,000,000 OperationalLNG - POLB $16,000,000 $16,000,000 $16,000,000 $16,000,000 $16,000,000 $80,000,000LNG - SCAQMD $6,000,000 $6,000,000 $6,000,000 $6,000,000 $6,000,000 $30,000,000 Assumes SCAQMD $6M/yr MatchLNG - ARB $0 $0 $0 $0 $0 $0LNG - EPA $0 $0 $0 $0 $0 $0LNG - Bond Funding $0 $200,000,000 $200,000,000 $200,000,000 $200,000,000 $800,000,000 Assumes Bond Funding
$38,000,000 $238,000,000 $238,000,000 $238,000,000 $238,000,000 $990,000,000
Measure FY Totals $44,000,000 $238,000,000 $238,000,000 $238,000,000 $238,000,000 $996,000,000
Budget by Measure
Page 33 of 83

San Pedro Bay Ports Clean Air Action PlanDRAFT - Clean Diesel & Alt Fuel Options for Policy DiscussionHeavy-Duty Vehicles (Trucks)
Budget Scenario 9 - Focus on Replacements w/Focus On Alt Fuels 7,000 Frequent Trucks (preliminary 2005 EI data) 9,800 Semi-Frequent Trucks (preliminary 2005 EI data)5,252 Frequent Caller Trucks Alt Fuel Replace 5,112 Cleaire + Chip Reflash 1993 to 1998 MY trucks; 4 to 5 years useful life
844 Cleaire 1999 to 2003 MY trucks; to 5 years useful life46 Frequent Caller Trucks CD Replaced 3,622 Cannot be Cleaire'd or DPF'd Pre 1993 MY trucks
5,298 Total Trucks Replaced SBP-HDV2 Alternate Fuel Infrastructure FY 2006/2007 FY 2007/2008 FY 2008/2009 FY 2009/2010 FY 2010/2011 Total Notes
POLA $1,000,000 $0 $0 $0 $0 $1,000,000POLB $1,000,000 $0 $0 $0 $0 $1,000,000SCAQMD $0 $0 $0 $0 $0 $0ARB $0 $0 $0 $0 $0 $0EPA $0 $0 $0 $0 $0 $0Bond Funding $0 $0 $0 $0 $0 $0
Measure FY Totals $2,000,000 $0 $0 $0 $0 $2,000,000
TOTAL HDV COSTS $46,000,000 $238,000,000 $238,000,000 $238,000,000 $238,000,000 $998,000,000
Page 34 of 83

San Pedro Bay Ports Clean Air Action PlanDRAFT - Clean Diesel & Alt Fuel Options for Policy DiscussionHeavy-Duty Vehicles (Trucks)
Budget Scenario 9 - Focus on Replacements w/Focus On Alt Fuels 7,000 Frequent Trucks (preliminary 2005 EI data) 9,800 Semi-Frequent Trucks (preliminary 2005 EI data)5,252 Frequent Caller Trucks Alt Fuel Replace 5,112 Cleaire + Chip Reflash 1993 to 1998 MY trucks; 4 to 5 years useful life
844 Cleaire 1999 to 2003 MY trucks; to 5 years useful life46 Frequent Caller Trucks CD Replaced 3,622 Cannot be Cleaire'd or DPF'd Pre 1993 MY trucks
5,298 Total Trucks Replaced Budget Scenario 9 - Options for Cleaner Diesel (CD)
Measure # Measure DescriptionSBP-HDV1 HDV Incentives (Clean Diesel) FY 2006/2007 FY 2007/2008 FY 2008/2009 FY 2009/2010 FY 2010/2011 Total Notes
$6,000,000 $0 $0 $0 $0 $6,000,000
CD Option 1 - Clean Diesel Trucks MY2007+100% CD Funding $129,500 /truck ($126k O/Op, $1.3k AVL, $2.2k admin)see note below
Number of total trucks/year 46 0 0 0 0 46
Total DPM Emis Red tpy 3 3 3 3 3 17Total NOx Emis Red tpy 25 25 25 25 25 124
0% CD Funding $16,200 /truck ($14.5k Cleaire, $200 Chip Reflash, $1,000 Installation, $500 Incentive)# of Cleaire + Chip Units/year 0 0 0 0 0 0 Assumed no funding available
Total DPM Emis Red tpy 0 0 0 0 0 0Total NOx Emis Red tpy 0 0 0 0 0 0
# of Cleaire 0 0 0 0 0 0
Total DPM Emis Red tpy 0 0 0 0 0 0Total NOx Emis Red tpy 0 0 0 0 0 0
Budget by Measure
Page 35 of 83

San Pedro Bay Ports Clean Air Action PlanDRAFT - Clean Diesel & Alt Fuel Options for Policy DiscussionHeavy-Duty Vehicles (Trucks)
Budget Scenario 9 - Focus on Replacements w/Focus On Alt Fuels 7,000 Frequent Trucks (preliminary 2005 EI data) 9,800 Semi-Frequent Trucks (preliminary 2005 EI data)5,252 Frequent Caller Trucks Alt Fuel Replace 5,112 Cleaire + Chip Reflash 1993 to 1998 MY trucks; 4 to 5 years useful life
844 Cleaire 1999 to 2003 MY trucks; to 5 years useful life46 Frequent Caller Trucks CD Replaced 3,622 Cannot be Cleaire'd or DPF'd Pre 1993 MY trucks
5,298 Total Trucks Replaced Budget Scenario 9 - Options for Alt Fuels
Alt Fuel Option 1 - Purchase of New LNG Trucks $188,500 /truck ($185k O/Op, $1.3k AVL, $2.2k admin) see note belowMeasure # Measure Description
SBP-HDV1 HDV Incentives (Alt Fuel) FY 2006/2007 FY 2007/2008 FY 2008/2009 FY 2009/2010 FY 2010/2011 Total Notes$38,000,000 $238,000,000 $238,000,000 $238,000,000 $238,000,000 $990,000,000
Number of total trucks/year 202 1,263 1,263 1,263 1,263 5,252
Total DPM Emis Red tpy 15 107 199 292 384 997Total NOx Emis Red tpy 110 797 1,485 2,172 2,860 7,424
Alt Fuel Option 2 - Purchase of Westport LNG Trucks $188,500 /truck ($185k O/Op, $1.3k AVL, $2.2k admin) see note belowMeasure # Measure Description
SBP-HDV1 HDV Incentives (Alt Fuel) FY 2006/2007 FY 2007/2008 FY 2008/2009 FY 2009/2010 FY 2010/2011 Total Notes$38,000,000 $238,000,000 $238,000,000 $238,000,000 $238,000,000 $990,000,000
Number of total trucks/year 202 1,263 1,263 1,263 1,263 5,252
Total DPM Emis Red tpy 15 107 198 290 382 992Total NOx Emis Red tpy 127 923 1,718 2,514 3,310 8,592
SBP-HDV1 FY 2006/2007 FY 2007/2008 FY 2008/2009 FY 2009/2010 FY 2010/2011 TotalTotal DPM Reduction (tpy) 18 110 203 295 387 1,013Total NOx Reduction (tpy) 134 822 1,510 2,197 2,885 7,548Total SOx Reduction (tpy) 0.093 0.583 0.583 0.583 0.583 2.427
NotesDiesel Truck Cost - Based on ARB's Ports Truck Report, page B-16LNG Truck Cost - Based on April 18, 2006 meeting between Westport, POLA, POLB and Starcrest
Budget by Measure
Budget by Measure
Page 36 of 83

San Pedro Bay Ports Clean Air Action PlanDRAFT - Clean Diesel & Alt Fuel Options for Policy DiscussionHeavy-Duty Vehicles (Trucks)
Budget Scenario 10 - Focus on Replacements w/Focus on 50/50 Alt Fuels & Clean Diesel (CD) + Retrofits7,000 Frequent Trucks (preliminary 2005 EI data) 9,800 Semi-Frequent Trucks (preliminary 2005 EI data)2,706 Frequent Caller Trucks Alt Fuel Replaced 5,112 Cleaire + Chip Reflash 1993 to 1998 MY trucks; 4 to 5 years useful life3,273 Frequent Caller Trucks CD Replaced 844 Cleaire 1999 to 2003 MY trucks; to 5 years useful life
0 Semi-Freq Caller Trucks Alt Fuel Replaced 3,622 Cannot be Cleaire'd or DPF'd Pre 1993 MY trucks0 Semi-Freq Caller Trucks CD Replaced 3,000 Cleaire + Chip Reflash
5,979 Total Trucks Replaced Budget Overview
Measure # Measure DescriptionSBP-HDV1 HDV Incentives (Clean Diesel) FY 2006/2007 FY 2007/2008 FY 2008/2009 FY 2009/2010 FY 2010/2011 Total Notes
Clean Diesel - POLA $8,000,000 $8,000,000 $8,000,000 $8,000,000 $8,000,000 $40,000,000 OperationalClean Diesel - POLB $8,000,000 $8,000,000 $8,000,000 $8,000,000 $8,000,000 $40,000,000Clean Diesel - SCAQMD $6,000,000 $0 $0 $0 $0 $6,000,000 Assumes SCAQMD 1 Time $6MClean Diesel - ARB $0 $0 $0 $0 $0 $0Clean Diesel - EPA $0 $0 $0 $0 $0 $0Clean Diesel - Bond Funding $0 $100,000,000 $100,000,000 $100,000,000 $100,000,000 $400,000,000 Assumes Bond Funding
$22,000,000 $116,000,000 $116,000,000 $116,000,000 $116,000,000 $486,000,000
HDV Incentives (Alt Fuels)LNG - POLA $8,000,000 $8,000,000 $8,000,000 $8,000,000 $8,000,000 $40,000,000 OperationalLNG - POLB $8,000,000 $8,000,000 $8,000,000 $8,000,000 $8,000,000 $40,000,000LNG - SCAQMD $6,000,000 $6,000,000 $6,000,000 $6,000,000 $6,000,000 $30,000,000 Assumes SCAQMD $6M/yr MatchLNG - ARB $0 $0 $0 $0 $0 $0LNG - EPA $0 $0 $0 $0 $0 $0LNG - Bond Funding $0 $100,000,000 $100,000,000 $100,000,000 $100,000,000 $400,000,000 Assumes Bond Funding
$22,000,000 $122,000,000 $122,000,000 $122,000,000 $122,000,000 $510,000,000
Measure FY Totals $44,000,000 $238,000,000 $238,000,000 $238,000,000 $238,000,000 $996,000,000
Budget by Measure
Page 37 of 83

San Pedro Bay Ports Clean Air Action PlanDRAFT - Clean Diesel & Alt Fuel Options for Policy DiscussionHeavy-Duty Vehicles (Trucks)
Budget Scenario 10 - Focus on Replacements w/Focus on 50/50 Alt Fuels & Clean Diesel (CD) + Retrofits7,000 Frequent Trucks (preliminary 2005 EI data) 9,800 Semi-Frequent Trucks (preliminary 2005 EI data)2,706 Frequent Caller Trucks Alt Fuel Replaced 5,112 Cleaire + Chip Reflash 1993 to 1998 MY trucks; 4 to 5 years useful life3,273 Frequent Caller Trucks CD Replaced 844 Cleaire 1999 to 2003 MY trucks; to 5 years useful life
0 Semi-Freq Caller Trucks Alt Fuel Replaced 3,622 Cannot be Cleaire'd or DPF'd Pre 1993 MY trucks0 Semi-Freq Caller Trucks CD Replaced 3,000 Cleaire + Chip Reflash
5,979 Total Trucks Replaced SBP-HDV2 Alternate Fuel Infrastructure FY 2006/2007 FY 2007/2008 FY 2008/2009 FY 2009/2010 FY 2010/2011 Total Notes
POLA $1,000,000 $0 $0 $0 $0 $1,000,000POLB $1,000,000 $0 $0 $0 $0 $1,000,000SCAQMD $0 $0 $0 $0 $0 $0ARB $0 $0 $0 $0 $0 $0EPA $0 $0 $0 $0 $0 $0Bond Funding $0 $0 $0 $0 $0 $0
Measure FY Totals $2,000,000 $0 $0 $0 $0 $2,000,000
TOTAL HDV COSTS $46,000,000 $238,000,000 $238,000,000 $238,000,000 $238,000,000 $998,000,000
Page 38 of 83

San Pedro Bay Ports Clean Air Action PlanDRAFT - Clean Diesel & Alt Fuel Options for Policy DiscussionHeavy-Duty Vehicles (Trucks)
Budget Scenario 10 - Focus on Replacements w/Focus on 50/50 Alt Fuels & Clean Diesel (CD) + Retrofits7,000 Frequent Trucks (preliminary 2005 EI data) 9,800 Semi-Frequent Trucks (preliminary 2005 EI data)2,706 Frequent Caller Trucks Alt Fuel Replaced 5,112 Cleaire + Chip Reflash 1993 to 1998 MY trucks; 4 to 5 years useful life3,273 Frequent Caller Trucks CD Replaced 844 Cleaire 1999 to 2003 MY trucks; to 5 years useful life
0 Semi-Freq Caller Trucks Alt Fuel Replaced 3,622 Cannot be Cleaire'd or DPF'd Pre 1993 MY trucks0 Semi-Freq Caller Trucks CD Replaced 3,000 Cleaire + Chip Reflash
5,979 Total Trucks Replaced Budget Scenario 10 - Options for Cleaner Diesel (CD)
Measure # Measure DescriptionSBP-HDV1 HDV Incentives (Clean Diesel) FY 2006/2007 FY 2007/2008 FY 2008/2009 FY 2009/2010 FY 2010/2011 Total Notes
$22,000,000 $116,000,000 $116,000,000 $116,000,000 $116,000,000 $486,000,000
CD Option 1 - Cleaner Diesel Trucks MY2007+90% CD Funding $129,500 /truck ($126k O/Op, $1.3k AVL, $2.2k admin) see note below
Number of total trucks/year 153 702 806 806 806 3,273
Total DPM Emis Red tpy 11 61 119 177 234 602Total NOx Emis Red tpy 82 456 886 1,316 1,746 4,486
10% CD Funding $16,200 /truck ($14.5k Cleaire, $200 Chip Reflash, $1,000 Installation, $500 Incentive)# of Cleaire + Chip Units/year 136 716 716 716 716 3,000
Total DPM Emis Red tpy 2 14 25 36 48 125Total NOx Emis Red tpy 19 118 216 315 414 1,081
# of Cleaire 0 844 0 0 0 844
Total DPM Emis Red tpy 0 7 7 7 7 30Total NOx Emis Red tpy 0 45 45 45 45 182
Budget by Measure
Page 39 of 83

San Pedro Bay Ports Clean Air Action PlanDRAFT - Clean Diesel & Alt Fuel Options for Policy DiscussionHeavy-Duty Vehicles (Trucks)
Budget Scenario 10 - Focus on Replacements w/Focus on 50/50 Alt Fuels & Clean Diesel (CD) + Retrofits7,000 Frequent Trucks (preliminary 2005 EI data) 9,800 Semi-Frequent Trucks (preliminary 2005 EI data)2,706 Frequent Caller Trucks Alt Fuel Replaced 5,112 Cleaire + Chip Reflash 1993 to 1998 MY trucks; 4 to 5 years useful life3,273 Frequent Caller Trucks CD Replaced 844 Cleaire 1999 to 2003 MY trucks; to 5 years useful life
0 Semi-Freq Caller Trucks Alt Fuel Replaced 3,622 Cannot be Cleaire'd or DPF'd Pre 1993 MY trucks0 Semi-Freq Caller Trucks CD Replaced 3,000 Cleaire + Chip Reflash
5,979 Total Trucks Replaced Budget Scenario 10 - Options for Alt Fuels
Alt Fuel Option 1 - Purchase of New LNG Trucks $188,500 /truck ($185k O/Op, $1.3k AVL, $2.2k admin) see note belowMeasure # Measure Description
SBP-HDV1 HDV Incentives (Alt Fuel) FY 2006/2007 FY 2007/2008 FY 2008/2009 FY 2009/2010 FY 2010/2011 Total Notes$22,000,000 $122,000,000 $122,000,000 $122,000,000 $122,000,000 $510,000,000
Number of total trucks/year 117 647 647 647 647 2,706
Total DPM Emis Red tpy 9 56 103 150 198 516Total NOx Emis Red tpy 64 416 768 1,121 1,473 3,842
Alt Fuel Option 2 - Purchase of Westport LNG Trucks $188,500 /truck ($185k O/Op, $1.3k AVL, $2.2k admin) see note belowMeasure # Measure Description
SBP-HDV1 HDV Incentives (Alt Fuel) FY 2006/2007 FY 2007/2008 FY 2008/2009 FY 2009/2010 FY 2010/2011 Total Notes$22,000,000 $122,000,000 $122,000,000 $122,000,000 $122,000,000 $510,000,000
Number of total trucks/year 117 647 647 647 647 2,706
Total DPM Emis Red tpy 8 56 103 150 197 513Total NOx Emis Red tpy 74 481 889 1,297 1,705 4,447
SBP-HDV1 FY 2006/2007 FY 2007/2008 FY 2008/2009 FY 2009/2010 FY 2010/2011 TotalTotal DPM Reduction (tpy) 22 138 255 371 487 1,273
Total NOx Reduction (tpy) 164 1,035 1,916 2,797 3,679 9,591
Total SOx Reduction (tpy) 0.054 0.299 0.299 0.299 0.299 1.250
NotesDiesel Truck Cost - Based on ARB's Ports Truck Report, page B-16LNG Truck Cost - Based on April 18, 2006 meeting between Westport, POLA, POLB and Starcrest
Budget by Measure
Budget by Measure
Page 40 of 83

San Pedro Bay Ports Clean Air Action PlanDRAFT - Clean Diesel & Alt Fuel Options for Policy DiscussionHeavy-Duty Vehicles (Trucks)
Budget Scenario 11 - Focus on Replacements w/Focus On Clean Diesel (CD) + Retrofits7,000 Frequent Trucks (preliminary 2005 EI data) 9,800 Semi-Frequent Trucks (preliminary 2005 EI data)7,000 Frequent Caller Trucks CD Fuel Replaced 5,112 Cleaire + Chip Reflash 1993 to 1998 MY trucks; 4 to 5 years useful life1,900 Semi-Freq Caller Trucks CD Replaced 844 Cleaire 1999 to 2003 MY trucks; to 5 years useful life
159 Semi-Frequentr Trucks Alt Replaced 3,622 Cannot be Cleaire'd or DPF'd Pre 1993 MY trucks9,059 Total Trucks Replaced
Budget Overview Measure # Measure Description
SBP-HDV1 HDV Incentives (Clean Diesel) FY 2006/2007 FY 2007/2008 FY 2008/2009 FY 2009/2010 FY 2010/2011 Total NotesClean Diesel - POLA $16,000,000 $16,000,000 $16,000,000 $16,000,000 $16,000,000 $80,000,000 OperationalClean Diesel - POLB $16,000,000 $16,000,000 $16,000,000 $16,000,000 $16,000,000 $80,000,000Clean Diesel - SCAQMD $6,000,000 $0 $0 $0 $0 $6,000,000 Assumes SCAQMD 1 Time $6MClean Diesel - ARB $0 $0 $0 $0 $0 $0Clean Diesel - EPA $0 $0 $0 $0 $0 $0Clean Diesel - Bond Funding $0 $200,000,000 $200,000,000 $200,000,000 $200,000,000 $800,000,000 Assumes Bond Funding
$38,000,000 $232,000,000 $232,000,000 $232,000,000 $232,000,000 $966,000,000
HDV Incentives (Alt Fuels)LNG - POLA $0 $0 $0 $0 $0 $0 OperationalLNG - POLB $0 $0 $0 $0 $0 $0LNG - SCAQMD $6,000,000 $6,000,000 $6,000,000 $6,000,000 $6,000,000 $30,000,000 Assumes SCAQMD $6M/yr MatchLNG - ARB $0 $0 $0 $0 $0 $0LNG - EPA $0 $0 $0 $0 $0 $0LNG - Bond Funding $0 $0 $0 $0 $0 $0 Assumes No Bond Funding
$6,000,000 $6,000,000 $6,000,000 $6,000,000 $6,000,000 $30,000,000
Measure FY Totals $44,000,000 $238,000,000 $238,000,000 $238,000,000 $238,000,000 $996,000,000
Budget by Measure
Page 41 of 83

San Pedro Bay Ports Clean Air Action PlanDRAFT - Clean Diesel & Alt Fuel Options for Policy DiscussionHeavy-Duty Vehicles (Trucks)
Budget Scenario 11 - Focus on Replacements w/Focus On Clean Diesel (CD) + Retrofits7,000 Frequent Trucks (preliminary 2005 EI data) 9,800 Semi-Frequent Trucks (preliminary 2005 EI data)7,000 Frequent Caller Trucks CD Fuel Replaced 5,112 Cleaire + Chip Reflash 1993 to 1998 MY trucks; 4 to 5 years useful life1,900 Semi-Freq Caller Trucks CD Replaced 844 Cleaire 1999 to 2003 MY trucks; to 5 years useful life
159 Semi-Frequentr Trucks Alt Replaced 3,622 Cannot be Cleaire'd or DPF'd Pre 1993 MY trucks9,059 Total Trucks Replaced
SBP-HDV2 Alternate Fuel Infrastructure FY 2006/2007 FY 2007/2008 FY 2008/2009 FY 2009/2010 FY 2010/2011 Total NotesPOLA $1,000,000 $0 $0 $0 $0 $1,000,000POLB $1,000,000 $0 $0 $0 $0 $1,000,000SCAQMD $0 $0 $0 $0 $0 $0ARB $0 $0 $0 $0 $0 $0EPA $0 $0 $0 $0 $0 $0Bond Funding $0 $0 $0 $0 $0 $0
Measure FY Totals $2,000,000 $0 $0 $0 $0 $2,000,000
TOTAL HDV COSTS $46,000,000 $238,000,000 $238,000,000 $238,000,000 $238,000,000 $998,000,000
Page 42 of 83

San Pedro Bay Ports Clean Air Action PlanDRAFT - Clean Diesel & Alt Fuel Options for Policy DiscussionHeavy-Duty Vehicles (Trucks)
Budget Scenario 11 - Focus on Replacements w/Focus On Clean Diesel (CD) + Retrofits7,000 Frequent Trucks (preliminary 2005 EI data) 9,800 Semi-Frequent Trucks (preliminary 2005 EI data)7,000 Frequent Caller Trucks CD Fuel Replaced 5,112 Cleaire + Chip Reflash 1993 to 1998 MY trucks; 4 to 5 years useful life1,900 Semi-Freq Caller Trucks CD Replaced 844 Cleaire 1999 to 2003 MY trucks; to 5 years useful life
159 Semi-Frequentr Trucks Alt Replaced 3,622 Cannot be Cleaire'd or DPF'd Pre 1993 MY trucks9,059 Total Trucks Replaced
Budget Scenario 11 - Options for Clean Diesel (CD)
Measure # Measure DescriptionSBP-HDV1 HDV Incentives (Clean Diesel) FY 2006/2007 FY 2007/2008 FY 2008/2009 FY 2009/2010 FY 2010/2011 Total Notes
$38,000,000 $232,000,000 $232,000,000 $232,000,000 $514,900,000 $1,248,900,000
CD Option 1 - Cleaner Diesel Trucks MY2007+50% CD Funding $129,500 /truck ($126k O/Op, $1.3k AVL, $2.2k admin) see note below
Number of total trucks/year 147 1,441 1,545 1,792 3,976 8,900
Total DPM Emis Red tpy 10 107 211 331 599 1,258Total NOx Emis Red tpy 70 754 1,489 2,648 5,222 10,183
50% CD Funding $16,200 /truck ($14.5k Cleaire, $200 Chip Reflash, $1,000 Installation, $500 Incentive)
# of Cleaire + Chip Units/year 1,173 1,970 1,970 0 0 5,112
Total DPM Emis Red tpy 19 50 82 82 82 313Total NOx Emis Red tpy 162 433 705 705 705 2,711
# of Cleaire 0 844 0 0 0 844
Total DPM Emis Red tpy 0 7 7 7 7 30Total NOx Emis Red tpy 0 45 45 45 45 182
Budget by Measure
Page 43 of 83

San Pedro Bay Ports Clean Air Action PlanDRAFT - Clean Diesel & Alt Fuel Options for Policy DiscussionHeavy-Duty Vehicles (Trucks)
Budget Scenario 11 - Focus on Replacements w/Focus On Clean Diesel (CD) + Retrofits7,000 Frequent Trucks (preliminary 2005 EI data) 9,800 Semi-Frequent Trucks (preliminary 2005 EI data)7,000 Frequent Caller Trucks CD Fuel Replaced 5,112 Cleaire + Chip Reflash 1993 to 1998 MY trucks; 4 to 5 years useful life1,900 Semi-Freq Caller Trucks CD Replaced 844 Cleaire 1999 to 2003 MY trucks; to 5 years useful life
159 Semi-Frequentr Trucks Alt Replaced 3,622 Cannot be Cleaire'd or DPF'd Pre 1993 MY trucks9,059 Total Trucks Replaced
Budget Scenario 11 - Options for Alt Fuels
Alt Fuel Option 1 - Purchase of New LNG Trucks $188,500 /truck ($185k O/Op, $1.3k AVL, $2.2k admin) see note belowMeasure # Measure Description
SBP-HDV1 HDV Incentives (Alt Fuel) FY 2006/2007 FY 2007/2008 FY 2008/2009 FY 2009/2010 FY 2010/2011 Total Notes$6,000,000 $6,000,000 $6,000,000 $6,000,000 $6,000,000 $30,000,000
Number of total trucks/year 32 32 32 32 32 159
Total DPM Emis Red tpy 2 4 7 9 11 33Total NOx Emis Red tpy 15 33 51 69 86 254
Alt Fuel Option 2 - Purchase of Westport LNG Trucks $188,500 /truck ($185k O/Op, $1.3k AVL, $2.2k admin) see note belowMeasure # Measure Description
SBP-HDV1 HDV Incentives (Alt Fuel) FY 2006/2007 FY 2007/2008 FY 2008/2009 FY 2009/2010 FY 2010/2011 Total Notes$6,000,000 $6,000,000 $6,000,000 $6,000,000 $6,000,000 $30,000,000
Number of total trucks/year 32 32 32 32 32 159
Total DPM Emis Red tpy 2 4 7 9 11 33Total NOx Emis Red tpy 18 37 56 75 94 280
SBP-HDV1 FY 2006/2007 FY 2007/2008 FY 2008/2009 FY 2009/2010 FY 2010/2011 TotalTotal DPM Reduction (tpy) 31 169 306 429 699 1,633
Total NOx Reduction (tpy) 247 1,266 2,290 3,468 6,059 13,330
Total SOx Reduction (tpy) 0.015 0.015 0.015 0.015 0.015 0.074
NotesDiesel Truck Cost - Based on ARB's Ports Truck Report, page B-16LNG Truck Cost - Based on April 18, 2006 meeting between Westport, POLA, POLB and Starcrest
Budget by Measure
Budget by Measure
Page 44 of 83

San Pedro Bay Ports Clean Air Action PlanDRAFT - Clean Diesel & Alt Fuel Options for Policy DiscussionHeavy-Duty Vehicles (Trucks)
Budget Scenario 12 - Focus on Replacements all FF and SFF trucks 50:50 CD and Alt Fuel7,000 Frequent Trucks (preliminary 2005 EI data) 9,800 Semi-Frequent Trucks (preliminary 2005 EI data)4,258 Frequent Caller Trucks Alt Fuel Replaced 0 Cleaire + Chip Reflash SFF 1993 to 1998 MY trucks; 4 to 5 years useful life4,258 Semi-Frequent Caller Alt Fuel Replaced 0 Cleaire + Chip Reflash (Frequent Callers) 1993 to 1998 MY trucks; 4 to 5 years useful life4,258 Semi Frequent Caller Trucks CD Replaced 0 Cleaire (Frequent callers)4,258 Frequent Caller Trucks CD Replaced 0 Cleaire SFF 1999 to 2003 MY trucks; to 5 years useful life
17,033 Total Trucks Replaced 0 Total Trucks Retrofitted 0 Semi-Frequent Trucks Cannot be Cleaired
Budget OverviewMeasure # Measure Description
SBP-HDV1 HDV Incentives (Clean Diesel) FY 2006/2007 FY 2007/2008 FY 2008/2009 FY 2009/2010 FY 2010/2011 Total NotesClean Diesel - POLA $0 $0 $0 $0 $0 $0 OperationalClean Diesel - POLB $0 $0 $0 $0 $0 $0Clean Diesel - SCAQMD $0 $0 $0 $0 $0 $0 Clean Diesel - ARB $0 $0 $0 $0 $0 $0Clean Diesel - EPA $0 $0 $0 $0 $0 $0Clean Diesel - Bond Funding $0 $268,200,000 $268,200,000 $268,200,000 $268,200,000 $1,072,800,000
$0 $268,200,000 $268,200,000 $268,200,000 $268,200,000 $1,072,800,000
HDV Incentives (Alt Fuels)LNG - POLA $16,000,000 $16,000,000 $16,000,000 $16,000,000 $16,000,000 $80,000,000 OperationalLNG - POLB $16,000,000 $16,000,000 $16,000,000 $16,000,000 $16,000,000 $80,000,000LNG - SCAQMD $12,000,000 $12,000,000 $12,000,000 $12,000,000 $12,000,000 $60,000,000 Assumes SCAQMD $6M/yr MatchLNG - ARB $0 $0 $0 $0 $0 $0LNG - EPA $0 $0 $0 $0 $0 $0LNG - Bond Funding $0 $346,400,000 $346,400,000 $346,400,000 $346,400,000 $1,385,600,000
$44,000,000 $390,400,000 $390,400,000 $390,400,000 $390,400,000 $1,605,600,000
Measure FY Totals $44,000,000 $658,600,000 $658,600,000 $658,600,000 $658,600,000 $2,678,400,000
SBP-HDV2 Alternate Fuel Infrastructure FY 2006/2007 FY 2007/2008 FY 2008/2009 FY 2009/2010 FY 2010/2011 Total NotesPOLA $1,500,000 $0 $0 $0 $0 $1,500,000POLB $1,500,000 $0 $0 $0 $0 $1,500,000SCAQMD tbd $0 $0 $0 $0 $0ARB $0 $0 $0 $0 $0 $0EPA $0 $0 $0 $0 $0 $0Bond Funding $0 $0 $0 $0 $0 $0
Measure FY Totals $3,000,000 $0 $0 $0 $0 $3,000,000
TOTAL HDV COSTS $47,000,000 $658,600,000 $658,600,000 $658,600,000 $658,600,000 $2,681,400,000
Budget by Measure
Page 45 of 83

San Pedro Bay Ports Clean Air Action PlanDRAFT - Clean Diesel & Alt Fuel Options for Policy DiscussionHeavy-Duty Vehicles (Trucks)
Budget Scenario 12 - Focus on Replacements all FF and SFF trucks 50:50 CD and Alt Fuel7,000 Frequent Trucks (preliminary 2005 EI data) 9,800 Semi-Frequent Trucks (preliminary 2005 EI data)4,258 Frequent Caller Trucks Alt Fuel Replaced 0 Cleaire + Chip Reflash SFF 1993 to 1998 MY trucks; 4 to 5 years useful life4,258 Semi-Frequent Caller Alt Fuel Replaced 0 Cleaire + Chip Reflash (Frequent Callers) 1993 to 1998 MY trucks; 4 to 5 years useful life4,258 Semi Frequent Caller Trucks CD Replaced 0 Cleaire (Frequent callers)4,258 Frequent Caller Trucks CD Replaced 0 Cleaire SFF 1999 to 2003 MY trucks; to 5 years useful life
17,033 Total Trucks Replaced 0 Total Trucks Retrofitted 0 Semi-Frequent Trucks Cannot be Cleaired
Budget Scenario 12 - Options for Cleaner Diesel (CD)
Measure # Measure DescriptionSBP-HDV1 HDV Incentives (Clean Diesel) FY 2006/2007 FY 2007/2008 FY 2008/2009 FY 2009/2010 FY 2010/2011 Total Notes
Bond Funding $0 $268,200,000 $268,200,000 $268,200,000 $268,200,000 $1,072,800,000
CD Option 12 - Clean Diesel Trucks MY2007+ Bond Funding $129,500 /truck ($126k O/Op, $1.3k AVL, $2.2k admin) see note below
Number of FF+SF trucks/year 0 2,071 2,071 2,071 2,071 8,283
Total DPM Emis Red tpy 0 105 209 314 419 1,047
Total NOx Emis Red tpy 0 780 1,559 2,627 3,407 8,373
Budget Scenario 12 - Options for Alt Fuels
Alt Fuel Option 1 - Purchase of New LNG Trucks $188,500 /truck ($185k O/Op, $1.3k AVL, $2.2k admin) see note belowMeasure # Measure Description
SBP-HDV1 HDV Incentives (Alt Fuel) FY 2006/2007 FY 2007/2008 FY 2008/2009 FY 2009/2010 FY 2010/2011 Total NotesPorts/SCAQMD Funding $44,000,000 $390,400,000 $390,400,000 $390,400,000 $390,400,000 $1,605,600,000
Number of total trucks/year 233 2,071 2,071 2,071 2,071 8,517
Total DPM Emis Red tpy 12.0 118.9 225.8 332.6 439.5 1,129
Total NOx Emis Red tpy 90 1,011 1,932 2,853 3,775 9,661
Budget by Measure
Budget by Measure
Page 46 of 83

San Pedro Bay Ports Clean Air Action PlanDRAFT - Clean Diesel & Alt Fuel Options for Policy DiscussionHeavy-Duty Vehicles (Trucks)
Budget Scenario 12 - Focus on Replacements all FF and SFF trucks 50:50 CD and Alt Fuel7,000 Frequent Trucks (preliminary 2005 EI data) 9,800 Semi-Frequent Trucks (preliminary 2005 EI data)4,258 Frequent Caller Trucks Alt Fuel Replaced 0 Cleaire + Chip Reflash SFF 1993 to 1998 MY trucks; 4 to 5 years useful life4,258 Semi-Frequent Caller Alt Fuel Replaced 0 Cleaire + Chip Reflash (Frequent Callers) 1993 to 1998 MY trucks; 4 to 5 years useful life4,258 Semi Frequent Caller Trucks CD Replaced 0 Cleaire (Frequent callers)4,258 Frequent Caller Trucks CD Replaced 0 Cleaire SFF 1999 to 2003 MY trucks; to 5 years useful life
17,033 Total Trucks Replaced 0 Total Trucks Retrofitted 0 Semi-Frequent Trucks Cannot be Cleaired
Alt Fuel Option 2 - Purchase of Westport LNG Trucks $188,500 /truck ($185k O/Op, $1.3k AVL, $2.2k admin) see note belowMeasure # Measure Description
SBP-HDV1 HDV Incentives (Alt Fuel) FY 2006/2007 FY 2007/2008 FY 2008/2009 FY 2009/2010 FY 2010/2011 Total NotesPorts/SCAQMD Funding $44,000,000 $390,400,000 $390,400,000 $390,400,000 $390,400,000 $1,605,600,000
Number of total trucks/year 233 2,071 2,071 2,071 2,071 8,517
Total DPM Emis Red tpy 12.0 118.6 225.2 331.9 438.5 1,126
Total NOx Emis Red tpy 104 1,097 2,089 3,082 4,075 10,447
Total (CD+Alt Fuel) DPM Red tpy 12.05 223.60 435.16 646.83 858.50Total (CD+Alt Fuel) NOx Red tpy 90 1,791 3,492 5,480 7,181
SBP-HDV1 FY 2006/2007 FY 2007/2008 FY 2008/2009 FY 2009/2010 FY 2010/2011 TotalTotal DPM Reduction (tpy) 12 224 435 647 858 2,176
Total NOx Reduction (tpy) 90 1,791 3,492 5,480 7,181 18,033
Total SOx Reduction (tpy) 0.108 0.957 0.957 0.957 0.957 3.936
NotesDiesel Truck Cost - Based on ARB's Ports Truck Report, page B-16LNG Truck Cost - Based on April 18, 2006 meeting between Westport, POLA, POLB and Starcrest
Budget by Measure
Page 47 of 83

San Pedro Bay Ports Clean Air Action Plan
DRAFT-June 2006
Implementation Schedule for the San Pedro Bay Ports Clean Air Action Plan Measures (Lease plus Phase In)
Measure Description Implementation Strategy
2006/2007 2007/2008 2008/2009 2009/2010 2010/2011POLA
SPBP-HDV1 All FF and SFF HDVs Incentive Funding by Ports, SCAQMD and Bonds 5% 39% 68% 83% 100%
SPBP-OGV1 VSR speed to 20 nm Voluntary, Incentive and Lease Requirement 100% 100% 100% 100% 100%VSR speed to 40 nm 0% 50% 100% 100% 100%
SPBP-OGV2 Reduction at Berth for container, liquid bulk and cruise terminals
Infrastructure-Ports OGV retrofit cost by OGV owners 2% 2% 7% 16% 23%
SPBP-OGV3 OGV Auxiliary Engine Fuel Improvement Lease Based 9% 26% 39% 45% 48%SPBP-OGV4 OGV Main Engine Fuel Improvement Lease Based 9% 26% 39% 45% 48%SPBP-OGV5 Slide Valve Retrofits for Main Engine OGVs Lease Based 9% 26% 39% 45% 48%SPBP-CHE1 Yard Tractors, Side Picks and Top Handlers Lease Based 9% 26% 42% 50% 53%
Other CHE Lease Based 0% 0% 0% 0% 53%POLB
SPBP-HDV1 All FF and SFF HDVs Funding by Ports, SCAQMD and Bonds 5% 39% 68% 83% 100%SPBP-OGV1 All ships VSR speed to 20 nm Voluntary, Incentive and Lease Requirement 100% 100% 100% 100% 100%
All Ships VSR speed to 40 nm 0% 50% 100% 100% 100%
SPBP-OGV2 Reduction at Berth for container and liquid bulk terminals
Infrastructure-Ports OGV retrofit cost by OGV owners 0% 1% 1% 1% 10%
SPBP-OGV3 OGV Auxiliary Engine Fuel Improvement Lease Based 13% 28% 39% 42% 43%SPBP-OGV4 OGV Main Engine Fuel Improvement Lease Based 13% 28% 39% 42% 43%SPBP-OGV5 Slide Valve Retrofits for Main Engine OGVs Lease Based 13% 28% 39% 42% 43%SPBP-CHE1 Yard Tractors, Side Picks and Top Handlers Lease Based 13% 28% 44% 47% 49%
Other CHE Lease Based 0% 0% 0% 0% 49%
Year 1 Year 2 Year 3 Year 4 Year 5Lease Required phase in (SPBP-OGV3,4 and 5) 50% 70% 90% 90% 90%Lease Required phase in (SPBP-CHE1) 50% 70% 100% 100% 100%
Overall Implementation
Page 48 of 83

San Pedro Bay Ports Clean Air Action Plan
DRAFT-June 2006
Measure Description Implementation Strategy
FY 1 FY 2 FY 3 FY 4 FY 5POLA
SPBP-HDV1 All FF and SFF HDVs Incentive Funding by Ports, SCAQMD and Bonds 5% 39% 68% 83% 100%
SPBP-OGV1VSR speed to 20 nm Voluntary, Incentive and Lease
Requirement 100% 100% 100% 100% 100%VSR speed to 40 nm 0% 50% 100% 100% 100%
SPBP-OGV2 Reduction at Berth for container, liquid bulk and cruise terminals
Infrastructure-Ports OGV retrofit cost by OGV owners Refer to Ship Calls Assumptions Shown Below
SPBP-OGV3 OGV Auxiliary Engine Fuel Improvement Lease Based 50% 70% 90% 90% 90%Upto 20 nm from Pt. Fermin 100% 100% 100% 100% 100%Upto 40 nm from Pt. Fermin 0% 50% 100% 100% 100%
SPBP-OGV4 OGV Main Engine Fuel Improvement Lease Based 50% 70% 90% 90% 90%Upto 20 nm from Pt. Fermin 100% 100% 100% 100% 100%Upto 40 nm from Pt. Fermin 0% 50% 100% 100% 100%
SPBP-OGV5 Slide Valve Retrofits for Main Engine OGVs Lease Based 50% 70% 90% 90% 90%Upto 20 nm from Pt. FerminUpto 40 nm from Pt. Fermin
SPBP-CHE1 Yard Tractors, Side Picks and Top Handlers Lease Based 50% 70% 100% 100% 90%Other CHE Lease Based 50% 70% 100% 100% 100%
POLB
SPBP-HDV1 All FF and SFF HDVs Funding by Ports, SCAQMD and Bonds 5% 39% 68% 83% 100%
SPBP-OGV1All ships VSR speed to 20 nm Voluntary, Incentive and Lease
Requirement 100% 100% 100% 100% 100%All Ships VSR speed to 40 nm 0% 50% 100% 100% 100%
SPBP-OGV2 Reduction at Berth for container and liquid bulk terminals
Infrastructure-Ports OGV retrofit cost by OGV owners Refer to Ship Calls Assumptions Shown Below
SPBP-OGV3 OGV Auxiliary Engine Fuel Improvement Lease Based 50% 70% 90% 90% 90%Upto 20 nm from Pt. Fermin 100% 100% 100% 100% 100%Upto 40 nm from Pt. Fermin 0% 50% 100% 100% 100%
SPBP-OGV4 OGV Main Engine Fuel Improvement Lease Based 50% 70% 90% 90% 90%Upto 20 nm from Pt. Fermin 100% 100% 100% 100% 100%Upto 40 nm from Pt. Fermin 0% 50% 100% 100% 100%
SPBP-OGV5 Slide Valve Retrofits for Main Engine OGVs Lease Based 50% 70% 90% 90% 90%Upto 20 nm from Pt. FerminUpto 40 nm from Pt. Fermin
SPBP-CHE1 Yard Tractors, Side Picks and Top Handlers Lease Based 50% 70% 100% 100% 90%Other CHE Lease Based 50% 70% 100% 100% 100%
Overall Implementation
This measure provides emissions reduction through out the operation of OGV main engines
This measure provides emissions reduction through out the operation of OGV main engines
Once the Lease is Renewed Following Phase in Schedule Applies for San Pedro Bay Ports Clean Air Action Plan Measures
Page 49 of 83

San Pedro Bay Ports Clean Air Action Plan
DRAFT-June 2006
Once the Lease is Renewed Following Phase in Schedule Applies for San Pedro Bay Ports Clean Air Action Plan Measures
Ship Calls Assumptions for POLA -SPBP-OGV 2 YEAR 2006 2007 2008 2009 2010
B90-93 (Cruise Terminal)
40% of Princess
Calls
80% of Princess
Calls
80% of Princess
Calls
Pier 300 (APL)
Pier 400 (APM)
B224-236 (Evergreen) rebuilding wharf
Wharf work for 3/4 year
up to 70% at one Berth
up to 100% at one berth
B212-218 (YTI) Assumes issues are resolved rebuilding wharfWharf work for 3/4 year
up to 70% at one Berth
up to 100% at one berth
B175-181(Pasha)
B136-147 (TraPac)
0 0 0
EIR/EIS Complete;
Wharf Work
complete mid year
Mitigation: 30% MOL
ships (assumes
1/2 MOL, 1/2 invitee)
EIR/EIS Complete; Mitigation: 60% MOL
ships (assumes
1/2 MOL, 1/2 invitee)
B121-131 (WBCT)
B100-102 (CS) 70% (1 weekly, 1 biweekly) EIR/EIS Complete; Mitigation: 70% (1 weekly, 1 biweekly)
EIR/EIS Complete; Mitigation:
70% (1 weekly, 1 biweekly)
EIR/EIS Complete; Mitigation:
70% (2 weekly, 1 biweekly)
EIR/EIS Complete; Mitigation: 100% (2 weekly, 1 biweekly)
Pier 400 (Liquid Bulk)
bimonthly service 20%
ship calls
bimonthly service 20%
ship callsB195-199
Shore Power Schedule for the POLB
Site Number of Berth Anticipated Date of Operation Number of CallsPier C(Matson) 1 Jan-11 52 calls per berth
Pier D,E,F (Middle Harbor) 1 Sep-11 17 calls per berthPier G (ITS) 2 Jan-11 50 calls per berthPier S 2 Sep-11 33 calls per berthPier T, berth T121 (BP) 1 4 th qtr of 2007 12 vessels per year
Page 50 of 83

San Pedro Bay Ports Clean Air Action Plan
DRAFT-June 2006
2001 OGV Baseline Emissions in tpy for POLA
1 Applicable to all OGV measures
Tons Per Year
Type NOx Main NOx Aux DPMMain DPMAux SOx main SOx Aux
Auto Carrier 125 31 13 1 72 17Bulk 171 99 18 4 99 66Containership 2,968 1,290 320 44 1,824 663Cruise 839 604 86 14 500 201General Cargo 60 27 6 1 35 20Miscellaneous 5 10 1 1 3 8Other Tug 11 1 1 0 8 0Reefer 45 6 5 0 26 4RoRo 10 25 3 1 63 21Tanker 232 342 26 14 174 207Totals 4,464 2,434 478 81 2,804 1,206Total Main plus Auxiliary Engines 6,898 558 4,0101 VSR speeds not included
Page 51 of 83

San Pedro Bay Ports Clean Air Action Plan
DRAFT-June 2006
2002 OGV Baseline Emissions in tpy for POLB
1 Applicable to all OGV measures
Tons Per Year
Type NOx Main NOx Aux DPMMain DPMAux SOx main SOx Aux
Auto 91.9 43.0 12.1 2.0 45.0 28.1Container 2518.3 1729.7 335.8 78.9 1140.2 1128.2Other 500.4 434.1 69.6 19.8 292.1 139.8RoRo 62.4 135.6 8.8 6.2 32.9 87.9Reefer 42.8 90.2 6.7 4.1 26.3 58.6Tanker 646.2 381.8 110.8 17.4 512.1 247.9Totals 3862.1 2814.3 543.9 128.4 2048.7 1690.5
Total Main plus Auxiliary Engines 6,676 672 3,7391 VSR speeds not included
Page 52 of 83

San Pedro Bay Ports Clean Air Action Plan
DRAFT-June 2006
Emission Reductions Achieved by Fuel Substitutions
The following tables present emission reduction percentages potentially achieved by switching fuelsApplied to calculate emissions reductions from CARB's Marine Auxiliary Engine regulation, SPBP-OGV3 and SPBP-OGV4
Substituted Fuel Type
NOx
2.7%
S IF
O
1.5%
S IF
O
1.5%
S M
DO
0.5%
S M
GO
0.2%
S M
GO
0.1%
S M
GO
500 p
pm S
EPA
500 p
pm S
CARB15
ppm
S CARB
NOx
NOx Reduction from SwitchingCurrent Fuel Type Designation
Residual 2.7% S IFO 0% 0% 10% 10% 10% 10% 10% 15% 15%Residual 1.5% S IFO 0% 10% 10% 10% 10% 10% 15% 15%Distillate 1.5% S MDO 0% 0% 0% 0% 0% 7% 7%Distillate 0.5% S MGO 0% 0% 0% 0% 7% 7%Distillate 0.2% S MGO 0% 0% 0% 7% 7%Low S Distillate 0.1% S MGO 0% 0% 7% 7%EPA Onroad 500 ppm S EPA 0% 7% 7%CARB Onroad 500 ppm S CARB 0% 0%CARB Onroad 15 ppm S CARB 0%Note: The 10% NOx redn. is based on lower N in distillate fuel per EPA420-D-02-002, 4/02, Table 8.3-4. Note: The 7% reduction for CARB diesel is estimated based on the lower aromatic content.Note: Entec reported a 6% NOx reduction for the residual to distillate switch (rather than 10%).
NOx Reduction from Switching
Page 53 of 83

San Pedro Bay Ports Clean Air Action Plan
DRAFT-June 2006
Emission Reductions Achieved by Fuel Substitutions
DPM
Substituted Fuel Type
2.7%
S IF
O
1.5%
S IF
O
1.5%
S M
DO
0.5%
S M
GO
0.2%
S M
GO
0.1%
S M
GO
500 p
pm S
EPA
500 p
pm S
CARB15
ppm
S CARB
DPM
PM Reduction from SwitchingCurrent Fuel Type DesignationResidual 2.7% S IFO 0% 18% 53% 61% 64% 65% 68% 74% 75%Residual 1.5% S IFO 0% 42% 51% 53% 54% 61% 68% 69%Distillate 1.5% S MDO 0% 15% 20% 21% 61% 68% 69%Distillate 0.5% S MGO 0% 5% 6% 7% 10% 10%Distillate 0.2% S MGO 0% 2% 8% 25% 28%Low S Distillate 0.1% S MGO 0% 4% 21% 25%EPA Onroad 500 ppm S EPA 0% 20% 23%CARB Onroad 500 ppm S CARB 0% 4%CARB Onroad 15 ppm S CARB 0%
Assumption: Reduction due to S and Distillate are calculated using multiplicative CFs
PM Reduction from Switching
Page 54 of 83

San Pedro Bay Ports Clean Air Action Plan
DRAFT-June 2006
Emission Reductions Achieved by Fuel SubstitutionsSubstituted Fuel Type
SOx
2.7%
S IF
O
1.5%
S IF
O
1.5%
S M
DO
0.5%
S M
GO
0.2%
S M
GO
0.1%
S M
GO
500 p
pm S
EPA
500 p
pm S
CARB15
ppm
S CARB
SO2 Reduction from Switching
SOx
Current Fuel Type Designation
Residual 2.7% S IFO 0% 44% 44% 81% 93% 96% 98% 98% 99%Residual 1.5% S IFO 0% 0% 67% 87% 93% 97% 97% 99%Distillate 1.5% S MDO 0% 67% 87% 93% 97% 97% 99%Distillate 0.5% S MGO 0% 60% 80% 90% 90% 97%Distillate 0.2% S MGO 0% 50% 75% 75% 93%Low S Distillate 0.1% S MGO 0% 50% 50% 85%EPA Onroad 500 ppm S EPA 0% 0% 97%CARB Onroad 500 ppm S CARB 0% 97%CARB Onroad 15 ppm S CARB 0%Note: Gray color areas represent no emission reductions.Note: Sulfur oxide reductions directly proportional to reductions in fuel sulfur content.
SO2 Reduction from Switching
Page 55 of 83

San Pedro Bay Ports Clean Air Action Plan
DRAFT-June 2006
Emission Reductions Achieved by Fuel SubstitutionsDPM Reduction Calculations
% S % Rdn from 2.7% 2.7 0%1.5 18% From EPA420-D-02-0020.5 56%0.3 63% From EPA420-D-02-002,switching from 2.7% IFO to 0.3 % S distillate
Reduction CFDPM reduction per 1% S reduction 15% 85%DPM reduction due to S from 2.7 to 1.5 (2.7-1.5) 18% 82% DPM reduction due to S from 2.7 to 0.5 (2.7-0.5) 33% 67%DPM reduction due to S from 2.7 to 0.3 (2.7-0.3) 36% 64% DPM reduction due to S from 2.7 to 0.2 (2.7-0.2) 38% 63%DPM reduction due to S from 2.7 to 0.1 (2.7-0.1) 39% 61%DPM reduction due to S from 1.5 to 0.5 (1.5-0.5) 15% 85%DPM reduction due to S from 1.5 to 0.2 (1.5-0.2) 20% 81%DPM reduction due to S from 1.5 to 0.1 (1.5-0.1) 21% 79% DPM reduction due to S from .5 to 0.2 (1.5-0.2) 5% 96%DPM reduction due to S from .5 to 0.1 (1.5-0.1) 6% 94%DPM reduction due to S from .2 to 0.1 (.2-0.1) 2% 99%DPM reduction due to switch from residual to distillate fuel 42% 58%
Page 56 of 83

San Pedro Bay Ports Clean Air Action Plan
DRAFT-June 2006
CARB's Adopted Marine Auxiliary Engines Regulation Adopted in December of 2005
Assumption: Ships utilizing AMP/Cold Ironing are also meeting CARB's Marine Auxiliary Engine regulationPort of Los Angeles
Requirements for all OGV auxiliary engines operating within 24 nautical miles:Starting January 1, 2007, use MGO 0.5% or less S contentStarting January 1, 2010, use MGO with 0.1% or less S content
Emission Reduction (tpy) FY FY FY FY FY FY2005/2006 2006/2007 2007/2008 2008/2009 2009/2010 2010/2011
1 Baseline OGV NOx emissions (tpy) 6,898 6,898 6,898 6,898 6,898 6,898NOx Emissions Reduced 24 nm 0 35 69 69 69 69NOx CF (Total OGV) 1.000 0.995 0.990 0.990 0.990 0.9901 Baseline OGV PM emissions (tpy) 558 558 558 558 558 558DPM Emissions Reduced 24 nm 0 12 23 23 24 25DPM CF (Total OGV) 1.000 0.979 0.958 0.958 0.957 0.9561 Baseline SOx Emissions (tpy) 4010 4010 4010 4010 4010 4010SOx Emissions Reduced 24 nm 0 373 747 747 747 747SOx CF (Total OGV) 1.000 0.907 0.814 0.814 0.814 0.8141 Includes Main and Auxiliary Engine Emissions
Page 57 of 83

San Pedro Bay Ports Clean Air Action Plan
DRAFT-June 2006
CARB's Adopted Marine Auxiliary Engines Regulation Adopted in December of 2005Percent of total POLA auxilairy and main OGV emissions within 24 nm 82%
% of Emissions from IFO380in all Auxiliary Engines
% IFO380 %MDO Aux NOx Aux PM AuxSOx NOx PM SOxContainership 37.4% 62.6% 53.0% 54.8% 54.98% 20.5% 33.6% 34.7%Tanker 54.8% 45.2% 14.0% 17.0% 17.19% 7.9% 13.0% 13.3%Cruise Ship 4.1% 95.9% 24.8% 17.2% 16.64% 1.1% 1.8% 1.8%Other 60.7% 39.3% 8.2% 11.0% 11.19% 5.1% 8.9% 9.1%Composite 100.0% 100.0% 100.0% 34.5% 57.2% 59.0%
(2) Table 2.3, pg.53; FINAL DRAFT Port-Wide Baseline Air Emissions Inventory, 2004Sample Calc:% Emissions from IFO380 in Aux =((%IFO x IFO EF) / ((%IFO x IFO EF)+(%MDO x MDO EF))) x % EmissionsReduction in tpy = Total Aux Emissions x % Emissions from IFO 380 in Aux x % Red due to fuel switch x % Emissions within 24 nm
Fuel Use Distribution2 % Emissions
Page 58 of 83

San Pedro Bay Ports Clean Air Action Plan
DRAFT-June 2006 CARB's Adopted Marine Auxiliary Engines Regulation Adopted in December of 2005
Assumption: Ships utilizing AMP/Cold Ironing are also meeting CARB's Marine Auxiliary Engine regulationPort of Long Beach
Requirements for all OGV auxiliary engines operating within 24 nautical miles:Starting January 1, 2007, use MGO with 0.5% or less sulfur content Starting January 1, 2010, use MGO with 0.1% or less sulfur content
Emission Reduction (tpy)
FY 2005/2006
FY 2006/2007 FY 2007/2008
FY 2008/2009
FY 2009/2010
FY 2010/2011
1 Baseline OGV NOx emissions (tpy) 6,676 6,676 6,676 6,676 6,676 6,676NOx Emissions Reduced 24 nm 0 97 194 194 194 194NOx CF (Total OGV) 1.000 0.985 0.971 0.971 0.971 0.9711 Baseline OGV PM emissions (tpy) 672 672 672 672 672 672DPM Emissions Reduced 24 nm 0 33 65 65 67 69DPM CF (Total OGV) 1.000 0.952 0.903 0.903 0.900 0.8981 Baseline SOx Emissions (tpy) 3739 3739 3739 3739 3739 3739SOx Emissions Reduced 24 nm 0.000 640 1,279 1,279 1,279 1,279SOx CF (Total OGV) 1.000 0.829 0.658 0.658 0.658 0.6581 Includes Main and Auxiliary Engine Emissions
Page 59 of 83

San Pedro Bay Ports Clean Air Action Plan
DRAFT-June 2006 CARB's Adopted Marine Auxiliary Engines Regulation Adopted in December of 2005
Percent of total POLB auxilairy and main OGV emissions within 24 nm 95%
% of Emissions from IFO380in all Auxiliary Engines
% IFO380 %MDO Aux NOx Aux PM Aux SOx NOx PM SOxContainership 71.0% 29.0% 66.7% 66.7% 66.7% 48.1% 57.9% 58.4%Tanker 71.0% 29.0% 14.7% 14.7% 14.7% 10.6% 12.7% 12.8%Cruise Ship 71.0% 29.0% 0.0% 0.0% 0.0% 0.0% 0.0% 0.0%Other 71.0% 29.0% 18.6% 18.6% 18.6% 13.4% 16.1% 16.3%Composite 100.0% 100.0% 100.0% 72.1% 86.7% 87.5%Sample Calc:% Emissions from IFO380 in Aux =((%IFO x IFO EF) / ((%IFO x IFO EF)+(%MDO x MDO EF))) x % EmissionsReduction in tpy = Total Aux Emissions x % Emissions from IFO 380 in Aux x % Red due to fuel switch x % Emissions within 24 nm
Fuel Use Distribution2 % Emissions
Page 60 of 83

San Pedro Bay Ports Clean Air Action Plan
DRAFT-June 2006 SPBP-OGV 1 - Vessel Speed Reduction (VSR) based on Tariff and Inventives
Applicable to all OGVs Port of Los Angeles
FY FY FY FY FY FY2005/2006 2006/2007 2007/2008 2008/2009 2009/2010 2010/2011
Participation rate @ 20 nm from Pt. Fermin 70% 100% 100% 100% 100% 100%Participation rate @ 40 nm from Pt. Fermin 0% 0% 50% 100% 100% 100%
Emission Reduction Percentages(1)
Main Engine AuxiliariesNOx 57.6% -6.7% Auxiliary engine emissions increase becausePM10 0.0% -8.1% of increased time in transit (due to lower speeds)
Speed assumptions: w/out VSR 22 knotswith VSR 12 knots
20-mile VSRFY FY FY FY FY FY
2005/2006 2006/2007 2007/2008 2008/2009 2009/2010 2010/2011Distance of Compliance Zone (nm) 20 20 20 20 20 20Participation Rate2 (at 12 kts) 70% 100% 100% 100% 100% 100%
Main Engine (relative to current VSR distance & emissions) 2005/2006 2006/2007 2007/2008 2008/2009 2009/2010 2010/2011NOx, % reduction 20% 29% 29% 29% 29% 29%NOx, tons reduction per year 900 1,286 1,286 1,286 1,286 1,286DPM10 (credit only taken for NOx reductions pending evaluation of effect on PM emissions)Increase in Auxiliary Engine Emissions due to longer transit timesNOx, % increase 2.3% 3.4% 3.4% 3.4% 3.4% 3.4%NOx, tons increase per year 11 16 16 16 16 16DPM, % increase 2.8% 4.1% 4.1% 4.1% 4.1% 4.1% DPM, tons increase per year 0.5 0.6 0.5 0.5 0.5 0.5 Net Decrease, tons NOx: 888 1,269 1,270 1,270 1,270 1,270Expanded Distance VSR3
Page 61 of 83

San Pedro Bay Ports Clean Air Action Plan
DRAFT-June 2006 SPBP-OGV 1 - Vessel Speed Reduction (VSR) based on Tariff and Inventives
Applicable to all OGVs Port of Los Angeles DO NOT DOUBLE COUNT FY FY FY FY FY FYwith current 20 nm program 2005/2006 2006/2007 2007/2008 2008/2009 2009/2010 2010/2011Additional Distance of Compliance Zone (nm) 20 20 20 20 20 20Participation Rate2 (at 12 kts) 0% 0% 50% 100% 100% 100%
Main Engine Emission Decreases FY FY FY FY FY FY(Only enhanced VSR distance) 2005/2006 2006/2007 2007/2008 2008/2009 2009/2010 2010/2011NOx, % reduction 0% 0% 14% 29% 29% 29%NOx, tons reduction per year 0 0 643 1,286 1,286 1,286DPM (credit only taken for NOx reductions pending evaluation of effect on PM emissions)Increase in Auxiliary Engine Emissions due to longer transit timesNOx, % increase 0.0% 0.0% 1.7% 3.4% 3.4% 3.4%NOx, tons increase per year 0 0 8 16 16 16DPM, % increase 0.0% 0.0% 2.0% 4.1% 4.1% 4.1%DPM, tons increase per year 0.0 0.0 0.2 0.3 0.3 0.3Net Decrease, tons NOx: 0 0 635 1,270 1,270 1,270Net Decrease, tons NOx, only expanded VSR: 0 0 635 1,270 1,270 1,270 Nox CF for current plus expanded VSR 0.871 0.815 0.721 0.628 0.628 0.628 Notes:1 - Reductions calculated using 20-mile VSR applicability distance @ 100% participation (12 knots)2 - Participation Rate: Currently, as modeled, the participation rate only takes into account those vessels that reach the target speed of 12 knots, however the POLA VSR program takes into account the reductions associated w/all vessels that reduce speed over their baseline corrected speed. This difference will be incorporated into the next version of this control measure worksheet.3 - Percent reductions and increases are relative to emissions within the expanded VSR zone. Tons of reductions and increases have been estimated using the ratio of expanded VSR distance to current (20 nm) VSR distance to adjust for the greater emissions basis of the expanded program.
Page 62 of 83

San Pedro Bay Ports Clean Air Action Plan
DRAFT-June 2006 SPBP-OGV 1 - Vessel Speed Reduction (VSR) based on Tariff and Inventives
Applicable to all OGVs Port of Los Angeles Information Used to Estimate Emissions Reductions From VSR Program
1. BLEI Speed Emissions Total, tpy for POLA 2. Modeled at 12-Knot Scenario in Fairway, tpyTons Per Year Tons Per YearType NOx Main NOx Aux PMMain PMAux NOx Main NOx Aux PMMain PMAux
Auto Carrier 124.6 30.5 13.2 1.1 64.7 32.4 6.9 1.2Bulk 170.6 98.8 18.0 4.3 137.3 103.3 14.5 4.8Containership 2,967.6 1,290.3 319.8 44.2 1,068.6 1,356.0 117.0 47.4Cruise 838.5 603.8 85.6 13.9 353.6 687.6 36.6 15.9General Cargo 59.8 27.3 6.3 1.3 41.9 28.3 4.5 1.4Miscellaneous 5.3 9.6 0.6 0.5 4.0 9.9 0.4 0.6Other Tug 10.6 1.1 0.6 0.0 10.6 1.1 0.6 0.0Reefer 44.8 6.5 4.6 0.2 20.1 7.5 2.1 0.4RoRo 9.8 24.8 2.9 1.4 7.6 25.4 2.2 1.4Tanker 231.9 341.7 26.0 13.7 183.6 345.7 20.7 14.1Totals 4,463.6 2,434.4 477.7 80.7 1,892.0 2,597.3 205.6 87.0
3. Reduction between Corrected & 12 Knot Scenario, tpy Based on POLA emissions 4. Percentage Reduction by Vessel TypeTons Per Year Type NOx Main NOx Aux PMMain PMAux NOx Main NOx Aux PMMain PMAux
Auto Carrier 59.9 -1.9 6.3 -0.1 48% -6% 48% -9%Bulk 33.3 -4.5 3.5 -0.4 20% -5% 19% -9%Containership 1,899.0 -65.6 202.8 -3.2 64% -5% 63% -7%Cruise 484.9 -83.8 49.0 -2.0 58% -14% 57% -14%General Cargo 17.8 -1.1 1.9 -0.1 30% -4% 30% -8%Miscellaneous 1.3 -0.3 0.1 -0.1 24% -3% 17% -20%Other Tug 0.0 0.0 0.0 0.0 0% 0% 0% 0%Reefer 24.7 -1.0 2.5 -0.2 55% -15% 54% -100%RoRo 2.2 -0.5 0.7 0.0 22% -2% 24% 0%Tanker 48.3 -4.0 5.3 -0.4 21% -1% 20% -3%Totals 2,571.4 -162.7 272.1 -6.5 57.6% -6.7% 57.0% -8.1%
Notes:1 - Adjusted Speeds: 2001 Baseline OGV transit emissions modeled with speed correction factors used by the Port
in estimating reductions from the VSR program2 - 12-Knot Scenario: Modeled corrected speed emissions from all OGVs transiting at 12 knots; auxiliary engine
emissions increased because of longer transit times
Page 63 of 83

San Pedro Bay Ports Clean Air Action Plan
DRAFT-June 2006 SPBP-OGV 1 - Vessel Speed Reduction (VSR) based on Tariff and Inventives
Applicable to all OGVs Port of Los Angeles Percent of auxiliary emissions during transit: 20%
Page 64 of 83

San Pedro Bay Ports Clean Air Action Plan
DRAFT-June 2006 SPBP-OGV 1 - Vessel Speed Reduction (VSR) based on Tariff and Inventives
Applicable to all OGVs
Port of Long Beach
FY FY FY FY FY FY2005/2006 2006/2007 2007/2008 2008/2009 2009/2010 2010/2011
Participation rate @ 20 nm from Pt. Fermin 0% 100% 100% 100% 100% 100%Participation rate @ 40 nm from Pt. Fermin 0% 0% 50% 100% 100% 100%
Emission Reduction Percentages(1)
Main Engine AuxiliariesNOx 23.4% -1.1% Auxiliary engine emissions increase becausePM10 0.0% -1.1% of increased time in transit (due to lower speeds)
Speed assumptions: w/out VSR 22 knotswith VSR 12 knots
20-mile VSRFY FY FY FY FY FY
2005/2006 2006/2007 2007/2008 2008/2009 2009/2010 2010/2011Distance of Compliance Zone (nm) 20 20 20 20 20 20Participation Rate2 (at 12 kts) 78% 100% 100% 100% 100% 100%
Main Engine Emission Decreases FY FY FY FY FY FY(relative to current VSR distance & emissions) 2005/2006 2006/2007 2007/2008 2008/2009 2009/2010 2010/2011NOx, % reduction 9% 12% 12% 12% 12% 12%NOx, tons reduction per year 353 453 453 453 453 453DPM10 (credit only taken for NOx reductions pending evaluation of effect on PM emissions)
Increase in Auxiliary Engine Emissions due to longer transit timesNOx, % increase 0.4% 0.5% 0.5% 0.5% 0.5% 0.5%NOx, tons increase per year 2 2 2 2 2 2DPM, % increase 0.4% 0.5% 0.5% 0.5% 0.5% 0.5%DPM, tons increase per year 0.1 0.1 0.0 0.0 0.0 0.0Net Decrease, tons NOx: 352 451 451 451 451 451 Expanded Distance VSR3
DO NOT DOUBLE COUNT FY FY FY FY FY FYwith current 20 nm program 2005/2006 2006/2007 2007/2008 2008/2009 2009/2010 2010/2011Additional Distance of Compliance Zone (nm) 20 20 20 20 20 20Participation Rate2 (at 12 kts) 0% 0% 50% 100% 100% 100%
Page 65 of 83

San Pedro Bay Ports Clean Air Action Plan
DRAFT-June 2006 SPBP-OGV 1 - Vessel Speed Reduction (VSR) based on Tariff and Inventives
Applicable to all OGVs
Port of Long Beach
Main Engine Emission Decreases FY FY FY FY FY FY(Only enhanced VSR distance) 2005/2006 2006/2007 2007/2008 2008/2009 2009/2010 2010/2011NOx, % reduction 0% 0% 6% 12% 12% 12%NOx, tons reduction per year 0 0 226 453 453 453DPM (credit only taken for NOx reductions pending evaluation of effect on PM emissions)Increase in Auxiliary Engine Emissions due to longer transit timesNOx, % increase 0.0% 0.0% 0.3% 0.5% 0.5% 0.5%NOx, tons increase per year 0 0 1 2 2 2DPM, % increase 0.0% 0.0% 0.3% 0.5% 0.5% 0.5%DPM, tons increase per year 0.0 0.0 0.0 0.0 0.0 0.0Net Decrease, tons NOx: 0 0 225 451 451 451 Net Decrease, tons NOx, only expanded VSR: 0 0 225 451 451 451Nox CF for current plus expanded VSR 0.947 0.931 0.896 0.861 0.861 0.861Notes:1 - Reductions calculated using 20-mile VSR applicability distance @ 100% participation (12 knots)2 - Participation Rate: 2002 baseline emissions inventory assumes before VSR speeds.3 - Percent reductions and increases are relative to emissions within the expanded VSR zone. Tons of reductions and increases have been estimated using the ratio of expanded VSR distance to current (20 nm) VSR distance to adjust for the greater emissions basis of the expanded program.
Page 66 of 83

San Pedro Bay Ports Clean Air Action Plan
DRAFT-June 2006 SPBP-OGV 1 - Vessel Speed Reduction (VSR) based on Tariff and Inventives
Applicable to all OGVs
Port of Long Beach
Information Used to Estimate Emissions Reductions From VSR Program
2002 POLB, Emissions in TPY
NO VSR VSR to 20 Miles - 12 Knots
Type NOx Main NOx Aux NOx PMMain PMAux PM Type NOx Main NOx Aux NOx PMMain PMAux PM
Auto Carrier 91.94 43.03 134.97 12.11 1.96 14.07 Auto Carri 69.87 43.81 113.68 9.09 2.00 11.09Bulk 293.96 259.66 553.62 41.60 11.84 53.45 Bulk 270.45 260.24 530.69 38.11 11.87 49.98Containership 2,518.34 1,729.68 4,248.02 335.83 78.89 414.73 Containers 1,762.79 1,754.72 3,517.51 229.13 80.04 309.16General Cargo 97.02 66.95 163.98 13.31 3.05 16.37 General Ca 86.11 67.25 153.36 11.79 3.07 14.85ITB 85.06 29.71 114.78 11.19 1.36 12.54 ITB 77.02 29.83 106.86 10.10 1.36 11.46MISC 24.31 77.75 102.06 3.51 3.55 7.06 MISC 23.00 77.80 100.80 3.31 3.55 6.86RORO 62.44 135.60 198.04 8.84 6.19 15.03 RORO 49.62 136.12 185.74 6.96 6.21 13.17Reefer 42.82 90.19 133.01 6.73 4.11 10.84 Reefer 35.92 91.01 126.93 5.61 4.15 9.76Tanker 646.18 381.76 1,027.94 110.78 17.41 128.19 Tanker 581.87 383.88 965.74 99.16 17.51 116.67
3,862.08 2,814.35 6,676.43 543.91 128.37 672.27 2,956.64 2,844.67 5,801.31 413.26 129.75 543.01
Reductions Percentage Reductions
Type NOx Main NOx Aux NOx PMMain PMAux PM Type NOxMain NOx Aux NOx PMMain PMAux PM
Auto Carrier 22.08 -0.78 21.29 3.02 -0.04 2.98 Auto Carri 24.0% -1.8% 15.8% 24.9% -1.8% 21.2%Bulk 23.51 -0.58 22.93 3.49 -0.03 3.47 Bulk 8.0% -0.2% 4.1% 8.4% -0.2% 6.5%Containership 755.55 -25.04 730.51 106.71 -1.14 105.56 Containers 30.0% -1.4% 17.2% 31.8% -1.4% 25.5%General Cargo 10.92 -0.30 10.62 1.53 -0.01 1.51 General Ca 11.3% -0.4% 6.5% 11.5% -0.4% 9.3%ITB 8.04 -0.12 7.92 1.09 -0.01 1.08 ITB 9.5% -0.4% 6.9% 9.7% -0.4% 8.6%MISC 1.31 -0.05 1.26 0.20 0.00 0.20 MISC 5.4% -0.1% 1.2% 5.8% -0.1% 2.9%RORO 12.82 -0.52 12.30 1.88 -0.02 1.86 RORO 20.5% -0.4% 6.2% 21.3% -0.4% 12.4%Reefer 6.90 -0.82 6.08 1.11 -0.04 1.08 Reefer 16.1% -0.9% 4.6% 16.6% -0.9% 9.9%Tanker 64.32 -2.12 62.20 11.61 -0.10 11.52 Tanker 10.0% -0.6% 6.1% 10.5% -0.6% 9.0%
905.44 -30.32 875.12 130.65 -1.38 129.26 23.4% -1.1% 13.1% 24.0% -1.1% 19.2%
Notes:1 - Adjusted Speeds: 2001 Baseline OGV transit emissions modeled with speed correction factors used by the Port
in estimating reductions from the VSR program2 - 12-Knot Scenario: Modeled corrected speed emissions from all OGVs transiting at 12 knots; auxiliary engine
emissions increased because of longer transit times
Percent of auxiliary emissions during transit: 13%
Page 67 of 83

San Pedro Bay Ports Clean Air Action Plan
DRAFT-June 2006 SPBP-OGV 1 - Vessel Speed Reduction (VSR) based on Tariff and Inventives
Applicable to all OGVs
Port of Long Beach
SPBP-OGV 1 - Vessel Speed Reduction (VSR) expanded to 20 nm POLB
FY 2006/2007
FY 2007/2008
FY 2008/2009
FY 2009/2010
FY 2010/2011 Total
(tpy) (tpy) (tpy) (tpy) (tpy) (tons)Current VSR participation (20 nm) 78% 100% 100% 100% 100% DPM Reduction 0 0 0 0 0 0NOx Reduction 451 451 451 451 451 2,254
Incentives 0% 50% 100% 100% 100%DPM Reduction 0 0 0 0 0 0NOx Reduction 0 225 451 451 451 1,578
Total SPBP-OGV1 ReductionTOTAL Measure DPM Reductions 0 0 0 0 0 0TOTAL Measure NOx Reductions 451 676 902 902 902 3,833
Page 68 of 83

San Pedro Bay Ports Clean Air Action Plan
DRAFT-June 2006 SPBP-OGV 2 - Reduction of At-Berth OGV Emissions through Lease requirement, Incentives and Capital FundingAssumption: Ships utilizing AMP are also meeting CARB's Marine Auxiliary Engine regulation
Port of Los Angeles
FY FY FY FY FY2006/2007 2007/2008 2008/2009 2009/2010 2010/2011
Annual kW-hrs - Containerships 6,264,000 5,832,000 8,208,000 22,032,000 49,572,000 Annual kW-hrs - Tanker 0 0 0 648,000 1,296,000 Annual kW-hrs - Cruise Ships 0 0 6,400,000 12,800,000 12,800,000
NOx Reductions, tons, containerships 92 84 118 318 715 NOx Reductions, tons, Tankers 0 0 0 9 19NOx Reductions, tons, cruise ships 0 0 91 181 181 Combined NOx Reductions, tons 92 84 209 509 916 NOx CF 0.987 0.988 0.969 0.926 0.866DPM Reductions, tons, containerships 3 2 3 8 17DPM Reductions, tons, Tankers 0.0 0.0 0.0 0.3 0.5DPM Reductions, tons, cruise ships 0.0 0.0 1.5 3.0 3.0Combined DPM Reductions, tons 3 2 4 11 21DPM CF 0.995 0.996 0.992 0.979 0.961SOx Reductions, tons, containerships 43 36 51 136 306SOx Reductions, tons, Tankers 0 0 0 5 10SOx Reductions, tons, cruise ships 0 0 25 50 50Combined SOx Reductions, tons 43 36 76 191 366SOx CF 0.987 0.988 0.975 0.937 0.880
Auxiliary Engine Emission Factors, g/kW-hr Residual Distillate Container Tanker CruiseNOx 14.70 13.90 14.20 14.34 13.93PM 0.8 0.3 0.49 0.57 0.32SOx 12.3 4.3 7.26 8.68 4.62Percentage fuel used, Container 37% 63%Percentage fuel used, Tanker 55% 45%Percentage fuel used, Cruise 4% 96%From Table 2.3:Summary of Mono-Fuel or Dual-Fuel by Vessel Type, page 56 from report "Port of Los Angeles Baseline Air Emissions Inventory-2001"
Percentage of hoteling emissions eliminated: 95%
Assumed Schedule for Containership AMP Participation - POLAFY FY FY FY FY
2006/2007 2007/2008 2008/2009 2009/2010 2010/2011B212-218 (YTI) 4 0 11 36 52
B224-236 (Evergreen) 0 0 11 36 52
APM 0 0 0 0 10
B136-147 (Trapac) 0 0 0 40 106
Pier 300 (APL) 0 0 0 0 72
B100-102 (CS) 54 54 54 92 131
B121-131 (Yang Ming or WBCT) 0 0 0 0 36
Total container calls 58 54 76 204 4595-year 851
kW-HR 6,264,000 5,832,000 8,208,000 22,032,000 49,572,000
108,000 kW per call (72 hrs/ container&tanker call, 1,500 kW load during hoteling)
Assumed Schedule for Liquid Bulk (tanker) AMP Participation
Pier 400 (Liquid Bulk) 0 0 0 6 12
kW-HR 0 0 0 648000 1296000
Assumed Schedule for Cruise Ship AMP Participation
B90-93Cruise 0 0 100 200 200
kW-HR 0 0 6400000 12800000 12800000
Total Calls 58 54 176 410 671
kW/hrs per call: 64,000 (8 hrs per cruise call, 8,000 kW load during hoteling)
Page 69 of 83

San Pedro Bay Ports Clean Air Action Plan
DRAFT-June 2006
SPBP-OGV 2 - Reduction of At-Berth OGV Emissions through Lease requirement, Incentives and Capital FundingAssumption: Ships utilizing cold ironing are also meeting CARB's Marine Auxiliary engines regulation
Port of Long Beach
FY FY FY FY FY2006/2007 2007/2008 2008/2009 2009/2010 2010/2011
Annual kW-hrs - Containerships 0 0 0 0 21,816,000 Annual kW-hrs - Tanker 324,000 1,296,000 1,296,000 1,296,000 1,296,000Annual kW-hrs - Cruise Ships 0 0 0 0 0NOx Reductions, tons, containerships 0 0 0 0 307NOx Reductions, tons, Tankers 5 18 18 18 18NOx Reductions, tons, cruise ships 0 0 0 0 0Combined NOx Reductions, tons 5 18 18 18 326NOx CF 0.999 0.997 0.997 0.997 0.950DPM Reductions, tons, containerships 0.0 0.0 0.0 0.0 6.9 DPM Reductions, tons, Tankers 0.2 0.6 0.6 0.6 0.4DPM Reductions, tons, cruise ships 0.0 0.0 0.0 0.0 0.0 Combined DPM Reductions, tons 0.2 0.6 0.6 0.6 7.3 DPM CF 1.000 0.999 0.999 0.999 0.988SOx Reductions, tons, containerships 0 0 0 0 150SOx Reductions, tons, Tankers 3 9 9 9 9SOx Reductions, tons, cruise ships 0 0 0 0 0Combined SOx Reductions, tons 3 9 9 9 159SOx CF 0.999 0.996 0.996 0.996 0.935
Average Auxiliary Engine Emission Factors, g/kW- Residual Distillate Container Tanker CruiseNOx 14.70 13.90 14.47 14.47 14.47 PM 0.8 0.3 0.66 0.66 0.66SOx 12.3 4.3 9.98 9.98 9.98Percentage used, Container 71% 29%Percentage used, Tanker 71% 29%Percentage used, Cruise 71% 29%
Percentage of hoteling emissions eliminated: 95%
Assumed Schedule for Containership Cold Ironing Participation-POLB
Site 2006/2007 2007/2008 2008/2009 2009/2010 2010/2011Pier G (ITS K-Line - Two berths) 0 0 0 0 100 50 calls per berthPier C (Matson - One berth) 0 0 0 0 52Piers D, E, F (Middle Harbor) 0 0 0 0 17Pier S (Two berths) 0 0 0 0 33Total container calls 0 0 0 0 202
5-year 202
kW-HR 0 0 0 0 21,816,000108,000 kW per call (72 hrs/ container&tanker call, 1,500 kW load during hoteling)
Assumed Schedule for Liquid Bulk (tanker) Cold Ironing Participation
Pier T 121 3 12 12 12 12 12 vessels per year, 3 utilizing shore power in 4 qtr of 2007Construction finishes in August of 2007
kW-HR 324,000 1,296,000 1,296,000 1,296,000 1,296,000
Assumed Schedule for Cruise Ship Cold Ironing Participation
B90-93Cruise 0 0 0 0 0
kW-HR 0 0 0 0 0
Total Calls 3 12 12 12 214
kW/hrs per call: 64,000 (8 hrs per cruise call, 8,000 kW load during hoteling)
Page 70 of 83

San Pedro Bay Ports Clean Air Action Plan
DRAFT-June 2006
SPBP-OGV 3 - Lease Required Auxiliary Engine Fuel Improvement (0.2% S Fuel)
Applicable to all OGVs
Port of Los Angeles
FY FY FY FY FY FY2005/2006 2006/2007 2007/2008 2008/2009 2009/2010 2010/2011
Participation rate @ 20 nm from Pt. Fermin 0% 100% 100% 100% 100% 100%Participation rate @ 40 nm from Pt. Fermin 0% 0% 50% 100% 100% 100%
Emission Reduction Estimates (tpy) FY FY FY FY FY FY2005/2006 2006/2007 2007/2008 2008/2009 2009/2010 2010/2011
Implementation Schedule 0% 9% 25% 38% 44% 47% Based on Lease RenewalNOx Emissions Reduced 0 0 3 9 11 111 NOx CF (Total OGV) 1.000 1.000 1.000 0.999 0.998 0.998DPM Emissions Reduced 0 0 1 3 3 21 DPM CF (Total OGV) 1.000 1.000 0.997 0.994 0.994 0.995SOx Emissions Reduction 0 41 68 112 74 211 SOx Emissions CF 1.000 0.989 0.979 0.966 0.977 0.994
1 CARB's Marine Auxiliary Engine Regulation Adopted in December of 2005 is included in the CF calculations2001 BLEI info on 40-mile radius
Percent of auxiliary emissions during transit 20%Percent of auxiliary emissions during transit within 20 nm plus hotelling:: 90%Percent of auxiliary emissions during transit within40 nm plus hotelling:: 100%
Page 71 of 83

San Pedro Bay Ports Clean Air Action Plan
DRAFT-June 2006 SPBP-OGV 3 - Lease Required Auxiliary Engine Fuel Improvement (0.2% S Fuel)
Applicable to all OGVs
Port of Long Beach
FY FY FY FY FY FY2005/2006 2006/2007 2007/2008 2008/2009 2009/2010 2010/2011
Participation rate @ 20 nm from Pt. Fermin 0% 100% 100% 100% 100% 100%Participation rate @ 40 nm from Pt. Fermin 0% 0% 50% 100% 100% 100%
Emission Reduction Estimates (tpy) FY FY FY FY FY FY2005/2006 2006/2007 2007/2008 2008/2009 2009/2010 2010/2011
Implementation Schedule 0% 13% 28% 39% 42% 43% Based on Lease RenewalNOx Emissions Reduced 0.0 0.0 1.8 5.0 5.3 5.4 1 NOx CF (Total OGV) 1.000 1.000 1.000 0.999 0.999 0.999DPM Emissions Reduced 0.0 0.7 2.1 3.6 2.7 1.61DPM CF (Total OGV) 1.000 0.999 0.997 0.994 0.996 0.997 SOx Reduction 0 76 70 99 57 81 SOx CF (Total OGV) 1.000 0.976 0.972 0.960 0.977 0.997
1 CARB's Marine Auxiliary Engine Regulation Adopted in December of 2005 is included in the CF calculations
Percent of auxiliary emissions during transit 13%Percent of auxiliary emissions during transit within 20 nm plus hotelling:: 95%
Page 72 of 83

San Pedro Bay Ports Clean Air Action Plan
DRAFT-June 2006
SPBP-OGV 4 -Main Engine Fuel Improvement
Fuel Switch from IFO 380 to 0.2% S MGO
Assumption: Applicable to all OGVs; Based on Lease Renewal
Port of Los Angeles
FY FY FY FY FY FY
2005/2006 2006/2007 2007/2008 2008/2009 2009/2010 2010/2011Participation rate @ 20 nm from Pt. Fermin 0% 100% 100% 100% 100% 100%Participation rate @ 40 nm from Pt. Fermin 0% 0% 50% 100% 100% 100%
Fuel ImplementationFY
2005/2006FY
2006/2007FY
2007/2008FY
2008/2009FY
2009/2010FY
2010/2011IFO 380 to 0.2% S MGO participation rate 0% 9% 25% 38% 44% 47% Lease basedParticipation rate @ 20 nm from Pt. Fermin 0% 100% 100% 100% 100% 100%Participation rate @ 40 nm from Pt. Fermin 0% 0% 50% 100% 100% 100%
Emission Reduction (tpy) EstimatesFY FY FY FY FY FY
2005/2006 2006/2007 2007/2008 2008/2009 2009/2010 2010/2011NOx Emissions Reduced , MGO 0 20 85 172 197 210NOx CF (Total OGV ) 1.000 0.997 0.988 0.975 0.971 0.969DPM Emissions Reduced, MGO 0 14 58 117 135 143DPM CF (Total OGV) 1.000 0.975 0.892 0.781 0.747 0.732SOx Emissions Reduced, MGO 0.000 117 492 998 1,149 1,219SOx CF 1.000 0.968 0.849 0.694 0.648 0.626
Page 73 of 83

San Pedro Bay Ports Clean Air Action Plan
DRAFT-June 2006
SPBP-OGV 4 -Main Engine Fuel Improvement
Fuel Switch from IFO 380 to 0.2% S MGO
Assumption: Applicable to all OGVs; Based on Lease Renewal Port of Long BeachApply to all Ship Types
FY FY FY FY FY FY2005/2006 2006/2007 2007/2008 2008/2009 2009/2010 2010/2011
Participation rate @ 20 nm from Pt. Fermin 0% 100% 100% 100% 100% 100%Participation rate @ 40 nm from Pt. Fermin 0% 0% 50% 100% 100% 100%
2005/2006 2006/2007 2007/2008 2008/2009 2009/2010 2010/2011NOx Emissions Reduced , MGO 0 24 82 152 162 165NOx CF (Total OGV ) 1.000 0.996 0.987 0.977 0.975 0.975DPM Emissions Reduced , MGO 0 22 74 136 146 149DPM CF (Total OGV) 1.000 0.966 0.878 0.775 0.759 0.754SOx Reduction, MGO 0.000 119 405 744 796 812SOx CF (Total OGV) 1.000 0.961 0.835 0.697 0.676 0.670
Page 74 of 83

San Pedro Bay Ports Clean Air Action Plan
DRAFT-June 2006
SPBP-OGV 5 - Slide Valve Retrofit-Main Engine
Assumption: Applicable to all OGVs; Based on Lease Renewal
Port of Los Angeles
Reductions due to Slide Valve-Main EngineNOx 30%PM 25%
FY
2005/2006FY
2006/2007FY
2007/2008FY
2008/2009FY
2009/2010FY
2010/2011Slide Valve Retrofit Implementation Rate 0% 9% 25% 38% 44% 47% Lease based
Emission Reduction (tpy) EstimatesFY FY FY FY FY FY
2005/2006 2006/2007 2007/2008 2008/2009 2009/2010 2010/2011Total NOx Emissions Reduced 0 121 338 515 592 629NOx CF (Total OGV ) 1.000 0.982 0.950 0.925 0.913 0.908Total DPM Emissions Reduced 0 11 30 46 53 56DPM CF (Total OGV) 1.000 0.980 0.944 0.914 0.901 0.895Total SOx Emissions Reduced 0 0 0 0 0 0SOx CF (Total OGV) 1.000 1.000 1.000 1.000 1.000 1.000
Page 75 of 83

San Pedro Bay Ports Clean Air Action Plan
DRAFT-June 2006
SPBP-OGV 5 - Slide Valve Retrofit-Main Engine Assumption: Applicable to all OGVs; Based on Lease Renewal
Port of Long Beach
Reductions due to Slide Valve-Main EngineNOx 30%PM 25%
FY 2005/2006 FY 2006/2007 FY 2007/2008 FY 2008/2009 FY 2009/2010 FY 2010/2011
Slide Valve Retrofit Implementation Rate 0% 13% 28% 39% 42% 43% Lease Based
Emission Reduction (tpy) EstimatesFY FY FY FY FY FY
2005/2006 2006/2007 2007/2008 2008/2009 2009/2010 2010/2011Total NOx Emissions Reduced 0 146 330 455 486 496NOx CF (Total OGV ) 1.000 0.978 0.949 0.930 0.925 0.924Total DPM Emissions Reduced 0 17 39 53 57 58DPM CF (Total OGV) 1.000 0.973 0.936 0.912 0.906 0.904
Total SOx Emissions Reduced 0 0 0 0 0 0SOx CF (Total OGV) 1.000 1.000 1.000 1.000 1.000 1.000
Page 76 of 83

San Pedro Bay Ports Clean Air Action Plan
DRAFT-June 2006
Implementation and Reduction Estimates Used to Calculate Emissions Reduction Due to CARB's Cargo Handling Equipment Regulation Adopted in December of 2005 and SPBP-CHE 1
Implementation Schedule for Yard Tractors per CARB's Regulation
5 MY 2007 2008 2009 2010 2011 2007 2008 2009 2010 2011pre-2003 50% 100% 100% 100% 100% 50% 100% 100% 100%2003 25% 50% 25%2004 25%
5MY 2007 2008 2009 2010 2011 2007 2008 2009 2010 2011pre-2000 25% 50% 100% 100% 100% 25% 50% 100% 100%2000 25% 50% 100% 100% 25% 50% 100%2001 25% 50% 100% 25% 50%2002 25% 50% 25%2003 25%
Following emissions reduction estimates were used to calculate control factors for CARB's cargo handling equipment regulation adopted in December of 2005.
Emissions Reduction Table for Diesel Yard Tractors
Off-Road Diesel 1 NOx 1 "PM 2 NOx 2 "PMTier 0 (Pre 1996) 87% 97% 98% 97%Tier 1(1996-2001) 84% 98% 97% 98%Tier 2 (2002-2005) 76% 93% 96% 93%Tier 3 (2006-2010) 59% 93% 93% 93%Tier 4 (2011-2013) 87% 33% 87% 33%Tier 4 (2013+) 33% 33% 33% 33%1 Reduction (%) due to 2007-2009 on-road hdv replacement2 Reduction (%) due to 2010 + MY on-road hdv replacement
On-Road HDV Diesel Emission Rate (gm/hp-hr)2007-2009 1.1 0.01 2010+ 0.2 0.01On-Road HDV LNG Emissions Rate (gm/hp-hr)2007-2009 0.2 0.01
No adjustment for the off-road duty cycle was made when considering replacement with on-road engines
Implementation Schedule for Non-Yard Tractors 5 MY 2007 2008 2009 2010 2011 2012 2013
Pre 1988 25% 50% 75% 100% 100% 100% 100%1988-1995 0% 25% 50% 75% 100% 100% 100%1996-2002 0% 0% 25% 50% 75% 100% 100%2003-2006 0% 0% 0% 25% 50% 75% 100%
Emissions Reduction Table for Diesel Yard Tractors
Cranes Cranes Excavator Excavator Forklift Forklift Loader Loader% Affected 91% 91% 100% 100% 100% 100% 100% 100%4 Technology Passive DPF DOC Active DPF DOC% Reduction 0% 85% 0% 25% 0% 85% 0% 25%
RTG RTG Sweeper Sweeper Other Other Other% Affected 100% 100% 100% 100% 100% 100% 100%4 Technology DPF DOC 3 DOC or DOC w. Emulsified % Reduction 0% 85% 0% 25% 20% 50% 25%3 Except for pre 2003 where it is only DOC
Source:Implementation schedule from CARB's staff report obtained from CARB's website under board reports dated Jan 28, 2006.4 Technology assumption from appendix D @http://www.arb.ca.gov/regact/cargo2005/appd.pdf5 Implementation for remaining model years not applicable within FY 2006/2007 to 2010/2011
Off-Road YT with no VDEC Off-Road YT with VDEC
On-Road YT with no VDEC On-Road YT with VDEC
Page 77 of 83

San Pedro Bay Ports Clean Air Action Plan
DRAFT-June 2006
CARB's Cargo Handling Equipment Regulation Adopted in December of 2005
Port of Los Angeles
Emission Reduction (tpy) FY FY FY FY FY FY
2005/2006 2006/2007 2007/2008 2008/2009 2009/2010 2010/2011
Baseline CHE NOx emissions (tpy) 2,106 2,106 2,106 2,106 2,106 2,106NOx Emissions Reduced 0 95 449 708 713 755NOx CF 1.000 0.955 0.787 0.664 0.661 0.642
Baseline CHE DPM emissions (tpy) 86 86 86 86 86 86DPM Emissions Reduced 0 6 25 40 45 50DPM CF 1.000 0.930 0.709 0.535 0.477 0.419
Baseline CHE SOx Emissions (tpy) 3 3 3 3 3 3SOx Emissions Reduced 0 0 0 0 0 0SOx CF 1.000 1.000 1.000 1.000 1.000 1.000
Page 78 of 83

San Pedro Bay Ports Clean Air Action Plan
DRAFT-June 2006
CARB's Cargo Handling Equipment Regulation Adopted in December of 2005
Port of Long Beach
Emission Reduction (tpy)
FY 2005/2006FY
2006/2007FY
2007/2008FY
2008/2009FY
2009/2010FY
2010/2011
Baseline CHE NOx emissions (tpy) 1,810 1,810 1,810 1,810 1,810 1,810NOx Emissions Reduced 0 29 323 588 588 622NOx CF 1.000 0.984 0.822 0.675 0.675 0.656
Baseline CHE DPM emissions (tpy) 67 67 67 67 67 67DPM Emissions Reduced 0 4 21 36 40 43DPM CF 1.000 0.940 0.687 0.463 0.403 0.358
Baseline CHE SOx Emissions (tpy) 5 5 5 5 5 5SOx Emissions Reduced 0 0 0 0 0 0SOx CF 1.000 1.000 1.000 1.000 1.000 1.000
Page 79 of 83

San Pedro Bay Ports Clean Air Action Plan
DRAFT-June 2006
SPBP-CHE 1 Performance Standards for CHE
Port of Los Angeles
Emission Reduction (tpy)
FY 2005/2006
FY 2006/2007
FY 2007/2008
FY 2008/2009
FY 2009/2010
FY 2010/2011
NOx Emissions Reduced (tpy) 0 90 126 179 199 2251 NOx CF 1.000 0.955 0.924 0.872 0.857 0.833DPM Emissions Reduced (tpy) 0 2 3 5 5 61 DPM CF 1.000 0.971 0.946 0.898 0.885 0.836SOx Emissions Reduced (tpy) 0 0 0 0 0 0SOx CF 1.000 1.000 1.000 1.000 1.000 1.000
1 CARB's Cargo Handling Equipment Regulation Adopted in December of 2005 is included in the baseline for the CF calculation
Emissions Reduction Calculations Basis for SPBP-CHE 1:50% of the 2003+ MY Yard Tractors, Top Handlers and Side Handlers not covered by CARB's regulation within next five years wwith those equipped with cleanest available 2007+ MY on-road diesel and remaning 50% with 2007+ MY LNG engines meeting 0.01 g/hp-hr PM and 0.2 g/hp-hr NOx standards. CHE other than Yard Tractors, Top Handlers and Side Handlers will be replaced with those meeting Tier 4 standards in FY 2010
Page 80 of 83

San Pedro Bay Ports Clean Air Action Plan
DRAFT-June 2006
SPBP-CHE 1 Performance Standards for CHE
Port of Long Beach
Emission Reduction (tpy)FY
2005/2006FY
2006/2007FY
2007/2008FY
2008/2009FY
2009/2010FY
2010/2011
NOx Emissions Reduced (tpy) 0 37 69 110 136 151NOx CF 1.000 0.979 0.954 0.910 0.889 0.873
DPM Emissions Reduced (tpy) 0 2 3 4 5 5DPM CF 1.000 0.973 0.938 0.861 0.831 0.786
SOx Emissions Reduced (tpy) 0 0 0 0 0 0SOx CF 1.000 1.000 1.000 1.000 1.000 1.000
1 CARB's Cargo Handling Equipment Regulation Adopted in December of 2005 is included in the baseline for the CF calculations
Emissions Reduction Calculations Basis for SPBP-CHE 1:50% of the 2003+ MY Yard Tractors, Top Handlers and Side Handlers not covered by CARB's regulation within next five years will be with those equipped with cleanest available 2007+ MY on-road diesel and remaning 50% with 2007+ MY LNG engines meeting 0.01 g/hp-hr PM and 0.2 g/hp-hr NOx standards. CHE other than Yard Tractors, Top Handlers and Side Handlers will be replaced with those meeting Tier 4 standards in FY 2010/2011
Page 81 of 83

San Pedro Bay Ports Clean Air Action Plan
DRAFT-June 2006
SPBP - RL1 PHL Agreement
Port of Los Angeles
1 Emission Reduction (tpy) FY FY FY FY FY FY
2005/2006 2006/2007 2007/2008 2008/2009 2009/2010 2010/2011
Baseline NOx emissions (tpy) 2,466 2,466 2,466 2,466 2,466 2,466NOx Emissions Reduced 0 163 163 163 163 163NOx CF 1.000 0.934 0.934 0.934 0.934 0.934
BaselineDPM emissions (tpy) 60 60 60 60 60 60DPM Emissions Reduced 3 3 3 3 3 3DPM CF 0.950 0.950 0.950 0.950 0.950 0.950
Baseline SOx Emissions (tpy) 90 90 90 90 90 90SOx Emissions Reduced 0.2 0.2 0.2 0.2 0.2 0.2SOx CF 0.998 0.998 0.998 0.998 0.998 0.998
1 Estimated in August 2005 based on MOU terms and on data associated with baseline emissions inventories:
Page 82 of 83

San Pedro Bay Ports Clean Air Action Plan
DRAFT-June 2006
SPBP - RL1 PHL Agreement
Port of Los Angeles
1Emission Reduction (tpy) FY FY FY FY FY FY
2005/2006 2006/2007 2007/2008 2008/2009 2009/2010 2010/2011
Baseline NOx emissions (tpy) 2,067 2,067 2,067 2,067 2,067 2,067NOx Emissions Reduced 0 137 137 137 137 137NOx CF 1.000 0.934 0.934 0.934 0.934 0.934
BaselineDPM emissions (tpy) 51 51 51 51 51 51DPM Emissions Reduced 2.6 2.6 2.6 2.6 2.6 2.6DPM CF 0.949 0.949 0.949 0.949 0.949 0.949
Baseline SOx Emissions (tpy) 86 86 86 86 86 86SOx Emissions Reduced 0.2 0.2 0.2 0.2 0.2 0.2SOx CF 0.998 0.998 0.998 0.998 0.998 0.998
1 Estimated using POLA and POLB baseline emissions inventories ratio applied to POLAemissions reduction benefit
Page 83 of 83