draft presentation - th mgmt · –alternative reporting: qcdr, gpro website –vbm: report as...
TRANSCRIPT

04/03/2015
1
Quality Matters:
How to Succeed with
PQRS in 2015
Jeanne Chamberlin, MA, FACMPE
Director, MSOC Health
A Short History of PQRS
2007:
3 measures
on 80%
2% Bonus
2012:
3 measures
on 50% / 80%
0.5% Bonus
Performance > 0
2015:
NO BONUS
----------------------
9 measures
3 domains
on 50% avoids
2% PENALTY
----------------------
VBM for All
2014:
9 measures
on 50%
0.5% Bonus
---------------------
3 measures on
50% avoids
2% PENALTY
---------------------
VBM- 10+
2013:
3 measures
on 50%
0.5% Bonus
-----------------------
1 measure on
1 patient avoids
1.5% PENALTY
-----------------------
VBM 100+
Participate Or Else�..
2015 Payments Reporting Year Amount
Meaningful Use 2013/2014* -1%
eRX 2013 -1%
PQRS 2013 -1.5%
2016 Payments Reporting Year Amount
Meaningful Use 2014 -2%
PQRS 2014 -2%
VBM if 10+ Providers 2014 -2%
2017 Payments Reporting Year Amount
Meaningful Use 2015 -3%
PQRS 2015 -2%
VBM (-/+ 10 Providers) 2015 -2 to -4%
-3.5%
-6%
-7 to 9%
04/03/2015
2
Introduction to the
Value Based Modifier Program
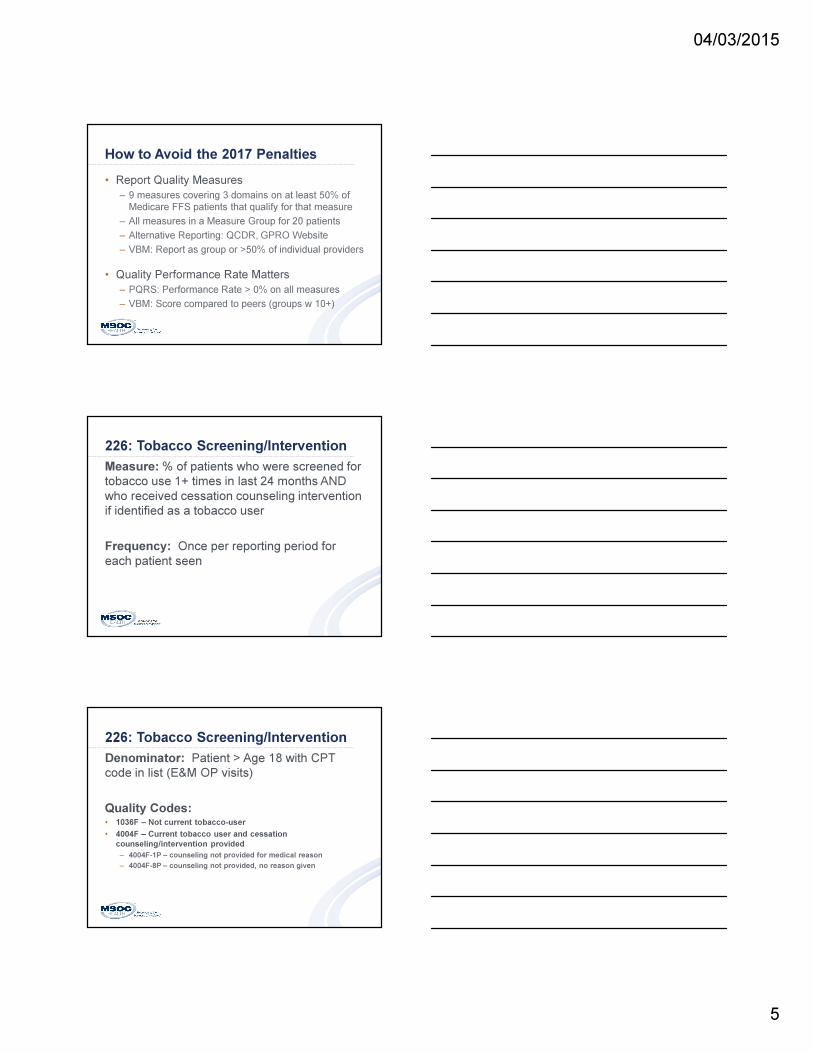
Value Based Modifier (VBM)
• Practice Level (TIN)
• All Sizes & Specialties
• Penalty in 2017 if PQRS quality measures
are not reported for 2015:
– 2% if < 10 Providers, 4% if 10+ Providers
– Via Group Reporting (Register by 6/30/15)
– Individually by > 50% of eligible providers
– Applies to MD revenue only in 2017
– Expands to all revenue in 2018
VBM Concepts
10+ Providers Low Cost Avg Cost High Cost
High Quality + 4x* + 2x* + 0%
Average Quality + 2x* + 0% -2.0%
Low Quality + 0% -2.0% -4.0%
PQRS and claims data used to compare practice to national
specialty-specific mean on Quality and Cost
*Budget Neutral: -4% penalty if PQRS data not reported; these
dollars plus those from red boxes must equal increased
payments to practices in green boxes
<10 Providers Low Cost Avg Cost High Cost
High Quality + 2x* + 1x* + 0%
Average Quality + 1x* + 0% -1.0%
Low Quality + 0% -1.0% -2.0%

04/03/2015
3
VBM in 2015
• Impacts Medicare Revenue in 2017
• +/- applies to all MDs in group in 2017
• 10+ Providers: Fully Implemented
• 1-9 Providers: Upside Only
QRUR Reports – 2013 Data
Requires IACS Login
PQRS Program
The Basics

04/03/2015
4
PQRS: Who Must Participate?
• Physicians, Optometrists, Podiatrists
• Physician Assistants/Nurse Practitioners
• Therapists: PTs, OTs, Speech
• Clinical Psychologists and CSWs
• Dieticians
PAID UNDER MEDICARE PHYSICIAN FEE SCHEDULE
NOT PARTICIPATING IN MEDICARE ACO
PQRS is a Provider-Based Program
TIN/NPI
Same provider/2 practices
Dr. Williams: $100 for a 99213
Dr. Brown: $96 for a 99213
Penalties are 2 Years Ahead
Reporting
Period
Penalty
Seen In
PQRS
Penalty
VBM
Penalty
2013 2015 -1.5% -2.0%*
2014 2016 -2.0% -2.0%*
2015 2017 -2.0% -2 to -4%
* Applied to certain practices only, based on size
04/03/2015
5
How to Avoid the 2017 Penalties
• Report Quality Measures
– 9 measures covering 3 domains on at least 50% of
Medicare FFS patients that qualify for that measure
– All measures in a Measure Group for 20 patients
– Alternative Reporting: QCDR, GPRO Website
– VBM: Report as group or >50% of individual providers
• Quality Performance Rate Matters
– PQRS: Performance Rate > 0% on all measures
– VBM: Score compared to peers (groups w 10+)
226: Tobacco Screening/Intervention
Measure: % of patients who were screened for
tobacco use 1+ times in last 24 months AND
who received cessation counseling intervention
if identified as a tobacco user
Frequency: Once per reporting period for
each patient seen
226: Tobacco Screening/Intervention
Denominator: Patient > Age 18 with CPT
code in list (E&M OP visits)
Quality Codes:• 1036F – Not current tobacco-user
• 4004F – Current tobacco user and cessation
counseling/intervention provided
– 4004F-1P – counseling not provided for medical reason
– 4004F-8P – counseling not provided, no reason given

04/03/2015
6
226: Tobacco Screening/InterventionMC Patients with office visit during year: 1200
Over Age 18: 1200
FFS (not MC Advantage Plans): 1000 = DENOMINATOR
______________________________________________
1036F (Non-Smoker): 500
4004F (Smoker w/ Counseling): 100
4004F-1P (Medical Exception): 10
4004F-8P (Smoker, no counsel): 140
Total of Above: 750
______________________________________________
Reporting Rate: 750/1000 = 75%
Performance Rate: (500+100)/(750-10) = 600/740 = 81%
Reporting Options
For 2015
Group vs Individual Reporting
Group = 2+ Providers in same TIN
• Required for practices with 100+ providers
• Less work for larger/multi-spec practices
• Balance under & over-performing providers
• Register by 6/30/15 (IACS) & Specify Method
• Fewer Reporting Choices
• Reported on Physician Compare

04/03/2015
7
Option 1: Report Through Your EHR
• 2014 CEHRT and 9 CQMs (7/14 Version)
• Report same 9 quality measures for both MU &
PQRS for full year on all patients (3 domains)
• One MC patient in one measure
• Group or Individual Provider
• Caution – Possible low performance results
• Caution – EHRs may charge a fee
• Caution – Many vendors lack experience
Option 2: Measure Group2015 -- 22 Measure Groups (-5, +2 compared to 2014)
Prev. Care (10) CAD (6) Cataracts (8)
Diabetes (6) Heart Failure (6) Dementia (10)
Asthma (6) CABG (7) Parkinson’s (7)
COPD (7) Oncology (7) Sleep Apnea (7)
Acute Otitis Externa (8)
NEW
Exposure to Ionizing
Radiation (6)
Chronic Kidney
Disease (6)
Sinusitis (6) NEW Hepatitis C (8) Gen Surgery (7)
Rheumatoid Arthritis (8) IBD (7) Total Knee
Replacement (6)
HIV (8) Deleted: Back Pain, Perioperative, CV Prev, Htx, IVD
Report on sample of 20 patients, 11 must be Medicare
Report via Registry Program
Individual Provider Only, No Group Reporting
Option 3: Individual Measures
• 9 Measures from 3 Domains
• New Requirement: 1 of 9 measures must be
from “Cross-Cutting” List
• For each measure:
– Reporting Rate > 50%: Quality indicator is reported
on over half of the qualifying Medicare FFS patients
– Performance Rate > 0%: Meet quality performance
on at least 1 of the patients included
• Individual Provider: Claims or Registry
• Group: Registry Only

04/03/2015
8
Summary of PQRS Options
Individual Reporting
Option 1
EMR
Option 2
Measure
Group
Option 3
Individual
Measures
Claims
Option 4
Individual
Measures
Registry
Option 5
Qualified
Clinical Data
Repostitory
# Measures
to Avoid
Penalty
9 measures
- same ones
reported for MU
1 Measure
Group (6+Measures)
9 measures
covering 3 domains
9 measures
covering 3 domains
At least 9
measures
covering 3
domains
Required
Measures
1 of 9 from
CMS List
All in Group 1 of 9 from CMS
List
1 of 9 from CMS
List
1-2 Outcome
measures
Patient
Population
All patients,
at least one
must be Medicare
20 patients
with defined
DX, 11 must
be Medicare
FFS
50% of Medicare
FFS patients with qualifying service
50% of Medicare
FFS patients with qualifying service
50% of eligible
patients with
qualifying service
Reported
When
Jan-Feb
2016 for
DOS in 2015
Jan-Feb 2016
for DOS in 2015
On each claim for qualifying service
Jan-Feb 2016 for DOS in 2015
Jan-Feb 2016 for
DOS in 2015
Cost Depends on EMR
$250-
500/provider;
chart abstraction
Negligible except workflow changes
$250-
500/provider,chart abstraction
Depends on
QCDR
Summary of PQRS Options
Group Reporting
Option 1
EMR
Option 2
Individual
Measures Registry
Option 3
GPRO Website
(25+ Providers)
Option 1,2,3
Plus CAHPS
**Required for 100+
# Measures to
Avoid Penalty
9 measures -
same ones
reported for MU
9 measures covering 3 domains
25 Measures, no
choices
Option 1: 6 measures
Option 2: 6 measures
Option 3: all measures
Required
Measures
1 of 9 from
CMS List
1 of 9 from CMS List 25 Measures CAHPS for PQRS
Patient
Population
All patients, at
least one must be Medicare
50% of Medicare
FFS patients with qualifying service
Patient Sample
assigned by CMS
(up to 248)
CAHPS: All patients
Reported
When
Jan-Feb 2016
for DOS in 2015
Jan-Feb 2016 for DOS in 2015
Jan-Feb 2016 for
DOS in 2015
Jan-Feb 2016 for DOS
in 2015
Cost Depends on EMR
$250-500/provider,chart abstraction
Chart abstraction
and data entry
Depends on
Selections and Vendor
selected
Suggestions for Neurosurgery

04/03/2015
9
www.cms.gov/pqrs
Page Down/Click on Links
List of
Measures
Detailed
Specifications
Measure Specification Document
Open/Save largest
file – 600+ Pages
– Each measure
has 2-4 pages of
detail

04/03/2015
10
Grouping PQRS Measure Title NQS Domain Claims Registry Page #
Perioperative 021 Selection of Prophylactic Antibiotic Safety X X 56
Perioperative 022 Discontinuation of Prophylactic Parenteral Antibiotics Safety X X 61
Perioperative 023 VTE Prophylaxis Safety X X 66
Perioperative 358Patient-Centered Surgical Risk Assessment and
CommunicationPt Experience - X 502
Osteoporosis 024Communication with the Physician Managing On-going
Care Post-Fracture of Hip, Spine or Distal Radius Care Coord X X 73
Osteoporosis 040Management Following Fracture of Hip, Spine or
Distal RadiusEffectiveness X X 87
Stroke 032 Discharged on Antithrombotic Therapy Effectiveness X X 79
Stroke 033Anticoagulant Therapy Prescribed for Atrial Fibrillation
(AF) at DischargeEffectiveness - X 82
Stroke 187Stroke and Stroke Rehabilitation: Thrombolytic
TherapyEffectiveness - X 288
Oncology 143 Medical and Radiation – Pain Intensity Quantified Pt Experience - X 228
Oncology 144 Medical and Radiation – Plan of Care for Pain Pt Experience - X 233
CEA 260
Rate of Carotid Endarterectomy (CEA) for
Asymptomatic Patients, without Major Complications
(Discharged to Home by Post-Operative Day #2)
Safety - X 393
CEA 346Rate of Postop Stroke or Death in Asymptomatic
Patients undergoing CEAEffectiveness - X 488
CAS 344
Rate of CAS for Asymptomatic Patients, Without Major
Complications (Discharged to Home by Post-Operative
Day #2)
Effectiveness - X 484
CAS 345Rate of Postop Stroke or Death in Asymptomatic
Patients Undergoing CASEffectiveness - X 486
One from Cross-Cutting List
#1: Diabetes-HGA1C
#46: Med Reconciliation
(Post Dischg)
#47: Advanced Care Plan
#110: Flu Shot
#111: Pneumonia Vaccination
#128: BMI Screening/FU
#130: Document Current Meds
#131: Pain Assessment/FU
#134: Depression Screen/FU
#182: Functional Outcome Assess.
#226: Tobacco Use Screening/FU
#236: Controlling High Blood Pressure
#240: Childhood Immunizations
#317: High BP Screeening/FU
#318: Screening for Fall Risk
#321: CAHPS for PQRS
#374: Closing Referral Loop
#400: Hep C Screening
#402: Tobacco Use/FU-Adolescents
Considerations
• How big is the qualifying population?
• How easy to identify a qualifying patient?
• How easy to capture quality detail?
• Coordinate with Quality Improvement Goals
• Other Quality Reporting programs
– Patient Centered Specialty Practice Recognition
– Commercial payer programs
• How will you monitor throughout year?
04/03/2015
11
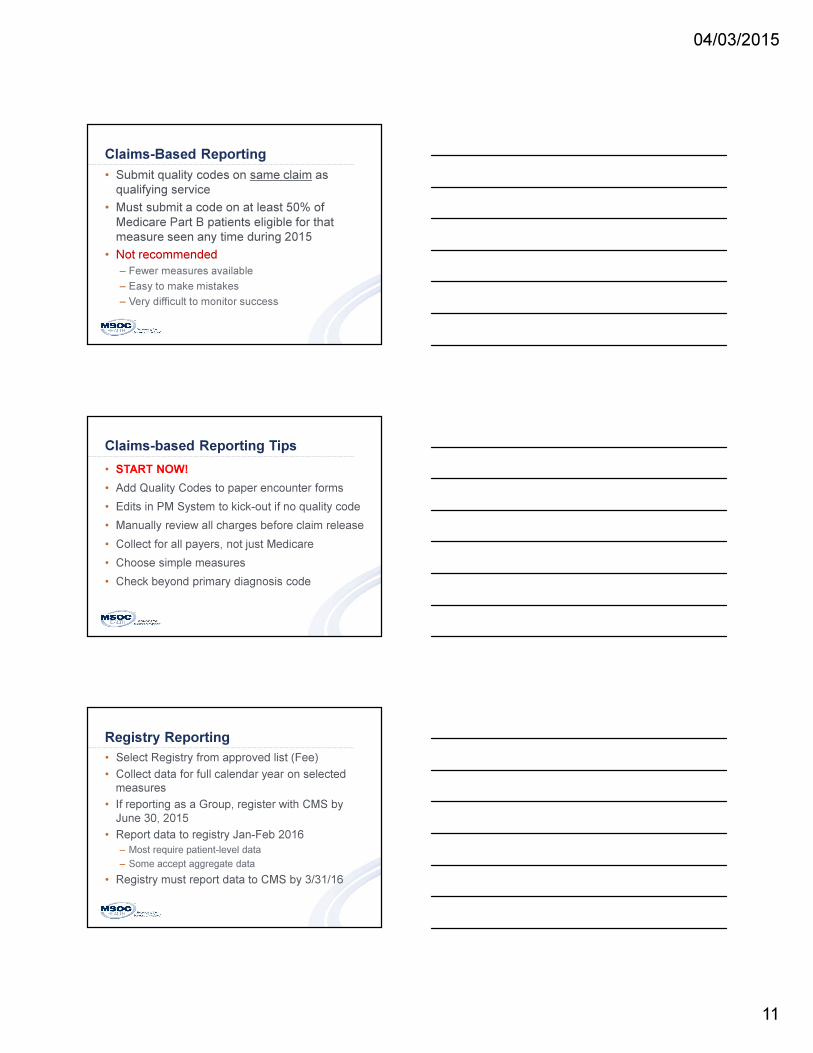
Claims-Based Reporting
• Submit quality codes on same claim as
qualifying service
• Must submit a code on at least 50% of
Medicare Part B patients eligible for that
measure seen any time during 2015
• Not recommended
– Fewer measures available
– Easy to make mistakes
– Very difficult to monitor success
Claims-based Reporting Tips
• START NOW!
• Add Quality Codes to paper encounter forms
• Edits in PM System to kick-out if no quality code
• Manually review all charges before claim release
• Collect for all payers, not just Medicare
• Choose simple measures
• Check beyond primary diagnosis code
Registry Reporting
• Select Registry from approved list (Fee)
• Collect data for full calendar year on selected
measures
• If reporting as a Group, register with CMS by
June 30, 2015
• Report data to registry Jan-Feb 2016
– Most require patient-level data
– Some accept aggregate data
• Registry must report data to CMS by 3/31/16
04/03/2015
12
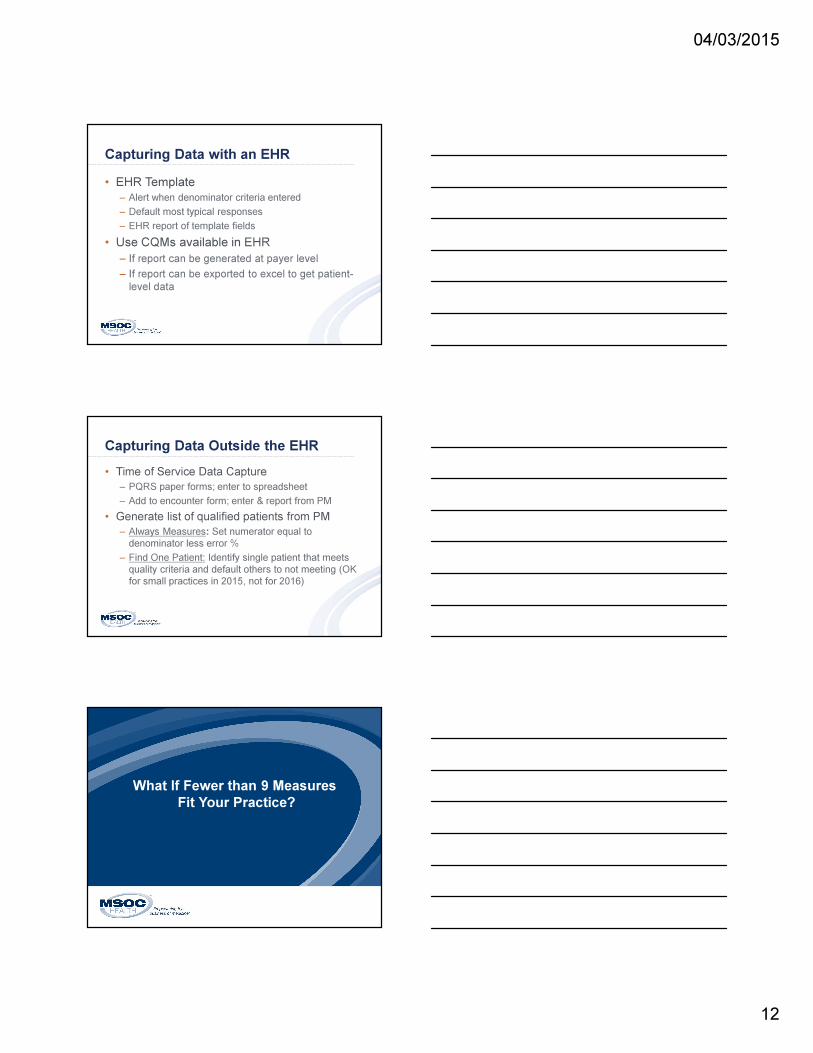
Capturing Data with an EHR
• EHR Template
– Alert when denominator criteria entered
– Default most typical responses
– EHR report of template fields
• Use CQMs available in EHR
– If report can be generated at payer level
– If report can be exported to excel to get patient-
level data
Capturing Data Outside the EHR
• Time of Service Data Capture
– PQRS paper forms; enter to spreadsheet
– Add to encounter form; enter & report from PM
• Generate list of qualified patients from PM
– Always Measures: Set numerator equal to
denominator less error %
– Find One Patient: Identify single patient that meets
quality criteria and default others to not meeting (OK
for small practices in 2015, not for 2016)
What If Fewer than 9 Measures
Fit Your Practice?

04/03/2015
13
MAV Process
• Report 1-8 Measures
– Reporting Rate > 50% on each measure reported
– Performance Rate >0% on each measure
– 1 cross-cutting measure reported
• What Clinical Clusters are Represented?
– CMS analyzes claims to ID other measures in
same cluster that could have been reported
– If reporting on claims, excluded if < 15 in
denominator (no minimum for registry reporting)
Example: Report 130, 24, 40 - Registry
• All 3 in Osteoporosis Cluster (Registry)
• 110 and 226 also in cluster
• Medicare claims data: many patients meet
denominator for 110 and 226
Penalty
-2% PQRS + -2 to -4% VBM
Example: Report 21, 22, 23 - Claims
• All 3 in Perioperative Clinical Cluster (Claims)
• No other measures in cluster
• No cross-cutting measure reported
• Not eligible for MAV process
Penalty
-2% PQRS + -2 to -4% VBM

04/03/2015
14
Example: Report 130, 226, 385-Registry
• 130 & 226 are cross-cutting measures
• 385 is in no clinical cluster
• 130/226 do not trigger cluster
Passes MAV – No Penalty
Keys to MAV
• Review available measures and denominator
criteria; select all that are appropriate to your
practice
• Use the right 2015 Clinical Cluster definition
(www.cms.gov/pqrs, Analysis & Payment)
• Validate # of qualifying Medicare FFS
patients for any other measure in the same
cluster (0 for registry, 15 for claims)
• Report 1 cross-cutting measure
Summary
04/03/2015
15
The Game Has Changed
PQRS = Pay for Reporting
VBM = Pay for Performance
You Can’t Do It Alone��
Resources
PQRS: www.cms.gov/pqrs, www.qualitynet.org, 866-288-8912
VBM: www.cms.gov/physicianfeedbackprogram
888-734-6433 option 3
MU: www.cms.gov/ehrincentiveprograms
888-734-6433 option 1
Medicare Quality Programs Resource List
www.msochealth.com
04/03/2015
16
QUESTIONS?
Jeanne Chamberlin, FACMPE
Practice Management [email protected]
919-442-2422