draft report on definition of benchmark studies on
TRANSCRIPT

Draft report on definition of benchmark studies on repository-scale numerical simulations of gas
FORGE Report D1.1 – VER.0
Name Organisation Signature Date
Compiled Jacques Wending Andra 10th October 2009
Verified Simon Norris NDA 20th October 2009
Approved Richard Shaw BGS 25th October 2009
Euratom 7th Framework Programme Project: FORGE

FORGE Report: D1.1 – Ver. 0
i
Fate of repository gases (FORGE)
The multiple barrier concept is the cornerstone of all proposed schemes for underground disposal of radioactive wastes. The concept invokes a series of barriers, both engineered and natural, between the waste and the surface. Achieving this concept is the primary objective of all disposal programmes, from site appraisal and characterisation to repository design and construction. However, the performance of the repository as a whole (waste, buffer, engineering disturbed zone, host rock), and in particular its gas transport properties, are still poorly understood. Issues still to be adequately examined that relate to understanding basic processes include: dilational versus visco-capillary flow mechanisms; long-term integrity of seals, in particular gas flow along contacts; role of the EDZ as a conduit for preferential flow; laboratory to field up-scaling. Understanding gas generation and migration is thus vital in the quantitative assessment of repositories and is the focus of the research in this integrated, multi-disciplinary project. The FORGE project is a pan-European project with links to international radioactive waste management organisations, regulators and academia, specifically designed to tackle the key research issues associated with the generation and movement of repository gasses. Of particular importance are the long-term performance of bentonite buffers, plastic clays, indurated mudrocks and crystalline formations. Further experimental data are required to reduce uncertainty relating to the quantitative treatment of gas in performance assessment. FORGE will address these issues through a series of laboratory and field-scale experiments, including the development of new methods for up-scaling allowing the optimisation of concepts through detailed scenario analysis. The FORGE partners are committed to training and CPD through a broad portfolio of training opportunities and initiatives which form a significant part of the project.
Further details on the FORGE project and its outcomes can be accessed at www.FORGEproject.org.
Contact details:
Author 1 Jacques Vending
Organisation Andra
Tel: 01 46 11 81 81
email: [email protected]
web address: www.andra.fr
Address 1-7, rue Jean-Monnet
92298 Châtenay-Malabry cedex
FORGE Report: D1.1– Ver. 0
ii
Contents
Contents ......................................................................................... ii
CONTEXT AND OBJECTIVES .............................................................1
REFERENCE TEST CASE ....................................................................1
1.1 GEOMETRY ............................................................................2
1.2 PHYSICAL PARAMETERS ........................................................3
1.3 Initial conditions ...................................................................5
1.4 Boundary conditions .............................................................6
1.5 Production term for hydrogen .............................................7
1.6 Simulation period .................................................................8
SENSITIVITY ANALYSIS ....................................................................8
Output results ................................................................................9
ANNEX 1 : Mathematical model proposed for the exercise ............ 12

FORGE Report: D1.1– Ver. 0
1
CONTEXT AND OBJECTIVES From WP1 participants point of view, the aim of the benchmark should less be a comparison of numerical codes then an exercise trying to answer some precise questions in a PA logic (for example, which could be the relative role of the EDZ, interfaces, backfill in the migration of gas at storage scale?). This clearly includes numerical considerations, but they are a mean and not an objective.
One of the difficulties is to find a common playground for all participants, which allows bringing some add-on for each one. After discussion, a general agreement was that the reference exercise will be as generic as possible (without targeting precisely on national concepts) and to propose sensitivity analyses making it possible to cover national specificities. What is aimed is more to feel how the systems react and why they can react differently rather than an inter-comparison of codes. A second agreement was that, although the final aim of the benchmark studies is to represent repository-scale simulations, the first exercise should be rather simple and at cell scale.
In this context, one of the major problems in representing gas transfers in a repository for radioactive waste is to model simultaneously all gas sources (generally located in the disposal cells) and the transfer pathways constituted by the network of interfaces, plugs and undergrounds drift.
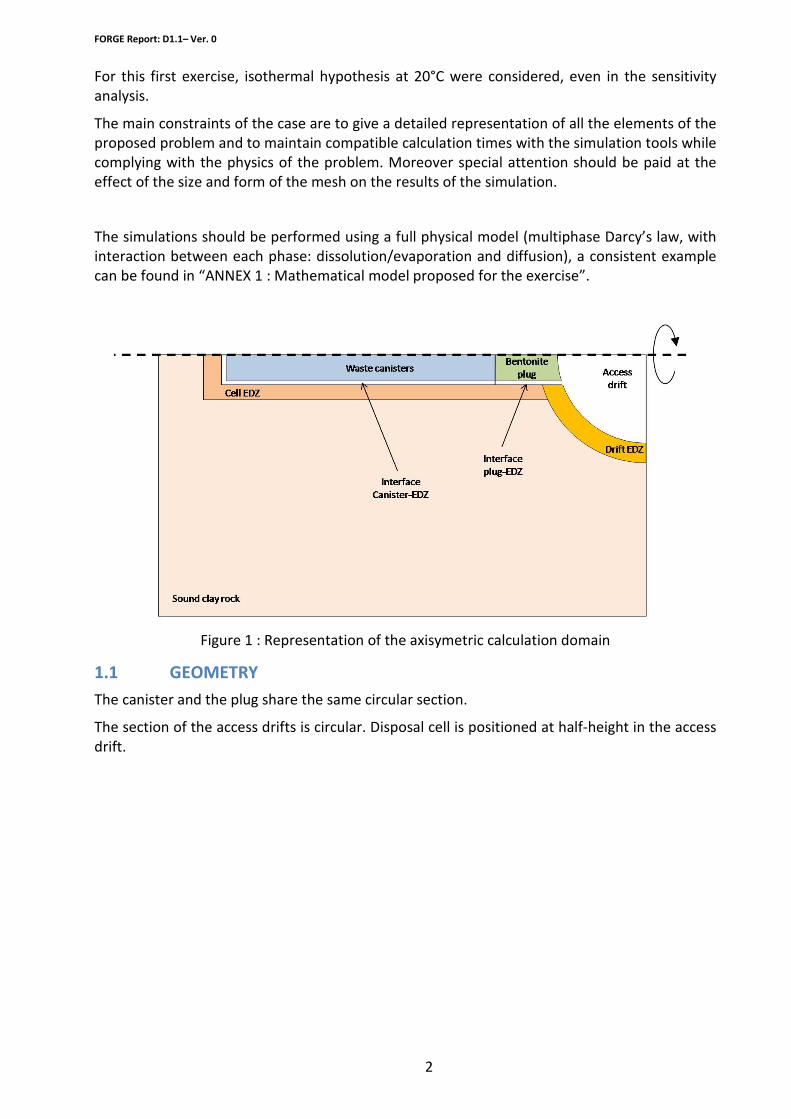
REFERENCE TEST CASE The objective of this first test case is to simulate the gas production and migration in a disposal cell and a portion of the drift (Figure 1).
The calculation domain is axisymetric. In the direction of the cell axis, the extension takes into account the length of the cell, the distance between the bottom of two adjacent cells in this direction and the radius of the access drift (Figure 2 and Table 1). The radius of the axisymetric domain is a compromise between the inter-cell distance along the access drift and the thickness of the geological layer.
A gas-production term is provided for the disposal cell. It is imposed on the external surface of the cylinder that represents schematically the canisters. The cell is constituted of a material impermeable to both water and gas, and is not explicitly represented in the model (the external surface of the canister is a no flux boundary). The materials to be taken into account in that simulation include the EDZ of both the cell and the access drift, the cell plug, the backfill of the access drift and the geological medium. Moreover the interface between the cell and the cell EDZ should be represented (general retention behaviour similar to a sand), taking into account a different behaviour whether the interface is facing the bentonite plug (same permeability as EDZ)or the canisters (same permeability as a sand).
The aim of this test case is to better understand the mechanisms of the gas migration (transport, diffusion and dissolution) at the cell scale and in particular to analyze the effect of the presence of different material and interfaces on such mechanisms.
FORGE Report: D1.1– Ver. 0
2
For this first exercise, isothermal hypothesis at 20°C were considered, even in the sensitivity analysis.
The main constraints of the case are to give a detailed representation of all the elements of the proposed problem and to maintain compatible calculation times with the simulation tools while complying with the physics of the problem. Moreover special attention should be paid at the effect of the size and form of the mesh on the results of the simulation.
The simulations should be performed using a full physical model (multiphase Darcy’s law, with interaction between each phase: dissolution/evaporation and diffusion), a consistent example can be found in “ANNEX 1 : Mathematical model proposed for the exercise”.
Figure 1 : Representation of the axisymetric calculation domain
1.1 GEOMETRY The canister and the plug share the same circular section.
The section of the access drifts is circular. Disposal cell is positioned at half-height in the access drift.

FORGE Report: D1.1– Ver. 0
3
Figure 2 : Dimensions in the calculation domain
Table 1 : Size of items in the calculation domain
Name of parameter Parameter Value
Length of the domain (cell axis direction) Lx 60 m
Radius of the domain Rx 20 m
Radius of access drift Rd 3 m
Thickness of the access drift EDZ Ed 1 m
Length of the plug Lp 5 m
Length of the canister zone Lc 40 m
Thickness of the cell EDZ Ec 0.5 m
Plug and canisters radius Rc 0.5 m
Thickness of the interface Ei 0.01 m
Distance between end of cell EDZ and boundary Lr 11.5 m
1.2 PHYSICAL PARAMETERS Physical parameters at 20°C are shown in Table 2 (for this first exercise, all calculations are isotherm and temperature is set at 20°C throughout the simulation period).

FORGE Report: D1.1– Ver. 0
4
Table 2 : Physical characteristics of materials
Parameter (at 20°C)
Materials
Interface facing plug
Interface
facing canister
Backfill
(access drift)
Kv [m2] 5.0 10-18 1.0 10-12 5.0 10-17
Kh [m2] 1.0 10-17 Kv=Kh
Porosity [%] 30 100 40
Specific storage coefficient [m-1]
4.6 10-06 4.6 10-06 1.0 10-05
Two-phase flow parameters
Sgr [%] 0 0 0
Swr [%] 0 0 0
Van Genuchten parameters
n [-] 4 4 1.5
Pr [Pa] 104 104 2 106
τ
(Tortuosity) 1 1 2
Parameter (at 20°C)
Materials
Bentonite plug EDZ Geologial Medium
Kv [m2] 1.0 10-20 5.0 10-18 5.0 10-21
Kh [m2] Kv=Kh 1.0 10-17 1.0 10-20
Porosity [%] 35 15 15
Specific storage coefficient [m-1] 4.4 10-06 2.3 10-06 2.3 10-06
Two-phase flow parameters
Sgr [%] 0 0 0
Swr [%] 0 0 0
Van Genuchten parameters
n [-] 1.6 1.5 1.5
Pr [Pa] 1.6 107 1.5 106 1.5 107
τ
(Tortuosity) 4.5 2 2

FORGE Report: D1.1– Ver. 0
5
- Viscosity of the gas mixture:
The viscosity of the gas mixture (water vapour + hydrogen) can be estimated by a classical Wilke approximation or by a simplified formula as follows:
gvapw
gvapw
gH
gH
g XXµµ
µ+
=
2
2
1 with sPaKTsPaKT g
vapwgH .10)293(.109)293( 56
2
−− ==== µµ
- Diffusion coefficient of dissolved H2 in water:
( )TTD
waterwaterH µ
14/ 1057.1
2
−= (m2/s)
- Diffusion coefficient of gaseous H2 in water vapour: (T0=293 K and at P0=1.0·105 Pa: D0=9.5·10-5 m2/s)
75.1
0
0022
=− T
TPP
DD gOHH (m2/s)
- Diffusion coefficient of dissolved H2 in the water of the porous medium:
eauHwwH DSD /2 22
=τω
- Diffusion coefficient of dissolved H2 in the binary H2/water-vapour mixture of the porous medium:
( ) gOHHw
gvapH DSD
222 2/ 1 −
−=τω
- Solubility of hydrogen in water: ( ) 316 ..106.72932
−−−== mPamolKTH H
Note: Temperature in diffusion models is stated in Kelvin.
1.3 INITIAL CONDITIONS Water saturation:
- in the geological medium is equal to 100%; - in the cell and drift EDZ is equal to 100%
FORGE Report: D1.1– Ver. 0
6
- in the interface (facing canister and plug) equal to 5%; - in the bentonite plug is equal to 70%; - in the backfill of the access drifts is equal to 70%.
Pressure:
- in the water-saturated materials at 100%, the water and gaz pressure are equals to the value at radial outer boundary (respectively 5 MPa and 0.1 MPa, see Boundary limits);
- in partially-saturated materials, the gas pressure is equal to 1 atmosphere. The water pressure is deduced from the gas pressure and the saturation by applying Van Genuchten models associated with each material.
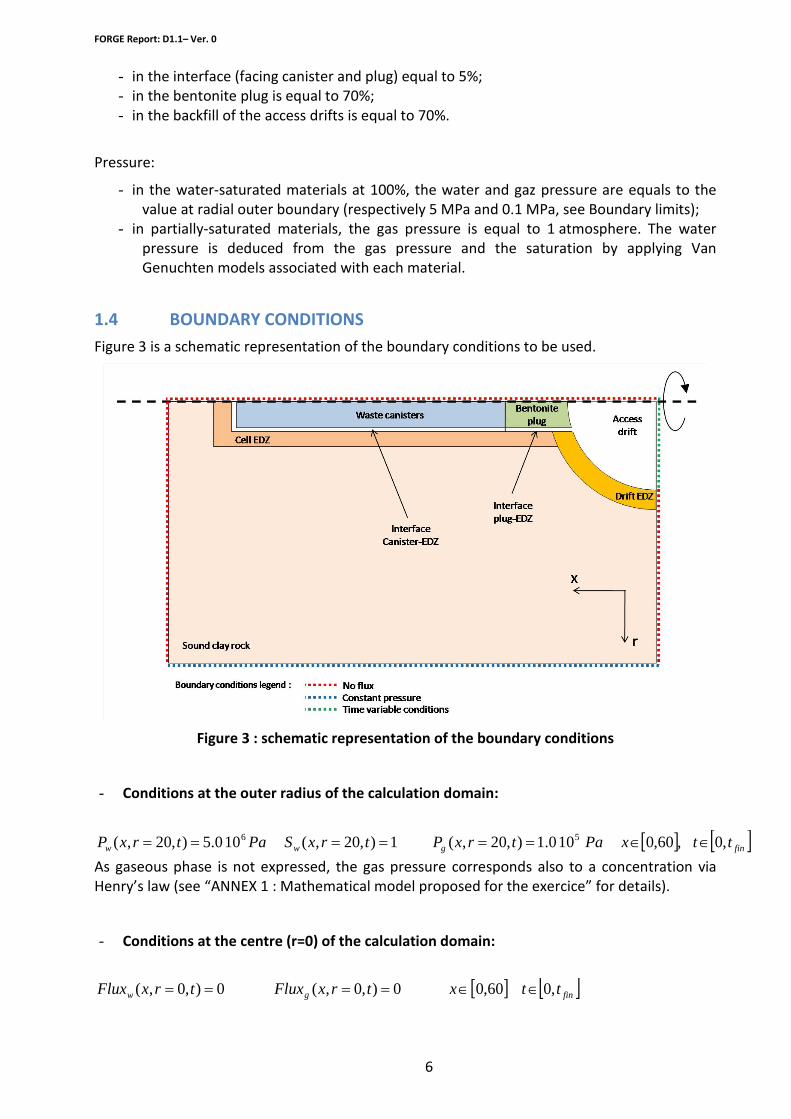
1.4 BOUNDARY CONDITIONS Figure 3 is a schematic representation of the boundary conditions to be used.
Figure 3 : schematic representation of the boundary conditions
- Conditions at the outer radius of the calculation domain:
[ ] [ ]fingww ttxPatrxPtrxSPatrxP ,0,60,0100.1),20,(1),20,(100.5),20,( 56 ∈∈======As gaseous phase is not expressed, the gas pressure corresponds also to a concentration via Henry’s law (see “ANNEX 1 : Mathematical model proposed for the exercice” for details).
- Conditions at the centre (r=0) of the calculation domain:
[ ] [ ]fingw ttxtrxFluxtrxFlux ,060,00),0,(0),0,( ∈∈====
FORGE Report: D1.1– Ver. 0
7
- Conditions on the lateral side, x=60 of the calculation domain:
[ ] [ ]fingw ttrtrxFluxtrxFlux ,020,00),,60(0),,60( ∈∈====
- Conditions on the lateral side, x=0 of the calculation domain:
] ] [ ]fingw ttrtrxFluxtrxFlux ,020,30),3,0(0),3,0( ∈∈=>==>=
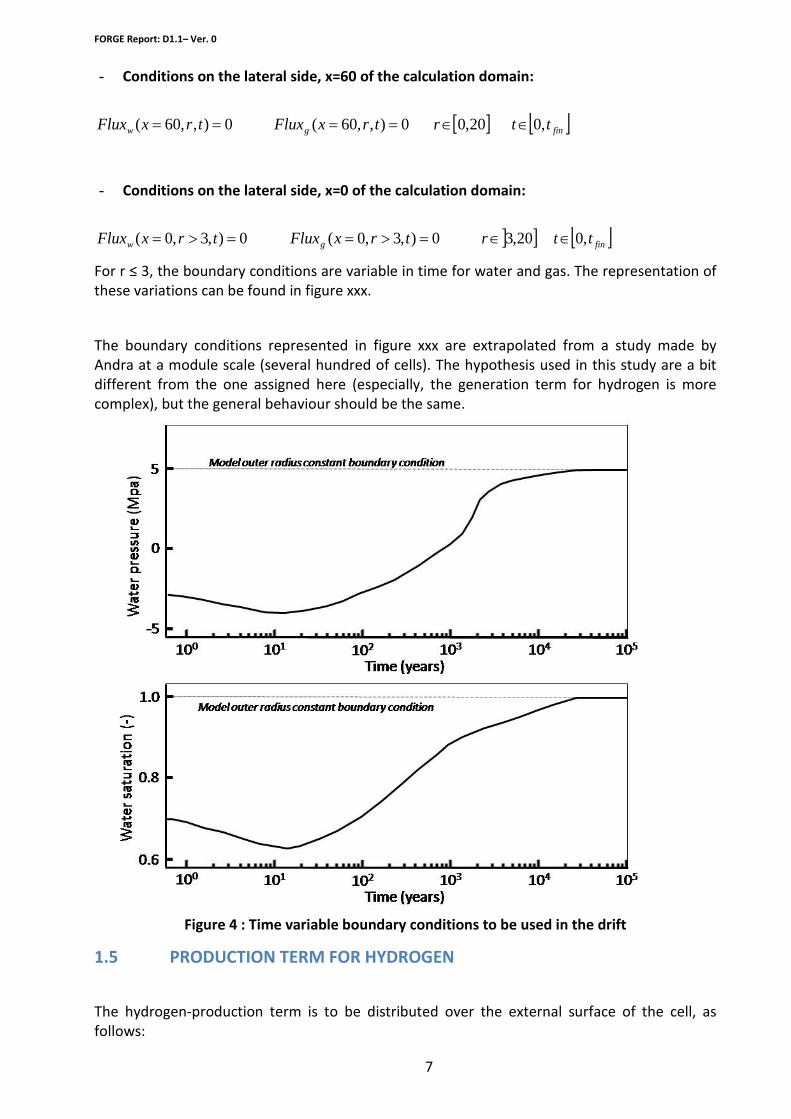
For r ≤ 3, the boundary conditions are variable in time for water and gas. The representation of these variations can be found in figure xxx.
The boundary conditions represented in figure xxx are extrapolated from a study made by Andra at a module scale (several hundred of cells). The hypothesis used in this study are a bit different from the one assigned here (especially, the generation term for hydrogen is more complex), but the general behaviour should be the same.
Figure 4 : Time variable boundary conditions to be used in the drift
1.5 PRODUCTION TERM FOR HYDROGEN
The hydrogen-production term is to be distributed over the external surface of the cell, as follows:

FORGE Report: D1.1– Ver. 0
8
- for 0 < t ≤ 10000 years, cellyearmolQ gH //100
2= 0
2=w
HQ
- for t > 10000 years cellyearmolQ gH //0
2= 0
2=w
HQ
1.6 SIMULATION PERIOD
The simulation will be performed between moment t0=0 and moment tfin=100.000 years.
SENSITIVITY ANALYSIS For this first exercise, the sensitivity analysis is concentrated oround uncertainties concerning the EDZ, the host rock permeability and the diffusion of H2 in porous media :
Sensitivity 1 :
The evolution of the EDZ intrinsic permeability with time is not well known, some data however show a reduction of permeability with time down to values similar to those of the undisturbed rock. Concerning the evolution with time of the retention and relative permeability curve of the EDZ, no consistent data are available.
For this sensitivity analysis, everything else being equal to the reference case, EDZ intrinsic permeability (for both drift and cell) is supposed equal to undisturbed rock permeability
Sensitivity 2 :
Depending of the type of clay rock, Mualem / Van Genuchten curve is not always the best choice for relative permeability of the host rock and EDZ. For certain data a power law fits quite well the measures.
For this sensitivity analysis, everything else being equal to the reference case, relative permeability curve for water and gas of undisturbed host rock and EDZ (for both drift and cell) is supposed to follow saturation at the power 3 :
333 )1( wg
grw
wr SSKSK −===
- wrK : Relative permeability for water (-)
- grK : Relative permeability for the total gas phase (-)
- wS : saturation for water (-)
- gS : saturation for the total gas phase (-)
Sensitivity 3 :
Uncertainties for the diffusion coefficient of dissolved hydrogen in porous media is quite high and this parameter can have a real impact on the percentage of H2 turning effectively to gas.
FORGE Report: D1.1– Ver. 0
9
For this sensitivity analysis, everything else being equal to the reference case, the diffusion coefficient of dissolved hydrogen under water saturated conditions will be multiplied by 10 for all simulated porous media.
Output results The output will be the same for the reference case and the sensitivity cases.
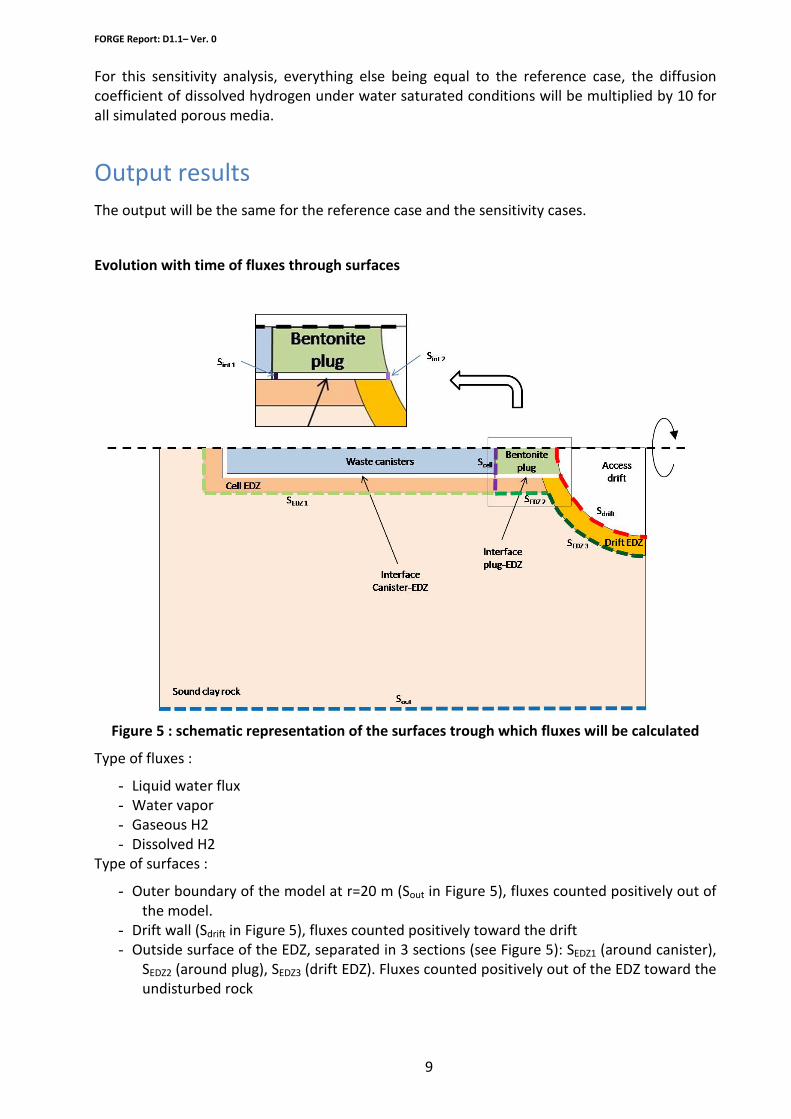
Evolution with time of fluxes through surfaces
Figure 5 : schematic representation of the surfaces trough which fluxes will be calculated
Type of fluxes :
- Liquid water flux - Water vapor - Gaseous H2 - Dissolved H2
Type of surfaces :
- Outer boundary of the model at r=20 m (Sout in Figure 5), fluxes counted positively out of the model.
- Drift wall (Sdrift in Figure 5), fluxes counted positively toward the drift - Outside surface of the EDZ, separated in 3 sections (see Figure 5): SEDZ1 (around canister),
SEDZ2 (around plug), SEDZ3 (drift EDZ). Fluxes counted positively out of the EDZ toward the undisturbed rock

FORGE Report: D1.1– Ver. 0
10
- Inner cell surfaces (see Figure 5) : Scell (section including interface and EDZ at canister-plug junction), Sint1 (interface at canister-plug junction), Sint2 (interface at the drift wall). Fluxes counted positively toward the drift.
Evolution with time along lines
Evolution with time of :
- Water saturation - Water pressure - Gas pressure (in the gas phase when it exists) - Dissolved H2 pseudo-pressure (see Henry’s law in “ANNEX 1 : Mathematical model
proposed for the exercise” for details) - Capillary pressure
Type of lines
Figure 6 : schematic representation of the lines along which results should be given
- Lines at constant radius (see Figure 6) : Lint (passes through the interface), LEDZ (just outside the cell EDZ), Lrock (inside the rock at a 5 m radius)
- Lines at constant x (see Figure 6) : Lx=0 and Lx=60 (boundaries of the model), Lplug (in the middle of the plug), Lcell (in the middle of the canister)
Evolution with time at given points
Evolution with time of :
- Water saturation - Water pressure - Gas pressure (in the gas phase when it exists)

FORGE Report: D1.1– Ver. 0
11
- Dissolved H2 pseudo-pressure (see Henry’s law in “ANNEX 1 : Mathematical model proposed for the exercise” for details)
- Capillary pressure
Figure 7 : schematic representation of the point where results should be given
Type of points :
- Points 1 to 4, at the same radius as the centre of the interface (see Figure 7) : P1 and P4 (at the boundaries), P2 (in the middle of the canister), P3 (in the middle of the plug)
- Points 5 and 6, at the same radius as the centre of the cell EDZ (see Figure 7) : P5 (in the middle of the canister), P6 (in the middle of the plug)
- Point 7 (see Figure 7) in the middle of the drift EDZ on the x=0 boundary - Points 8 to 12, at a 5 m radius (see Figure 7) : P8 and P12 (at the boundaries), P9 (at the
same x as the middle of the canister), P10 (at the same x as the middle of the plug), P11 (at the same x as the intersection of the drift and the interface)

FORGE Report: D1.1– Ver. 0
12
ANNEX 1 : Mathematical model proposed for the exercise
The capillary pressure is defined as the difference between gas pressure and water pressure :
wgC PPP −= (1)
• Pc : capillary pressure (Pa) • Pg : total pressure of the gas phase(Pa) • Pw : water pressure (Pa)
The dependence between water and gas saturation in each porous media is expressed by :
1=+ Wg SS with p
gg V
VS = and
p
ww V
VS =
• Sg : gas saturation (-) • Sw : water saturation (-) • Vg : gas volume (m3) • Vw : water volume (m3) • Vp : pore volume (m3)
Van Genuchten model is used to express capillary pressure function of the effective saturation in a given porous media :
grwr
wrwwe SS
SSS
−−−
=1
(2)
mn
r
c
we
PP
S
+
=
1
1 (3)
• Swe : Effective water saturation (-) • Swr = residual water saturation (-) • Pr : reference pressure for Van genuchten law (Pa). Generally the value for this
coefficient is higher than the gas entry pressure for a given porous media
• n, m : coefficient for Van genuchten law. We have n
m 11−=
The relative permeability for water is expressed by integrating the Mualem prediction model in the Van Genuchten capillarity model :

FORGE Report: D1.1– Ver. 0
13
( )[ ]2/111 mmwewe
wr SSk −−= (4)
• wrk : relative permeability for water (-)
The relative permeability for gas is expressed similarly :
[ ] mmwewe
gr SSk 2/111 −−= (5)
• grk : relative permeability for gas (-)
The water and gas movement in a porous media is represented by the mass conservation law and the energy conservation law (reduced to the generalized Darcy law) :
)()( zgPSkkU www
wwr
w ∇+∇−= ρµ
(6)
)()(
zgPSkk
U ggg
ggr
g ∇+∇−= ρµ
(7)
• K : intrinsic permeability of the porous media (m2) • µg : viscosity of the total gas phase (kg.s-1.m-1) • µw : viscosity of water (kg.s-1.m-1) • ρg : volumetric mass of the total gas phase (kg.m-3) • ρw : volumetric mass of water (kg.m-3)
[ ])(exp)( atmwsatmww PPSP −= ρρ (8)
ρatm : volumetric mass of water at atmospheric pressure (kg.m-3)
Patm : atmospheric pressure (Pa)
Ss : specific storage (Pa-1)
• g : gravity (m.s-2) • z : altitude (m) • Ug : Darcy velocity for the gas phase (m.s-1) • Uw : Darcy velocity for water (m.s-1)
Equation of conservation for water :
www
ww QUt
S=∇+
∂∂ )()( ρωρ
(9)
• ω : porosity (-) • Qw : consumption/production of water (kg.m-3.s-1)
Equation of conservation for the total gas phase :

FORGE Report: D1.1– Ver. 0
14
ggg
gg QUt
S=∇+
∂
∂)(
)(ρ
ωρ (10)
• Qg : consumption/production for the total gas phase (kg.m-3.s-1)
The mass fraction of gaseous hydrogen is expressed as :
g
gHg
HXρρ
2
2= (11)
With g
gHg
H Vm
2
2=ρ and
g
g
g Vm
=ρ
• gHX
2is the mass fraction of hydrogen in the total gas phase (-)
• gHm
2 is the hydrogen mass in the gaz phase (kg)
• gm is the total mass of the gas phase (kg)
• gH 2
ρ is the volumetric mass of gaseous hydrogen in the gas phase (kg.m-3)
Mass conservation law for gaseous hydrogen :
gH
lgH
gHg
gHg
gHgg QJUXXS
t 22222
/)()( =Ω+−∇+∂∂ ρρω (12)
• lgH
/2
Ω is the exchange term from the gaseous phase to the liquid phase for H2 (kg.m-
3.s-1) • g
HQ2
is the consumption/production term for gaseous hydrogen (kg.m-3.s-1)
• gHJ
2 is the diffusive term for gaseous hydrogen (kg.m-2.s-1)
Diffusive flux for a binary mixture of gas (H2 and water vapor) can be expressed by Kick law :
gH
gvapHg
gH XDJ
222∇= ρ (13)
• gvapHD
2 is the diffusion coefficient for gaseous hydrogen in water vapor (m2.s-1)
The mass fraction of dissolved hydrogen is expressed as :
w
wHw
HXρρ
2
2= (14)
With w
wHw
H Vm
2
2=ρ and
w
w
w Vm
=ρ
• wHX
2is the mass fraction of dissolved hydrogen (-)
FORGE Report: D1.1– Ver. 0
15
• wHm
2 is the dissolved hydrogen mass (kg)
• wm is the total mass of the liquid phase (kg)
• wH 2
ρ is the volumetric mass of dissolved hydrogen in the liquid phase (kg.m-3)
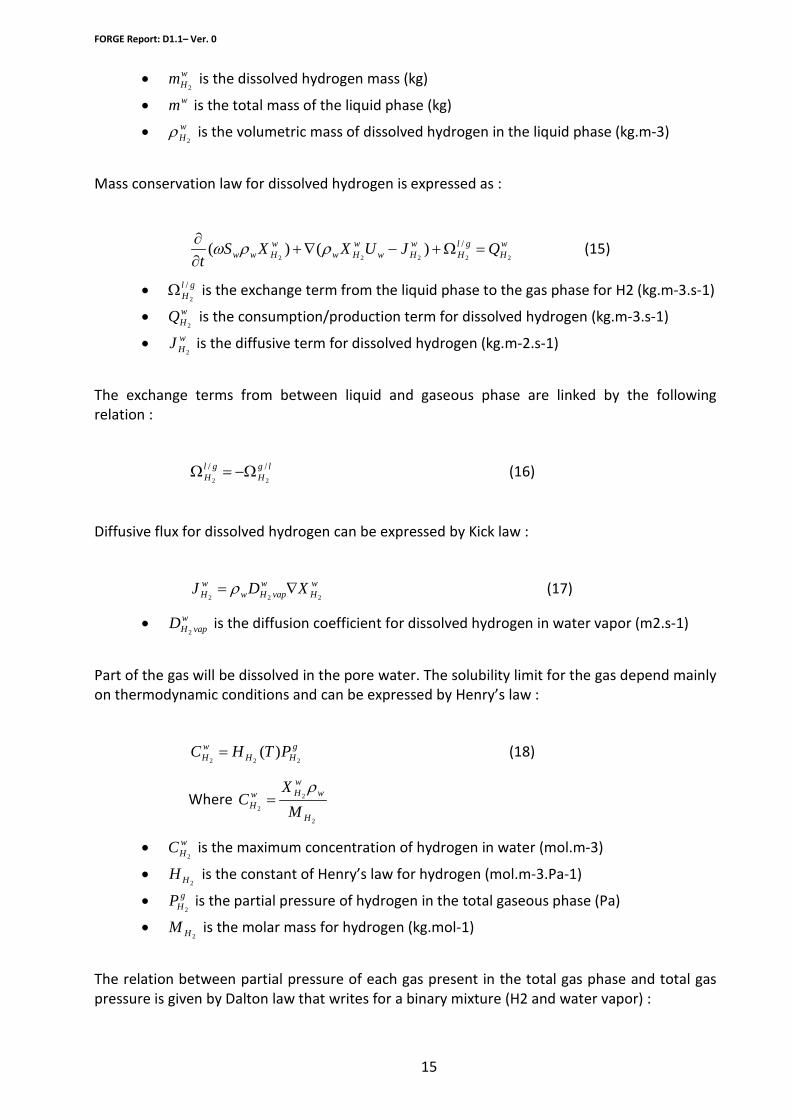
Mass conservation law for dissolved hydrogen is expressed as :
wH
glH
wHw
wHw
wHww QJUXXS
t 22222
/)()( =Ω+−∇+∂∂ ρρω (15)
• glH/
2Ω is the exchange term from the liquid phase to the gas phase for H2 (kg.m-3.s-1)
• wHQ
2 is the consumption/production term for dissolved hydrogen (kg.m-3.s-1)
• wHJ
2 is the diffusive term for dissolved hydrogen (kg.m-2.s-1)
The exchange terms from between liquid and gaseous phase are linked by the following relation :
lg
Hgl
H//22
Ω−=Ω (16)
Diffusive flux for dissolved hydrogen can be expressed by Kick law :
wH
wvapHw
wH XDJ
222∇= ρ (17)
• wvapHD
2 is the diffusion coefficient for dissolved hydrogen in water vapor (m2.s-1)
Part of the gas will be dissolved in the pore water. The solubility limit for the gas depend mainly on thermodynamic conditions and can be expressed by Henry’s law :
g
HHwH PTHC
222)(= (18)
Where 2
2
2H
wwHw
H MX
Cρ
=
• wHC
2 is the maximum concentration of hydrogen in water (mol.m-3)
• 2HH is the constant of Henry’s law for hydrogen (mol.m-3.Pa-1)
• gHP
2 is the partial pressure of hydrogen in the total gaseous phase (Pa)
• 2HM is the molar mass for hydrogen (kg.mol-1)
The relation between partial pressure of each gas present in the total gas phase and total gas pressure is given by Dalton law that writes for a binary mixture (H2 and water vapor) :
FORGE Report: D1.1– Ver. 0
16
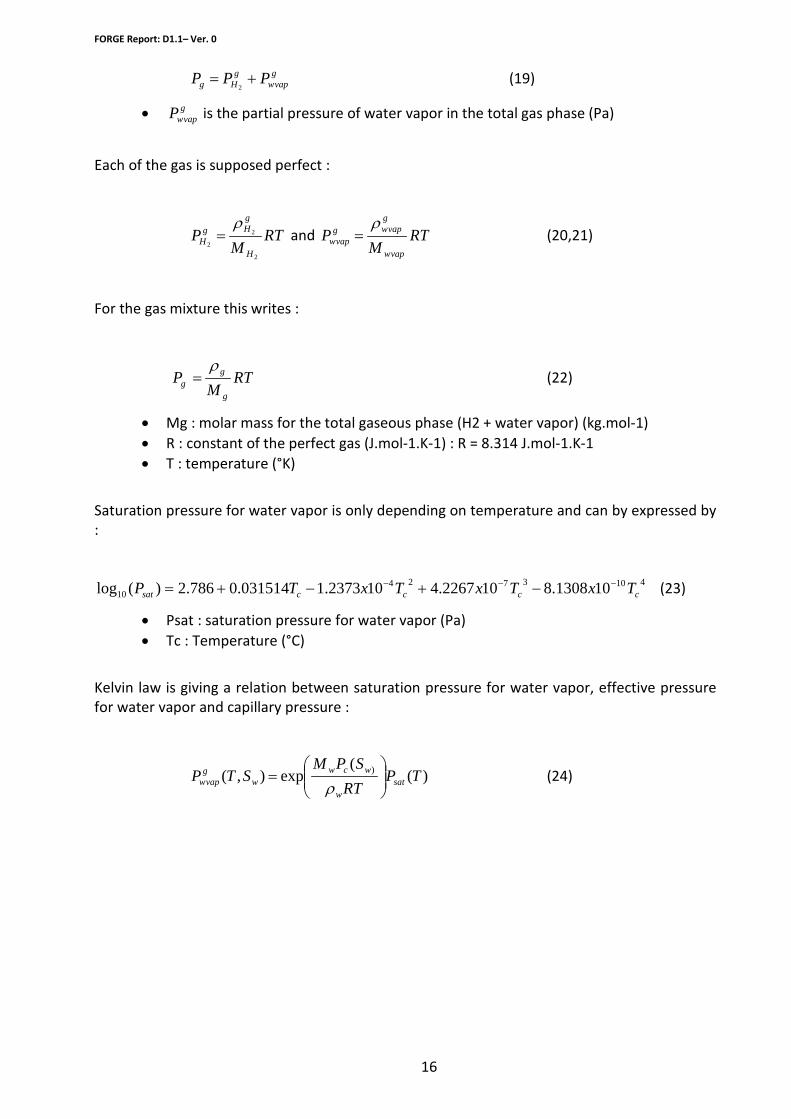
gvapw
gHg PPP +=
2 (19)
• gvapwP is the partial pressure of water vapor in the total gas phase (Pa)
Each of the gas is supposed perfect :
RTM
PH
gHg
H2
2
2
ρ= and RT
MP
vapw
gvapwg
vapw
ρ= (20,21)
For the gas mixture this writes :
RTM
Pg
gg
ρ= (22)
• Mg : molar mass for the total gaseous phase (H2 + water vapor) (kg.mol-1) • R : constant of the perfect gas (J.mol-1.K-1) : R = 8.314 J.mol-1.K-1 • T : temperature (°K)
Saturation pressure for water vapor is only depending on temperature and can by expressed by :
4103724
10 101308.8102267.4102373.1031514.0786.2)(log ccccsat TxTxTxTP −−− −+−+= (23)
• Psat : saturation pressure for water vapor (Pa) • Tc : Temperature (°C)
Kelvin law is giving a relation between saturation pressure for water vapor, effective pressure for water vapor and capillary pressure :
)((
exp),( ) TPRT
SPMSTP sat
w
wcww
gvapw
=
ρ (24)