draft status report - aga.org · document should be sent to the ppdc c/o american gas association,...
TRANSCRIPT

PLASTIC PIPING DATA COLLECTION INITIATIVE
STATUS REPORT August 10, 2017
Copyright © Plastic Pipe Database Committee 2017
All Rights Reserved
Administered by American Gas Association
400 North Capitol Street, N.W., 4th Floor Washington, DC 20001
U.S.A.
NOTICE AND COPYRIGHT The Plastic Pipe Database Committee (PPDC), composed of representatives of the American Gas Association
(AGA), American Public Gas Association (APGA), Plastics Pipe Institute (PPI), National Association of Regulatory Utility Commissioners (NARUC), National Association of Pipeline Safety Representatives (NAPSR), National Transportation Safety Board (NTSB) and U.S. Department of Transportation’s (DOT) Pipeline and Hazardous Materials Safety Administration (PHMSA), coordinates the creation and maintenance of a database (“PPDC Database”) to proactively monitor the performance of plastic pipe and metal and/or plastic appurtenances contained within plastic piping systems. While AGA provides administrative services to the PPDC, it does not independently test, evaluate, or verify the accuracy or soundness of any statements contained in the PPDC database or made by the PPDC.
This document is based on information from the database that has not been verified or audited. The PPDC and the AGA disclaim liability for any personal injury, property or other damages of any nature whatsoever, whether special, indirect, consequential or compensatory, directly or indirectly resulting from the publication, use of, or reliance on this document. The PPDC and the AGA also make no representation, warranty or guarantee in connection with this document, including, the accuracy or completeness of the information therein. Nothing contained in this document should be viewed as an endorsement or disapproval of any particular manufacturer or product.
In issuing and making this document available, the PPDC and the AGA are not undertaking to render professional or other services for or on behalf of any person or entity. Nor are the PPDC and the AGA undertaking to perform any duty owed by any person or entity to someone else. Anyone using this document should rely on his or her own independent judgment or, as appropriate, seek the advice of a competent professional in determining the exercise of reasonable care in any given circumstances.
Users of this document should consult applicable federal, state and local laws and regulations. The PPDC and the AGA do not, by the publication of this document, intend to urge action that is not in compliance with applicable laws, and this document may not be construed as doing so.
Information concerning safety and health risks, proper installation or use, performance or fitness or suitability for any purpose with respect to particular products or materials should be obtained from the User’s employer, the manufacturer or supplier of the raw material used.
All questions, requests for revisions, or other communications relating to the PPDC, the PPDC database or this document should be sent to the PPDC c/o American Gas Association, 400 N. Capitol St., N.W., Suite 450, Washington, D.C. 20001.
Copyright © Plastic Pipe Database Committee 2017. All Rights Reserved.
Table of Contents PPDC History and background 1 DOT Statistics 1 PPDC Volunteer and Active Submitter Statistics 2 Explanation of Historical Data Collection 2 Historically Known Information 3 Data Analysis and Information 4 Resin and Plastic Materials Improvement 4 Failures/Leaks on Newly Installed Pipe 5 GPTC Guidance 5 AGA Plastic Pipe Manual Reference 5 Manufacturer Information 6 Gas Distribution Integrity Management Program 6 Rate Process Method 6 Assistance and Answers from PPDC 6 Appendix A, Names of Gas Operators/Corporations Actively Submitting
Reports to the Plastic Pipe Database 8 Appendix B, General Failure/Leak Data Analysis 10 Appendix C, Century Data Analysis 18 Appendix D, Aldyl Data Analysis 21 Appendix E, PE 3306 Data Analysis 25 Appendix F, Cap Data Analysis 29 Appendix G, AMP Data Analysis 35 Appendix H, PVC Data Analysis 39 Appendix I, Kerotest Data Analysis 43 Appendix J Driscopipe® High Density Polyethylene (HDPE) Pipe
Data Analysis 47 Appendix K, Questions from Stakeholder Groups about the PPDC
and PPDC Data 51 Appendix L, Plastic Pipe Timeline 55
Note: highlighted areas indicate updated information.

Page 1
Plastic Piping Data Collection Initiative Status Report August, 2017
PPDC History and Background
The Plastic Pipe Database Committee (PPDC), composed of representatives of the American Gas Association (AGA), American Public Gas Association (APGA), Plastics Pipe Institute (PPI), National Association of Regulatory Utility Commissioners (NARUC), National Association of Pipeline Safety Representatives (NAPSR), National Transportation Safety Board (NTSB) and U.S. Department of Transportation’s (DOT) Pipeline and Hazardous Materials Safety Administration (PHMSA), has been coordinating since 1999 and receiving information since 2000 into a database of in-service plastic piping system failures and/or leaks with the objective of identifying possible performance issues. Company participation in this initiative is voluntary and the database is designed to address the confidentiality concerns of the participants. The data collection initiative arose from the NTSB Special Investigation Report Brittle-Like Cracking in Plastic Pipe for Gas Service1. The NTSB recommended that PHMSA determine how susceptible older plastic piping materials are to premature brittle-like cracking. The industry agreed to work with the regulatory community to voluntarily collect pertinent information to be placed into a secure database. The PPDC has and will continue to meet this objective. Based on the work of PPDC and PHMSA initiatives, the NTSB has classified the Safety Recommendation P-98-2 as Closed – Acceptable Action.
DOT Statistics
2016 Gas Distribution Annual Report statistics from DOT indicate there were approximately 721,026 miles of plastic main and over 48.3 million plastic services installed in the distribution systems of approximately 1,448 gas companies in the U.S. at the end of 2016. These statistics indicate an increase of 14,085 miles of plastic main and 800,000 services from 2015.
DOT Statistics for Year2
Total Miles of Plastic Main
Total Number of Plastic Services
2016 721,026 48.3 million 2015 706,941 47.5 million 2014 690,291 46.7 million 2013 674,980 46.1 million 2012 661,380 45.1 million
Table 1 Miles of Plastic Main and Number of Plastic Services
1 Brittle-Like Cracking in Plastic Pipe For Gas Service, NTSB Report No. NTSB/SIR-98/01, National Transportation Safety Board, Washington, D.C., April 1998. 2 Data downloaded from PHMSA website July 11, 2017.
Page 2
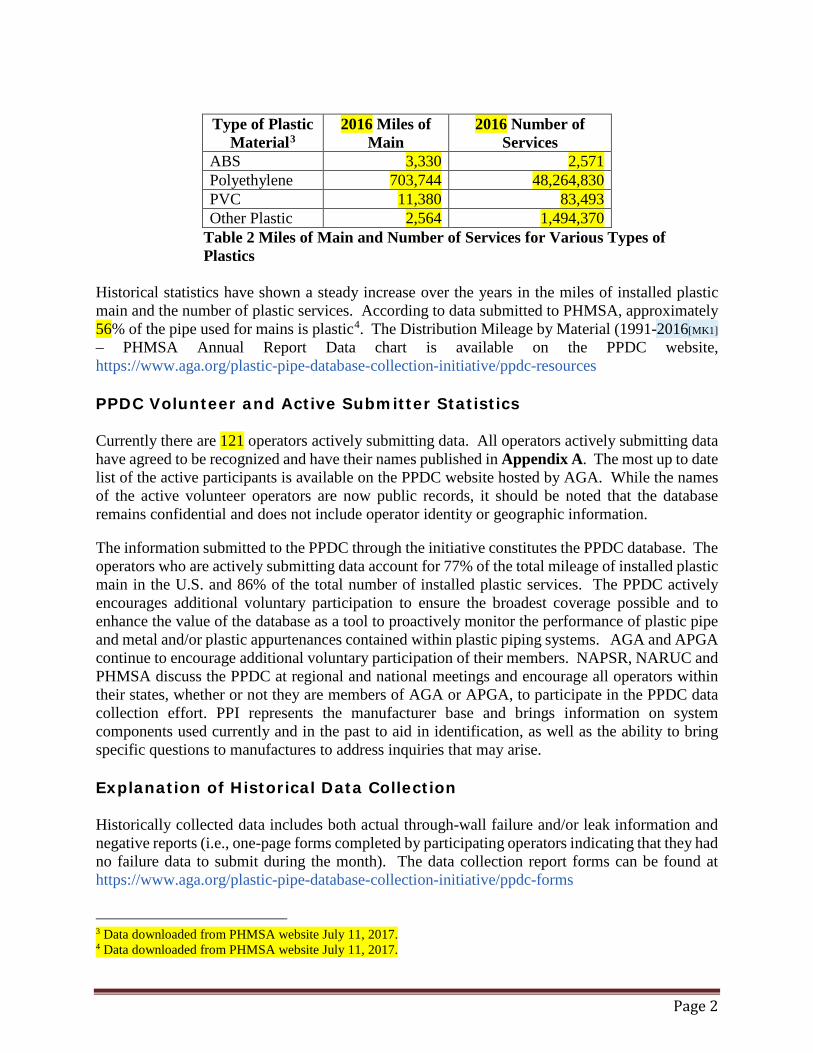
Table 2 Miles of Main and Number of Services for Various Types of Plastics
Historical statistics have shown a steady increase over the years in the miles of installed plastic main and the number of plastic services. According to data submitted to PHMSA, approximately 56% of the pipe used for mains is plastic4. The Distribution Mileage by Material (1991-2016[MK1] – PHMSA Annual Report Data chart is available on the PPDC website, https://www.aga.org/plastic-pipe-database-collection-initiative/ppdc-resources
PPDC Volunteer and Active Submitter Statistics
Currently there are 121 operators actively submitting data. All operators actively submitting data have agreed to be recognized and have their names published in Appendix A. The most up to date list of the active participants is available on the PPDC website hosted by AGA. While the names of the active volunteer operators are now public records, it should be noted that the database remains confidential and does not include operator identity or geographic information. The information submitted to the PPDC through the initiative constitutes the PPDC database. The operators who are actively submitting data account for 77% of the total mileage of installed plastic main in the U.S. and 86% of the total number of installed plastic services. The PPDC actively encourages additional voluntary participation to ensure the broadest coverage possible and to enhance the value of the database as a tool to proactively monitor the performance of plastic pipe and metal and/or plastic appurtenances contained within plastic piping systems. AGA and APGA continue to encourage additional voluntary participation of their members. NAPSR, NARUC and PHMSA discuss the PPDC at regional and national meetings and encourage all operators within their states, whether or not they are members of AGA or APGA, to participate in the PPDC data collection effort. PPI represents the manufacturer base and brings information on system components used currently and in the past to aid in identification, as well as the ability to bring specific questions to manufactures to address inquiries that may arise.
Explanation of Historical Data Collection
Historically collected data includes both actual through-wall failure and/or leak information and negative reports (i.e., one-page forms completed by participating operators indicating that they had no failure data to submit during the month). The data collection report forms can be found at https://www.aga.org/plastic-pipe-database-collection-initiative/ppdc-forms
3 Data downloaded from PHMSA website July 11, 2017. 4 Data downloaded from PHMSA website July 11, 2017.
Type of Plastic Material3
2016 Miles of Main
2016 Number of Services
ABS 3,330 2,571 Polyethylene 703,744 48,264,830 PVC 11,380 83,493 Other Plastic 2,564 1,494,370

Page 3
The scope of the committee was expanded to include failures and/or leaks of plastic pipe and metal and/or plastic appurtenances contained within plastic piping systems5. Immediate third-party damages are not collected or evaluated (except where a delayed failure and/or leak occurs after the damage event) since this data is collected by the Common Ground Alliance and it does not provide an indication of the long-term performance of plastic piping materials. The cumulative data supplied by volunteer participants in the Plastic Pipe Data Collection Initiative are examined in aggregate by the PPDC at each meeting to consider plastic system failures and/or leaks unrelated to third-party damage.
Historically Known Information
Although the data continues to be actively reviewed by the PPDC, the data cannot be directly correlated to quantities of each material that may be in service across the U.S. The failure and/or leak data points reinforce what is already (and historically) known about certain older plastic piping and components. Some of these were identified in 2000 by a government-industry group6 and have resulted in PHMSA Advisory Bulletins7. The bulletins can be found on the PHMSA website at http://www.phmsa.dot.gov/pipeline. Historically known information includes the following plastic piping and components that have demonstrated a significantly lower resistance to stress intensification8 that can result in material failure:
• Century Utility Products polyethylene (PE) pipe produced from 1970 through 1974 • DuPont Aldyl® A low ductile inner wall PE pipe manufactured from 1970 through 1972 • PE pipe manufactured from PE 3306 resin such as Swanson, Orangeburg and Yardley • DuPont Aldyl® service tee with a white Delrin® polyacetal threaded insert • Plexco service tee with Celcon® polyacetal threaded cap
Data Analysis and Information
The database was originally set up as an Excel file with columns representing each of the fields on the report form. Data was entered exactly as it was reported. The committee members agreed that to help with data analysis, typographical errors should be corrected. It was also agreed that manufacturer names and similar items should be standardized to allow for repeatable and consistent data analysis. Therefore, standardized columns were added to the Excel file. The original data continued to be entered exactly as received and standardized information was
5 In August 2009 the PPDC clarified the scope to include failures of metal or plastic appurtenances in plastic piping systems. In July 2010 the PPDC clarified failures/leaks information to be reported. 6 Robert J. Hall, Brittle-Like Cracking of Plastic Pipe, Final Report No. DTRS56-96-C-0002-006, General Physics Corp., Columbia, Maryland, August 2000. 7 DOT Advisory Bulletin ADB-07-01, Updated Notification of Susceptibility to Premature Brittle-Like Cracking of Older Plastic Pipe, Federal Register, Volume 72, Number 172, p. 51301; ADB-02-07, Notification of the Susceptibility to Premature Brittle-Like Cracking of Older Plastic Pipe, Federal Register, Volume 67, Number 228, p. 70806, November 26, 2002 and corrected Federal Register, Volume 67, Number 232, p. 72027, December 3, 2002; ADB-99-02, Potential Failures Due to Brittle-Like Cracking of Older Plastic Pipe in Natural Gas Distribution Systems, Federal Register, Volume 64, p. 1212; ADB-99-01, Potential Failure Due to Brittle-Like Cracking of Certain Polyethylene Plastic Pipe Manufactured by Century Utility Products Inc., Federal Register, Volume 64, p. 12211. 8 Stress intensification includes conditions such as rock impingement, squeeze off, soil settlement, bending, shear, over-tightening of caps.
Page 4
entered into the standardized columns. As the database grew, it was converted to Access format. Standardized fields replaced the standardized columns that were set up in the original Excel file. The original data submitted is preserved in fields marked ‘Original’ in the database and ensures accuracy should either further standardization into finer detail or adjustment of previous standardization become necessary. Standardization of the data continues as data is entered into the database and is refined by the data analysis discussions during the meetings. In addition to information which has been released in the Advisory Bulletins, the PPDC has performed analysis on the following:
• General Failures/Leaks - Appendix B • Century Utility Products - Appendix C. • All Aldyl pipe and fittings manufactured by DuPont and Uponor - Appendix D. • PE 3306 - Appendix E. • Caps - Appendix F. • AMP/AMP-FIT - Appendix G. • PVC - Appendix H • Kerotest – Appendix I • Driscopipe® High Density Polyethylene (HDPE) Pipe - Appendix J
Also, see Appendix K, Questions from Stakeholder Groups about the PPDC and PPDC Data. Questions for the PPDC can be submitted to Kate Miller at [email protected] or 202.824.7342, or on the PPDC website at https://www.aga.org/ppdc-forms. Questions can also be submitted to an applicable stakeholder representative as shown on the PPDC roster at https://www.aga.org/plastic-pipe-database-collection-initiative/ All charts, tables and discussion in this Status Report are based on cumulative data unless indicated otherwise. The PPDC has seen an elevated report of number of failures/leaks since 2010. This may be due to operators’ preparation for and implementation of Distribution Integrity Management Programs (DIMP) and the Federal requirement to submit Mechanical Fitting Failure Reports.
Resin and Plastic Materials Improvement
The data indicate that some of the early plastic piping products manufactured in the 1960s to early 1980s are more susceptible to brittle-like cracking (also known as slow crack growth) than newer vintage materials. Brittle-like cracking failures occur under conditions of stress intensification. Stress intensification is more common in fittings and joints. Operators should actively monitor the performance of their piping systems. Plastic materials, standards and manufacturing practices have steadily improved over the years. These enhancements have led to an improved ability to withstand stress intensification and have benefited long-term plastic gas piping system performance. Various milestones in the development and use of plastic materials are highlighted in the Plastic Pipe Timeline, Appendix L.
Page 5
Failures/Leaks on Newly Installed Pipe
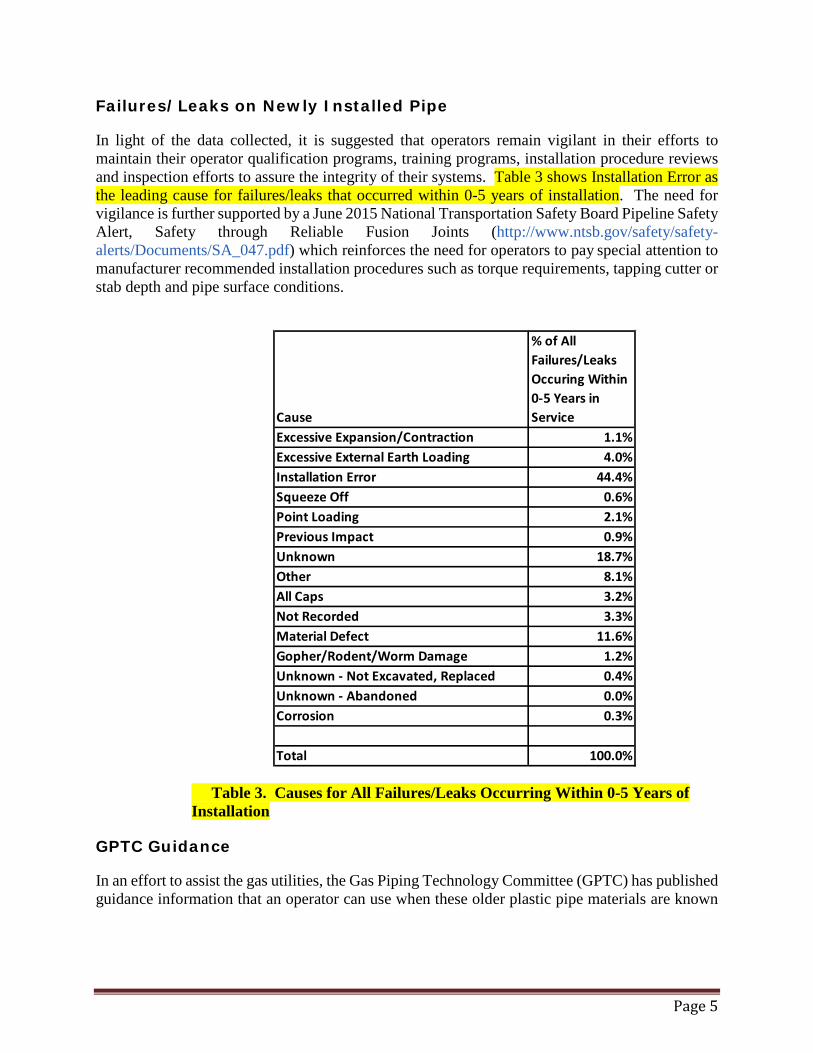
In light of the data collected, it is suggested that operators remain vigilant in their efforts to maintain their operator qualification programs, training programs, installation procedure reviews and inspection efforts to assure the integrity of their systems. Table 3 shows Installation Error as the leading cause for failures/leaks that occurred within 0-5 years of installation. The need for vigilance is further supported by a June 2015 National Transportation Safety Board Pipeline Safety Alert, Safety through Reliable Fusion Joints (http://www.ntsb.gov/safety/safety-alerts/Documents/SA_047.pdf) which reinforces the need for operators to pay special attention to manufacturer recommended installation procedures such as torque requirements, tapping cutter or stab depth and pipe surface conditions.
Table 3. Causes for All Failures/Leaks Occurring Within 0-5 Years of Installation
GPTC Guidance
In an effort to assist the gas utilities, the Gas Piping Technology Committee (GPTC) has published guidance information that an operator can use when these older plastic pipe materials are known
Cause
% of All Failures/Leaks Occuring Within 0-5 Years in Service
Excessive Expansion/Contraction 1.1%Excessive External Earth Loading 4.0%Installation Error 44.4%Squeeze Off 0.6%Point Loading 2.1%Previous Impact 0.9%Unknown 18.7%Other 8.1%All Caps 3.2%Not Recorded 3.3%Material Defect 11.6%Gopher/Rodent/Worm Damage 1.2%Unknown - Not Excavated, Replaced 0.4%Unknown - Abandoned 0.0%Corrosion 0.3%
Total 100.0%

Page 6
to be present in their piping system. The guidance information is contained in the 2015 edition of the Guide for Transmission, Distribution and Gathering Piping Systems under Subpart P9.
AGA Plastic Pipe Manual Reference
In addition, the AGA Plastic Pipe Manual for Gas Service10 contains information on plastic pipeline materials, including factors affecting plastic piping performance, engineering consideration for plastic pipe utilization, procurement considerations and acceptance tests, installation guidance, personnel training, field inspection and pressure testing, operations and maintenance, and emergency control procedures.
Manufacturer Information
The PPDC also compiled historical plastic piping manufacturer information. This ongoing effort is maintained by Plastics Pipe Institute and helps to identify the manufacturers of pipe, fittings and appurtenances for plastic gas distribution operations, including material designations, when the materials were produced, size ranges and other important information. Corrections and/or additions are encouraged and should be communicated to PPDC c/o Deb Bechtloff at PPI ([email protected]). It should be noted that operators are required to install piping that meets current regulations. This information should assist operators in the assessment of their plastic piping systems and is available on the portion of the AGA website hosting the PPDC. Go to https://www.aga.org/plastic-pipe-database-collection-initiative/ppdc-resources to access the PPDC information or go directly to the PPI website at http://plasticpipe.org/energy/energy-piping-systems-mfg-history.html.
Gas Distribution Integrity Management Program
PHMSA has developed and continues to enhance guidance to help the public and the affected industry understand the requirements of the regulations under CFR 49, Part 192, Subpart P, Gas Distribution Pipeline Integrity Management (DIMP). The DIMP Inspection Forms as well as other resources to support operators implement their program are on the DIMP Resources page and through PHMSA’s Pipeline Safety website, http://primis.phmsa.dot.gov/dimp/.
Rate Process Method
For the many miles of older PE materials still in service in the U.S., the key unknown is the projected performance of pipelines in situations where stress intensification may be present. The rate process method (RPM) can be a useful tool for evaluating these compounds and their susceptibility to brittle-like cracking. The RPM can also be used to predict performance of PE materials at their in-ground temperatures and operating stresses based on both internal pressure
9 Information about the GPTC can be found at https://www.aga.org/gptc and the guide information can be purchased at http://www.techstreet.com/aga/standards/aga-z380115?product_id=1896442 10 The AGA Plastic Pipe Manual for Gas Service can be purchased at http://www.techstreet.com/aga/standards/aga-xr0603?product_id=1314445

Page 7
as the primary load in combination with concentrated stresses such as rock impingement and squeeze-off.11
Assistance and Answers from PPDC
AGA is available to help participants fill out the report forms if there are any questions by a participant. A portion of the AGA website hosting the PPDC contains the latest versions of Frequently Asked Questions, data collection forms, form instruction, definitions, PPDC rosters, previous status and annual reports, a data collection PowerPoint tutorial entitled, “Plastic Pipe Data Collection” and further details on the goals of the Plastic Pipe Data Collection initiative. The PPDC encourages questions from the stakeholder groups. Appendix K contains a listing of questions reviewed at Committee meetings and responses from the PPDC. With this status report, the PPDC continues to urge all natural gas distribution system operators to volunteer as active participants in this proactive and worthwhile initiative. For questions or additional information about this initiative, contact PPDC c/o Kate Miller (by telephone 202.824.7342 or electronically at [email protected]).
11 Bragaw, C. G., “Prediction of Service Life of Polyethylene Gas Piping System,” Proceedings Seventh Plastic Fuel Gas Pipe Symposium, pp. 20-24, 1980, and Bragaw, C. G., “Service Rating of Polyethylene Piping Systems by the Rate Process Method,” Proceedings Eighth Plastic Fuel Gas Pipe Symposium, pp. 40-47, 1983, and Palermo, E. F., “Rate Process Method as a Practical Approach to a Quality Control Method for Polyethylene Pipe,” Proceedings Eighth Plastic Fuel Gas Pipe Symposium, pp. 96-101, 1983, and Mruk, S. A., “Validating the Hydrostatic Design Basis of PE Piping Materials,” and Palermo, E. F., “Rate Process Method Concepts Applied to Hydrostatically Rating Polyethylene Pipe,” Proceedings Ninth Plastic Fuel Gas Pipe Symposium, pp. 215-240, 1985.

Page 8
Appendix A Names of Gas Operators/Corporations Actively Submitting
Reports to the Plastic Pipe Database August 2017
Note: Depending on how annual reports are filed with PHMSA, some companies are listed under corporate names and some are listed by individual operating company names.
Alabama Gas Corp Alliant Energy Ameren Illinois Co Atlanta Gas Light Atmos Energy Avista Corp Austin Utilities Baltimore Gas & Electric Co Batesville Water & Gas Utility Black Hills Energy Black Hills Corporation/Source Gas CenterPoint Energy Central Hudson Gas & Electric Corp Chambersburg Gas Dept Chanute, City Of Cheyenne Light Fuel and Power Chesapeake Utilities Corporation Citizens Gas and Coke Utility City of Cartersville Gas System City of Ellensburg Gas Department City of Fort Morgan Clearwater Gas System Colorado Springs Utilities Colquitt Gas System, City Of Columbia Gas/Nisource Consolidated Edison Co Of New York Consumers Energy Corning Natural Gas Corporation Delmarva Power and Light Dominion Duke Energy Eastern Natural Gas Co Enstar Natural Gas Co Equitable Gas Company Greenville Utilities Commission Greer Commission Of Public Works Intermountain Gas Co Island Energy
Jackson Energy Authority Kansas Gas Service Kokomo Gas & Fuel Co/NIPSCO Knoxville Utilities Board Laclede Gas Co Lawrenceville, City of Liberty Utilities Long Beach Gas Dept, City Of Louisville Gas and Electric Madison Gas & Electric Co Memphis Light Gas & Water Division Mesa Municipal System, City Of Michigan Consolidated Gas Co (Michcon) Michigan Gas Utilities Co Middle Tennessee Natural Gas Utility District Middleborough Gas & Electric Dept Midwest Natural Gas Corp Minnesota Energy Resources Corporation Missouri Gas Energy Mobile Gas Service Corp Montana - Dakota Utilities Co Mountaineer Gas Co National Fuel National Grid/Keyspan New England Gas Company New Jersey Natural Gas Co New Mexico Gas Co North Shore Gas Co Northern Illinois Gas Co Northern States Power Co Northern States Power Company of Minnesota Northwest Natural Gas Co Norwich Public Utilities NV Energy Oklahoma Natural Gas Co. Orange and Rockland Utilities Orangeburg Public Utilities Osage City Municipal Gas System

Page 9
Pacific Gas & Electric Co Paris - Henry County Public Util Dist PECO Energy Co Peoples Gas Light & Coke Co Peoples Natural Gas Perryton, City Of Philadelphia Gas Works Piedmont Natural Gas Co Inc Pike Natural Gas Co Powell Clinch Utility District Public Service Electric & Gas Co Public Service Company of Colorado Public Service Company of North Carolina Puget Sound Energy Questar Gas Company Safford Utilities Div, City Of San Diego Gas & Electric Co Scottsboro Water Sewer & Gas Board Semco Energy Gas Company Sheffield Gas Department South Carolina Electric & Gas Co South Jersey Gas Co
Southeastern Natural Gas Co Southern California Gas Co Southwest Gas Corp Tallahassee, City of T.W. Phillips Gas & Oil Co. Texas Gas Service Company The Empire District Gas Company Tipton Municipal Utilities UGI Utilities Union Utility Dept, City Of Unisource Energy Services Valley Energy, Inc. Vectren Corporation Vermont Gas System Washington Gas Light Co Watertown Municipal Utilities Department We Energies Wilson Gas Dept, City Of Wisconsin Gas Co Wisconsin Public Service Corp Yankee Gas Services

Page 10
Appendix B General Failure/Leak Data Analysis
August 2017
B1. All Pipe Failures/Leaks by Cause
CAUSE% of All Pipe Failures/Leaks
% of Pipe Less DuPont & Uponor Failures/Leaks
Excessive Expansion/Contraction 1.2% 1.2%Excessive External Earth Loading 8.6% 3.6%Installation Error 11.1% 9.2%Squeeze Off 5.6% 4.4%Point Loading 15.8% 9.0%Previous Impact 5.6% 7.2%Unknown 10.3% 12.4%Other 16.9% 14.6% All Caps 0.0% 0.0%Not Recorded 2.9% 3.9%Material Defect 18.6% 31.0%Gopher/Rodent/Worm Damage 1.1% 1.9%Unknown - Not Excavated, Replaced 1.3% 1.3%Unknown - Abandoned 0.2% 0.1%Corrosion 0.8% 0.2%
Total 100.0% 100.0%

Page 11
B2. All Pipe Failures/Leaks by Material
MATERIAL% of All Pipe Failures/Leaks
% of All Pipe Less DuPont & Uponor Failures/Leaks
ABS 0.1% 0.1%Black Plastic 0.3% 0.5%CAB 0.0% 0.0%Celcon 0.0% 0.0%Delrin 0.0% 0.0%HDPE 3306 2.3% 4.4%HDPE 3406 2.9% 2.4%HDPE 3408 14.5% 28.5%MDPE 2306 32.7% 8.7%MDPE 2406 39.1% 40.3%Nylon 0.0% 0.0%PA 11 0.0% 0.0%PA 12 0.0% 0.0%PB 0.0% 0.0%PBT 0.0% 0.0%PVC 0.4% 0.8%Red Thread 0.0% 0.0%Other 1.9% 3.3%Not Recorded 5.3% 9.8%Steel 0.1% 0.2%Brass 0.0% 0.0%PE-2708 0.5% 0.9%PE-4710 0.0% 0.1%Malliable Iron 0.0% 0.0%Glass Filled Nylon 0.0% 0.0%Copper 0.0% 0.0%Ductile Iron 0.0% 0.0%Polyacetal or POM 0.0% 0.0%
100.0% 100.0%

Page 12
B3. All Fitting Failures/Leaks by Cause
CAUSE% of All Fittings Failures/Leaks
% of Fittings Less DuPont & Uponor Failures/Leaks
Excessive Expansion/Contraction 2.1% 2.6%Excessive External Earth Loading 3.3% 2.5%Installation Error 24.1% 24.0%Squeeze Off 0.1% 0.1%Point Loading 1.6% 1.1%Previous Impact 0.3% 0.4%Unknown 17.9% 22.1%Other 12.8% 8.4%All Caps 7.5% 7.9%Not Recorded 2.6% 2.7%Material Defect 25.8% 26.3%Gopher/Rodent/Worm Damage 0.0% 0.0%Unknown - Not Excavated, Replaced 0.4% 0.5%Unknown - Abandoned 0.0% 0.1%Corrosion 1.4% 1.2%
Total 100.0% 100.0%
Page 13
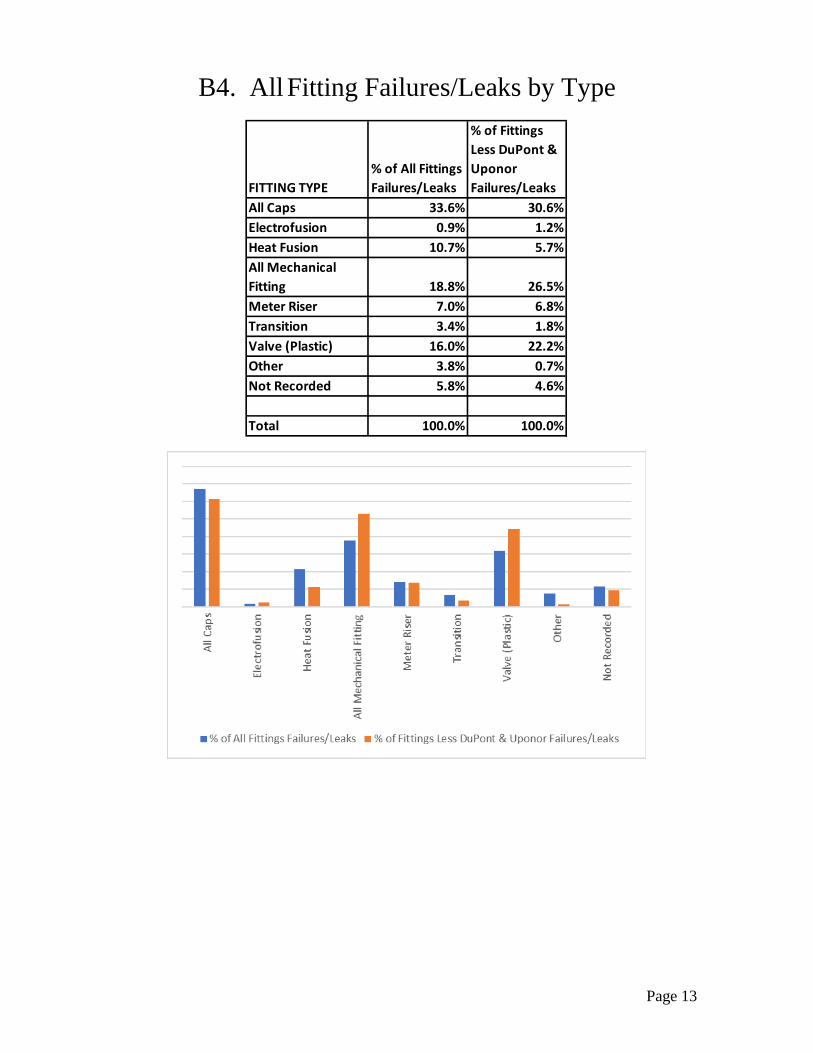
B4. All Fitting Failures/Leaks by Type
FITTING TYPE% of All Fittings Failures/Leaks
% of Fittings Less DuPont & Uponor Failures/Leaks
All Caps 33.6% 30.6%Electrofusion 0.9% 1.2%Heat Fusion 10.7% 5.7%All Mechanical Fitting 18.8% 26.5%Meter Riser 7.0% 6.8%Transition 3.4% 1.8%Valve (Plastic) 16.0% 22.2%Other 3.8% 0.7%Not Recorded 5.8% 4.6%
Total 100.0% 100.0%

Page 14
B5. All Joint Failures/Leaks by Cause
CAUSE% of All Joint Failures/Leaks
% of Joints Less DuPont & Uponor Failures/Leaks
Excessive Expansion/Contraction 3.5% 2.5%Excessive External Earth Loading 4.4% 3.3%Installation Error 46.6% 39.1%Squeeze Off 0.1% 0.2%Point Loading 2.3% 1.3%Previous Impact 0.5% 0.5%Unknown 14.5% 16.9%Other 5.4% 7.0%All Caps 0.0% 0.0%Not Recorded 5.7% 7.0%Material Defect 16.7% 21.9%Gopher/Rodent/Worm Damage 0.0% 0.0%Unknown - Not Excavated, Replaced 0.3% 0.2%Unknown - Abandoned 0.0% 0.0%Corrosion 0.1% 0.1%
Total 100.0% 100.0%

Page 15
B6. All Joint Failures/Leaks by Type
JOINT TYPE% of All Joints Failures/Leaks
% of Joints Less DuPont & Uponor Failures/Leaks
Butt fusion 16.2% 14.5%Electrofusion 4.7% 5.9%All Mechanical 36.9% 51.9%Saddle Fusion 9.7% 4.7%Socket Fusion 18.9% 9.8%Solvent 4.0% 5.8%Other 0.4% 0.5%Not Recorded 9.2% 7.0%
Total 100.0% 100.0%
Page 16
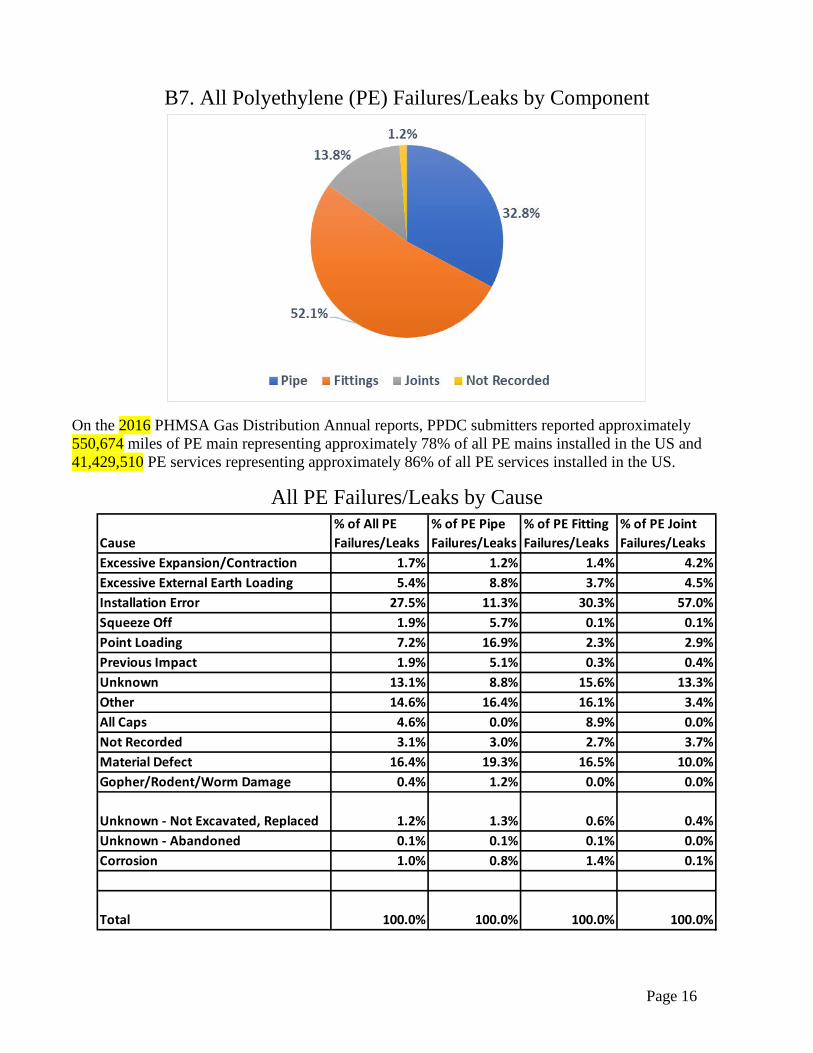
B7. All Polyethylene (PE) Failures/Leaks by Component
On the 2016 PHMSA Gas Distribution Annual reports, PPDC submitters reported approximately 550,674 miles of PE main representing approximately 78% of all PE mains installed in the US and 41,429,510 PE services representing approximately 86% of all PE services installed in the US.
All PE Failures/Leaks by Cause
Cause% of All PE Failures/Leaks
% of PE Pipe Failures/Leaks
% of PE Fitting Failures/Leaks
% of PE Joint Failures/Leaks
Excessive Expansion/Contraction 1.7% 1.2% 1.4% 4.2%Excessive External Earth Loading 5.4% 8.8% 3.7% 4.5%Installation Error 27.5% 11.3% 30.3% 57.0%Squeeze Off 1.9% 5.7% 0.1% 0.1%Point Loading 7.2% 16.9% 2.3% 2.9%Previous Impact 1.9% 5.1% 0.3% 0.4%Unknown 13.1% 8.8% 15.6% 13.3%Other 14.6% 16.4% 16.1% 3.4%All Caps 4.6% 0.0% 8.9% 0.0%Not Recorded 3.1% 3.0% 2.7% 3.7%Material Defect 16.4% 19.3% 16.5% 10.0%Gopher/Rodent/Worm Damage 0.4% 1.2% 0.0% 0.0%
Unknown - Not Excavated, Replaced 1.2% 1.3% 0.6% 0.4%Unknown - Abandoned 0.1% 0.1% 0.1% 0.0%Corrosion 1.0% 0.8% 1.4% 0.1%
Total 100.0% 100.0% 100.0% 100.0%

Page 17
B2. Acrylonitrile Butadiene Styrene (ABS) Failures/Leaks by Component
On the 2016 PHMSA Gas Distribution Annual reports, PPDC submitters reported approximately 174 miles of ABS main representing approximately 5% of all ABS mains installed in the US and approximately 55 ABS services representing approximately 2% of all ABS services installed in the US.
ABS Failures/Leaks by Cause
CAUSE% of All ABS Failures/Leaks
% of ABS Pipe Failures/Leaks
% of ABS Fitting Failures/Leaks
% of ABS Joint Failures/Leaks
Excessive Expansion/Contraction 1.1% 0.0% 1.8% 0.0%Excessive External Earth Loading 4.5% 15.4% 0.0% 14.3%Installation Error 19.3% 7.7% 16.4% 50.0%Squeeze Off 2.3% 15.4% 0.0% 0.0%Point Loading 0.0% 0.0% 0.0% 0.0%Previous Impact 0.0% 0.0% 0.0% 0.0%Unknown 27.3% 53.8% 25.5% 7.1%Other 1.1% 0.0% 1.8% 0.0%All Caps 6.8% 0.0% 10.9% 0.0%Not Recorded 15.9% 7.7% 14.5% 21.4%Material Defect 19.3% 0.0% 29.1% 7.1%Gopher/Rodent/Worm Damage 0.0% 0.0% 0.0% 0.0%Unknown - Not Excavated, Replaced 0.0% 0.0% 0.0% 0.0%Unknown - Abandoned 2.3% 0.0% 0.0% 0.0%Corrosion 0.0% 0.0% 0.0% 0.0%
Total 100.0% 100.0% 100.0% 100.0%

Page 18
Appendix C Century Data Analysis
August 2017 Background
Century Utility Products (Century) was identified by the NTSB Special Report12 and PHMSA advisory as a material susceptible to brittle-like cracking13. The objective of this appendix is to provide information from the Plastic Pipe Database Committee (PPDC) database about Century pipe, fittings and joints.
Methods
The information below reflects data collected by the PPDC. PPDC collects information voluntarily submitted by gas distribution pipeline operators on failures and/or leaks of metal or plastic appurtenances contained within plastic piping systems excluding third party damages. The PPDC Report Form provides for collection of information by manufacturer. More information about the PPDC can be found at https://www.aga.org/plastic-pipe-database-collection-committee
Results
Century represent less than 1% of all the reports in the database. The majority of the reported Century failures/leaks occur on pipe (55%). Other categories include fittings (32%), joints (12%) and not recorded (1%). The distribution of failures/leaks for pipe, fittings and joints by year installed is shown in Figure 1. The figure shows the majority of failures occurred on pipe installed from 1970 to 1974.
12 Brittle-Like Cracking in Plastic Pipe For Gas Service, NTSB Report No. NTSB/SIR-98/01, National Transportation Safety Board, Washington, D.C., April 1998. 13 DOT Advisory Bulletin ADB-07-01, Updated Notification of Susceptibility to Premature Brittle-Like Cracking of Older Plastic Pipe, Federal Register, Volume 72, Number 172, p. 51301; ADB-02-07, Notification of the Susceptibility to Premature Brittle-Like Cracking of Older Plastic Pipe, Federal Register, Volume 67, Number 228, p. 70806, November 26, 2002 and corrected Federal Register, Volume 67, Number 232, p. 72027, December 3, 2002; ADB-99-02, Potential Failures Due to Brittle-Like Cracking of Older Plastic Pipe in Natural Gas Distribution Systems, Federal Register, Volume 64, p. 1212; ADB-99-01, Potential Failure Due to Brittle-Like Cracking of Certain Polyethylene Plastic Pipe Manufactured by Century Utility Products Inc., Federal Register, Volume 64, p. 12211.

Page 19
Figure 1. Failures/Leaks by Years Installed as Reported to PPDC for Century Pipe, Fittings and Joints Figure 2 shows the failures/leaks by year of failure. The majority of the failures occurred prior to 2007; however, recently there have been additional reports submitted.
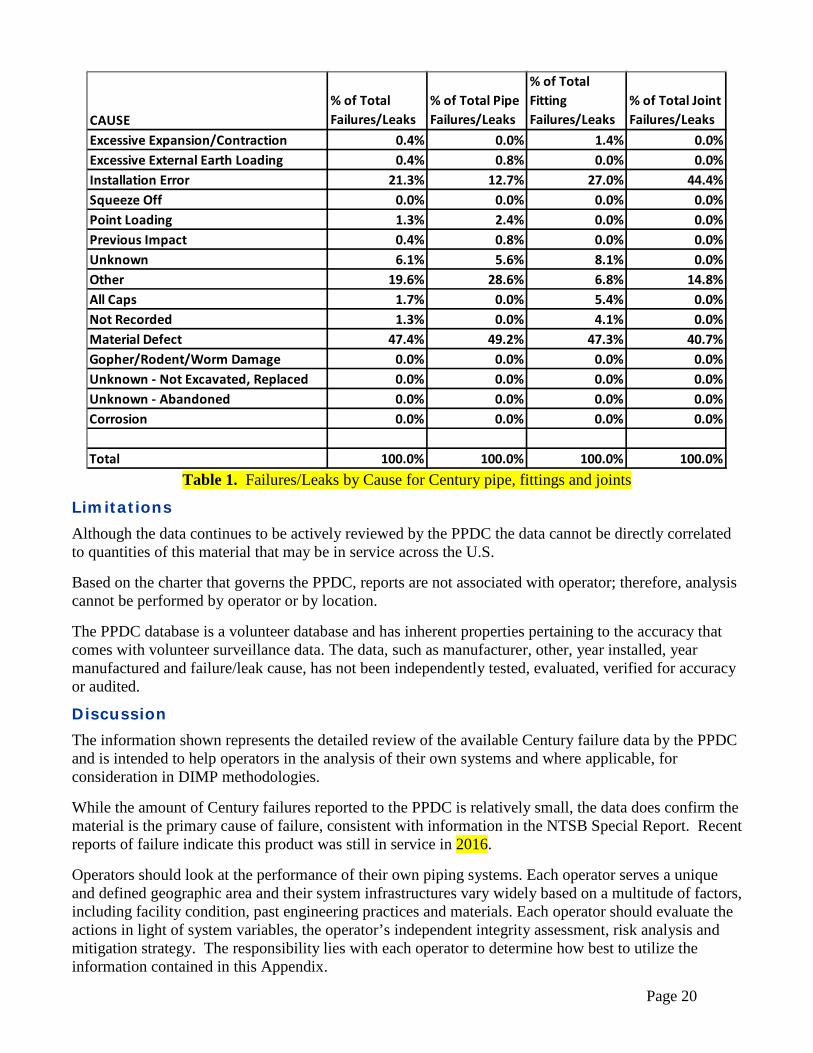
Figure 2. Failures/Leaks by Year of Failure as Reported to PPDC for Century Table 1 displays the percentages of failure/leak causes for Century including pipe, fittings and joints. The highest identified cause is material defect.
Page 20
Table 1. Failures/Leaks by Cause for Century pipe, fittings and joints
Limitations Although the data continues to be actively reviewed by the PPDC the data cannot be directly correlated to quantities of this material that may be in service across the U.S. Based on the charter that governs the PPDC, reports are not associated with operator; therefore, analysis cannot be performed by operator or by location. The PPDC database is a volunteer database and has inherent properties pertaining to the accuracy that comes with volunteer surveillance data. The data, such as manufacturer, other, year installed, year manufactured and failure/leak cause, has not been independently tested, evaluated, verified for accuracy or audited.
Discussion The information shown represents the detailed review of the available Century failure data by the PPDC and is intended to help operators in the analysis of their own systems and where applicable, for consideration in DIMP methodologies. While the amount of Century failures reported to the PPDC is relatively small, the data does confirm the material is the primary cause of failure, consistent with information in the NTSB Special Report. Recent reports of failure indicate this product was still in service in 2016. Operators should look at the performance of their own piping systems. Each operator serves a unique and defined geographic area and their system infrastructures vary widely based on a multitude of factors, including facility condition, past engineering practices and materials. Each operator should evaluate the actions in light of system variables, the operator’s independent integrity assessment, risk analysis and mitigation strategy. The responsibility lies with each operator to determine how best to utilize the information contained in this Appendix.
CAUSE% of Total Failures/Leaks
% of Total Pipe Failures/Leaks
% of Total Fitting Failures/Leaks
% of Total Joint Failures/Leaks
Excessive Expansion/Contraction 0.4% 0.0% 1.4% 0.0%Excessive External Earth Loading 0.4% 0.8% 0.0% 0.0%Installation Error 21.3% 12.7% 27.0% 44.4%Squeeze Off 0.0% 0.0% 0.0% 0.0%Point Loading 1.3% 2.4% 0.0% 0.0%Previous Impact 0.4% 0.8% 0.0% 0.0%Unknown 6.1% 5.6% 8.1% 0.0%Other 19.6% 28.6% 6.8% 14.8%All Caps 1.7% 0.0% 5.4% 0.0%Not Recorded 1.3% 0.0% 4.1% 0.0%Material Defect 47.4% 49.2% 47.3% 40.7%Gopher/Rodent/Worm Damage 0.0% 0.0% 0.0% 0.0%Unknown - Not Excavated, Replaced 0.0% 0.0% 0.0% 0.0%Unknown - Abandoned 0.0% 0.0% 0.0% 0.0%Corrosion 0.0% 0.0% 0.0% 0.0%
Total 100.0% 100.0% 100.0% 100.0%

Page 21
Appendix D Aldyl Data Analysis
April 2017 Background
The objective of this appendix is to provide information from the Plastic Pipe Database Committee (PPDC) database about Aldyl pipe and fittings manufactured by DuPont and Uponor.
Methods
The information below reflects data collected by the PPDC. PPDC collects information voluntarily submitted by gas distribution pipeline operators on failures and/or leaks of metal or plastic appurtenances contained within plastic piping systems excluding third party damages. More information about the PPDC can be found at https://www.aga.org/plastic-pipe-database-collection-committee. The PPDC Report Form provides for collection of information by manufacturer. Aldyl is a material trade name that was produced by DuPont and later Uponor. Therefore, the definition of “Aldyl” used for this analysis is the data reported as being manufactured by DuPont and Uponor.
Results
DuPont and Uponor represent approximately 38% of all the reports in the database. Figure 1 shows the failures/leaks by year of failure. As reflected in the graph, there has been a recent increase in data submitted to the database. The majority of the reported Aldyl failures/leaks occur on fittings (52%). Other categories include pipe (34%), joints (11%) and not recorded (3%).
Figure 1. Failures/Leaks by Year of Failure as reported to PPDC for Aldyl.

Page 22
Table 1 reflects an analysis of the two peaks from Figure 1, showing a change in fitting type failures from 2000-2005 compared to 2010-2016. Noting the increase in Cap-type failures, reference Appendix F for more detailed analysis on Caps.
Table 1: Fitting Types by Year Range of Failure
The distribution of the Years in Service of failures/leaks is similar for pipe, fittings and joints (Figure 2).
Figure 2. Failures/Leaks by Years in Service as reported to PPDC for Aldyl pipe, fittings and joints Figure 3 shows the failures/leaks by Year Installed. Although Figure 1 shows two data peaks, the year of installation range appears consistent.
Fitting Type
% of DuPont & Uponor Fitting Failures/Leaks Between 2000 and 2005
% of DuPont & Uponor Fitting Failures/Leaks Between 2010 and 2016
Cap 0.1% 63.2%Electrofusion 0.1% 0.5%Heat Fusion 28.5% 19.2%Mechanical Fitting 2.6% 4.2%Meter Riser 13.5% 4.6%Transition 16.0% 1.6%Valve (Plastic) 9.9% 1.0%Other 29.1% 0.4%Not Recorded 0.2% 5.2%
Total 100.0% 100.0%
Page 23
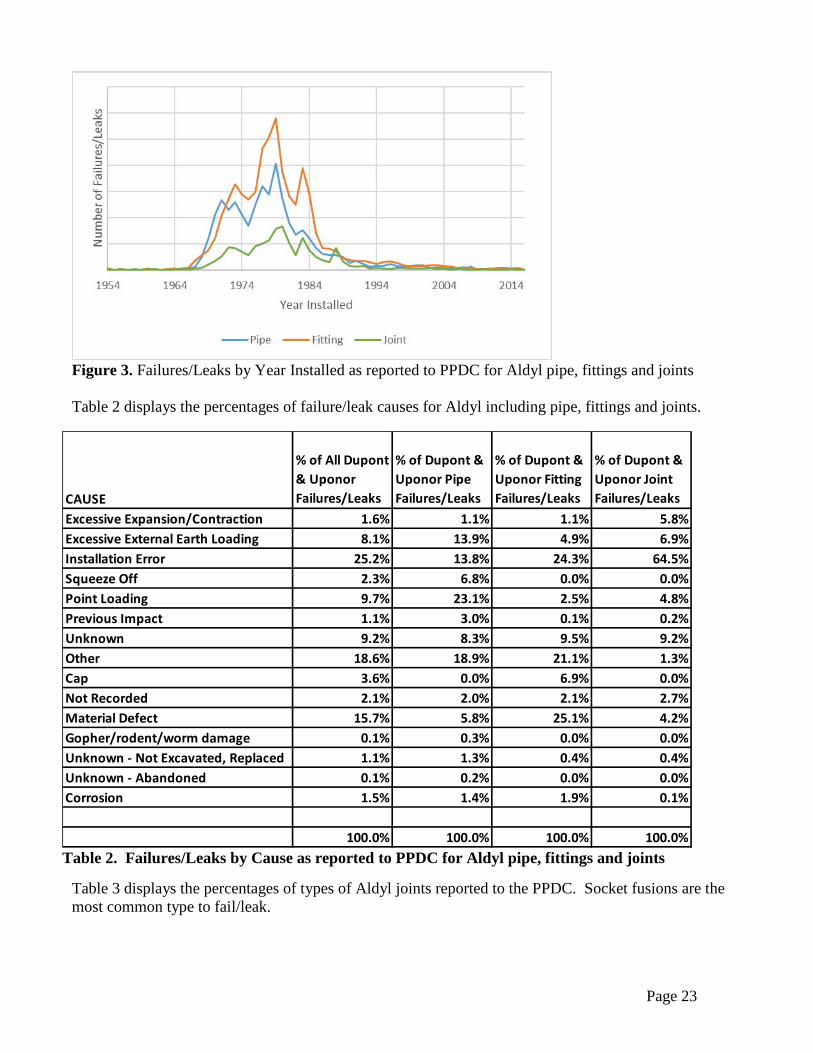
Figure 3. Failures/Leaks by Year Installed as reported to PPDC for Aldyl pipe, fittings and joints Table 2 displays the percentages of failure/leak causes for Aldyl including pipe, fittings and joints.
Table 2. Failures/Leaks by Cause as reported to PPDC for Aldyl pipe, fittings and joints
Table 3 displays the percentages of types of Aldyl joints reported to the PPDC. Socket fusions are the most common type to fail/leak.
CAUSE
% of All Dupont & Uponor Failures/Leaks
% of Dupont & Uponor Pipe Failures/Leaks
% of Dupont & Uponor Fitting Failures/Leaks
% of Dupont & Uponor Joint Failures/Leaks
Excessive Expansion/Contraction 1.6% 1.1% 1.1% 5.8%Excessive External Earth Loading 8.1% 13.9% 4.9% 6.9%Installation Error 25.2% 13.8% 24.3% 64.5%Squeeze Off 2.3% 6.8% 0.0% 0.0%Point Loading 9.7% 23.1% 2.5% 4.8%Previous Impact 1.1% 3.0% 0.1% 0.2%Unknown 9.2% 8.3% 9.5% 9.2%Other 18.6% 18.9% 21.1% 1.3%Cap 3.6% 0.0% 6.9% 0.0%Not Recorded 2.1% 2.0% 2.1% 2.7%Material Defect 15.7% 5.8% 25.1% 4.2%Gopher/rodent/worm damage 0.1% 0.3% 0.0% 0.0%Unknown - Not Excavated, Replaced 1.1% 1.3% 0.4% 0.4%Unknown - Abandoned 0.1% 0.2% 0.0% 0.0%Corrosion 1.5% 1.4% 1.9% 0.1%
100.0% 100.0% 100.0% 100.0%

Page 24
Table 3. Aldyl Joint Types failures/leaks as reported to PPDC
Limitations Although the data continues to be actively reviewed by the PPDC the data cannot be directly correlated to quantities of this material that may have been placed in service or may be in continued service across the U.S. Based on the charter that governs the PPDC, reports are not associated with operator; therefore, analysis cannot be performed by operator or by location. The PPDC database is a volunteer database and has inherent properties pertaining to the accuracy that come with volunteer surveillance data. The data, such as manufacturer, other, year installed, year manufactured and failure/leak cause, has not been independently tested, evaluated, verified for accuracy or audited. The PPDC Data Report Form does not request brand name, trade name or product name. The PPDC’s definition of Aldyl is broader than the product name of Aldyl A.
Discussion The information shown represents the detailed review of the available Aldyl failure data by the PPDC and is intended to help operators in the analysis of their own systems and where applicable, for consideration in DIMP methodologies. Aldyl failure data continues to be reported. Moreover, as depicted in Figure 1, there are now two peaks of failure data submissions (2000-2005, 2010-2016). Analysis has determined that the range of installation years for these peaks appears consistent. Therefore the installation years are more reflective of materials experiencing failures/leaks. Failure causes demonstrate that installation practices and the operating environment can greatly impact the service life of the Aldyl piping. Operators should look at the performance of their own piping systems. Each operator serves a unique and defined geographic area and their system infrastructures vary widely based on a multitude of factors, including facility condition, past engineering practices and materials. Each operator should evaluate the actions in light of system variables, the operator’s independent integrity assessment, risk analysis and mitigation strategy. The responsibility lies with each operator to determine how best to utilize the information contained in this Appendix.
JOINT
% of DuPont & Uponor Joint Failures/Leaks
Butt fusion 20.3%Electrofusion 2.0%Mechanical 3.5%Saddle Fusion 21.4%Socket Fusion 40.4%Solvent 0.0%Other 0.2%Not Recorded 12.1%
100.0%

Page 25
Appendix E PE 3306 Data Analysis
August 2017 Background
Polyethylene (PE) pipe manufactured from PE3306 resin was included in PHMSA advisories14 as one of the historically known materials susceptible to brittle-like cracking15. PE3306 resins include pipe manufactured by companies such as Swanson, Orangeburg and Yardley, starting in the 1950s and peaking in the 1970s. The objective of this appendix is to provide information from the Plastic Pipe Database Committee (PPDC) database about PE3306 pipe, fittings and joints.
Methods
The information below reflects data collected by the PPDC. PPDC collects information voluntarily submitted by gas distribution pipeline operators on failures and/or leaks of metal or plastic appurtenances contained within plastic piping systems excluding third party damages. The PPDC Report Form provides for collection of information by material. More information about the PPDC can be found at https://www.aga.org/plastic-pipe-database-collection-committee.
Results
PE3306 failures/leaks represent less than 1% of all the reports in the database. The majority of the reported failures occur on pipe (71%), other categories include fittings (19%), joints (10%) and not recorded (< 1%). Figure 1 shows the distribution of failures/leaks for pipe, fittings and joints by years in service and indicates an accelerated rate of failure for PE3306 in service for over 20 years.
14 DOT Advisory Bulletin ADB-07-01, Updated Notification of Susceptibility to Premature Brittle-Like Cracking of Older Plastic Pipe, Federal Register, Volume 72, Number 172, p. 51301; ADB-02-07, Notification of the Susceptibility to Premature Brittle-Like Cracking of Older Plastic Pipe, Federal Register, Volume 67, Number 228, p. 70806, November 26, 2002 and corrected Federal Register, Volume 67, Number 232, p. 72027, December 3, 2002; ADB-99-02, Potential Failures Due to Brittle-Like Cracking of Older Plastic Pipe in Natural Gas Distribution Systems, Federal Register, Volume 64, p. 1212; ADB-99-01, Potential Failure Due to Brittle-Like Cracking of Certain Polyethylene Plastic Pipe Manufactured by Century Utility Products Inc., Federal Register, Volume 64, p. 12211. 15 Brittle-Like Cracking in Plastic Pipe For Gas Service, NTSB Report No. NTSB/SIR-98/01, National Transportation Safety Board, Washington, D.C., April 1998.

Page 26
Figure 1. PE3306 Failures by Years in Service, 5 Year Intervals. Figure 2 shows the failures/leaks by year of failure. A significant portion of the failures occurred prior to 2008; however, recently there have been additional reports submitted. Of these failures that have occurred since 2010, the majority (91%) of the reported PE3306 failures/leaks are associated with service size piping (1” CTS in diameter or less).
Figure 2. Failures/Leaks by Year of Failure as Reported to PPDC for PE3306 Table 1 displays the percentages of failure/leak causes for PE3306 including pipe, fittings and joints. The highest identified failure causes are squeeze off for pipe, material defect for fittings, and installation error for joints.
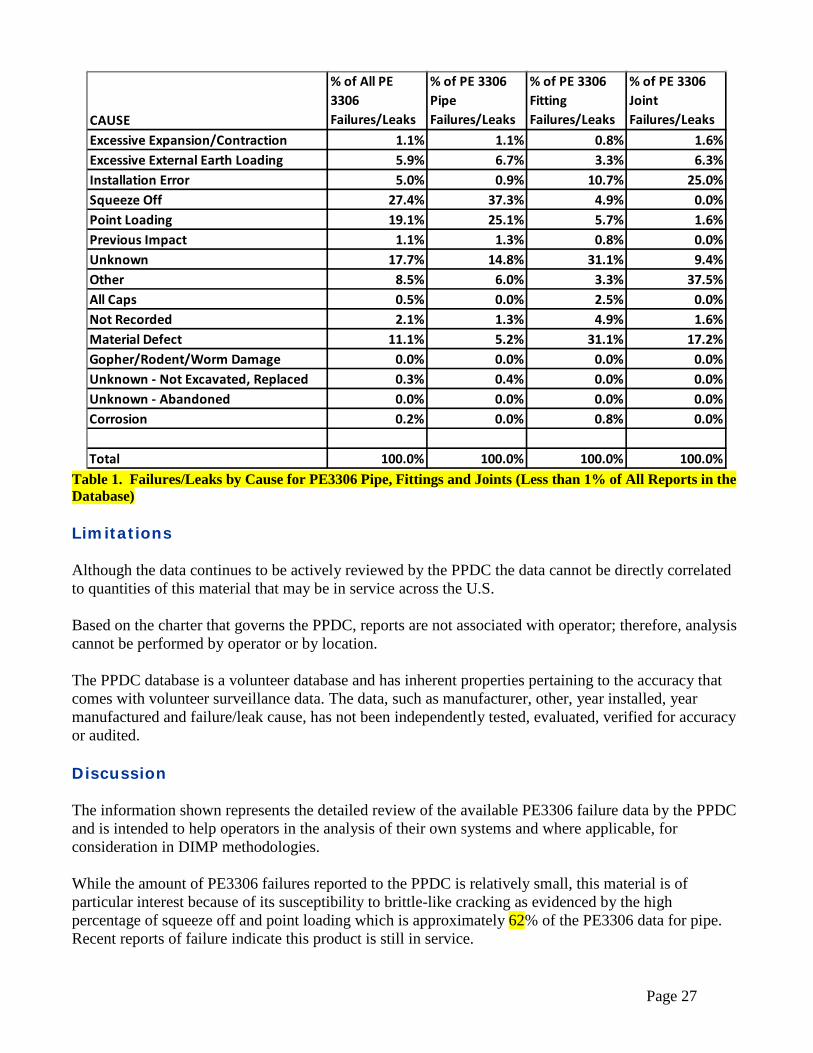
Page 27
Table 1. Failures/Leaks by Cause for PE3306 Pipe, Fittings and Joints (Less than 1% of All Reports in the Database)
Limitations
Although the data continues to be actively reviewed by the PPDC the data cannot be directly correlated to quantities of this material that may be in service across the U.S. Based on the charter that governs the PPDC, reports are not associated with operator; therefore, analysis cannot be performed by operator or by location. The PPDC database is a volunteer database and has inherent properties pertaining to the accuracy that comes with volunteer surveillance data. The data, such as manufacturer, other, year installed, year manufactured and failure/leak cause, has not been independently tested, evaluated, verified for accuracy or audited.
Discussion
The information shown represents the detailed review of the available PE3306 failure data by the PPDC and is intended to help operators in the analysis of their own systems and where applicable, for consideration in DIMP methodologies. While the amount of PE3306 failures reported to the PPDC is relatively small, this material is of particular interest because of its susceptibility to brittle-like cracking as evidenced by the high percentage of squeeze off and point loading which is approximately 62% of the PE3306 data for pipe. Recent reports of failure indicate this product is still in service.
CAUSE
% of All PE 3306 Failures/Leaks
% of PE 3306 Pipe Failures/Leaks
% of PE 3306 Fitting Failures/Leaks
% of PE 3306 Joint Failures/Leaks
Excessive Expansion/Contraction 1.1% 1.1% 0.8% 1.6%Excessive External Earth Loading 5.9% 6.7% 3.3% 6.3%Installation Error 5.0% 0.9% 10.7% 25.0%Squeeze Off 27.4% 37.3% 4.9% 0.0%Point Loading 19.1% 25.1% 5.7% 1.6%Previous Impact 1.1% 1.3% 0.8% 0.0%Unknown 17.7% 14.8% 31.1% 9.4%Other 8.5% 6.0% 3.3% 37.5%All Caps 0.5% 0.0% 2.5% 0.0%Not Recorded 2.1% 1.3% 4.9% 1.6%Material Defect 11.1% 5.2% 31.1% 17.2%Gopher/Rodent/Worm Damage 0.0% 0.0% 0.0% 0.0%Unknown - Not Excavated, Replaced 0.3% 0.4% 0.0% 0.0%Unknown - Abandoned 0.0% 0.0% 0.0% 0.0%Corrosion 0.2% 0.0% 0.8% 0.0%
Total 100.0% 100.0% 100.0% 100.0%

Page 28
Operators should look at the performance of their own piping systems. Each operator serves a unique and defined geographic area and their system infrastructures vary widely based on a multitude of factors, including facility condition, past engineering practices and materials. Each operator should evaluate the actions in light of system variables, the operator’s independent integrity assessment, risk analysis and mitigation strategy. The responsibility lies with each operator to determine how best to utilize the information contained in this Appendix.

Page 29
Appendix F Cap Data Analysis
August 2017 Background
In its Status Reports, the Plastic Pipe Database Committee (PPDC) has recognized the following two historically known issues:
• DuPont Aldyl® service tee with a white Delrin® polyacetal threaded insert • Plexco service tee with Celcon® polyacetal threaded cap
The objective of this appendix is to provide more detailed information from the PPDC database about these known cap issues, as well as caps from other manufacturers and materials for comparison. For purposes of this Appendix, ‘other manufacturers’ includes manufacturers other than DuPont and Plexco as well as reported failures/leaks from unspecified manufacturers.
Methods
The information below reflects data collected by the PPDC. PPDC collects information voluntarily submitted by gas distribution pipeline operators on failures and/or leaks of metal or plastic appurtenances contained within plastic piping systems excluding third party damages. The PPDC Report Form provides for collection of information by manufacturer. More information about the PPDC can be found at https://www.aga.org/plastic-pipe-database-collection-committee. Originally, cap was not listed as a type of fitting on the standard report form. In the process of reviewing historical data, the PPDC identified caps as an area of interest. In 2017, Threaded Cap was added to the report form as a type of fitting. Four new failure/leak causes specific to caps were also added.
Results
Caps represent approximately 20% of all reports in the database and 40% of all fitting failures. Figure 1 shows elevated reports of cap failures/leaks in recent years.
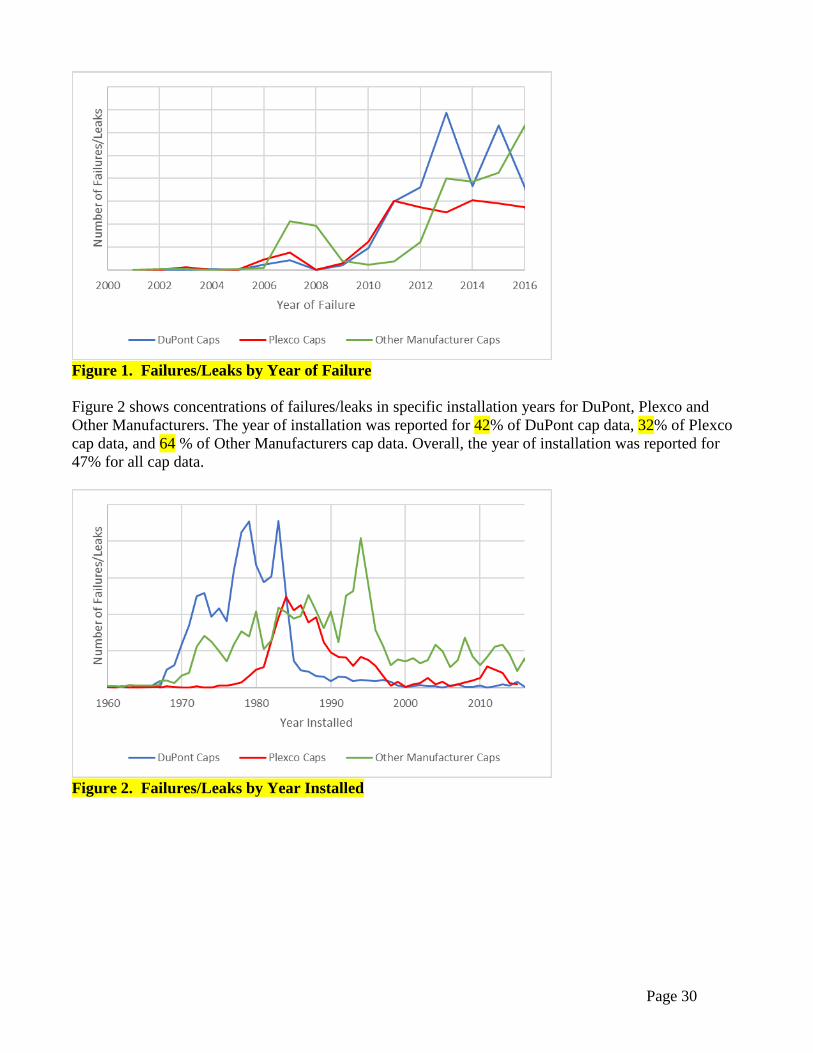
Page 30
Figure 1. Failures/Leaks by Year of Failure Figure 2 shows concentrations of failures/leaks in specific installation years for DuPont, Plexco and Other Manufacturers. The year of installation was reported for 42% of DuPont cap data, 32% of Plexco cap data, and 64 % of Other Manufacturers cap data. Overall, the year of installation was reported for 47% for all cap data.
Figure 2. Failures/Leaks by Year Installed

Page 31
Figure 3 shows the failure/leaks by years in service in 5 year intervals reflecting the performance over time.
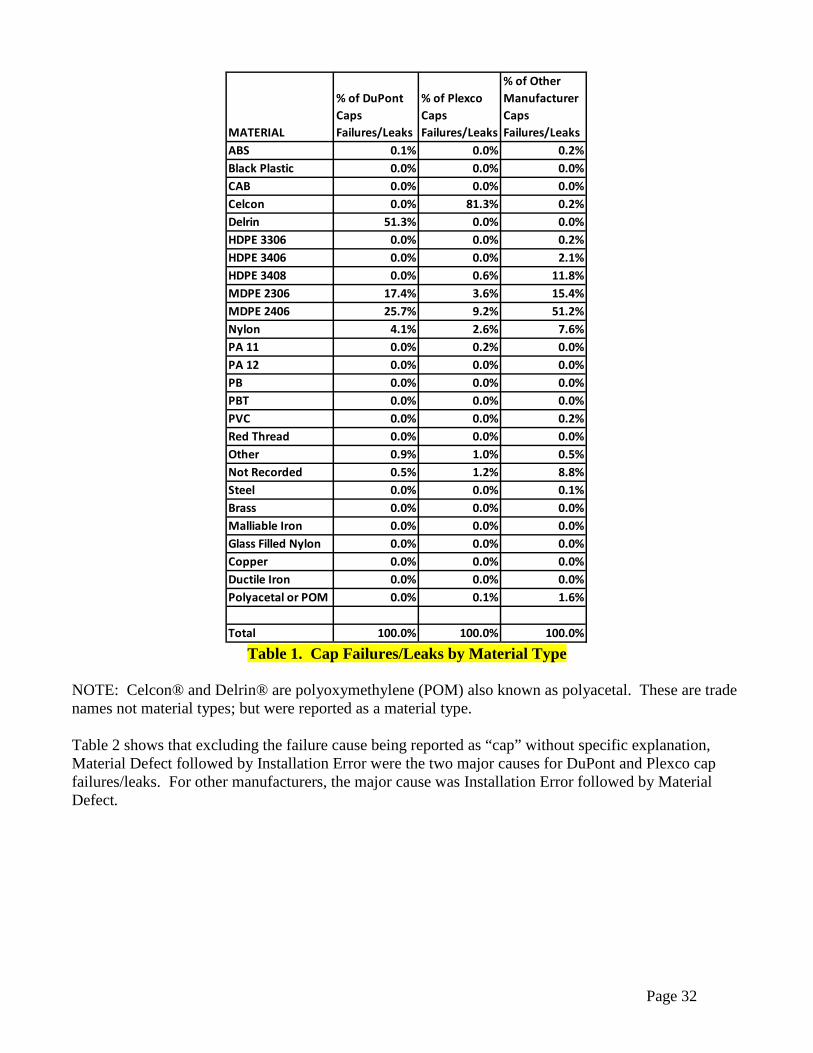
Figure 3. Failures/Leaks by Years in Service, 5 Year Intervals. Table 1 provides the distribution of reported material types for the cap failures/leaks. The majority of materials reported for DuPont and Plexco are reflective of the known issues.
Page 32
Table 1. Cap Failures/Leaks by Material Type
NOTE: Celcon® and Delrin® are polyoxymethylene (POM) also known as polyacetal. These are trade names not material types; but were reported as a material type. Table 2 shows that excluding the failure cause being reported as “cap” without specific explanation, Material Defect followed by Installation Error were the two major causes for DuPont and Plexco cap failures/leaks. For other manufacturers, the major cause was Installation Error followed by Material Defect.
MATERIAL
% of DuPont Caps Failures/Leaks
% of Plexco Caps Failures/Leaks
% of Other Manufacturer Caps Failures/Leaks
ABS 0.1% 0.0% 0.2%Black Plastic 0.0% 0.0% 0.0%CAB 0.0% 0.0% 0.0%Celcon 0.0% 81.3% 0.2%Delrin 51.3% 0.0% 0.0%HDPE 3306 0.0% 0.0% 0.2%HDPE 3406 0.0% 0.0% 2.1%HDPE 3408 0.0% 0.6% 11.8%MDPE 2306 17.4% 3.6% 15.4%MDPE 2406 25.7% 9.2% 51.2%Nylon 4.1% 2.6% 7.6%PA 11 0.0% 0.2% 0.0%PA 12 0.0% 0.0% 0.0%PB 0.0% 0.0% 0.0%PBT 0.0% 0.0% 0.0%PVC 0.0% 0.0% 0.2%Red Thread 0.0% 0.0% 0.0%Other 0.9% 1.0% 0.5%Not Recorded 0.5% 1.2% 8.8%Steel 0.0% 0.0% 0.1%Brass 0.0% 0.0% 0.0%Malliable Iron 0.0% 0.0% 0.0%Glass Filled Nylon 0.0% 0.0% 0.0%Copper 0.0% 0.0% 0.0%Ductile Iron 0.0% 0.0% 0.0%Polyacetal or POM 0.0% 0.1% 1.6%
Total 100.0% 100.0% 100.0%

Page 33
Table 2. Cap Failures/Leaks by Cause
Limitations
Although the data continues to be actively reviewed by the PPDC the data cannot be directly correlated to quantities of this material that may be in service across the U.S. Based on the charter that governs the PPDC, reports are not associated with operator; therefore, analysis cannot be performed by operator or by location. The PPDC database is a volunteer database and has inherent properties pertaining to the accuracy that comes with volunteer surveillance data. The data, such as manufacturer, other, year installed, year manufactured and failure/leak cause, etc., has not been independently tested, evaluated, verified for accuracy or audited.
Discussion
Cap failures/leaks reported to the PPDC are of particular interest due to known historical issues and have been included in a PHMSA Advisory Bulletin16. The fact that reported cap failures/leaks have been 16 DOT Advisory Bulletin ADB-07-01, Updated Notification of Susceptibility to Premature Brittle-Like Cracking of Older Plastic Pipe, Federal Register, Volume 72, Number 172, p. 51301; ADB-02-07, Notification of the Susceptibility to Premature Brittle-Like Cracking of Older Plastic Pipe, Federal Register, Volume 67, Number 228, p. 70806, November 26, 2002 and corrected Federal Register, Volume 67, Number 232, p. 72027, December 3, 2002; ADB-99-02, Potential Failures Due to Brittle-Like Cracking of Older Plastic Pipe in Natural Gas Distribution Systems, Federal Register, Volume 64, p. 1212; ADB-99-01, Potential Failure Due to Brittle-Like Cracking of Certain Polyethylene Plastic Pipe Manufactured by Century Utility Products Inc., Federal Register, Volume 64, p. 12211.
CAUSE
% of DuPont Caps Failures/Leaks
% of Plexco Caps Failures/Leaks
% of Other Manufacturer Caps Failures/Leaks
Excessive Expansion/Contraction 1.3% 0.5% 4.4%Excessive External Earth Loading 0.3% 0.7% 0.2%Installation Error 15.8% 4.1% 29.8%Squeeze Off 0.0% 0.0% 0.0%Point Loading 0.4% 0.3% 0.1%Previous Impact 0.0% 0.0% 0.0%Unknown 5.6% 3.6% 7.7%Other 5.7% 11.6% 3.3%All Caps* 16.5% 17.5% 30.9%Not Recorded 2.5% 2.6% 1.7%Material Defect 51.7% 59.0% 21.6%Gopher/Rodent/Worm Damage 0.0% 0.0% 0.0%Unknown - Not Excavated, Replaced 0.2% 0.0% 0.2%Unknown - Abandoned 0.0% 0.1% 0.1%Corrosion 0.0% 0.0% 0.0%
Total 100.0% 100.0% 100.0%* Cause listed only as "Cap."
Page 34
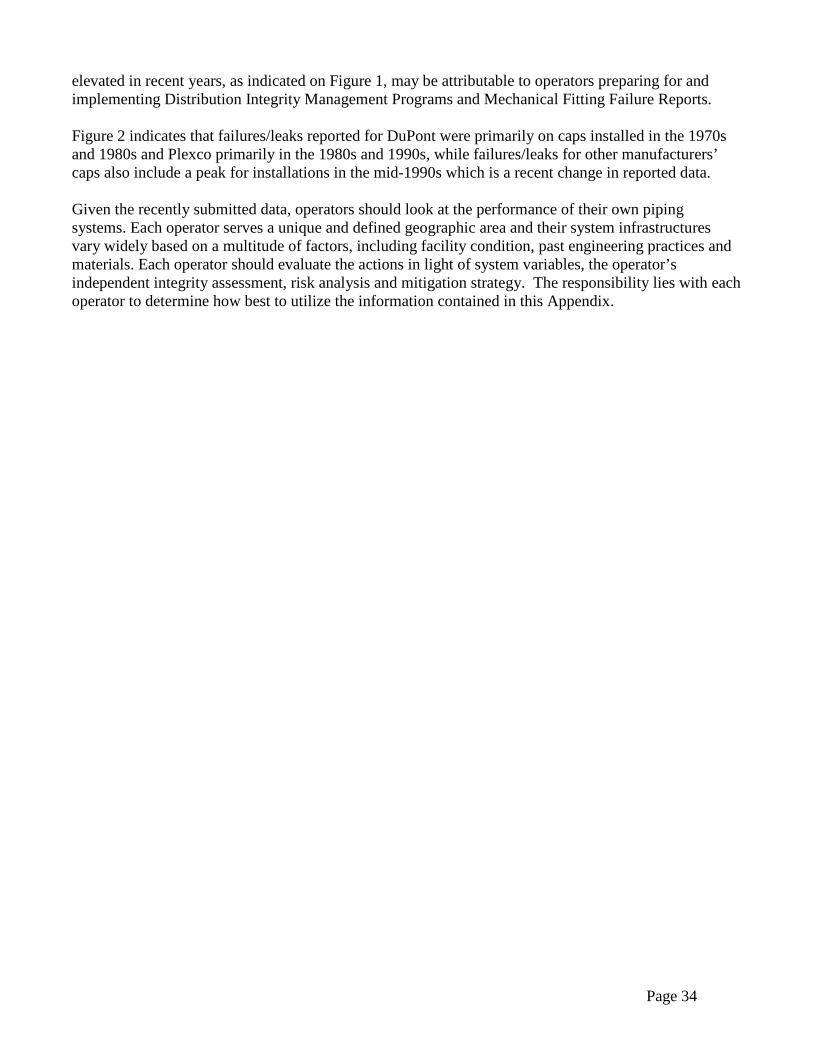
elevated in recent years, as indicated on Figure 1, may be attributable to operators preparing for and implementing Distribution Integrity Management Programs and Mechanical Fitting Failure Reports. Figure 2 indicates that failures/leaks reported for DuPont were primarily on caps installed in the 1970s and 1980s and Plexco primarily in the 1980s and 1990s, while failures/leaks for other manufacturers’ caps also include a peak for installations in the mid-1990s which is a recent change in reported data. Given the recently submitted data, operators should look at the performance of their own piping systems. Each operator serves a unique and defined geographic area and their system infrastructures vary widely based on a multitude of factors, including facility condition, past engineering practices and materials. Each operator should evaluate the actions in light of system variables, the operator’s independent integrity assessment, risk analysis and mitigation strategy. The responsibility lies with each operator to determine how best to utilize the information contained in this Appendix.

Page 35
Appendix G AMP Data Analysis
April 2017 Background
Fittings commonly known as AMP-FIT or AMP were manufactured in the 1970s and 1980s for use in natural gas distribution systems. These fittings were primarily used in natural gas service line applications and main line repairs. Rights to the manufacturing process and name of the fittings went through changes as they were sold to other manufacturers including Uponor in 1996.17 The objective of this appendix is to provide information from the Plastic Pipe Database Committee (PPDC) database about AMP fittings and joints.
Methods
The information below reflects data collected by the PPDC. PPDC collects information voluntarily submitted by gas distribution pipeline operators on failures and/or leaks of metal or plastic appurtenances contained within plastic piping systems excluding third party damages. The PPDC Report Form provides for collection of information by material. More information about the PPDC can be found at https://www.aga.org/plastic-pipe-database-collection-committee.
Results
AMP fittings represent approximately 2% of all the reports in the database. The majority of the data reported (89%) are fitting failures/leaks. Figure 1 shows AMP fitting failures/leaks by year installed, which depicts the majority being installed between 1970 and 1990.
17 Uponor in the US is now part of J M Eagle™.

Page 36
Figure 1. AMP Fitting Failures by Year Installed The distribution of failures/leaks for AMP fittings by years in service is shown in Figure 2.
Figure 2. AMP Fittings Failures by Years in Service, 5 year intervals. Figure 3 shows the failures/leaks by year of failure. The number of reported failures/leaks is variable across the years.

Page 37
Figure 3. Failures/Leaks by Year of Failure as reported to PPDC for AMP Fittings Table 1 displays the percentages of failure/leak causes for AMP. The highest reported failure causes are material defect and unknown (each 37% and 25%), followed by excessive external earth loading (17%). Although corrosion is reported as being only 0.5% of the data submitted; it should be noted corrosion is not a listed cause on the report form. Based on the expertise of the PPDC members, it is our opinion corrosion of the external steel compression rings may be a larger contributing factor than represented by the data submitted.
Table 1. Failures/Leaks by Cause for AMP
CAUSE% of Total AMP Failures/Leaks
Excessive Expansion/Contraction 3.8%Excessive External Earth Loading 16.6%Installation Error 12.6%Squeeze Off 0.0%Point Loading 1.0%Previous Impact 0.1%Unknown 24.6%Other 2.4%Cap 0.0%Not Recorded 1.8%Material Defect 36.7%Gopher/rodent/worm damage 0.0%Unknown - Not Excavated, Replaced 0.0%Unknown - Abandoned 0.0%Corrosion 0.5%
Total 100.0%
Page 38
Limitations
Although the data continues to be actively reviewed by the PPDC the data cannot be directly correlated to quantities of this material that may be in service across the U.S. Based on the charter that governs the PPDC, reports are not associated with operator; therefore, analysis cannot be performed by operator or by location. The PPDC database is a volunteer database and has inherent properties pertaining to the accuracy that comes with volunteer surveillance data. The data, such as manufacturer, other, year installed, year manufactured and failure/leak cause, has not been independently tested, evaluated, verified for accuracy or audited.
Discussion
The information shown represents the detailed review of the available AMP fittings failure/leak data by the PPDC and is intended to help operators in the analysis of their own systems and where applicable, for consideration in DIMP methodologies. Operators should look at the performance of their own piping systems. Each operator serves a unique and defined geographic area and their system infrastructures vary widely based on a multitude of factors, including facility condition, past engineering practices and materials. Each operator should evaluate the actions in light of system variables, the operator’s independent integrity assessment, risk analysis and mitigation strategy. The responsibility lies with each operator to determine how best to utilize the information contained in this Appendix.

Page 39
Appendix H PVC Data Analysis
April 2017 Background
Due to the evolution of piping materials and construction methods, the installation of new PVC pipe diminished significantly due to operator preferences after the mid-1980s. PVC is currently used only for repair purposes. According to data submitted to PHMSA on annual reports, mileage for PVC has been decreasing since 2000. Approximately 11,227 miles of main were reported in 2015. The objective of this appendix is to provide information from the Plastic Pipe Database Committee (PPDC) database about PVC pipe, fittings and joints.
Methods
The information below reflects data collected by the PPDC. PPDC collects information voluntarily submitted by gas distribution pipeline operators on failures and/or leaks of metal or plastic appurtenances contained within plastic piping systems excluding third party damages. The PPDC Report Form provides for collection of information by material. More information about the PPDC can be found at https://www.aga.org/plastic-pipe-database-collection-initiative/ppdc-forms.
Results
PVC represents approximately 3% of all the reports in the database. The majority of the reported failures occur on fittings (72%). Other categories include joints (24%), pipe (4%), and not recorded (0.1%). The distribution of failures/leaks for pipe, fittings and joints by years in service is shown in Figure 1.

Page 40
Figure 1. PVC Failures by Years in Service, 5 year intervals. Figure 2 shows the failures by year installed. This chart also demonstrates the lack of pipe installation after the mid-1980s.
Figure 2. PVC failures by Year Installed

Page 41
Figure 3 shows the failures/leaks by year of failure. The plot shows the increasing trend of failures of fittings and joints.
Figure 3. PVC Failures by Year of Failure Table 1 displays the percentages of failure/leak causes for PVC including pipe, fittings and joints. The highest failure causes for PVC fittings, which are the majority of failures, are material defect and installation error. The highest recorded failure cause for joints is installation error. The highest failure cause for pipe is point loading.
Table 1. Failures/Leaks by Cause for PVC pipe, fittings and joints
CAUSE% of All PVC Failures/Leaks
% of All PVC Pipe Failures/Leaks
% of All PVC Fitting Failures/Leaks
% of All PVC Joint Failures/Leaks
Excessive Expansion/Contraction 2.9% 2.8% 3.6% 0.7%Excessive External Earth Loading 8.4% 18.3% 7.2% 10.2%Installation Error 34.4% 7.0% 39.8% 22.9%Squeeze Off 0.2% 4.2% 0.0% 0.0%Point Loading 2.1% 36.6% 0.4% 1.4%Previous Impact 0.7% 4.2% 0.7% 0.2%Unknown 4.9% 5.6% 5.0% 4.4%Other 1.7% 0.0% 2.0% 1.2%Cap 0.4% 0.0% 0.5% 0.0%Not Recorded 10.5% 7.0% 0.5% 40.7%Material Defect 33.6% 11.3% 40.2% 18.1%Gopher/rodent/worm damage 0.0% 0.0% 0.0% 0.0%Unknown - Not Excavated, Replaced 0.2% 2.8% 0.1% 0.0%Unknown - Abandoned 0.0% 0.0% 0.0% 0.0%Corrosion 0.1% 0.0% 0.1% 0.2%
100.0% 100.0% 100.0% 100.0%

Page 42
Limitations
Although the data continues to be actively reviewed by the PPDC the data cannot be directly correlated to quantities of this material that may be in service across the U.S. Based on the charter that governs the PPDC, reports are not associated with operator; therefore, analysis cannot be performed by operator or by location. The PPDC database is a volunteer database and has inherent properties pertaining to the accuracy that comes with volunteer surveillance data. The data, such as manufacturer, other, year installed, year manufactured and failure/leak cause, has not been independently tested, evaluated, verified for accuracy or audited.
Discussion
The information shown represents the detailed review of the available PVC failure data by the PPDC and is intended to help operators in the analysis of their own systems and where applicable, for consideration in DIMP methodologies. The spike in fitting failures in Figure 2, between 2005 and 2011, are primarily attributed to material defect and occur between 0 and 5 years in service. Operators should look at the performance of their own piping systems. Each operator serves a unique and defined geographic area and their system infrastructures vary widely based on a multitude of factors, including facility condition, past engineering practices and materials. Each operator should evaluate the actions in light of system variables, the operator’s independent integrity assessment, risk analysis and mitigation strategy. The responsibility lies with each operator to determine how best to utilize the information contained in this Appendix.
Page 43
Appendix I Kerotest Data Analysis
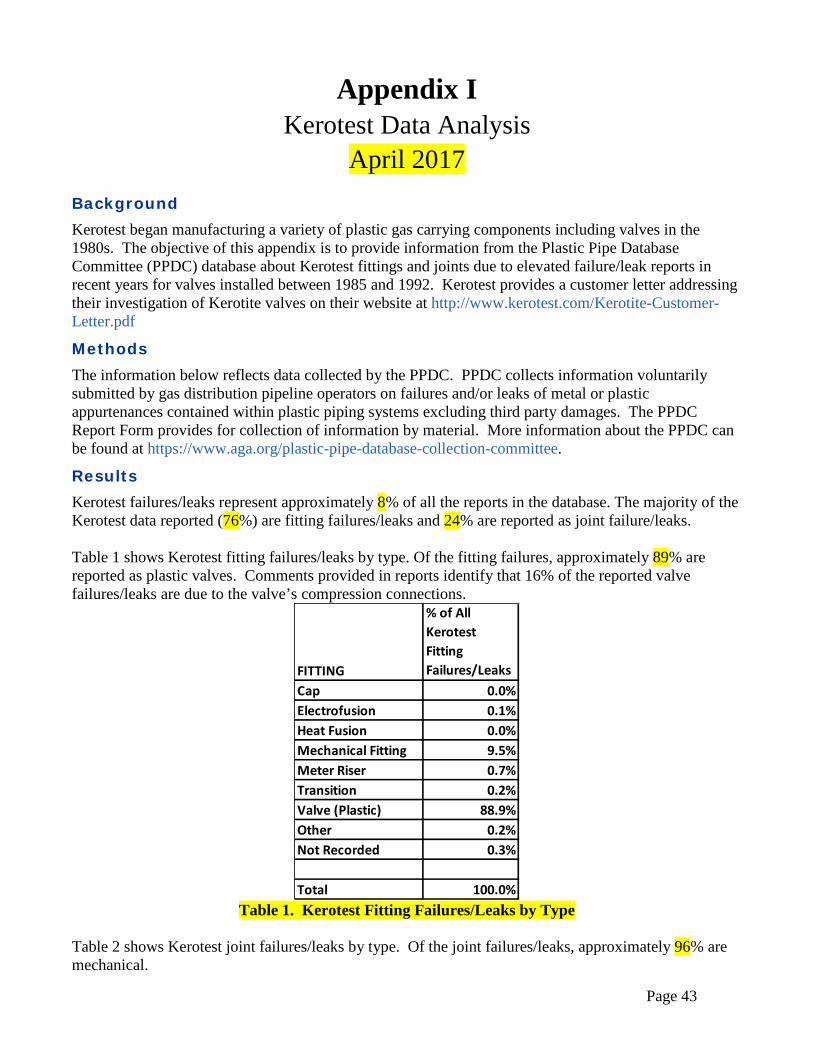
April 2017 Background Kerotest began manufacturing a variety of plastic gas carrying components including valves in the 1980s. The objective of this appendix is to provide information from the Plastic Pipe Database Committee (PPDC) database about Kerotest fittings and joints due to elevated failure/leak reports in recent years for valves installed between 1985 and 1992. Kerotest provides a customer letter addressing their investigation of Kerotite valves on their website at http://www.kerotest.com/Kerotite-Customer-Letter.pdf
Methods The information below reflects data collected by the PPDC. PPDC collects information voluntarily submitted by gas distribution pipeline operators on failures and/or leaks of metal or plastic appurtenances contained within plastic piping systems excluding third party damages. The PPDC Report Form provides for collection of information by material. More information about the PPDC can be found at https://www.aga.org/plastic-pipe-database-collection-committee.
Results Kerotest failures/leaks represent approximately 8% of all the reports in the database. The majority of the Kerotest data reported (76%) are fitting failures/leaks and 24% are reported as joint failure/leaks. Table 1 shows Kerotest fitting failures/leaks by type. Of the fitting failures, approximately 89% are reported as plastic valves. Comments provided in reports identify that 16% of the reported valve failures/leaks are due to the valve’s compression connections.
Table 1. Kerotest Fitting Failures/Leaks by Type
Table 2 shows Kerotest joint failures/leaks by type. Of the joint failures/leaks, approximately 96% are mechanical.
FITTING
% of All Kerotest Fitting Failures/Leaks
Cap 0.0%Electrofusion 0.1%Heat Fusion 0.0%Mechanical Fitting 9.5%Meter Riser 0.7%Transition 0.2%Valve (Plastic) 88.9%Other 0.2%Not Recorded 0.3%
Total 100.0%

Page 44
Table 2. Kerotest Joint Failures/Leaks by Type
Figure 1 shows Kerotest fittings and joint failures/leaks by year installed, which depicts the majority being installed between 1985 and 1992.
Figure 1. Kerotest Fitting and Joint Failures/Leaks by Year Installed. Figure 2 shows the Kerotest fitting and joint failures/leaks by year of failure/leak and shows elevated reports in recent years.
JOINT
% of All Kerotest Joint Failures/Leaks
Butt fusion 0.9%Electrofusion 0.7%Mechanical 97.8%Saddle Fusion 0.1%Socket Fusion 0.2%Solvent 0.0%Other 0.0%Not Recorded 0.3%
Total 100.0%

Page 45
Figure 2. Kerotest Fitting and Joint Failures/Leaks by Year of Failure/Leak Table 3 displays the percentages of failure/leak causes for Kerotest.
Table 3. Failures/Leaks by Cause for Kerotest
CAUSE% of All Kerotest Failures/Leaks
% of Kerotest Fitting Failures/Leaks
% of Kerotest Joint Failures/Leaks
Excessive Expansion/Contraction 3.3% 3.6% 2.5%Excessive External Earth Loading 1.3% 1.0% 2.4%Installation Error 5.1% 5.4% 4.3%Squeeze Off 0.2% 0.3% 0.1%Point Loading 0.0% 0.1% 0.0%Previous Impact 0.0% 0.1% 0.0%Unknown 38.3% 42.3% 26.5%Other 8.3% 8.7% 7.3%All Caps 0.1% 0.1% 0.0%Not Recorded 1.8% 1.4% 3.0%Material Defect 41.0% 36.7% 53.8%Gopher/Rodent/Worm Damage 0.0% 0.0% 0.0%Unknown - Not Excavated, Replaced 0.2% 0.3% 0.1%Unknown - Abandoned 0.0% 0.0% 0.1%Corrosion 0.1% 0.1% 0.0%
Total 100.0% 100.0% 100.0%
Page 46
Limitations
Although the data continues to be actively reviewed by the PPDC the data cannot be directly correlated to quantities of this material that may be in service across the U.S. Based on the charter that governs the PPDC, reports are not associated with operator; therefore, analysis cannot be performed by operator or by location. The PPDC database is a volunteer database and has inherent properties pertaining to the accuracy that come with volunteer surveillance data. The data, such as manufacturer, other, year installed, year manufactured and failure/leak cause, has not been independently tested, evaluated, verified for accuracy or audited.
Discussion
The information shown represents the detailed review of the available Kerotest failure/leak data by the PPDC and is intended to help operators in the analysis of their own systems and where applicable, for consideration in DIMP methodologies. Operators should look at the performance of their own piping systems. Each operator serves a unique and defined geographic area and their system infrastructures vary widely based on a multitude of factors, including facility condition, past engineering practices and materials. Each operator should evaluate the actions in light of system variables, the operator’s independent integrity assessment, risk analysis and mitigation strategy. The responsibility lies with each operator to determine how best to utilize the information contained in this Appendix.
Page 47
Appendix J Driscopipe® High Density Polyethylene (HDPE) Pipe Data
Analysis August 2017
Background Driscopipe® 7000 HDPE pipe was sold from approximately 1973 through 1980 and Driscopipe 8000 HDPE pipe was sold from late 1979 through 2000 by Phillips Products Company, a subsidiary of Phillips Chemical Company which was later called Phillips Driscopipe, Inc. The pipes were produced from Marlex® M-7000 and M-8000 compounded black resins produced by Phillips Chemical Company. The manufacturer worked with operators and identified two product concerns with Driscopipe HDPE pipe. One concern related to both Phillips Driscopipe 7000 and 8000 pipe is degradation in high temperature applications. Information about this is available on the manufacturer’s website at http://www.performancepipe.com/en-us/Documents/DriscopipeDegradation.pdf. In March 2012 this concern was highlighted through PHMSA Advisory Bulletin ADB-2012-03 http://www.phmsa.dot.gov/staticfiles/PHMSA/DownloadableFiles/Pipeline/Regulations/AdvisoryBulletins/DriscoPipe%20ADB-12-03.pdf . The second concern is related to plastic contamination known to have occurred in Phillips Driscopipe 8000 pipes. Information about this is available on the manufacturer’s website at http://www.performancepipe.com/en-us/Documents/DriscopipeContamination.pdf. The objective of this appendix is to provide information from the Plastic Pipe Database Committee (PPDC) about Driscopipe HDPE pipe manufactured by Phillips Driscopipe.
Methods The information below reflects data collected by the PPDC. PPDC collects information voluntarily submitted by gas distribution pipeline operators on failures and/or leaks of metal or plastic appurtenances contained within plastic piping systems excluding third party damages. The PPDC Report Form provides for collection of information by material. More information about the PPDC can be found at https://www.aga.org/plastic-pipe-database-collection-committee The PPDC Report Form provides for collection of information by Manufacturer. Driscopipe is a registered trade mark for pipe produced by Phillips Driscopipe. This analysis was limited to Phillips Driscopipe HDPE data which includes Phillips Driscopipe 7000 and 8000 pipes.
Results Phillips Driscopipe HDPE represents approximately 5% of all the reports in the database. The majority of the Phillips Driscopipe data reported 81% are pipe failures/leaks. Figure 1 shows Phillips Driscopipe HDPE failures/leaks by year installed.

Page 48
Figure 1. Phillips Driscopipe HDPE Failures/Leaks by Year Installed Figure 2 shows Philips Driscopipe HDPE failures/leaks by year of failure. Following the various notifications in 2012, there was an immediate increase in reports to the PPDC.
Figure 2. Phillips Driscopipe HDPE Failures/Leaks by Year of Failure. Table 1 shows Phillips Driscopipe HDPE failures/leaks by material type.
Page 49
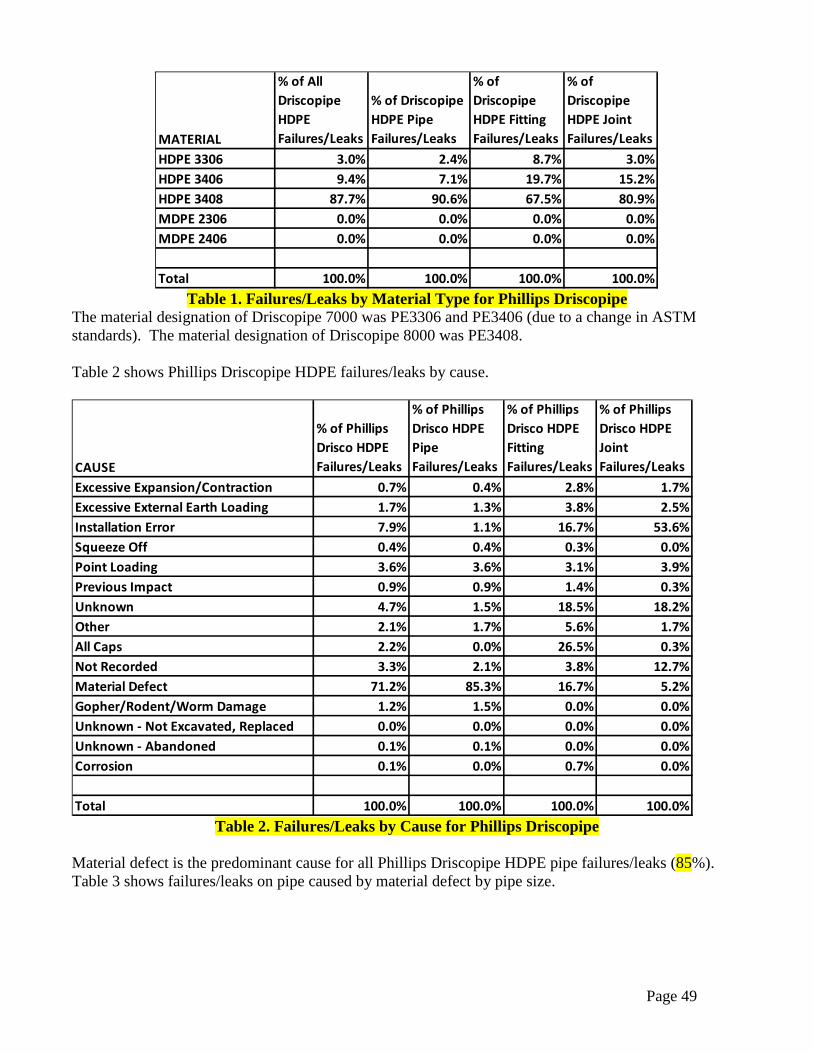
Table 1. Failures/Leaks by Material Type for Phillips Driscopipe
The material designation of Driscopipe 7000 was PE3306 and PE3406 (due to a change in ASTM standards). The material designation of Driscopipe 8000 was PE3408. Table 2 shows Phillips Driscopipe HDPE failures/leaks by cause.
Table 2. Failures/Leaks by Cause for Phillips Driscopipe
Material defect is the predominant cause for all Phillips Driscopipe HDPE pipe failures/leaks (85%). Table 3 shows failures/leaks on pipe caused by material defect by pipe size.
MATERIAL
% of All Driscopipe HDPE Failures/Leaks
% of Driscopipe HDPE Pipe Failures/Leaks
% of Driscopipe HDPE Fitting Failures/Leaks
% of Driscopipe HDPE Joint Failures/Leaks
HDPE 3306 3.0% 2.4% 8.7% 3.0%HDPE 3406 9.4% 7.1% 19.7% 15.2%HDPE 3408 87.7% 90.6% 67.5% 80.9%MDPE 2306 0.0% 0.0% 0.0% 0.0%MDPE 2406 0.0% 0.0% 0.0% 0.0%
Total 100.0% 100.0% 100.0% 100.0%
CAUSE
% of Phillips Drisco HDPE Failures/Leaks
% of Phillips Drisco HDPE Pipe Failures/Leaks
% of Phillips Drisco HDPE Fitting Failures/Leaks
% of Phillips Drisco HDPE Joint Failures/Leaks
Excessive Expansion/Contraction 0.7% 0.4% 2.8% 1.7%Excessive External Earth Loading 1.7% 1.3% 3.8% 2.5%Installation Error 7.9% 1.1% 16.7% 53.6%Squeeze Off 0.4% 0.4% 0.3% 0.0%Point Loading 3.6% 3.6% 3.1% 3.9%Previous Impact 0.9% 0.9% 1.4% 0.3%Unknown 4.7% 1.5% 18.5% 18.2%Other 2.1% 1.7% 5.6% 1.7%All Caps 2.2% 0.0% 26.5% 0.3%Not Recorded 3.3% 2.1% 3.8% 12.7%Material Defect 71.2% 85.3% 16.7% 5.2%Gopher/Rodent/Worm Damage 1.2% 1.5% 0.0% 0.0%Unknown - Not Excavated, Replaced 0.0% 0.0% 0.0% 0.0%Unknown - Abandoned 0.1% 0.1% 0.0% 0.0%Corrosion 0.1% 0.0% 0.7% 0.0%
Total 100.0% 100.0% 100.0% 100.0%

Page 50
Table 3. Failures/Leaks on Phillips Driscopipe PE pipe Caused by Material Defect by Pipe Size
Limitations
Although the data continues to be actively reviewed by the PPDC the data cannot be directly correlated to quantities of this material that may be in service across the U.S. Based on the charter that governs the PPDC, reports are not associated with operator; therefore, analysis cannot be performed by operator or by location. The PPDC database is a volunteer database and has inherent properties pertaining to the accuracy that comes with volunteer surveillance data. The data, such as manufacturer, other, year installed, year manufactured and failure/leak cause, has not been independently tested, evaluated, verified for accuracy or audited.
Discussion
The information shown represents the detailed review of the available Phillips Driscopipe HDPE failure/leak data by the PPDC and is intended to help operators in the analysis of their own systems and where applicable, for consideration in DIMP methodologies. Operators should look at the performance of their own piping systems. Each operator serves a unique and defined geographic area and their system infrastructures vary widely based on a multitude of factors, including facility condition, past engineering practices and materials. Each operator should evaluate the actions in light of system variables, the operator’s independent integrity assessment, risk analysis and mitigation strategy. The responsibility lies with each operator to determine how best to utilize the information contained in this Appendix.
Size(Inches)
% of Phillips Driscopipe HDPE Pipe Failures/Leaks
1/2 31.9% 3/4 0.4%
1 8.1%1 1/4 4.0%
2 53.0%4 2.5%6 0.1%
Total 100.0%

Page 51
Appendix K Questions from Stakeholder Groups about the PPDC and
PPDC Data The following questions and responses were reviewed by the PPDC at their April 2017 meeting. Question from APGA member: Given the safety advisory notice from the Tennessee Regulatory Authority from March 30th 2017 regarding electrofusion burn-throughs, does the PPDC have any data indicating this is a wider trend? Response from PPDC: Electrofusion failures/leaks represent 0.01% of the total database (as of April 2017). The PPDC report form does not specifically identify burn-through as a cause of failure. A review of the individual failure report comments did not identify any specific references to burn-through. The following questions and responses were reviewed by the PPDC at their August 2016 meeting. Question from AGA member: Is the industry seeing any trends regarding Permasert® coupling failures and, if so, is there concrete evidence? What is the general consensus on this product? Is it a product that has a finite life and at a certain time, it begins to fail? Is there a reason (with concrete evidence) to stop using these? Response from PPDC: The PPDC collects data by manufacturer (Perfection) not by brand (Permasert). The fitting types are collected as mechanical fittings and are not broken down further. Additional data on stab type mechanical fittings is available in the PHMSA Mechanical Fitting Failure Report database. http://phmsa.dot.gov/portal/site/PHMSA/menuitem.6f23687cf7b00b0f22e4c6962d9c8789/?vgnextoid=06cc95f181584410VgnVCM100000d2c97898RCRD&vgnextchannel=3430fb649a2dc110VgnVCM1000009ed07898RCRD&vgnextfmt=print . In looking at comments submitted to the database, there were few references to Permasert within the Perfection data. The following questions and responses were reviewed by the PPDC at their March 2016 meeting. Question from PPI: What does the PPDC database show for failures/leaks on socket heat fusion joints? Are there specific trends? Response from the PPDC: Socket fusions are a type of joint on the failure report form. Socket fusions represent 3% of all data submitted to the PPDC, with 59% of this 3% caused by installation error. There does not appear to be any increase or decrease in the number of reports by Year of Failure/Leak. The table shows distribution of socket fusion failures/leaks by size.
Size of Socket Fusion Joint Percentage 1/2 to 1 1/4" 72% 2" 20% >2" 8%
The following questions and responses were reviewed by the PPDC at their December 2015 meeting. Question from ASTM F17.20: What does the PPDC database show for failures/leaks on sidewall heat fusion joints? Are there specific trends relating to preparation of the joint?

Page 52
Response from the PPDC: Saddle fusions are a type of joint on the failure report form. Saddle fusions represent 1.4% of all data submitted to the PPDC. 63.5% of these failures/leaks were caused by installation error. The majority were installed prior to 1985. Limited information, with regard to specific aspects of the installation error, was reported. Approximately 90% of the saddle fusion failures/leaks were on piping 3” and under. The following questions and responses were reviewed by the PPDC at their March 2015 meeting. Question from NAPSR: What does the PPDC database show for Handley curb valves? Is there any trend in data since 2007? Are they still being manufactured? Response from the PPDC: Handley represents less than 0.1% of the data submitted to the PPDC. The data does indicate an increasing trend of failures/leaks since 2007. Due to the small amount of data submitted, we suggest NAPSR encourage operators who have Handley curb valves in their plastic piping systems to submit data. Handley is not currently listed in the manufacturer database available on the PPDC website. However, Handley has a currently active website; and produces natural gas carrying components. Question from AGA: Should Aldyl A and Century failure data still be submitted? Response from the PPDC: Yes, additional data points support additional analysis. The following question and response was reviewed by the PPDC at their March 2014 meeting. Question from APGA: Regarding Rockwell valves, is there a common cause for reports submitted to the PPDC? What about the involved component; pipe, fitting or joint? Are there any trends for installation dates? And are there any rising trends for any of the reported data? Response from the PPDC: Rockwell represents less than ¼ of 1% of the data submitted to the PPDC. Most of the Rockwell reports were for valves. Installations between 1981 and 1990 show the highest reported failures/leaks. While the trend of failures/leaks reported was going upward through 2010, since then, failures/leaks reported appear to be declining. Unfortunately, the majority of the reported causes were listed as unknown or left blank. However, causes reported include material defects, excessive earth loading and installation error. The following question and response was reviewed by the PPDC at their December 2013 meeting. Question from PHMSA: Is there a way to normalize the data? Can the number of data points be released? Is there a way to show data by state or geographical region? Response from the PPDC: Although the data continues to be actively reviewed by the PPDC the data cannot be directly correlated to quantities of this material that may be in service across the U.S. Based on the charter that governs the PPDC, the exact number of reports in the database cannot be released; only percentages of amounts can be released. Reports in the database are not associated with any operator information; therefore, analysis cannot be performed by operator or by geographic location. The following question and response was reviewed by the PPDC at their July 2013 meeting. Question from PHMSA: What does the PPDC data reflect regarding failures due to squeeze-off? For all plastic pipe? For plastic that has been known to be susceptible to brittle-like cracking? For pipe installed through the early 1980s? Are there any trends of squeeze-off failures over time for the any/all of the categories above?

Page 53
Response from the PPDC: Squeeze off represents approximately 2 % of all the data submitted. When considering pipe only, squeeze off represents approximately 6%. Failures/Leaks due to squeeze off for certain pipe materials known to be susceptible to brittle-like cracking ( Century, Aldyl A and PE3306) are included in other appendices in this status report. For pipe installed prior to and including 1983, squeeze offs represent approximately 9% of all data reported. Failures/leaks due to squeeze offs are trending down in all categories requested. The following questions and responses were reviewed by the PPDC at their March 2013 meeting. Question from Puget Sound Energy: We have a copy of the PPDC Status Report Appendix D which analyzes all Aldyl product but are interested in obtaining data for Aldyl High Density (HD). Does the PPDC have a report available that trends just Aldyl HD failures/leaks? If not, can we request the PPDC to generate a report for Aldyl HD? Response from the PPDC: No, the PPDC has not produced a separate report on DuPont & Uponor HD. The reports submitted to the PPDC containing DuPont & Uponor HD represent only 1.5% of all the data in the database. The distribution of failures/leaks for years in service for DuPont & Uponor HD is similar to the information contained in Figure 1 of the DuPont & Uponor appendix. The following questions and responses were reviewed by the PPDC at their December 2012 meeting. Question from PHMSA: Interactive threat events are often a combination of individual low frequency events that can culminate into a high consequence event. Does the PPDC collect data and perform analysis based on interactive threats, consequences and regional trends? Response from the PPDC: The reports submitted to the PPDC attribute cause to individual factors. The PPDC does not collect data on consequences or regional information. The PPDC committee looks at broad national trends. Other sections of this PPDC Status Report address possible contributing factors, reported causes, and collective perspective of the PPDC committee members. The following questions and responses were reviewed by the PPDC at their August 2012 meeting. Question from PMC PPDC Feedback Task Group: What does the PPDC data reflect regarding the 5 known concerns? How large a percentage of the data do they represent? Response from PPDC: Century Utility Products polyethylene (PE) pipe produced from 1970 through 1974 represents less than 1% of the data. DuPont Aldyl® A low ductile inner wall PE pipe manufactured from 1970 through 1972 represents 1.5% of the data; the PPDC database contains a small amount of data on year manufactured. However, DuPont and Uponor installed between 1970 and 1973, represent 4% of the data. PE pipe manufactured from PE 3306 resin such as Swanson, Orangeburg and Yardley represents 1% of the data. DuPont Aldyl® service punch tee with a white Delrin® polyacetal threaded insert; This is not listed as a distinct type of fitting on the PPDC report form. However, Delrin has been reported as a type of material. Plexco service tee with Celcon® polyacetal cap; This is not listed as a distinct type of fitting on the PPDC report form. However, Celcon has been reported as a type of material. Question from the PMC PPDC Feedback Task Group: Is there a way to generally say how much PE is Aldyl A? Response from the PPDC: Aldyl represents approximately 62 % of the PE reports in the database. The definition of “Aldyl” used for PPDC data analysis is the data reported as being manufactured by DuPont and Uponor. For additional information about Aldyl, see Appendix E.

Page 54
The following questions and responses were reviewed by the PPDC at their April 2012 meeting. Question from PHMSA: What does the PPDC data reflect with respect to lightning strikes? Response from PPDC: Lightning strikes listed as the cause of the failures/leaks account for ½ of 1% of the data and no trend is indicated. Question from PHMSA: Do static discharge failures appear in the database? Response from PPDC: Yes, static discharge failures/leaks account for less than ½ of 1% of the data and no trend is indicated. Question from PHMSA: Combination of lightning strikes and static discharge? Response from PPDC: Lightning strikes and static discharge failures/leaks account for less than ½ of 1% of the data and no trend is indicated. Question from PHMSA: Are there failures of Performance Pipe bolt on service tees with nylon bolts, metal bolts or other failure causes? Response from PPDC: Performance Pipe did not produce bolt on service tees. Please note the PPDC report form (click here to access a copy of the report form) and clarify the question. Note that bolt-on tees are not listed as a distinct type of fitting on the PPDC report form. Question from PHMSA: Is there an increase in failure numbers compared to earlier data on medium density 2306 materials? Response from PPDC: The number of failures/leaks seems to be decreasing; however, failure reports are still being submitted for this type of plastic. Question from PHMSA: Is there an increase in failure numbers compared to earlier data on pipe and fittings manufactured by DuPont? Response from PPDC: The number of failures/leaks seems to be decreasing; however, failure reports are still being submitted indicating this manufacturer. Question from PHMSA: Is there an increase in failure numbers compared to earlier data on Driscopipe® 8000 pipe? Response from PPDC: This is a high density pipe. High Density pipe failures/leaks are less than ½ of 1% of the data and no trend in indicated. Question from PHMSA: Do socket fusion failures appear in the database? Response from PPDC: Yes, socket fusions are a type of joint. 3% of all failures are socket fusions and of those 60% are known to be ½” to 1” CTS size.

Page 55
Appendix L Revised March 2016
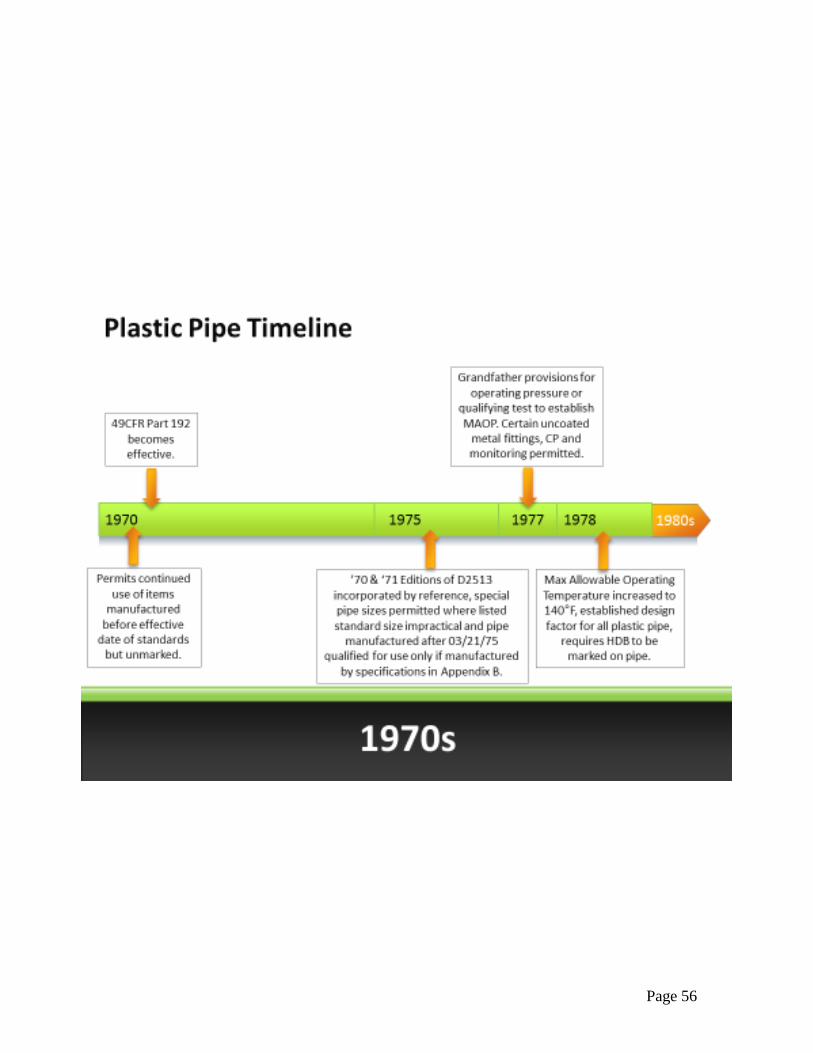
Page 56

Page 57
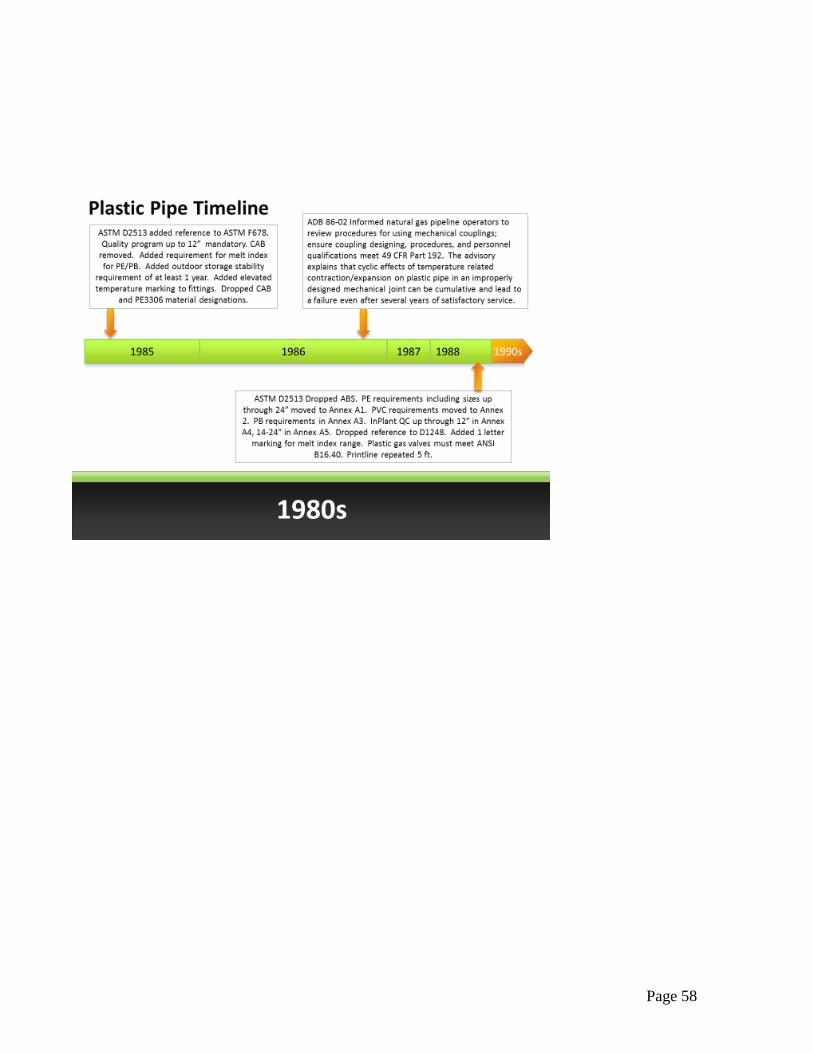
Page 58

Page 59

Page 60

Page 61

Page 62
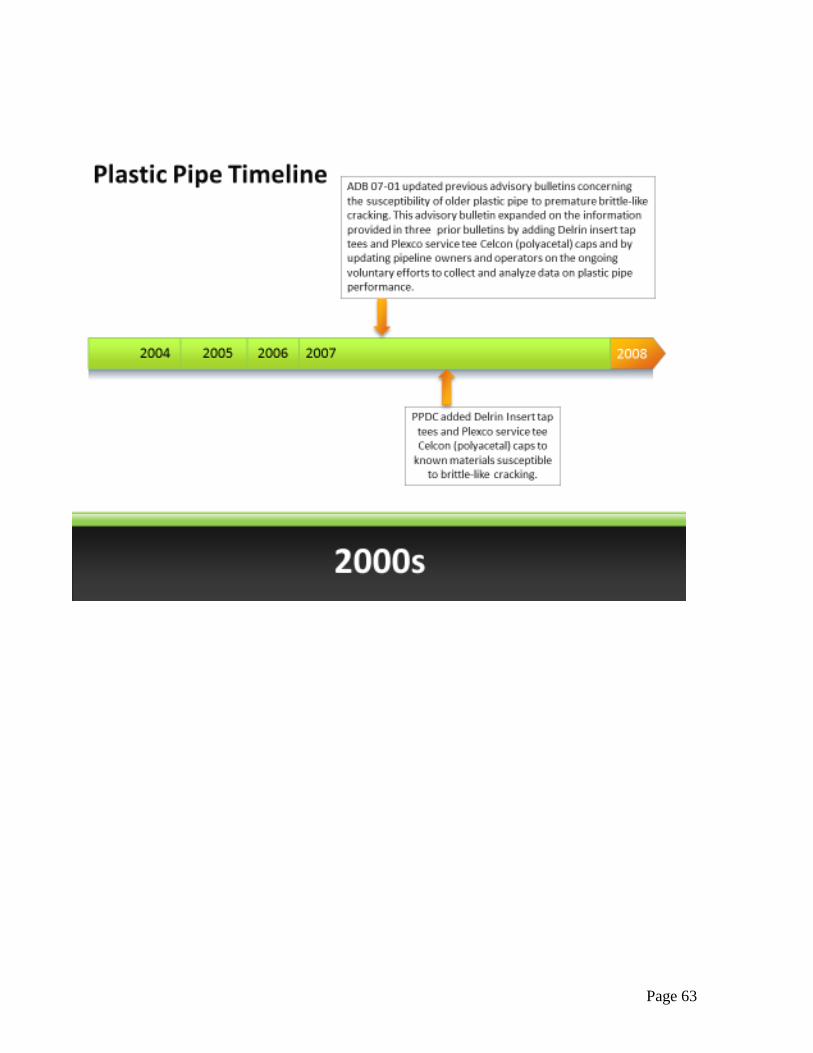
Page 63
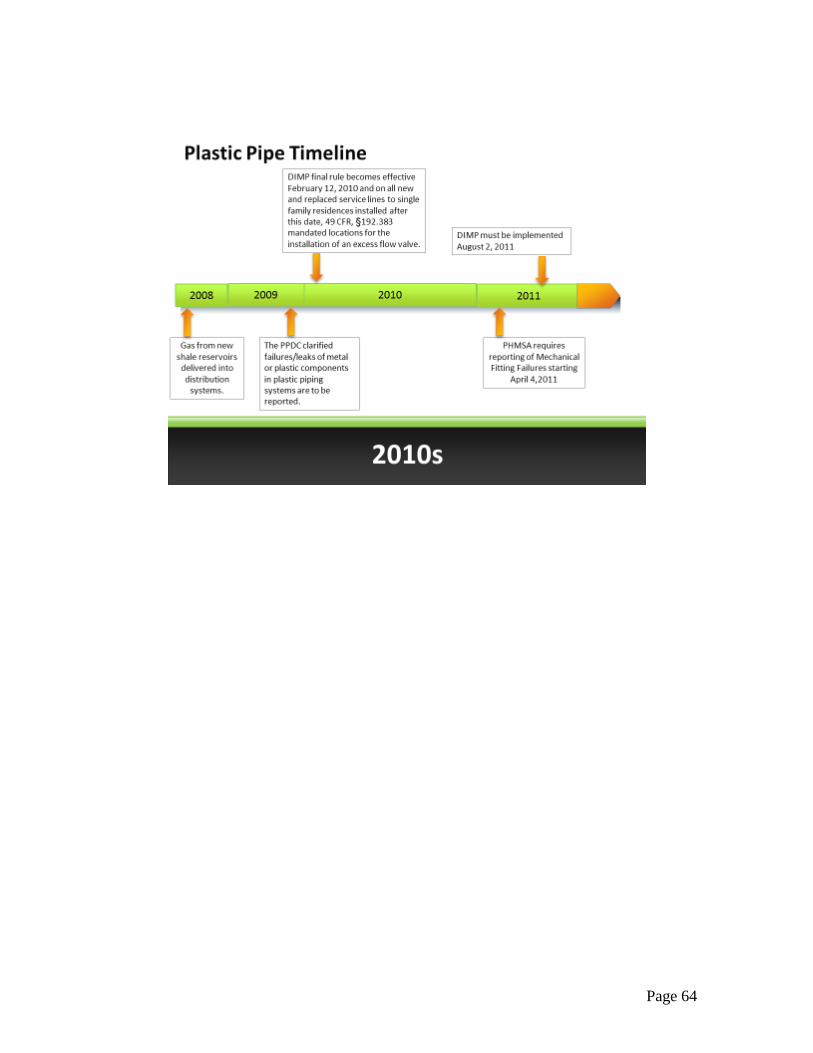
Page 64

Page 65

Page 66