draft technical memorandum water andenvironment sediment ... · august 2004 1 draft technical...
TRANSCRIPT

August 2004 1
DRAFT Technical Memorandum Water andEnvironment
Sediment Analysis
Subject: Sediment Analysis
Prepared For: Ed Cummings
Prepared by: Nuria Bertran-Ortiz
Reviewed by: Randy Raines
Date: August 23, 2004
Reference:
1 Purpose ................................................................................................................................................................2
2 The Five Scenarios ..............................................................................................................................................3
3 Components of Sediment Load..........................................................................................................................7
4 Wash Load Analysis ...........................................................................................................................................8
4.1 Methodology ................................................................................................................................................8
4.2 Results........................................................................................................................................................14
5 Bed Material Load Analysis.............................................................................................................................17
5.1 Methodology ..............................................................................................................................................17
5.2 Technical Assumptions ..............................................................................................................................21
5.3 Results........................................................................................................................................................24
5.4 Summary of 2-year Rainfall Event Results ................................................................................................34
6 Limitations of Sediment Load Analysis ..........................................................................................................35
7 Conclusions........................................................................................................................................................35
8 Recommendations.............................................................................................................................................36
Appendices Appendix A: Bibliography Appendix B: Reference for the Pacific Southwest Inter-Agency Committee (PSIAC) Method Appendix C: Detailed results of Wash Load Analysis Appendix D: Flood frequency curves for Arroyo las Positas and Arroyo Mocho at the Chain of Lakes Appendix E: 2 and 100-year flows and results of Bed Load Analysis

Sediment Analysis DRAFT
August 2004 2
1 Purpose This Technical Memorandum (TM) presents the results of the sediment balance task conducted for Phase 2 of the Stream Management Master Plan (SMMP). An analysis was conducted on the overall watershed sediment yield and in-stream sediment transport based on hydrologic modeling conducted by Schaaf & Wheeler (Hydrologic Procedures and Design Discharges, December 1997) and West Yost & Associates (Technical Memorandum No. 5 Task E: Evaluation of Problem Areas & Identification of Solutions, November 2001) and a sediment geomorphology study conducted by Ayres Associates (Zone 7 Water Agency Geomorphic and Sediment Transport Evaluation, December 2001). The analysis was conducted to assess the effect of flood management recommendations, developed during Phase 1 of the SMMP and outlined in the Interim Report (Zone 7 Stream Management Master Plan Phase 1 Interim Report, March 2004), on overall sediment yield or output at the outlet of Arroyo de la Laguna (ADLL). The analysis is to answer three questions:
1. What is the sediment yield today?
2. What will be the sediment yield at full build-out development conditions if recommended channel improvements are not implemented?
3. What will be the sediment yield at full build-out development conditions if recommended SMMP improvements are implemented?
It is important to note that the scope for this task did not include new modeling efforts or field measurements such as sediment sampling. Data needed for the analysis including design hydrology, channel geometry, and sediment particle size distributions were obtained from previous studies, as mentioned above.

Sediment Analysis DRAFT
August 2004 3
2 The Five Scenarios In order to answer the three questions posed above, five scenarios were developed based on differing development and channel conditions. These are summarized in Table 1 below.
Table 1 – Sediment Analysis Scenarios
Scenario Development Condition Channel Condition A Full Build-Out Full Channel Conveyance Capacity1 B Existing Development Full Channel Conveyance Capacity1 C Existing Development Existing Channel Conveyance Capacity2 D Full Build-Out Existing Channel Conveyance Capacity2 E Full Build-Out SMMP Improvements 1 Assumes channels have adequate capacity to convey flows generated during a 100-year rainfall event. 2 Existing channel capacities based on hydrologic modeling conducted by West Yost & Associates (West Yost & Associates, March 2002). For Arroyo las Positas, existing channel capacity through the Las Positas Golf Course reach is 1,800 cfs. For Arroyo Mocho, existing channel capacity through the Chain of Lakes is 900 cfs.
The first scenario (Scenario A) was used as a reference since the hydrologic modeling conducted by Schaaf & Wheeler (Schaaf & Wheeler, June 2000) and the sediment geomorphology study conducted by Ayres Associates (Ayres Associates, December 2001) were both based on these conditions. This land use scenario reflects full build-out as outlined by the Urban Growth Boundary presented in general plans for the Cities of Dublin, Pleasanton, Livermore, San Ramon, and the County of Alameda. A map of the Urban Growth Boundary is shown in Figure 1. The total area falling within the Urban Growth Boundary was calculated to be 76 square miles, or approximately 18% of the watershed’s area (430 square miles). This scenario also assumes that channels have adequate capacity to convey flows generated during a 100-year rainfall event. All flow is therefore assumed to be confined to the channels thereby eliminating bank overtopping and flooding on adjacent floodplains.
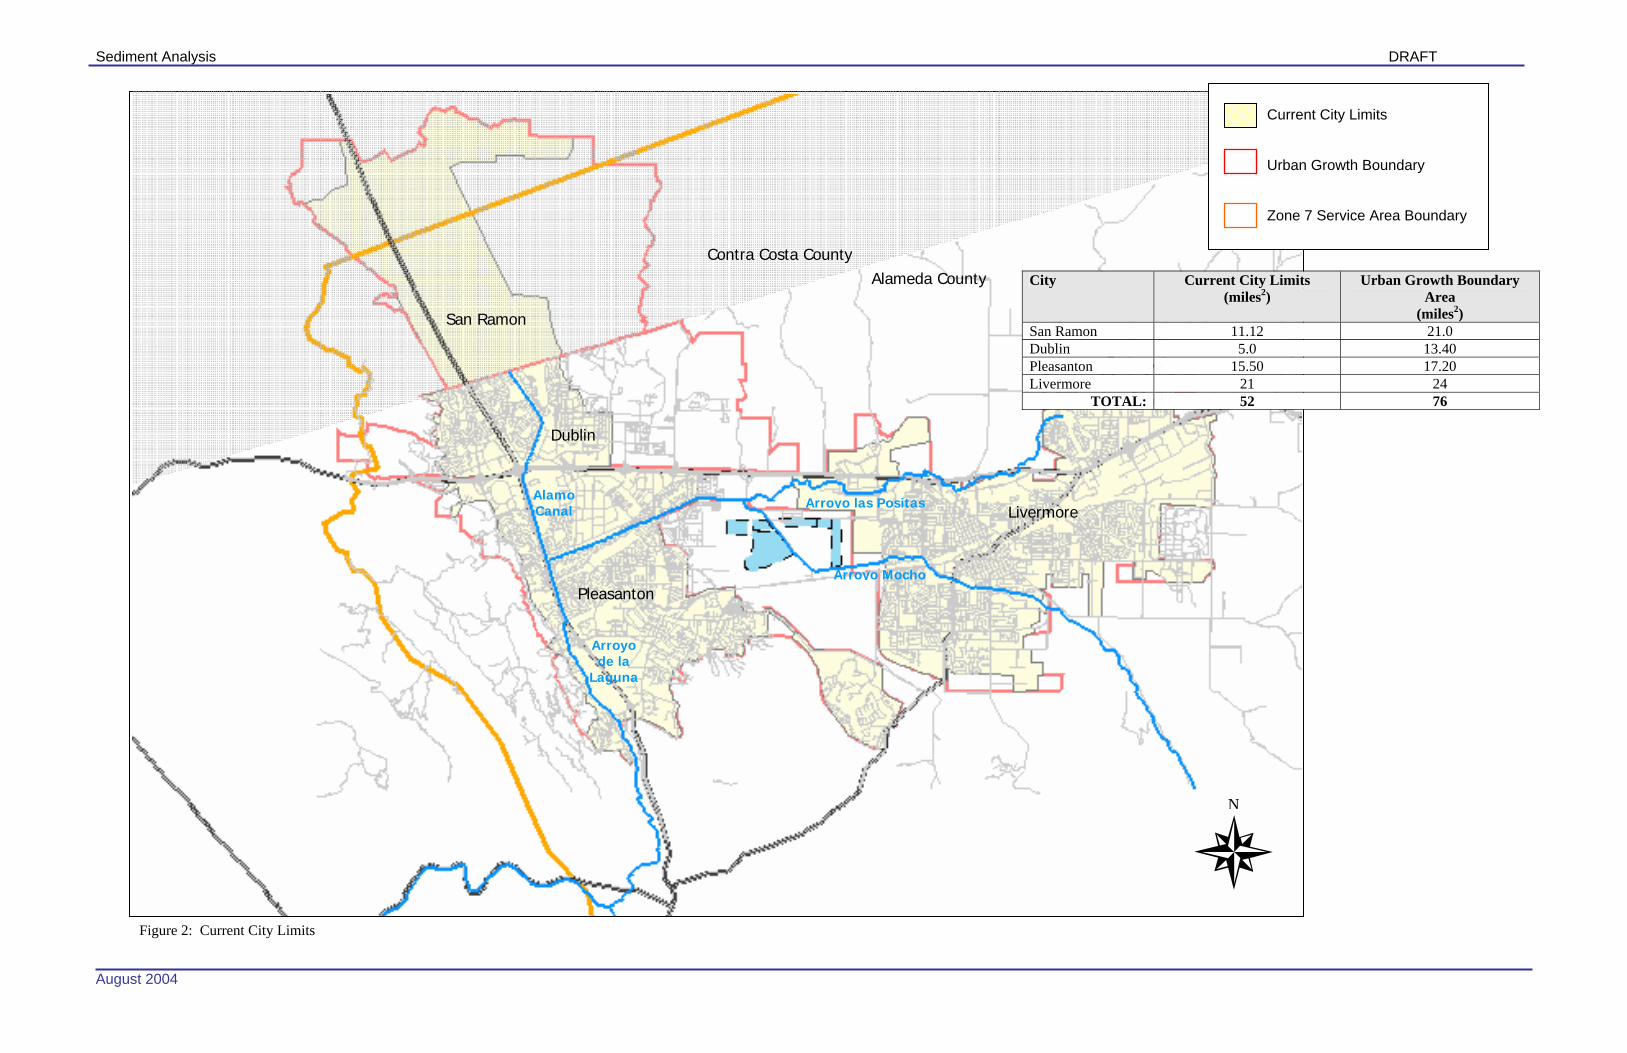
Scenario B reflects existing land use conditions as outlined by existing land use and city boundary maps presented in general plans. The total area falling within city boundaries was estimated to be approximately 52 square miles, or 12% of the watershed’s area. A map of the current city limits and the Urban Growth Boundary is shown in Figure 2. There is therefore an expected urban growth of approximately 24 square miles, or an increase of 46% in urbanized area. The increase in impervious areas will have an effect on peak flood flows and sediment yield from these watersheds. Scenario B assumes that channels have adequate capacity to convey flows generated during a 100-year rainfall event. As in Scenario A, all flow is assumed to be confined to the channels thereby eliminating bank overtopping and flooding on adjacent floodplains.
Scenario C represents present conditions in the watershed. As in Scenario B, existing development conditions are assumed. However, in this case, the current floodplain was assumed to be present and channel capacities were obtained from modeling conducted by West Yost & Associates. For Arroyo las Positas, existing capacity through the Las Positas Golf Course was set at 1,800 cfs (West Yost & Associates, March 2002). For Arroyo Mocho, the channel capacity was set at 900 cfs (West Yost & Associates, March 2002). Results from Scenario C will be used to answer question number one.
Scenario D represents future conditions at full build-out assuming improvements to the channels are not implemented. As in Scenario A, this land use scenario reflects full build-out as outlined by the Urban Growth Boundary presented in general plans. Channel capacities through Arroyo las Positas and Arroyo Mocho are the same as those of Scenario C. However, in this case, the floodplain is expanded due to increased flows resulting from an increase in impervious surfaces. Results from Scenario D will be used to answer question number two.

Sediment Analysis DRAFT
August 2004 4
Scenario E represents future conditions resulting from implementation of flood management recommendations outlined in the Zone 7 Phase 1 Interim Report (RMC, March 2004). The main improvement to the flood control system likely to significantly affect flows through the channels is the regional storage of flood flows at the Chain of Lakes. Results from Scenario E will be used to answer question number three.

Sediment Analysis DRAFT
August 2004
City Urban Growth Boundary Area
(miles2) San Ramon 21.0 Dublin 13.40 Pleasanton 17.20 Livermore 24
TOTAL: 76
Livermore
Pleasanton
Dublin
San Ramon
Contra Costa County
Alameda County
Arroyo las Positas
Arroyo Mocho
Alamo Canal
Arroyo de la
Laguna
Figure 1: Urban Growth Boundary
Urban Growth Boundary
N
Zone 7 Service Area Boundary
Sediment Analysis DRAFT
August 2004
City Current City Limits (miles2)
Urban Growth Boundary Area
(miles2) San Ramon 11.12 21.0 Dublin 5.0 13.40 Pleasanton 15.50 17.20 Livermore 21 24
TOTAL: 52 76
Figure 2: Current City Limits
Livermore
Pleasanton
Dublin
San Ramon
Contra Costa CountyAlameda County
Arroyo las Positas
Arroyo Mocho
Alamo Canal
Arroyo de la
Laguna
N
Current City Limits Urban Growth Boundary Zone 7 Service Area Boundary

Sediment Analysis DRAFT
August 2004 7
3 Components of Sediment Load The total sediment load at a specific location along a channel consists of sediment eroded from overland areas and sediment eroded from the channel banks and bed. Sediment derived from overland erosion is usually composed of fine particles carried mostly in suspension (wash load) (RCE, November 1994). Sediment eroded from the channel banks and bed is composed of coarser particles such as sand, gravel, and cobbles. This material is transported through the channel as bed load by various means including rolling, sliding, saltation, and surface creep (RCE, November 1994). The various components of the total sediment load carried in a channel are shown in Figure 3.
Figure 3 – Components of Total Sediment Load
The amount of sediment derived from overland erosion (wash load) is dependent on various climatic and physical characteristics of the watershed. It is controlled by the availability of erodible soils in the watershed and is therefore not dependent on the hydraulic conditions in the stream. The wash load component of the total sediment load will be calculated using the Pacific Southwest Inter-Agency Committee (PSIAC) Method (PSIAC, 1968). This method was developed to estimate sediment yields, or the volume of sediment derived from overland erosion. Details of this method will be discussed in Section 4 (Wash Load Analysis). The primary source of sand and coarser sediment material is from channel bank and bed erosion. This load is carried as bed material load and is dependent on the character of the sediment (i.e. size distribution), channel geometry, and channel hydraulic conditions. Bed material load analysis involves the use of an empirically derived transport capacity equation. This equation will be used in conjunction with the continuity principle (conservation of mass) to determine the vertical adjustment of the channel,
Bed Material Load
Total Sediment Load
Wash Load Suspended Bed Material Load
Bed Load

Sediment Analysis DRAFT
August 2004 8
or the aggradation/degradation of the channel bed. Details of the methodology used will be discussed in Section 5 (Bed Material Load Analysis).
4 Wash Load Analysis
4.1 Methodology The average annual wash load (suspended sediment yield) carried in Zone 7 channels and exiting the watershed at the outlet of ADLL will be based on a watershed-wide sediment mass balance. Soils eroded from the overland areas will constitute the suspended sediment input into the system and will be estimated using the PSIAC method. Sediment sinks in the system will vary based on development conditions and SMMP Program implementation. These sinks may include the volume of sediment carried in floodwaters and deposited on adjacent floodplains when bank overtopping occurs or the volume of sediment settling in detention storage at the Chain of Lakes upon implementation of the SMMP Program regional storage solution. The resulting, overall suspended sediment yield will be the total sediment input minus the total sinks. The PSIAC method estimates wash load or suspended sediment input into the stream by evaluating the condition of the watershed, and more specifically, by rating nine factors including surface geology, soils, climate, runoff, topography, ground cover, land use, upland erosion, and channel erosion and sediment transport. Each factor is assigned a yield level of high, moderate, or low. This level is in turn assigned a numerical value representing the relative significance in the overall rating (i.e. 0 to 10, -10 to 10, and 0 to 25). A yield rating is then calculated which equals the sum of the yield values for each factor. Based on this yield rating, the watershed is assigned a yield class (1 to 5). Each yield class is in turn assigned an average annual yield rate (acre-feet/mile2-year). This method is intended for broad-planning purposes to obtain an order-of-magnitude estimate of wash load. A copy of the reference describing the PSIAC method is attached in Appendix B. The PSIAC method was used by Ayres Associates as part of their geomorphic and sediment transport evaluation to estimate sediment yield rates for five types of ground cover: urban, grassland, urban/grassland, forest/grassland, and urban/forest (Ayres Associates, 2001). Areas draining into Zone 7 channels were then assigned a sediment yield rate based on the predominant ground cover type. Table 2 below lists the predominant ground cover types in the watershed and corresponding sediment yield rates as derived by Ayres Associates.
Table 2 – Sediment Yield Rates by Ground Cover Type (Ayres Associates, 2001)
Predominant Ground Cover Sediment Yield Rate (Acre-feet/mile2)
Urban 0.29 Grassland 0.93 Urban/Grassland 0.61 Forest/Grassland 0.46 Urban/Forest 0.38 These sediment yield rates were verified by re-classifying each ground cover type utilizing guidelines published by the PSIAC. Arc Info 8.0®, a Geographical Information System (GIS) software, was used to delineate areas draining into the channels. A map of resulting sub-watersheds and corresponding drainage areas is shown in Figure 4. The area draining into Arroyo del Valle was not included in the analysis since it was assumed that all soils eroded from the upland watershed would be trapped behind the Del Valle Reservoir.

Sediment Analysis DRAFT
August 2004 9
Similarly, the Chain of Lakes area was not included in the analysis since it was assumed that eroded soils would be trapped in existing and future gravel mining pits and would therefore not contribute to the wash loads in Arroyo las Positas or Arroyo Mocho. As described in Section 2, Scenario A assumes full build-out development conditions. City and county general plans were reviewed to obtain the urban growth boundary area. This area was mapped in GIS and overlaid on the sub-watershed map. As illustrated in Figure 5, each sub-watershed was then classified by ground cover type. Some sub-watersheds were assigned two types of ground cover (i.e. urban and grassland, etc.). The areas within each sub-watershed corresponding to the ground cover classification were then calculated using GIS. The resulting sediment input (acre-feet/year) was calculated by multiplying the average annual sediment yield rates (acre-feet/mile2-year) by the corresponding drainage areas (mile2). Results of these calculations are shown in Appendix C and summarized in Table 3. Scenario B assumes existing development conditions and full design channel capacities. As in Scenario A, city general plans were reviewed to obtain existing city boundaries. City boundaries were mapped and overlaid on the sub-watershed map. Once again, sub-watersheds were classified by ground cover type and areas were obtained. Channels were assumed to have adequate capacity to convey the 100-year flood flows. As a result, it was assumed that no flooding would occur around Arroyo las Positas or Arroyo Mocho. Suspended sediment input estimates for this scenario are shown in Appendix C and summarized in Table 3. Scenario C assumes existing development conditions and channel capacities. Figure 6 shows the current 100-year floodplain around Chain of Lakes. Both Arroyo las Positas and Arroyo Mocho are currently under capacity. Flooding will therefore occur during a 100-year rainfall event. However, flooding is also likely to occur during higher frequency rainfall events. The amount of sediment carried in floodwaters overtopping the channel banks represents the sediment sink component of the mass balance. In order to quantify the amount of sediment deposited on the adjacent floodplain on any given year, two questions need to be answered:
• When does bank overtopping occur? • Over the long term, how much sediment will be deposited on the floodplain on any one year?
Flood frequency curves were plotted to answer the first question. Flows during a 100, 15, and 2-year events were plotted against their respective exceedance probabilities (Schaaf & Wheeler, 1997). A line of best fit was then drawn and used to determine the exceedance probability for the existing channel capacities of Arroyo las Positas and Arroyo Mocho. These flood frequency curves are shown in Appendix D. The Arroyo las Positas reach along Las Positas Golf Course has a current capacity of 1,800 cfs (West Yost & Associates, March 2002). Based on its flood frequency curve, this reach can accommodate flows up to a 3-year event. The Arroyo Mocho reach through the Chain of Lakes has a current capacity of 900 cfs (West Yost & Associates, March 2002). Based on its flood frequency curve, this reach can accommodate flows up to a 4-year event. Accounting for remaining freeboard in the channels, it was assumed that bank overtopping would occur at or above a 5-year event for both channels at these locations.
Data from a U.S. Geological Service (USGS) suspended sediment gage was obtained to determine the mass of sediment carried in a 5-year event. The only suspended sediment gage in the watershed is located at Alameda Creek near Niles Canyon, downstream of the confluence with ADLL (USGS Station ID 11179000). Available data includes daily mean stream flow discharge (cfs), daily mean suspended sediment concentration (mg/L), and daily mean suspended sediment discharge (tons/day) for a fourteen-year period of record (1959 to 1973). The range of mean daily flows obtained was divided into class intervals. The number of observations (frequency) corresponding to each class interval was then tabulated. Flows representing a 5-year storm event or greater ranged from 3,820 cfs to 7,890 cfs. From

Sediment Analysis DRAFT
August 2004 10
the suspended sediment load (tons/day) data, it was determined that over a fourteen year period of record, 27% of the total suspended sediment load was due to storms equal to or greater than a 5-year event. This percentage is an average annual amount over a long period of time and was applied to flows through Arroyo las Positas and Arroyo Mocho. It was therefore assumed that 27% of the sediment reaching Arroyo las Positas at Las Positas Golf Course and Arroyo Mocho at the Chain of Lakes would be deposited on the floodplain on any one year. In this case, the sediment input will be the eroded soils from overland areas, while the sediment sink will be the 27% being deposited on the floodplain. The resulting suspended sediment yield will equal the input minus the sinks. Suspended sediment input, sink estimates, and resulting suspended sediment yield for this scenario are shown in Appendix C and summarized in Table 3.

Sediment Analysis DRAFT
August 2004
Sub-watershed Name Vhg
Area (miles2)
Re-aligned Arroyo las Positas 8.91 Arroyo Seco 14.62 Cayetano Creek 11.02 Collier Creek 4.75 Cottonwood Creek 4.33 Arroyo las Positas 37.80 Line G3 3.73 Tassajara Creek 27.06 Chabot Canal 5.25 Arroyo Mocho 39.13 Tributaries to Alamo Canal 43.48 Pleasanton Canal 2.36 Line B2-1 and Tributaries 3.43
TOTAL AREA: 206
Figure 4: Wash Load Analysis Sub-watersheds
Re-aligned Arroyo las Positas
Arroyo Seco
Cayetano Creek
Collier Creek
Cottonwood Creek
Arroyo las Positas
Line G-3
Tassajara Creek
Chabot Canal
Arroyo Mocho
Tributaries to Alamo Canal
Pleasanton Canal
Line B2-1 & Tributaries

Sediment Analysis DRAFT
August 2004
Subwatershed Ground Cover Type
Sediment Yield (Acre-feet/year)
Urban 0.44 Re-aligned Arroyo las Positas Grassland 6.87
Urban 0.20 Arroyo Seco Grassland 13.0 Urban 0.0005 Cayetano Creek Grassland 10.2 Urban 0.19 Collier Creek Grassland 3.8 Urban 4.0 Arroyo las Positas Grassland 22.3 Urban 0.004 Cottonwood Creek Grassland 4.0 Urban 0.57 Arroyo Mocho Forest/Grassland 17.1 Urban 0.80 Line G3 Grassland 0.90 Urban 0.70 Tassajara Creek Grassland 23.0 Urban 1.50 Chabot Canal Grassland 0.11 Urban 7.70 Tributaries to Alamo
Canal Forest/Grassland 7.80 Urban 0.57 Pleasanton Canal Urban/Grassland 0.24 Urban 0.6 Line B2-1 and
Tributaries Grassland 1.3 TOTAL: 128
Urban Growth Boundary Grassland Forest/Grassland
Arroyo las Positas
Arroyo Mocho
ADLL
Figure 5: Scenario A Sub-watershed Ground Cover Type

Sediment Analysis DRAFT
August 2004 13
Figure 6 – Existing 100-year Flood Plain Around Chain of Lakes

Sediment Analysis DRAFT
August 2004 14
Scenario D assumes full build-out development conditions and existing channel capacities. This scenario would apply if channel improvements were not implemented. As in Scenario C, it was assumed that 27% of suspended sediment loads reaching Arroyo las Positas and Arroyo Mocho would be deposited on the floodplain on any one year. Suspended sediment input, sink estimates, and resulting suspended sediment yield for this scenario are shown in Appendix C and summarized in Table 3.
Scenario E assumes full build-out development conditions and implementation of SMMP Program improvements, as described in the Zone 7 SMMP Phase 1 Interim Report (RMC, 2004). The only SMMP Program improvement likely to affect the watershed’s total suspended sediment yield is the regional storage of flood flows at the Chain of Lakes. The proposed detention ponds will trap sediment suspended in waters overtopping the channel banks. However, they will not trap bed material load since this portion of the total sediment load is not transported in suspension and will therefore remain in the channels. Sediment basins were not considered in the wash load analysis since they will not trap sediment suspended in the water column. However, they will trap bed material load and will therefore affect the bed material transport capacity analysis discussed in Section 5 (Bed Material Load Analysis). As in Scenarios C and D, diversion of flows from Arroyo las Positas and Arroyo Mocho into the Chain of Lakes will occur at or above a 5-year event. As a result, it was assumed that the same percentage of suspended sediment (i.e. 27%) would become trapped at the Chain of Lakes on any one year. Suspended sediment input, sink estimates, and resulting suspended sediment yield for this scenario are shown in Appendix C and summarized in Table 3.
4.2 Results Results of the wash load analysis for all five scenarios are summarized in Table 3 below.
Table 3 – Wash Load Analysis Results for Scenarios A through E
Scenario Sediment Input (Acre-
feet/year)
Sediment Sink
(Acre-feet/year)
Sediment Output/Yield
(Acre-feet/year)
Assumptions
A 128 0 128 - Future build-out development conditions (urban growth boundary)
- Full design channel capacities therefore no flooding around Arroyo las Positas or Arroyo Mocho
B 136 0 136
- Existing development conditions (city boundaries)
- Full design channel capacities therefore no flooding around Arroyo las Positas or Arroyo Mocho
C 136 22 114 - Existing development conditions (city boundaries)
- Flooding occurs at or above a 5-year storm event
- 27% of suspended sediment load settles on floodplain at any one given year
D 128 21 107 - Future build-out development conditions (urban growth boundary)
- Flooding occurs at or above a 5-year storm

Sediment Analysis DRAFT
August 2004 15
Scenario Sediment Input (Acre-
feet/year)
Sediment Sink
(Acre-feet/year)
Sediment Output/Yield
(Acre-feet/year)
Assumptions
event
- 27% of suspended sediment load settles on floodplain at any one given year
E 128 21 107 - Future build-out development conditions (urban growth boundary)
- Diversion of flows into the Chain of Lakes occurs at or above a 5-year storm event
- 27% of suspended sediment load settles in detention ponds
A summary table of suspended sediment yields in acre-feet per year, cubic yards per year, tons per year, and tons per acre per year is given in Table 4 below. The PSIAC method calculates sediment yield as a volumetric load rate. However, the volumetric load can be converted to a mass load by assuming a suspended sediment density equal to that of uniform inorganic silt (0.0495 tons/ft3 or 99 lbs/ft3) (Lambe and Whitman, 1969).
Table 4 – Wash Load Analysis Results Expressed as Volumetric and Mass Load Rates
Scenario Sediment Output/Yield
(AF/year)
Sediment Output/Yield
(yards3/year)
Sediment Output/Yield
(tons/year)
Sediment Output/Yield1
(tons/acre-year)
A - (Full Build-Out + Full Channel Conveyance Capacity)
128 206,000 275,500 2.09
B - (Existing Develop. + Full Channel Conveyance Capacity)
136 212,000 283,300 2.15
C - (Exist. Develop. + Exist. Channel Conveyance Capacity)
114 184,000 246,100 1.87
D - (Full Build-Out + Exist. Channel Conveyance Capacity)
107 172,000 229,700 1.74
E - (Full Build-Out + SMMP Improvements)
107 172,000 229,700 1.74
1 Based on a total surface area of 206 square miles.
Urbanization tends to increase runoff and decrease sediment yield since the area of ground cover types with the highest sediment yield rates (i.e. grasslands and urban/grasslands) decreases and is replaced by ground cover types with low erosion potential. This explains the decrease in sediment yield for Scenario B, when compared to Scenario A, or for Scenario D, when compared to Scenario C. In addition, floodplains act as a sediment sink since suspended sediment is carried in waters overtopping channel banks and is then deposited on the adjacent lands. In Scenario A and B, it was assumed that the channels had sufficient capacity to convey the 100-year rainfall event flows and the sediment suspended in those flows. As a result, scenarios A and B have higher sediment yields exiting the watershed when compared to scenarios C and D. The suspended sediment yield in Scenario E equals that of Scenario D. Both

Sediment Analysis DRAFT
August 2004 16
scenarios share the same development and channel design conditions. However, in Scenario E, the suspended sediment is being concentrated in the storage ponds at the Chain of Lakes instead of being allowed to settle on the adjacent floodplains. From a sediment yield perspective, the Chain of Lakes regional storage solution provides a controlled environment to manage suspended sediment in the watershed.
The sediment yield from the watershed is considered to be of medium magnitude. Low sediment yields are generally considered to range between 0.41 to 1.21 tons/acre–year (Annandale, 2002). High sediment yields are generally considered to be on the order of 4.05 tons/acre-year or above (Annandale, 2002).
The PSIAC method has been used to quantify sediment yield in various watersheds in the Bay Area including the Pajaro River watershed, spanning parts of Santa Cruz, Monterey, San Benito, and Santa Clara counties (Annandale, 2002) and the Upper Penitencia Creek watershed in eastern Santa Clara Valley (PWA, 2003). Sediment yields from these watersheds and Zone 7 channels have been presented in Table 5 for comparison purposes.
Table 5 – Sediment Yields from Pajaro River and Upper Penitencia Creek Watersheds
Zone 7 Channels1 Pajaro River Watershed2
Upper Penitencia Creek Watershed3
Sediment Output/Yield (tons/acre-year)
1.74 to 2.15 1.17 2.3 to 3.7
1 Calculated value, as shown in Table 4. 2 Annandale, George W. Pajaro River Watershed Study Technical Memorandum No. 1.2.4. Prepared for the Pajaro River Watershed Flood Prevention Authority. February 13, 2002. 3 Philip Williams & Associates, Ltd. Upper Penitencia Creek Reconnaissance Level Sediment Assessment: Existing Conditions Summary. Prepared for the U.S. Army Corps of Engineers San Francisco District. April 4, 2003.

Sediment Analysis DRAFT
August 2004 17
5 Bed Material Load Analysis
5.1 Methodology Bed material load is composed of sand and coarser sediment material eroded from the channel banks and bed. The quantity of bed load transported through the channel will depend on the bed load transport capacity of the channel and the sediment supply. A sediment transport capacity relationship was developed by Ayres Associates utilizing regression analysis, the Meyer-Peter and Muller bed load equation, and the Zeller and Fullerton Power Function Relation (Ayres Associates, 2001). The relationship is a function of variables known to influence sediment transport capacity (i.e. channel hydrology, channel geometry, and sediment size and gradation). This relationship is given by:
29.061.050
65.345.0
000157.0dDVGrqt =
Where qt = unit width total load transport capacity (cfs/ft)
Gr = gradation coefficient of the bed material =
+
16
50
50
84
21
DD
DD
V = average velocity (ft/s)
D50 = bed material size of which fifty percent of the sediment load by weight is smaller (mm)
d = hydraulic depth (ft)
The sediment transport capacity in units of tons/day can be calculated by multiplying qt by the water surface top width, number of seconds per day, and bed material average density. The average density used to represent fine to coarse sand was 0.0545 tons per cubic feet or 109 lbs per cubic feet (Lambe and Whitman, 1969).
The vertical adjustment of the channel is due to removal of sediment from the channel bed (degradation) or deposition of sediment on the channel bed (aggradation). The magnitude of adjustment will be based on conservation of mass and will be dependent on the difference between the amount of sediment transported into the reach (supply) and the amount of sediment transported out of the reach (reach capacity). This continuity concept is illustrated in Figure 7 below.

Sediment Analysis DRAFT
August 2004 18
Figure 7 – Bed Material Load Continuity Concept
If the change in bed material volume in the reach is negative (Sediment Outflow > Sediment Inflow), then the reach capacity is greater than the sediment supply. The reach will attain a state of equilibrium (i.e. reach capacity) by supplementing the Sediment Inflow with bank and/or bed material. The reach is therefore degrading or eroding. Conversely, if the change in volume is positive (Sediment Outflow < Sediment Inflow) then the sediment supply is greater than the reach capacity. As a result, the excess sediment is deposited on the channel bed resulting in an aggradating reach. The channel will adjust until a state of static equilibrium is attained (i.e. when the Sediment Inflow equals the Sediment Outflow). Channel adjustments may include changes in gradation of the bed material, changes in cross-sectional area (width and depth), and changes in the channel bed slope. The sediment transport analysis discussed above will evaluate the long-term degradation or aggradation potential of the channel. However, it will not identify the specific channel adjustments resulting from the estimated trend.
Due to data limitations on channel geometric and hydraulic characteristics, only the main channels draining into Arroyo de la Laguna were considered for the analysis (i.e. Arroyo Mocho, Arroyo las Positas, and Alamo Canal). In addition, channel geometric data for the downstream reach of Arroyo las Positas (Reach H-1) is representative of the old channel alignment and does not reflect the latest modifications or upgrades to the reach.
The first step in the continuity analysis was delineation of these channels into a number of reaches. As seen in Figure 8, Arroyo las Positas, Arroyo Mocho, Alamo Canal, and Arroyo de la Laguna were divided into six, thirteen, one, and eight reaches respectively, ranging in length from 1,100 feet (Alamo Canal) to 12,700 feet (Arroyo Mocho). Delineation of these reaches mirrored the reach delineation developed by Ayres Associates and was based on common physical characteristics of the channel including bottom width, slope, and top width. After reach delineation, characteristic geometric and hydraulic information was obtained from Ayres Associates (Ayres Associates, December 2001), Schaaf & Wheeler (Schaaf & Wheeler, June 2000), and West Yost Associates (West Yost Associates, November 2001) for each reach. After establishing representative geometric and hydraulic characteristics, the bed load transport capacity was calculated for each reach. The conservation of mass principle was then applied on a reach-by-reach basis by assuming that the sediment inflow to any given reach was equal to the sediment capacity of the adjacent upstream reach. In order to establish an upstream sediment boundary condition, the upstream
Sediment Inflow (Upstream Reach Capacity)
Sediment Outflow (Reach Capacity)
Change in Volume = Sediment Inflow – Sediment Outflow

Sediment Analysis DRAFT
August 2004 19
reach of all ADLL tributaries (Arroyo Mocho, Arroyo las Positas, and Alamo Canal) was assumed to be in equilibrium (i.e. not aggrading or degrading) and was therefore designated as a supply reach.

Sediment Analysis DRAFT
August 2004
Contra Costa County
Alameda County
Arroyo las Positas
Arroyo Mocho
Alamo Canal
Arroyo de la
Laguna
Figure 8: Reach Delineation
H-1
H-2
G-50
G-60
G-20
G-30 G-40
B-30
B-50
B-40
B-60
B-70
G-10
B-10
H-3

Sediment Analysis DRAFT
August 2004 21
5.2 Technical Assumptions The same five scenarios were again considered based on differing development and channel conditions. The points below describe technical assumptions taken under each scenario. Channels were always assumed to be clean or free of sediment deposition. In addition, channel geometries (bottom width, side slopes, and bed slopes) were obtained from the Ayres Associates report and were assumed to be uniform for all scenarios and in accordance with the 1966 Flood Control Master Plan. Similarly, data on sediment characteristics (gradation and size) was also obtained from the Ayres Associates report and was assumed to be uniform for all five scenarios. Flows for scenarios A and E were obtained from existing modeling conducted by Schaaf & Wheeler and West Yost & Associates. Flows for the remaining scenarios were calculated from interpolation of existing data. Flows for all reaches under each scenario are shown in Appendix E.
• Scenario A - Full Build-Out Development + Full Channel Conveyance Capacity Data for this scenario was obtained from the Ayres Associates analysis as presented in their report (Zone 7 Water Agency Geomorphic and Sediment Transport Evaluation, December 2001). Hydraulic data (i.e. velocity and flow depth) was based on ultimate, full build-out hydrology as presented in Table 1 of Schaaf & Wheeler’s draft report (Zone 7 Special Drainage Area 7-1 Program Update of Channel Improvement Costs, June 2000). It was assumed that all flow was confined to the channels thereby eliminating bank overtopping or lost of flow to storage on the flood plain. Non-uniform flow was assumed and all channels were assumed to be impacted by backwater conditions during the 100-year rainfall event. Flow depths during the 100-year event were obtained from hydraulic modeling conducted by West Yost & Associates and presented in Table TM5A-5 of TM No. 5 Appendices (Technical Memorandum No. 5: Task E: Evaluation of Problem Areas & Identification of Solutions Appendices, November 2001).
No flooding was predicted during the 2-year rainfall events. As a result, flow in the channels was assumed to be uniform and the normal depth was calculated using Manning’s equation.
• Scenario B – Existing Development + Full Channel Conveyance Capacity Hydraulic data was based on existing hydrology as presented in Table 1 of the December 1997 Schaaf & Wheeler report (Hydrologic Procedures and Design Discharges). Again, all flow was assumed to be contained within the channel. Non-uniform flow was assumed and all channels were assumed to be impacted by back-water conditions during the 100-year rainfall event. Flow depths during the 100-year event were calculated from interpolation of depths provided in Table TM5A-5 of TM No. 5 Appendices (Technical Memorandum No. 5: Task E: Evaluation of Problem Areas & Identification of Solutions Appendices, November 2001). The flow velocity was calculated by utilizing the continuity relationship (Q=VA).
No flooding was predicted during the 2-year rainfall events. As a result, flow in the channels was assumed to be uniform and the normal depth was calculated using Manning’s equation.
• Scenario C – Existing Development + Existing Channel Conveyance Capacity In this case, hydraulic data was based on a combination of existing hydrology, as in Scenario B, and existing channel capacities. This scenario assumed that the flood plain was present and resulted in attenuation of peak flows during the 100-year rainfall event. Non-uniform flow was assumed in the downstream end of Arroyo Mocho (Reach G-10) and Arroyo de la Laguna (Reach B-70 to B-10). These reaches were assumed to be impacted by backwater conditions during the 100-year rainfall event. Flow depths during the 100-year event were calculated from interpolation of depths provided in Table TM5A-12 of TM No. 5 Appendices (Technical Memorandum No. 5: Task E: Evaluation of Problem Areas & Identification of Solutions Appendices, November 2001). The flow velocity was calculated by utilizing the continuity

Sediment Analysis DRAFT
August 2004 22
relationship (Q=VA). Uniform flow was assumed for reaches not impacted by backwater conditions and depths were calculated using Manning’s equation.
No flooding was predicted during the 2-year rainfall events. As a result, flow in the channels was assumed to be uniform and the normal depth was calculated using Manning’s equation.
• Scenario D – Full Build-Out Development + Existing Channel Conveyance Capacity Hydraulic data was based on a combination of ultimate, full build-out hydrology and existing channel capacities. The flow was not assumed to be contained within the channel. Instead, the floodplain at build-out was assumed to be present to attenuate peak flows. As a result, the downstream end of Arroyo Mocho (Reach G-10) and Arroyo de la Laguna (Reach B-70 to B-10) were assumed to be impacted by backwater conditions during a 100-year rainfall event. Channel flows for these reaches were assumed to be non-uniform and flow depths were based on modeling conducted by West Yost & Associates using a step backwater computational model (HEC-RAS) (Technical Memorandum No. 5: Task E: Evaluation of Problem Areas & Identification of Solutions Appendices, November 2001). The flow velocity was calculated by utilizing the continuity relationship (Q=VA). Uniform flow was assumed for remaining reaches (i.e. Arroyo las Positas and most of Arroyo Mocho). Depths and velocities for these reaches were calculated using Manning’s equation.
As in Scenario C, flooding was not predicted to occur during the 2-year rainfall event. As a result, flow in the channels during a 2-year event was assumed to be uniform and the normal depth was calculated using Manning’s equation.
• Scenario E – Full Build-Out Development + Implementation of SMMP Program Hydraulic data was based on a combination of ultimate, full build-out hydrology and flows resulting from 5,000 acre-feet of storage at the Chain of Lakes during a 100-year rainfall event. This regional storage solution was recommended in Phase 1 of the SMMP Program and is described in more detail in the Zone 7 SMMP Phase 1 Interim Report (RMC, March 2004). The purpose of storage at Chain of Lakes is to attenuate peak flows and offset the capacity deficiencies through Arroyo Mocho and Arroyo las Positas. The flow was still assumed to be non-uniform at the downstream end of Arroyo Mocho (Reach G-10) and Arroyo de la Laguna. Backwater depths were obtained from Table TM5A-23 of the West Yost & Associates’ TM No. 5 Appendices. The flow velocity was calculated by utilizing the continuity relationship (Q=VA). Uniform flow was assumed for remaining reaches (i.e. Arroyo las Positas and most of Arroyo Mocho). Depths and velocities for these reaches were calculated using Manning’s equation.
Flooding was not predicted to occur during the 2-year storm events. As a result, flow in the channels during a 2-year event was assumed to be uniform and the normal depth was calculated using Manning’s equation.
Results of the bed material load transport analysis will be reviewed as part of Subtask 1.4: SMMP Project Refinement to determine the adequacy of recommended sediment basins. The Zone 7 SMMP Phase 1 Interim Report proposed construction of in-stream sediment basins at aggradational reaches along Arroyo las Positas (near Airway Boulevard), Arroyo Mocho (at Robertson Park, near Stanley Boulevard, and downstream of the confluence with Tassajara Creek), and Alamo Canal (near the confluence with Arroyo Mocho). Location and size of these sediment basins was determined from field observations and was therefore based on existing development conditions and channel conveyance capacities. An analysis of the adequacy of proposed sediment basins and recommended changes to the location and size of those basins will be conducted as part of Subtask 1.4: SMMP Project Refinement activities.
A summary of assumptions taken under each scenario is shown in Table 6.

Sediment Analysis DRAFT
August 2004
Table 6 – Summary of Technical Assumptions Taken for Bed Load Transport Analysis
References for data on: Assumptions Scenario Development Conditions
Channel Condition Channel Geometry
(Bottom Width, Side Slope, Bed Slope)
Sediment Characteristics
Hydrology Hydraulic Analysis (Velocity and Flow Depth)
A Full Build-Out Full Conveyance Capacity
Ayres Associates, 2001
Ayres Associates, 2001
Table 1 Schaaf & Wheeler (June 2000) Table TM5A-5 of West Yost & Associates, November 2001
2-year: Manning’s Equation (uniform flow at normal depth) 100-year: Continuity Relationship (non-uniform flow impacted by backwater condition. Flow depth obtained from Table TM5A-5 of West Yost & Associates, November 2001)
• All flow is confined to channels. There is no bank overtopping or flow lost to storage on flood plain.
• Channels impacted by backwater conditions during 100-year storm event. Non-uniform flow along channels during 100-year storm event.
• Channels flowing at normal depth during 2-year storm event. Uniform flow along channels during 2-year storm event.
B Existing Full Conveyance Capacity
Ayres Associates, 2001
Ayres Associates, 2001
Table 1, Schaaf & Wheeler (December 1997) Table TM5A-5 of West Yost & Associates, November 2001
2-year: Manning’s Equation (uniform flow at normal depth) 100-year: Continuity Relationship (non-uniform flow impacted by backwater condition. Flow depth calculated by interpolation from Table TM5A-5 of West Yost & Associates, November 2001)
• All flow is confined to channels. There is no bank overtopping or flow lost to storage on flood plain.
• Channels impacted by backwater conditions during 100-year storm event. Non-uniform flow along channels during 100-year storm event.
• Channels flowing at normal depth during 2-year storm event. Uniform flow along channels during 2-year storm event.
C Existing Existing Conveyance Capacity
Ayres Associates, 2001
Ayres Associates, 2001
Table 1, Schaaf & Wheeler (December 1997) Figure 4.2, RMC Interim Report (March 2004)
2-year: Manning’s Equation (uniform flow at normal depth) 100-year: Continuity Relationship (non-uniform flow impacted by backwater condition for Reach G-10 on Arroyo Mocho and all reaches along Arroyo de la Laguna. Flow depth calculated by interpolation from Table TM5A-12 of West Yost & Associates, November 2001).
• Bank overtopping occurs resulting in storage of flows on current flood plain. • Reach G-10 on Arroyo Mocho and all reaches along Arroyo de la Laguna impacted
by backwater conditions during 100-year storm event. Non-uniform flow along these reaches during 100-year storm event.
• Remaining channels flowing at normal depth during a 100-year storm event. • Channels flowing at normal depth during 2-year storm event. Uniform flow along
channels during 2-year storm event.
D Full Build-Out Existing Conveyance Capacity
Ayres Associates, 2001
Ayres Associates, 2001
Table 1 Schaaf & Wheeler (June 2000) Figure 4.2, RMC Interim Report (March 2004)
2-year: Manning’s Equation (uniform flow at normal depth) 100-year: Continuity Relationship (non-uniform flow impacted by backwater condition for Reach G-10 on Arroyo Mocho and Arroyo de la Laguna. Flow depth obtained from West Yost & Associates, November 2001)
• Bank overtopping occurs resulting in storage of flows on ultimate, full build-out flood plain.
• Reach G-10 on Arroyo Mocho and Arroyo de la Laguna impacted by backwater conditions during 100-year storm event. Non-uniform flow along these reaches during 100-year storm event.
• Remaining channels flowing at normal depth during a 100-year storm event. • Channels flowing at normal depth during 2-year storm event. Uniform flow along
channels during 2-year storm event.
E Full Build-Out Implementation of SMMP Program
Ayres Associates, 2001
Ayres Associates, 2001
Table TM5A-27, West Yost & Associates (November 2001)
2-year: Manning’s Equation (uniform flow at normal depth) 100-year: Continuity Relationship (non-uniform flow impacted by backwater condition for Reach G-10 on Arroyo Mocho and Arroyo de la Laguna. Flow depth obtained from West Yost & Associates, November 2001)
• Bank overtopping occurs resulting in diversion of 5,000 acre-feet of storage at Chain of Lakes during 100-year storm event.
• Reach G-10 on Arroyo Mocho and Arroyo de la Laguna impacted by backwater conditions during 100-year storm event. Non-uniform flow along these reaches during 100-year storm event.
• Remaining channels flowing at normal depth during a 100-year storm event. • Channels flowing at normal depth during 2-year storm event. Uniform flow along
channels during 2-year storm event.

Sediment Analysis DRAFT
August 2004 24
5.3 Results The bed load transport calculations and results for all five scenarios are shown in Appendix E. As previously discussed, the purpose of this sediment balance task is to answer three questions:
1. What is the sediment yield today?
2. What will be the sediment yield at full build-out development conditions if recommended channel improvements are not implemented?
3. What will be the sediment yield at full build-out development conditions if recommended SMMP improvements are implemented?
In order to answer these questions, the discussion on bed load transport results is focused on Scenarios C, D, and E. Results for Scenarios A and B are shown in Appendix E.
Scenario C – Existing Development + Existing Channel Conveyance Capacity
Results of the reach-based bed load transport analysis for Scenario C are summarized in Table 7 and illustrated in Figure 9. A plus (+) sign indicates aggradation whereas a negative (-) sign indicates degradation. Calculations performed and results are shown in Appendix E.
Table 7 – Scenario C Bed Load Transport Analysis Results
Line Reach US Station
DS Station
Sediment Imbalance 2-year Event (yards3/event)
Sediment Imbalance 100-year Event (yards3/event)
H-3 227+00 208+00 Upstream Sediment Boundary Condition
Upstream Sediment Boundary Condition
H-2 208+00 92+00 +1,400 +69,000 Arroyo las Positas (Line H)
H-1 92+00 0+00 -13,000 -110,000 G-60 620+00 552+00 Upstream Sediment
Boundary Condition Upstream Sediment Boundary Condition
G-60 552+00 350+00 +140 +9,700 G-50 350+00 176+86 -200 +47,000 G-40 173+50 150+00 +9,100 +75,000 G-30 150+00 70+00 +4,500 +35,000 G-20 70+00 40+00 +490 -970
Arroyo Mocho (Line G)
G-10 40+00 0+00 -450 -980 Alamo Canal (Line F)
F-10 11+00 0 Upstream Sediment Boundary Condition
Upstream Sediment Boundary Condition
B-70 392+00 373+00 -68,000 +16,000 B-60 373+00 335+00 +3,800 +4,100 B-50 335+00 307+90 +53,000 -8,800 B-40 307+90 238+20 +6,900 -58,000 B-30 238+20 32+25 -4,200 -29,000
Arroyo de la Laguna (Line B)
B-10 32+25 2+00 -12,000 -170,000
Line H (Arroyo las Positas) In accordance with the analysis conducted by Ayres and Associates, Reach H-3 (station 227+00 to 208+00) was selected to be the upstream sediment boundary condition. It was therefore assumed to be geomorphically stable so that the sediment delivered from it would, over the long term, equal its sediment transport capacity. Reach H-2 (station 208+00 to 92+00) results indicate that this is a general area of

Sediment Analysis DRAFT
August 2004 25
sediment aggradation with approximately 1,400 cubic yards of sediment being deposited during a 2-year rainfall event over 11,600 feet of channel running along Airway Boulevard and through the Las Positas Golf Course. Results for the downstream reach of Arroyo las Positas (Reach H-1, from station 92+00 to 0+00) indicate a degradational reach possibly due to the sudden contraction of the channel from 28 feet immediately upstream (Reach H-2) to 10 feet at Reach H-1. The largest sediment imbalance occurs at the downstream reach (Reach H-1, from station 35+00 to 0+00) with -12,000 cubic yards of sediment being eroded from the channel during a 2-year event. These results are consistent with field observations as identified in the Zone 7 SMMP Phase 1 Interim Report (RMC, March 2004) including recorded sedimentation occurring downstream of the Interstate 580 crossing and along Airway Boulevard.
Line G (Arroyo Mocho) Reach G-60 (station 620+00 to 552+00) was selected to be the upstream sediment boundary condition. Results for Reach G-60 (station 620+00 to 350+00) show a general zone of channel aggradation. The stretch of Arroyo Mocho between Wente Street and Stanley Boulevard (Reach G-60, from station 552+00 to 350+00) is generally aggrading with 180 cubic yards of sediment being deposited during a 2-year event. Aggradation is most severe between stations 425+00 and 410+00 (from the Holmes Street crossing to the Stanley Boulevard crossing), with 1,200 cubic yards being deposited along the 1,500-foot stretch of Line G-60. Degradation occurs immediately downstream (Reach G-60, from station 410+00 to 350+00), with 910 cubic yards being eroded from the channel during a 2-year event. However, overall, Reach G-60 remains a slightly aggradational reach. Results indicate an area of degradation along Arroyo Mocho at Reach G-50 (station 350+00 to 176+86) with an estimated 200 cubic yards of sediment being degraded along approximately 17,300 feet of channel during a 2-year event. However, the sediment carrying capacity of Reach G-50 increases with higher flows during larger magnitudes events. As a result, this reach becomes aggradational with approximately 47,000 cubic yards of sediment being deposited during a 100-year rainfall event.
Results for the remaining reaches in Arroyo Mocho indicate general aggradation with severe aggradation occurring just downstream of the confluence with Arroyo las Positas (Reach G-40). Mild channel degradation occurs at the downstream reach of Arroyo Mocho (Reach G-10) with -450 cubic yards of sediment being eroded along 4,000 feet of channel during a 2-year event.
Line F (Alamo Canal) Information on sediment size and channel geometry for Alamo Canal was limited to the reach immediately upstream of the confluence with Arroyo Mocho. As a result, this reach was assumed to be stable so that the sediment delivered to Arroyo de la Laguna was equal to its sediment transport capacity.
Line B (Arroyo de la Laguna) For a 2-year event, results indicate channel degradation at the upstream reach of Arroyo de la Laguna (Reach B-70), followed by channel aggradation for the middle reaches (Reach B-60, B-50, and B-40) and channel degradation for the downstream reaches (Reach B-30 and B-10). These results are consistent with field observations, in particular the observed severe bank erosion occurring in the downstream portions of ADLL, near Verona Bridge at station 195+00, or Reach B-30. A total of 12,000 cubic yards of bed load material is estimated to exit Arroyo de la Laguna during a 2-year event. This figure increases to 170,000 cubic yards during a 100-year rainfall event.

Sediment Analysis DRAFT
August 2004
176+86
B-30
B-50
40+00
373+00
335+00
307+90
238+20
B-40
B-60
B-70 G-10 G-20
350+00
150+00
70+00
92+00 208+00
G-30
G-40 H-1H-2
G-50
32+25 2+00
B-20
620+00
G-60
Sediment Imbalance (2-year)
Sediment Imbalance (100-year)
Reach
(tons/event) (yards3/event) (tons/event) (yards3/event) H-2 +2,100 +1,400 +100,000 +69,000 H-1 -20,000 -13,000 -160,000 -110,000 G-60 +210 +140 +14,000 +9,700 G-50 -290 -200 +69,000 +47,000 G-40 +13,000 +9,100 +110,000 +75,000 G-30 +6,700 +4,500 +52,000 +35,000 G-20 +720 +490 -1,400 -970 G-10 -660 -450 -1,400 -980 B-70 -100,000 -68,000 +23,000 +16,000 B-60 +5,600 +3,800 +6,000 +4,100 B-50 +78,000 +53,000 -13,000 -8,800 B-40 +10,000 +6,900 -85,000 -58,000 B-30 -6,200 -4,200 -43,000 -29,000 B-20 -17,000 -12,000 -260,000 -170,000
Significant Aggradation (2-year Event)
Mild Aggradation (2-year Event)
Significant Degradation (2-year Event)
Mild Degradation (2-year Event)
Figure 9: Scenario C Bed Load Transport Analysis
N

Sediment Analysis DRAFT
August 2004 27
Scenario D – Full Build-Out Development + Existing Channel Conveyance Capacity
Results of the reach-based bed load transport analysis for Scenario D are summarized in Table 8 and illustrated in Figure 10. Calculations performed and results are shown in Appendix E.
Table 8 – Scenario D Bed Load Transport Analysis Results
Line Reach US Station
DS Station
Sediment Imbalance 2-year Event (yards3/event)
Sediment Imbalance 100-year Event (yards3/event)
H-3 227+00 208+00 Upstream Sediment Boundary Condition
Upstream Sediment Boundary Condition
H-2 208+00 92+00 +3,000 +77,000 Arroyo las Positas (Line H)
H-1 92+00 0+00 -28,000 -110,000 G-60 620+00 552+00 Upstream Sediment
Boundary Condition Upstream Sediment Boundary Condition
G-60 552+00 350+00 +230 +10,000 G-50 350+00 176+86 -52 +50,000 G-40 173+50 150+00 +21,000 +75,000 G-30 150+00 70+00 +7,600 +35,000 G-20 70+00 40+00 +800 -970
Arroyo Mocho (Line G)
G-10 40+00 0+00 -740 +4,800 Alamo Canal (Line F)
F-10 11+00 0 Upstream Sediment Boundary Condition
Upstream Sediment Boundary Condition
B-70 392+00 373+00 -100,000 +17,000 B-60 373+00 335+00 +5,600 +540 B-50 335+00 307+90 +78,000 -11,000 B-40 307+90 238+20 +10,000 -57,000 B-30 238+20 32+25 -6,300 -48,000
Arroyo de la Laguna (Line B)
B-10 32+25 2+00 -18,000 -120,000
Line H (Arroyo las Positas) Reach H-3 (station 227+00 to 208+00) was selected to be the upstream sediment boundary condition. Reach H-2 (station 208+00 to 92+00) results indicate that this is a general area of sediment aggradation with approximately 3,000 cubic yards of sediment being deposited during a 2-year rainfall event over 11,600 feet of channel running along Airway Boulevard and through the Las Positas Golf Course. Results for the downstream reach of Arroyo las Positas (Reach H-1, from station 92+00 to 0+00) indicate a degradational reach again due to the sudden contraction of the channel from 28 feet immediately upstream (Reach H-2) to 10 feet at Reach H-1. As in Scenario C, the largest sediment imbalance occurs at the downstream reach (Reach H-1, from station 35+00 to 0+00) with -25,000 cubic yards of sediment being eroded from the channel during a 2-year event. This may be due to the sudden expansion of the channel from 10 feet immediately upstream (Reach H-1, from station 92+00 to 35+00) to 30 feet at Reach H-1 (station 35+00 to 0+00). The sudden channel expansion increases the sediment carrying capacity of the stream. However, because of the constriction upstream, not enough sediment is being delivered and the channel compensates by eroding from its banks or bed. These results are consistent with field observations as identified in the Zone 7 SMMP Phase 1 Interim Report (RMC, March 2004) including recorded sedimentation occurring downstream of the Interstate 580 crossing and along Airway Boulevard.

Sediment Analysis DRAFT
August 2004 28
Line G (Arroyo Mocho) Reach G-60 (station 620+00 to 552+00) was selected to be the upstream sediment boundary condition. Results for Reach G-60 (station 620+00 to 350+00) show a general zone of channel aggradation. As in Scenario C, the stretch of Arroyo Mocho between Wente Street and Stanley Boulevard (Reach G-60, from station 552+00 to 350+00) is generally aggrading with 230 cubic yards of sediment being deposited during a 2-year event. Aggradation is most severe between stations 425+00 and 410+00 (from the Holmes Street crossing to the Stanley Boulevard crossing), with 1,800 cubic yards being deposited along the 1,500-foot stretch of Line G-60. Degradation occurs immediately downstream (Reach G-60, from station 410+00 to 350+00), with 1,400 cubic yards being eroded from the channel during a 2-year event. However, overall, Reach G-60 remains a slightly aggradational reach. Results indicate a stable reach along Arroyo Mocho at Reach G-50 (station 350+00 to 176+86) with an estimated 52 cubic yards of sediment being degraded along approximately 17,300 feet of channel during a 2-year event. However, the sediment carrying capacity of Reach G-50 increases with higher flows during larger magnitudes events. As a result, this reach becomes less stable with aggradation occurring during a 100-year event.
Results for the remaining reaches in Arroyo Mocho indicate general aggradation with severe aggradation occurring just downstream of the confluence with Arroyo las Positas (Reach G-40). Mild channel degradation occurs at the downstream reach of Arroyo Mocho (Reach G-10) with 740 cubic yards of sediment being eroded along 4,000 feet of channel during a 2-year event. In contrast to results for Scenario C, this reach becomes aggradational with an increase in flows. As seen in Appendix E, the backwater depth for this reach under Scenario D is 18.68 feet, compared to a depth of 15.31 feet under Scenario C. This increase in depth is due to higher flows in ADLL for Scenario D, which are affected by backwater conditions. The higher depth in Scenario D translates to an increased sediment carrying capacity when compared to that of Scenario C.
Line F (Alamo Canal) Information on sediment size and channel geometry for Alamo Canal was limited to the reach immediately upstream of the confluence with Arroyo Mocho. As a result, this reach was assumed to be stable so that the sediment delivered to Arroyo de la Laguna was equal to its sediment transport capacity.
Line B (Arroyo de la Laguna) For a 2-year event, results indicate channel degradation at the upstream reach of Arroyo de la Laguna (Reach B-70), followed by channel aggradation for the middle reaches (Reach B-60, B-50, and B-40) and channel degradation for the downstream reaches (Reach B-30 and B-10). These results are consistent with field observations, in particular the observed severe bank erosion occurring in the downstream portions of ADLL, near Verona Bridge at station 195+00, or Reach B-30. A total of 18,000 cubic yards of bed load material is estimated to exit Arroyo de la Laguna during a 2-year event. This figure increases to 120,000 cubic yards during a 100-year rainfall event.

Sediment Analysis DRAFT
August 2004
176+86
B-30
B-50
40+00
373+00
335+00
307+90
238+20
B-40
B-60
B-70 G-10 G-20
350+00
150+00
70+00
92+00 208+00
G-30
G-40 H-1H-2
G-50
32+25 2+00
B-20
620+00
G-60
Sediment Imbalance (2-year)
Sediment Imbalance (100-year)
Reach
(tons/event) (yards3/event) (tons/event) (yards3/event) H-2 +4,400 +3,000 +110,000 +77,000 H-1 -42,000 -28,000 -160,000 -110,000 G-60 +340 +230 +15,000 +10,000 G-50 -77 -52 +73,000 +50,000 G-40 +31,000 +21,000 +110,000 +75,000 G-30 +11,000 +7,600 +52,000 +35,000 G-20 +1,200 +800 -1,400 -970 G-10 -1,100 -740 +7,100 +4,800 B-70 -150,000 -100,000 +25,000 +17,000 B-60 +8,300 +5,600 +800 +540 B-50 +110,000 +78,000 -16,000 -11,000 B-40 +15,000 +10,000 -83,000 -57,000 B-30 -9,300 -6,300 -71,000 -48,000 B-20 -26,000 -18,000 -180,000 -120,000
Figure 10: Scenario D Bedload Transport Analysis
N
Significant Aggradation (2-year Event)
Mild Aggradation (2-year Event)
Significant Degradation (2-year Event)
Mild Degradation (2-year Event)

Sediment Analysis DRAFT
August 2004 30
Scenario E – Full Build-Out Development + Implementation of SMMP Program
The Zone 7 SMMP Interim Report proposed construction of in-stream sediment basins at several identified aggradational reaches along Arroyo las Positas, Arroyo Mocho, and Alamo Canal. Table 9 below summarizes the location and size of these sediment basins. These were derived from field observations and are therefore based on existing development conditions and channel conveyance capacities.
Table 9 – Location and Size of Sediment Basins Proposed in Zone 7 SMMP Interim Report
Project No.
Reach US Station
DS Station
Location Size (acre-feet)
R.5-3 H-2 195+00 155+00 North of I-580 & downstream of confluence with Cayetano Creek
2.8
R.5-3 H-1 95+00 55+00 Downstream of confluence with Cayetano Creek
2.8
R.3-2 G-60 547+00 536+00 Robertson Park 16 R.3-6 G-60 390+00 360+00 Along Arroyo Mocho 7.35 R.9-7 F-10 0+00 5+00 Upstream of Interstate 580 crossing 1.84
An analysis of the adequacy of the proposed sediment basins was not conducted as part of this study. However, results from the sediment load analysis will be reviewed as part of Subtask 1.4: SMMP Project Refinement and recommendations on sediment basin locations, sizes, and maintenance schedule will be developed based on these results. For the purposes of this study, it was assumed that the proposed location and size of the sediment basins as presented in the Zone 7 SMMP Phase 1 Interim Report were adequate. The potential volumetric load of bed material to be detained in each sediment basin was assumed to be equal to the basin’s volume. In addition, it was assumed that the basins would be drained once a year. The resulting volumetric loads of retained bed material are shown in Table 10 below. Results of the long-term, reach-based bed load transport analysis for Scenario E are also summarized in Table 10 and illustrated in Figure 11. Details of the calculations performed are shown in Appendix E.
Table 10 – Scenario E Bed Load Transport Analysis Results
Line Reach US Station
DS Station
Sediment Imbalance
2-year Event (yards3/event)
Sediment Imbalance 100-
year Event (yards3/event)
Sediment Basin Capacity (yards3)
H-3 227+00 208+00 Upstream Sediment Boundary Condition
Upstream Sediment Boundary Condition
-
H-2 208+00 92+00 +3,000 +78,000 4,500
Arroyo las Positas (Line H)
H-1 92+00 0+00 -28,000 -91,000 4,500 G-60 620+00 552+00 Upstream
Sediment Boundary Condition
Upstream Sediment Boundary Condition
-
G-60 552+00 350+00 +230 +10,000 25,800 G-50 350+00 176+86 -52 +46,000 - G-40 173+50 150+00 +21,000 +60,000 - G-30 150+00 70+00 +7,600 +37,000 -
Arroyo Mocho (Line G)
G-20 70+00 40+00 +800 -850 -

Sediment Analysis DRAFT
August 2004 31
Line Reach US Station
DS Station
Sediment Imbalance
2-year Event (yards3/event)
Sediment Imbalance 100-
year Event (yards3/event)
Sediment Basin Capacity (yards3)
G-10 40+00 0+00 -740 +4,800 - Alamo Canal (Line F)
F-10 11+00 0 Upstream Sediment Boundary Condition
-
B-70 392+00 373+00 -100,000 +17,000 - B-60 373+00 335+00 +5,600 +580 - B-50 335+00 307+90 +78,000 -11,000 - B-40 307+90 238+20 +10,000 -58,000 - B-30 238+20 32+25 -6.300 -49,000 -
Arroyo de la Laguna (Line B)
B-10 32+25 2+00 -18,000 -120,000 -
Line H (Arroyo las Positas) The upstream reach of Arroyo las Positas (Reach H-3, from station 227+00 to station 208+00) was assumed to be stable so that the sediment delivered from this reach was equal to its sediment transport capacity. Reach H-2 (from station 208+00 to station 92+00) is shown to be aggradating with approximately 3,000 cubic yards of sediment being deposited during a 2-year event from station 208+00 (below I-580, at Airway Boulevard and Rotan Road) to 92+00 (at Las Positas Golf Course). During a 100-year storm event, the sediment transport capacity of reach H-2 (3.31 cfs), from Station 208+00 to 143+00, is greatly reduced compared to the adjacent upstream reach (25.17 cfs), possibly due to lower slope, or greater width of the channel bottom resulting in a reduction in flow velocity (4.82 ft/s vs. 7.97 ft/s upstream). The last reach in Arroyo las Positas (Reach H-1, from station 92+00 to station 0+00) is shown to be degrading. This may be due to the sudden constriction of the channel cross sectional area (490 ft2 at the upstream reach to 175 ft2 at Reach H-1 during a 2-year event), resulting in considerably higher flow velocities (2.25 ft/s at the upstream reach compared to 4.83 at Reach H-1) and sediment transport capacities (0.26 cfs at the upstream reach compared to 1.29 cfs at Reach H-1 for a 2-year storm event).
Line G (Arroyo Mocho) The upstream reach of Arroyo Mocho (Reach G-60, from station 620+00 to station 552+00) was assumed to be stable. As in Scenario D, the stretch of Arroyo Mocho between Wente Street and Stanley Boulevard (Reach G-60, from station 552+00 to 350+00) is generally aggrading with 230 cubic yards of sediment being deposited during a 2-year event. Aggradation is most severe between stations 425+00 and 410+00 (from the Holmes Street crossing to the Stanley Boulevard crossing), with 1,800 cubic yards being deposited along the 1,500-foot stretch of Line G-60. Degradation occurs immediately downstream (Reach G-60, from station 410+00 to 350+00), with 1,400 cubic yards being eroded from the channel during a 2-year event. However, overall, Reach G-60 remains a slightly aggradational reach. The sediment imbalance for the reach immediately upstream of the confluence of Arroyo las Positas and Arroyo Mocho (Reach G-50, from station 210+00 to station 176+86) is almost negligible during a 2-year event (-930 cubic yards over approximately 17,000 feet of channel). The reaches downstream of this confluence are shown to be aggradating except for Reach G10 during a 2-year storm event (station 40+00 to 0+00), and Reach G-20 during a 100-year storm event.
Line F (Alamo Canal) Information on sediment size and channel geometry for Alamo Canal was limited to the reach immediately upstream of the confluence with Arroyo Mocho. As a result, this reach was assumed to be stable so that the sediment delivered to Arroyo de la Laguna was equal to its sediment transport capacity.

Sediment Analysis DRAFT
August 2004 32
Line B (Arroyo de la Laguna) The reach at Arroyo de la Laguna immediately downstream of the confluence of Arroyo Mocho and Alamo Canal is shown to be degrading. The channel then goes through a cycle of aggradation (Reach B-60, B-50, and B-40 from station 373+00 to station 238+20) and degradation (Reach B-30 and B-10). The reaches immediately upstream of the confluence with Alameda Creek are shown to be degrading, with the greatest sediment imbalance occurring at the outlet reach (-18,000 cubic yards for a 2-year event).

Sediment Analysis DRAFT
August 2004
176+86
B-30
B-50
40+00
373+00
335+00
307+90
238+20
B-40
B-60
B-70 G-10 G-20
350+00
150+00
70+00
92+00 208+00
G-30
G-40 H-1H-2
G-50
32+25 2+00
B-20
620+00
G-60
Sediment Imbalance (2-year)
Sediment Imbalance (100-year)
Reach
(tons/event) (yards3/event) (tons/event) (yards3/event) H-2 +4,400 +3,000 +110,000 +78,000 H-1 -42,000 -28,000 -130,000 -91,000 G-60 +340 +230 +15,000 +10,000 G-50 -77 -52 +67,000 +46,000 G-40 +31,000 +21,000 +89,000 +60,000 G-30 +11,000 +7,600 +54,000 +37,000 G-20 +1,200 +800 -1,200 -850 G-10 -1,100 -740 +7,000 +4,800 B-70 -150,000 -100,000 +24,000 +17,000 B-60 +8,300 +5,600 +860 +580 B-50 +110,000 +78,000 -16,000 -11,000 B-40 +15,000 +10,000 -85,000 -58,000 B-30 -9,300 -6,300 -73,000 -49,000 B-20 -26,000 -18,000 -180,000 -120,000
Figure 11: Scenario E Bed Load Transport Analysis
N
Significant Aggradation (2-year Event)
Mild Aggradation (2-year Event)
Significant Degradation (2-year Event)
Mild Degradation (2-year Event)

Sediment Analysis DRAFT
August 2004 34
5.4 Summary of 2-year Rainfall Event Results Bed load transport results for the 2-year rainfall event for all three scenarios are summarized in Table 11 below.
Table 11 – Summary of Bed Load Transport Results for the 2-year Rainfall Event
Sediment Imbalance Line Reach US Station
DS Station Scenario C
(yards3/event) Scenario D
(yards3/event) Scenario E
(yards3/event) H-3 227+00 208+00 Upstream Sediment
Boundary Condition
Upstream Sediment Boundary Condition
Upstream Sediment Boundary Condition
H-2 208+00 92+00 +1,400 +3,000 +3,000
Arroyo las Positas (Line H)
H-1 92+00 0+00 -13,000 -28,000 -28,000 G-60 620+00 552+00 Upstream Sediment
Boundary Condition
Upstream Sediment Boundary Condition
Upstream Sediment Boundary Condition
G-60 552+00 350+00 +140 +230 +230 G-50 350+00 176+86 -200 -52 -52 G-40 173+50 150+00 +9,100 +21,000 +21,000 G-30 150+00 70+00 +4,500 +7,600 +7,600 G-20 70+00 40+00 +490 +800 +800
Arroyo Mocho (Line G)
G-10 40+00 0+00 -450 -740 -740 Alamo Canal (Line F)
F-10 11+00 0 Upstream Sediment Boundary Condition
Upstream Sediment Boundary Condition
Upstream Sediment Boundary Condition
B-70 392+00 373+00 -68,000 -100,000 -100,000 B-60 373+00 335+00 +3,800 +5,600 +5,600 B-50 335+00 307+90 +53,000 +78,000 +78,000 B-40 307+90 238+20 +6,900 +10,000 +10,000 B-30 238+20 32+25 -4,200 -6,300 -6.300
Arroyo de la Laguna (Line B)
B-10 32+25 2+00 -12,000 -18,000 -18,000 As shown above, degradation and aggradation trends under Scenario C are generally milder than that of Scenario D or Scenario E. This is due to an increase in impervious cover under full build-out development conditions resulting in a reduction in lag time and an increase in peak flows. Larger peak flows augment the channels’ sediment transport capacities resulting in an overall increase in aggradation or degradation trends. Degradation and aggradation trends under scenarios D and E are the same due to the similarity in flows under both scenarios for a 2-year rainfall event. As previously discussed, Reach H-2 along Arroyo las Positas and Reach G-50 along Arroyo Mocho have adequate channel capacity to accommodate flows up to a 3-year and 4-year rainfall event, respectively. Even if these channels were not improved, they would still have enough capacity to convey the 2-year event flows. The Zone 7 SMMP Phase 1 Interim Report does not recommend channel improvements to either Arroyo las Positas nor Arroyo Mocho. Instead, deficient channel capacities are addressed by diversion of flows into the Chain of Lakes when bank overtopping occurs. As discussed in Section 4, bank overtopping occurs under a 5-year or greater event. As a result, flows through these channels under a 2-year event are equal to those of Scenario D. Because sediment transport capacity is largely dependent on hydraulic conditions in the channel, the aggradation and degradation trends are also equal under both scenarios.

Sediment Analysis DRAFT
August 2004 35
6 Limitations of Sediment Load Analysis It is important to note that the scope for this task did not include new modeling efforts or field measurements such as sediment sampling. Data needed for the analysis including design hydrology, channel geometries, and sediment particle size distributions were obtained from previous studies conducted by Schaaf & Wheeler, West Yost & Associates, and Ayres Associates. The analyses conducted are based on static, empirically derived equations and is adequate for broad-planning purposes to obtain an order-of-magnitude estimate of sediment load. In the case of the bed material load analysis, the hydraulic conditions in the channel cannot be updated as bed elevation changes along the channel. As a result, specific parameters in the transport equation are static and cannot change based on aggradation or degradation in the channel. In addition, SMMP improvements such as bank stabilization cannot be factored into the analysis. The analysis will describe general trends of channel aggradation or degradation but it will not specify whether channel erosion is originating from the bed or banks.
7 Conclusions The total sediment load consists of the sediment eroded from overland areas (wash load) and the sediment eroded from the channel banks and bed (bed material load). As discussed in Section 4 (Wash Load Analysis), the suspended sediment yield exiting the watershed at the downstream reach of ADLL on an annual average basis was calculated using the PSIAC method. Bed material load was calculated by utilizing a bed load transport equation in conjunction with the continuity principle. Bed load was calculated on an event basis for the 2-year or 100-year rainfall events. In order to determine the long-term average bed load exiting the watershed at ADLL, a bed material load frequency curve would have to be developed utilizing bed load for a range of frequency events including the 2, 5, 10, 25, 50, and 100-year rainfall events. The area under the curve would represent the mean annual bed load and would be approximated by the following relation:
25102550100 4.02.008.004.0015.0015.0 sSsssss YYYYYYY +++++= Due to limitations in flow data for the 5, 10, 25 and 50-year events, the bed material load frequency curve could not be developed. As a result, the long-term mean annual bed load could not be calculated. Instead, the total sediment load will be presented as wash load and bed material load as show in Table 12 below.
Table 12 – Summary of Wash Load and Bed Material Load Exiting the Watershed
Wash Load Bed Material Load (2-year Event)
Bed Material Load (100-year Event)
Scenario (tons/year) (yards3/year) (tons/event) (yards3/event) (tons/event) (yards3/event) C 246,000 184,000 17,000 12,000 260,000 170,000 D 230,000 172,000 26,000 18,000 180,000 120,000 E 230,000 172,000 26,000 18,000 180,000 120,000 As previously discussed, the purpose of the sediment load analysis was to answer three questions: 1. What is the sediment yield today?
As seen in Table 12, the sediment yield today will be equal to the sediment load exiting ADLL under Scenario C, or 184,000 cubic yards of suspended sediment per year and 12,000 cubic yards of bed load during a 2-year event.
2. What will be the sediment yield at full build-out development conditions if recommended channel improvements are not implemented?

Sediment Analysis DRAFT
August 2004 36
As seen in Table 12, the sediment yield in the future without implementation of channel improvements will be equal to the sediment load exiting ADLL under Scenario D, or 172,000 cubic yards of suspended sediment per year and 18,000 cubic yards of bed load during a 2-year event.
3. What will be the sediment yield at full build-out development conditions if recommended SMMP improvements are implemented?
As seen in Table 12, the sediment yield in the future with implementation of the regional storage solution at the Chain of Lakes will be similar to that of Scenario D. The difference between Scenario D and E will be the management of flows and sediment in the watershed. Under Scenario D, flows will overtop the banks onto the adjacent floodplain resulting in flooding around Las Positas Golf Course and along Stanley Boulevard. Suspended sediment carried in the floodwaters will settle onto the floodplain. Under Scenario E, flows will not be allowed to overtop the banks. Instead, they will be diverted into the Chain of Lakes for temporary storage thereby alleviating the flooding around the Chain of Lakes area. The channels will still carry the same suspended sediment and bed load as in Scenario C. However, suspended sediment carried in water overtopping the bank will now settle in the storage ponds. As a result, sediment accumulation in detention storage should be looked at in more detail under the sediment maintenance program. Aggradation/degradation trends under Scenario D and E will also be similar. However, after construction of sediment basins the excess bed material load being deposited along aggradational reaches will be managed. After review of the degradational trends in Scenario E, the bank stabilization and grade control measures recommended in the Zone 7 SMMP Phase 1 Interim Report will be revisited as part of Subtask 1.4 (SMMP Project Refinement) to match field observation and results of the bed load transport analysis for Scenario E.
8 Recommendations The following tasks are recommended as part of Phase 2 of the SMMP Program:
• Consider suspended sediment accumulation in the Chain of Lakes detention ponds. • Re-visit location and size of recommended sediment basins. Develop a maintenance schedule
based on aggradation trends of Scenario E. • Re-visit bank stabilization and grade control measures in ADLL based on natural grade of stream,
field observations, and degradation trends of Scenario E. The following tasks are recommended for future phases of the SMMP Program:
• Conduct field verification of actual channel geometry. As discussed in Section 5, channel geometries (bottom width, side slopes, and bed slopes) were obtained from the Ayres Associates report and were assumed to be uniform for all scenarios and in accordance with the 1966 Flood Control Master Plan. In order to model actual conditions in the channel, a survey of existing channel geometries needs to be conducted. Data on actual channel geometries would be used to re-evaluate the sediment loads under scenarios C, and D, and E.
• Develop MIKE-11 sediment model in concert with development of an updated HEC-RAS model to simulate conditions under scenarios C, D, and E. These models would be used as a tool in conjunction with the stream Operations & Maintenance program.

Appendix A

Appendix A
Bibliography Alameda County Community Development Agency. East County Area Plan: A Portion of the Alameda County General Plan. Updated May, 2002. Annandale, George W. Pajaro River Watershed Study TM No. 1.2.4 Collection and Analysis of Sediment Data: Prepared for Raines, Melton & Carella Inc. February, 2002. Annandale, George W. Pajaro River Watershed Study TM No. 1.2.9 Development of Sediment Model: Prepared for Raines, Melton & Carella Inc. March, 2002. Ayres Associates. Zone 7 Water Agency Geomorphic and Sediment Transport Evaluation: Prepared for Zone 7 Water Agency and West Yost and Associates. December 2001. Livermore, City of. Community General Plan 2003-2025 Draft. March, 2004. Dublin, City of. General Plan. July, 1998. Pacific Southwest Inter-Agency Committee. Report of the Water Management Subcommittee: Factors Affecting Sediment Yield and Measures for the Reduction of Erosion and Sediment Yield. October 1968. Philip Williams & Associates, Ltd.. Upper Penitencia Creek Reconnaissance Level Sediment Assessment Project Conditions Evaluation: Prepared for U.S. Army Corps of Engineers, San Francisco District. April, 2003. Philip Williams & Associates, Ltd. Upper Penitencia Creek Reconnaissance Level Sediment Assessment: Existing Conditions Summary: Prepared for U.S. Army Corps of Engineers, San Francisco District. April, 2003. Raines, Melton & Carella, Inc. Zone 7 Stream Management Master Plan Phase 1 Interim Report. March, 2004. Resource Consultants & Engineers, Inc. Sediment and Erosion Design Guide: Prepared for Albuquerque Metropolitan Arroyo Flood Control Authority (AMAFCA). November 1994. San Ramon, City of. General Plan 2020. July, 2001. Schaaf & Wheeler Consulting Civil Engineers. Hydrologic Procedures and Design Discharges. December 1997. Schaaf & Wheeler Consulting Civil Engineers. Draft Zone 7 Special Drainage Area 7-1 Program Updated of Channel Improvement Costs: Prepared for Zone 7. June, 2000. Wallace, Roberts & Todd. Easter Dublin Specific Plan: Prepared for City of Dublin. January, 1994. West Yost & Associates. Flood Control Master Plan Issue Paper No. 2 Flood Flows in Zone 7 Channels. March, 2002.

Appendix A
West Yost &Associates. Flood Control Master Plan TM No. 5 Appendices. November, 2001.

Appendix B


Appendix C

Name Predominant Ground CoverYield Rate
(Acre-ft/mile2- year)Area(ft2)
Area(acres)
Area(miles2)
Sediment Yield(Acre-ft)
Sediment Yield(ft3/year)
Sediment Yield(tons/year)
Sediment Yield(yards3/year)
Line B2-1 and Tributaries Urban 0.29 57,715,298 1,325 2.07 0.600375192 26,152 1,295 969Grassland 0.93 37,972,375 872 1.36 1.266731316 55,179 2,731 2,044
95,687,673 2,197 3 2 81,331 4,026 3,012Re-aligned Arroyo las Positas Urban 0.29 42,202,775 969 1.51 0.439008377 19,123 947 708
Grassland 0.93 206,088,520 4,731 7.39 6.874965871 299,474 14,824 11,092Total: 248,291,295 5,700 9 7 318,597 15,771 11,800
Arroyo Seco Urban 0.29 18,326,869 421 0.66 0.190642656 8,304 411 308Grassland 0.93 389,312,756 8,937 13.96 12.98719556 565,722 28,003 20,953
Total: 407,639,625 9,358 15 13 574,027 28,414 21,260Cayetano Creek Urban 0.29 50,478 1 0.00 0.000525092 23 1 1
Grassland 0.93 307,076,248 7,050 11.01 10.24384437 446,222 22,088 16,527Total: 307,126,726 7,051 11 10 446,245 22,089 16,528
Tassajara Creek Urban 0.29 67,195,710 1,543 2.41 0.698993836 30,448 1,507 1,128Grassland 0.93 687,211,738 15,776 24.65 22.9248929 998,608 49,431 36,985
Total: 754,407,448 17,319 27 24 1,029,057 50,938 38,113Cottonwood Creek Urban 0.29 356,599 8 0.01 0.003709469 162 8 6
Grassland 0.93 120,283,036 2,761 4.31 4.012556205 174,787 8,652 6,474Total: 120,639,635 2,770 4 4 174,949 8,660 6,480
Line G3 Urban 0.29 77,052,237 1,769 2.76 0.801524955 34,914 1,728 1,293Grassland 0.93 26,886,474 617 0.96 0.896913572 39,070 1,934 1,447
103,938,711 2,386 4 2 73,984 3,662 2,740Collier Creek Urban 0.29 18,634,828 428 0.67 0.193846155 8,444 418 313
Grassland 0.93 113,697,290 2,610 4.08 3.792860404 165,217 8,178 6,119Total: 132,332,118 3,038 5 4 173,661 8,596 6,432
Chabot Canal Urban 0.29 143,135,859 3,286 5.13 1.488950451 64,859 3,211 2,402Grassland 0.93 3,191,654 73 0.11 0.106471289 4,638 230 172
Total: 146,327,513 3,359 5 2 69,497 3,440 2,574Tributaries to Alamo Canal Urban 0.29 740,122,399 16,991 26.55 7.699018158 335,369 16,601 12,421
Forest/Grassland 0.46 472,043,802 10,837 16.93 7.78886057 339,283 16,794 12,566Total: 1,212,166,201 27,828 43 15 674,652 33,395 24,987
Pleasanton Canal Urban 0.29 54,908,517 1,261 1.97 0.571178053 24,881 1,232 921Urban/Grassland 0.61 10,969,626 252 0.39 0.24002443 10,455 518 387
Total: 65,878,143 1,512 2 1 35,336 1,749 1,309Arroyo las Positas Urban 0.29 386,679,958 8,877 13.87 4.022383355 175,215 8,673 6,489
Grassland 0.93 667,011,406 15,312 23.93 22.25102426 969,255 47,978 35,898Total: 1,053,691,364 24,189 38 26 1,144,470 56,651 42,388
Arroyo Mocho Urban 0.29 55,233,789 1,268 1.98 0.574561651 25,028 1,239 927Forest/Grassland 0.46 1,035,509,305 23,772 37.14 17.08620589 744,275 36,842 27,566
Total: 1,090,743,094 25,040 39 18 769,303 38,081 28,493
TOTAL: 5,738,869,546 131,746 206 128 5,565,106 275,473 206,115
Sediment Yield (tons/acre-year) 2.09
Scenario AFull Build-Out Development + Full Channel Conveyance Capacity
Appendix C8/23/2004

Name Predominant Ground CoverYield Rate
(Acre-ft/mile2- year)Area(ft2)
Area(acres)
Area(miles2)
Sediment Yield(Acre-ft)
Sediment Yield(ft3/year)
Sediment Yield(tons/year)
Sediment Yield(yards3/year)
Line B2-1 and Tributaries Urban 0.29 56,547,085 1,298 2.03 0.588223022 25,623 1,268 949Grassland 0.93 39,140,588 899 1.40 1.305702069 56,876 2,815 2,107
95,687,673 2,197 3 2 82,499 4,084 3,056Re-aligned Arroyo las Positas Urban 0.29 42,364,662 973 1.52 0.440692376 19,197 950 711
Grassland 0.93 205,926,633 4,727 7.39 6.869565461 299,238 14,812 11,083Total: 248,291,295 5,700 9 7 318,435 15,763 11,794
Arroyo Seco Urban 0.29 17,744,061 407 0.64 0.184580079 8,040 398 298Grassland 0.93 389,895,564 8,951 13.99 13.00663762 566,569 28,045 20,984
Total: 407,639,625 9,358 15 13 574,609 28,443 21,282Cayetano Creek Grassland 0.93 307,126,726 7,051 11.02 10.24552829 446,295 22,092 16,529Tassajara Creek Urban 0.29 11,193,529 257 0.40 0.116439096 5,072 251 188
Grassland 0.93 743,213,919 17,062 26.66 24.79308568 1,079,987 53,459 39,999Total: 754,407,448 17,319 27 25 1,085,059 53,710 40,187
Cottonwood Creek Urban 0.29 346,538 8 0.01 0.003604809 157 8 6Grassland 0.93 120,293,097 2,762 4.31 4.012891837 174,802 8,653 6,474
Total: 120,639,635 2,770 4 4 174,959 8,660 6,480Line G3 Urban 0.29 4,157,422 95 0.15 0.043246992 1,884 93 70
Grassland 0.93 99,781,289 2,291 3.58 3.328632557 144,995 7,177 5,370103,938,711 2,386 4 3 146,879 7,271 5,440
Collier Creek Urban 0.29 11,745,859 270 0.42 0.122184634 5,322 263 197Grassland 0.93 120,586,259 2,768 4.33 4.02267149 175,228 8,674 6,490
Total: 132,332,118 3,038 5 4 180,550 8,937 6,687Chabot Canal Urban 0.29 60,942,550 1,399 2.19 0.633946223 27,615 1,367 1,023
Grassland 0.93 85,384,963 1,960 3.06 2.848381401 124,075 6,142 4,595Total: 146,327,513 3,359 5 3 151,690 7,509 5,618
Tributaries to Alamo Canal Urban 0.29 453,053,484 10,401 16.25 4.712824529 205,291 10,162 7,603Forest/Grassland 0.46 759,112,718 17,427 27.23 12.5255815 545,614 27,008 20,208
Total: 1,212,166,201 27,828 43 17 750,905 37,170 27,811Pleasanton Canal Urban 0.29 54,927,215 1,261 1.97 0.571372554 24,889 1,232 922
Urban/Grassland 0.61 10,950,928 251 0.39 0.239615306 10,438 517 387Total: 65,878,143 1,512 2 1 35,327 1,749 1,308
Arroyo las Positas Urban 0.29 336,866,093 7,733 12.08 3.504201697 152,643 7,556 5,653Grassland 0.93 716,825,271 16,456 26 24 1,041,641 51,561 -5,653
Total: 1,053,691,364 24,189 38 27 1,194,284 59,117 0Arroyo Mocho Urban 0.29 46,350,058 1,064 1.66 0.482149902 21,002 1,040 778
Forest/Grassland 0.46 1,044,393,036 23,976 37.46 17.23279005 750,660 37,158 27,802Total: 1,090,743,094 25,040 39 18 771,663 38,197 28,580
TOTAL: 5,738,869,546 131,746 206 136 5,913,154 292,701 174,773
Sediment Yield (tons/acre-year) 2.22
Scenario BExisting Development + Full Channel Conveyance Capacity
Appendix C8/23/2004

NamePredominant Ground Cover
Yield Rate(Acre-ft/mile2- year)
Area(ft2)
Area(acres)
Area(miles2)
Sediment Yield(Acre-ft)
Sediment Yield(ft3/year)
Sediment Yield(tons/year)
Sediment Yield(yards3/year)
Re-aligned Arroyo las Positas Urban 0.29 42,364,662 973 1.52 0.440692376 19,197 950 711Grassland 0.93 205,926,633 4,727 7.39 6.869565461 299,238 14,812 11,083
Total: 248,291,295 5,700 9 7 318,435 15,763 11,794Arroyo Seco Urban 0.29 17,744,061 407 0.64 0.184580079 8,040 398 298
Grassland 0.93 389,895,564 8,951 13.99 13.00663762 566,569 28,045 20,984Total: 407,639,625 9,358 15 13 574,609 28,443 21,282
Cayetano Creek Grassland 0.93 307,126,726 7,051 11.02 10.24552829 446,295 22,092 16,529Collier Creek Urban 0.29 11,745,859 270 0.42 0.122184634 5,322 263 197
Grassland 0.93 120,586,259 2,768 4.33 4.02267149 175,228 8,674 6,490Total: 132,332,118 3,038 5 4 180,550 8,937 6,687
Arroyo las Positas Urban 0.29 336,866,093 7,733 12.08 3.504201697 152,643 7,556 5,653Grassland 0.93 716,825,271 16,456 26 24 1,041,641 51,561 38,579
Total: 1,053,691,364 24,189 38 27 1,194,284 59,117 44,233Total Sediment Yield draining to Arroyo las Positas reach adjacent to Las Poisitas Golf Course: 62 2,714,173 134,352 100,525
27% (Total Sediment Yield draining to Arroyo las Positas reach adjacent to Las Poisitas Golf Course): 17 732827 36275 27142Remaining Sediment Yield at outlet of Arroyo las Positas: 45 1,981,346 98,077 73,383
Cottonwood Creek Urban 0.29 346,538 8 0.01 0.003604809 157 8 6Grassland 0.93 120,293,097 2,762 4.31 4.012891837 174,802 8,653 6,474
Total: 120,639,635 2,770 4 4 174,959 8,660 6,480Arroyo Mocho Urban 0.29 46,350,058 1,064 1.66 0.482149902 21,002 1,040 778
Forest/Grassland 0.46 1,044,393,036 23,976 37.46 17.23279005 750,660 37,158 27,802Total: 1,090,743,094 25,040 39 18 771,663 38,197 28,580
Total Sediment Yield draining to Arroyo Mocho: 18 771,663 38,197 28,58027% (Total Sediment Yield draining to Arroyo Mocho): 5 208,349 10,313 7,717
Remaining Sediment Yield at Outlet of Arroyo Mocho: 13 563,314 27,884 20,863
Line G3 Urban 0.29 4,157,422 95 0.15 0.043246992 1,884 93 70Grassland 0.93 99,781,289 2,291 3.58 3.328632557 144,995 7,177 5,370
103,938,711 2,386 4 3 146,879 7,271 5,440Tassajara Creek Urban 0.29 11,193,529 257 0.40 0.116439096 5,072 251 188
Grassland 0.93 743,213,919 17,062 26.66 24.79308568 1,079,987 53,459 39,999Total: 754,407,448 17,319 27 25 1,085,059 53,710 40,187
Chabot Canal Urban 0.29 60,942,550 1,399 2.19 0.633946223 27,615 1,367 1,023Grassland 0.93 85,384,963 1,960 3.06 2.848381401 124,075 6,142 4,595
Total: 146,327,513 3,359 5 3 151,690 7,509 5,618Tributaries to Alamo Canal Urban 0.29 453,053,484 10,401 16.25 4.712824529 205,291 10,162 7,603
Forest/Grassland 0.46 759,112,718 17,427 27.23 12.5255815 545,614 27,008 20,208Total: 1,212,166,201 27,828 43 17 750,905 37,170 27,811
Pleasanton Canal Urban 0.29 54,927,215 1,261 1.97 0.571372554 24,889 1,232 922Urban/Grassland 0.61 10,950,928 251 0.39 0.239615306 10,438 517 387
Total: 65,878,143 1,512 2 1 35,327 1,749 1,308Line B2-1 and Tributaries Urban 0.29 56,547,085 1,298 2.03 0.588223022 25,623 1,268 949
Grassland 0.93 39,140,588 899 1.40 1.305702069 56,876 2,815 2,10795,687,673 2,197 3 2 82,499 4,084 3,056
TOTAL: 5,738,869,546 131,746 206 114 4,971,978 246,113 184,147
Sediment Yield (tons/acre-year) 1.87
Scenario CExisting Development + Existing Channel Conveyance Capacity
Appendix C8/23/2004

NamePredominant Ground Cover
Yield Rate(Acre-ft/mile2-
year)Area(ft2)
Area(acres)
Area(miles2)
Sediment Yield(Acre-ft)
Sediment Yield(ft3/year)
Sediment Yield(tons/year)
Sediment Yield(yards3/year)
Re-aligned Arroyo las Positas Urban 0.29 42,202,775 969 1.51 0.439008377 19,123 947 708Grassland 0.93 206,088,520 4,731 7.39 6.874965871 299,474 14,824 11,092Total: 248,291,295 5,700 8.91 7 318,597 15,771 11,800
Arroyo Seco Urban 0.29 18,326,869 421 0.66 0.190642656 8,304 411 308Grassland 0.93 389,312,756 8,937 13.96 12.98719556 565,722 28,003 20,953Total: 407,639,625 9,358 14.62 13 574,027 28,414 21,260
Cayetano Creek Urban 0.29 50,478 1 0.0018 0.000525092 23 1 1Grassland 0.93 307,076,248 7,050 11.01 10.24384437 446,222 22,088 16,527
Total: 307,126,726 7,051 11 10 446,245 22,089 16,528Collier Creek Urban 0.29 18,634,828 428 0.67 0.193846155 8,444 418 313
Grassland 0.93 113,697,290 2,610 4.08 3.792860404 165,217 8,178 6,119Total: 132,332,118 3,038 4.75 4 173,661 8,596 6,432
Arroyo las Positas Urban 0.29 386,679,958 8,877 13.87 4.022383355 175,215 8,673 6,489Grassland 0.93 667,011,406 15,312 23.93 22.25102426 969,255 47,978 35,898Total: 1,053,691,364 24,189 37.80 26 1,144,470 56,651 42,388
Total Sediment Yield draining to Arroyo las Positas reach adjacent to Las Poisitas Golf Course: 61 2,656,999 131,521 98,40727% (Total Sediment Yield draining to Arroyo las Positas reach adjacent to Las Poisitas Golf Course): 16 717,390 35,511 26,570
Remaining Sediment Yield at outlet of Arroyo las Positas: 45 1,939,609 96,011 71,837
Cottonwood Creek Urban 0.29 356,599 8 0.01 0.003709469 162 8 6Grassland 0.93 120,283,036 2,761 4.31 4.012556205 174,787 8,652 6,474Total: 120,639,635 2,770 4.33 4 174,949 8,660 6,480
Arroyo Mocho Urban 0.29 55,233,789 1,268 1.98 0.574561651 25,028 1,239 927Forest/Grassland 0.46 1,035,509,305 23,772 37.14 17.08620589 744,275 36,842 27,566Total: 1,090,743,094 25,040 39.13 17.66076755 769,303 38,081 28,493
Total Sediment Yield draining to Arroyo Mocho: 18 769,303 38,081 28,49327% (Total Sediment Yield draining to Arroyo Mocho): 5 207,712 10,282 7,693
Remaining Sediment Yield at Outlet of Arroyo Mocho: 13 561,591 27,799 20,800
Line G3 Urban 0.29 77,052,237 1,769 2.76 0.801524955 34,914 1,728 1,293Grassland 0.93 26,886,474 617 0.96 0.896913572 39,070 1,934 1,447
103,938,711 2,386 3.73 2 73,984 3,662 2,740Tassajara Creek Urban 0.29 67,195,710 1,543 2.41 0.698993836 30,448 1,507 1,128
Grassland 0.93 687,211,738 15,776 24.65 22.9248929 998,608 49,431 36,985Total: 754,407,448 17,319 27.06 24 1,029,057 50,938 38,113
Chabot Canal Urban 0.29 143,135,859 3,286 5.13 1.488950451 64,859 3,211 2,402Grassland 0.93 3,191,654 73 0.11 0.106471289 4,638 230 172Total: 146,327,513 3,359 5.25 2 69,497 3,440 2,574
Tributaries to Alamo Canal Urban 0.29 740,122,399 16,991 26.55 7.699018158 335,369 16,601 12,421Forest/Grassland 0.46 472,043,802 10,837 16.93 7.78886057 339,283 16,794 12,566Total: 1,212,166,201 27,828 43.48 15 674,652 33,395 24,987
Pleasanton Canal Urban 0.29 54,908,517 1,261 1.97 0.571178053 24,881 1,232 921Urban/Grassland 0.61 10,969,626 252 0.39 0.24002443 10,455 518 387Total: 65,878,143 1,512 2.36 1 35,336 1,749 1,309
Line B2-1 and Tributaries Urban 0.29 57,715,298 1,325 2.07 0.600375192 26,152 1,295 969Grassland 0.93 37,972,375 872 1.36 1.266731316 55,179 2,731 2,044
95,687,673 2,197 3.43 2 81,331 4,026 3,012
TOTAL: 5,738,869,546 131,746 206 107 4,640,005 229,680 171,852
Sediment Yield (tons/acre-year) 1.74
Scenario DFull Build-Out Development + Existing Channel Conveyance Capacity
Appendix C8/23/2004

NamePredominant Ground Cover
Yield Rate(Acre-ft/mile2-
year)Area(ft2)
Area(acres)
Area(miles2)
Sediment Yield(Acre-ft)
Sediment Yield(ft3/year)
Sediment Yield(tons/year)
Sediment Yield(yards3/year)
Re-aligned Arroyo las Positas Urban 0.29 42,202,775 969 1.51 0.439008377 19,123 947 708Grassland 0.93 206,088,520 4,731 7.39 6.874965871 299,474 14,824 11,092Total: 248,291,295 5,700 8.91 7 318,597 15,771 11,800
Arroyo Seco Urban 0.29 18,326,869 421 0.66 0.190642656 8,304 411 308Grassland 0.93 389,312,756 8,937 13.96 12.98719556 565,722 28,003 20,953Total: 407,639,625 9,358 14.62 13 574,027 28,414 21,260
Cayetano Creek Urban 0.29 50,478 1 0.0018 0.000525092 23 1 1Grassland 0.93 307,076,248 7,050 11.01 10.24384437 446,222 22,088 16,527
Total: 307,126,726 7,051 11 10 446,245 22,089 16,528Collier Creek Urban 0.29 18,634,828 428 0.67 0.193846155 8,444 418 313
Grassland 0.93 113,697,290 2,610 4.08 3.792860404 165,217 8,178 6,119Total: 132,332,118 3,038 4.75 4 173,661 8,596 6,432
Arroyo las Positas Urban 0.29 386,679,958 8,877 13.87 4.022383355 175,215 8,673 6,489Grassland 0.93 667,011,406 15,312 23.93 22.25102426 969,255 47,978 35,898Total: 1,053,691,364 24,189 37.80 26 1,144,470 56,651 42,388
Total Sediment Yield draining to Arroyo las Positas reach adjacent to Las Poisitas Golf Course: 61 2,656,999 131,521 98,40727% to storage at Chain of Lakes: 16 717,390 35,511 26,570
Remaining Sediment Yield at outlet of Arroyo las Positas: 45 1,939,609 96,011 71,837
Cottonwood Creek Urban 0.29 356,599 8 0.01 0.003709469 162 8 6Grassland 0.93 120,283,036 2,761 4.31 4.012556205 174,787 8,652 6,474Total: 120,639,635 2,770 4.33 4 174,949 8,660 6,480
Arroyo Mocho Urban 0.29 55,233,789 1,268 1.98 0.574561651 25,028 1,239 927Forest/Grassland 0.46 1,035,509,305 23,772 37.14 17.08620589 744,275 36,842 27,566Total: 1,090,743,094 25,040 39.13 17.66076755 769,303 38,081 28,493
Total Sediment Yield draining to Arroyo Mocho: 18 769,303 38,081 28,49327% to storage at Chain of Lakes: 5 207,712 10,282 7,693
Remaining Sediment Yield at Outlet of Arroyo Mocho: 13 561,591 27,799 20,800
Line G3 Urban 0.29 77,052,237 1,769 2.76 0.801524955 34,914 1,728 1,293Grassland 0.93 26,886,474 617 0.96 0.896913572 39,070 1,934 1,447
103,938,711 2,386 3.73 2 73,984 3,662 2,740Tassajara Creek Urban 0.29 67,195,710 1,543 2.41 0.698993836 30,448 1,507 1,128
Grassland 0.93 687,211,738 15,776 24.65 22.9248929 998,608 49,431 36,985Total: 754,407,448 17,319 27.06 24 1,029,057 50,938 38,113
Chabot Canal Urban 0.29 143,135,859 3,286 5.13 1.488950451 64,859 3,211 2,402Grassland 0.93 3,191,654 73 0.11 0.106471289 4,638 230 172Total: 146,327,513 3,359 5.25 2 69,497 3,440 2,574
Tributaries to Alamo Canal Urban 0.29 740,122,399 16,991 26.55 7.699018158 335,369 16,601 12,421Forest/Grassland 0.46 472,043,802 10,837 16.93 7.78886057 339,283 16,794 12,566Total: 1,212,166,201 27,828 43.48 15 674,652 33,395 24,987
Pleasanton Canal Urban 0.29 54,908,517 1,261 1.97 0.571178053 24,881 1,232 921Urban/Grassland 0.61 10,969,626 252 0.39 0.24002443 10,455 518 387Total: 65,878,143 1,512 2.36 1 35,336 1,749 1,309
Line B2-1 and Tributaries Urban 0.29 57,715,298 1,325 2.07 0.600375192 26,152 1,295 969Grassland 0.93 37,972,375 872 1.36 1.266731316 55,179 2,731 2,044
95,687,673 2,197 3.43 2 81,331 4,026 3,012
TOTAL: 5,738,869,546 131,746 206 107 4,640,005 229,680 171,852
Sediment Yield (tons/acre-year) 1.74
Scenario EFull Build-Out Development + Implementation of SMMP Program
Appendix C8/23/2004

Appendix D

Flows Exceedance Probability x-Year Event Flows Exceedance Probability x-Year Event(cfs) (cfs)
1 100 1 1 100 11,100 2 50 2 370 2 50 2
3 33.33333333 3 3 33.33333333 34 25 4 4 25 45 20 5 5 20 56 16.66666667 6 6 16.66666667 67 14.28571429 7 7 14.28571429 78 12.5 8 8 12.5 89 11.11111111 9 9 11.11111111 9
10 10 10 10 10 1011 9.090909091 11 11 9.090909091 1112 8.333333333 12 12 8.333333333 1213 7.692307692 13 13 7.692307692 1314 7.142857143 14 14 7.142857143 14
5,300 15 6.666666667 15 2,300 15 6.666666667 1516 6.25 16 16 6.25 1617 5.882352941 17 17 5.882352941 1718 5.555555556 18 18 5.555555556 1819 5.263157895 19 19 5.263157895 1920 5 20 20 5 2021 4.761904762 21 21 4.761904762 2122 4.545454545 22 22 4.545454545 2223 4.347826087 23 23 4.347826087 2324 4.166666667 24 24 4.166666667 2425 4 25 25 4 2526 3.846153846 26 26 3.846153846 2627 3.703703704 27 27 3.703703704 2728 3.571428571 28 28 3.571428571 2829 3.448275862 29 29 3.448275862 2930 3.333333333 30 30 3.333333333 3031 3.225806452 31 31 3.225806452 3132 3.125 32 32 3.125 3233 3.03030303 33 33 3.03030303 3334 2.941176471 34 34 2.941176471 3435 2.857142857 35 35 2.857142857 3536 2.777777778 36 36 2.777777778 3637 2.702702703 37 37 2.702702703 3738 2.631578947 38 38 2.631578947 3839 2.564102564 39 39 2.564102564 3940 2.5 40 40 2.5 4041 2.43902439 41 41 2.43902439 4142 2.380952381 42 42 2.380952381 4243 2.325581395 43 43 2.325581395 4344 2.272727273 44 44 2.272727273 4445 2.222222222 45 45 2.222222222 4546 2.173913043 46 46 2.173913043 4647 2.127659574 47 47 2.127659574 4748 2.083333333 48 48 2.083333333 4849 2.040816327 49 49 2.040816327 4950 2 50 50 2 5051 1.960784314 51 51 1.960784314 5152 1.923076923 52 52 1.923076923 5253 1.886792453 53 53 1.886792453 5354 1.851851852 54 54 1.851851852 5455 1.818181818 55 55 1.818181818 5556 1.785714286 56 56 1.785714286 5657 1.754385965 57 57 1.754385965 5758 1.724137931 58 58 1.724137931 5859 1.694915254 59 59 1.694915254 5960 1.666666667 60 60 1.666666667 6061 1.639344262 61 61 1.639344262 6162 1.612903226 62 62 1.612903226 6263 1.587301587 63 63 1.587301587 6364 1.5625 64 64 1.5625 6465 1.538461538 65 65 1.538461538 6566 1.515151515 66 66 1.515151515 6667 1.492537313 67 67 1.492537313 6768 1.470588235 68 68 1.470588235 6869 1.449275362 69 69 1.449275362 6970 1.428571429 70 70 1.428571429 7071 1.408450704 71 71 1.408450704 7172 1.388888889 72 72 1.388888889 7273 1.369863014 73 73 1.369863014 7374 1.351351351 74 74 1.351351351 7475 1.333333333 75 75 1.333333333 7576 1.315789474 76 76 1.315789474 7677 1.298701299 77 77 1.298701299 7778 1.282051282 78 78 1.282051282 7879 1.265822785 79 79 1.265822785 7980 1.25 80 80 1.25 80
Future Flows @ Las Positas Golf Course on Arroyo las Positas (Location H-2)
(Schaaf & Wheeler, June 2000)
Future Flows @ Cope Lake on Arroyo Mocho (Location G-50)
(Schaaf & Wheeler, June 2000)

Flows Exceedance Probability x-Year Event Flows Exceedance Probability x-Year Event(cfs) (cfs)
Future Flows @ Las Positas Golf Course on Arroyo las Positas (Location H-2)
(Schaaf & Wheeler, June 2000)
Future Flows @ Cope Lake on Arroyo Mocho (Location G-50)
(Schaaf & Wheeler, June 2000)
81 1.234567901 81 81 1.234567901 8182 1.219512195 82 82 1.219512195 8283 1.204819277 83 83 1.204819277 8384 1.19047619 84 84 1.19047619 8485 1.176470588 85 85 1.176470588 8586 1.162790698 86 86 1.162790698 8687 1.149425287 87 87 1.149425287 8788 1.136363636 88 88 1.136363636 8889 1.123595506 89 89 1.123595506 8990 1.111111111 90 90 1.111111111 9091 1.098901099 91 91 1.098901099 9192 1.086956522 92 92 1.086956522 9293 1.075268817 93 93 1.075268817 9394 1.063829787 94 94 1.063829787 9495 1.052631579 95 95 1.052631579 9596 1.041666667 96 96 1.041666667 9697 1.030927835 97 97 1.030927835 9798 1.020408163 98 98 1.020408163 9899 1.01010101 99 99 1.01010101 99
9,600 100 1 100 4,700 100 1 100

Future Flows @ Las Positas Golf Course on Arroyo las Positas (Location H-2)(Schaaf & Wheeler, June 2000)
0
1
10
100
1,000
10,000
100,000
110100
Exceedance Probability (%)
Dis
char
ge (c
fs)
Current Capacitythrough Reach H-2 = 1,800 cfs
Exceedance Probability = 37%,or equivalent to a 3-year event

Future Flows at Cope Lake on Arroyo Mocho (Location G-50)(Schaaf & Wheeler, June 2000)
0
1
10
100
1,000
10,000
100,000
110100
Exceedance Probability (%)
Dis
char
ge (c
fs)
Current Capacitythrough Reach G-50 = 900 cfs
Exceedance Probability = 28%,or equivalent to a 4-year event

Appendix E

FUTURE BUILD-OUT + FULL CONVEYANCE CAPACITY
Location Future Flows Existing Flows Resulting Flows Existing Channel CapacitiesResulting Flows (peak at Arroyo
Mocho) Existing Channel Capacities Resulting FlowsFlows through Channels w/
Storage Resulting FlowsG-60 4,700 4,500 4,500 4,500 4,700 4,700G-50 4,700 4,700 4,700 900 900 900 900 1,300 1,300G-40 12,700 11,600 11,600 3,200 3,200 3,300G-30 13,100 12,000 16,200 3,600 16,200 3,600 3,700G-20 16,500 15,100 7,700 7,700 7,800 7,800G-10 16,900 15,300 15,500 18,200 8,100 18,200 8,100 8,200H-3 9,000 8,200 8,200 9,000 9,000H-2 9,600 8,700 1,800 1,800 1,800 1,800 1,500 1,500H-1 10,100 9,200 9,200 2,300 2,300 2,000F-10 6,500 5,400 8,500 5,400 8,500 6,500 6,500B-70 23,400 20,900 20,900 13,500 14,600 14,700B-60 23,400 20,900 19,600 15,000 19,600 16,200 16,300 16,300B-50 25,500 22,700 22,700 18,700 17,200 18,700 18,600 18,700 18,700B-40 25,800 23,000 17,500 18,900 19,000B-30 26,100 23,300 17,800 19,200 19,300B-10 27,000 24,100 18,600 20,100 20,200
Schaaf & Wheeler, June 2000 (Table 1)
RMC, TM#2, December 2003 (Figure B-3)
Resulting Flows (Calculated)
RMC Interim Report, March 2004 (Figure 4.2)
Resulting Flows (Calculated)
RMC Interim Report, March 2004 (figure 4.2)
Resulting Flows (Calculated)
West Yost & Associates, November 2001 (Table
TM5A-27)Resulting Flows
(Calculated)
Arro
yo M
ocho
Arro
yo
las
Pos
itas
Arro
yo d
e la
La
guna
EXISTING DEVELOPMENT CONDITIONS + FULL CONVEYANCE CAPACITY
EXISTING DEVELOPMENT CONDITIONS + EXISTING CHANNEL CAPACITY
100-Year Flows
FUTURE BUILD-OUT + IMPLEMENTATION OF SMMP PROGRAMFUTURE BUILD-OUT + EXISTING CHANNEL CAPACITY
Appendix E8/23/2004

FUTURE BUILD-OUT + FULL CONVEYANCE CAPACITY
Location Future Flows Existing Flows Resulting Flows Existing Channel Capacities
Flows Existing Development Conditions + Full Conveyance
Capacity Resulting Flows Existing Channel CapacitiesFlows Future Build-Out + Full
Conveyance Capacity Resulting FlowsFlows through Channels w/
Storage Resulting FlowsG-60 350 245 245 245 250 350 350 350 350G-50 370 610 300 900 300 300 900 370 370 370 370G-40 1,400 1,000 1,000 1,000 1,400 1,400 1,400 1,400G-30 1,600 730 1,100 16,200 1,100 1,100 16,200 1,600 1,600 1,600 1,600G-20 2,000 970 1,400 1,400 1,400 2,000 2,000 2,000 2,000G-10 2,200 1,500 18,200 1,500 1,500 18,200 2,200 2,200 2,200 2,200H-3 1,000 530 530 530 530 1,000 1,000 1,000 1,000H-2 1,100 600 1,800 600 600 1,800 1,100 1,100 1,100 1,100H-1 1,200 700 700 700 1,200 1,200 1,200 1,200F-10 1,500 1,200 8,500 1,200 1,200 8,500 1,500 1,500 1,500 1,500B-70 3,700 2,700 2,700 2,700 3,700 3,700 3,700 3,700B-60 3,700 2,700 19,600 2,700 2,700 19,600 3,700 3,700 3,700 3,700B-50 4,100 3,000 18,700 3,000 3,000 18,700 4,100 4,100 4,100 4,100B-40 4,200 3,100 3,100 3,100 4,200 4,200 4,200 4,200B-30 4,400 3,200 3,200 3,200 4,400 4,400 4,400 4,400B-10 4,600 3,300 3,300 3,300 4,600 4,600 4,600 4,600
Schaaf & Wheeler, June 2000 (Table 1)
Schaaf & Wheeler, December 1997 (Table
1)Resulting Flows
(Calculated)RMC Interim Report,
March 2004 (Figure 4.2)
Schaaf & Wheeler, December 1997 (Table
1)Resulting Flows
(Calculated)RMC Interim Report,
March 2004 (Figure 4.2)Schaaf & Wheeler, June
2000 (Table 1)Resulting Flows
(Calculated)
Future Build-Out + Existing Channel
CapacityResulting Flows
(Calculated)
2-Year Flows
FUTURE BUILD-OUT + IMPLEMENTATION OF SMMP PROGRAM
Arro
yo M
ocho
Arro
yo
las
Pos
itas
Arro
yo d
e la
La
guna
EXISTING DEVELOPMENT CONDITIONS + FULL CONVEYANCE CAPACITY EXISTING DEVELOPMENT CONDITIONS + EXISTING CHANNEL CAPACITY FUTURE BUILD-OUT + EXISTING CHANNEL CAPACITY
Appendix E8/23/2004

Line Channel Name US Station DS Station
[L]Reach Length
(ft)
[b]Bottom Width
(ft)
[z]Side
Slopes(_H:1V)
[S]Bed Slope Manning's n
Event(yr)
[Q]Flow (cfs)
[d]Manning
Depth(ft)
[d]Backwater
Depth (WYA)1
(ft)
[A]Area(ft2)
[P]Wetted
Perimeter(ft)
[Rh]Hydraulic
Radius(ft)
Top Width(ft)
[V]Velocity
(ft/s) d16 (mm)d50
(mm) d84 (mm)d90
(mm) Gr
Reach Capacity(cfs/ft)
Reach Capacity
(cfs)Reach Capacity
(ft3/event)
Aggradation/Degradation
(cfs)
Aggradation/Degradation(tons/event)
Aggradation/Degradation
(yards3/event)
Aggradation/Degradation
2-year Event by Reach(tons/event)
Aggradation/Degradation
100-year Event by Reach(tons/event)
H-3 H Arroyo las Positas 22,700 20,800 1,900 30 10.00 0.004300 0.045 2-year 1,000 3.78 - 255.76 105.88 2.42 105.50 3.91 0.60 6.50 11.30 11.30 6.29 0.0113 1.19 102,98222,700 20,800 1,900 30 10.00 0.004300 0.037 100-year 9,000 - 12.40 1,909.60 279.24 6.84 278.00 4.71 0.60 6.50 11.30 11.30 6.29 0.0158 4.40 380,452
H-2 H Arroyo las Positas 20,800 14,300 6,500 70 3.00 0.002900 0.045 2-year 1,100 3.58 - 288.87 92.63 3.12 91.47 3.81 0.50 2.60 9.00 10.10 4.33 0.0154 1.41 121,666 -0.22 -1.0E+03 -6.9E+0220,800 14,300 6,500 70 3.00 0.002900 0.037 100-year 9,600 - 11.48 1,198.97 142.61 8.41 138.88 8.01 0.50 2.60 9.00 10.10 4.33 0.1658 23.02 1,988,971 -18.62 -8.8E+04 -6.0E+04
H-2 H Arroyo las Positas 14,300 12,500 1,800 40 10.00 0.002700 0.045 2-year 1,100 4.08 - 329.66 122.01 2.70 121.60 3.34 0.50 2.60 9.00 10.10 4.33 0.0092 1.12 96,418 0.29 1.4E+03 9.4E+0214,300 12,500 1,800 40 10.00 0.002700 0.036 100-year 9,600 - 9.53 1,289.41 231.55 5.57 230.60 7.45 0.50 2.60 9.00 10.10 4.33 0.1342 30.94 2,673,131 -7.92 -3.7E+04 -2.5E+04
H-2 H Arroyo las Positas 12,500 9,200 3,300 28 9.00 0.000800 0.044 2-year 1,100 5.98 - 489.83 136.37 3.59 135.71 2.25 0.50 2.60 9.00 10.10 4.33 0.0019 0.26 22,696 0.85 4.0E+03 2.7E+0312,500 9,200 3,300 28 9.00 0.000800 0.033 100-year 9,600 - 4.10 266.09 102.25 2.60 101.80 36.08 0.50 2.60 9.00 10.10 4.33 54.3812 5,536.00 478,310,772 -5,505.07 -2.6E+07 -1.8E+07
H-1 H Arroyo las Positas 9,200 3,500 5,700 10 2.00 0.002500 0.045 2-year 1,200 8.93 - 248.56 49.91 4.98 45.70 4.83 0.50 2.60 9.00 10.10 4.33 0.0281 1.29 111,089 -1.02 -4.8E+03 -3.3E+039,200 3,500 5,700 10 2.00 0.002500 0.036 100-year 10,100 - 9.37 269.29 51.90 5.19 47.48 37.51 0.50 2.60 9.00 10.10 4.33 49.3018 2,340.85 202,249,274 3,195.16 1.5E+07 1.0E+07
H-1 H Arroyo las Positas 3,500 0 3,500 30 5.50 0.012000 0.044 2-year 1,200 3.54 - 174.95 69.55 2.52 68.91 6.86 0.50 2.60 9.00 10.10 4.33 0.1327 9.15 790,278 -7.86 -3.7E+04 -2.5E+043,500 0 3,500 30 5.50 0.012000 0.035 100-year 10,100 - 9.05 721.96 131.18 5.50 129.55 13.99 0.50 2.60 9.00 10.10 4.33 1.3614 176.37 15,238,250 2,164.48 1.0E+07 6.9E+06
G-60 G Arroyo Mocho 62,000 55,200 6,800 130 1.25 0.008800 0.042 2-year 350 0.88 - 115.37 132.82 0.87 132.20 3.03 1.60 10.40 12.30 13.00 3.84 0.0041 0.54 46,71762,000 55,200 6,800 130 1.25 0.008800 0.036 100-year 4,700 - 10.23 1,460.72 162.75 8.98 155.58 3.22 1.60 10.40 12.30 13.00 3.84 0.0025 0.39 33,621
G-60 G Arroyo Mocho 55,200 42,500 12,700 40 1.50 0.008000 0.043 2-year 350 1.85 - 79.13 46.67 1.70 45.55 4.41 1.60 10.40 12.30 13.00 3.84 0.0129 0.59 50,953 -0.05 -2.3E+02 -1.6E+0255,200 42,500 12,700 40 1.50 0.008000 0.036 100-year 4,700 - 13.06 778.25 87.09 8.94 79.18 6.04 1.60 10.40 12.30 13.00 3.84 0.0232 1.84 158,714 -1.45 -6.8E+03 -4.6E+03
G-60 G Arroyo Mocho 42,500 41,000 1,500 60 1.50 0.000880 0.044 2-year 350 2.86 - 183.66 70.30 2.61 68.57 1.91 1.60 10.40 12.30 13.00 3.84 0.0005 0.04 3,170 0.55 2.6E+03 1.8E+0342,500 41,000 1,500 60 1.50 0.000880 0.036 100-year 4,700 - 14.00 1,134.00 110.48 10.26 102.00 4.14 1.60 10.40 12.30 13.00 3.84 0.0058 0.59 50,709 1.25 5.9E+03 4.0E+03
G-60 G Arroyo Mocho 41,000 35,000 6,000 65 1.50 0.007100 0.043 2-year 350 1.44 - 96.71 70.19 1.38 69.32 3.62 1.60 10.40 12.30 13.00 3.84 0.0068 0.47 40,474 -0.43 -2.0E+03 -1.4E+0341,000 35,000 6,000 65 1.50 0.007100 0.036 100-year 4,700 - 16.18 1,444.39 123.34 11.71 113.54 3.25 1.60 10.40 12.30 13.00 3.84 0.0023 0.26 22,382 0.33 1.5E+03 1.0E+03
G-50 G Arroyo Mocho 35,000 31,000 4,000 40 2.00 0.003800 0.044 2-year 370 2.40 - 107.52 50.73 2.12 49.60 3.44 1.60 10.40 12.30 13.00 3.84 0.0049 0.24 20,924 0.23 1.1E+03 7.2E+0235,000 31,000 4,000 40 2.00 0.003800 0.037 100-year 4,700 - 11.69 740.91 92.28 8.03 86.76 6.34 1.60 10.40 12.30 13.00 3.84 0.0287 2.49 214,883 -2.23 -1.0E+04 -7.1E+03
G-50 G Arroyo Mocho 31,000 21,200 9,800 60 2.00 0.003500 0.045 2-year 370 1.97 - 125.96 68.81 1.83 67.88 2.93 1.60 10.40 12.30 13.00 3.84 0.0029 0.19 16,834 0.05 2.2E+02 1.5E+0231,000 21,200 9,800 60 2.00 0.003500 0.038 100-year 4,700 - 12.27 1,037.31 114.87 9.03 109.08 4.53 1.60 10.40 12.30 13.00 3.84 0.0083 0.90 78,004 1.58 7.5E+03 5.1E+03
G-50 G Arroyo Mocho 21,200 17,686 3,514 70 3.00 0.007700 0.045 2-year 370 1.42 - 105.45 78.98 1.34 78.52 3.52 1.60 10.40 12.30 13.00 3.84 0.0062 0.48 41,883 -0.29 -1.4E+03 -9.3E+0221,200 17,686 3,514 70 3.00 0.007700 0.038 100-year 4,700 - 14.19 1,597.37 159.75 10.00 155.14 2.94 1.60 10.40 12.30 13.00 3.84 0.0016 0.25 22,000 0.65 3.1E+03 2.1E+03
G-40 G Arroyo Mocho 17,350 15,000 2,350 60 2.50 0.008100 0.048 2-year 1,400 3.48 - 239.08 78.74 3.04 77.40 5.86 1.40 6.00 10.50 10.60 3.02 0.0382 2.96 255,602 6.67 3.1E+04 2.1E+0417,350 15,000 2,350 60 2.50 0.008100 0.039 100-year 12,700 - 20.93 2,350.96 172.71 13.61 164.65 5.40 1.40 6.00 10.50 10.60 3.02 0.0169 2.78 240,426 173.84 8.2E+05 5.6E+05
G-30 G Arroyo Mocho 15,000 12,686 2,314 60 2.60 0.000810 0.047 2-year 1,600 7.14 - 560.95 99.78 5.62 97.13 2.85 1.40 6.00 10.50 10.60 3.02 0.0022 0.22 18,838 2.74 1.3E+04 8.8E+0315,000 12,686 2,314 60 2.60 0.000810 0.038 100-year 13,100 - 17.89 1,905.54 159.67 11.93 153.03 6.87 1.40 6.00 10.50 10.60 3.02 0.0426 6.53 563,764 -3.74 -1.8E+04 -1.2E+04
G-30 G Arroyo Mocho 12,686 10,151 2,535 60 2.00 0.001400 0.046 2-year 1,600 6.17 - 446.00 87.58 5.09 84.66 3.59 1.40 6.00 10.50 10.60 3.02 0.0054 0.46 39,555 -0.24 -1.1E+03 -7.7E+0212,686 10,151 2,535 60 2.00 0.001400 0.038 100-year 13,100 - 17.18 1,621.10 136.83 11.85 128.72 8.08 1.40 6.00 10.50 10.60 3.02 0.0778 10.02 865,615 -3.49 -1.6E+04 -1.1E+04
G-30 G Arroyo Mocho 10,151 7,000 3,151 60 2.00 0.001660 0.045 2-year 1,600 5.80 - 415.28 85.94 4.83 83.20 3.86 1.40 6.00 10.50 10.60 3.02 0.0072 0.60 51,489 -0.14 -6.5E+02 -4.4E+0210,151 7,000 3,151 60 2.00 0.001660 0.038 100-year 13,100 - 18.19 1,753.15 141.35 12.40 132.76 7.47 1.40 6.00 10.50 10.60 3.02 0.0575 7.64 659,812 2.38 1.1E+04 7.6E+03
G-20 G Arroyo Mocho 7,000 4,000 3,000 60 2.00 0.000940 0.047 2-year 2,000 7.94 - 602.67 95.52 6.31 91.77 3.32 1.40 6.00 10.50 10.60 3.02 0.0038 0.35 29,985 0.25 1.2E+03 8.0E+027,000 4,000 3,000 60 2.00 0.000940 0.039 100-year 16,500 - 21.49 2,213.04 156.11 14.18 145.96 7.46 1.40 6.00 10.50 10.60 3.02 0.0544 7.94 685,640 -0.30 -1.4E+03 -9.6E+02
G-10 G Arroyo Mocho 4,000 0 4,000 60 2.00 0.001300 0.047 2-year 2,200 7.65 - 575.77 94.20 6.11 90.59 3.82 1.40 6.00 10.50 10.60 3.02 0.0064 0.58 50,060 -0.23 -1.1E+03 -7.4E+024,000 0 4,000 60 2.00 0.001300 0.039 100-year 16,900 - 24.27 2,634.27 168.54 15.63 157.08 6.42 1.40 6.00 10.50 10.60 3.02 0.0303 4.76 411,562 3.17 1.5E+04 1.0E+04
F-10 F Alamo Canal 1,100 0 1,100 30 2.50 0.001420 0.047 2-year 1,500 8.04 - 402.80 73.30 5.50 70.20 3.72 0.50 2.10 10.10 10.90 4.50 0.0130 0.91 78,7791,100 0 1,100 30 2.50 0.001420 0.038 100-year 6,500 - 15.34 1,048.49 112.61 9.31 106.70 6.20 0.50 2.10 10.10 10.90 4.50 0.0695 7.41 640,269
B-70 B Arroyo de la Laguna 39,200 37,300 1,900 80 2.00 0.007500 0.043 2-year 3,700 5.06 - 456.01 102.63 4.44 100.24 8.11 0.50 1.00 3.70 10.00 2.85 0.3269 32.77 2,831,142 -31.28 -1.5E+05 -1.0E+0539,200 37,300 1,900 80 2.00 0.007500 0.037 100-year 23,400 - 31.71 4,547.85 221.81 20.50 206.84 5.15 0.50 1.00 3.70 10.00 2.85 0.0365 7.54 651,669 4.63 2.2E+04 1.5E+04
B-60 B Arroyo de la Laguna 37,300 33,500 3,800 80 2.00 0.007500 0.044 2-year 3,700 5.13 - 463.03 102.94 4.50 100.52 7.99 0.50 1.00 3.70 10.00 2.85 0.3084 31.00 2,678,807 1.76 8.3E+03 5.6E+0337,300 33,500 3,800 80 2.00 0.007500 0.038 100-year 23,400 - 34.22 5,079.62 233.04 21.80 216.88 4.61 0.50 1.00 3.70 10.00 2.85 0.0238 5.17 446,403 2.38 1.1E+04 7.6E+03
B-50 B Arroyo de la Laguna 33,500 30,790 2,710 55 1.50 0.001900 0.044 2-year 4,100 10.11 - 708.94 91.43 7.75 85.32 5.78 0.50 1.00 3.70 10.00 2.85 0.0778 6.64 573,472 24.37 1.1E+05 7.8E+0433,500 30,790 2,710 55 1.50 0.001900 0.038 100-year 25,500 - 36.56 4,015.75 186.82 21.50 164.68 6.35 0.50 1.00 3.70 10.00 2.85 0.0754 12.42 1,072,966 -7.25 -3.4E+04 -2.3E+04
B-40 B Arroyo de la Laguna 30,790 23,820 6,970 30 1.50 0.001200 0.045 2-year 4,200 15.35 - 814.09 85.35 9.54 76.06 5.16 0.50 1.00 3.70 10.00 2.85 0.0454 3.46 298,530 3.18 1.5E+04 1.0E+0430,790 23,820 6,970 30 1.50 0.001200 0.038 100-year 25,800 - 34.03 2,757.96 152.70 18.06 132.09 9.35 0.50 1.00 3.70 10.00 2.85 0.3167 41.83 3,614,004 -29.41 -1.4E+05 -9.4E+04
B-30 B Arroyo de la Laguna 23,820 17,845 5,975 40 1.00 0.001700 0.045 2-year 4,400 13.60 - 729.09 78.47 9.29 67.20 6.03 0.50 1.00 3.70 10.00 2.85 0.0834 5.60 484,003 -2.15 -1.0E+04 -6.9E+0323,820 17,845 5,975 40 1.00 0.001700 0.037 100-year 26,100 - 30.07 2,107.00 125.05 16.85 100.14 12.39 0.50 1.00 3.70 10.00 2.85 0.9147 91.60 7,914,092 -49.77 -2.3E+05 -1.6E+05
B-30 B Arroyo de la Laguna 17,845 9,960 7,885 50 2.00 0.002500 0.047 2-year 4,400 10.24 - 722.08 95.81 7.54 90.98 6.09 0.80 2.40 5.60 7.00 2.67 0.0534 4.85 419,472 0.75 3.5E+03 2.4E+0317,845 9,960 7,885 50 2.00 0.002500 0.038 100-year 26,100 - 26.87 2,787.49 170.17 16.38 157.48 9.36 0.80 2.40 5.60 7.00 2.67 0.1936 30.49 2,633,997 61.11 2.9E+05 2.0E+05
B-30 B Arroyo de la Laguna 9,960 3,225 6,735 30 2.00 0.002800 0.047 2-year 4,400 12.20 - 663.92 84.57 7.85 78.81 6.63 0.80 2.40 5.60 7.00 2.67 0.0689 5.43 469,097 -0.57 -2.7E+03 -1.8E+039,960 3,225 6,735 30 2.00 0.002800 0.038 100-year 26,100 - 25.07 2,009.11 142.12 14.14 130.28 12.99 0.80 2.40 5.60 7.00 2.67 0.6526 85.03 7,346,287 -54.54 -2.6E+05 -1.7E+05
B-10 B Arroyo de la Laguna 3,225 200 3,025 10 3.00 0.005000 0.047 2-year 4,600 12.37 - 583.00 88.25 6.61 84.24 7.89 0.80 2.40 5.60 7.00 2.67 0.1299 10.94 945,445 -5.51 -2.6E+04 -1.8E+043,225 200 3,025 10 3.00 0.005000 0.037 100-year 27,000 - 23.23 1,851.20 156.92 11.80 149.38 14.59 0.80 2.40 5.60 7.00 2.67 1.0181 152.08 13,139,620 -67.05 -3.2E+05 -2.1E+05
[Boundary Condition]
[Boundary Condition]
[Boundary Condition]
CHANNEL DATA FLOW DATA BED MATERIAL DATA SEDIMENT TRANSPORT DATA
-1.1E+03
[Bounday Condition]
-1.5E+05
8.3E+03
1.1E+05
4.4E+03
3.1E+04
1.1E+04
1.2E+03
-4.2E+04
-2.6E+04
[Bounday Condition]
3.4E+02
-7.7E+01
[Bounday Condition]
-1.4E+03
1.5E+04
[Bounday Condition]
-2.6E+07
2.5E+07
[Bounday Condition]
6.1E+02
2.1E+01
8.2E+05
-2.3E+04
[Bounday Condition]
2.2E+04
1.1E+04
-3.4E+04
-1.4E+05
-3.2E+05
1.5E+04
-9.3E+03
Scenario A: Full Build-Out Development + Full Conveyance Capacity
SUMMARY RESULTS
-2.0E+05
1 West Yost & Associates, November 2001 (Table TM5A-5 of Appendices)
Appendix E8/23/2004

Line Channel Name US Station DS Station
[L]Reach Length
(ft)
[b]Bottom Width
(ft)
[z]Side
Slopes(_H:1V)
[S]Bed Slope Manning's n
Event(yr)
[Q]Flow (cfs)
[d]Manning
Depth(ft)
[d]Backwater
Depth (WYA)1
(ft)
[A]Area(ft2)
[P]Wetted
Perimeter(ft)
[Rh]Hydraulic
Radius(ft)
Top Width(ft)
[V]Velocity
(ft/s) d16 (mm)d50
(mm) d84 (mm)d90
(mm) Gr
Reach Capacity(cfs/ft)
Reach Capacity
(cfs)Reach Capacity
(ft3/event)
Aggradation/Degradation
(cfs)
Aggradation/Degradation(tons/event)
Aggradation/Degradation
(yards3/event)
Aggradation/Degradation
2-year Event by Reach(tons/event)
Aggradation/Degradation
100-year Event by Reach(tons/event)
H-3 H Arroyo las Positas 22,700 20,800 1,900 30 10.00 0.004300 0.045 2-year 530 2.78 - 160.77 85.90 1.87 85.62 3.30 0.60 6.50 11.30 11.30 6.29 0.0066 0.57 49,08622,700 20,800 1,900 30 10.00 0.004300 0.037 100-year 8,200 - 12.24 1,865.38 276.02 6.76 274.80 4.40 0.60 6.50 11.30 11.30 6.29 0.0123 3.39 292,742
H-2 H Arroyo las Positas 20,800 14,300 6,500 70 3.00 0.002900 0.045 2-year 600 2.51 - 194.94 85.90 2.27 85.08 3.08 0.50 2.60 9.00 10.10 4.33 0.0079 0.67 57,850 -0.10 -4.8E+02 -3.2E+0220,800 14,300 6,500 70 3.00 0.002900 0.037 100-year 8,700 - 10.99 1,131.64 139.51 8.11 135.94 7.69 0.50 2.60 9.00 10.10 4.33 0.1447 19.67 1,699,814 -16.29 -7.7E+04 -5.2E+04
H-2 H Arroyo las Positas 14,300 12,500 1,800 40 10.00 0.002700 0.045 2-year 600 3.02 - 212.00 100.70 2.11 100.40 2.83 0.50 2.60 9.00 10.10 4.33 0.0055 0.55 47,329 0.12 5.7E+02 3.9E+0214,300 12,500 1,800 40 10.00 0.002700 0.036 100-year 8,700 - 9.40 1,259.60 228.94 5.50 228.00 6.91 0.50 2.60 9.00 10.10 4.33 0.1024 23.35 2,017,706 -3.68 -1.7E+04 -1.2E+04
H-2 H Arroyo las Positas 12,500 9,200 3,300 28 9.00 0.000800 0.044 2-year 600 4.54 - 312.62 110.22 2.84 109.72 1.92 0.50 2.60 9.00 10.10 4.33 0.0012 0.13 11,190 0.42 2.0E+03 1.3E+0312,500 9,200 3,300 28 9.00 0.000800 0.033 100-year 8,700 - 4.32 288.92 106.24 2.72 105.76 30.11 0.50 2.60 9.00 10.10 4.33 27.6903 2,928.53 253,024,927 -2,905.18 -1.4E+07 -9.3E+06
H-1 H Arroyo las Positas 9,200 3,500 5,700 10 2.00 0.002500 0.045 2-year 700 6.96 - 166.48 41.13 4.05 37.84 4.21 0.50 2.60 9.00 10.10 4.33 0.0183 0.69 59,720 -0.56 -2.6E+03 -1.8E+039,200 3,500 5,700 10 2.00 0.002500 0.036 100-year 9,200 - 8.92 248.33 49.89 4.98 45.68 37.05 0.50 2.60 9.00 10.10 4.33 47.8152 2,184.20 188,714,542 744.33 3.5E+06 2.4E+06
H-1 H Arroyo las Positas 3,500 0 3,500 30 5.50 0.012000 0.044 2-year 700 2.67 - 119.31 59.85 1.99 59.37 5.88 0.50 2.60 9.00 10.10 4.33 0.0818 4.85 419,438 -4.16 -2.0E+04 -1.3E+043,500 0 3,500 30 5.50 0.012000 0.035 100-year 9,200 - 8.94 707.78 129.95 5.45 128.34 13.00 0.50 2.60 9.00 10.10 4.33 1.0448 134.09 11,585,248 2,050.11 9.7E+06 6.6E+06
G-60 G Arroyo Mocho 62,000 55,200 6,800 130 1.25 0.008800 0.042 2-year 245 0.71 - 93.06 132.28 0.70 131.78 2.63 1.60 10.40 12.30 13.00 3.84 0.0026 0.34 29,66262,000 55,200 6,800 130 1.25 0.008800 0.036 100-year 4,500 - 9.93 1,414.16 161.79 8.74 154.83 3.18 1.60 10.40 12.30 13.00 3.84 0.0024 0.38 32,410
G-60 G Arroyo Mocho 55,200 42,500 12,700 40 1.50 0.008000 0.043 2-year 245 1.50 - 63.38 45.41 1.40 44.50 3.87 1.60 10.40 12.30 13.00 3.84 0.0086 0.38 32,942 -0.04 -1.8E+02 -1.2E+0255,200 42,500 12,700 40 1.50 0.008000 0.036 100-year 4,500 - 12.82 759.33 86.22 8.81 78.46 5.93 1.60 10.40 12.30 13.00 3.84 0.0218 1.71 147,591 -1.33 -6.3E+03 -4.3E+03
G-60 G Arroyo Mocho 42,500 41,000 1,500 60 1.50 0.000880 0.044 2-year 245 2.31 - 146.60 68.33 2.15 66.93 1.67 1.60 10.40 12.30 13.00 3.84 0.0004 0.02 2,038 0.36 1.7E+03 1.1E+0342,500 41,000 1,500 60 1.50 0.000880 0.036 100-year 4,500 - 13.62 1,095.46 109.11 10.04 100.86 4.11 1.60 10.40 12.30 13.00 3.84 0.0056 0.57 48,927 1.14 5.4E+03 3.7E+03
G-60 G Arroyo Mocho 41,000 35,000 6,000 65 1.50 0.007100 0.043 2-year 245 1.16 77.69 69.20 1.12 68.49 3.15 1.60 10.40 12.30 13.00 3.84 0.0044 0.30 25,849 -0.28 -1.3E+03 -8.8E+0241,000 35,000 6,000 65 1.50 0.007100 0.036 100-year 4,500 - 15.82 1,403.71 122.04 11.50 112.46 3.21 1.60 10.40 12.30 13.00 3.84 0.0022 0.24 21,132 0.32 1.5E+03 1.0E+03
G-50 G Arroyo Mocho 35,000 31,000 4,000 40 2.00 0.003800 0.044 2-year 300 2.12 - 93.79 49.48 1.90 48.48 3.20 1.60 10.40 12.30 13.00 3.84 0.0039 0.19 16,157 0.11 5.3E+02 3.6E+0235,000 31,000 4,000 40 2.00 0.003800 0.037 100-year 4,700 - 11.69 740.91 92.28 8.03 86.76 6.34 1.60 10.40 12.30 13.00 3.84 0.0287 2.49 214,883 -2.24 -1.1E+04 -7.2E+03
G-50 G Arroyo Mocho 31,000 21,200 9,800 60 2.00 0.003500 0.045 2-year 300 1.75 - 110.79 67.80 1.63 66.98 2.72 1.60 10.40 12.30 13.00 3.84 0.0023 0.15 13,049 0.04 1.7E+02 1.2E+0231,000 21,200 9,800 60 2.00 0.003500 0.038 100-year 4,700 - 12.27 1,037.31 114.87 9.03 109.08 4.53 1.60 10.40 12.30 13.00 3.84 0.0083 0.90 78,004 1.58 7.5E+03 5.1E+03
G-50 G Arroyo Mocho 21,200 17,686 3,514 70 3.00 0.007700 0.045 2-year 300 1.25 - 92.19 77.91 1.18 77.50 3.25 1.60 10.40 12.30 13.00 3.84 0.0048 0.37 31,980 -0.22 -1.0E+03 -7.0E+0221,200 17,686 3,514 70 3.00 0.007700 0.038 100-year 4,700 - 14.19 1,597.37 159.75 10.00 155.14 2.94 1.60 10.40 12.30 13.00 3.84 0.0016 0.25 22,000 0.65 3.1E+03 2.1E+03
G-40 G Arroyo Mocho 17,350 15,000 2,350 60 2.50 0.008100 0.048 2-year 1,000 2.86 - 191.68 75.37 2.54 74.28 5.20 1.40 6.00 10.50 10.60 3.02 0.0263 1.95 168,752 3.27 1.5E+04 1.0E+0417,350 15,000 2,350 60 2.50 0.008100 0.039 100-year 11,600 - 19.58 2,133.24 165.44 12.89 157.90 5.44 1.40 6.00 10.50 10.60 3.02 0.0176 2.79 240,790 131.56 6.2E+05 4.2E+05
G-30 G Arroyo Mocho 15,000 12,686 2,314 60 2.60 0.000810 0.047 2-year 1,100 5.79 434.11 92.23 4.71 90.08 2.53 1.40 6.00 10.50 10.60 3.02 0.0015 0.14 12,053 1.81 8.5E+03 5.8E+0315,000 12,686 2,314 60 2.60 0.000810 0.038 100-year 12,000 - 17.60 1,861.38 158.06 11.78 151.52 6.45 1.40 6.00 10.50 10.60 3.02 0.0339 5.13 443,602 -2.35 -1.1E+04 -7.5E+03
G-30 G Arroyo Mocho 12,686 10,151 2,535 60 2.00 0.001400 0.046 2-year 1,100 4.97 347.20 82.20 4.22 79.86 3.17 1.40 6.00 10.50 10.60 3.02 0.0037 0.29 25,199 -0.15 -7.2E+02 -4.9E+0212,686 10,151 2,535 60 2.00 0.001400 0.038 100-year 12,000 - 16.30 1,509.38 132.90 11.36 125.20 7.95 1.40 6.00 10.50 10.60 3.02 0.0745 9.32 805,512 -4.19 -2.0E+04 -1.3E+04
G-30 G Arroyo Mocho 10,151 7,000 3,151 60 2.00 0.001660 0.045 2-year 1,100 4.67 323.50 80.87 4.00 78.66 3.40 1.40 6.00 10.50 10.60 3.02 0.0048 0.38 32,743 -0.09 -4.1E+02 -2.8E+0210,151 7,000 3,151 60 2.00 0.001660 0.038 100-year 12,000 - 17.02 1,600.56 136.12 11.76 128.08 7.50 1.40 6.00 10.50 10.60 3.02 0.0594 7.60 656,941 1.72 8.1E+03 5.5E+03
G-20 G Arroyo Mocho 7,000 4,000 3,000 60 2.00 0.000940 0.047 2-year 1,400 6.48 472.95 88.99 5.31 85.93 2.96 1.40 6.00 10.50 10.60 3.02 0.0026 0.23 19,616 0.15 7.2E+02 4.9E+027,000 4,000 3,000 60 2.00 0.000940 0.039 100-year 15,100 - 20.67 2,094.70 152.44 13.74 142.68 7.21 1.40 6.00 10.50 10.60 3.02 0.0486 6.94 599,367 0.67 3.1E+03 2.1E+03
G-10 G Arroyo Mocho 4,000 0 4,000 60 2.00 0.001300 0.047 2-year 1,500 6.15 444.22 87.48 5.08 84.58 3.38 1.40 6.00 10.50 10.60 3.02 0.0043 0.37 31,717 -0.14 -6.6E+02 -4.5E+024,000 0 4,000 60 2.00 0.001300 0.039 100-year 15,500 - 23.58 2,526.83 165.45 15.27 154.32 6.13 1.40 6.00 10.50 10.60 3.02 0.0260 4.01 346,176 2.93 1.4E+04 9.4E+03
F-10 F Alamo Canal 1,100 0 1,100 30 2.50 0.001420 0.047 2-year 1,200 7.17 - 343.62 68.61 5.01 65.85 3.50 0.50 2.10 10.10 10.90 4.50 0.0107 0.71 60,9441,100 0 1,100 30 2.50 0.001420 0.038 100-year 5,400 - 16.98 1,230.20 121.44 10.13 114.90 4.39 0.50 2.10 10.10 10.90 4.50 0.0191 2.20 189,878
B-70 B Arroyo de la Laguna 39,200 37,300 1,900 80 2.00 0.007500 0.043 2-year 2,700 4.21 - 371.76 98.81 3.76 96.82 7.26 0.50 1.00 3.70 10.00 2.85 0.2301 22.28 1,925,197 -21.21 -1.0E+05 -6.8E+0439,200 37,300 1,900 80 2.00 0.007500 0.037 100-year 20,900 - 28.87 3,976.55 209.11 19.02 195.48 5.26 0.50 1.00 3.70 10.00 2.85 0.0405 7.92 683,912 -1.71 -8.1E+03 -5.5E+03
B-60 B Arroyo de la Laguna 37,300 33,500 3,800 80 2.00 0.007500 0.044 2-year 2,700 4.26 - 377.29 99.06 3.81 97.05 7.15 0.50 1.00 3.70 10.00 2.85 0.2171 21.07 1,820,648 1.21 5.7E+03 3.9E+0337,300 33,500 3,800 80 2.00 0.007500 0.038 100-year 20,900 - 31.09 4,420.38 219.04 20.18 204.36 4.73 0.50 1.00 3.70 10.00 2.85 0.0269 5.50 475,595 2.41 1.1E+04 7.7E+03
B-50 B Arroyo de la Laguna 33,500 30,790 2,710 55 1.50 0.001900 0.044 2-year 3,000 8.46 - 572.26 85.48 6.69 80.37 5.24 0.50 1.00 3.70 10.00 2.85 0.0573 4.61 397,883 16.47 7.8E+04 5.3E+0433,500 30,790 2,710 55 1.50 0.001900 0.038 100-year 22,700 - 35.62 3,862.28 183.43 21.06 161.86 5.88 0.50 1.00 3.70 10.00 2.85 0.0573 9.27 801,231 -3.77 -1.8E+04 -1.2E+04
B-40 B Arroyo de la Laguna 30,790 23,820 6,970 30 1.50 0.001200 0.045 2-year 3,100 13.13 - 652.15 77.32 8.43 69.38 4.75 0.50 1.00 3.70 10.00 2.85 0.0352 2.45 211,260 2.16 1.0E+04 6.9E+0330,790 23,820 6,970 30 1.50 0.001200 0.038 100-year 23,000 - 33.02 2,626.08 149.06 17.62 129.06 8.76 0.50 1.00 3.70 10.00 2.85 0.2512 32.42 2,800,736 -23.14 -1.1E+05 -7.4E+04
B-30 B Arroyo de la Laguna 23,820 17,845 5,975 40 1.00 0.001700 0.045 2-year 3,200 11.34 - 582.20 72.07 8.08 62.68 5.50 0.50 1.00 3.70 10.00 2.85 0.0625 3.92 338,526 -1.47 -6.9E+03 -4.7E+0323,820 17,845 5,975 40 1.00 0.001700 0.037 100-year 23,300 - 29.27 2,027.53 122.79 16.51 98.54 11.49 0.50 1.00 3.70 10.00 2.85 0.7010 69.08 5,968,426 -36.66 -1.7E+05 -1.2E+05
B-30 B Arroyo de la Laguna 17,845 9,960 7,885 50 2.00 0.002500 0.047 2-year 3,200 8.60 - 577.75 88.45 6.53 84.39 5.54 0.80 2.40 5.60 7.00 2.67 0.0396 3.35 289,044 0.57 2.7E+03 1.8E+0317,845 9,960 7,885 50 2.00 0.002500 0.038 100-year 23,300 - 26.27 2,693.73 167.48 16.08 155.08 8.65 0.80 2.40 5.60 7.00 2.67 0.1459 22.63 1,954,979 46.45 2.2E+05 1.5E+05
B-30 B Arroyo de la Laguna 9,960 3,225 6,735 30 2.00 0.002800 0.047 2-year 3,200 10.38 - 526.75 76.41 6.89 71.51 6.08 0.80 2.40 5.60 7.00 2.67 0.0526 3.76 325,175 -0.42 -2.0E+03 -1.3E+039,960 3,225 6,735 30 2.00 0.002800 0.038 100-year 23,300 - 24.85 1,980.55 141.13 14.03 129.40 11.76 0.80 2.40 5.60 7.00 2.67 0.4556 58.96 5,093,836 -36.33 -1.7E+05 -1.2E+05
B-10 B Arroyo de la Laguna 3,225 200 3,025 10 3.00 0.005000 0.047 2-year 3,300 10.76 - 454.71 78.03 5.83 74.54 7.26 0.80 2.40 5.60 7.00 2.67 0.0997 7.43 642,065 -3.67 -1.7E+04 -1.2E+043,225 200 3,025 10 3.00 0.005000 0.037 100-year 24,100 - 21.74 1,635.28 147.50 11.09 140.44 14.74 0.80 2.40 5.60 7.00 2.67 1.0780 151.39 13,079,895 -92.43 -4.4E+05 -3.0E+05
BED MATERIAL DATA SEDIMENT TRANSPORT DATAFLOW DATACHANNEL DATA
-1.7E+04
5.7E+03
7.8E+04
1.0E+04
1.5E+04
7.4E+03
7.2E+02
-6.6E+02
[Bounday Condition]
-1.0E+05
-6.2E+03
2.1E+02
-3.3E+02
-2.2E+04
[Bounday Condition]
[Bounday Condition][Boundary Condition]
[Boundary Condition]
[Boundary Condition]
[Bounday Condition]
-1.4E+07
SUMMARY RESULTS
2.1E+03
1.3E+07
[Bounday Condition]
6.1E+02
-4.7E+01
6.2E+05
-2.3E+04
3.1E+03
1.4E+04
[Bounday Condition]
-8.1E+03
1.1E+04
-1.8E+04
-1.1E+05
-1.2E+05
-4.4E+05
1 Calculated by interpolation from flows provided in Table TM5A-5 of West Yost & Associates, November 2001 (Appendices)
Scenario B: Existing Development + Full Conveyance Capacity
Appendix E8/23/2004

Line Channel Name US Station DS Station
[L]Reach Length
(ft)
[b]Bottom Width
(ft)
[z]Side
Slopes(_H:1V)
[S]Bed Slope Manning's n
Event(yr)
[Q]Flow (cfs)
[d]Manning
Depth(ft)
[d]Backwater
Depth (WYA)1
(ft)
[A]Area(ft2)
[P]Wetted
Perimeter(ft)
[Rh]Hydraulic
Radius(ft)
Top Width(ft)
[V]Velocity
(ft/s) d16 (mm)d50
(mm) d84 (mm)d90
(mm) Gr
Reach Capacity(cfs/ft)
Reach Capacity
(cfs)Reach Capacity
(ft3/event)
Aggradation/Degradation
(cfs)
Aggradation/Degradation(tons/event)
Aggradation/Degradation
(yards3/event)
Aggradation/Degradation
2-year Event by Reach(tons/event)
Aggradation/Degradation
100-year Event by Reach(tons/event)
H-3 H Arroyo las Positas 22,700 20,800 1,900 30 10.00 0.004300 0.045 2-year 530 2.78 - 160.77 85.90 1.87 85.62 3.30 0.60 6.50 11.30 11.30 6.29 0.0066 0.57 49,08622,700 20,800 1,900 30 10.00 0.004300 0.037 100-year 8,200 8.88 - 1,053.91 208.39 5.06 207.50 7.78 0.60 6.50 11.30 11.30 6.29 0.1088 22.57 1,949,991
H-2 H Arroyo las Positas 20,800 14,300 6,500 70 3.00 0.002900 0.045 2-year 600 2.47 - 190.78 85.59 2.23 84.79 3.04 0.50 2.60 9.00 10.10 4.33 0.0076 0.64 55,500 -0.07 -3.5E+02 -2.4E+0220,800 14,300 6,500 70 3.00 0.002900 0.037 100-year 8,200 4.25 - 351.69 96.88 3.63 95.50 5.12 0.50 2.60 9.00 10.10 4.33 0.0433 4.14 357,322 18.43 8.7E+04 5.9E+04
H-2 H Arroyo las Positas 14,300 12,500 1,800 40 10.00 0.002700 0.045 2-year 600 2.97 - 207.41 99.78 2.08 99.48 2.80 0.50 2.60 9.00 10.10 4.33 0.0053 0.53 45,671 0.11 5.4E+02 3.6E+0214,300 12,500 1,800 40 10.00 0.002700 0.036 100-year 1,800 4.64 - 401.16 133.30 3.01 132.84 4.48 0.50 2.60 9.00 10.10 4.33 0.0259 3.45 297,771 0.69 3.2E+03 2.2E+03
H-2 H Arroyo las Positas 12,500 9,200 3,300 28 9.00 0.000800 0.044 2-year 600 4.47 - 304.99 108.96 2.80 108.46 1.90 0.50 2.60 9.00 10.10 4.33 0.0011 0.12 10,761 0.40 1.9E+03 1.3E+0312,500 9,200 3,300 28 9.00 0.000800 0.033 100-year 1,800 6.56 - 570.25 146.72 3.89 145.99 3.16 0.50 2.60 9.00 10.10 4.33 0.0065 0.95 82,340 2.49 1.2E+04 8.0E+03
H-1 H Arroyo las Positas 9,200 3,500 5,700 10 2.00 0.002500 0.045 2-year 700 6.62 - 153.85 39.61 3.88 36.48 4.09 0.50 2.60 9.00 10.10 4.33 0.0168 0.61 52,837 -0.49 -2.3E+03 -1.6E+039,200 3,500 5,700 10 2.00 0.002500 0.036 100-year 2,300 10.81 - 341.97 58.36 5.86 53.25 6.73 0.50 2.60 9.00 10.10 4.33 0.0893 4.75 410,808 -3.80 -1.8E+04 -1.2E+04
H-1 H Arroyo las Positas 3,500 0 3,500 30 5.50 0.012000 0.044 2-year 700 2.52 - 110.53 58.17 1.90 57.72 5.69 0.50 2.60 9.00 10.10 4.33 0.0740 4.27 368,933 -3.66 -1.7E+04 -1.2E+043,500 0 3,500 30 5.50 0.012000 0.035 100-year 2,300 4.39 - 237.31 79.03 3.00 78.24 9.71 0.50 2.60 9.00 10.10 4.33 0.4424 34.61 2,990,621 -29.86 -1.4E+05 -9.6E+04
G-60 G Arroyo Mocho 62,000 55,200 6,800 130 1.25 0.008800 0.042 2-year 250 0.72 - 94.25 132.31 0.71 131.80 2.65 1.60 10.40 12.30 13.00 3.84 0.0027 0.35 30,46862,000 55,200 6,800 130 1.25 0.008800 0.036 100-year 4,500 3.72 - 500.48 141.90 3.53 139.29 9.00 1.60 10.40 12.30 13.00 3.84 0.1431 19.93 1,721,611
G-60 G Arroyo Mocho 55,200 42,500 12,700 40 1.50 0.008000 0.043 2-year 250 1.51 - 63.82 45.44 1.40 44.53 3.89 1.60 10.40 12.30 13.00 3.84 0.0087 0.39 33,401 -0.03 -1.6E+02 -1.1E+0255,200 42,500 12,700 40 1.50 0.008000 0.036 100-year 4,500 7.45 - 380.94 66.84 5.70 62.34 11.81 1.60 10.40 12.30 13.00 3.84 0.3159 19.69 1,701,422 0.23 1.1E+03 7.5E+02
G-60 G Arroyo Mocho 42,500 41,000 1,500 60 1.50 0.000880 0.044 2-year 250 2.34 - 148.28 68.42 2.17 67.01 1.68 1.60 10.40 12.30 13.00 3.84 0.0004 0.02 2,084 0.36 1.7E+03 1.2E+0342,500 41,000 1,500 60 1.50 0.000880 0.036 100-year 4,500 11.31 - 870.66 100.79 8.64 93.94 5.17 1.60 10.40 12.30 13.00 3.84 0.0137 1.29 111,262 18.40 8.7E+04 5.9E+04
G-60 G Arroyo Mocho 41,000 35,000 6,000 65 1.50 0.007100 0.043 2-year 250 1.18 - 78.79 69.25 1.14 68.54 3.18 1.60 10.40 12.30 13.00 3.84 0.0045 0.31 26,605 -0.28 -1.3E+03 -9.1E+0241,000 35,000 6,000 65 1.50 0.007100 0.036 100-year 4,500 5.92 - 437.54 86.35 5.07 82.77 10.29 1.60 10.40 12.30 13.00 3.84 0.2040 16.88 1,458,534 -15.59 -7.3E+04 -5.0E+04
G-50 G Arroyo Mocho 35,000 31,000 4,000 40 2.00 0.003800 0.044 2-year 300 2.12 - 93.79 49.48 1.90 48.48 3.20 1.60 10.40 12.30 13.00 3.84 0.0039 0.19 16,157 0.12 5.7E+02 3.9E+0235,000 31,000 4,000 40 2.00 0.003800 0.037 100-year 900 3.64 - 172.10 56.28 3.06 54.56 5.23 1.60 10.40 12.30 13.00 3.84 0.0199 1.08 93,696 15.80 7.4E+04 5.1E+04
G-50 G Arroyo Mocho 31,000 21,200 9,800 60 2.00 0.003500 0.045 2-year 300 1.75 - 110.79 67.80 1.63 66.98 2.72 1.60 10.40 12.30 13.00 3.84 0.0023 0.15 13,049 0.04 1.7E+02 1.2E+0231,000 21,200 9,800 60 2.00 0.003500 0.038 100-year 900 3.02 - 199.44 73.51 2.71 72.08 4.51 1.60 10.40 12.30 13.00 3.84 0.0122 0.88 76,265 0.20 9.5E+02 6.5E+02
G-50 G Arroyo Mocho 21,200 17,686 3,514 70 3.00 0.007700 0.045 2-year 300 1.25 - 92.19 77.91 1.18 77.50 3.25 1.60 10.40 12.30 13.00 3.84 0.0048 0.37 31,980 -0.22 -1.0E+03 -7.0E+0221,200 17,686 3,514 70 3.00 0.007700 0.038 100-year 900 2.17 - 165.86 83.71 1.98 83.01 5.43 1.60 10.40 12.30 13.00 3.84 0.0265 2.20 189,699 -1.31 -6.2E+03 -4.2E+03
G-40 G Arroyo Mocho 17,350 15,000 2,350 60 2.50 0.008100 0.048 2-year 1,000 2.74 - 183.17 74.76 2.45 73.70 5.08 1.40 6.00 10.50 10.60 3.02 0.0243 1.79 154,806 2.85 1.3E+04 9.1E+0317,350 15,000 2,350 60 2.50 0.008100 0.039 100-year 3,200 4.97 - 360.29 86.79 4.15 84.87 8.88 1.40 6.00 10.50 10.60 3.02 0.1574 13.36 1,154,368 23.45 1.1E+05 7.5E+04
G-30 G Arroyo Mocho 15,000 12,686 2,314 60 2.60 0.000810 0.047 2-year 1,100 5.79 - 434.56 92.26 4.71 90.11 2.54 1.40 6.00 10.50 10.60 3.02 0.0016 0.14 12,075 1.65 7.8E+03 5.3E+0315,000 12,686 2,314 60 2.60 0.000810 0.038 100-year 3,600 9.92 - 850.83 115.26 7.38 111.57 4.23 1.40 6.00 10.50 10.60 3.02 0.0086 0.96 82,923 12.40 5.8E+04 4.0E+04
G-30 G Arroyo Mocho 12,686 10,151 2,535 60 2.00 0.001400 0.046 2-year 1,100 4.97 - 347.60 82.23 4.23 79.88 3.17 1.40 6.00 10.50 10.60 3.02 0.0037 0.29 25,251 -0.15 -7.2E+02 -4.9E+0212,686 10,151 2,535 60 2.00 0.001400 0.038 100-year 3,600 8.77 - 680.03 99.22 6.85 95.08 5.29 1.40 6.00 10.50 10.60 3.02 0.0202 1.92 165,924 -0.96 -4.5E+03 -3.1E+03
G-30 G Arroyo Mocho 10,151 7,000 3,151 60 2.00 0.001660 0.045 2-year 1,100 4.67 - 323.66 80.88 4.00 78.67 3.40 1.40 6.00 10.50 10.60 3.02 0.0048 0.38 32,772 -0.09 -4.1E+02 -2.8E+0210,151 7,000 3,151 60 2.00 0.001660 0.038 100-year 3,600 8.36 - 641.38 97.39 6.59 93.44 5.61 1.40 6.00 10.50 10.60 3.02 0.0254 2.37 204,774 -0.45 -2.1E+03 -1.4E+03
G-20 G Arroyo Mocho 7,000 4,000 3,000 60 2.00 0.000940 0.047 2-year 1,400 6.48 - 473.04 88.99 5.32 85.93 2.96 1.40 6.00 10.50 10.60 3.02 0.0026 0.23 19,623 0.15 7.2E+02 4.9E+027,000 4,000 3,000 60 2.00 0.000940 0.039 100-year 7,700 15.06 - 1,357.33 127.35 10.66 120.24 5.67 1.40 6.00 10.50 10.60 3.02 0.0222 2.67 230,917 -0.30 -1.4E+03 -9.7E+02
G-10 G Arroyo Mocho 4,000 0 4,000 60 2.00 0.001300 0.047 2-year 1,500 6.15 - 444.22 87.48 5.08 84.58 3.38 1.40 6.00 10.50 10.60 3.02 0.0043 0.37 31,717 -0.14 -6.6E+02 -4.5E+024,000 0 4,000 60 2.00 0.001300 0.039 100-year 8,100 - 15.31 1,387.39 128.47 10.80 121.24 5.84 1.40 6.00 10.50 10.60 3.02 0.0246 2.98 257,366 -0.31 -1.4E+03 -9.8E+02
F-10 F Alamo Canal 1,100 0 1,100 30 2.50 0.001420 0.047 2-year 1,200 7.17 - 343.29 68.58 5.01 65.83 3.50 0.50 2.10 10.10 10.90 4.50 0.0107 0.70 60,8491,100 0 1,100 30 2.50 0.001420 0.038 100-year 5,400 13.69 - 879.04 103.71 8.48 98.44 6.14 0.50 2.10 10.10 10.90 4.50 0.0694 6.83 590,288
B-70 B Arroyo de la Laguna 39,200 37,300 1,900 80 2.00 0.007500 0.043 2-year 2,700 4.21 - 371.76 98.81 3.76 96.82 7.26 0.50 1.00 3.70 10.00 2.85 0.2301 22.28 1,925,197 -21.21 -1.0E+05 -6.8E+0439,200 37,300 1,900 80 2.00 0.007500 0.037 100-year 13,500 - 22.89 2,879.10 182.37 15.79 171.56 4.69 0.50 1.00 3.70 10.00 2.85 0.0286 4.90 423,293 4.91 2.3E+04 1.6E+04
B-60 B Arroyo de la Laguna 37,300 33,500 3,800 80 2.00 0.007500 0.044 2-year 2,700 4.26 - 377.39 99.06 3.81 97.05 7.15 0.50 1.00 3.70 10.00 2.85 0.2172 21.08 1,821,539 1.20 5.6E+03 3.8E+0337,300 33,500 3,800 80 2.00 0.007500 0.038 100-year 15,000 - 26.43 3,511.49 198.20 17.72 185.72 4.27 0.50 1.00 3.70 10.00 2.85 0.0195 3.62 312,776 1.28 6.0E+03 4.1E+03
B-50 B Arroyo de la Laguna 33,500 30,790 2,710 55 1.50 0.001900 0.044 2-year 3,000 8.45 - 572.18 85.48 6.69 80.36 5.24 0.50 1.00 3.70 10.00 2.85 0.0573 4.60 397,786 16.48 7.8E+04 5.3E+0433,500 30,790 2,710 55 1.50 0.001900 0.038 100-year 17,200 - 31.39 3,204.45 168.18 19.05 149.17 5.37 0.50 1.00 3.70 10.00 2.85 0.0427 6.37 550,028 -2.75 -1.3E+04 -8.8E+03
B-40 B Arroyo de la Laguna 30,790 23,820 6,970 30 1.50 0.001200 0.045 2-year 3,100 13.13 - 652.15 77.32 8.43 69.38 4.75 0.50 1.00 3.70 10.00 2.85 0.0352 2.45 211,260 2.16 1.0E+04 6.9E+0330,790 23,820 6,970 30 1.50 0.001200 0.038 100-year 17,500 - 28.94 2,124.49 134.34 15.81 116.82 8.24 0.50 1.00 3.70 10.00 2.85 0.2086 24.37 2,105,663 -18.01 -8.5E+04 -5.8E+04
B-30 B Arroyo de la Laguna 23,820 17,845 5,975 40 1.00 0.001700 0.045 2-year 3,200 11.34 - 582.20 72.07 8.08 62.68 5.50 0.50 1.00 3.70 10.00 2.85 0.0625 3.92 338,526 -1.47 -6.9E+03 -4.7E+0323,820 17,845 5,975 40 1.00 0.001700 0.037 100-year 17,800 - 25.18 1,641.23 111.22 14.76 90.36 10.85 0.50 1.00 3.70 10.00 2.85 0.5928 53.57 4,628,346 -29.20 -1.4E+05 -9.3E+04
B-30 B Arroyo de la Laguna 17,845 9,960 7,885 50 2.00 0.002500 0.047 2-year 3,200 8.60 - 577.92 88.46 6.53 84.40 5.54 0.80 2.40 5.60 7.00 2.67 0.0397 3.35 289,186 0.57 2.7E+03 1.8E+0317,845 9,960 7,885 50 2.00 0.002500 0.038 100-year 17,800 - 23.67 2,304.04 155.86 14.78 144.68 7.73 0.80 2.40 5.60 7.00 2.67 0.0996 14.40 1,244,536 39.16 1.8E+05 1.3E+05
B-30 B Arroyo de la Laguna 9,960 3,225 6,735 30 2.00 0.002800 0.047 2-year 3,200 10.38 - 526.75 76.41 6.89 71.51 6.08 0.80 2.40 5.60 7.00 2.67 0.0526 3.76 325,175 -0.42 -2.0E+03 -1.3E+039,960 3,225 6,735 30 2.00 0.002800 0.038 100-year 17,800 - 23.00 1,748.00 132.86 13.16 122.00 10.18 0.80 2.40 5.60 7.00 2.67 0.2751 33.56 2,899,920 -19.16 -9.0E+04 -6.1E+04
B-10 B Arroyo de la Laguna 3,225 200 3,025 10 3.00 0.005000 0.047 2-year 3,300 10.76 - 454.78 78.04 5.83 74.55 7.26 0.80 2.40 5.60 7.00 2.67 0.0997 7.43 642,229 -3.67 -1.7E+04 -1.2E+043,225 200 3,025 10 3.00 0.005000 0.037 100-year 18,600 - 20.36 1,447.19 138.77 10.43 132.16 12.85 0.80 2.40 5.60 7.00 2.67 0.6667 88.11 7,612,551 -54.54 -2.6E+05 -1.7E+05
[Boundary Condition]
CHANNEL DATA
-1.0E+05
5.6E+03
[Bounday Condition]
2.1E+02
-2.9E+02
6.7E+03
7.2E+02
7.8E+04
1.0E+04
[Boundary Condition]
[Boundary Condition]
[Bounday Condition]
Scenario C: Existing Development + Existing Channel Capacity
FLOW DATA BED MATERIAL DATA
[Bounday Condition]
SEDIMENT TRANSPORT DATA
2.3E+04
6.0E+03
6.9E+04
1.1E+05
5.2E+04
-1.4E+03
[Bounday Condition]
-1.4E+03
SUMMARY RESULTS
1.0E+052.1E+03
-1.3E+04
-8.5E+04
-4.3E+04
-2.6E+05
1 Calculated by interpolation from flows provided in Table TM5A-12 of West Yost & Associates, November 2001 (Appendices)
-6.2E+03
-1.7E+04
-1.6E+05
[Bounday Condition]
1.4E+04
-6.6E+02
1.3E+04
[Bounday Condition]
-2.0E+04
Appendix E8/23/2004

Line Channel Name US Station DS Station
[L]Reach Length
(ft)
[b]Bottom Width
(ft)
[z]Side
Slopes(_H:1V)
[S]Bed Slope Manning's n
Event(yr)
[Q]Flow (cfs)
[d]Manning
Depth(ft)
[d]Backwater
Depth (WYA)1
(ft)
[A]Area(ft2)
[P]Wetted
Perimeter(ft)
[Rh]Hydraulic
Radius(ft)
Top Width(ft)
[V]Velocity
(ft/s) d16 (mm)d50
(mm) d84 (mm)d90
(mm) Gr
Reach Capacity(cfs/ft)
Reach Capacity
(cfs)Reach Capacity
(ft3/event)
Aggradation/Degradation
(cfs)
Aggradation/Degradation(tons/event)
Aggradation/Degradation
(yards3/event)
Aggradation/Degradation
2-year Event by Reach(tons/event)
Aggradation/Degradation
100-year Event by Reach(tons/event)
H-3 H Arroyo las Positas 22,700 20,800 1,900 30 10.00 0.004300 0.045 2-year 1,000 3.78 - 255.76 105.88 2.42 105.50 3.91 0.60 6.50 11.30 11.30 6.29 0.0113 1.19 102,98222,700 20,800 1,900 30 10.00 0.004300 0.037 100-year 9,000 9.24 - 1,129.90 215.62 5.24 214.70 7.97 0.60 6.50 11.30 11.30 6.29 0.1172 25.17 2,174,439
H-2 H Arroyo las Positas 20,800 14,300 6,500 70 3.00 0.002900 0.045 2-year 1,100 3.58 - 288.87 92.63 3.12 91.47 3.81 0.50 2.60 9.00 10.10 4.33 0.0154 1.41 121,666 -0.22 -1.0E+03 -6.9E+0220,800 14,300 6,500 70 3.00 0.002900 0.037 100-year 1,800 4.25 - 351.69 96.88 3.63 95.50 5.12 0.50 2.60 9.00 10.10 4.33 0.0433 4.14 357,322 21.03 9.9E+04 6.7E+04
H-2 H Arroyo las Positas 14,300 12,500 1,800 40 10.00 0.002700 0.045 2-year 1,100 4.08 - 329.66 122.01 2.70 121.60 3.34 0.50 2.60 9.00 10.10 4.33 0.0092 1.12 96,418 0.29 1.4E+03 9.4E+0214,300 12,500 1,800 40 10.00 0.002700 0.036 100-year 1,800 4.64 - 401.43 133.34 3.01 132.88 4.48 0.50 2.60 9.00 10.10 4.33 0.0260 3.45 298,085 0.69 3.2E+03 2.2E+03
H-2 H Arroyo las Positas 12,500 9,200 3,300 28 9.00 0.000800 0.044 2-year 1,100 5.98 - 489.83 136.37 3.59 135.71 2.25 0.50 2.60 9.00 10.10 4.33 0.0019 0.26 22,696 0.85 4.0E+03 2.7E+0312,500 9,200 3,300 28 9.00 0.000800 0.033 100-year 1,800 6.56 - 570.25 146.72 3.89 145.99 3.16 0.50 2.60 9.00 10.10 4.33 0.0065 0.95 82,340 2.50 1.2E+04 8.0E+03
H-1 H Arroyo las Positas 9,200 3,500 5,700 10 2.00 0.002500 0.045 2-year 1,200 8.93 - 248.56 49.91 4.98 45.70 4.83 0.50 2.60 9.00 10.10 4.33 0.0281 1.29 111,089 -1.02 -4.8E+03 -3.3E+039,200 3,500 5,700 10 2.00 0.002500 0.036 100-year 2,300 10.82 - 342.08 58.37 5.86 53.26 6.73 0.50 2.60 9.00 10.10 4.33 0.0893 4.76 411,006 -3.80 -1.8E+04 -1.2E+04
H-1 H Arroyo las Positas 3,500 0 3,500 30 5.50 0.012000 0.044 2-year 1,200 3.54 - 174.95 69.55 2.52 68.91 6.86 0.50 2.60 9.00 10.10 4.33 0.1327 9.15 790,278 -7.86 -3.7E+04 -2.5E+043,500 0 3,500 30 5.50 0.012000 0.035 100-year 2,300 4.38 - 237.07 78.99 3.00 78.20 9.70 0.50 2.60 9.00 10.10 4.33 0.4419 34.56 2,985,847 -29.80 -1.4E+05 -9.5E+04
G-60 G Arroyo Mocho 62,000 55,200 6,800 130 1.25 0.008800 0.042 2-year 350 0.88 - 115.37 132.82 0.87 132.20 3.03 1.60 10.40 12.30 13.00 3.84 0.0041 0.54 46,71762,000 55,200 6,800 130 1.25 0.008800 0.036 100-year 4,700 3.81 - 514.00 142.21 3.61 139.54 9.14 1.60 10.40 12.30 13.00 3.84 0.1507 21.03 1,816,817
G-60 G Arroyo Mocho 55,200 42,500 12,700 40 1.50 0.008000 0.043 2-year 350 1.85 - 79.13 46.67 1.70 45.55 4.41 1.60 10.40 12.30 13.00 3.84 0.0129 0.59 50,953 -0.05 -2.3E+02 -1.6E+0255,200 42,500 12,700 40 1.50 0.008000 0.036 100-year 4,700 7.63 - 392.53 67.51 5.81 62.89 11.97 1.60 10.40 12.30 13.00 3.84 0.3293 20.71 1,789,501 0.32 1.5E+03 1.0E+03
G-60 G Arroyo Mocho 42,500 41,000 1,500 60 1.50 0.000880 0.044 2-year 350 2.86 - 183.66 70.30 2.61 68.57 1.91 1.60 10.40 12.30 13.00 3.84 0.0005 0.04 3,170 0.55 2.6E+03 1.8E+0342,500 41,000 1,500 60 1.50 0.000880 0.036 100-year 4,700 11.59 - 897.27 101.80 8.81 94.78 5.24 1.60 10.40 12.30 13.00 3.84 0.0143 1.35 117,043 19.36 9.1E+04 6.2E+04
G-60 G Arroyo Mocho 41,000 35,000 6,000 65 1.50 0.007100 0.043 2-year 350 1.44 - 96.71 70.19 1.38 69.32 3.62 1.60 10.40 12.30 13.00 3.84 0.0068 0.47 40,474 -0.43 -2.0E+03 -1.4E+0341,000 35,000 6,000 65 1.50 0.007100 0.036 100-year 4,700 6.07 - 450.15 86.90 5.18 83.22 10.44 1.60 10.40 12.30 13.00 3.84 0.2137 17.78 1,536,256 -16.43 -7.7E+04 -5.3E+04
G-50 G Arroyo Mocho 35,000 31,000 4,000 40 2.00 0.003800 0.044 2-year 370 2.40 - 107.52 50.73 2.12 49.60 3.44 1.60 10.40 12.30 13.00 3.84 0.0049 0.24 20,924 0.23 1.1E+03 7.2E+0235,000 31,000 4,000 40 2.00 0.003800 0.037 100-year 900 3.64 - 172.10 56.28 3.06 54.56 5.23 1.60 10.40 12.30 13.00 3.84 0.0199 1.08 93,696 16.70 7.9E+04 5.3E+04
G-50 G Arroyo Mocho 31,000 21,200 9,800 60 2.00 0.003500 0.045 2-year 370 1.97 - 125.96 68.81 1.83 67.88 2.93 1.60 10.40 12.30 13.00 3.84 0.0029 0.19 16,834 0.05 2.2E+02 1.5E+0231,000 21,200 9,800 60 2.00 0.003500 0.038 100-year 900 3.02 - 199.44 73.51 2.71 72.08 4.51 1.60 10.40 12.30 13.00 3.84 0.0122 0.88 76,265 0.20 9.5E+02 6.5E+02
G-50 G Arroyo Mocho 21,200 17,686 3,514 70 3.00 0.007700 0.045 2-year 370 1.42 - 105.45 78.98 1.34 78.52 3.52 1.60 10.40 12.30 13.00 3.84 0.0062 0.48 41,883 -0.29 -1.4E+03 -9.3E+0221,200 17,686 3,514 70 3.00 0.007700 0.038 100-year 900 2.17 - 165.61 83.69 1.98 82.99 5.42 1.60 10.40 12.30 13.00 3.84 0.0264 2.19 189,146 -1.31 -6.2E+03 -4.2E+03
G-40 G Arroyo Mocho 17,350 15,000 2,350 60 2.50 0.008100 0.048 2-year 1,400 3.48 - 239.08 78.74 3.04 77.40 5.86 1.40 6.00 10.50 10.60 3.02 0.0382 2.96 255,602 6.67 3.1E+04 2.1E+0417,350 15,000 2,350 60 2.50 0.008100 0.039 100-year 3,200 4.98 - 360.38 86.79 4.15 84.88 8.88 1.40 6.00 10.50 10.60 3.02 0.1575 13.37 1,154,856 23.38 1.1E+05 7.5E+04
G-30 G Arroyo Mocho 15,000 12,686 2,314 60 2.60 0.000810 0.047 2-year 1,600 7.14 - 560.95 99.78 5.62 97.13 2.85 1.40 6.00 10.50 10.60 3.02 0.0022 0.22 18,838 2.74 1.3E+04 8.8E+0315,000 12,686 2,314 60 2.60 0.000810 0.038 100-year 3,600 9.92 - 850.83 115.26 7.38 111.57 4.23 1.40 6.00 10.50 10.60 3.02 0.0086 0.96 82,923 12.41 5.8E+04 4.0E+04
G-30 G Arroyo Mocho 12,686 10,151 2,535 60 2.00 0.001400 0.046 2-year 1,600 6.17 - 446.00 87.58 5.09 84.66 3.59 1.40 6.00 10.50 10.60 3.02 0.0054 0.46 39,555 -0.24 -1.1E+03 -7.7E+0212,686 10,151 2,535 60 2.00 0.001400 0.038 100-year 3,600 8.77 - 680.03 99.22 6.85 95.08 5.29 1.40 6.00 10.50 10.60 3.02 0.0202 1.92 165,924 -0.96 -4.5E+03 -3.1E+03
G-30 G Arroyo Mocho 10,151 7,000 3,151 60 2.00 0.001660 0.045 2-year 1,600 5.80 - 415.28 85.94 4.83 83.20 3.86 1.40 6.00 10.50 10.60 3.02 0.0072 0.60 51,489 -0.14 -6.5E+02 -4.4E+0210,151 7,000 3,151 60 2.00 0.001660 0.038 100-year 3,600 8.36 - 641.38 97.39 6.59 93.44 5.61 1.40 6.00 10.50 10.60 3.02 0.0254 2.37 204,774 -0.45 -2.1E+03 -1.4E+03
G-20 G Arroyo Mocho 7,000 4,000 3,000 60 2.00 0.000940 0.047 2-year 2,000 7.94 - 602.67 95.52 6.31 91.77 3.32 1.40 6.00 10.50 10.60 3.02 0.0038 0.35 29,985 0.25 1.2E+03 8.0E+027,000 4,000 3,000 60 2.00 0.000940 0.039 100-year 7,700 15.06 - 1,357.33 127.35 10.66 120.24 5.67 1.40 6.00 10.50 10.60 3.02 0.0222 2.67 230,917 -0.30 -1.4E+03 -9.7E+02
G-10 G Arroyo Mocho 4,000 0 4,000 60 2.00 0.001300 0.047 2-year 2,200 7.65 - 575.77 94.20 6.11 90.59 3.82 1.40 6.00 10.50 10.60 3.02 0.0064 0.58 50,060 -0.23 -1.1E+03 -7.4E+024,000 0 4,000 60 2.00 0.001300 0.039 100-year 8,100 - 18.68 1,818.68 143.54 12.67 134.72 4.45 1.40 6.00 10.50 10.60 3.02 0.0086 1.16 100,506 1.51 7.1E+03 4.8E+03
F-10 P Alamo Canal 1,100 0 1,100 30 2.50 0.001420 0.047 2-year 1,500 8.05 - 403.16 73.32 5.50 70.23 3.72 0.50 2.10 10.10 10.90 4.50 0.0130 0.91 78,8901,100 0 1,100 30 2.50 0.001420 0.038 100-year 6,500 - 15.34 1,048.49 112.61 9.31 106.70 6.20 0.50 2.10 10.10 10.90 4.50 0.0695 7.41 640,269
B-70 B Arroyo de la Laguna 39,200 37,300 1,900 80 2.00 0.007500 0.043 2-year 3,700 5.06 - 456.01 102.63 4.44 100.24 8.11 0.50 1.00 3.70 10.00 2.85 0.3269 32.77 2,831,142 -31.28 -1.5E+05 -1.0E+0539,200 37,300 1,900 80 2.00 0.007500 0.037 100-year 14,600 - 26.32 3,491.08 197.71 17.66 185.28 4.18 0.50 1.00 3.70 10.00 2.85 0.0181 3.35 289,149 5.23 2.5E+04 1.7E+04
B-60 B Arroyo de la Laguna 37,300 33,500 3,800 80 2.00 0.007500 0.044 2-year 3,700 5.13 - 463.03 102.94 4.50 100.52 7.99 0.50 1.00 3.70 10.00 2.85 0.3084 31.00 2,678,807 1.76 8.3E+03 5.6E+0337,300 33,500 3,800 80 2.00 0.007500 0.038 100-year 16,200 - 28.77 3,957.03 208.66 18.96 195.08 4.09 0.50 1.00 3.70 10.00 2.85 0.0163 3.18 274,503 0.17 8.0E+02 5.4E+02
B-50 B Arroyo de la Laguna 33,500 30,790 2,710 55 1.50 0.001900 0.044 2-year 4,100 10.11 - 708.94 91.43 7.75 85.32 5.78 0.50 1.00 3.70 10.00 2.85 0.0778 6.64 573,472 24.37 1.1E+05 7.8E+0433,500 30,790 2,710 55 1.50 0.001900 0.038 100-year 18,600 - 33.09 3,462.37 174.31 19.86 154.27 5.37 0.50 1.00 3.70 10.00 2.85 0.0422 6.50 561,916 -3.33 -1.6E+04 -1.1E+04
B-40 B Arroyo de la Laguna 30,790 23,820 6,970 30 1.50 0.001200 0.045 2-year 4,200 15.35 - 814.09 85.35 9.54 76.06 5.16 0.50 1.00 3.70 10.00 2.85 0.0454 3.46 298,530 3.18 1.5E+04 1.0E+0430,790 23,820 6,970 30 1.50 0.001200 0.038 100-year 18,900 - 30.54 2,315.24 140.11 16.52 121.62 8.16 0.50 1.00 3.70 10.00 2.85 0.1987 24.17 2,088,327 -17.67 -8.3E+04 -5.7E+04
B-30 B Arroyo de la Laguna 23,820 17,845 5,975 40 1.00 0.001700 0.045 2-year 4,400 13.60 - 729.09 78.47 9.29 67.20 6.03 0.50 1.00 3.70 10.00 2.85 0.0834 5.60 484,003 -2.15 -1.0E+04 -6.9E+0323,820 17,845 5,975 40 1.00 0.001700 0.037 100-year 19,200 - 26.48 1,760.39 114.90 15.32 92.96 10.91 0.50 1.00 3.70 10.00 2.85 0.5964 55.44 4,789,831 -31.27 -1.5E+05 -1.0E+05
B-30 B Arroyo de la Laguna 17,845 9,960 7,885 50 2.00 0.002500 0.047 2-year 4,400 10.24 - 722.08 95.81 7.54 90.98 6.09 0.80 2.40 5.60 7.00 2.67 0.0534 4.85 419,472 0.75 3.5E+03 2.4E+0317,845 9,960 7,885 50 2.00 0.002500 0.038 100-year 19,200 - 24.48 2,422.54 159.48 15.19 147.92 7.93 0.80 2.40 5.60 7.00 2.67 0.1082 16.01 1,383,254 39.43 1.9E+05 1.3E+05
B-30 B Arroyo de la Laguna 9,960 3,225 6,735 30 2.00 0.002800 0.047 2-year 4,400 12.20 - 663.92 84.57 7.85 78.81 6.63 0.80 2.40 5.60 7.00 2.67 0.0689 5.43 469,097 -0.57 -2.7E+03 -1.8E+039,960 3,225 6,735 30 2.00 0.002800 0.038 100-year 19,200 - 23.51 1,810.74 135.14 13.40 124.04 10.60 0.80 2.40 5.60 7.00 2.67 0.3169 39.30 3,395,811 -23.29 -1.1E+05 -7.5E+04
B-10 B Arroyo de la Laguna 3,225 200 3,025 10 3.00 0.005000 0.047 2-year 4,600 12.37 - 583.00 88.25 6.61 84.24 7.89 0.80 2.40 5.60 7.00 2.67 0.1299 10.94 945,445 -5.51 -2.6E+04 -1.8E+043,225 200 3,025 10 3.00 0.005000 0.037 100-year 20,100 - 21.78 1,640.91 147.75 11.11 140.68 12.25 0.80 2.40 5.60 7.00 2.67 0.5486 77.17 6,667,713 -37.87 -1.8E+05 -1.2E+05
[Boundary Condition]
[Boundary Condition]
-2.6E+04
8.3E+03
1.1E+05
1.5E+04
-9.3E+03
1.2E+03
-1.1E+03
[Bounday Condition]
-1.5E+05
3.4E+02
-7.7E+01
3.1E+04
1.1E+04
[Bounday Condition]
4.4E+03
-4.2E+04
[Bounday Condition]
BED MATERIAL DATA SEDIMENT TRANSPORT DATACHANNEL DATA FLOW DATA
[Boundary Condition] [Bounday Condition]
1.1E+05
-1.6E+05
[Bounday Condition]
1.5E+04
7.3E+04
1.1E+05
5.2E+04
-1.4E+03
7.1E+03
[Bounday Condition]
2.5E+04
8.0E+02
-1.6E+04
-8.3E+04
-7.1E+04
1 West Yost & Associates, November 2001 (Table TM5A-23 of Appendices)
-1.8E+05
SUMMARY RESULTS
Scenario D: Full Build-Out Development + Existing Channel Capacity
Appendix E8/23/2004

Line Channel Name US Station DS Station
[L]Reach Length
(ft)
[b]Bottom Width
(ft)
[z]Side
Slopes(_H:1V)
[S]Bed Slope Manning's n
Event(yr)
[Q]Flow (cfs)
[d]Manning
Depth(ft)
[d]Backwater
Depth (WYA)1
(ft)
[A]Area(ft2)
[P]Wetted
Perimeter(ft)
[Rh]Hydraulic
Radius(ft)
Top Width(ft)
[V]Velocity
(ft/s) d16 (mm)d50
(mm) d84 (mm)d90
(mm) Gr
Reach Capacity(cfs/ft)
Reach Capacity
(cfs)Reach Capacity
(ft3/event)
Aggradation/Degradation
(cfs)
Aggradation/Degradation(tons/event)
Aggradation/Degradation
(yards3/event)
Aggradation/Degradation
2-year Event by Reach(tons/event)
Aggradation/Degradation
100-year Event by Reach(tons/event)
H-3 H Arroyo las Positas 22,700 20,800 1,900 30 10.00 0.004300 0.045 2-year 1,000 3.78 - 255.76 105.88 2.42 105.50 3.91 0.60 6.50 11.30 11.30 6.29 0.0113 1.19 102,98222,700 20,800 1,900 30 10.00 0.004300 0.037 100-year 9,000 9.24 - 1,129.90 215.62 5.24 214.70 7.97 0.60 6.50 11.30 11.30 6.29 0.1172 25.17 2,174,439
H-2 H Arroyo las Positas 20,800 14,300 6,500 70 3.00 0.002900 0.045 2-year 1,100 3.58 - 288.87 92.63 3.12 91.47 3.81 0.50 2.60 9.00 10.10 4.33 0.0154 1.41 121,666 -0.22 -1.0E+03 -6.9E+0220,800 14,300 6,500 70 3.00 0.002900 0.037 100-year 1,500 3.83 - 311.64 94.19 3.31 92.95 4.82 0.50 2.60 9.00 10.10 4.33 0.0356 3.31 286,127 21.86 1.0E+05 7.0E+04
H-2 H Arroyo las Positas 14,300 12,500 1,800 40 10.00 0.002700 0.045 2-year 1,100 4.08 - 329.66 122.01 2.70 121.60 3.34 0.50 2.60 9.00 10.10 4.33 0.0092 1.12 96,418 0.29 1.4E+03 9.4E+0214,300 12,500 1,800 40 10.00 0.002700 0.036 100-year 1,500 4.26 - 351.25 125.52 2.80 125.10 4.27 0.50 2.60 9.00 10.10 4.33 0.0223 2.79 240,937 0.52 2.5E+03 1.7E+03
H-2 H Arroyo las Positas 12,500 9,200 3,300 28 9.00 0.000800 0.044 2-year 1,100 5.98 - 489.69 136.36 3.59 135.69 2.25 0.50 2.60 9.00 10.10 4.33 0.0019 0.26 22,686 0.85 4.0E+03 2.7E+0312,500 9,200 3,300 28 9.00 0.000800 0.033 100-year 1,500 6.04 - 498.00 137.46 3.62 136.79 3.01 0.50 2.60 9.00 10.10 4.33 0.0056 0.77 66,567 2.02 9.5E+03 6.5E+03
H-1 H Arroyo las Positas 9,200 3,500 5,700 10 2.00 0.002500 0.045 2-year 1,200 8.93 - 248.56 49.91 4.98 45.70 4.83 0.50 2.60 9.00 10.10 4.33 0.0281 1.29 111,089 -1.02 -4.8E+03 -3.3E+039,200 3,500 5,700 10 2.00 0.002500 0.036 100-year 2,000 10.16 - 308.05 55.44 5.56 50.64 6.49 0.50 2.60 9.00 10.10 4.33 0.0799 4.05 349,542 -3.28 -1.5E+04 -1.0E+04
H-1 H Arroyo las Positas 3,500 0 3,500 30 5.50 0.012000 0.044 2-year 1,200 3.54 - 174.78 69.52 2.51 68.89 6.86 0.50 2.60 9.00 10.10 4.33 0.1326 9.13 789,004 -7.85 -3.7E+04 -2.5E+043,500 0 3,500 30 5.50 0.012000 0.035 100-year 2,000 4.08 - 213.96 75.62 2.83 74.88 9.33 0.50 2.60 9.00 10.10 4.33 0.3909 29.27 2,529,051 -25.23 -1.2E+05 -8.1E+04
G-60 G Arroyo Mocho 62,000 55,200 6,800 130 1.25 0.008800 0.042 2-year 350 0.88 - 115.37 132.82 0.87 132.20 3.03 1.60 10.40 12.30 13.00 3.84 0.0041 0.54 46,71762,000 55,200 6,800 130 1.25 0.008800 0.036 100-year 4,700 3.81 - 514.00 142.21 3.61 139.54 9.14 1.60 10.40 12.30 13.00 3.84 0.1507 21.03 1,816,817
G-60 G Arroyo Mocho 55,200 42,500 12,700 40 1.50 0.008000 0.043 2-year 350 1.85 - 79.13 46.67 1.70 45.55 4.41 1.60 10.40 12.30 13.00 3.84 0.0129 0.59 50,953 -0.05 -2.3E+02 -1.6E+0255,200 42,500 12,700 40 1.50 0.008000 0.036 100-year 4,700 7.63 - 392.53 67.51 5.81 62.89 11.97 1.60 10.40 12.30 13.00 3.84 0.3293 20.71 1,789,501 0.32 1.5E+03 1.0E+03
G-60 G Arroyo Mocho 42,500 41,000 1,500 60 1.50 0.000880 0.044 2-year 350 2.86 - 183.73 70.30 2.61 68.57 1.91 1.60 10.40 12.30 13.00 3.84 0.0005 0.04 3,172 0.55 2.6E+03 1.8E+0342,500 41,000 1,500 60 1.50 0.000880 0.036 100-year 4,700 11.59 - 897.27 101.80 8.81 94.78 5.24 1.60 10.40 12.30 13.00 3.84 0.0143 1.35 117,043 19.36 9.1E+04 6.2E+04
G-60 G Arroyo Mocho 41,000 35,000 6,000 65 1.50 0.007100 0.043 2-year 350 1.44 - 96.71 70.19 1.38 69.32 3.62 1.60 10.40 12.30 13.00 3.84 0.0068 0.47 40,474 -0.43 -2.0E+03 -1.4E+0341,000 35,000 6,000 65 1.50 0.007100 0.036 100-year 4,700 6.07 - 450.15 86.90 5.18 83.22 10.44 1.60 10.40 12.30 13.00 3.84 0.2137 17.78 1,536,256 -16.43 -7.7E+04 -5.3E+04
G-50 G Arroyo Mocho 35,000 31,000 4,000 40 2.00 0.003800 0.044 2-year 370 2.40 - 107.52 50.73 2.12 49.60 3.44 1.60 10.40 12.30 13.00 3.84 0.0049 0.24 20,924 0.23 1.1E+03 7.2E+0235,000 31,000 4,000 40 2.00 0.003800 0.037 100-year 1,300 4.50 - 220.38 60.12 3.67 57.99 5.90 1.60 10.40 12.30 13.00 3.84 0.0291 1.69 145,613 16.10 7.6E+04 5.2E+04
G-50 G Arroyo Mocho 31,000 21,200 9,800 60 2.00 0.003500 0.045 2-year 370 1.97 - 125.96 68.81 1.83 67.88 2.93 1.60 10.40 12.30 13.00 3.84 0.0029 0.19 16,834 0.05 2.2E+02 1.5E+0231,000 21,200 9,800 60 2.00 0.003500 0.038 100-year 1,300 3.75 - 253.13 76.77 3.30 75.00 5.14 1.60 10.40 12.30 13.00 3.84 0.0185 1.39 119,753 0.30 1.4E+03 9.6E+02
G-50 G Arroyo Mocho 21,200 17,686 3,514 70 3.00 0.007700 0.045 2-year 370 1.42 - 105.45 78.98 1.34 78.52 3.52 1.60 10.40 12.30 13.00 3.84 0.0062 0.48 41,883 -0.29 -1.4E+03 -9.3E+0221,200 17,686 3,514 70 3.00 0.007700 0.038 100-year 1,300 2.69 - 210.01 87.01 2.41 86.14 6.19 1.60 10.40 12.30 13.00 3.84 0.0402 3.46 298,884 -2.07 -9.8E+03 -6.6E+03
G-40 G Arroyo Mocho 17,350 15,000 2,350 60 2.50 0.008100 0.048 2-year 1,400 3.48 - 239.08 78.74 3.04 77.40 5.86 1.40 6.00 10.50 10.60 3.02 0.0382 2.96 255,602 6.66 3.1E+04 2.1E+0417,350 15,000 2,350 60 2.50 0.008100 0.039 100-year 3,300 5.06 - 367.78 87.26 4.21 85.31 8.97 1.40 6.00 10.50 10.60 3.02 0.1625 13.86 1,197,745 18.87 8.9E+04 6.0E+04
G-30 G Arroyo Mocho 15,000 12,686 2,314 60 2.60 0.000810 0.047 2-year 1,600 7.14 - 560.95 99.78 5.62 97.13 2.85 1.40 6.00 10.50 10.60 3.02 0.0022 0.22 18,838 2.74 1.3E+04 8.8E+0315,000 12,686 2,314 60 2.60 0.000810 0.038 100-year 3,700 10.07 - 867.40 116.08 7.47 112.34 4.27 1.40 6.00 10.50 10.60 3.02 0.0088 0.99 85,634 12.87 6.1E+04 4.1E+04
G-30 G Arroyo Mocho 12,686 10,151 2,535 60 2.00 0.001400 0.046 2-year 1,600 6.17 - 446.00 87.58 5.09 84.66 3.59 1.40 6.00 10.50 10.60 3.02 0.0054 0.46 39,555 -0.24 -1.1E+03 -7.7E+0212,686 10,151 2,535 60 2.00 0.001400 0.038 100-year 3,700 8.91 - 692.90 99.82 6.94 95.62 5.34 1.40 6.00 10.50 10.60 3.02 0.0207 1.98 171,337 -0.99 -4.7E+03 -3.2E+03
G-30 G Arroyo Mocho 10,151 7,000 3,151 60 2.00 0.001660 0.045 2-year 1,600 5.80 - 415.28 85.94 4.83 83.20 3.86 1.40 6.00 10.50 10.60 3.02 0.0072 0.60 51,489 -0.14 -6.5E+02 -4.4E+0210,151 7,000 3,151 60 2.00 0.001660 0.038 100-year 3,700 8.49 - 653.56 97.97 6.67 93.96 5.66 1.40 6.00 10.50 10.60 3.02 0.0261 2.45 211,512 -0.46 -2.2E+03 -1.5E+03
G-20 G Arroyo Mocho 7,000 4,000 3,000 60 2.00 0.000940 0.047 2-year 2,000 7.94 - 602.58 95.51 6.31 91.76 3.32 1.40 6.00 10.50 10.60 3.02 0.0038 0.35 29,977 0.25 1.2E+03 8.0E+027,000 4,000 3,000 60 2.00 0.000940 0.039 100-year 7,800 15.17 - 1,369.98 127.82 10.72 120.66 5.69 1.40 6.00 10.50 10.60 3.02 0.0225 2.71 234,427 -0.27 -1.2E+03 -8.5E+02
G-10 G Arroyo Mocho 4,000 0 4,000 60 2.00 0.001300 0.047 2-year 2,200 7.65 - 575.68 94.19 6.11 90.58 3.82 1.40 6.00 10.50 10.60 3.02 0.0064 0.58 50,046 -0.23 -1.1E+03 -7.4E+024,000 0 4,000 60 2.00 0.001300 0.039 100-year 8,200 - 18.68 1,818.68 143.54 12.67 134.72 4.51 1.40 6.00 10.50 10.60 3.02 0.0090 1.22 105,110 1.50 7.0E+03 4.8E+03
F-10 P Alamo Canal 1,100 0 1,100 30 2.50 0.001420 0.047 2-year 1,500 8.05 - 403.16 73.32 5.50 70.23 3.72 0.50 2.10 10.10 10.90 4.50 0.0130 0.91 78,8901,100 0 1,100 30 2.50 0.001420 0.038 100-year 6,500 - 15.34 1,048.49 112.61 9.31 106.70 6.20 0.50 2.10 10.10 10.90 4.50 0.0695 7.41 640,269
B-70 B Arroyo de la Laguna 39,200 37,300 1,900 80 2.00 0.007500 0.043 2-year 3,700 5.06 - 456.01 102.63 4.44 100.24 8.11 0.50 1.00 3.70 10.00 2.85 0.3269 32.77 2,831,142 -31.28 -1.5E+05 -1.0E+0539,200 37,300 1,900 80 2.00 0.007500 0.037 100-year 14,700 - 26.32 3,491.08 197.71 17.66 185.28 4.21 0.50 1.00 3.70 10.00 2.85 0.0185 3.43 296,444 5.20 2.4E+04 1.7E+04
B-60 B Arroyo de la Laguna 37,300 33,500 3,800 80 2.00 0.007500 0.044 2-year 3,700 5.13 - 463.03 102.94 4.50 100.52 7.99 0.50 1.00 3.70 10.00 2.85 0.3084 31.00 2,678,807 1.76 8.3E+03 5.6E+0337,300 33,500 3,800 80 2.00 0.007500 0.038 100-year 16,300 - 28.77 3,957.03 208.66 18.96 195.08 4.12 0.50 1.00 3.70 10.00 2.85 0.0167 3.25 280,739 0.18 8.6E+02 5.8E+02
B-50 B Arroyo de la Laguna 33,500 30,790 2,710 55 1.50 0.001900 0.044 2-year 4,100 10.11 - 708.94 91.43 7.75 85.32 5.78 0.50 1.00 3.70 10.00 2.85 0.0778 6.64 573,472 24.37 1.1E+05 7.8E+0433,500 30,790 2,710 55 1.50 0.001900 0.038 100-year 18,700 - 33.09 3,462.37 174.31 19.86 154.27 5.40 0.50 1.00 3.70 10.00 2.85 0.0430 6.63 573,021 -3.38 -1.6E+04 -1.1E+04
B-40 B Arroyo de la Laguna 30,790 23,820 6,970 30 1.50 0.001200 0.045 2-year 4,200 15.35 - 814.09 85.35 9.54 76.06 5.16 0.50 1.00 3.70 10.00 2.85 0.0454 3.46 298,530 3.18 1.5E+04 1.0E+0430,790 23,820 6,970 30 1.50 0.001200 0.038 100-year 19,000 - 30.54 2,315.24 140.11 16.52 121.62 8.21 0.50 1.00 3.70 10.00 2.85 0.2026 24.64 2,128,940 -18.01 -8.5E+04 -5.8E+04
B-30 B Arroyo de la Laguna 23,820 17,845 5,975 40 1.00 0.001700 0.045 2-year 4,400 13.60 - 729.09 78.47 9.29 67.20 6.03 0.50 1.00 3.70 10.00 2.85 0.0834 5.60 484,003 -2.15 -1.0E+04 -6.9E+0323,820 17,845 5,975 40 1.00 0.001700 0.037 100-year 19,300 - 26.48 1,760.39 114.90 15.32 92.96 10.96 0.50 1.00 3.70 10.00 2.85 0.6078 56.50 4,881,517 -31.86 -1.5E+05 -1.0E+05
B-30 B Arroyo de la Laguna 17,845 9,960 7,885 50 2.00 0.002500 0.047 2-year 4,400 10.24 - 722.08 95.81 7.54 90.98 6.09 0.80 2.40 5.60 7.00 2.67 0.0534 4.85 419,472 0.75 3.5E+03 2.4E+0317,845 9,960 7,885 50 2.00 0.002500 0.038 100-year 19,300 - 24.48 2,422.54 159.48 15.19 147.92 7.97 0.80 2.40 5.60 7.00 2.67 0.1103 16.32 1,409,733 40.18 1.9E+05 1.3E+05
B-30 B Arroyo de la Laguna 9,960 3,225 6,735 30 2.00 0.002800 0.047 2-year 4,400 12.20 - 663.92 84.57 7.85 78.81 6.63 0.80 2.40 5.60 7.00 2.67 0.0689 5.43 469,097 -0.57 -2.7E+03 -1.8E+039,960 3,225 6,735 30 2.00 0.002800 0.038 100-year 19,300 - 23.51 1,810.74 135.14 13.40 124.04 10.66 0.80 2.40 5.60 7.00 2.67 0.3229 40.06 3,460,814 -23.74 -1.1E+05 -7.6E+04
B-10 B Arroyo de la Laguna 3,225 200 3,025 10 3.00 0.005000 0.047 2-year 4,600 12.37 - 582.92 88.25 6.61 84.23 7.89 0.80 2.40 5.60 7.00 2.67 0.1299 10.94 945,232 -5.51 -2.6E+04 -1.8E+043,225 200 3,025 10 3.00 0.005000 0.037 100-year 20,200 - 21.78 1,640.91 147.75 11.11 140.68 12.31 0.80 2.40 5.60 7.00 2.67 0.5586 78.58 6,789,594 -38.53 -1.8E+05 -1.2E+05
[Boundary Condition]
[Boundary Condition]
[Boundary Condition]
CHANNEL DATA FLOW DATA BED MATERIAL DATA SEDIMENT TRANSPORT DATA
[Bounday Condition]
4.4E+03
-4.2E+04
[Bounday Condition]
[Bounday Condition]
-1.5E+05
3.4E+02
-7.7E+01
3.1E+04
1.1E+04
1.2E+03
-1.1E+03
-2.6E+04
8.3E+03
1.1E+05
1.5E+04
-9.3E+03
-1.3E+05
SUMMARY RESULTS
Scenario E: Full Build-Out Development + Implementation of SMMP Program
[Bounday Condition]
[Bounday Condition]
1.5E+04
6.7E+04
8.9E+04
5.4E+04
-1.2E+03
7.0E+03
[Bounday Condition]
2.4E+04
8.6E+02
-1.6E+04
-8.5E+04
-7.3E+04
-1.8E+05
1 West Yost & Associates, November 2001 (Table TM5A-23 of Appendices)
1.1E+05
Appendix E8/23/2004