draft - university of toronto t-space · draft thirty-ninth canadian geotechnical colloquium:...
TRANSCRIPT
Draft
Thirty-ninth Canadian Geotechnical Colloquium:
Unsaturated Soil Mechanics: Bridging the Gap Between
Research and Practice
Journal: Canadian Geotechnical Journal
Manuscript ID cgj-2016-0709.R1
Manuscript Type: Review
Date Submitted by the Author: 23-Aug-2017
Complete List of Authors: Siemens, Gregory; GeoEngineering Centre at Queens-RMC,
Is the invited manuscript for consideration in a Special
Issue? : N/A
Keyword: unsaturated soils, capillarity, strength, expansive soils, seepage
https://mc06.manuscriptcentral.com/cgj-pubs
Canadian Geotechnical Journal

Draft
Siemens (2017) 39th Canadian Geotechnical Colloquium
THIRTY-NINTH CANADIAN GEOTECHNICAL 1
COLLOQUIUM: UNSATURATED SOIL MECHANICS: 2
BRIDGING THE GAP BETWEEN RESEARCH 3
AND PRACTICE 4
Greg A. Siemens 5
Professor and Research Director 6
GeoEngineering Centre at Queen’s-RMC 7
Department of Civil Engineering 8
Royal Military College of Canada 9
Kingston, Ontario, K7K 7B4, CANADA 10
p: +1-613-541-6000 x6396; e: [email protected] 11
ABSTRACT 12
The majority of geoengineering applications occur in the unsaturated zone, which is in the near-surface 13
region forming the connection between meteorological phenomena above and saturated ground below. 14
The key characteristic of the unsaturated zone is that water is in tension or, put another way, pore water 15
pressure is negative. Moisture content, as well as most material properties, vary spatially and temporally 16
in the unsaturated zone and coupled processes are common. In geoengineering applications in the vadose 17
zone, unsaturated soils may be present during part or all of its design life. The question is how or when 18
to consider the unsaturated soils principles in an analysis or design. Although most geoengineering 19
applications have an unsaturated component, use of unsaturated soil mechanics in practice lingers 20
behind the prolific number of publications due uncertain benefit of accounting for unsaturated effects, 21
complexity, and conservativeness among other reasons. The focus of this colloquium is to continue 22
bridging the gap by illustrating unsaturated soils principles using application-driven examples in the 23
areas of capillarity as well as flow, strength, and deformation phenomena. As principles of unsaturated 24
soils become more understood and demand increases for incorporating climate change effects in design, 25
use of unsaturated soils principles in practice will continue to increase. 26
Keywords: 27
unsaturated soils, capillarity, seepage, strength, expansive soils 28
29
Page 1 of 37
https://mc06.manuscriptcentral.com/cgj-pubs
Canadian Geotechnical Journal

Draft
Siemens (2017) 39th Canadian Geotechnical Colloquium
INTRODUCTION 30
The majority of geoengineering applications occur in the unsaturated, or vadose zone, which can 31
be up to hundreds of meters in depth depending on the ground profile and climate. Unsaturated soils 32
applications include foundations, excavations, and buried infrastructure (Figure 1a, Costa et al. 2003, 33
Machmer 2012, Jung et al. 2016), infiltration and landslide triggering (Figure 1b, Iverson 2000; Blatz et 34
al. 2004; Tohari et al. 2007; Cascini et al. 2010; Rahimi et al. 2010; Zhang et al. 2010; Robinson et al. 35
2016), compacted materials (Figure 1c, Siekmeier 2007), cover systems (Figure 1d, Wilson et al. 1994, 36
O’Kane et al. 1998; Aubertin et al. 2009; Dobchuk et al. 2013; Huang et al. 2015; Knidiri et al. 2016), 37
evaporation-aided mine waste consolidation (Bussiere 2007; Qi et al. 2017; Simms 2017), sampling and 38
load tests (Figure 1e, Konrad 1990; Vanapalli and Mohamed 2007; Costa et al. 2003), as well as 39
cryogenic suction processes and contaminant migration (Figure 1f, Konrad and Morgenstern 1980; 40
Lenhard and Parker 1987; Azmatch et al. 2012). The unsaturated component of these examples can be 41
broadly grouped into flow, strength, and deformation phenomena. The key characteristic of the 42
unsaturated zone is that water is in tension or, alternatively, pore water pressure is negative. Soil 43
moisture content, in turn, varies with negative pore pressure or suction. A consequence of variable 44
moisture content is that soil properties, which are relatively constant in the saturated zone, vary spatially 45
and temporally in the unsaturated zone. Unsaturated processes are often coupled, meaning they span 46
across one or more of the flow-strength-deformation groups. For example, infiltration into a slope 47
(Figure 1b) is a flow process, which is coupled with the unsaturated strength of the soil and can lead to 48
landslide triggering. Unsaturated soils, found in the near-surface region, are continually interacting with 49
the surrounding environment as they form the connection between weather systems above and saturated 50
ground below. Thus, in each of the applications in Figure 1, the unsaturated component may be present 51
during part or all of its design life. 52
The question is how or when to consider the unsaturated component in an analysis or design. 53
Unsaturated soils researchers continue to move the state-of-the-art ahead with numerous unsaturated 54
soils conferences every year. Beginning with the first issue (Hamilton 1963) and continuing with several 55
Canadian Geotechnical Colloquiums papers (Fredlund 1979; Barbour, 1998; Bussiere 2007; Simms 56
2017), the Canadian Geotechnical Journal is recognized as one of the key journals for disseminating 57
unsaturated soils research. In practice, use of unsaturated soils principles develops incrementally with 58
local expertise or in applications that have unsaturated effects at their core (e.g. cover systems or deep 59
geological repositories for spent nuclear fuel). Thus, despite numerous geoengineering applications that 60
include an unsaturated component, a gap exists between research and practice. The gap is due to a 61
number of reasons that include the perceived complicated nature of unsaturated soil mechanics. Another 62
perception that, in all cases, ignoring unsaturated effects provides additional safety in the performance of 63
a geo-structure. In some cases, if the unsaturated components are ignored in design, additional safety 64
factor may be available to the designer, which in my opinion is a reasonable approach. For example, 65
ignoring the unsaturated strength component for a foundation above the water table will underestimate 66
the strength and stiffness of the founding soil. However, in other cases, ignoring the unsaturated effects 67
can lead to inefficiencies that affect the expected performance or lead to a false conclusion of a failure 68
mechanism. For example, ignoring unsaturated soils effects in modelling transient triggering of a 69
rainfall-induced landslide. In this paper, unsaturated soils principles are presented to illustrate 70
Page 2 of 37
https://mc06.manuscriptcentral.com/cgj-pubs
Canadian Geotechnical Journal
Draft
Siemens (2017) 39th Canadian Geotechnical Colloquium
opportunities to broaden use of unsaturated soil mechanics. Unsaturated soils principles are illustrated 71
through application-driven examples in the areas of capillarity as well as flow, strength, and deformation 72
phenomena. 73
CAPILLARITY 74
Capillarity is a surface tension phenomenon whereby a pressure change occurs across an air-75
water interface (Lu and Likos 2004, Fredlund et al. 2012). The shape of the air-water interface and the 76
corresponding change in pressure across the interface is described by the classic Young-Laplace 77
Equation (Maxwell and Strutt 1911). Figure 2 includes three examples of capillarity: in zero gravity, in 78
capillary tubes, and on flat surfaces. Canadian astronaut Chris Hadfield is shown in Figure 2a on-board 79
the International Space Station with his hand coated in water. Water preferentially coats his hand as 80
surface tension forces dominate in zero-gravity conditions. Water also forms menisci between his 81
fingers and the direction of the surface tension forces are indicated on the figure. The angle at which 82
surface tension forces act with respect to his fingers is determined by the contact angle shown in Figure 83
2c, which displays a drop of water on horizontal and sloped surfaces. On a horizontal surface, the 84
interaction between air-water and the surface is apparent by the contact angle, α. In this case, the contact 85
angle is less than 90o, which indicates water is the wetting fluid and air is the non-wetting fluid. The 86
solid surface prefers to be in contact with water rather than air. Contact angle is also variable, as 87
illustrated in Figure 2c for the sloped surface. In the sloped case, there is a clear leading contact angle, 88
α1, and trailing contact angle, α2. Contact angle is a property that is unique to each fluid-fluid-solid 89
combination. In some cases, fluids can be wetting while in other cases fluids are wetting. For example, 90
mercury forms beads on a surface indicate air is the wetting fluid for an air-mercury-solid combination. 91
A classic example of capillarity is given in Figure 2b, which is capillary tubes of different sizes 92
placed into a container of water. Capillary forces act to draw water up into the capillary tubes to 93
different heights. The height that water is drawn up the capillary tube is a function of the radius of the 94
tube as well as the surface tension, contact angle, and density of water. Performing vertical force 95
equilibrium by resolving the weight of the water and surface tension forces, and solving for the capillary 96
rise height, h, gives the equation on Figure 2b. The smaller the radius of the tube the greater the height 97
of capillary rise. An important implication of the curved meniscus at the top of each water column is the 98
pressure difference between the air and water in the tube. The pressure difference between the air and 99
water phases also leads to the definition of matric suction (air pressure-water pressure or ua-uw). The 100
force arrows pointing upward and the concave shape of the meniscus indicate that air pressure is greater 101
than the water pressure. This is a physical representation of the Young-Laplace Equation (Maxwell and 102
Strutt 1911), which describes the pressure difference across curved surfaces. 103
In unsaturated ground, water is under the same surface tension forces as in the capillary tubes 104
with surface tension forces pulling soil grains together. For a visual example, Bozkurt et al. (2017) 105
recently measured surface tension forces between two glass spheres connected by a water bridge. Figure 106
3 is a hydrostatic ground profile showing pore pressure and degree of saturation versus elevation. The 107
profile is at hydrostatic equilibrium and no flow is occurring. At the groundwater table, pore pressure is 108
zero and varies hydrostatically above and below. Below the groundwater table, the ground is saturated 109
and degree of saturation is 100%. Moving up from the phreatic surface, three distinct zones are the 110
capillary zone, transition zone, and residual zone. In the capillary zone, degree of saturation remains at, 111
Page 3 of 37
https://mc06.manuscriptcentral.com/cgj-pubs
Canadian Geotechnical Journal
Draft
Siemens (2017) 39th Canadian Geotechnical Colloquium
or close to, 100%. The soil-air-water representation shows occluded bubbles, which is reflective of a 112
continuous water phase and discontinuous gas phase. From the capillary tube analogy, the height of the 113
capillary zone is reflective of the radius of the largest pores in the soil. Moving upward into the 114
transition zone, degree of saturation decreases with elevation. In this zone, the air phase becomes 115
continuous across the element. Moving upward in the transition zone, degree of saturation continues to 116
decrease until the residual zone is reached. The vertical distance from the groundwater table to the 117
residual zone (indicated on Figure 3) is soil-type dependent and ranges from a few millimeters for 118
gravels to hundreds of meters for clays. From the capillary tube analogy (Figure 2) this vertical distance 119
is related to a continuous set of pores that have a radius less than that associated with the vertical 120
distance above the groundwater table (equation on Figure 2b). Within the residual zone, Sr=0% is 121
approached asymptotically. The air phase is continuous while the water phase has become discontinuous 122
and water only coats the soil grains (since water is the wetting fluid and air is the non-wetting fluid). 123
Storage Function 124
The storage function is the fundamental relationship for unsaturated soils (Brooks and Corey 125
1964, van Genuchten 1980, Fredlund and Xing, 1994, Barbour 1998, Lu and Likos, 2004, Fredlund et al. 126
2012). Also termed the soil water characteristic curve or water retention curve amongst other names, the 127
storage function is the relationship between water content and suction as shown schematically in Figure 128
4a. The storage function provides valuable and important information of the soil. Most often associated 129
with soils, storage functions have also been reported for geosynthetics (Bouazza et al. 2006, Bathurst et 130
al. 2007, 2009; Siemens and Bathurst 2010, Beddoe et al., 2011, Siemens et al. 2012) and are used to 131
develop frozen soil relationships (Azmatch et al. 2012). The storage function is the first, and often only, 132
function that is experimentally measured in unsaturated soils. From the storage function (van Genuchten 133
1980, Fredlund and Xing, 1994) many other unsaturated soil relationships can be estimated including 134
unsaturated hydraulic conductivity (Mualem 1976, Fredlund et al. 1994, Burdine 1953, Leong and 135
Rahardjo 1997), and unsaturated strength (Vanapalli et al. 1996). 136
The storage function in Figure 4a is essentially equivalent to the vertical profile of degree of 137
saturation for the hydrostatic pore pressure profile in Figure 3. Analogous zones and soil-air-water 138
representations appear on Figure 4a to reflect this similarity. Suction, or matric suction (ua-uw) to be 139
more precise, is expressed as the difference between the air pressure (ua) and water pressure (uw). This is 140
consistent with the pressure difference across the air-water interface explained by the Young-Laplace 141
Equation and expressed physically as the curved surface within the capillary tubes in Figure 2c. For the 142
typical case of atmospheric air pressure, suction is equivalent to the absolute value of the negative pore 143
water pressure. Similar to the vertical profile (Figure 3), the magnitude of suction at which the residual 144
water content is reached varies orders of magnitude. Because of this difference, the x-axis is adjusted to 145
ensure the entire storage function can be viewed on a single graph. Coarse-grained soils have suction 146
plotted on an arithmetic axis while fine-grained soils plotted on logarithmic axis. Similar to grain-size 147
curves, logarithmic axes are used for convenience in order to be able to visualize the entire relationship. 148
An important aspect of the storage function is interpretation of material properties including the 149
air entry value and unsaturated hydraulic conductivity function from experimental data. This is 150
especially true for deformable soils, which will experience significant volumetric strains during drying 151
and cause changes to the soil’s pore-size distribution (Romero and Simms 2008). Historically, storage 152
Page 4 of 37
https://mc06.manuscriptcentral.com/cgj-pubs
Canadian Geotechnical Journal

Draft
Siemens (2017) 39th Canadian Geotechnical Colloquium
functions are plotted using a range of moisture content variables including degree of saturation, 153
volumetric water content, or gravimetric water content. These are mostly due to unsaturated soil 154
mechanics taking on aspects of hydrology or agriculture rather than a geo-perspective. AEV is defined 155
as the suction at which air enters the soil. Soils that experience swelling-shrinkage with changes in 156
suction are particularly susceptible to potential errors in AEV interpretation. Using gravimetric or 157
volumetric water content can cause significant errors in determining AEV or unsaturated conductivity 158
curve as changes in moisture content could reflect loss of water rather than air entering the soil. To 159
properly interpret AEV and the unsaturated hydraulic conductivity curve, moisture content must be 160
plotted in terms of degree of saturation (Fredlund et al. 2012). In deformable soils (Fredlund et al. 2011, 161
Wijaya et al. 2015, Saleh-Mbemba et al. 2016), measurement of the shrinkage curve, in addition to the 162
storage function is recommended to ensure proper interpretation of material parameters including AEV 163
and the unsaturated hydraulic conductivity curve. 164
FLOW PHENOMENA 165
Unsaturated flow phenomena commonly occur in the near surface zone with interactions 166
between above-ground weather systems. Examples include infiltration (Figure 1b), cover systems 167
(Figure 1d), water drawn towards a freezing front due to cryogenic suction (Figure 1f), and multi-phase 168
flow applications such as contaminant migration (Figure 1f). In each of these applications, the soil 169
serves as a conveyant for flow while also undergoing changes in storage during transient events. The 170
ability of soil to convey flow applies to movement of water in the near-surface area, water balance 171
calculations, and ground-climate interactions. 172
The fundamental principle that controls flow phenomena in unsaturated ground is that hydraulic 173
conductivity varies with suction as shown in Figure 4b. Saturated hydraulic conductivity alone is one of 174
the most variable material properties fluctuating more than ten orders of magnitude. In unsaturated 175
ground, the hydraulic conductivity of an individual soil also differs orders of magnitude due to changes 176
in moisture content. The shape of the unsaturated conductivity function (Figure 4b) resembles the 177
storage function (Figure 4a) with three distinct zones. In the capillary zone at suctions less than the air 178
entry value, the saturated conductivity is essentially retained. In the transition zone, hydraulic 179
conductivity decreases as pores desaturate and the water phase becomes more disconnected while the air 180
phase becomes continuous. In the residual zone, the water phase becomes discontinuous and hydraulic 181
conductivity decreases to essentially nil. The range of difference from saturated hydraulic conductivity 182
to the minimum is often greater than 4 orders of magnitude and can be greater depending on the soil 183
type. 184
That hydraulic conductivity varies orders of magnitude brings into question the validity of the 185
flow laws for saturated ground. Researchers found that D’arcy’s law (D’Arcy 1856) and Bernoulli’s law 186
apply, however, the process for solving the flow equation becomes more complicated. In saturated 187
ground, the differential equation for flow reduces to the Laplace differential equation, which can be 188
solved graphically. For unsaturated flow, the assumptions of isotropic and homogeneous are invalidated. 189
Therefore, a numerical solution is often used, which may take the form of finite element or finite 190
difference methods. With the advent of numerous groundwater flow software, steady-state unsaturated 191
flow problems can be solved relatively quickly using numerical solutions. 192
Page 5 of 37
https://mc06.manuscriptcentral.com/cgj-pubs
Canadian Geotechnical Journal
Draft
Siemens (2017) 39th Canadian Geotechnical Colloquium
Unsaturated flow phenomena impact all the applications in Figure 1 making its understanding 193
vital for application. Ever more powerful computers and software make solving steady-state unsaturated 194
flow problems possible with relative ease, however, care must be taken to appreciate the underlying 195
assumptions and inputs. Unsaturated flow phenomena will be presented in this section in order to 196
illustrate where appropriate assumptions can be made to obtain a suitable answer and where detailed soil 197
information is necessary. The three applications are steady-state vertical flow, steady-state seepage in a 198
dam, and infiltration in homogeneous and layered ground. The applications will illustrate the 199
consequences of making poor assumptions in an analysis and the implications of those consequences. 200
Steady-State Flow Phenomena 201
Illustrative example #1: Determination of vertical flow direction in unsaturated ground 202
The first example illustrates the driving gradient for flow in unsaturated ground. Figure 5a plots 203
two gravimetric moisture content profiles and the question for both profiles is whether flow is upward or 204
downward. In both profiles (Figure 5a), gravimetric water content increases nonlinearly with depth and a 205
constant value is obtained at 5m depth. An initial temptation is to interpret the direction of flow as 206
following the moisture content gradient or that the both profiles show downward flow due to gravity. 207
However, D’arcy’s law and Bernoulli’s law still hold in unsaturated ground and, therefore, water flows 208
due an energy (i.e. total head) gradient. The equation for total head (Figure 5c) includes both elevation 209
head and pressure head. Thus the determination of direction of flow requires knowledge of the storage 210
function. Figure 5b plots the storage function in terms of gravimetric water content versus both matric 211
suction and matric suction head. 212
In order to properly determine the direction of flow, Bernoulli’s equation (Figure 5c) is 213
employed. A datum is set at 5m depth in order to assess the elevation head of each moisture content 214
measurement. Then the storage function (Figure 5b), is used to calculate the pressure head for each 215
gravimetric water content measurement. The moisture content measurements are plotted on the storage 216
function (ignoring hysteresis) and the matric suction head for each measurement is indicated on Figure 217
5b. Finally, the total head profile can be calculated and plotted in Figure 5c. Despite seemingly 218
comparable moisture content profiles, opposing flow gradients (one up and one down) are indicated by 219
the total head gradients. This example illustrates the principle that unsaturated flow still follows 220
Bernoulli’s equation, with flow from high total head to low total head. 221
Illustrative example #2: Unconfined flow through an earth dam 222
The second example illustrates where assuming a storage function is sufficient to obtain a 223
realistic solution to a flow problem. Terzaghi (1943) used seepage through a dam as an example of 224
where unsaturated principles can be applied. A similar example, given in Figure 6, is an earthen dam 225
with 2H:1V slopes and 2m of freeboard to retain a 10m high water reservoir. A 9m wide toe drain is 226
located on the downstream side of the dam. The solutions provided on Figure 6 include a graphical 227
solution, a finite element method solution which makes an incorrect assumption, and a finite element 228
method solution that employs a sensible unsaturated hydraulic conductivity assumption to obtain an 229
appropriate solution. 230
Page 6 of 37
https://mc06.manuscriptcentral.com/cgj-pubs
Canadian Geotechnical Journal

Draft
Siemens (2017) 39th Canadian Geotechnical Colloquium
The graphical solution is given in Figure 6a and a summary of the flow calculations is given on 231
the figure. In order to draw the flownet, an assumption about the water table is made. The water table is 232
assumed to be a no-flow boundary and the unsaturated component of flow is zero. This is indicated on 233
Figure 6a as K=0 in the unsaturated zone and K=Ksat in the saturated zone. Flow of 144 L/d/m of dam 234
was calculated using the flownet solution and a Ksat=10-6 m/s. 235
A second solution is shown in Figure 6b, which illustrates an incorrect, or ‘black box’, approach 236
to finite element modelling. With some effort, flow calculations can be performed using software, 237
however, proper care is required even for straightforward problems. In the case displayed in Figure 6b 238
the saturated hydraulic conductivity has been applied to the entire domain, which is indicated on the 239
figure as K=Ksat above and below the water table. This assumption could be made to be ‘conservative’ 240
or by mistake. Comparing the flow calculations for Figure 6a and 6b indicate they are significantly 241
different. Assuming that the entire domain has saturated conductivity increases the total flow to 227 242
L/d/m with 86 L/d/m being the unsaturated component. The flow below the water table (141 L/d/m) is 243
comparable to the flow net (144 L/d/m). Therefore, the issue is with the unsaturated component, which 244
is too high. 245
A third solution, which sensibly accounts for the unsaturated component of flow, is shown in 246
Figure 6c. In this case, the unsaturated hydraulic conductivity curve was assumed using ‘stock’ storage 247
function from within the software. The only input required is a saturated hydraulic conductivity and the 248
soil type. The solution, shown in Figure 6c, shows the total head contours are similar to Figure 6b. 249
However, the flow calculations are significantly different. Flow below the water table is principally 250
equivalent (141 versus 142 L/d/m) while the unsaturated component is just 13 L/d/m compared with 86 251
L/d/m in the ‘black box’ solution. 252
The most representative solution for estimating unconfined flow within a homogeneous earthen 253
dam can be made using a finite element model solution with an assumed unsaturated conductivity 254
function (Figure 6c). The flownet solution ignored the unsaturated component of flow and 255
underestimated flow by 10%. The ‘black box’ solution which applied saturated hydraulic conductivity to 256
the entire domain overestimated flow by 40% and the unsaturated component of flow by 500%. For 257
cases in which the saturated conductivity is known, assuming the unsaturated conductivity function is 258
normally acceptable for steady-state problems. In these applications, the impact of the unsaturated 259
conductivity function serves to decrease in conductivity above the water table. With some practice, 260
steady-state problems can be solved relatively quickly. Sensitivity analyses can also be performed to get 261
a sense of the impact of uncertainties in the geometry, material properties, and boundary conditions. 262
Transient Flow Phenomena 263
Transient unsaturated flow phenomena are inherently more complicated compared with steady-264
state and require a higher level of material property measurements. For example, in cover systems 265
(Figure 1d, Wilson et al. 1994, O’Kane et al. 1998; Aubertin et al. 2009; Dobchuk et al. 2013; Huang et 266
al. 2015; Knidiri et al. 2016) transient analysis allows for consideration of soil-weather interactions, 267
which are coupled problems that include heat transfer, vapour flow, and liquid flow, to calculate 268
evaporation from the soil surface (Bitelli et al. 2008; Lehman et al. 2008; Or et al. 2013). In this section, 269
transient flow phenomena are illustrated using unsaturated transparent soil. An unsaturated transparent 270
soil experiment is shown in Figure 7a, which is a series of digital photos of infiltration in a layered 271
Page 7 of 37
https://mc06.manuscriptcentral.com/cgj-pubs
Canadian Geotechnical Journal

Draft
Siemens (2017) 39th Canadian Geotechnical Colloquium
profile. Transparent soil is formed by matching the refractive indices of a soil and pore fluid and several 272
combinations of transparent soil are found in the literature (Iskander et al. 2015). Saturated transparent 273
soil allows for direct observation from within the soil mass of deformations, strains and soil-structure 274
interaction rather then at the boundary of an experiment. Unsaturated transparent soil takes this concept 275
in another direction (Peters et al. 2011). Observations in unsaturated experiments are often limited by the 276
number of measurement devices that can be located within an experimental apparatus. A nominal 277
number of discrete measurement points are normally included to measure pore pressure, suction, and/or 278
moisture content. Unsaturated transparent soil, combined with digital image analysis, allows for 279
measurement of degree of saturation to the millimeter resolution, which is orders of magnitude more 280
data than can be obtained from discrete measurements. 281
To illustrate transient moisture migration in a heterogeneous profile, a transparent infiltration 282
experiment is shown in Figure 7a with a fine layer between two coarse layers. A 10cm high pond was 283
placed at the surface and the wetting front descends through the profile. Digital images were collected 284
every 5s in this experiment and a select number are shown in the figure. The wetting front is clearly 285
visible and is indicated by the black arrow. As the wetting front reaches the fine layer, ponding occurs, 286
the soil above the fine layer changes to a darker colour associated with an increase in saturation. In the 287
final photo, ponding is complete and the wetting front continues to descend through the fine layer. These 288
images visually illustrate how moisture migration is affected by a relatively thin finer layer. The finer 289
layer serves as a bottleneck to the system and causes saturation above as well as development of positive 290
pore pressure. 291
Transparent soil allows for clear identification of the wetting front and measurement of the 292
degree of saturation within the profile at high spatial and temporal resolution. Each digital image is 293
processed by normalizing the image intensity between an image of a dry profile (white) and a saturated 294
profile (black) to calculate the normalized intensity, IN at the pixel scale. The calibration curve plotted in 295
Figure 7b is used to convert normalized intensity to degree of saturation. On the plot are calibration 296
points as well as a predicted curve. At IN=0, the soil is dry and IN=1, degree of saturation is 100%. At 297
90%, discrete air bubbles are visible while at lower saturations the soil visually lightens continually until 298
its dry. Details on the digital image process can be found in Peters et al. (2011) and Sills et al. (2016). 299
Transparent soil used at RMC is formed from fused quartz and comes in two types, termed the coarse 300
and fine gradations (Figure 7c). Both gradations are uniform sands with D10 equal to 0.75mm and 301
0.13mm respectively. The saturated conductivity of the two gradations differ by less than one order of 302
magnitude. 303
Impact of heterogeneities on infiltration 304
To quantitatively illustrate the impact of minor heterogeneities on unsaturated processes, detailed 305
results from two infiltration experiments are plotted in Figure 8 including degree of saturation profiles 306
during the two experiments, wetting front location versus time, and pore pressure profiles from the 307
beginning and end of the experiments. The only difference between the two experiments is the 120mm 308
fine layer placed at 510mm depth below the surface. The D10 of the finer layer is just 0.62mm less than 309
the coarse layers. The water table is located a 180mm elevation and a 10cm pond is placed on the 310
surface at the beginning of the experiment. The uniform profile experiment shows the dry degree of 311
saturation profile to start and the wetting front starting to descend at time=0s. As the wetting front 312
Page 8 of 37
https://mc06.manuscriptcentral.com/cgj-pubs
Canadian Geotechnical Journal
Draft
Siemens (2017) 39th Canadian Geotechnical Colloquium
descends the soil increases Sr behind the wetting front and the experiment is completed at 380s. The 313
wetting front versus time (Figure 8c) shows the wetting front descending linearly from the surface down 314
to the water table. The initial and final pore pressure results show the initial vertical suction profile 315
which then becomes a linear decrease in pore pressure from the 10cm pond at the surface to 0kPa at the 316
water table. 317
Infiltration in a layered profile shows the impact of a fine layer with D10 differing just 0.62mm 318
between the two gradations. Prior to the wetting front reaching the fine layer, the experimental results 319
are identical in terms of the change in saturation and the wetting front descent rate. As the wetting front 320
reaches the fine layer, the wetting front slows down significantly (Figure 8c). The wetting front 321
continues to descend at a slower constant rate below the top of the fine layer until the water table is 322
reached at the end of the test. The wetting front encountering the fine layer causes a ponding above the 323
top of the fine layer and a hydrostatic pore pressure profile occurs (Figure 8d). The pore pressure 324
dissipates across the fine layer and is essentially 0 kPa in the lower coarse layer. 325
Small heterogeneities affect the mobility of the wetting front, infiltration rate, and pore pressure 326
response during infiltration. In the field, small differences in grain-size leading to a layered profile often 327
occur naturally or during construction. Comparing the degree of saturation profiles at the end of 328
infiltration (last profiles on Figure 8a and 8b) shows they are identical above the fine layer in the 329
uniform and layered experiments. The wetting front also descends at the same rate until the sharp change 330
when the fine layer is reached. Below the fine layer, the wetting front moves 4-times slower compared 331
with the uniform profile. From a flow perspective, the fine layer serves as a bottleneck which reduces 332
the transmissive capacity of the system. The pore pressure response at the end of the test is also 333
significantly different. Pore pressure in the uniform coarse profile decreases from the 10cm pond at the 334
surface to 0kPa at the water table (Figure 8d). In the layered experiment, a hydrostatic profile occurs 335
above the fine layer with the initial suction dissipated below the fine layer. These experiments illustrate 336
the impact of a thin and minor heterogeneity on infiltration. The fine gradation layer is just, 120mm 337
thick and the D10 is only 0.62mm different. However, the fine layer caused important differences to the 338
pore pressure response and water balance calculations. 339
In the steady-state examples given above, estimations of the unsaturated functions were adequate 340
to model the results. However, in transient applications, the unsaturated functions have a more 341
significant role in the results. The two experiments plotted in Figure 8 were modelled using the finite 342
element method (Siemens et al. 2014) and the results are plotted on Figure 8c and 8d. The storage 343
functions and unsaturated conductivity functions were measured for coarse and fine gradations. The 344
results match the model values throughout the experiments, however, the both the experiments and 345
numerical simulations require experience to obtain reliable results. If infiltration rate is the most 346
important consideration, another option is to use Green-Ampt model (Green and Ampt 1911), which 347
gives the infiltration rate and wetting front location (Siemens et al. 2013). With proper calibration of the 348
Green-Ampt parameters and knowledge of the conductivity of the transmissive zone these models are 349
options depending on the requirements of the application. 350
Flow Phenomena Summary 351
Flow phenomena impact most geotechnical applications that include an unsaturated component. 352
Applications in unsaturated ground (Figure 1) are inherently connected to the weather systems above 353
Page 9 of 37
https://mc06.manuscriptcentral.com/cgj-pubs
Canadian Geotechnical Journal

Draft
Siemens (2017) 39th Canadian Geotechnical Colloquium
ground and therefore will interact hydraulically. Flow mechanisms in unsaturated ground are impacted 354
by the hydraulic conductivity function which varies with suction. This section illustrated that the driving 355
energy for flow follows Bernoulli’s law, showed how reasonable assumptions can be made for steady-356
state applications, and demonstrated the influence that small heterogeneities have on transient 357
unsaturated flow. 358
STRENGTH PHENOMENA 359
Geotechnical applications that include an unsaturated strength component include foundations 360
(Figure 1a), buried infrastructure (Figure 1a), landslides (Figure 1b), compacted construction materials 361
(Figure 1c), and pile and plate load tests (Figure 1e). For these type of applications located in the vadose 362
zone, a component of their performance is dependent on unsaturated soil principles. Within the 363
unsaturated zone, strength is a function of suction. Commonly found evidence of unsaturated strength 364
principles are sand castles constructed from a coarse-grained (also termed cohesionless) soils as depicted 365
on Figure 9. If a coarse-grained soil is dry (Sr=0) or saturated (Sr=1), the maximum slope the soil is 366
stable at is the angle of repose or angle of internal friction. However, if the soil is unsaturated it is stable 367
at steeper slopes, which allows for creation of impressive structures such as the one shown in Figure 9. 368
In an unsaturated state, surface tension forces act at the granular level to increase the normal stress 369
between particles. In this framework, the friction angle of the soil remains constant while the apparent 370
cohesion intercept is affected by suction. Figure 9 shows a Mohr-Coulomb strength envelope for 371
saturated and unsaturated soils. For saturated and dry soils (Sr=1 and Sr=0), apparent cohesion is nil and 372
the strength envelope is dependent only on the friction angle of the soil. For unsaturated soils, an 373
apparent cohesion term elevates the strength envelope vertically. The amount of apparent cohesion is 374
related to the storage function. The apparent cohesion intercept increases through the capillary zone and 375
transition zone and decreases in the residual zone (Vanapalli et al. 1996, Lu and Likos 2004, Fredlund et 376
al. 2012). 377
All soils in the vadose zone have an unsaturated component of strength associated with apparent 378
cohesion. In practice, the unsaturated component is infrequently counted on in design due to its inherent 379
transient nature. In this section, the focus is placed on examples in which ignoring unsaturated strength 380
would have led to the wrong answer/development of an application. An interesting historical example of 381
unsaturated soil strength as well as the effect of suction on plate load experiments are examined. 382
Historical Example 383
An historical application of unsaturated soil mechanics is illustrated in Figure 10a, which is a 384
wall painting from a tomb in southeastern Egypt (Newberry 1895). The wall painting shows a statue on 385
a sled being dragged over the sandy desert. The application of unsaturated soil mechanics is shown by 386
the person adding water to the ground directly in front of the sled. Once thought to be a ceremonial act, 387
he is actually using unsaturated principles to minimize interface friction between the sand and the 388
bottom of the sled. 389
In order to test this hypothesis, Fall et al. (2014) performed a set of experiments to examine the 390
influence of moisture content on interface friction. The experiment (plotted in Figure 10b as Load versus 391
Displacement) consisted of placing a mass on top of a 11x7.5cm sled and pulling it across a sandy 392
material prepared at specified water contents. The results (Figure 10b) show that an initial stiff response 393
Page 10 of 37
https://mc06.manuscriptcentral.com/cgj-pubs
Canadian Geotechnical Journal

Draft
Siemens (2017) 39th Canadian Geotechnical Colloquium
transitions to one where load remains constant with displacement. The volumetric moisture content of 394
each experiment is noted on Figure 10b. The authors observed that when the sand was dry or at high 395
moisture content the sled sank into the ground and plowed sand out of the way. Between these two 396
extreme moisture contents, the sled sank less into the soil and less plowing occurred. Figure 10b 397
indicates that when the soil is dry or saturated the effort to pull the sled across the sand is high compared 398
with a minimal load for VWC=5%. At VWC=5%, for this particular sandy material, the strength of the 399
material is maximized and the load to pull the sled is minimized. 400
The unsaturated soil principle illustrated in Figure 9 is displayed with this historical application. 401
Figure 9 shows that apparent cohesion is a function of saturation. At Sr=100% or Sr=0%, strength 402
reduces to the saturated value, which from an interface-friction perspective, led to plowing of the sled 403
through the sand and an increase in pulling load. At VWC=5%, the soil strength was maximized, the 404
sled slid on top of the sand and the pulling load was minimized. The Egyptians wanted to maximize 405
speed and mobility for transport of statues and construction materials. Therefore, minimizing the 406
interface friction between the sled and the ground allowed for more efficient transport. In a dry desert 407
environment, the near-surface sand would be at a moisture content less than this optimal value. Thus the 408
person on the front of the sled wetting up the surficial sand would temporarily increase the sand strength 409
and minimize pulling effort. From Figure 10b a 30% reduction in pulling load was found for the 410
optimized moisture content compared with both dry and wetter sand. Thus an 30% efficiency was 411
gained by taking advantage of unsaturated principles. 412
Plate Load Tests 413
The effect of suction on unsaturated soil strength can be important in back analysis of failures as 414
well as interpretation of insitu tests. Understanding the impact of suction on the unsaturated strength 415
envelope can significantly impact interpretation of the failure mechanism. To understand the 416
significance of suction on surface loads, Vanapalli and Mohamed (2007) performed a series of 417
laboratory experiments where they applied a vertical pressure to the surface of a soil formed at specified 418
moisture contents. The experiments were performed in a 90x90x75cm (width x length x height) 419
reinforced box and the loading surface was 10x10cm. The soil is characterized as a sandy-gravel with 420
the storage function plotted in Figure 11a. The soil has an AEV of 3 kPa (~30 cm) and its residual 421
saturation is obtained at a suction of just 8 kPa (~80 cm). The friction angle of the soil is φ’=39o. 422
The question is, what impact could 6kPa suction have on the failure load. The four plate load 423
experiments were performed at suctions of 0, 2, 4, and 6kPa with the results plotted in Figure 11b. The 424
results show that the applied stress-settlement curves differ due to the suction. In each test a peak stress 425
is obtained followed by some decrease for the lower suction tests. A stiffer response to the load is 426
notable for the unsaturated experiments. A less stiff response and a lower peak stress is apparent for the 427
test performed at 0 kPa suction (i.e. saturated). The peak value increases with increasing suction over the 428
range of tests performed. At just 6kPa suction, the peak load capacity increases 7-fold compared with 429
the saturated test. 430
Practical implications can be drawn from these tests. The only difference in the plate load 431
experiments was the moisture content of the soil. Reducing the moisture content increases suction and, 432
in turn, increases the apparent cohesion intercept of the failure envelope (Figure 9). The implication for 433
interpreting plate load tests in the field is the need to measure moisture content in the zone of influence. 434
Page 11 of 37
https://mc06.manuscriptcentral.com/cgj-pubs
Canadian Geotechnical Journal

Draft
Siemens (2017) 39th Canadian Geotechnical Colloquium
Any variation in moisture content will have a corresponding effect on the strength of the soil. In the 435
experiments presented in Figure 11, the degree of saturation varied from 58-100% and had a 7-fold 436
effect on the peak capacity of the load test. 437
Strength Phenomena Summary 438
Unsaturated soils experience an increase in apparent cohesion associated with capillary forces 439
acting at the granular scale. However, owing to the inherent transient nature moisture migration within 440
the unsaturated zone, apparent cohesion is also a transient. In analysis of failures, and insitu tests 441
knowledge of unsaturated strength principles is recommended in order to correctly identify the 442
governing mechanisms. 443
DEFORMATION PHENOMENA 444
Deformation phenomena associated with unsaturated soils often coincide with a change in the 445
environmental conditions that alter the moisture regime. The key characteristic with respect to 446
deformation phenomena is that unsaturated soils can experience volumetric strains due to fluctuations in 447
both stress and moisture content (i.e. suction). Volumetric deformations associated with stress are 448
perhaps more intuitive compared with deformations associated with moisture fluctuations. Classic 449
examples of volumetric deformations associated with moisture changes are expansive soils and 450
collapsible soils. Expansive soils respond to wetting and drying cycles with significant volumetric 451
swelling and shrinkage as displayed on Figure 12 due to their clay mineralogy. Collapsible soils are 452
recently deposited or altered soils, which have a high void ratio, high sensitivity, and low inter-particle 453
bonding. In contrast to expansive soils, collapsible soils respond to wetting by subsiding or 454
hydroconsolidating with significant settlement (Clemence and Finbarr, 1981; Basma and Erdil 1992; 455
Rogers et al. 1994; Houston et al. 2001). Problems associated with collapsible soils include identifying 456
and characterizing them during a site investigation, predicting the magnitude of wetting, quantitative 457
predictions of collapse strains, and selecting design or mitigation alternatives (Houston et al. 2001). In 458
this section, the main principles of unsaturated soil deformation phenomena associated with wetting-459
drying of expansive clay soils are illustrated and a conceptual framework for swelling potential is 460
presented. 461
The most well-known soils that encounter deformations associated with moisture fluctuations are 462
expansive soils. The most susceptible structures to expansive soil effects are lightly loaded infrastructure 463
such as shallow foundations (Figure 12a, Domaschuk 1986). The American Society of Civil Engineers 464
report that expansive soils cause owners more financial loss than the combined effect of hurricanes, 465
earthquakes, and tornadoes. For reference Hurricane Sandy caused approximately $65.6 billion of 466
damage (Wikipedia). In the basement schematic (Figure 12a), a combination of events induces both 467
swelling and shrinkage, which leads to damaging differential displacements. Prior to construction often a 468
vegetative layer is removed. The vegetative layer provides an elevated suction environment through the 469
root systems, which uptake moisture from the ground. Once the vegetative layer is removed and the area 470
covered, the soil beneath the house experiences a suction decrease as the house cuts off direct access to 471
the ground surface. The soil swells and the house heaves in response to the decrease in suction. Adjacent 472
to the house, a shrinkage scenario ensues as a large tree is planted and the root systems descend deep 473
below the ground in the area next to the foundation. A growing tree continually requires more moisture 474
Page 12 of 37
https://mc06.manuscriptcentral.com/cgj-pubs
Canadian Geotechnical Journal
Draft
Siemens (2017) 39th Canadian Geotechnical Colloquium
from the ground, which comes from its roots and leads to an increase in suction around the perimeter 475
foundation. Owing to the increasing suction, the soil shrinks in response. The overall effect of the 476
swelling under the center of the house and the shrinkage on the periphery is differential settlements and 477
cracking of the basement. The damaging cost to owners is worsened as they often occur to personal 478
dwellings and few options may be apparent, which leads to extreme actions. The photograph in Figure 479
12b shows an example of extreme actions with basement walls being removed from a house, which were 480
then replaced along with the foundation (Siemens 2007). 481
To illustrate the magnitude of volumetric strains that can occur in expansive soils, digital images 482
from a shrinkage experiment and a swelling experiment are given in Figure 12d and 12e. In the 483
shrinkage experiment (Figure 12d), the test begins with an initially saturated sample. The specimen is 484
initially located within a test ring to provide confinement, which is later removed once separation 485
between the ring and the specimen occurs. The specimen dries in the low humidity laboratory 486
environment and shrinks. After 8 days, the specimen shrinks 75% of its initial volume. The suction-487
volumetric strain path for the shrinkage experiment is illustrated in Figure 12c, which is a constitutive 488
model for volumetric strains in unsaturated soil for both matric suction and net normal stress. Initially 489
saturated, the specimen is at 0 kPa matric suction. As evaporation of the pore water occurs, matric 490
suction increases and the soil shrinks in response. In the swelling experiment (Figure 12e), an 491
unsaturated expansive soil is given access to water through filter paper strips in contact with a water 492
reservoir (Lim and Siemens 2013). The initially unsaturated sample takes on water and swells in 493
response. After 10 days, the soil swells to -59.4% volumetric strain. Figure 12c plots the volumetric 494
strain-matric suction path, which is followed during the swelling experiment. The specimen is initially 495
unsaturated and at elevated suction. As the specimen is given access to water, matric suction decreases 496
and the sample swells in response. 497
Unifying Concept of Swelling Potential 498
Owing to the cost of damage to infrastructure constructed in expansive soils as well as their 499
importance for use as environmental barriers (i.e. landfill liners), much research has sought to 500
characterize the swelling potential of expansive soils. Swelling potential is measured in the laboratory 501
(ASTM D4546) and also estimated from index properties (Komine and Ogata 2003; Prakash and 502
Sridharan 2004; Cui et al. 2012; Ito and Azam 2013). Concepts for analysis and prediction of 503
infrastructure constructed in expansive soil are based on moisture content changes, suction, or 504
empirically based (Fredlund 1983; Briaud et al. 2003; Houston et al. 2011; Vanapalli and Lu 2012; 505
Puppala et al. 2014). Owing to the number of continuing resources and publications associated with 506
expansive soils, the research and practice communities are still in need of a practical methodology to 507
assess the effect of swelling potential to infrastructure. 508
Swell Equilibrium Limit Concept 509
A unifying concept for swelling potential is illustrated in Figure 13a using the application of a 510
retaining wall. The retaining wall is constructed on swelling ground and expansive soil is also used as 511
backfill material. An extended infiltration event occurs to induce wetting conditions to the system. 512
During wetting, swelling potential can be satisfied by a combination of volumetric expansion and 513
swelling-induced stresses, which depend on the boundary conditions during wetting. Three cases are 514
Page 13 of 37
https://mc06.manuscriptcentral.com/cgj-pubs
Canadian Geotechnical Journal
Draft
Siemens (2017) 39th Canadian Geotechnical Colloquium
illustrated in Figure 13a and their stress-volume paths plotted in Figure 13b in terms of specific volume 515
(V=e+1) versus mean stress (p=(σ1+σ2+σ3)/3). The three cases are unconfined swelling, swelling under 516
the foundation and swelling adjacent to the retaining wall. For the first case, in front of the retaining wall 517
swelling occurs under unconfined conditions like the laboratory experiment in Figure 12e. In Figure 518
13b, the stress-volume path begins at zero stress and moves vertically upward until the swelling 519
potential is satisfied. The second case for swelling is under the foundation. In this case the expansive soil 520
is subjected to an elevated stress level prior to the infiltration event, which serves to attenuate the 521
magnitude of swelling compared with the unconfined case. In Figure 13b, the stress-volume path begins 522
at an elevated stress level and moves vertically upward until the swelling potential is satisfied. The third 523
case for swelling is adjacent to the retaining wall. In this case, volumetric confinement is provided by 524
the retaining wall, which restricts expansion. Thus swelling potential is satisfied by swelling-induced 525
stresses during wetting. From a stress-volume perspective, the soil state begins at a location associated 526
with the stress level equal to the overburden stress and a volume equivalent to the end of construction. 527
During wetting, the stress-volume path is sloped upward to the right as expansion is limited by the 528
existence of the stiff retaining wall. At equilibrium, all three soil elements’ swelling potential have been 529
satisfied and their end-points are on the Swelling Equilibrium Limit (SEL, Siemens and Blatz 2009). 530
Measurement of Swelling Equilibrium Limit 531
The SEL is unique for each soil and is measured experimentally with a series of swelling 532
experiments such as those presented in Figure 13b. The experimental methodology (Siemens and Blatz 533
2007, Lim and Siemens 2013) consists of bringing identically prepared unsaturated specimens to defined 534
initial conditions and then wetting under idealized boundary conditions (Figure 13b). Results from three 535
triaxial swelling experiments to define a SEL are plotted on Figure 13b. In each test, the specimen is 536
brought to an initial stress condition and then given access to water. During the swelling phase, 537
controlled boundary conditions define the stress-volume path followed during the test. In Figure 13b 538
each test was brought to an initial stress state of 250 kPa and then the swelling phase was initiated. The 539
three boundary conditions applied during the tests were constant mean stress (CMS, vertical path), 540
constant stiffness (CS, upward sloping path), and constant volume (CV, horizontal path). The constant 541
mean stress-volume path is equivalent to the soil swelling under the foundation in Figure 13a as the 542
initial total stress is maintained during the swelling phase. When subjected to a constant mean stress, 543
swelling potential is satisfied by volumetric expansion. The constant stiffness stress-volume path is an 544
idealized representation of swelling adjacent to the retaining wall (Figure 13b). In the experiment, the 545
soil swells against a linear-elastic spring boundary condition. The third swelling test is constant volume, 546
in which swelling potential is satisfied entirely with swelling-induced stresses. The initial volume is 547
maintained constant during swelling and a horizontal path is followed during swelling. At the end of 548
each test, swelling potential is satisfied and the soil state lies on the SEL. 549
The unifying concept of swelling potential is illustrated for three soils in Figure 13c-e, which 550
include their SELs and unsaturated isotropic compression lines. The SEL is defined by fitting a 551
logarithmic curve to the end of swelling test points as shown in Figure 13c-e for bentonite-sand buffer, 552
Bearpaw clay, and Lake Agassiz clay. The triaxial swelling experiments shown in Figure 13b have their 553
end of swelling test states plotted in Figure 13c for reference. Also on SEL plots are shown the isotropic 554
Page 14 of 37
https://mc06.manuscriptcentral.com/cgj-pubs
Canadian Geotechnical Journal

Draft
Siemens (2017) 39th Canadian Geotechnical Colloquium
compression line on which each of the swelling tests was initiated. The area between the SEL and the 555
isotropic compression line is the swelling potential for each soil. The swelling potential is at a maximum 556
at zero stress and decreases with increasing stress. The isotropic compression curve and SEL converge at 557
higher stresses where the confining stress overcomes the swelling potential of the expansive soil. 558
Use of Swell Equilibrium Limit 559
Practical use of SEL concept relies on knowing the initial stress and volume states of a soil and 560
the boundary conditions during swelling. For a house foundation or a retaining wall these are defined for 561
constant mean stress areas and strategies are being developed for more complex cases (Lim 2014). Finite 562
element modelling of foundations (Siemens and Blatz 2008) have shown the potential for analysis tools. 563
The question arises whether SELs can only be defined in the laboratory or whether they can be estimated 564
from readily measured material properties as has been used in other analyses (Komine and Ogata 2003; 565
Prakash and Sridharan 2004; Cui et al. 2012; Ito and Azam 2013). Lim and Siemens (2016) showed that 566
SELs can be estimated from liquid limit, free swell potential, plasticity index, and initial specific 567
volume. The process involved fitting SEL equation parameters (VSEL=A+Bln(p)) to the material 568
properties for the soils as plotted in Figure 14a-b for liquid limit. In the plots SEL parameter ‘A’ 569
increases with increasing liquid limit while SEL parameter ‘B’ decreases. Parameter ‘A’ is the y-570
intercept of the SEL equation at zero mean stress while ‘B’ is related to the curvature. In both plots 571
Figure 14a and Figure 14b linear fits are provide although, in the future, non-linear fits may be justified 572
when the database size is increased. Using the predicted values from Figure 14a-b the SEL for Regina 573
clay was estimated based on its liquid limit of 76% (Fredlund 1975). The resulting SEL is plotted 574
alongside experimental data in Figure 14c and the results are comparable. 575
Deformation Phenomena Summary 576
Expansive soils display most distinctly that volumetric deformations in unsaturated soils are 577
induced by changes in suction. Due to this susceptibility, expansive soils annually cause similar 578
financial loss as the combined effect of hurricanes, earthquakes, and tornadoes (ASCE). The SEL 579
provides a conceptual framework to analyze and predict swelling behaviour and the ability to predict 580
SELs from index properties gives more encouragement to its use. Future research is directed at 581
development of a practical analysis tool. 582
SUMMARY 583
Unsaturated soils are found throughout nature in the vadose zone and form the connection 584
between above ground meteorological systems and saturated ground below. Geoengineering applications 585
in the vadose zone include an unsaturated component during some or all of their design lives (Figure 1). 586
Use of unsaturated principles is increasing in practice owing to knowledge accessibility, appreciation of 587
unsaturated effects on soil behavior, and increase in computing capabilities to incorporate unsaturated 588
relationships. This paper serves to make unsaturated soil mechanics more accessible and broaden their 589
use in practice. More and more designs are asked to incorporate climate change effects to predict 590
performance decades into the future. Incorporating climate change effects into design, will only serve to 591
increase the use of unsaturated soil mechanics in practice. 592
Page 15 of 37
https://mc06.manuscriptcentral.com/cgj-pubs
Canadian Geotechnical Journal
Draft
Siemens (2017) 39th Canadian Geotechnical Colloquium
ACKNOWLEDGEMENTS 593
The author is very grateful to the Canadian Foundation for Geotechnique and the Colloquium 594
Selection Committee for the honour of giving the Colloquium Lecture and opportunity to prepare this 595
manuscript. Contributions from current and past collaborators and graduate students have made this 596
work possible. Collaborators that have contributed to research on unsaturated soils from within the 597
GeoEngineering Centre at Queen’s-RMC including Richard Bathurst, Ryley Beddoe, Richard 598
Brachman, Kerry Rowe, and Andy Take and as well as graduate students: Pedram Abootalebi, John 599
Kingswood, Stephen Laporte, Bee Fong Lim, Jesse McCaw, Chris Oldroyd, Stephen Peters, Suzanne 600
Powell, Lee-Ann Sills, and Bardia Tabiatnejad. Funding from Natural Sciences and Engineering 601
Research Council, Nuclear Waste Management Organization, Royal Military College of Canada, and 602
Canada’s Department of National Defence is gratefully acknowledged. 603
Page 16 of 37
https://mc06.manuscriptcentral.com/cgj-pubs
Canadian Geotechnical Journal

Draft
Siemens (2017) 39th Canadian Geotechnical Colloquium
NOTATION 604 o degrees 605
A, B SEL equation parameters 606
AEV air entry value 607
CMS constant mean stress 608
CS constant stiffness 609
CV constant volume 610
c’’ apparent cohesion 611
d day 612
D10 10% passing 613
e void ratio 614
FEM finite element model 615
h height 616
h capillary rise 617
he elevation head 618
hp pressure head 619
ht total head 620
IN normalized pixel intensity 621
K hydraulic conductivity 622
Ksat saturated hydraulic conductivity 623
L liter 624
l length 625
m meter 626
627
P horizontal load 628
p mean stress 629
q applied stress 630
r capillary tube radius 631
S settlement 632
SEL Swelling Equilibrium Limit 633
Sr degree of saturation 634
Ts surface tension 635
ua air pressure 636
ua-uw matric suction 637
uw water pressure 638
V specific volume, e+1 639
w width 640
w gravimetric water content 641
α contact angle 642
γw unit weight of water 643
εv volumetric strain 644
∆ displacement 645
ρw density of water 646
φ’ friction angle 647
σ1, σ2, σ3 principal stresses 648
τ shear strength649
Page 17 of 37
https://mc06.manuscriptcentral.com/cgj-pubs
Canadian Geotechnical Journal
Draft
Siemens (2017) 39th Canadian Geotechnical Colloquium
REFERENCES 650
ASTM. 2003. Standard test methods for one-dimensional swell or settlement potential of cohesive soils. 651
ASTM standard D4546. American Society for Testing and Materials (ASTM), West 652
Conshoshocken, Pa. 653
Aubertin, M., Cifuentes, E., Apithy, S.A., Bussiere, B. Molson, J. and Chapuis, R.P. 2009. Analyses of 654
water diversion along inclined covers with capillary barrier effects. Canadian Geotechnical 655
Journal, 46(10): 1146-1164. 656
Azmatch, T.F., Sego, D.C., Arenson, L.U. and Biggar, K.W. 2012. Using soil freezing characteristic 657
curve to estimate the hydraulic conductivity function of partially frozen soils. Cold Regions 658
Science and Technology. 83-84: 103-109. 659
Barbour, S.L. 1998. Nineteenth Canadian Geotechnical Colloquium: The soil-water characteristic curve: 660
a historical perspective. Canadian Geotechnical Journal, 35:5 873-894. 661
Basma, A.A. and Erdil, R.T. 1992. Evaluation and control of collapsible soils. Journal of Geotechnical 662
Engineering. 118(10): 1491-1504. 663
Bathurst, R.J., Ho, A.F., and Siemens, G.A. 2007. A column apparatus for investigation of 1-D 664
unsaturated-saturated response of sand-geotextile systems. ASTM Geotechnical Testing Journal. 665
30(6): 433-441[doi: 10.1520/GTJ100954]. 666
Bathurst, R.J., Siemens, G.A. and Ho, A.F. 2009. Experimental investigation of infiltration ponding in 667
one-dimensional sand-geotextile columns. Geosynthetics International, 16(3): 158-172 [doi: 668
10.1680/gein.2009.16.3.158]. 669
Beddoe, R.A., Take, W.A. and Rowe, R.K. 2011. Water-retention behavior of geosynthetic clay liners. 670
ASCE Journal of Geotechnical & Geoenvironmental Engineering, 137(11): 1028-1038. 671
Bittelli, M., Ventura, F., Campbell, G.S., Snyder, R., Gallegati, F., and Pisa, P. 2008. Coupling of heat, 672
water vapor, and liquid water fluxes to compute evaporation in bare soils. J. Hydrol., 362: 191–673
205. 674
Blatz, J.A., Ferreira, N.J., and Graham, J. 2004. Effects of near-surface environmental conditions on 675
instability of an unsaturated soil slope. Canadian Geotechnical Journal, 41: 1111–1126. 676
Bouazza, A., Zornberg, J.G., McCartney, J.S. and Nahlawi, H. 2006. Significance of unsaturated 677
behaviour of geotextiles in earthen structures, Australian Geomechanics, 41(3): 133-142. 678
Bozkurt, M.B., Fratta, D., and Likos, W.J. 2017. Capillary forces between equally sized moving glass 679
beads: an experimental study. Canadian Geotechnical Journal. 10pp. Available at: 680
http:dx.doi.org/10.1139/cgj-2016-0213. Accessed 15 August 2017. 681
Briaud, J.L., Zhang, X., and Moon, S. 2003. Shrink test–water content method for shrink and swell 682
predictions. Journal of Geotechnical & Geoenvironmental Engineering, 129(7): 590-600. 683
Brooks, R.H., and Corey, A.T., 1964, Hydraulic properties of porous media: Hydrology Papers,. 684
Colorado State University, 24 p. 685
Page 18 of 37
https://mc06.manuscriptcentral.com/cgj-pubs
Canadian Geotechnical Journal

Draft
Siemens (2017) 39th Canadian Geotechnical Colloquium
Burdine, N.T. 1953, Relative permeability calculations from pore-size distribution data, Petr. 686
Trans., Inst. Mining Metall. Eng. 198: 71-77. 687
Bussiere, B., 2007. Colloquium 2004: Hydrogeotechnical properties of hard rock tailings from metal 688
mines and emerging geoenvironmental disposal approaches. Canadian Geotechnical Journal, 44: 689
1019–1052. 690
Cascini, L., Cuomo, S., Pastor, M. and Sorbino, G. 2010. Modeling of Rainfall-Induced Shallow 691
Landslides of the Flow-Type. J. Geotech. Geoenviron. Eng., 136(1): 85-98 692
Clemence, S. P., and Finbarr, A. O., 1981. Design considerations for collapsible soils. Journal of Soil 693
Mechanics and Foundation Engineering, GT3, 107: 305–317. 694
Costa, Y.D., Cintra, J.C., and Zornberg, J.G. 2003. Influence of matric suction on the results of plate 695
load tests performed on a lateritic soil deposit. ASTM Geotechnical Testing Journal. 26(2): 1-9. 696
Cui, S., Zhang, H. and Zhang, M. 2012. Swelling characteristics of compacted GMZ bentonite–sand 697
mixtures as a buffer/backfill material in China. Engineering Geology, 141-142: 65-73. 698
D’Arcy, H, 1856, Les fontaines publiques de la Ville de Dijon, Dalmont, Paris, Victor Dalmont. 699
Dobchuk, B., Nichol, C., Wilson, G.W., and Aubertin., M. 2013. Evaluation of a single-layer 700
desulphurized tailings cover. Canadian Geotechnical Journal, 50(7): 777-792. 701
Domaschuk, L. 1986. Is your house suffering? University of Manitoba, Department of Civil 702
Engineering, ISBN 0921267002, 18pp. 703
Fall, A., Weber, B., Pakpour, M., Lenoir, N., Shahidzadeh, J., Fiscina, C., Wagner, C., and Bonn, D. 704
2014. Sliding friction on wet and dry sand. Physical Review Letters, 112:17, 175502, 4 pp. 705
Fredlund, D.G. 1975. Engineering properties of expansive clays. In Proceedings of the Seminar on 706
Shallow Foundations on Expansive Clays, Regina, Saskatchewan, 27-28 October 1975, pp. 1-58. 707
Fredlund, D.G. 1979. Second Canadian Geotechnical Colloquium: Appropriate concepts and technology 708
for unsaturated soils. Canadian Geotechnical Journal, 16: 121-139. 709
Fredlund, D.G. 1983. Prediction of ground movements in swelling clays. In Proceedings of the 31st 710
Annual Soil Mechanics and Foundation Engineering Conference, Earle Brown Centre, 711
University of Minnesota, Minneapolis, Minnesota, 1 February 1983, pp. 1-48. 712
Fredlund, D.G., Rahardjo, H., and Fredlund, M.D. 2012. Unsaturated soil mechanics in engineering 713
practice. John Wiley & Sons, Hoboken New Jersey, 926 pp. 714
Fredlund, D.G., Stone, J., Stianson, J., and Sedgwick, A. 2011. Determination of water storage and 715
permeability functions for oil sands tailings. Proceedings Tailings and Mine Waste 2011, 716
Vancouver B.C., 6-9 November 2011, 15 pp. 717
Fredlund, D.G., Xing, A., 1994. Equations for the soil-water characteristics curve. Canadian 718
Geotechnical Journal 31(4): 521–532. 719
Page 19 of 37
https://mc06.manuscriptcentral.com/cgj-pubs
Canadian Geotechnical Journal
Draft
Siemens (2017) 39th Canadian Geotechnical Colloquium
Fredlund, D.G., Xing, A. and Huang, S. 1994. Predicting the permeability function for unsaturated soils 720
using the soil-water characteristic curve. Canadian Geotechnical Journal. 31(4): 533-546. 721
Green, W. H., and G. A, Ampt, 1911, Studies on Soil Physics, J. Agric. Sci. 4(1): 1-24. 722
Hamilton, J.J. 1963. Volume changes in undisturbed clay profiles in Western Canada. Canadian 723
Geotechnical Journal. 1(1): 27-42. 724
Houston, S., Dye, H., Zapata, C., Walsh, K., and Houston, W. 2011. Study of expansive soils and 725
residential foundations on expansive soils in Arizona. Journal of Performance of Constructed 726
Facilities, 25(1): 31-44. 727
Houston, S.L., Houston, W.N., Zapata, C.E., and Lawrence, C. 2001. Geotechnical engineering practice 728
for collapsible soils. Geotechnical and Geological Engineering. 19: 333-355. 729
Huang, M., Barbour, S.L., and Carey, S.K. 2015. The impact of reclamation cover depth on the 730
performance of reclaimed shale overburden at an oil sands mine in Northern Alberta, Canada. 731
Hydrological Processes, 29: 2840–2854. 732
Iskander, M., R. Bathurst, and M. Omidvar. 2015. Past, present, and future of transparent soils. Geotech. 733
Test. J. 38(5): 557-573. doi:10.1520/GTJ20150079. 734
Ito, M. and Azam, S. 2013. Engineering properties of a vertisolic expansive soil deposit. Engineering 735
Geology, 152(1): 10-16. 736
Iverson, R.M. 2000. Landslide triggering by rain infiltration. Water Resources Research. 36(7): 1897-737
1910. 738
Jung, J.K., O’Rourke, T.D., and Argyrou, C. 2016. Multi-directional force-displacement response of 739
underground pipe in sand. Canadian Geotechnical Journal. 53: 1763-1781. 740
Knidiri, J., Bussiere, B., Hakkou, R., Bosse, B., Maqsoud, A., and Benzaazoua, M. 2016. 741
Hydrogeological behaviour of an inclined store-and-release cover experimental cell made with 742
phosphate mine waste. Canadian Geotechnical Journal, In press and available online, [doi: 743
10.1139/cgh-2015-0530]. 744
Komine, H. and Ogata, N. 1994. Experimental study on swelling characteristics of compacted bentonite. 745
Canadian Geotechnical Journal, 31(4): 478-490. 746
Konrad, J. 1990. Sampling of Saturated and Unsaturated Sands by Freezing. Geotechnical Testing 747
Journal, 13(2): 88-96. 748
Konrad, J.-M. and Morgenstern, N.R. 1980. A mechanistic theory of ice lens formation in fine-grained 749
soils. Canadian Geotechnical Journal. 17: 473-486. 750
Lehman, P., Assouline, S., and Or, D. 2008. Characteristic lengths affecting evaporative drying of 751
porous media. Physical Review. 77: 056309, 16 pp. 752
Lenhard, R.J., and J.C. Parker. 1987. Measurement and prediction of saturation-pressure relationships in 753
three-phase porous media systems. J. Contam. Hydrol. 1: 407-424. 754
Page 20 of 37
https://mc06.manuscriptcentral.com/cgj-pubs
Canadian Geotechnical Journal
Draft
Siemens (2017) 39th Canadian Geotechnical Colloquium
Leong, E.C. and Rahardjo, H. 1997. Permeability functions for unsaturated soils. Journal of 755
Geotechnical and Geoenvironmental Engineering, 123(12): 1118-1126. 756
Lim, B.F. 2014. Advanced testing and a numerical tool for swell equilibrium limit of expansive soils. 757
Ph.D. thesis, Department of Civil Engineering, Royal Military College of Canada, Kingston, ON. 758
Lim, B.F. and Siemens, G.A. 2013. An unconfined swelling test for clayey soils that incorporates 759
digital image correlation. ASTM Geotechnical Testing Journal. 36(6): 823-833 760
[doi: 10.1520/GTJ20120220]. 761
Lim, B.F. and Siemens, G.A. 2016. A unifying framework for modeling swelling soil behaviour. 762
Canadian Geotechnical Journal 53(9): 1495-1509 [doi: 10.1139/cgj-2015-0049]. 763
Lu, N. and Likos, W.J. 2004. Unsaturated soil mechanics. Wiley, 584 pages 764
Machmer, B. 2012. Understanding the behavior of a pile foundation in unsaturated soils subjected to 765
lateral loading. Masters of Science Thesis, Civil Engineering, Clemson University, 184 pp. 766
Maxwell, J.C., Strutt, J.W. 1911. Capillary Action. Encyclopædia Britannica. 5 (11th ed.) 256–275 767
(https://en.wikipedia.org/wiki/Young–Laplace_equation. Accessed 15 August 2017). 768
Mualem, Y. (1976). A new model for predicting the hydraulic conductivity of unsaturated porous media, 769
Water Resources Research, 12(3): 513–522. 770
Newberry, P.E. 1895. El Bersheh: The Tomb of Tehuti-Hetep. Egypt Exploration Fund, London, Vol. 1. 771
O’Kane, M., Wilson, G.W., and Barbour, S.L. 1998. Instrumentation and monitoring of an engineered 772
soil cover system for mine waste rock. Canadian Geotechnical Journal, 35: 828-846. 773
Or, D., Lehmann, P., Shahraeeni, E., and Shokrim, N. 2013. Advances in Soil Evaporation Physics—A 774
Review. Vadose Zone Journal. 12(4): 16 pp. 775
Peters, S.B., Siemens, G., Take, W.A. 2011. Characterization of transparent soil for unsaturated 776
applications. ASTM Geotechnical Testing Journal Special Issue on Innovations in Characterizing 777
the Mechanical and Hydrological Properties of Unsaturated Soil, 34(5): 445-456. 778
[doi: 10.1520/GTJ103580]. 779
Powell, J.S., Siemens, G.A., Take, W.A. and Remenda, V.H. 2013. Characterizing the swell potential 780
of Bearpaw Shale. Engineering Geology. 158: 89-97 [doi: 10.1016/j.enggeo.2013.03.006]. 781
Prakash, K. and Sridharan, A. 2004. Free swell ratio and clay mineralogy of fine-grained soils. 782
Geotechnical Testing Journal, 27(2): 1-6. 783
Puppala, A.J., Manosuthikij, T. and Chittoori, B.C.S. 2014. Swell and shrinkage strain prediction models 784
for expansive clays. Engineering Geology, 168: 1-8. 785
Qi, S., Simms, P., Vanapalli, S. and Soleimani, S. 2017. Piecewise-Linear Formulation of Coupled 786
Large-Strain Consolidation and Unsaturated Flow. II: Testing and Performance. J. Geotech. 787
Geoenviron. Eng., 143(7): 04017019. 788
Page 21 of 37
https://mc06.manuscriptcentral.com/cgj-pubs
Canadian Geotechnical Journal

Draft
Siemens (2017) 39th Canadian Geotechnical Colloquium
Rahimi, A., Rahardjo, H., and Leong, E.-C. 2010. Effect of hydraulic properties of soil on rainfall-789
induced slope failure. Engineering Geology 114: 135–143. 790
Robinson, J.D., Vahedifard, F., and AghaKouchak, A. 2016. Rainfall-triggered slope instabilities under 791
a changing climate: comparative study using historical and projected precipitation extremes. Can. 792
Geotech. J. in press, doi: 10.1139/cgj-2015-0602. 793
Rogers, C.D.F., Dijkstra, T.A., Smalley, I.J. 1994. Hydroconsolidation and subsidence of loess: Studies 794
from China, Russia, North America and Europe: In memory of Jan Sajgalik. Engineering 795
Geology. 37(2): 83-113 796
Romero, E. and Simms, P. 2008. Microstructure Investigation in Unsaturated Soils: A Review with 797
Special Attention to Contribution of Mercury Intrusion Porosimetry and Environmental Scanning 798
Electron Microscopy. Geotechnical and Geological Engineering. 26(6): 705-727. 799
Saleh-Mbemba, F. Aubertin, M., and Mbonimpa, M. and Li, L. 2016. Experimental characterization of 800
the shrinkage and water retention behaviour of tailings from hard rock mines. Geotechnical and 801
Geological Engineering, 34(1): 251-266. doi: 10.1007/s10706-015-9942-0 802
Siekmeier, J. 2007. Implementation of unsaturated soil mechanics during pavement construction QA. 803
Geo-Strata —Geo Institute of ASCE, 2011, 15(1): pg. 36,38,40,43. 804
Siemens, G.A. 2007. Replacement of a 30-year-old shallow foundation on swelling soil: a case study. 805
2nd Canadian Young Geotechnical Engineers and Geoscientists Conference (cYGEGC), 806
Ganonoque, Ontario, 25-27 October 2007, CD Proceedings. 807
Siemens, G.A. and Bathurst, R.J. 2010. Numerical parametric investigation of infiltration in one-808
dimensional sand-geotextile columns. Geotextiles and Geomembranes. 28: 460-476 809
[doi:10.1016/j.geotexmem.20 09.12.0 09]. 810
Siemens, G.A. and Blatz, J.A. 2007. A triaxial apparatus for applying liquid infiltration with controlled 811
boundary conditions and internal suction measurement. Journal of Geotechnical and 812
Geoenvironmental Engineering. 133(6): 748-752 [doi: 10.1061/(ASCE)1090-0241]. 813
Siemens, G.A. and Blatz, J.A. 2008. Numerical modelling of shallow foundations on swelling clay soil 814
using the swelling equilibrium limit. 1st European Conference on Unsaturated Soils (E-815
UNSAT), Durham, United Kingdom, 2-5 July 2008, 855-860. 816
Siemens, G.A. and Blatz, J.A. 2009. Evaluation of the influence of boundary confinement on the 817
behaviour of unsaturated swelling clay soils. Canadian Geotechnical Journal. 46(3): 339-356 818
[doi: 10.1139/T08-125]. 819
Siemens, G.A., Peters, S.B. and Take, W.A. 2013. Comparison of confined and unconfined infiltration 820
in transparent porous media. Water Resources Research. 49: 851-863 [doi: 821
10.1002/wrcr.20101]. 822
Siemens, G.A., Take, W.A. and Peters, S.B. 2014. Physical and numerical modeling of infiltration 823
including consideration of the pore air phase. Canadian Geotechnical Journal – Thematic Issue 824
on Unsaturated Soils. 51: 1475–1487 [doi: 10.1139/cgj-2013-0447]. 825
Page 22 of 37
https://mc06.manuscriptcentral.com/cgj-pubs
Canadian Geotechnical Journal

Draft
Siemens (2017) 39th Canadian Geotechnical Colloquium
Siemens, G., Take, W.A., Rowe, R.K.R. and Brachman, R.W.I. 2012. Numerical investigation of 826
transient hydration of unsaturated geosynthetic clay liners. Geosynthetics International, 19(3): 827
232-251 [doi: 10.1680/gein.12.00011]. 828
Sills, L-A.S., Mumford, K.G., and Siemens, G.A. 2016. Quantification of fluid saturations in transparent 829
porous media. In press, Vadose Zone Journal, (October 2016, #VZJ-2016-06-0052-ORA). 830
Simms, P. 2017. 2013 Colloquium of the Canadian Geotechnical Society: Geotechnical and 831
geoenvironmental behaviour of high-density tailings. Canadian Geotechnical Journal, 54: 455–832
468. 833
Terzaghi, K. 1943. Theoretical soil mechanics. John Wiley & Sons. 528 pp. 834
Tohari, A., Nishigaki, M., and Komatsu, M. 2007. Laboratory Rainfall-Induced Slope Failure with 835
Moisture Content Measurement. J. Geotech. Geoenviron. Eng., 133(5): 575-587 836
van Genuchten, M.Th., 1980, A Closed-Form Equation for Predicting the Hydraulic Conductivity of 837
Unsaturated Soils, Soil Science Society of America Journal, 44: 892-898 838
Vanapalli, S.K., Fredlund, D.G., Pufahl, D.E. and Clifton, A.W. 1996. Model for the prediction of shear 839
strength with respect to soil suction. Canadian Geotechnical Journal, 33: 379-392. 840
Vanapalli, S.K. and Lu, L. 2012. A state-of-the art review of 1-D heave prediction methods for 841
expansive soils. International Journal of Geotechnical Engineering, 6: 15-41. 842
Vanapalli, S.K. and Mohamed, F.M.O. 2007. Bearing capacity of model footings in unsaturated soils. 843
Experimental Unsaturated Soil Mechanics, Ed. T. Schanz. 112: 483-493. 844
Wijaya, M., Leong, E.C. and Rahardjo, H. 2015. Effect of shrinkage on air-entry value of soils. Soils 845
and Foundations. 55(1): 166-180. 846
Wilson, G.W., Fredlund, D.G. and Barbour, S.L. 1994. Coupled soil-atmosphere modelling for soil 847
evaporation. Canadian Geotechnical Journal 31: 151-161. 848
Zhang, L.L., Zhang, J., Zhang, L.M., and Tang, W.H. 2011. Stability analysis of rainfall-induced slope 849
failure: a review. Proceedings of the Institution of Civil Engineers Geotechnical Engineering 164 850
Issue GE5, 299–316. 851
Page 23 of 37
https://mc06.manuscriptcentral.com/cgj-pubs
Canadian Geotechnical Journal

Draft
Precipitation
Potential slip surface
Infiltration
Water content (%)
Dry
den
sity
(M
g/m
3)
Sr=100%
Protectedarea
Precipitation
Evaporation
Deflected infiltration
a) Foundations, tunnels, and excavations b) Infiltration and landslide triggering
c) Compacted materials for construction d) Cover systems
e) Sampling, pile and plate load tests
Descending freezing front
Water drawn upto freezing front
f) Cryogenic suction and contaminant migration
Figure 1. Geotechnical applications that include an unsaturated component: a) Foundations, tunnels and excavations, b) Infiltration and landslide triggering, c) Construction materials for construction, d) Cover systems, e) Sampling, pile and plate load tests, and f) Cryogenic suction and contaminant migration.
Road
Reinforced wall
Page 24 of 37
https://mc06.manuscriptcentral.com/cgj-pubs
Canadian Geotechnical Journal

DraftTs
Ts
a)
b)
c)
Figure 2. Capillarity: a) Capillarity in zero gravity (image captured from Canada Space Agency video https://www.youtube.com/watch?v=o8TssbmY-GM accessed 29 November 2016), b) Capillary rise in tubes, and b) Contact angle on flat and sloped surfaces.
Page 25 of 37
https://mc06.manuscriptcentral.com/cgj-pubs
Canadian Geotechnical Journal
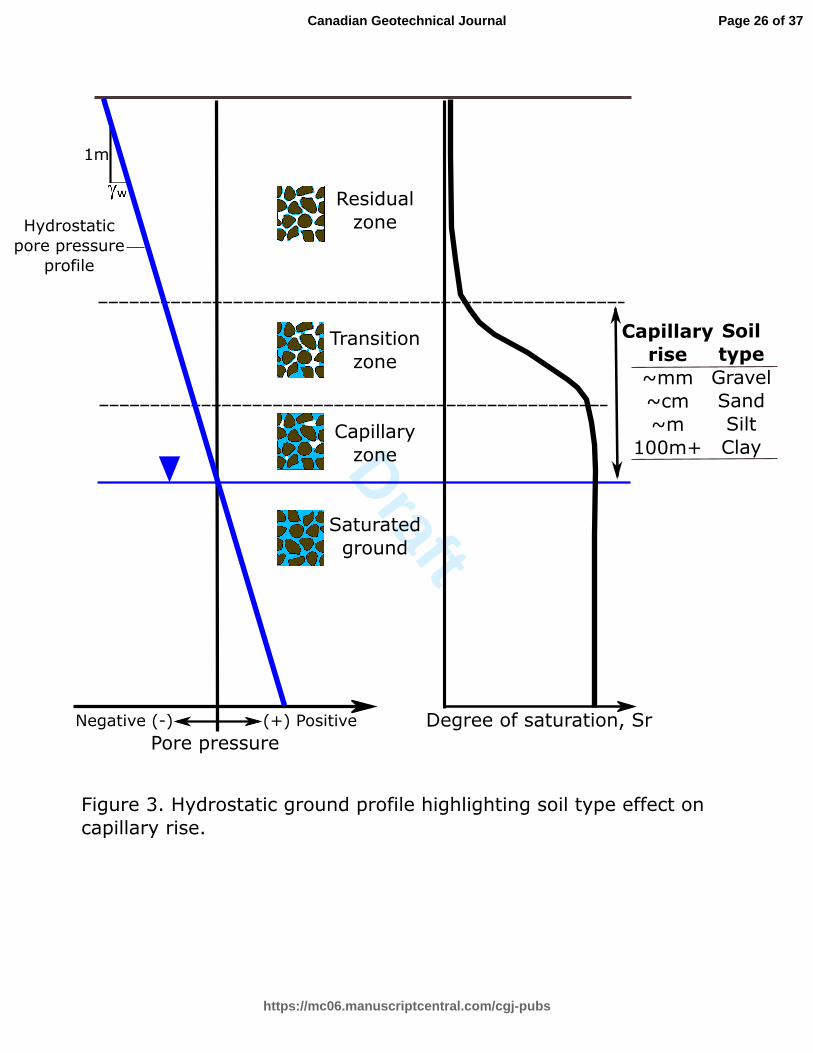
Draft
Pore pressureNegative (-) (+) Positive Degree of saturation, Sr
Residual zone
Transition zone
Capillary zone
Saturated ground
Soiltype
GravelSand SiltClay
Capillary rise~mm~cm ~m
100m+
Figure 3. Hydrostatic ground profile highlighting soil type effect on capillary rise.
1m
Hydrostaticpore pressure
profile
Page 26 of 37
https://mc06.manuscriptcentral.com/cgj-pubs
Canadian Geotechnical Journal

DraftSuction
Deg
ree
of s
atura
tion
, Sr
(%)
Ksat
Residualwater
content
Suction
Hyd
raulic
con
duct
ivity
>104
100%
Air entryvalue, AEV
a)
b)
Figure 4. Typical a) Storage function and b) unsaturated hydraulic conductivity function.
Capillaryzone
Transitionzone
Residualzone
Soil-typedependent
Page 27 of 37
https://mc06.manuscriptcentral.com/cgj-pubs
Canadian Geotechnical Journal

Draft0 10 20 30 40
0
1
2
3
4
5
6
Dep
th (
m)
Gravimetric water content, w (%)
0.1 1 10 1000
10
20
30
40
Gra
vim
etric
wat
er c
onte
nt, w
(%
)
Matric suction, ua-uw (kPa)
a)
b)
Pressure head, hp (m)-0.01 -0.1 -1 -10
Flow directionup or down?
-10-8 -6 -4 -2 0 2 4Total head, ht (m)
c)
5
4
3
2
1
0
-1
Ele
vatio
n he
ad, h
e (m
)
Datum
Upw
ard flow
Dow
nw
ard flo
w
Figure 5. Vertical flow illustrative example: a) Two gravimetric water content profiles, b) Storage functionwith gravimetric water content values added to interpret suction, and c) Total head profiles with flow direction indicated.
ht = he + hphp =-(ua-uw)
22
22
Page 28 of 37
https://mc06.manuscriptcentral.com/cgj-pubs
Canadian Geotechnical Journal

DraftK=Ksat
K=Ksat
K=Ksat
K=f(Sr)
K=0
10 86 4
2
108 6
42
K=Ksat
SaturatedUnsaturatedTotal
HydcondKsat
f(Sr)
FlowL/d/m14213155
SaturatedUnsaturatedTotal
HydcondKsat
Ksat
FlowL/d/m14186227
SaturatedUnsaturatedTotal
HydcondKsat
0
FlowL/d/m1440144
a)
b)
c)
Figure 6. Steady-state flow comparison for: a) traditional flownet, b) FEMassuming saturated conductivity in unsaturated zone, and c) FEM with assumed unsaturated conductivity function.
%1000
%6238
%928
No flow
Page 29 of 37
https://mc06.manuscriptcentral.com/cgj-pubs
Canadian Geotechnical Journal

Draft
a)
b)
Sr=1.0
Sr=0.9
Sr=0.7
Sr=0.6
Sr=00 0.1 0.2 0.3 0.4 0.5 0.6 0.7 0.8 0.9 1
0
0.1
0.2
0.3
0.4
0.5
0.6
0.7
0.8
0.9
1
Sat
ura
tion,
Sr
(−)
Normalized intensity, IN (−)
Predicted
Peterset al.2011
Sillset al.2016
CoarseFine
Coarse and Fine
c)
Figure 7. Transparent soil for unsaturated applications showing: a) Series of photos from an infiltration test in a layered system (Siemens et al. 2014), b) Calibration curve for image analysis (after Sills et al. 2016, and c) Grain-size distributions for coarse and fine transparent soils (after Siemens et al. 2014).
Coarse FineD10 (mm) 0.75 0.13
Page 30 of 37
https://mc06.manuscriptcentral.com/cgj-pubs
Canadian Geotechnical Journal
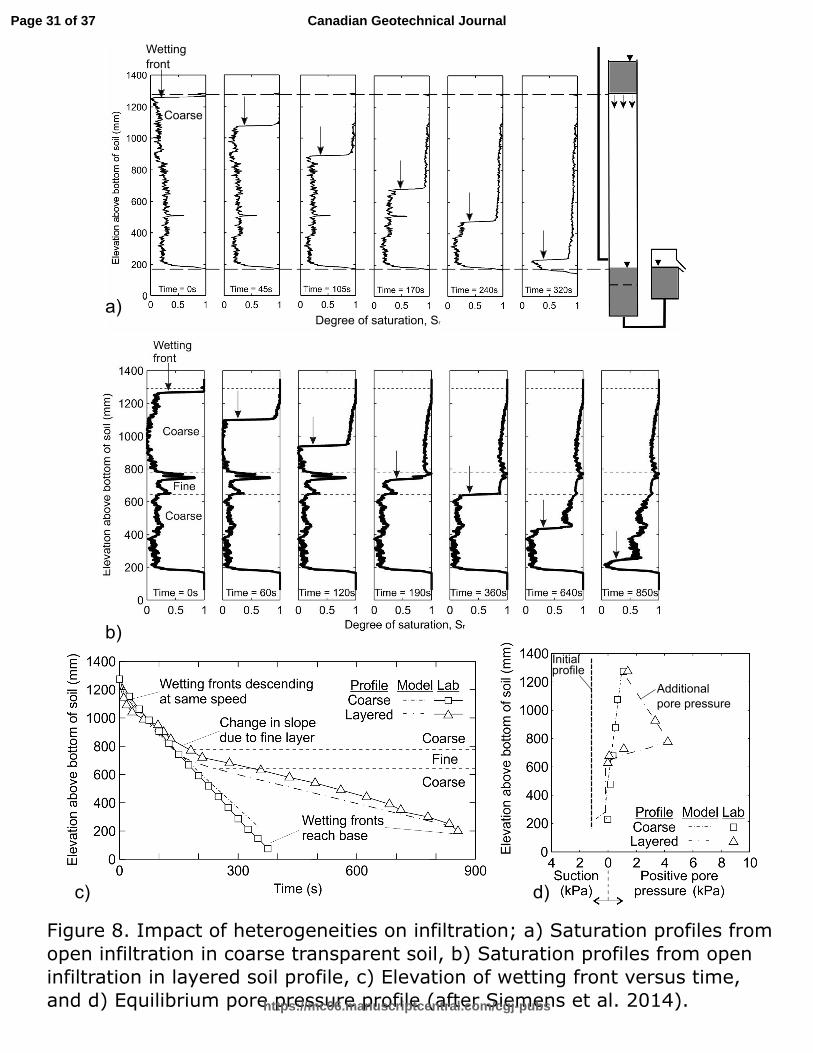
Draft
Wettingfront
Degree of saturation, Sr
Initialprofile
Coarse
a)
b)
c) d)
Figure 8. Impact of heterogeneities on infiltration; a) Saturation profiles from open infiltration in coarse transparent soil, b) Saturation profiles from open infiltration in layered soil profile, c) Elevation of wetting front versus time, and d) Equilibrium pore pressure profile (after Siemens et al. 2014).
Additional pore pressure
Page 31 of 37
https://mc06.manuscriptcentral.com/cgj-pubs
Canadian Geotechnical Journal
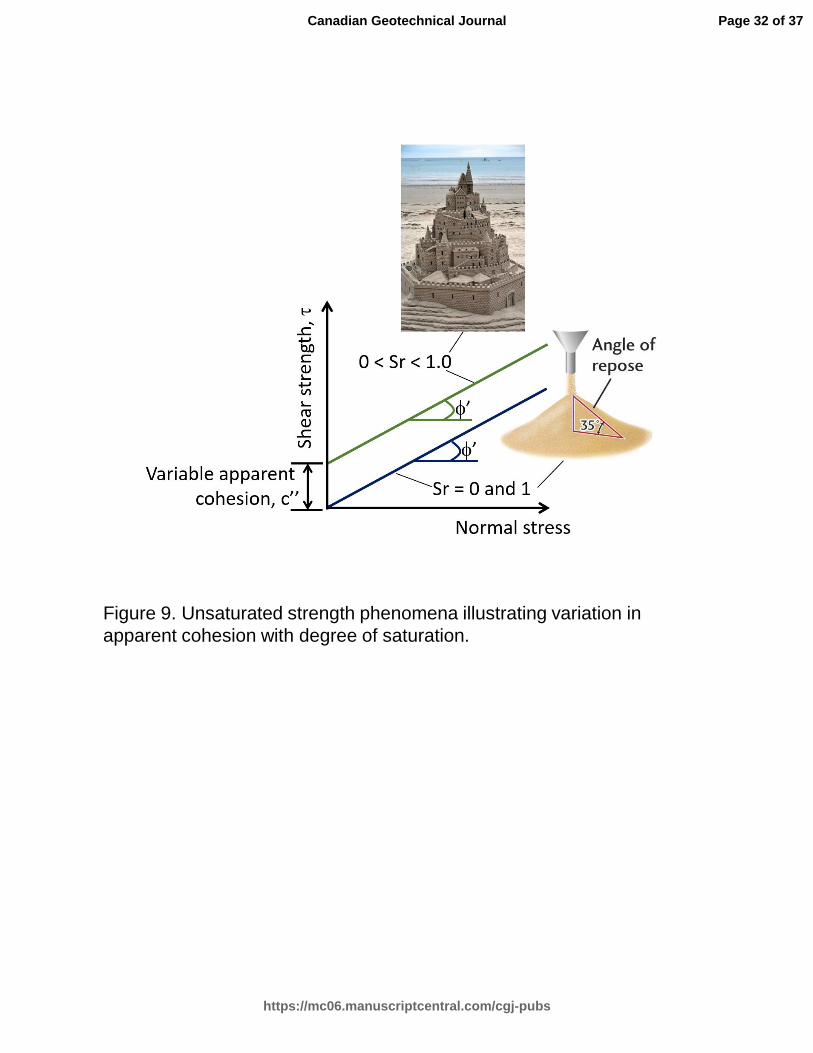
Draft
Figure 9. Unsaturated strength phenomena illustrating variation in
apparent cohesion with degree of saturation.
Page 32 of 37
https://mc06.manuscriptcentral.com/cgj-pubs
Canadian Geotechnical Journal

Draft
0 5 10 15 200
2
4
6
Load
, P (
N)
Displacement, Δ (mm)
VWC
7.4%Dry
1.5%
5%
Sand with variablemoisture content
P
Δ
Mass
Real-time moisture control
30% reduction
in load
P
a)
b)
Figure 10. a) Wall painting from tomb of Djehutihotep in southeastern Egypt (after Newberry 1895), and b) Interface friction experiments plotted as load versus displacement.
Page 33 of 37
https://mc06.manuscriptcentral.com/cgj-pubs
Canadian Geotechnical Journal
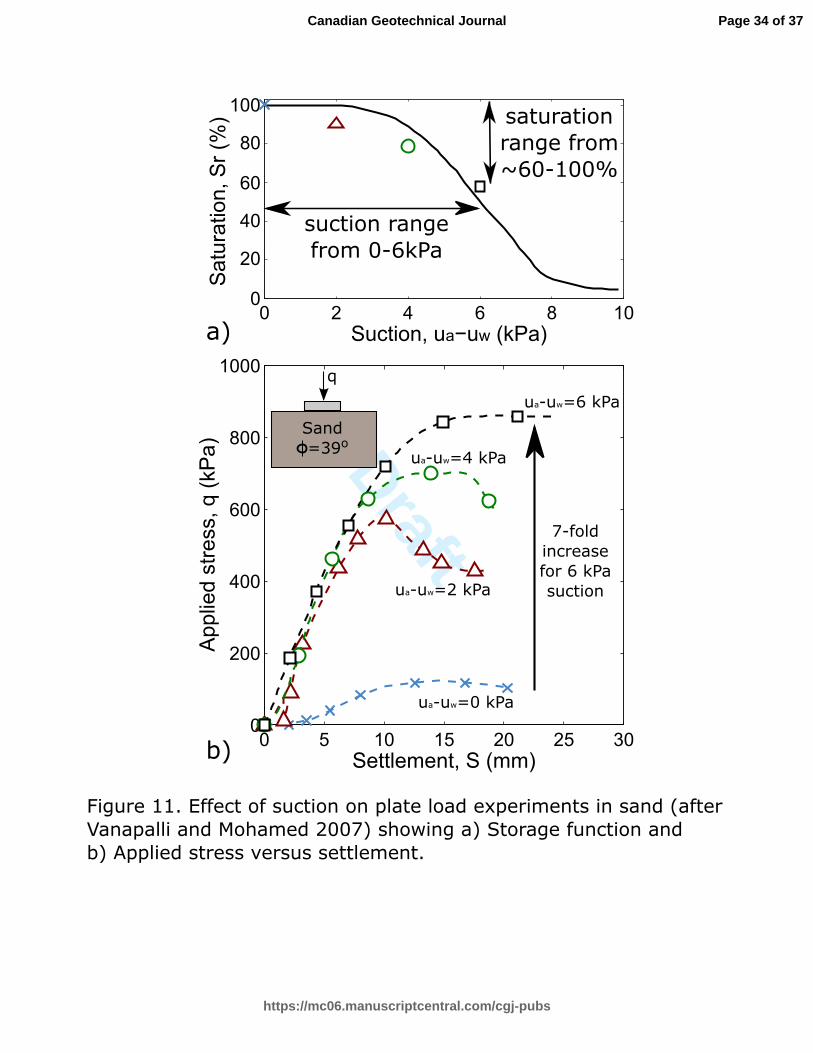
Draft0 2 4 6 8 10
0
20
40
60
80
100
Sat
ura
tion,
Sr
(%)
Suction, ua−uw (kPa)
0 5 10 15 20 25 300
200
400
600
800
1000
App
lied
stre
ss, q
(kP
a)
Settlement, S (mm)
q
Sand =39o
ua-uw=6 kPa
ua-uw=4 kPa
ua-uw=2 kPa
ua-uw=0 kPa
a)
b)
Figure 11. Effect of suction on plate load experiments in sand (afterVanapalli and Mohamed 2007) showing a) Storage function and b) Applied stress versus settlement.
7-foldincreasefor 6 kPasuction
suction range from 0-6kPa
saturationrange from ~60-100%
Page 34 of 37
https://mc06.manuscriptcentral.com/cgj-pubs
Canadian Geotechnical Journal

Draft
Shrinkage due to
increase inmatric suction
Swelling due to decrease in matric suction
Figure 12. Unsaturated deformation phenomena including a) Combined effects of heave and shrinkage on a residential structure (after Domaschuk 1986), b) Removal of basement walls from a residential structure affected byexpansive soils, c) Constitutive model for volumetric strains due to changes in suction and net normal stress, d) Shrinkage experiment, and e) Free swell experiment (after Lim and Siemens 2013).
a)
b)
c)
d)
e)
Page 35 of 37
https://mc06.manuscriptcentral.com/cgj-pubs
Canadian Geotechnical Journal

DraftMean stress, p (kPa)
0 500 1000 1500 2000
Spe
cific
vol
ume,
V
1.4
1.6
1.8
2.0
2.2
2.4
b) Bentonite-sand-buffer
Constant mean stress (CMS)
Constant stiffness (CS)
Constant volume (CV)
Figure 13. Swelling Equilibrium Limit results: a) Retaining wall constructed inexpansive soil illustrating swelling conditions, b) Swelling paths and experiments for bentonite-sand-buffer, and SEL summary plots for c) Bentonite-sand-buffer, d) Bearpaw clay, and e) Lake Agassiz clay (after Lim and Siemens 2016).
a) Retaining wall constructed in expansive soil
Unconfined swelling
SEL
Page 36 of 37
https://mc06.manuscriptcentral.com/cgj-pubs
Canadian Geotechnical Journal

Draft
Page 37 of 37
https://mc06.manuscriptcentral.com/cgj-pubs
Canadian Geotechnical Journal