draft v7.4 thirty meter telescope detailed science case
TRANSCRIPT

DRAFT V7.4
Thirty Meter Telescope Detailed Science Case Document
22 Feb 2005 PURPOSE OF THIS DOCUMENT............................................................................................................ 3 1 HIGH-PRIORITY SCIENCE DRIVERS FOR OBSERVATORY REQUIREMENTS .............. 3
1.1 THE EARLY EVOLUTION OF THE UNIVERSE.................................................................................. 4 1.1.1 Cosmology and the Formation of Structure............................................................................ 4 1.1.2 The “Dark Ages” and Re-Ionization (requires redo: base on Carlberg doc)........................... 5 1.1.3 The Epoch of Galaxy Formation ............................................................................................ 6
1.2 EXTRA-SOLAR PLANET STUDIES.................................................................................................. 7 1.2.1 Physical Conditions in Planet-formation Regions .................................................................. 7 1.2.2 Doppler Reflex Motion Studies of Terrestrial Planets............................................................ 8 1.2.3 Direct Imaging of Extra-solar Planets..................................................................................... 9 1.2.4 Spectroscopic Characterizations of Extra Solar Planets ......................................................... 9
1.3 RESOLVED STELLAR POPULATIONS IN THE GALAXY NEARBY GALAXIES .................................. 10 1.4 FUNDAMENTAL PHYSICS............................................................................................................ 12
1.4.1 Dark Matter .......................................................................................................................... 12 1.4.2 Dark Energy.......................................................................................................................... 12 1.4.3 Fundamental theory .............................................................................................................. 13 1.4.4 Fundamental constants.......................................................................................................... 14
1.5 BLACK HOLES............................................................................................................................ 15 1.5.1 Precision Astrometry in the Galactic Center ........................................................................ 15 1.5.2 Galactic Nuclei from z=0 to z=6 (bolte will pull from below) ............................................ 15
1.6 SOLAR SYSTEM STUDIES............................................................................................................ 15 1.6.1 Planets and satellites ............................................................................................................. 15 1.6.2 The outer Solar System......................................................................................................... 16
2 SCIENCE PROGRAMS ORGANIZED BY INSTRUMENT CONCEPTS ................................ 18 2.1 IRIS: INFRARED IMAGING SPECTROMETER (LOCAL STELLAR POPS: WHERE?)............................ 18
2.1.1 Overview of capability and expected performance............................................................... 18 2.1.2 Overview of anticipated science areas.................................................................................. 18 2.1.3 Specific Science Cases: Detailed Discussions ...................................................................... 19
2.1.3.1 Studies of Galaxies at High Redshift (C. Steidel, CIT).............................................................. 19 2.1.3.2 The Initial Mass Function in Young Clusters............................................................................. 21
2.1.3.2.1 IRIS Imaging of Rich, Dense Clusters. ................................................................................. 23 2.1.3.2.2 IRIS IFU Spectroscopy of Rich, Dense Clusters. ................................................................. 25
2.1.3.3 The Galactic Center (A. Ghez, UCLA)...................................................................................... 26 2.1.3.4 Supermassive Black Holes in other Galaxies (L.Ferrarese, NRC/HIA/DAO) ........................... 29
2.1.3.4.1 Resolved Dynamical Studies in the Local Universe. ............................................................ 31 2.1.3.4.2 SBH Beyond the Local Neighborhood. ................................................................................ 32
2.2 IRMOS: INFRARED MULTIOBJECT SPECTROMETER (ABRAHAM).............................................. 38 2.2.1 Overview of capability and expected performance............................................................... 38 2.2.2 Overview of anticipated science areas.................................................................................. 38 2.2.3 Specific science cases: detailed discussions ......................................................................... 39
2.2.3.1 Galaxy formation at 1<z<2.5 ..................................................................................................... 39 2.2.3.2 Studies of extremely high redshift galaxies................................................................................ 42
2.3 WFOS: WIDE FIELD OPTICAL SPECTROMETER.......................................................................... 44 2.3.1 Overview of capability, expected performance and science areas........................................ 44 2.3.2 Specific science cases ........................................................................................................... 46
Page 1 of 85 - 1 - Created on 2/22/2005 4:21 PM

2.3.2.1 Baryonic Structure in the High Redshift Universe ..................................................................... 46 2.3.2.2 Spectroscopy of z>5 Galaxies, AGN, Gamma Ray Burst Hosts ................................................ 50 2.3.2.3 Elliptical Galaxy Dynamics with WFOS (P. Cote, NRC/HIA/DAO) ........................................ 52
2.4 MIRES: MID-INFRARED ECHELLE SPECTROMETER................................................................... 56 2.4.1 Overview of capability and expected performance............................................................... 56 2.4.2 Overview of anticipated science areas.................................................................................. 56 2.4.3 Specific science cases ........................................................................................................... 56
2.4.3.1 Dissipation timescales for gas in terrestrial and giant planet regions of planet-forming disks. .. 56 2.4.3.2 Identification of forming planets during the disk accretion phase.............................................. 60 2.4.3.3 The structure and kinematics of infalling envelopes .................................................................. 61
2.4.4 Trades in the Mid-IR ............................................................................................................ 65 2.5 PFI: PLANET FORMATION INSTRUMENT SCIENCE CASE SUMMARY ........................................... 66
2.5.1 Overview of capability and expected performance............................................................... 66 2.5.2 Overview of anticipated science areas.................................................................................. 66 2.5.3 Detailed Science Case (B. Macintosh, LLNL; J. Graham, UC Berkeley) ............................ 66 2.5.4 ExAO system parameters ..................................................................................................... 67 2.5.5 Planet detection in 2014........................................................................................................ 68
2.5.5.1 Radial velocity surveys .............................................................................................................. 68 2.5.5.2 Astrometry ................................................................................................................................. 68 2.5.5.3 Direct interferometric detection ................................................................................................. 68 2.5.5.4 Direct detection via coronagraphic spacecraft............................................................................ 69 2.5.5.5 8-10m telescope ExAO .............................................................................................................. 69 2.5.5.6 ALMA........................................................................................................................................ 69
2.5.6 Comparison between different methods ............................................................................... 69 2.5.7 Planet formation imager ....................................................................................................... 71
2.6 NIRES: NEAR-INFRARED ECHELLE SPECTROMETER (NEEDS WORK!) ....................................... 74 2.6.1 Overview of capability and expected performance............................................................... 74 2.6.2 Overview of anticipated science areas.................................................................................. 74 2.6.3 Specific science cases: detailed discussion........................................................................... 74
2.6.3.1 Detailed abundance studies of Local Group stars. ..................................................................... 74 2.6.3.2 The intergalactic medium beyond z=7 ....................................................................................... 74
2.7 HROS: HIGH-RESOLUTION OPTICAL SPECTROMETER ............................................................... 75 2.7.1 Overview of capability and expected performance............................................................... 75 2.7.2 Specific science cases: detailed discussion........................................................................... 76
2.7.2.1 Stellar Abundances in the Local Group ..................................................................................... 76 2.7.2.1.1 Main-sequence stars in globular clusters: ............................................................................. 77 2.7.2.1.2 In-situ abundance studies in the Galactic Halo ..................................................................... 78 2.7.2.1.3 Detailed abundance measurements for significant samples of stars in Local Group Dwarfs 78 2.7.2.1.4 Precision Radial Velocities: Planets around K and M dwarfs............................................... 79 2.7.2.1.5 IGM abundances and kinematics to z=6.5 ............................................................................ 80 2.7.2.1.6 Variation of the Fine Structure Constant .............................................................................. 80
2.8 WIRC: WIDE-FIELD INFRARED CAMERA................................................................................... 81 2.8.1 Overview of capability and expected performance............................................................... 81 2.8.2 Overview of anticipated science areas.................................................................................. 81 2.8.3 Specific Science Cases ......................................................................................................... 81
2.8.3.1 Stellar Populations in the Local Universe .................................................................................. 81 2.8.3.1.1 Local Universe Galaxy Sample ............................................................................................ 82 2.8.3.1.2 Resolved Stellar Populations: Photometry............................................................................ 82 2.8.3.1.3 Simulations: M32.................................................................................................................. 84 2.8.3.1.4 Simulations: NGC 3379........................................................................................................ 84
2.8.3.2 The Galactic Center ................................................................................................................... 84 2.8.4 Additional requirements on the architecture of an MCAO imager used for astrometry ....... 84
Page 2 of 85 - 2 - Created on 2/22/2005 4:21 PM

Purpose of this Document The purpose of this document is to gather in one place the studies that (1) demonstrate the scientific capabilities of the TMT and (2) quantitatively evaluate the impact of decisions about the TMT site, AO systems, instruments and telescope configuration on TMT science capability. The document is organized into two sections. Section 1 contains high level descriptions of some of the “flagship” areas in which we anticipate TMT will have a powerful and unique role in addressing the most important questions of the coming decades in astronomy and astrophysics. Section 2 is organized by the instruments defined in version 15 of the TMT Science-driven Requirements Document. In Section 2, the level of detail is significantly deeper than in Section 1 and a much broader range of topics is discussed. Included in this section are merit functions for some capabilities to assist in trade studies. It is anticipated that Section 2 will be changed with time as additional science case studies are completed and perhaps in response to changes in the baseline capabilities of the Observatory. In Section 2 there are bulleted, brief descriptions of areas for which detailed studies are underway. When the detailed version is completed, the short placeholders will be replaced.
1 High-Priority Science Drivers for Observatory Requirements
A TMT will be an extraordinarily powerful tool across the broad landscape of astronomical research. It has historically been the case that the most important discoveries arising from order-of-magnitude increases in astronomy facilities were not anticipated during the planning phases of the facilities. Nevertheless, consideration of what capabilities are required to advance the state-of-the-art in areas anticipated to be important at the dawn of the TMT era can be used to guide the design of the Observatory. In the sections that follow we have concentrated on a subset of areas for which the TMT (1) will provide `breakthrough’ capabilities, (2) which are particularly demanding in terms of Observatory requirements and (3) which have been judged to represent among the most exciting and important of the questions to be addressed in astronomy in the coming decades. The new capabilities of the TMT can be viewed in a general sense as well. For seeing-limited observations the image quality is generally set by the site rather than the size of the telescope, and the benefits of TMT are its factor of nine increase in collecting area, allowing either 9x faster observations of point like objects, or observations of fainter objects. When the TMT is used to make diffraction-limited images, the increases are much more dramatic: observing speed of point-like objects increases as D4 opening up qualitatively new opportunities. Also, as the angular resolution increases, the ability to understand morphology of complex objects dramatically increases. When observations
Page 3 of 85 - 3 - Created on 2/22/2005 4:21 PM

are limited by crowding, the improved angular resolution can greatly reduce source confusion.
1.1 The Early Evolution of the Universe There are a number of forefront research topics in the area of early evolution of the Universe for which TMT will have an enormous impact. Among the most important contributions will be direct observations of the development of large-scale structure, the mass assembly of galaxies, and the tomographic reconstruction of the otherwise “invisible” intergalactic medium. The necessary observations are a combination of wide-field faint object spectroscopy, powerful integral-field spectroscopy at the diffraction-limit of the telescope to measure small-scale kinematics, chemistry, and morphology, and high dispersion spectroscopy of high-surface density background sources that will probe the primary reservoir of gas available for galaxy and star formation before it has been incorporated into galaxies. The science ranges from the structure of the dark matter distribution to environmental effects on the assembly and evolution of galactic systems, to the chemistry of early galaxies and the production and dispersal of the heavy elements that would eventually form stars capable of harboring planetary systems. TMT provides the first real opportunity to observe simultaneously all of the baryons, both diffuse and “collapsed” into galaxies, and the complex physical processes connecting them, during the most eventful period of time in the Universe’s history.
1.1.1 Cosmology and the Formation of Structure Within the last few years, we have witnessed a revolution in cosmology with the phenomenal success of CMB experiments, the apparently inescapable conclusion that the cosmic expansion is accelerating (with its implications for “dark energy”), and a seeming convergence of the values of the Hubble constant, the total matter density, and the total baryon density. Most astronomers would agree at this point that we live in a universe that is reasonably well described by so-called “Λ-CDM”, in which structure grows hierarchically via gravitational instability in a manner casually referred to as “bottom-up”. The number of unanswered questions, however, is vast, even though the questions have become much more focused by recent progress. We do not understand the nature of the dark matter that forms the backbone of this hierarchical structure formation, and we do not understand the complexities of the formation of the observable universe that results from the complex physics of baryons within these halos of dark matter. TMT will provide a revolution in the ability to observe baryonic process within halos of dark matter, to measure matter distributions on small and large scales, and, perhaps most importantly, to connect the theoretical underpinning of structure formation to its observable consequences: the formation of galaxies, their large scale distribution, and the dependence of the processes on environment on both large and small physical scales.
Page 4 of 85 - 4 - Created on 2/22/2005 4:21 PM

Of course, TMT will not be working on these problems alone in an era when ALMA, JWST, and other future space and ground facilities operating at wavelengths from the X-
ray to radio wavelengths will also be concerned with such fundamental questions. However, the optical and near-IR spectroscopic capabilities provided by TMT and its proposed suite of instruments will be unique in their sensitivity to a huge dynamic range in cosmic matter density during the z=1.6-7 era, tracing baryonic structure from regions that have lower than the mean cosmic matter density to the highest density regions hosting the formation of super-massive black holes in the centers of giant galaxies. TMT will bring high-quality spectra of “typical” galaxies at these lookback times into reach for the first time, and will use these same spectra to observe the physics of baryons in the intergalactic medium with high fidelity and in three
dimensions. The IGM provides a more faithful representation of the matter density than observable galaxies, and it provides a natural barometer for processes that are currently least well-understood: radiative and mechanical feedback from galaxy formation. Together, observations of galaxies and the IGM over the redshift range z=1.6-7 using TMT spectrometers from the near-UV to the near-IR will connect the dark and observable components from the era of reionization to the dawn of the “modern” universe.
Figure 1: An example simulation of the structure of dark mater at z=3. Courtesy of R. Cen, Princeton University.
1.1.2 The “Dark Ages” and Re-Ionization (requires redo: base on Carlberg
doc) The investigation of the “epoch of re-ionization” and the formation of the first stars and heavy elements in the universe will require large ground-based telescopes operating in the near-IR. The power of TMT lies in its ability to enable spectroscopic analysis of faint objects. While JWST will be supremely effective in discovering relatively bright z>6 objects that may be used as probes of the re-ionization era, the spectroscopic capabilities of JWST will be limited to low-dispersion measurements. The principle diagnostics of the reionization era will be in the astrophysics of resonance lines of metallic species that fall in the rest wavelength range 122-164 nm, which at z=6-10 fall in the 0.9-1.6 micron wavelength range. The required spectral resolution will be R>10,000. This is an example where a TMT near-IR spectrograph fed by diffraction-limited images will have far greater sensitivity than JWST. Current theory predicts that the first substantial star formation in galaxies occurred within ~108 solar mass galaxies undergoing the first atomic cooling at redshifts z=10-15. The expected flux densities of such objects are in the nano-Jansky regime (AB>31 mag), and the sizes are expected to be on the order of 100 pc, i.e., very nearly the diffraction limit of
Page 5 of 85 - 5 - Created on 2/22/2005 4:21 PM

a 30m telescope in the 1-2.5 micron range. The expected low masses of these first objects suggest kinematic line widths of ~20 km s-1. Thus, maximum spectral sensitivity to these objects will be achieved with spectral resolution of R~5000-10,000 and spatial resolution of ~20 milli-arc-seconds. A 30m telescope at the diffraction limit can reduce the effective spectroscopic near-IR background to AB~29 per first-light galaxy “footprint”. Thus, TMT will be the primary means of extracting physical understanding from the earliest galaxies discovered with JWST, in much the same way that Keck has provided astrophysical context to Hubble Space Telescope images.
1.1.3 The Epoch of Galaxy Formation One of the flagship science drivers for TMT is the detailed study of galaxies in the era of galaxy formation. Redshifts 1<z< 7 encompass no more than the first 35% of the age of the Universe, but perhaps 80% of its total star and heavy element production and black hole accretion. Initial forays into this “epoch of galaxy formation and assembly”, using present-generation 8-10m class optical/IR telescopes and ground-based radio and sub-mm telescopes, have already indicated a very broad-brush picture that makes clear the gains that can be made with a significant increase in sensitivity from the near-UV to the near-IR. TMT will bring this phase of the Universe’s history into as sharp a focus as the present view of the nearby Universe through its powerful spectroscopic capabilities. For technical and scientific reasons, the spectral region between 1µm and 2.5µm is where the TMT extragalactic science reach is arguably greatest. For 1<z<7 the many important spectral diagnostic features in the rest-UV and optical fall into the near-IR. These are also the wavelengths where diffraction-limited TMT work is possible and has the highest angular resolution. The spectral resolution required for determining galaxy chemical abundances, deriving masses from kinematics and measuring mass outflows (R~4000) coincidentally also dramatically reduces the background over much of this spectral region by resolving the OH emission from the atmosphere. The combination of working between the OH emission and working at angular
resolutions between 0.01′′ and 0.05′′ results in sensitivity improvements far greater than the order of magnitude based on the TMT collecting area compared to 8 and 10m telescopes. Spatially-resolved spectroscopy at these wavelengths will be achieved using integral field unit (IFU) spectrometers. With IFUs it will be possible to spatially “dissect” individual galaxies and protogalaxies at these redshifts, resolving structures spatially at the 100pc level and measuring stellar and gas motions to ~10 km/sec in the same objects.
sg
P
Figure 2: An example of a possible integral-field spectrometer "footprint" superposed on a faint galaxy from the Hubble Deep Field. Courtesy of J. Larkin, UCLA.
The simultaneous spatial resolution and pectral sensitivity will also extend studies of black hole growth and its connection to alaxy formation throughout the most relevant cosmic epoch.
age 6 of 85 - 6 - Created on 2/22/2005 4:21 PM

1.2 Extra-Solar Planet Studies 1.2.1 Physical Conditions in Planet-formation Regions
The study of planet-forming environments is central to understanding the origin of the earth and solar system. The likely complexity of the planet-formation process -- as manifest in the diversity of planetary architectures observed to date -- emphasizes the need for the direct observational study of young disk systems in order to understand the physical processes responsible for these architectures.
Figure 3: Simulation of planet formation with associated gaps in a young stallr disk. Courtesy of G. Bryden, Caltech.
For example, one important issue is the gas dissipation timescale in the terrestrial and giant planet formation regions. The dissipation timescale is poorly constrained by current observations, but is critical to the outcome of the planet formation process. If gas persists for several Myr in the terrestrial planet region, it can have a significant impact on the final mass, eccentricity, and consequent habitability of terrestrial planets. In the giant planet region, the gas dissipation timescale provides an important constraint on the dominant pathway(s) for giant planet formation, e.g., whether giant planets form primarily by
gravitational instability or through core accretion, the mechanism that is believed to have produced the planets in the solar system. Thus, measuring the gas dissipation timescale in disks bears directly on a central issue: the commonality of solar systems like our own. Another way to explore the physical processes involved in planet formation is by looking at the evolution of planetary systems, i.e., by identifying and characterizing young planetary systems in the process of formation and comparing their properties (planetary masses and orbital radii) with the properties of mature planetary systems, e.g., those characterized from precision radial velocities. Young planetary systems can be characterized by studying the gaps that they induce in their surrounding disks. Line profiles obtained at high spectral resolution (R ~ 100,000) can measure both the distance of the planet from its parent star (from the line width) and the width of the gap (from the line shape), thereby probing the mass of the forming planet. Only TMT will have the sensitivity to probe large samples of nearby young stars (the systems that can be studied with current generation telescopes are very few) and determine thereby when giant planets form, where they form, and how frequently systems like our own form. Observations in the near- and mid-infrared are ideal for the study of planet formation environments at radial distances r < 10 AU. At the warm temperatures and high densities of disks at these distances, molecules are expected to be abundant and sufficiently excited to produce a rich vibrational and rotational spectrum. With velocity-resolved profiles, we can determine the region of the disk responsible for the emission. From the measurement of multiple molecular probes, we can determine physical properties such as temperatures, densities, and column densities as a function of radius. Examples of relevant velocities are ~30 km/s at 1AU for gas in orbit around solar-mass stars, ~10 km/s for gas at 5 AU.
Page 7 of 85 - 7 - Created on 2/22/2005 4:21 PM

These velocities therefore require spectral resolutions in the range R=20,000 to > 100,000. Important molecular transitions are present throughout the infrared, for example, the vibrational transitions of gas phase H2 (2-4um), CO (4.6um fundamental), and H2O (2.6µm, 2.7µm, 6.0µm bands). At longer wavelengths, these molecules have pure rotational transitions, for example, the S(1) 3-1 transition of H2 (17µm). Translucent or diffuse clouds (Av < 2) can be studied at UV and optical wavelengths, but the larger column densities that are encountered in molecular clouds and star forming regions (Av = few to > 100) often require observations at much longer wavelengths, in the near- to mid-infrared (2-27µm). In addition to penetrating regions of high extinction, these diagnostics are also strongly complementary to those at other wavelengths, from the UV to the millimeter, probing unique ranges of temperature, density, ionization, and relative abundance.
1.2.2 Doppler Reflex Motion Studies of Terrestrial Planets As of 2005, the vast majority of extra-solar planets have been discovered through radial velocity monitoring of host stars of planets and planetary systems. The presence of planets is inferred via the small periodic reflex motions of the host stars around the system center of mass. The most successful of the programs has used the Keck 1 10m telescope and HIRES spectrometer to discover more than 100 extra-solar planets. Key to the program is extremely high stability and velocity precision (~2 m/sec per observation). The stability is provided in large part by the location of HIRES in a controlled environment on the Keck Nasmyth platform. The velocity precision is achieved through a combination of high S/N (~300), high spectral resolution (~45000), the superposition of wavelength fiducial lines via an iodine cell and by use of wide spectral coverage (averaging over many spectral features). The searches have concentrated on nearby, bright stars, predominantly F- and G-type stars because of the high S/N requirement. To date, all extra-solar planets discovered via these techniques have been gas giants with masses generally larger than that of Jupiter. However, with ever-improving velocity precision, sub-Jupiter-mass planets have been recently discovered, with the current record Msin(i) ~0.1MJupiter (=30MEarth). The distribution of Msin(i) rises to lower mass with a power law dM/dN ∼ M-1 suggesting that planets with 1 – 30 Earth masses are numerous. The exciting step forward in this area for a TMT is the potential for discovery of extra-solar planets into the regime of terrestrial planets. A principal important factor will be the extension of the search to lower-mass main-sequence stars. The 10x improvement in light-gathering capability of TMT will increase the stellar sample by a factor of 30 with the majority of the added stars being low-luminosity K and M stars. The smaller inertial mass of the host stars directly lowers the planet-mass detection lower limit. The Earth induces a motion of 3 cm/sec in the Sun – beyond the reach of even TMT. However, by extending the planet searches to M stars and improving the measurement precision from 2 to 1m/sec with TMT it will be possible to detect extra-solar planets with masses as low as 5 Earth masses in stellar habitable zones.
Page 8 of 85 - 8 - Created on 2/22/2005 4:21 PM
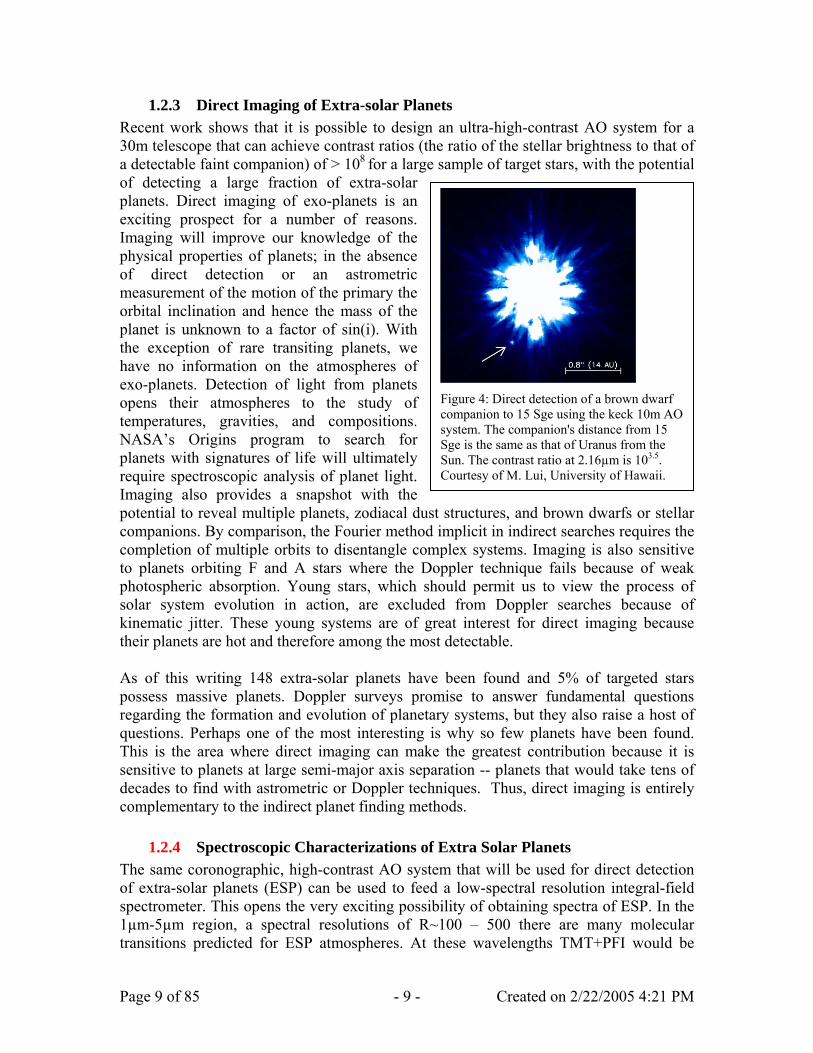
1.2.3 Direct Imaging of Extra-solar Planets Recent work shows that it is possible to design an ultra-high-contrast AO system for a 30m telescope that can achieve contrast ratios (the ratio of the stellar brightness to that of a detectable faint companion) of > 108 for a large sample of target stars, with the potential of detecting a large fraction of extra-solar planets. Direct imaging of exo-planets is an exciting prospect for a number of reasons. Imaging will improve our knowledge of the physical properties of planets; in the absence of direct detection or an astrometric measurement of the motion of the primary the orbital inclination and hence the mass of the planet is unknown to a factor of sin(i). With the exception of rare transiting planets, we have no information on the atmospheres of exo-planets. Detection of light from planets opens their atmospheres to the study of temperatures, gravities, and compositions. NASA’s Origins program to search for planets with signatures of life will ultimately require spectroscopic analysis of planet light. Imaging also provides a snapshot with the potential to reveal multiple planets, zodiacal duscompanions. By comparison, the Fourier methodcompletion of multiple orbits to disentangle comto planets orbiting F and A stars where the Dphotospheric absorption. Young stars, which shsolar system evolution in action, are excludekinematic jitter. These young systems are of gtheir planets are hot and therefore among the mos As of this writing 148 extra-solar planets havpossess massive planets. Doppler surveys proregarding the formation and evolution of planetaquestions. Perhaps one of the most interesting iThis is the area where direct imaging can maksensitive to planets at large semi-major axis sepadecades to find with astrometric or Doppler techcomplementary to the indirect planet finding met
1.2.4 Spectroscopic Characterizations ofThe same coronographic, high-contrast AO systof extra-solar planets (ESP) can be used to feedspectrometer. This opens the very exciting possi1µm-5µm region, a spectral resolutions of R~transitions predicted for ESP atmospheres. At
Page 9 of 85 - 9 -
Figure 4: Direct detection of a brown dwarf companion to 15 Sge using the keck 10m AO system. The companion's distance from 15 Sge is the same as that of Uranus from the Sun. The contrast ratio at 2.16µm is 103.5. Courtesy of M. Lui, University of Hawaii.
t structures, and brown dwarfs or stellar implicit in indirect searches requires the plex systems. Imaging is also sensitive
oppler technique fails because of weak ould permit us to view the process of d from Doppler searches because of
reat interest for direct imaging because t detectable.
e been found and 5% of targeted stars mise to answer fundamental questions ry systems, but they also raise a host of s why so few planets have been found. e the greatest contribution because it is ration -- planets that would take tens of niques. Thus, direct imaging is entirely hods.
Extra Solar Planets em that will be used for direct detection a low-spectral resolution integral-field
bility of obtaining spectra of ESP. In the 100 – 500 there are many molecular
these wavelengths TMT+PFI would be
Created on 2/22/2005 4:21 PM

sensitive to atmospheric and surface signatures, allow measurement of atmospheric
sip
TlrpT
P
Figure 5: Upper panel: Predicted spectra for the warm, gas-giant planet orbiting 55 Cnc at 0.11AU (55Cnc b) and a hypothetical Jupiter-like planet (55 Cnc d) at the same distance from 55 Cnc as Jupiter is from the Sun. Lower Panel: same as above now plotted against flux ratio of the planets to the central star. (Courtesy Sudarsky, Burrows and Lunine, U Arizona).
tructure and bulk chemical composition and measure temporal variations due to changes n cloud cover or seasons. The detection of biomarkers in ESP is a particularly exciting ossibility.
1.3 Resolved Stellar Populations in the Galaxy Nearby Galaxies he ``in situ’’ study of the process of galaxy formation in which galaxies are observed at
arge z and lookback time has begun in the 8-10m telescope era and will be evolutionized by the TMT. A powerful alternative approach to understanding the rocesses of galaxy formation and evolution is to use the z=0 stellar ``fossil record’’. he basic understanding of the star formation, chemical evolution, and accretion history
age 10 of 85 - 10 - Created on 2/22/2005 4:21 PM

of the Galaxy was developed based on color-magnitude diagram studies, abundances of elements in stars from different Galactic populations, and the relations between stellar kinematics, ages and metallicities. In the past decade, using the Hubble Space Telescope and 4m – 10m ground-based telescopes, studies based on resolved stellar populations have been extended to the Galaxy’s dwarf galaxy complement. This work has revealed an unexpectedly wide variety of star formation and chemical enrichment histories for the handful of galaxies for which such studies have been possible.
This is an area in which the TMT provides spectacular advances if it can deliver diffraction-limited imaging with a characterizable point-spread-function over a modest field. Resolved-stellar-content studies can be extended throughout the Local Group and to groups within 20Mpc, including the Virgo cluster. This extension will for the first time allow such studies for galaxies all along the Hubble sequence and with large enough samples of each type to measure cosmic variance in evolution histories as a function of environment. There are many important questions to be addressed and answered. What is the star formation history for galaxies through the Hubble Sequence and is there range of star formation history at a given Hubble Type? We already have sent that dwarf galaxies can have
very different star-formation histories: what are the key factors that govern dwarf galaxy star formation episodes? What is the assembly/star formation history for a giant elliptical galaxy based on resolved-star analysis? Did star formation commence at the same time for all galaxies in the local universe? Are the integrated-light abundance and age studies of distant galaxies accurate? Are the star formation histories of local galaxies compatible with observations of galaxies at large lookback times and can a mapping be established between galaxies at different epochs of the Universe?
Figure 6: "Observed" color-magnitude diagram from a simulated image of M32 as seen with the TMT and an MCAO system. The red, blue and green lines represent three input stellar populations. The indivdual points are photometric measurements from the simulated image. Courtesy of K. Olsen, NOAO.
Page 11 of 85 - 11 - Created on 2/22/2005 4:21 PM
In Section2.8.3.1 below, detailed investigations are presented of how the TMT and a combination of WIRC+MCAO photometry and spectroscopy using IRIS can be used in the area of local universe stellar populations studies.
1.4 Fundamental Physics One of the most important developments in recent years is the growing synergy between cosmology, astrophysics and fundamental physics. The high temperatures (and therefore high particle energies) present in the big bang probe an energy regime that is far beyond what can be studied by particle accelerators on Earth. Astronomical observations are therefore an essential tool (sometimes the only tool) with which to test fundamental theory at high energies. Examples abound - cosmologists were the first to correctly predict that the number of families of elementary particles must be exactly three. This followed from a comparison of spectroscopic measurements of the abundance of helium in interstellar clouds with the abundance predicted by big-bang nucleosynthesis. The theoretical prediction depends on the rate of expansion of the universe a few minutes after the big bang. The expansion rate is a function of the number of species of relativistic particles, particularly neutrinos. Subsequently, the cosmological prediction was confirmed by measurements of the decay width of the Z boson (which depends on the number of species into which this particle can decay).
1.4.1 Dark Matter The evidence is now overwhelming that about 25% of the mass of the Universe consists of dark matter. Little is known about its nature other than it interacts with normal matter and energy primarily through gravitation. There are many possible candidates for the dark matter ranging from new fundamental particles, such as the very-low-mass axion, to planetary-sized black holes. Astrophysical observations can provide important clues to the nature of this matter. For example, standard cold-dark-matter theory (in which the dark matter consists of nonrelativistic non-interacting particles) overpredicts the number of low-mass dark-matter galaxy halos, and predicts cusps in galaxy cores that are not observed. This has led to models that modify the energies or interactions of the particles (warm dark matter, fuzzy dark matter, etc). These models modify the structure of galaxy dark matter halos and can be probed by studies of the velocity structure in galaxy cores and in dwarf galaxies. Such work, which involves spatial-resolved spectroscopy of low-surface-brightness galaxies, is well suited for the TMT with IRIS and IRMOS.
1.4.2 Dark Energy One of the most important discoveries of the past decade is the acceleration of the Universe, implied by observations of distant supernovae. This acceleration has profound consequences. Not only does it affect the size and brightness of distant objects, but it modifies gravitational dynamics, slowing the growth of structure and, ultimately, determining fate of the Universe. According to general relativity, the expansion is driven by a new type of relativistic matter having a negative pressure. The properties of this “dark energy” are at present poorly determined. The simplest physical parameter that can be constrained by observations is the dimensionless ratio w of pressure and energy density. If w is assumed to be constant, present observations support a value of close to –1, consistent with a classical “cosmological constant” term in Einstein’s equations, however, w may in fact vary with time. On physical grounds we expect that the energy of the vacuum should be determined dynamically, perhaps by spontaneous breaking of the
Page 12 of 85 - 12 - Created on 2/22/2005 4:21 PM

symmetry of a quantum field. However, attempts to calculate the vacuum energy of such fields fails spectacularly because the energy scale that follows naturally from theory exceeds the observed limits on the energy density of the dark energy by 120 orders of magnitude. This enormous discrepancy is arguably the most important problem facing fundamental physics theory today.
Despite this shortcoming of the theory, there are many plausible candidates for the dark energy. Choosing between them will require more precise measurements of w over a wide range of cosmic time. This calls for accurate measurements of the expansion rate as a function of redshift. A promising technique is the measurement of the baryonic peak in the galaxy spatial correlation function imprinted in the distribution of dark matter at the time of recombination (Peebles & Yu 1970, ApJ, 162, 815). The co-moving scale of this peak, roughly 150 Mpc, can be
cdectd0vWeato1w
THu
P
Figure 7: The baryon peak in the galaxy 2-point correlation function detected by the Sloan Red Galaxy Survey. The curves indicate theoretical predictions for three different values of the matter density, with the bottom curve being the prediction with the baryon peak removed (Eisenstein et al 2005, astro-ph/0501171)
accurately determined by osmic microwave background observations. The corresponding angular scale can be etermined by deep wide-field galaxy surveys. This gives the angular-size distance to the ffective redshift of the survey, from which expansion rate can be derived using standard osmological relations. This approach has the very important advantage that it avoids all he systematic effects that could potentially bias the supernovae technique. A robust etection of the peak, comparable to that achieved by the Sloan survey at a redshift of .35 (Eisenstein et al 2005, astro-ph/0501171), requires an effective survey commoving olume of order 1 Gpc3, and a sample size of order 50,000 galaxies. The TMT, with FOS, will be able to conduct surveys similar to that of Sloan at higher redshifts. For
xample, over the redshift range z = 1 to 3.5, the 150 Mpc co-moving scale subtends an ngle that ranges from 2.6 to 1.3 degrees on the sky. A survey of 100 square degrees in his redshift interval would sample a commoving volume of 3 Gpc3, allowing a measure f the expansion rate over a wide range of redshift. The TMT could achieve this with 000 WFOS pointings using 1 hr exposures and a resolving power R ~ 2000, which ould give redshifts for some 200,000 galaxies.
1.4.3 Fundamental theory he standard model of particle physics is the most successful theory ever devised. owever, it remains incomplete as gravity is not included. Intensive theoretical work is nderway to investigate extensions, or new theories, that go beyond the standard model
age 13 of 85 - 13 - Created on 2/22/2005 4:21 PM

in an attempt to unify the fundamental forces and ultimately include a quantum theory of gravity. The approaches vary widely, ranging from a particle approach (string theory, supersymmetry) to a geometric approach (large extra dimensions). The predictions of these theories have yet to be worked out in sufficient detail to allow experimental tests. However, it is already clear that astrophysical observations will provide important constraints. For example, gravitational radiation from astrophysical objects such as compact stars and black holes, allows us to probe gravitational physics in a regime that cannot be achieved on Earth. With its superb resolution, the TMT will be a central part of this effort.
1.4.4 Fundamental constants The standard model, while successful in predicting the outcome of virtually all experimental tests to date, is unsatisfactory in that it contains 20 parameters whose numerical values are not predicted and must be determined experimentally. It is expected that a more-fundamental theory will predict the values of many of these parameters. In many such theories, such as those employing macroscopic extra dimensions, the parameter values are a function of time. It is therefore of great interest to search for possible variations of these fundamental “constants”.
CipfodPwamTiwd
P
Figure 8: Evidence for variation of the fine structure constant from Mg II and Fe II absorption lines (black points). (Data from Webb et al 2001, PRL, 87, 091301 and Murphy et al 2001, MNRAS, 327, 1208. Figure reproduced from Uzan 2003, Rev. Mod. Phys. 75, 403).
ertain resonance lines in the spectral of heavy atomic species are sensitive to variations n some of these parameters, particularly the fine structure constant α, the electron to roton mass ratio µ, and the proton gyromagnetic factor g. These lines can be probed as a unction of redshift by means of high-resolution spectroscopy of distant quasars. Current bservations, conducted with 10m and 8m telescopes have produced mixed results. A 4-σ etection of variation of the fine structure constant was reported by Webb et al (2001, RL 87, 091301; see Figure 1.5.2) based on Keck spectra. However, a conflicting result as subsequently published by Chand et al (2005, A&A 430, 47). It is clear that a larger
nd better data set is needed to confirm or refute this result. The technique requires the easurement of the relative wavelengths of narrow absorption lines within multiplets. he limiting factors are photon noise and spectral resolution. With its order of magnitude
ncrease in light-gathering power over the Keck and VLT telescopes, TMT with HROS ill improve the accuracy by a factor of 3 to 4 in the same integration time, which would ecisively resolve the issue.
age 14 of 85 - 14 - Created on 2/22/2005 4:21 PM

1.5 Black Holes 1.5.1 Precision Astrometry in the Galactic Center
Figure 9: Stellar orbits based on proper motions in the inner 1 arcsec of the Galactic center. Courtesy A. Ghez, UCLA.
One of the scientific goals of having diffraction-limited performance on a 30-m telescope is a detailed study of the center of the Milky Way Galaxy. The proximity of our Galaxy’s center (8 kpc) presents a unique opportunity to study a supermassive black hole and its effects on its environment with much higher spatial resolution than can be brought to bear in any other galaxy. Over the last decade, diffraction-limited imaging on 10-m class telescopes of stars within the Galaxy’s central cluster has allowed the proper motion of the brightest stars (K=14-16) to be measured with a precision of 1 milli-arcsec and has demonstrated the existence of 4 million solar masses of dark matter confined to within a radius of 90 AU. While this is well outside the Schwarzschild radius (90AU=1,000 Rs), it is the most convincing
case for a supermassive black hole at the center of any normal galaxy today. A large number of questions have arisen from these experiments that require a 30-m telescope to address effectively. In section 2.1.3.1 we explore in detail two examples that benefit tremendously from the precision astrometry along with diffraction-limited spectroscopy offered by a 30m aperture. First, the high spatial resolution reduces crowding, which is significant as the confusion limit has already been reached at K=17 with current resolution. Second, the astrometric precision will be improved by a minimum of a factor of 3 and ideally, with the higher S/N, by a factor of more than 10, to 0.1 milli-arcsec; this allows orbital solutions for a given star to be determined more quickly, and, more importantly, stars with significantly shorter orbital periods (in principle as short as 1 year, compared to the minimum currently measured of 15 years) can be measured.
1.5.2 Galactic Nuclei from z=0 to z=6 (bolte will pull from below)
1.6 Solar System Studies 1.6.1 Planets and satellites
In many cases, global infrared images of planets and satellites of the Solar System observed with TMT would be higher spatial resolution than those obtained by spacecraft exploring the Solar System. In addition, ground-based telescopes offer the possibility of significantly higher spectral resolution than has been obtainable on board spacecraft. The combination of these two
Page 15 of 85 - 15 - Created on 2/22/2005 4:21 PM

capabilities will allow a 30 m telescope anchored to the Earth to make significant contributions to the exploration of the Solar System. A further advantage of TMT over explorer-type missions is the ability (thanks to the permanent nature of the facility and a routinely operating adaptive optics system) to monitor changes, e.g., weather and volcanic activity, on Solar System objects. As an example, we consider the case of Jupiter’s satellite Europa. Europa’s surface is covered with water ice, but evidence suggests that underneath this ice layer a global liquid water ocean may exist. The water from this ocean may sporadically reach the
surface of Europa in the many cracks penetrating the icy surface of the satellite. One piece of supporting evidence for this ocean is that low-resolution spectroscopy from the Galileo spacecraft has suggested that the dark regions around the cracks are composed of hydrated salts evaporated from the seawater below. If this were true, the composition of the salts would hold important answers to questions of composition of the proto-solar nebula, the degree of aqueous processing of the satellites, and the potential for supporting life or pre-organic chemistry. Unfortunately, at the spectral resolution of Galileo (R ~ 200), the identification of the dark materials on Europa is not certain. A resolution ≥10 times higher, however, would allow the many different salt species or other possible components to be readily discerned. While such spectral resolutions are routinely available from the ground today, at the low spatial resolution of typical ground-based observations the spectra of the large icy regions hide the spectra of the
dwtG
Moip-sTftsn
P
Figure 10: A visible-light Galileo image of Europa, convolved to the resolution of TMT. Linear cracks, expected to be the location of evaporated oceanic salts, are clearly resolved, as are craters and large icy regions. High-resolution spectroscopy of these features will allow definitive chemical composition determinations. Courtesy M. Brown, CIT.
unresolved dark areas. At TMT resolution, however, the ark regions on Europa are resolved. High spatial and spectral resolution imaging of the satellite ill allow definitive compositional identification that will help to solve many of the questions of
his satellite and its possible oceanic interior. Similar problems will be solvable on the other alilean satellites and on many other bodies of the Solar System.
1.6.2 The outer Solar System ost of the original material in the disk of gas, dust, and ice that formed the sun and planets of
ur Solar System has been heated, stirred, and compressed beyond recognition, leaving little nformation about the initial conditions that led to the current Solar System. Recently, however, lanetary astronomers have discovered a vast swarm of small icy bodies -- named the Kuiper belt - orbiting at the edge of the Solar System. While closer to the sun everything was heated and wept into planets, beyond Neptune the density of material was so low that no planets formed. hese Kuiper belt objects (KBOs) have been preserved in deep freeze since the time of the
ormation of the Solar System. Study of the composition of these objects provides direct access o the make-up of the material out of which the planets formed. The composition of icy bodies uch as these is best determined through moderate resolution (R ~ 1000) spectroscopy in the ear-infrared (1-2.5 µm) where most important ices have strong absorption features. Because of
age 16 of 85 - 16 - Created on 2/22/2005 4:21 PM

their vast distances and small sizes, these objects are extremely faint, so such infrared spectroscopy has only been possible for a small number of the largest objects, where the Keck telescope has been used at extremely low spectral resolution to search for the signatures of a few extremely abundant ices with broad spectral bands. Unfortunately, these large objects are the least effective at preserving the early chemical signatures, so the promise of studying primordial material remains unfulfilled. In lieu of spectroscopy, astronomers have been studying the broadband colors of KBOs from the blue to the infrared. While colors alone cannot provide compositional information, they can at least indicate which objects might be compositionally similar and which different. Indeed, from studies of dozens of objects, it is apparent that KBOs come in a wide range of compositions with colors varying from essentially neutral to the reddest objects ever observed in the Solar System. It is clear that once spectroscopy is possible, astronomers will be rewarded with a rich assortment of spectral and compositional types holding many clues to the earliest history of the Solar System. With the TMT we expect that hundreds (if not thousands, by then) of moderately faint KBOs will be well within the range of moderate resolution spectroscopy. Because of the relative youth of this field, it is difficult to speculate on the discoveries that will be enabled by these advances. However, it is clear that this type of basic exploration of the Solar System will yield important insights into the formation of our and other planetary systems for many years to come.
Page 17 of 85 - 17 - Created on 2/22/2005 4:21 PM
2 Science Programs organized by Instrument Concepts
2.1 IRIS: InfraRed Imaging Spectrometer (local stellar pops: where?)
2.1.1 Overview of capability and expected performance This instrument is intended to provide moderate spectral resolution (~ R=4000) spatially resolved spectroscopy and imaging over a small field of view in the wavelength region from 1µm to 2.5µm (extensions of this range to 0.6µ and 5µ are desirable). It will be fed by an adaptive-optics-corrected beam and will be capable of working spatially at the diffraction limit of the 30m telescope at all wavelengths longer than 1µm. Spectroscopy will be spatially resolved through use of an integral-field unit (IFU). In addition to reconstructing images from the spectrum from each IFU resolution element, this instrument will have a diffraction-limited, larger-field direct imaging mode. A parallel imaging capability would be advantageous for some projects, as well as for providing simultaneous knowledge of the point-spread function. This is the highest priority instrument for TMT because (1) it best takes advantage of the capabilities unique to a 30m telescope with images corrected to the diffraction limit, and (2) it offers a range of capabilities that will be used for a broad range of science areas. Using conservative assumptions based on the performance of existing systems, it is anticipated that IRIS+NFIRAOS will allow point sources as faint as K = 28 (KAB = 30) to be detected at the 3σσ level in the K-band with 3 hour exposure times.
2.1.2 Overview of anticipated science areas
• The physics of galaxy formation. Spatially resolved studies of galaxies and assemblages of sub-galactic-mass objects providing measurements of kinematics, chemistry and physical conditions on scales ~ 100 parsecs will be possible for objects from the epoch of peak star formation in the Universe (z=1 – 4).
• AGNs, Black Hole demographics and growth throughout cosmic history:
Photometric, spectroscopic and, for Local Group galaxies, astrometric studies of stellar and gas orbits in the centers of galaxies will improve our understanding of the nature of supermassive black holes and their effect on their surroundings in the local Universe and extend our knowledge of galactic-size black hole formation and growth to z≥4.
• Stellar populations in galaxies from the Local Group to the Virgo Cluster.
The combination of precise photometry of large samples of stars in galaxies up to distances of 15 Mpc and spectroscopy of the brightest red-giant and supergiant stars in the same fields will allow direct determinations of the metal abundance
Page 18 of 85 - 18 - Created on 2/22/2005 4:21 PM

distributions and star-formation histories of hundreds of galaxies in the local Universe.
• The Evolution of Star Clusters and the IMF. 3-dimensional orbits and stellar
luminosity functions will be able to be measured in the cores of dense stellar systems ranging from the Galactic Center, to core-collapse globular clusters, to young star-forming clusters.
• The Detection and Characterization of Extrasolar Planets and Planet-
forming environments. Studies of extrasolar planets and proto-planetary disks are in their infancy with AO systems coming on line on 8 and 10m telescopes. The number of good targets (nearby, young stars) is limiting progress in this field. IRIS will be a very powerful facility for characterizing extrasolar planets and disks as it will provide much improved diagnostic capability and dramatically increase the sample of systems.
• Solar System studies. IRIS will have better physical spatial resolution and much
higher sensitivity for studying solar system objects (planets, moons and asteroids) than many space missions of the past two decades.
2.1.3 Specific Science Cases: Detailed Discussions 2.1.3.1 Studies of Galaxies at High Redshift (C. Steidel, CIT)
A major breakthrough scientific application of IRIS+NFIRAOS will be the spatial dissection of galaxies during the peak epoch of galaxy formation, in the range z ~ 1-4, which evidently harbors the most active period of star formation and AGN accretion in the history of the universe. Observations of these galaxies with the TMT will exploit both the light gathering power and the unique angular resolution at near-IR wavelengths provided by this facility. While large samples of galaxies throughout this redshift range are already known, and the current generation of 8 – 10 metre telescopes will learn a great deal more in the next decade, spatially resolved spectroscopy, which will allow differences in chemistry, kinematics, and physical conditions to be mapped as a function of spatial position within the galaxies, is required to go beyond measurements of crude global properties, and thereby gain fresh understanding into the physics of galaxy formation. IRIS, with its imaging and IFU capabilities, will provide the crucial first steps in a comprehensive survey of these systems. Galaxies at z = 1 – 4 generally show considerable spatial structure in the highest-resolution images available at present, which are those recorded with the Hubble Space Telescope Advanced Camera for Surveys (ACS); examples are shown in Figure 8. These data show that the target galaxies exhibit a tremendous diversity in spatial structure and surface brightness at the spatial resolution of the ACS; however, it is not clear what these galaxies will look like at the diffraction limit of the TMT – at some angular resolution they should break up into luminous point-like super star clusters and/or individual giant HII regions, and the detection of objects of this nature will provide a breakthrough in characterizing the assembly of disks and spheroids. It is anticipated that the TMT will
Page 19 of 85 - 19 - Created on 2/22/2005 4:21 PM

come close to detecting the brightest clusters and star-forming regions, as the diffraction limit of the TMT at 2 microns is roughly 15 milli-arcseconds, which corresponds to ~100
pc nearly independent of redshift through the redshift range of primary interest. For comparison, the largest rich star clusters in nearby galaxies can have sizes approaching a few tens of parsecs. Clusters at z ~ 3 that have masses in excess of 106 solar masses and are viewed within the first 108 years of their evolution should be within the detection threshold of IRIS in K-band imaging mode.
The near-IR provides access to well-calibrated diagnostic emission and absorption lines throughout the rest-frame optical part of the spectrum during the z=1-4 era. However, spatially resolved spectroscopy of forming galaxies is challenging because the targets are faint in the near-IR; even the brightest examples, as in Figure 8, have KAB~22-24.5 in the continuum. The typical total
asc
T
P
Figure 11: Postage stamp images of 56 GOODS-N galaxies with z = 1.5 – 2.0. Each box is 3 arcsec on a side. Note the complex morphologies of these systems. With IRIS in both imaging and IFU modes it will be possible to observe systems of this nature with unprecedented angular resolution in the restframe visible.
ngular size of the galaxies of interest is ~ 0.5-2 arc seconds in diameter, and so a pectroscopic field of ~ 2 arc seconds would comfortably map the emission line and ontinuum characteristics of the entire luminous region.he sensitivity of spatially resolved spectroscopy of high-z galaxies with the TMT is
uncertain, as knowledge of spatial structure on scales below those that have been observed to date is required. Moreover, there will almost certainly be a diffuse component made up of unresolved stars and gas emission. To deal with these eventualities, it is essential to have flexibility in the spatial sampling of the IRIS IFU. In Figure 9 we demonstrate the detection of Hα in four real galaxies, observed at 0.1′′ resolution by HST/ACS. It has
Figure 12: Examples of high-z galaxies as observed with the IRIS IFU with 0.05 arcsec angular sampling and R = 4000 at the wavelength of restframe H_. A line flux of 10-17 ergs sec-1 cm-2 has been assumed, which corresponds to a SFR of 1.5 solar masses year-1
age 20 of 85 - 20 - Created on 2/22/2005 4:21 PM

been assumed that the Hα line flux traces the UV continuum light and has the same ratio of H alpha to UV everywhere in the galaxy. We further assume that the total Hα flux is 10-17 ergs sec-1 cm-2, which at the redshift of the galaxies (z=2.3) corresponds to star formation rates of ~ 4 solar masses per year (i.e., similar to the Galaxy today). A Strehl ratio of 0.5 is assumed. The color scale shows the S/N ratio for the Hα line at each 0.05" spatial sample after 1 hour of integration, parsed into four 900 second exposures. Kinematic information could be obtained in regions with S/N ~5 per spatial sample, while chemical information would require S/N ~ 20 (see Figure 10 for a sample spectrum); clearly, night long integrations will be required to achieve the latter goal. It is
conceivable that higher sensitivity could be obtained for regions that may be obscured in the far-UV but bright at Hα, or that finer spatial sampling could reveal regions with very high surface brightness; it is the nature of the pioneering work that will be done with IRIS + NFIRAOS that we can only guess as to what will be found. The interline background in H and K is assumed to be 18.5 AB per sq. arcsec. Finally, we note that the detector dark current is 0.03 electrons/s/pixel, and finer sampling would not gain significantly in sensitivity unless the dark current is significantly reduced relative to this assumption.
WmdAesnee
TatsiU
P
Figure 13: The composite spectrum for a sample of 10 galaxies at z = 2.4, obtained in seeing-limited mode for whole galaxies using the Keck NIRSPEC. The [NII]/H_ ratio indicates approximately solar metallicities in the HII regions, and the ratio of the SII lines suggests densities of ~1000cm3. Using IRIS, spectra of this quality could be obtained for positions in individual galaxies at a spatial scale of 0.1 – 0.2 kpc at any redshift <4. Courtesy of C. Steidel, CIT.
hile this science case has focused on extended extragalactic sources, there are also ore compact sources that could be observed, and these include the most distant galaxies
iscovered by JWST, young star clusters in distant systems, or AGN in distant galaxies. ssuming negligible contributions from detector dark current and read noise, it is
stimated that S/N=5 per spectral resolution element per 20 milli-arcsecond IRIS IFU patial element is achieved in one hour with R = 4000 for a source with KAB~ 26 (140 Jy) landing entirely on a single IFU element. In 10 hours, a spectrally unresolved mission line with a flux of ~ 10-20 erg/sec/cm2 can be detected at the 5 sigma level; as an xample, this is equivalent to a line luminosity of ~ 4 x 10⁶ solar luminosities at z=10.
2.1.3.2 The Initial Mass Function in Young Clusters he large majority of stars are believed to form in rich clusters containing between 104
nd 106 stars, and with volumes of 3 to 30 pc3. Such compact clusters are expected to be he most prominent features in protogalactic clumps and merging galaxies. The massive tars in these clusters are the primary source of heavy elements injected into both the nterstellar medium of their host systems and the nearby intergalactic medium (IGM). nderstanding the kinds of stars that form in these regions and the processes that control
age 21 of 85 - 21 - Created on 2/22/2005 4:21 PM

their formation is an essential first step in understanding the star forming history of galaxies. Of primary interest to the evolution of galaxies and the IGM is quantifying the mass function in these clusters. The mass function of stars more massive than 5 Msun controls the total quantity and relative abundances of heavy elements enriching the ISM and IGM. The ratio of high (M >> 5 Msun) to low (M << 1 Msun) mass stars also provides a measure of the amount of material available for recycling into subsequent generations of stars compared with that contained in stars with lifetimes well in excess of the Hubble time. Of equal interest is gaining an understanding of the star formation process in these rich, dense clusters. Recent theoretical work (Elmegreen and Shadmehri, 2003; McKee and Tan, 2003) suggests that conditions during cluster formation may favor the formation of protostellar cores characterized by higher turbulent speeds, higher initial core densities and, as a result, higher time averaged accretion rates during the stellar assembly phase. These conditions, combined with a high volume density of protostellar cores may also produce a larger fraction of more massive stars. Chemical composition – through its affect on protostellar properties – may also play a role in determining both the core accretion rates and emerging IMF. Direct observations of rich, dense clusters should in principle enable determination of (1) the shape of the IMF over the entire range of masses, from ~100 Msun to well below 1
Msun; (2) the time-averaged accretion rates characteristic of protostellar cores through direct observation of the ‘stellar birthline’ in very young clusters; and (3) the relationship between emerging stellar masses and local stellar density within a given cluster, which is a potential measure of the importance of collisions between protostellar cores and mergers in forming high mass stars. By studying clusters in a number of galaxies it is possible to probe the effects of parameters such as metallicity on the IMF. Familiar examples of nearby rich, dense clusters are (1) the Arches Cluster located near the center of the Milky Way galaxy, and (2) R136 in the Large Magellanic Cloud. Attempts to carry out detailed studies of these regions with current facilities have thus far been limited primarily by crowding, which
P
Figure 14: Hertzprung-Russell Diagram for young star forming clusters (from Paller and Stahler 1990). The effect of higher time-averaged accretion rate during the stellar assembly phase is to raise the birth line in the HRD. The location of post birthline PMS tracks for masses spanning the range from 0.2 to 5 solar masses.
age 22 of 85 - 22 - Created on 2/22/2005 4:21 PM

limits the accuracy of photometric probes of the IMF and the location of the birthline, as well as precluding spectroscopy of all but the brightest cluster members. Breakthrough observations that enable probes of clusters spanning a wide range of initial density and chemical composition in a range of environments, including systems external to the Milky-Way, will be possible with IRIS on the TMT owing to the tremendous gain in angular resolution and light gathering power with respect to extant facilities. Below, we outline a breakthrough program that utilizes both the diffraction limited imaging and IFU capabilities of IRIS + NFIRAOS and will allow the study of the IMF over a range of metallicity, cluster density, and galactic environment. The target clusters will also provide a sample with which to study the effect of the same parameters on the star formation process, or more specifically the location of the stellar birth line for the low mass stars still descending onto the main sequence. These data will not only allow for an unprecedented investigation of the IMF which is critical to star formation history calculations in the early universe, but also for a new exploration of aspects of the star formation process in massive clusters. For example, what is the spatial distribution of the more massive stars relative to the lower mass stars? If massive stars preferentially form in the densest parts of clusters, this implies collisions or mergers could play a role in their formation. Do the most massive stars form in the most dense clusters? With deep imaging in a range of stellar environments including the Milky Way, and Magellanic Clouds, we hope to explore the location of the stellar birthline for low mass stars (Palla and Stahler, 1990) (Figure 11). This locus in the Hertzsprung--Russell Diagram (HRD) may be a function of cluster density or metallicity since it depends on the mass accretion rate. An IRIS study of the IMF would consist of both imaging and spectroscopic components, and these are described below.
2.1.3.2.1 IRIS Imaging of Rich, Dense Clusters. We develop the technical justification for this science case using the known properties of young massive clusters in the Milky Way galaxy and the LMC based on the recent work of Hillenbrand and Carpenter (2000, hereafter HC00). The HC00 method deduces a mass function from an infrared CMD, from which one seeks to find a statistical estimate for the mass function, taking into account the observational uncertainties, a distribution of stellar ages, a distribution of intrinsic excesses (due to accretion disk emission), and a distribution of line of sight extinction. Since the observed colors are degenerate to different combinations of these parameters, the method seeks to find the most probable mass for any point in the CMD given that the excess, extinction, and age have statistical distributions which can be determined independently or reliably assumed. An appropriate set of stellar models is then used to find the most probable mass for any star (or localized group of stars) in the CMD. In the following, we describe the necessary data sets needed to obtain these distributions, and the IMFs in star clusters in and beyond the Milky Way. The basic imaging data needed for this program are deep high angular resolution near-infrared images in H and K. With maximum sizes of a few parcsecs, which corresponds to ~1 arcsec at the distance of M33, the clusters will fit well within the IRIS imaging
Page 23 of 85 - 23 - Created on 2/22/2005 4:21 PM

field. We have carried out calculations to determine the photometric limits for Arches or R136 like clusters from the LMC to M82. While imaging in Galactic clusters is also crucial, this work can be done to well below a solar mass on current 8m telescopes with adaptive optics. Determining the distributions of age, excess, and extinction to individual stars will, however, need to be carried out in Galactic clusters with a 30 meter facility.
We have computed photometric crowding and photon statistic limits for target environments in the LMC, M33, and M82 using the radial profiles of the Arches and R136, coupled with the crowding limit algorithm given by Olsen et al. (2003). The input luminosity function used for these calculations is a hybrid based on measurements in the Arches cluster (Blum et al. 2002) for the high mass stars (~/> 2 Msun) and measurements in the Trapezium by HC00 for the low mass stars (~/< 3 Msun), and the result is shown in Figure 12. The Arches radial profile is a fit to a re-analysis of the Figer et al. (1999) HST data by Blum et al. (2002), while the profile for R136 is taken from Mackey and Gilmore (2003). The limiting K-band magnitude as a function of location in an Arches-like
c(1fi TaBd
P
Figure 15: : Hybrid K-band luminosity function adopted for the crowding calculations. The upper end (M >/~ 2 Msun) is adopted from Blum et al. (2002). The mass function is slightly steeper than the mass function of Figer et al. (1999) and Stolte et al (2001)
luster, and the corresponding lower mass limit that can be probed, are shown in Tables 1 TMT) and 2 (8 metre telescope). The distance moduli used for the calculations were 8.5, 24.5, and 27.8 for the LMC, M33, and M82, respectively. K-band magnitudes are or crowding limited photometry to 10% accuracy. Mass to K magnitude transformation s that given in Blum et al. (2002).
his program utilizes the diffraction limit of the TMT, and only modest exposure times re required to reach the limiting magnitude imposed by crowding in M33 and M82. ecause the LMC is closer than the other galaxies crowding is less of a concern, and eeper photometric measurements can be obtained than in the more distant systems.
Limiting K-magnitude
Limiting Mass
Radius (Re) LMC M33 M82 LMC M33 M82 0.5 >27.5 17 <19.8 ~0.01 170 >200 1.0 >27.5 18.9 <19.8 ~0.01 65 >200 2.0 >27.5 22.3 20 ~0.01 3 193
Table 1: Limiting K-magnitudes, set by crowding, and the corresponding lower mass limits that can be probed with the TMT working at its diffraction limit.
age 24 of 85 - 24 - Created on 2/22/2005 4:21 PM

5.0 >27.5 27.5 23.9 ~0.01 1.1 32
Limiting K-magnitude
Limiting Mass
Radius (Re) LMC M33 M82 LMC M33 M82 0.5 16.3 <16.5 <19.8 13 >200 >200 1.0 24.6 <16.5 <19.8 0.25 >200 >200 2.0 24.6 17.2 <19.8 0.25 150 >200 5.0 24.6 21.5 <19.8 0.25 20 >200
2.1.3.2.2 IRIS IFU Spectroscopy of Rich, Dense Clusters. The HC00 method relies on individual spectra to produce the excess emission for a given cluster. These properties are derivedof the individual stars. Ideally, the spectra would sample the en
magnitudes inHC00 appliedderived distribphotometric relatively narrmore distant cassume the emission and athat are too spectroscopicadistributions cGalactic and more nearby metallicities an Based on themass functionrobust even uncertainties distributions. distributions wthe massive clone to two h
quality spectra (S/N 100 - 50, where hotter, more luminous starsweaker features) will be sufficient. HC00 used optical colors and spectra to derive the extinction tostars. With appropriate colors corresponding to each, they used
Page 25 of 85 - 25 - Create
Table 2: Limiting K-magnitudes, set by crowding, and the corresponding lower mass limits that can be probed with an 8 metre working at its diffraction limit.
distributions of age and from the spectral types tire range of colors and the (K, H-K) CMD. the spectroscopically utions uniformly to their data that covered a ow range of masses. For lusters, we will need to distributions of excess ge for stars in the CMD faint to be observed
lly. Appropriate an be estimated from the LMC clusters that are and sample a range of d densities.
analysis of HC00, the results appear to be
for relatively large in the excess and age
Assuming the ill be broadly similar in usters we observe, then undred stars with good
Figure 16: MK that can be sampled with a S/N = 50 at R = 4000 on IRIS in IFU mode during a 3 hour total exposure time. These numbers hold for the uncrowded outer regions of clusters. For some embedded Milky Way clusters, the limiting MK will be similar to the LMC owing to the compensating effects of extinction and distance.
need higher S/N due to
and ages of individual the observed H - K to
d on 2/22/2005 4:21 PM

derive the excess emission to each star. For this program the extinction and intrinsic excess can be determined iteratively using the infrared spectra obtained with the IRIS IFU. For the hot stars, the colors will be dominated by extinction (reddening) except for a few high mass objects still enshrouded in their birth material (e.g., W31, Blum et al. 2001). For the low mass stars, accurate spectral type classifications exist which will allow for the extinction and excess to be determined iteratively from the near infrared colors and spectra (See, e.g.,Ali et al. 1997). The expected performance with the IRIS IFU is shown in Figure 13, and it is clear that within the Local Group we will be able to obtain spectra of stars with masses of at least a few tens of a solar mass.
2.1.3.3 The Galactic Center (A. Ghez, UCLA) One of the scientific goals of having diffraction-limited performance on a 30-meter telescope is a detailed study of the center of the Milky Way Galaxy. The proximity of our Galaxy's center presents a unique opportunity to study a supermassive black hole and its environs with much higher spatial resolution than can be brought to bear on any other galaxy. Over the last decade, near-infrared monitoring of stars within the Milky Way's central cluster using 10-meter class telescope has enabled complete Keplerian orbit reconstructions for ~10 sources that have demonstrated the existence of a central black hole of mass 3.7±0.2 x 10⁶ MSUN and at a distance of 8 ±0.4 kpc (Schodel,R. et al. 2002, Nature, 419, 694; Schodel, R., Ott, T., Genzel, R., Eckart, A., Mouawad, N., &
Figure 17: The K-band magnitude limit and number N of stars with detectable orbital motions as a function of the aperture of a diffraction limited telescope. Results are shown for power-law K-band luminosity functions normalized to observations by Schodelel et al. (2003) with the slopes matching the range found by Genzel, et cal. 2003, ApJ, 594, 812. Courtesy A. Ghez, UCLA.
Page 26 of 85 - 26 - Created on 2/22/2005 4:21 PM
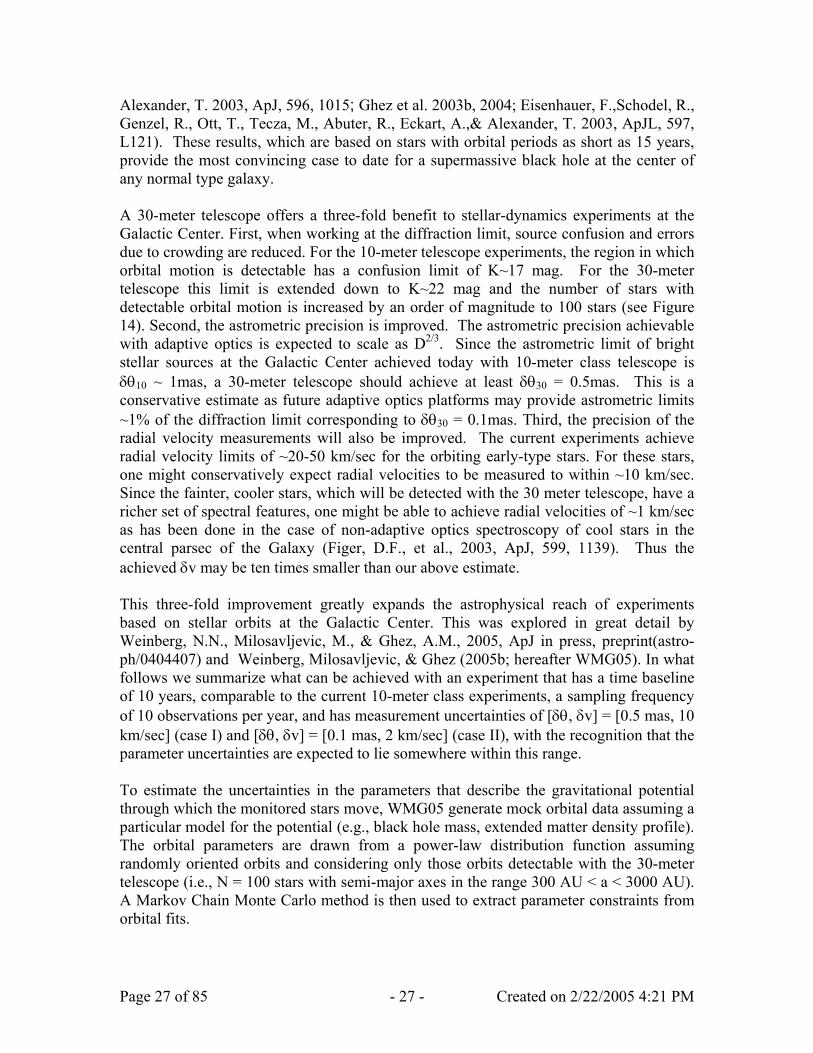
Alexander, T. 2003, ApJ, 596, 1015; Ghez et al. 2003b, 2004; Eisenhauer, F.,Schodel, R., Genzel, R., Ott, T., Tecza, M., Abuter, R., Eckart, A.,& Alexander, T. 2003, ApJL, 597, L121). These results, which are based on stars with orbital periods as short as 15 years, provide the most convincing case to date for a supermassive black hole at the center of any normal type galaxy. A 30-meter telescope offers a three-fold benefit to stellar-dynamics experiments at the Galactic Center. First, when working at the diffraction limit, source confusion and errors due to crowding are reduced. For the 10-meter telescope experiments, the region in which orbital motion is detectable has a confusion limit of K~17 mag. For the 30-meter telescope this limit is extended down to K~22 mag and the number of stars with detectable orbital motion is increased by an order of magnitude to 100 stars (see Figure 14). Second, the astrometric precision is improved. The astrometric precision achievable with adaptive optics is expected to scale as D2/3. Since the astrometric limit of bright stellar sources at the Galactic Center achieved today with 10-meter class telescope is δθ10 ~ 1mas, a 30-meter telescope should achieve at least δθ30 = 0.5mas. This is a conservative estimate as future adaptive optics platforms may provide astrometric limits ~1% of the diffraction limit corresponding to δθ30 = 0.1mas. Third, the precision of the radial velocity measurements will also be improved. The current experiments achieve radial velocity limits of ~20-50 km/sec for the orbiting early-type stars. For these stars, one might conservatively expect radial velocities to be measured to within ~10 km/sec. Since the fainter, cooler stars, which will be detected with the 30 meter telescope, have a richer set of spectral features, one might be able to achieve radial velocities of ~1 km/sec as has been done in the case of non-adaptive optics spectroscopy of cool stars in the central parsec of the Galaxy (Figer, D.F., et al., 2003, ApJ, 599, 1139). Thus the achieved δv may be ten times smaller than our above estimate. This three-fold improvement greatly expands the astrophysical reach of experiments based on stellar orbits at the Galactic Center. This was explored in great detail by Weinberg, N.N., Milosavljevic, M., & Ghez, A.M., 2005, ApJ in press, preprint(astro-ph/0404407) and Weinberg, Milosavljevic, & Ghez (2005b; hereafter WMG05). In what follows we summarize what can be achieved with an experiment that has a time baseline of 10 years, comparable to the current 10-meter class experiments, a sampling frequency of 10 observations per year, and has measurement uncertainties of [δθ, δv] = [0.5 mas, 10 km/sec] (case I) and [δθ, δv] = [0.1 mas, 2 km/sec] (case II), with the recognition that the parameter uncertainties are expected to lie somewhere within this range. To estimate the uncertainties in the parameters that describe the gravitational potential through which the monitored stars move, WMG05 generate mock orbital data assuming a particular model for the potential (e.g., black hole mass, extended matter density profile). The orbital parameters are drawn from a power-law distribution function assuming randomly oriented orbits and considering only those orbits detectable with the 30-meter telescope (i.e., N = 100 stars with semi-major axes in the range 300 AU < a < 3000 AU). A Markov Chain Monte Carlo method is then used to extract parameter constraints from orbital fits.
Page 27 of 85 - 27 - Created on 2/22/2005 4:21 PM

Figure 18: Left panel: The constraints on MBH and R0 obtainable with the 30-meter telescope. The solid contours show the 68%, 95%, and 99.7% confidence levels for case I. The dashed contour shows the 99.7% confidence level for case II. Right panel: The constraint on the extended mass distribution obtainable with the 30-m telescope. The input models have power-law slope of γ=1.5 and γ=2 and enclosed mass of 6000 solar masses within 0.01pc. The line styles are the same as in the left panel.
WMG05 determine how well the 30-meter telescope constrains the mass and distance to the massive black hole at the Galactic center and the extended matter distribution of stars
and dark matter around the black hole. They also demonstrate that relativistic effects are detectable with the 30-meter telescope. Finally, they show that interstellar interactions between monitored stars and background massive remnants will be observed with the 30-meter telescope if the population of stellar-mass black holes predicted by theory exists. We now summarize their results. MBH and R0: For case I, the fractional uncertainties in MBH and R0 are less than 0.1% at the 99.7% level (Figure 15 a factor of ~100 times better than present uncertainties. For case II the fractional uncertainties in MBH and R0 are smaller than those of case I by almost a factor of five. As shown by Olling & Merrifield (2000, MNRAS, 311, 361; 2001, MNRAS, 326, 164) measuring the Galactic constants R0 and the Galactic rotation speed Ω0 to high accuracy will constrain the shortest-to-longest axis ratio q = c /a of the Galactic dark matter halo to similar accuracy. The shape parameter q is an important diagnostic of dark matter models and structure formation and is currently poorly constrained in all galaxies including the Milky Way. Measuring the Extended Matter Distribution: Modeling the extended matter distribution as a power-law profile, WMG05 find that the presence of extended matter is detectable (i.e., observations yield a lower bound) assuming case I as long as the mass in
Page 28 of 85 - 28 - Created on 2/22/2005 4:21 PM

extended matter within 0.01 pc Mext (r < 0.01 pc) > 1500 solar masses. The 30-meter telescope will measure Mext and the power-law density slope γ to 20 - 30% accuracy (Figure 15). Thus, if the dark matter distribution matches theoretical expectations and forms a density spike (Gondolo, P. & Silk, J., 1999, Physical Review Letters, 83, 1719) its influence on the orbits will be detectable with the 30-meter telescope. A detection would constitute a measurement of the gravitational influence of dark matter on the smallest scales yet. Measuring Relativistic Effects: If only one star with e > 0.96 is monitored over a single period at a measurement accuracy corresponding to case I, the orbital pericenter advance due to the relativistic prograde precession will be measured to 5σ accuracy. Several such high eccentricity stars are expected to be detected in the 30-meter telescope's sample of 100 stars. Detecting higher-order relativistic effects such as frame dragging due to the spin of the black hole requires an astrometric precision < 0.05mas or the favorable detection of a star on a highly compact and eccentric orbit. Interstellar Interactions: WMG05 estimate the rate at which monitored stars experience detectable encounters with background stars and stellar remnants. The rate of such encounters is proportional to the mass of the background sources. They find that if the background sources are dominated by stellar-mass black holes, as predicted by estimates of mass segregation in the vicinity of a massive black hole (Morris, 1993, ApJ, 408,496; Miralda-Escude, & Gould, 2000, ApJ, 545, 847), approximately 10% of all stars monitored at a case I precision will experience detectable deflections in their orbital motions. Monitoring orbits with the 30-meter telescope therefore provides a viable means of measuring the mass function of stellar-mass black holes. In conclusion, the monitoring of stellar orbits around the massive black hole at the Galactic center at the high astrometric and spectroscopic resolution attainable with the 30-meter telescope enables one to probe the deep gravitational potential of the region. Many exciting measurements are achievable even for modest (factor of a few) improvements over the astrometric capabilities of current 10-meter class telescopes.
2.1.3.4 Supermassive Black Holes in other Galaxies (L.Ferrarese, NRC/HIA/DAO) Observational evidence for supermassive black holes (SBH) residing in galactic centers has advanced along two separate routes. With few notable exceptions (e.g. the Milky Way, Ghez, et al. 2003, ApJ, 586, L127; NGC 4258, Miyoshi et al. 1995, Nature, 373, 127), dynamical measurements of SBH masses, MBH , based on resolved stellar or gas kinematics have been exclusively HST material. On the other hand, dynamical detections based on (spatially unresolved) reverberation mapping techniques (e.g. Peterson et al. 2004, ApJ, in press; astro-ph/040729), or indirect measurements based on scaling relations which link MBH to nuclear or galactic properties (e.g. the MBH -σ relation, or the r-Lnuc and MBH -Lnuc relations for AGNs, see Ferrarese & Ford, 2004, Space Science Reviews, in press; astro-ph/0411247) are better suited to ground-based facilities. A requirement for detections relying on the dynamical modeling of spatially resolved (stellar or gaseous) kinematics is to map the SBH “sphere of influence”, i.e. the region of
Page 29 of 85 - 29 - Created on 2/22/2005 4:21 PM

space within which the SBH dominates the gravitational potential and therefore the kinematics of the surrounding material. The sphere of influence has radius rh = G MBH / σ2 ~ 11.2(MBH/108 M ) /(σ/200 km sec-1) 2 pc with σ the stellar velocity dispersion. Non-AO equipped ground-based telescopes can target 108 M SBHs (rh ~14 pc) within (under the very best seeing conditions) 5 Mpc. Reaching out to 25 Mpc, HST/STIS could grant access to galaxies in the Virgo and Fornax clusters. Ten years of research with HST have produced almost three dozen detections of SBHs in galactic nuclei. These detections have revealed the existence of a symbiotic relationship between SBHs and their host galaxies, in particular, the relation between SBH masses and the velocity dispersion of their host bulge, MBH = 1.7 x 10⁸ (σ/200 km sec-1)4.6
(Ferrarese & Merritt 2000, Gebhardt et al. 2000) has proven invaluable in the study of SBH demographics (e.g. Yu & Tremaine 2002; Shankar et al. 2004) and has generated intense activity on the theoretical front, changing the way we view SBH and galaxy formation (e.g. Bromley et al. 2004 and reference therein). At present, further progress is impeded by three main shortcomings: • HST’s resolution has been exploited to its fullest; whole interesting classes of objects
are expected to host SBHs whose sphere of influence is well below HST’s resolution, and therefore remain unexplored. For instance, small (< 106 M ) SBH have intrinsically small spheres of influence; very massive (> 109 M ) SBHs are found in massive, rare galaxies generally at large distances, placing their sphere of influence beyond HST’s resolution capabilities.
• HST’s light gathering abilities are limited, confining stellar dynamical studies to high
surface brightness objects. For instance, an HST stellar dynamical study of the nuclear region of M87, which is characterized by a low stellar surface brightness, is unfeasible.
• The lack of an Integral Field Unit onboard HST limits the accuracy with which the
intrinsic dynamical structure of the galaxy can be derived. Many nuclei exhibit complex and asymmetric kinematics, therefore long slit spectroscopy almost always fails to produce an unambiguous dynamical picture of galactic cores.
As a consequence of these shortcomings, the following issues remain to be addressed: • Build an unbiased local sample. Current detections are mostly in early type galaxies
in uncrowded environments. Targeting galaxies across the entire Hubble sequence
Page 30 of 85 - 30 - Created on 2/22/2005 4:21 PM

and in a variety of environments is an essential diagnostic tool for theoretical models addressing the formation and evolution of SBHs.
• Explore the high (> 109 M ) and low (< 106 M ) mass end of the supermassive black
hole mass function, including addressing the existence of Intermediate Mass (100-105 M ) Black Holes in globular clusters.
• Extend local scaling relations, linking MBH to overall galaxy properties, beyond the
local universe. • All of these goals require a boost in both resolution capabilities and light gathering
ability over those provided by HST, as can only be provided by the next generation of diffraction limited ground based large telescopes.
2.1.3.4.1 Resolved Dynamical Studies in the Local Universe. Figure 16 is meant to address resolution constraints. For each galaxy in the CfA redshift
sample (Huchra et al. 1990), the SBH mass has been estimated using the known relation with bulge luminosity (as in Ferrarese & Ford 2004); the latter was taken to be a fraction of the total magnitude following Fukugita et al. (1998). The solid lines identify SBHs for which rh is equal to the diffraction limited resolution of a 2.4m (HST), 8m and 30m (TMT) aperture at 8550 A (i.e. assuming the observations are carried out using the Ca triplet absorption lines). The figure shows that late type galaxies host SBHs too “small” to be detected by HST, while only a handful of Sa galaxies are within HST’s grasp. It is only with an 8m diffraction limited telescope that a complete study of galaxies spanning the entire Hubble sequence can be performed. Even then, little would be
6
w TFwsHS
P
Figure 19: Estimate of the SBH mass vs distance for galaxies in the CfA Redshift sample. Spatial resolution requirements necessary for resolved dynamical studies are met only by galaxies which lie above the solid lines (representing the diffraction limit of HST, and 8m and 30m aperture at 855nm.
gained below 10 solar masses; the TMT ill make it possible to lower this limit by an order of magnitude.
MT’s advantage becomes more tangible once sensitivity requirements are considered. igure 17, which is restricted to a representative sample of local early type galaxies for hich central surface brightnesses are available (Faber et al. 1989), shows that the lack of
ufficient sensitivity sets a significant percentage of the sample beyond the reach of both ST and an 8m aperture, while TMT would be able to detect all but the least massive BHs within 100 Mpc.
age 31 of 85 - 31 - Created on 2/22/2005 4:21 PM

Figure 20: SBH radius of influence vs. central surface brightness for the early-type galaxies sample of Faber et al. (1989). The size of the symbol is proportional to the galaxy distance, as shown in the legend. The solid lines show the constraints dictated by re resolution (the vertical segment) and sensitivity (slanted lines) requirements for a 2.4 (HST), 8m and 30m (TMT) diffraction limited apertures. The photometric zero points for the 8m and 30m apertures are assumed equal to the HST/STIS photometric zero points (in other words, it is assumed that the increase in aperture size is exactly balanced by the decrease in the size of the resolution element), which gives a S/N=50 in a 9000s exposure (~3 HST orbits) for µV=13 mag arcsec-2.The spectra are spatially binned to match the SBH radius of influence (a condition typical of the best HST spectra obtained to date). Exposure are assumed to be 9000s.
The advantage of 2-dimensional spectroscopy is harder to quantify. Suffice it to say that current studies show the kinematics of galaxies to be very complex (e.g. Emsellem et al.
2004). Not accounting for this complexity can lead to an incorrect dynamical description, and to biased estimates of the central potential and SBH mass. In conclusion, TMT shall prove instrumental in building an unbiased sample of SBHs in the local universe (points A and B). The combination of resolving power and sensitivity will not simply augment the sample of galaxies observed by HST, but will open new frontiers, by allowing to investigate the existence (yet unaddressed) of SBHs below 106 M , explore the demography of SBHs in the richest Abell clusters within 100 Mpc, and address the connection between SBHs and galaxy morphology and environment.
2.1.3.4.2 SBH Beyond the Local Neighborhood. The existence of scaling relations linking MBH to the overall properties (luminosity, velocity dispersion) of the host galaxy are reasonably well established locally. How these relations evolved in time is a direct probe of the mechanisms that regulate the joint evolution of galaxies and SBHs. Figure 18 shows the detection capability of TMT/IRIS, for three SBH of mass 107, 108 and 109 M , as they are moved to higher and higher redshifts. Considering resolution requirements only, a SBH can be probed up to the
Page 32 of 85 - 32 - Created on 2/22/2005 4:21 PM

r
P
Figure 21: Detectability of three SBHs, with mass (from top to bottom) 107, 108, and 109 M , as a function of redshift using TMT/IRIS.
Red continuous line: projected radius of the SBH sphere of influence, in arcsec. A ΩM=0.2 ΩΛ =0.8 cosmology has been assumed, with H0=75 km/s/Mpc. Red dashed line: TMT resolution at 8550 A (the redshifted wavelength of the Ca triplet absorption lines is shown on the top axis). Blue continuous line: K-band surface brightness, in mag per “resolution element”. The latter is defined as equal to the largest of the TMT resolution and half the radius of the SBH sphere of influence. The central surface brightness is estimated from the total magnitude using the relation of Faber et al. (1998), while the B-band magnitude is estimated using the SBH mass – host luminosity relation of Ferrarese & Ford (2004). Galaxy colors are from Fukugita et al. (1996) and Bruzual & Charlot (2003). Surface brightness dimming as (1+z)4 has been assumed, as well as a luminosity evolution of ∆µ = –1.75z (Cross et al. 2004).Blue short-dashed line: K-band surface brightness at which S/N=10 is reached in three hours of integration, at a spectral resolution corresponding to half the expected central velocity dispersion of the galaxy. These are given for point sources, a correction to the case of uniform illumination has been applied, by assuming that 30% of the PSF energy is included in a resolution element. NOTE: The figure projects a worse case scenario, since the photometric zero points are appropriate to K-band observations, while the observations proposed here are carried out at significantly shorter wavelengths, at which the sky background is much reduced. Blue long-dashed line: as above, but for a 10 hour total exposure.
edshift at which the projected size of its radius of influence falls below the resolution
age 33 of 85 - 33 - Created on 2/22/2005 4:21 PM
capabilities of the instrument. This happens at z~ 0.4, 0.1 and 0.025 as the SBH mass is decreased from 109 to 107 M . It is interesting to note that, because of the non-monotonic nature of the relation between angular size and redshift, the sphere of influence of a 1010
M SBH (not shown) can be resolved at any redshift (provided that progressively bluer absorption lines, e.g. Mgb or Ca H,K, are used to measure the kinematics as the redshift increases). A non negligible number of AGNs (Tran et al. 2001) are found to host well defined, thin, 100-pc scale nuclear disks of gas and dust, the kinematics of which has been used successfully to constrain the central potential and measure the mass of the central SBH (e.g. Ferrarese & Ford 1999, Barth et al. 2001). Measurements of MBH from emission line kinematics are limited by resolution requirements only, it follows that, at least in principle, TMT could map the very massive SBHs throught the Universe. For studies based on stellar kinematics, sensitivity becomes the limiting factor, at least as far as the most massive SBHs are concerned (Figure 18). Resolution requirements can be relaxed for more massive black holes, and the signal can be binned over several resolution elements (the S/N calculations used in producing Figure 18 indeed assume spatial binning such as to have no more than four independent datapoints within the SBH sphere of influence). The advantage of binning is however largely offset by the fact that massive SBHs reside in giant elliptical galaxies, and central surface brightness decreases as the total magnitude increases (for Mv < −20, Faber et al. 1989). As a consequence, a stellar dynamical detection of SBHs more massive than 35108 M is restricted by sensitivity requirements to within z < 0.1, while for less massive black holes, the detection is restricted by resolution requirements as shown in Figure 11. TMT would therefore allow us to follow the evolution of 108 M SBHs to a redshift of 0.1 (through either stellar or gas kinematics), of 109 M SBHs to z~0.4 (both through stellar and gas kinematics up to z~0.1, through gas kinematics further out), and of 1010 M SBHs throughout the Universe (through gas kinematics). Furthermore, dynamical detections of SBHs out to z=0.1 will allow a direct calibration of “secondary mass estimators” able to push SBH detections to high redshifts. Reverberation mapping (e.g. Peterson 2002) holds tremendous potential as a mass estimator, but its use is at present hindered by the lack of an independent confirmation of the SBH masses derived using the method. A dynamical detection of SBHs in reverberation-mapped AGNs (of which many examples are available within z < 0.1) would provide such confirmation, as well as offer a direct insight onto the morphology and kinematics of the Broad Line Region (Onken et al. 2004). In this regard, TMT’s contribution would be comparable to that provided by HST in anchoring the distance scale ladder, by measuring secure Cepheid distances to local galaxies, then used to calibrated further reaching distance estimators. The redshift evolution of the MBH−σ relation has been investigated up to a redshift 0.35 using Keck/LRIS (Treu et al. 2004). The current generation of ground-based telescopes is adequate for reverberation mapping studies, for which the main challenge is the ability to schedule monitoring programs, rather than resolution or light gathering capabilities.
Page 34 of 85 - 34 - Created on 2/22/2005 4:21 PM

However, TMT will be instrumental in measuring the large scale (within one effective radius) stellar velocity dispersion of high redshift bulges. TMT’s advantage is twofold: the high spatial resolution will help in preventing the AGN light from contaminating the stellar continuum of the host (the availability of a coronographic finger would further enhance this performance), and the increased collective area will aid the detection of stellar absorption lines in the low surface brightness off-nuclear regions (diffraction limited spatial resolution is not required for stellar velocity dispersion measurements on these spatial scales, therefore spatial binning is acceptable). Repeating the same exercise made in producing Figure 18, but now using the average surface brightness within one effective radius, shows that in a three hour exposure it will be possible to measure stellar velocity dispersion in bulges with effective radii as low as 1.5 kpc (expected to host SBHs of 108 M ) up to z~2.5 (provided the spectra are binned within the entire region). Not accounting for contamination from the central AGN, which would produce a considerably degraded performance, a 10 meter class telescope could only reach out to z~ 1.0. In conclusion, TMT’s resolving power and sensitivity will make it possible to break several barriers: investigate the existence of SBHs across the entire Hubble sequence, study the demography of SBHs as a function of environment, extend the SBH mass function by a factor two in MBH, extend dynamical measurements of massive (108 to 109M ) SBHs to z~0.4, and very massive (>1010 M ) SBHs throughout the Universe. It will anchor the calibration of reverberation mapping as a mass estimator, and allow investigators to study the redshift evolution of SBH scaling relations up to z~2.5. It is with TMT that the next giant leap in SBH research, comparable in magnitude to the one which followed the launch of HST, will be taken.
Page 35 of 85 - 35 - Created on 2/22/2005 4:21 PM

References: Ali, B., Sellgren, K., Depoy, D.L., Carr, J.S., Gatley, I., Merrill, K.M., \& Lada, E.\ 1998, ASP Conf. Ser. 154: Cool Stars, Stellar Systems, and the Sun, 10, 1663 Barth, A. et al. 2001, ApJ, 555, 685 Blum, R. D., Damineli, A., & Conti, P. S. 1999, AJ, 117, 1392. Blum, R. D., Conti, P. S., & Damineli, A. 2001, AJ, 121, 3149 Blum, R.~D., Conti, P.~S., Damineli, A., &; Figueredo, E. 2002, Hot Star Workshop III: The Earliest Stages of Massive Star Birth. ASP Conference Proceedings, Vol. 267. Edited by Paul A. Crowther. ISBN: 1-58381-107-9. San Francisco, Astronomical Society of the Pacific, 2002, p.283 Brandl, B., Brandner, W., Eisenhauer, F., Moffat, A.F.J., Palla, F., & Zinnecker, H. 1999, A&A, 352, L69 Bromley, J.M., Somerville, R.S., & Fabian, A.C., 2004, MNRAS, 350, 456 Davidge, Olsen, Blum, Stephens, & Rigaut 2005, AJ, 129, 201 Elmegreen, B.G. and Shadmehri, M. 2003, M.N.R.A.S. 338, 817. Emsellem, E. et al. 2004, MNRAS, 352, 721 Faber, S. M., et al. 1989, ApJS, 69, 763 Ferrarese, L. & Merritt, D. 2000, ApJ, 539 L9 Ferrarese, L., & Ford, H.C. 1999, ApJ, 515, 583 Ferrarese, L., & Ford, H. 2004, Space Science Reviews, in press (astro-
ph/0411247) Figer, D. F., Kim, S. S., Morris, M., Serabyn, E., Rich, R. M., & McLean, I. S. 1999, ApJ, 525, 750 Frogel, Stephens, Ramirez, & DePoy 2001, AJ, 122, 1896 Fukugita, M., Hogan, C.J., & Peebles, P.J.E. 1998, ApJ, 503, 518 Gebhardt, K., et al. 2000, ApJ, 539, L13
TMT_DetailedScienceCase_v7_4_modAbraham.doc- 36 - Created on 2/22/2005
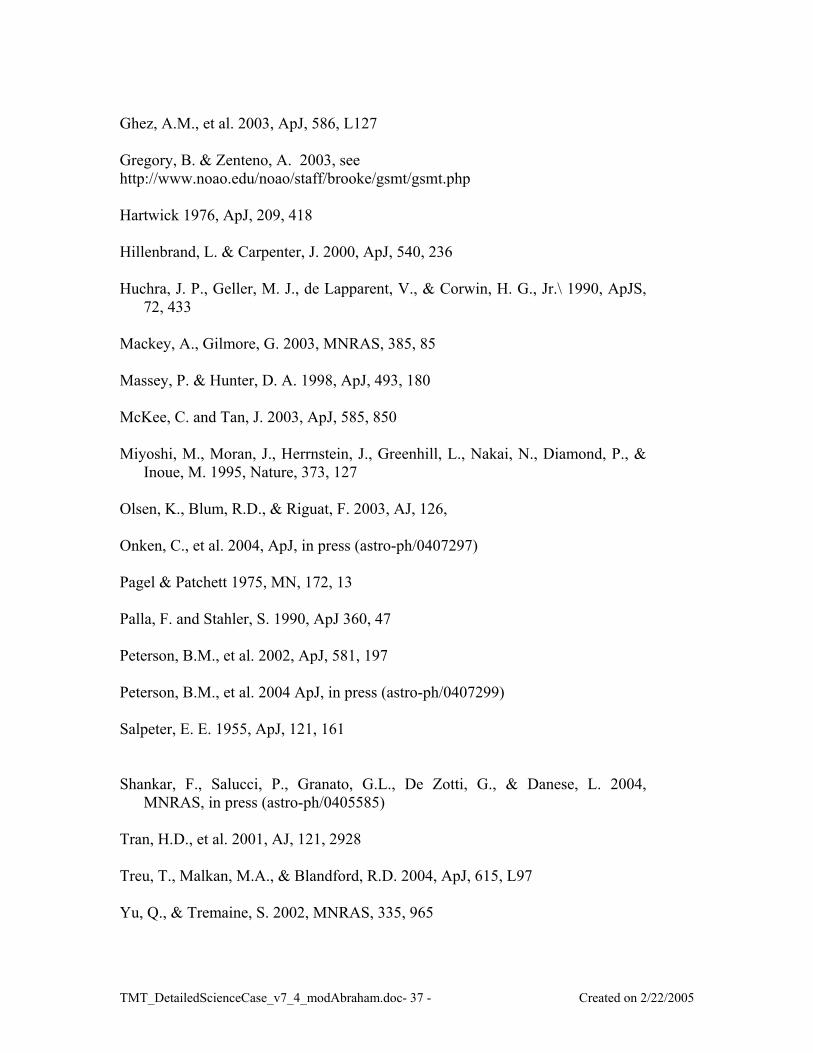
Ghez, A.M., et al. 2003, ApJ, 586, L127 Gregory, B. & Zenteno, A. 2003, see http://www.noao.edu/noao/staff/brooke/gsmt/gsmt.php Hartwick 1976, ApJ, 209, 418 Hillenbrand, L. & Carpenter, J. 2000, ApJ, 540, 236 Huchra, J. P., Geller, M. J., de Lapparent, V., & Corwin, H. G., Jr.\ 1990, ApJS,
72, 433 Mackey, A., Gilmore, G. 2003, MNRAS, 385, 85 Massey, P. & Hunter, D. A. 1998, ApJ, 493, 180 McKee, C. and Tan, J. 2003, ApJ, 585, 850 Miyoshi, M., Moran, J., Herrnstein, J., Greenhill, L., Nakai, N., Diamond, P., &
Inoue, M. 1995, Nature, 373, 127 Olsen, K., Blum, R.D., & Riguat, F. 2003, AJ, 126, Onken, C., et al. 2004, ApJ, in press (astro-ph/0407297) Pagel & Patchett 1975, MN, 172, 13 Palla, F. and Stahler, S. 1990, ApJ 360, 47 Peterson, B.M., et al. 2002, ApJ, 581, 197 Peterson, B.M., et al. 2004 ApJ, in press (astro-ph/0407299) Salpeter, E. E. 1955, ApJ, 121, 161 Shankar, F., Salucci, P., Granato, G.L., De Zotti, G., & Danese, L. 2004,
MNRAS, in press (astro-ph/0405585) Tran, H.D., et al. 2001, AJ, 121, 2928 Treu, T., Malkan, M.A., & Blandford, R.D. 2004, ApJ, 615, L97 Yu, Q., & Tremaine, S. 2002, MNRAS, 335, 965
TMT_DetailedScienceCase_v7_4_modAbraham.doc- 37 - Created on 2/22/2005

2.2 IRMOS: InfraRed MultiObject Spectrometer (Abraham)
2.2.1 Overview of capability and expected performance IRMOS will provide spatially resolved spectroscopy over multiple small (~2 arcsec) AO-corrected fields within a larger (~5 arcmin) field. Although the initial concept utilizes deployable integral-field units operating behind a “MOAO” AO system, other concepts that allow multi-object, spatially-resolved spectroscopy with a scheme for rapid reconfiguration of the targeted objects will be considered. This instrument is intended to study multiple, extended objects. For many of the anticipated science areas, the apparent size and anticipated low-surface brightness of the sources leads to a requirement for near-diffraction-limited spatial resolution: ~ 0.05 arcsec per integral-field element. Spectral resolutions between 2000 and 10000 will cover the range of science from “identification” and discovery quality spectra to the spectra required to work between the atmospheric OH lines and to make detailed determinations of physical properties of galaxies during the era of galaxy formation.
2.2.2 Overview of anticipated science areas Properties of galaxies during the era of peak star formation. One of the key science drivers for TMT is the detailed study of galaxy evolution in situ at 1<z<2.5. Something like half of all the mass in stars forms over this redshift range. Current-generation 8m-class optical/IR telescopes, and ground-based radio and sub-mm telescopes and satellites have set the stage for galaxy evolution work over 1<z<2.5, but resolved studies of galaxies at these high redshifts will only become routinely possible with IRMOS on TMT. This instrument’s unique capability to undertake highly multiplexed spectroscopic observations with both high angular and spectral resolution between 1µm and 2.5µm will allow detailed studies of chemistry, outflows, star-formation rates and kinematics to be undertaken. Properties of extremely high redshift galaxies. Although 8 and 10m telescopes will have discovered some galaxies at z>5, IRMOS will usher in the era of routine spectroscopic study of this era. Surveys for objects at these large redshifts is one of the drivers for JWST; IRMOS will provide the spectroscopy to allow astrophysical interpretation. The properties of galaxies at these redshifts, their clustering characteristics, volume density and the evolution of galaxy properties from this early era to intermediate redshifts are all areas for which little will be known until JWST and ELTs are operating. Because these objects are anticipated to be very faint, the multiplexing capabilities of IRMOS will be important for building even modest samples. The surface density of targets is unknown but is potentially very high (see figure XXX, taken from Le Delliou et al. 2004). Note that integration times will be very long and multi-object capabilities will be essential to build up meaningful samples.
TMT_DetailedScienceCase_v7_4_modAbraham.doc- 38 - Created on 2/22/2005

Observations of the optically faint extra-galactic Universe. IRMOS is anticipated to be a work-horse instrument for a wide range of programs studying extended source that are very faint in the optical. In addition to the specific cases listed above, clusters of galaxies and proto clusters at z>1, faint galaxies over a wide range of redshift which are not undergoing vigorous star-formation and dusty systems are all classes of objects for which IRMOS will provide a powerful diagnostic capability. The surface density of targets is very high: ~25 arcmin-2 to ~1µJy at 2 microns, even if we restrict consideration only to the redshift range z=1.5-3.5; these would tend to have line fluxes >10-17 ergs/s/cm2 in H-alpha (for example).
2.2.3 Specific science cases: detailed discussions
2.2.3.1 Galaxy formation at 1<z<2.5 Observational data now suggests quite strongly that the peak era for galaxy formation is the redshift range 1<z<2.5. As shown in Figure XX, about half the stellar mass seen in the current Universe formed over this redshift range. Because of band-shifting of visible-wavelength features to longer wavelengths, at 1<z<2.5 most of the best-understood and best-developed diagnostic spectral emission features fall in the near-IR. As will be described below, high angular resolution is important both for astrophysical interpretation of spectra and for reducing the brightness of the night sky background underneath each resolution element for greatly improved sensitivity. At redshifts near the peak in the cosmic star-formation activity, around half the galaxy population is morphologically peculiar. We do not know if this morphological peculiarity is due to mergers distorting the appearance of famobserving genuinely new categories of young gaIn either case, because of the inherent lack population, resolved spectroscopic observationsunderlying dynamics than long-slit observations.of nascent galaxies at 1<z<2.5 represents a kknowledge of the dynamical states of these galaxbasic questions about the nature and origin of th‘are the many linear systems that are seen edgproto-galaxies?’ Because of photon starvation,needed to understand the relationships between
TMT_DetailedScienceCase_v7_4_modAbraham.doc- 39 -
Figure XX: The mass assembly history of galaxies, characterized by the cumulative fraction of the local stellar mass in galaxies formed as a function of redshift. The curves are based upon observational measures of the evolving star-formation rate density (shown as an inset), for two different redshifts of first star formation. Note that around half the mass in stars currently existing in the universe formed over the redshift range 1<z<3.
iliar-looking systems, or because we are laxies that are rare in the local Universe. of symmetry in much of the galaxy are far more useful for disentangling Undertaking kinematical investigations ey opportunity for TMT: our present ies is essentially nil, and even absolutely is population remain wide open, such as e-on disks, or cigar-shaped collapsing
instruments such as IRMOS will be these galaxies and local galaxies, to
Created on 2/22/2005
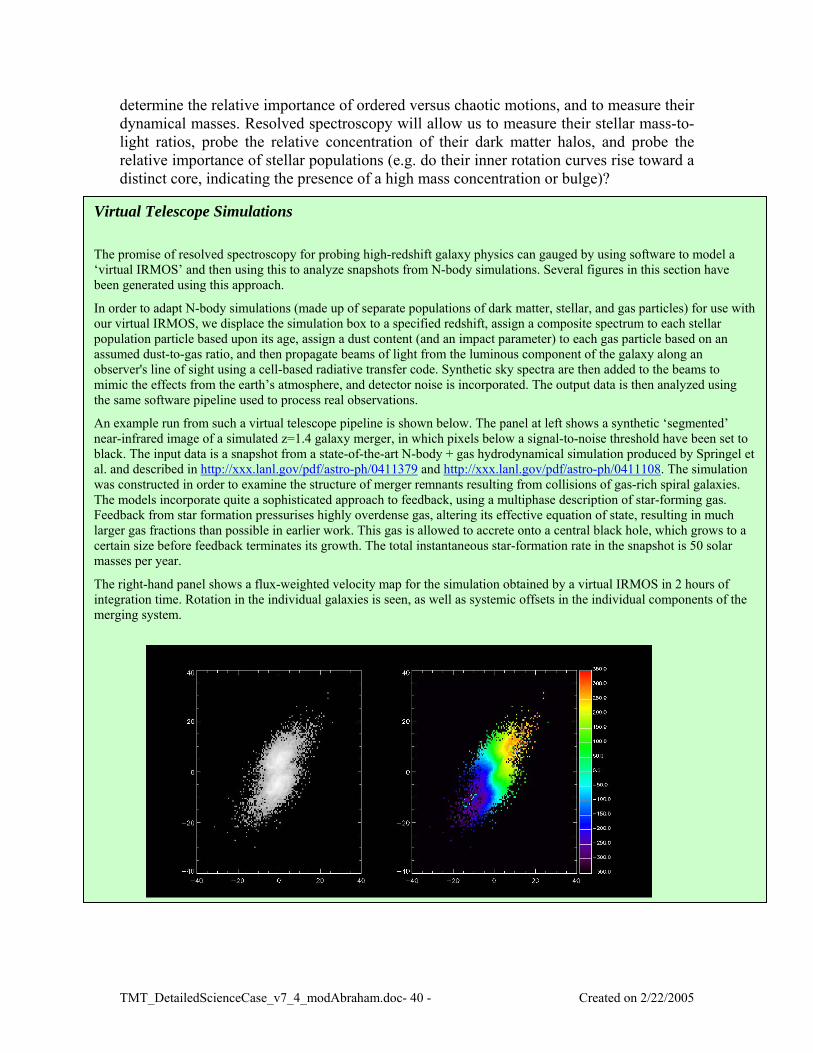
determine the relative importance of ordered versus chaotic motions, and to measure their dynamical masses. Resolved spectroscopy will allow us to measure their stellar mass-to-light ratios, probe the relative concentration of their dark matter halos, and probe the relative importance of stellar populations (e.g. do their inner rotation curves rise toward a distinct core, indicating the presence of a high mass concentration or bulge)?
Virtual Telescope Simulations The promise of resolved spectroscopy for probing high-redshift galaxy physics can gauged by using software to model a ‘virtual IRMOS’ and then using this to analyze snapshots from N-body simulations. Several figures in this section have been generated using this approach.
In order to adapt N-body simulations (made up of separate populations of dark matter, stellar, and gas particles) for use with our virtual IRMOS, we displace the simulation box to a specified redshift, assign a composite spectrum to each stellar population particle based upon its age, assign a dust content (and an impact parameter) to each gas particle based on an assumed dust-to-gas ratio, and then propagate beams of light from the luminous component of the galaxy along an observer's line of sight using a cell-based radiative transfer code. Synthetic sky spectra are then added to the beams to mimic the effects from the earth’s atmosphere, and detector noise is incorporated. The output data is then analyzed using the same software pipeline used to process real observations.
An example run from such a virtual telescope pipeline is shown below. The panel at left shows a synthetic ‘segmented’ near-infrared image of a simulated z=1.4 galaxy merger, in which pixels below a signal-to-noise threshold have been set to black. The input data is a snapshot from a state-of-the-art N-body + gas hydrodynamical simulation produced by Springel et al. and described in http://xxx.lanl.gov/pdf/astro-ph/0411379 and http://xxx.lanl.gov/pdf/astro-ph/0411108. The simulation was constructed in order to examine the structure of merger remnants resulting from collisions of gas-rich spiral galaxies. The models incorporate quite a sophisticated approach to feedback, using a multiphase description of star-forming gas. Feedback from star formation pressurises highly overdense gas, altering its effective equation of state, resulting in much larger gas fractions than possible in earlier work. This gas is allowed to accrete onto a central black hole, which grows to a certain size before feedback terminates its growth. The total instantaneous star-formation rate in the snapshot is 50 solar masses per year.
The right-hand panel shows a flux-weighted velocity map for the simulation obtained by a virtual IRMOS in 2 hours of integration time. Rotation in the individual galaxies is seen, as well as systemic offsets in the individual components of the merging system.
TMT_DetailedScienceCase_v7_4_modAbraham.doc- 40 - Created on 2/22/2005

Acdcrtgh Woid
T
Point-By-Point Chemistry
An illustration of the signal-to-noise achievable in two hours with IRMOS within small regions across the face of a simulated galaxy. The simulation shown corresponds to the merger of two disk galaxies at z=2.5,with star formation activity modulated by the effect of a central galactic nucleus which raises the specific entropy of the hot gas in the merger product. A narrow-band infrared image is shown at top. Below this is the spectrum obtained by summing all the pixels contained within the small white box near the nucleus of one of the galaxy images. The emission lines recovered are Hβ, [O III ]4959 and [O III]5007.
nice coincidence is that the spectral resolution (R~5000) required to determine galaxy hemical abundances and probe outflows, as well as to undertake kinematical mass eterminations, is about what is needed to resolve out narrow-line sky background ontamination from hydroxyl molecules in the upper atmosphere. This line emission is esponsible for the bulk of the night sky contamination between one and 1.6 microns. In he simulation above, note how the point-by-point signal-to-noise across the face of a alaxy is sufficient to determine line ratios (and by inference chemical composition) with igh signal-to-noise.
e can show via simulation (see Figures XX and XX above) that diffraction limited bservations are not necessarily optimal for dynamical work, because galaxies are nherently low surface brightness objects, and observations may become limited by etector characteristics (such as dark current) for spatial sampling finer than 0.05” at
MT_DetailedScienceCase_v7_4_modAbraham.doc- 41 - Created on 2/22/2005

Mapping Metallicity at Different Resolutions
A test of the minimum spatial resolution required to resolve the metallicity gradients produced by a hydrodynamical simulation of a young disk galaxy. The true distribution of metallicity is shown at top left, and a narrow-band infrared observation corresponding to this is shown at top right. The three panels at the bottom illustrate the distribution of [NII]/[SII] obtained at three different angular resolutions in two hours with TMT. Note that [NII]/[SII] is a robust tracer of metallicity and that the large-scale distribution of metals is recovered well at 0.05” spatial resolution, while significant artifacts emerge as the resolution is degraded.
spectral resolutions around R~5000. On the other hand, a spatial resolution sufficient to resolve bright features on the surface of the galaxies will be essential (see Figure XX below, which shows an exploration of the spatial sampling required to recover metallicity gradients). While we do not yet know what the absolutely optimal spatial sampling is for undertaking dynamical investigations (for example, it is clear from HST observations that these distant galaxies still have unresolved bright structures at resolutions of 0.1 kpc, but how these break up at higher resolution is unknown), a spatial sampling of 0.05” will be appropriate for probing large-scale metallicity gradients and spatial variations in extinction (see Figures XX and XX below). The individual exposure times for most dynamical investigations will be rather long in order to achieve the required signal-to-noise, but the target density is rather high. This is the primary motivation for the multiplexing capability of IRMOS. A target density of >30 galaxies/arcmin-2 can be expected over the redshift range 1<z<2.5, and even if we restrict consideration to quite precisely defined subsamples of interest, in most cases the advantage from multiplexing remains high. For example, one obvious set of targets will be ‘big disks’ at high redshifts. According to Labbe et al. (2003) the surface density of very large (effective radii > 0.6 ”) and very bright (rest-frame luminosities are a factor of three brighter than typical Sc galaxies) galaxies with clear disk-like is about one per square arcmin between 1.4<z<3 down to K=22.
2.2.3.2 Studies of extremely high redshift galaxies. Progress over the past two years hints that we may be closing in on a population of young galaxies at redshifts which make them prime candidates for being the sources of cosmic reionization. Photometric redshift analyses of the Hubble Ultra-Deep Field (HUDF), and other deep HST data, has uncovered an abundant population of candidate z~6 objects at z'<28.5 mag (Bunker et al. 2004, Bouwens et al. 2004). This result comes hard on the heels of deep narrow-band imaging surveys which have revealed tantalizing evidence of a
TMT_DetailedScienceCase_v7_4_modAbraham.doc- 42 - Created on 2/22/2005

first population of star-forming galaxies at z>6 (Hu et al. 2002, Kodaira et al. 2003, Rhoads et al. 2003). While these observations set the stage for the exploration of the z>6 Universe, it is already clear that existing facilities have simultaneously hit the walls of photon starvation and poor existing near-IR spectrographs, and the near-IR capability of IRMOS coupled to a 30m-class facility is needed for a true exploration of the sources of reionization. For example, to date only a few objects have had Lyman alpha at z>6 spectroscopically confirmed, and it is likely that the only objects being picked up are the subset of very active star-forming objects with little dust obscuration. Early results from the HUDF (and based largely on uncertain photometric redshifts) report a sharp decline in star-formation history between z=3 and z=6 (Bunker et al. 2004). The comoving star formation rate contributed by galaxies with L_UV>0.1 L* drops a factor of six from z=3 to z=6 and at this level these objects contribute too few UV photons to reionize the Universe. This short-fall in ionizing photons might be accounted for by a very abundant population of undetected faint galaxies, or by a radically top-heavy stellar initial mass function. However, another very real option is that reionization might have occurred at z>6 as suggested by WMAP observations. Very little guidance can be gleaned from theoretical work on the abundance of very high-redshift sources. As shown below, even the best of the current models predicts source densities that vary by an order of magnitude depending on assumptions made regarding photon escape fraction, dust models, and the initial mass function. Clearly this is an area of astrophysics that will continue to be dominated by observations. Without a proper census of these systems, and more specifically a luminosity function which maps out the contribution fainter galaxies make to the UV background, it is unclear how closely related these brighter systems are to the true sources of reionization. Such work will rely heavily on the multiplexing capability of IRMOS. The resolved mapping capability of IRMOS will also allow searches for high-redshift systems to efficiently target the caustics of foreground lenses in order to take advantage of lensing amplification to detect fainter sources. This strategy has already resulted in an apparent success, the z ~ 7 galaxy detected by Kneib et al. (2004) behind Abell 2218. (In fairness, the same strategy has also resulted in an apparent false alarm, the z~10 system reported by Pello et al. 2004, which proved to be an artifact). Given the relatively modest effort expended in looking, it is difficult to understand how the z ~ 7 object reported by Kneib et al. (2004) fits into the picture of a rapidly declining co-moving star-formation rate, because the volumes probes by searches along caustics are much smaller than those probed by narrow band surveys (Hu et al. 1998, Malhotra et al. 2001, Hu et al. 2003), or the color-based dropout surveys described earlier. However, if the volume density of background sources is high (Santos et al. 2003), the lensing boost may well provide an efficient means for obtaining a glimpse of the first galaxies forming beyond z >7, and allow IRMOS to probe very far down the luminosity function of the earliest galaxies. In any case, it is clear that observations that go deeper than current data, and which probe to higher redshifts, are needed to make major progress in determining the sources of reionizing photons in the early universe, and that IRMOS stands poised to make a major contribution to our understanding of the the space density of very high redshift systems.
TMT_DetailedScienceCase_v7_4_modAbraham.doc- 43 - Created on 2/22/2005

Figure XXX: The predicted counts of Lyman-alpha emitting galaxies, plotted in different redshift intervals, from Delliou et al. 2004. The various panels show the impact of varying the input parameters in the model, such as the escape fraction, dust model, redshift of reionization, and cosmological density parameter.
2.3 WFOS: Wide Field Optical Spectrometer 2.3.1 Overview of capability, expected performance and science areas
WFOS is a wide-field faint-object spectrometer intended for low to intermediate spectral resolution observations of extremely faint objects at wavelengths from the atmospheric UV cutoff at 0.31µm to at least 1.0µm . Because of its broad scientific capabilities it is one of the highest priority capabilities for TMT and one of the first instruments that will be commissioned. WFOS will allow routine spectroscopic observations of very faint sources, from the local universe to redshifts z~7 and beyond. Given the improved light collecting power of
TMT_DetailedScienceCase_v7_4_modAbraham.doc- 44 - Created on 2/22/2005

TMT of a factor of 10-20 over existing 6.5-10m telescopes, it will allow quantitative diagnostic spectroscopy of objects which, at present, can only be crudely identified, and identification quality spectra of sources which are currently completely out of reach. The surface density of sources within spectroscopic reach of WFOS is extremely high-- more than 106 per square degree in a typical field at high galactic latitude. The need for observations over appreciable volumes of space and using large samples for many scientific problems drives a requirement for a large addressable field with a high multiplexing factor; however, it is essential for WFOS to maintain the aperture advantage of TMT compared to existing facilities. Whereas the highest sensitivity will make possible fundamentally new survey programs, examples of which are outlined below, WFOS will often be the instrument of choice for the spectroscopic identification and characterization of rare phenomena and new discoveries from both TMT and other future observatories. Such programs may not always benefit from massive multiplexing, but they certainly depend on the largest possible (simultaneous) spectral coverage and the highest possible throughput. As discussed below, the requirement for performance of WFOS down to the atmospheric cutoff at ~0.31 µm is driven science that takes advantage of the extremely low terrestrial background in the UV/blue, and which needs access to the rich astrophysics accessible in the rest-frame far- to near-UV for objects from z~0-3. The lack of any planned UV spectroscopic capability in space during at least the initial years of the TMT era makes the WFOS near-UV capability still more compelling (see appendix 1). Traditionally, optical spectrographs have been designed to work to a long wavelength limit of ~1µ, primarily because of the precipitous drop in the quantum efficiency of Si CCD detectors rather than for scientific reasons. In fact, spectral sensitivity beyond 1µm with large multiplex gains is required for gaining access to the astrophysics of objects which have little or no flux at shorter wavelengths; such objects include low-mass stars, massive galaxies at z~2, and z>6 galaxies and AGN. Thus, there is strong scientific impetus to extend the long-wavelength limit of WFOS to the point that thermal background in a non-cryogenic instrument compromises sensitivity (~1.5-1.6 µm). The range of spectral resolution is specified to allow “identification” quality spectra for the faintest sources at the low end and to allow detailed astrophysical diagnostics (e.g. kinematics of low-mass galaxies, chemistry and kinematics from interstellar absorption line features in galaxy and AGN spectra, abundances for many elements in stellar spectra) at the high-R end. The high-resolution mode is also required for effective background (OH) suppression for wavelengths longward of 0.73 µm. Most scientific programs will be focused on a subset of the wavelength range of the instrument; e.g., 0.3-0.6 µm, 0.5-1.0 µ, 0.8-1.5 µm and thus optimization of the instrument modes for performance over ~1 octave must be achieved. However, WFOS designs that can achieve simultaneous spectral coverage over larger wavelength ranges are encouraged. As a faint object spectrometer on the largest ground-based telescope, WFOS will unquestionably be used to address science that is currently unforeseen.
TMT_DetailedScienceCase_v7_4_modAbraham.doc- 45 - Created on 2/22/2005

However, we outline some key science areas and observing programs that have driven the WFOS requirements discussed above.
2.3.2 Specific science cases 2.3.2.1 Baryonic Structure in the High Redshift Universe
Large galaxy surveys of the relatively local universe, encompassing volumes of ~108 Mpc3 and including hundreds of thousands of galaxies, have recently been achieved using wide-field spectrographs on 4m-class telescopes. These surveys have produced a wealth of information on the large-scale structure of the universe, the demographics of present-day galaxies, and their environmental dependence. A key to the power of these surveys has been the fact that the survey spectra have been of high enough quality to extract considerably more than a redshift. In parallel with these fundamental surveys rooted firmly at the present epoch, we have gained tremendous insight into the history of galaxy formation through surveys at high redshifts and inferences from the “fossil record” . We now see that the present-day universe was shaped by events that occurred primarily in the redshift range z=1-5 (corresponding to look-back times of 8-12.5 Gyr), which some have called the “epoch of galaxy formation”. While the cosmological community has converged on a theoretical framework for structure formation that generally works well to account for the large-scale distribution of matter, depending only on gravity, we have seen that understanding galaxy formation and its connection to large scale structure is considerably more complex. The reason for the added complexity is that the distribution and state of baryons are strongly influenced by processes that are difficult to model, many of which are currently very poorly constrained by observations. Learning more requires direct observations of the epoch when these processes were most important. Fortunately, TMT+WFOS will make possible surveys of the young universe that will be capable of observing these complex processes during exactly the cosmic era when they had their strongest influence, z~1.5-4. The program we outline will be capable not only of tracing the distribution of galaxies in the young universe, but also the distribution and state of the intergalactic gas which provides the dominant reservoir for feeding the process of galaxy formation. This aspect of the survey—that it traces both the galaxies and the IGM during the most crucial era for galaxy formation -- is completely unique and depends on access to the rest-frame far-UV spectra of galaxies and AGN that are redshifted into the WFOS spectral range for z>1.6. It will provide, arguably, a much more complete census of baryonic material in the universe than any other survey, at any redshift. The basic idea is illustrated schematically in figure 19. Most of the baryons in the universe are believed to be distributed in a complex network of filamentary structure, most of which is at too low a density contrast to produce galaxies, in which hydrogen is mostly ionized by the UV radiation field produced by massive stars and AGN in galaxies. The trace amount of HI in the IGM produces the “Lyman α forest” in the spectra of background sources that have been studied along relatively rare lines of sight to bright QSOs. Because HI column densities as small as ~1012 atoms cm-2 can easily be seen in absorption against background sources, it is possible to use observations of the Lyman α
TMT_DetailedScienceCase_v7_4_modAbraham.doc- 46 - Created on 2/22/2005

forest to trace the baryonic distribution in structure with low enough density contrast that it still accurately reflects the linear power spectrum of density fluctuations on small scales that cannot be observed in any other way. Thus, a high quality rest-frame far-UV spectrum of a QSO yields a very accurate one-dimensional map of the HI distribution along the line of site, which in low density contrast regions is easily converted into a 1-D
minsig Foexsukeanfofuanth Winof
TM
Figure 22: The “cosmic web” of the baryon distribution in a cosmological simulation, where HI in the IGM traces the dark matter distribution even in regions with low density contrast. A line of sight through the volume yields a one-dimensional map of both the HI and metallic species along the line of sight, as shown in the righthand panel. Regions disturbed by galaxy formation processes are schematically indicated. In such regions, sightline probes will reveal the extent to which galaxies alter the physical state of the IGM: their sphere of influence, mass outflow, ionization effects, deposition of mechanical energy, etc. Densely sampled sightlines through a survey volume, together with detailed maps of the galaxy distribution, will provide unprecedented views of the distribution of baryons in the Universe, and their relation to the sites of galaxy formation.
ap of the matter density. As illustrated in figure 20, the 1-D sampling also contains formation on the distribution of metals as a function of redshift along the same line of ht.
rming galaxies and AGN accretion energy disturb this simple IGM laboratory, to an tent that is currently unknown; yet, understanding how energy “feedback” from pernovae and AGN in galaxies impacts the large-scale and small-scale environment is y to a detailed understanding of galaxy formation. These processes control the heating d cooling of baryons (and thus are directly responsible for modulating galaxy-scale star rmation) both in the galaxy and in the nearby IGM; they probably also control the ture path of the galaxy formation process after these energetic processes have ceased, d they almost certainly are responsible for depositing heavy elements into the IGM and e (future) ICM.
e expect that the baryonic “system” of galaxies and the IGM may resemble the cartoon figure 19, where in regions far from galaxies, the IGM provides an accurate reflection the matter distribution, whereas on scales near galaxies, it provides a laboratory for
T_DetailedScienceCase_v7_4_modAbraham.doc- 47 - Created on 2/22/2005

measuring the local disturbances caused by the galaxy formation process. We know from spectral evidence (see figure 20) that vigorously star forming galaxies at both low and high redshift produce strong outflows of interstellar material via winds driven by rapid supernova explosions and AGN outbursts; at high redshifts (z~2-5) such “superwinds” are ubiquitous. The physics of these outflows are not well understood, and their large-scale effects are unknown, although preliminary evidence suggests that they may affect surprisingly large regions of the IGM. Historically, the spectra of QSOs have been the only available means to study the IGM at high redshifts, since they have been the only suitably bright background source. The problem is that bright QSOs are rare, and so information on the IGM is difficult to extend to three dimensions. The situation is very different when the light-gathering power of
TMT is brought to bear on the problem. While the surface density of QSOs with apparent magnitudes suitable for IGM studies increases significantly, the space density of compact, UV-bright star forming galaxies at apparent magnitudes capable of yielding very high quality spectra easily overtakes QSOs as background sources. By R~24 (~1µJy), approximately the apparent magnitude at which TMT+WFOS can obtain a spectrum at R~6000 with S/N~30, galaxies in the appropriate redshift range (z=1.8-4) outnumber QSOs by more than a factor of 30. More importantly, the surface density of useable background sources increases by more than 2 orders of magnitude over the current situation for 8m-class telescopes, exceeding 1.2 arcmin-2 . This means that the IGM
pme
T
Figure 23: Spectra illustrating the quality expected for R~24 galaxies at R=5000 using WFOS. The spectra shown are portions of a real spectrum of the z=2.73 gravitationally-lensed object cB58. This spectrum has been used to obtain the chemical abundances of 6 elements, to place constraints on the high-mass end of the stellar initial mass function, to show that superwinds are driving interstellar material out of the galaxy at velocities up to 1000 km s-
1,and to estimate the mass outflow rate. Some of the many interstellar and stellar lines are indicated. Note the presence of the Lyman α forest over the redshift range 1.63-2.0 in the bottom spectrum.
roperties can be densely sampled on physical scales of <500kpc, approximately the aximum sphere of influence of individual galaxies on the IGM and comparable to the
xpected coherence length of the undisturbed IGM. Thus, the 3-D IGM can be
MT_DetailedScienceCase_v7_4_modAbraham.doc- 48 - Created on 2/22/2005
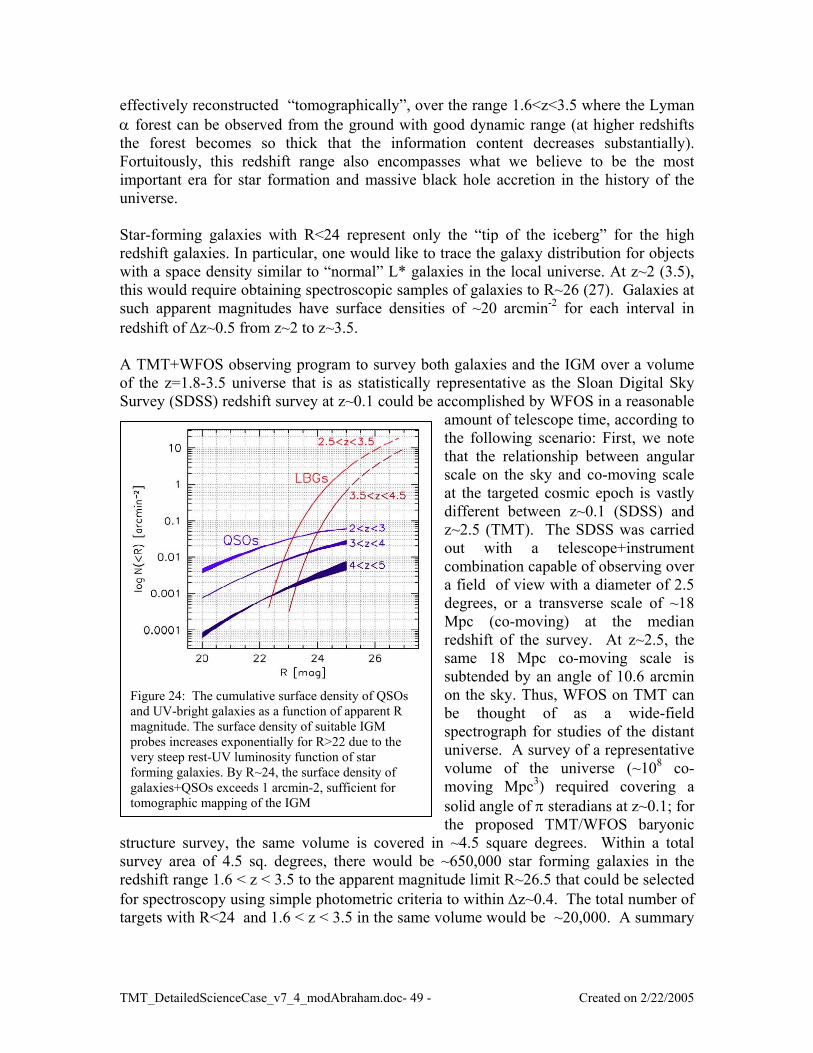
effectively reconstructed “tomographically”, over the range 1.6<z<3.5 where the Lyman α forest can be observed from the ground with good dynamic range (at higher redshifts the forest becomes so thick that the information content decreases substantially). Fortuitously, this redshift range also encompasses what we believe to be the most important era for star formation and massive black hole accretion in the history of the universe. Star-forming galaxies with R<24 represent only the “tip of the iceberg” for the high redshift galaxies. In particular, one would like to trace the galaxy distribution for objects with a space density similar to “normal” L* galaxies in the local universe. At z~2 (3.5), this would require obtaining spectroscopic samples of galaxies to R~26 (27). Galaxies at such apparent magnitudes have surface densities of ~20 arcmin-2 for each interval in redshift of ∆z~0.5 from z~2 to z~3.5. A TMT+WFOS observing program to survey both galaxies and the IGM over a volume of the z=1.8-3.5 universe that is as statistically representative as the Sloan Digital Sky Survey (SDSS) redshift survey at z~0.1 could be accomplished by WFOS in a reasonable
amount of telescope time, according to the following scenario: First, we note that the relationship between angular scale on the sky and co-moving scale at the targeted cosmic epoch is vastly different between z~0.1 (SDSS) and z~2.5 (TMT). The SDSS was carried out with a telescope+instrument combination capable of observing over a field of view with a diameter of 2.5 degrees, or a transverse scale of ~18 Mpc (co-moving) at the median redshift of the survey. At z~2.5, the same 18 Mpc co-moving scale is subtended by an angle of 10.6 arcmin on the sky. Thus, WFOS on TMT can be thought of as a wide-field spectrograph for studies of the distant universe. A survey of a representative volume of the universe (~108 co-moving Mpc3) required covering a solid angle of π steradians at z~0.1; for
ssrft
T
Figure 24: The cumulative surface density of QSOs and UV-bright galaxies as a function of apparent R magnitude. The surface density of suitable IGM probes increases exponentially for R>22 due to the very steep rest-UV luminosity function of star forming galaxies. By R~24, the surface density of galaxies+QSOs exceeds 1 arcmin-2, sufficient for tomographic mapping of the IGM
the proposed TMT/WFOS baryonic tructure survey, the same volume is covered in ~4.5 square degrees. Within a total urvey area of 4.5 sq. degrees, there would be ~650,000 star forming galaxies in the edshift range 1.6 < z < 3.5 to the apparent magnitude limit R~26.5 that could be selected or spectroscopy using simple photometric criteria to within ∆z~0.4. The total number of argets with R<24 and 1.6 < z < 3.5 in the same volume would be ~20,000. A summary
MT_DetailedScienceCase_v7_4_modAbraham.doc- 49 - Created on 2/22/2005
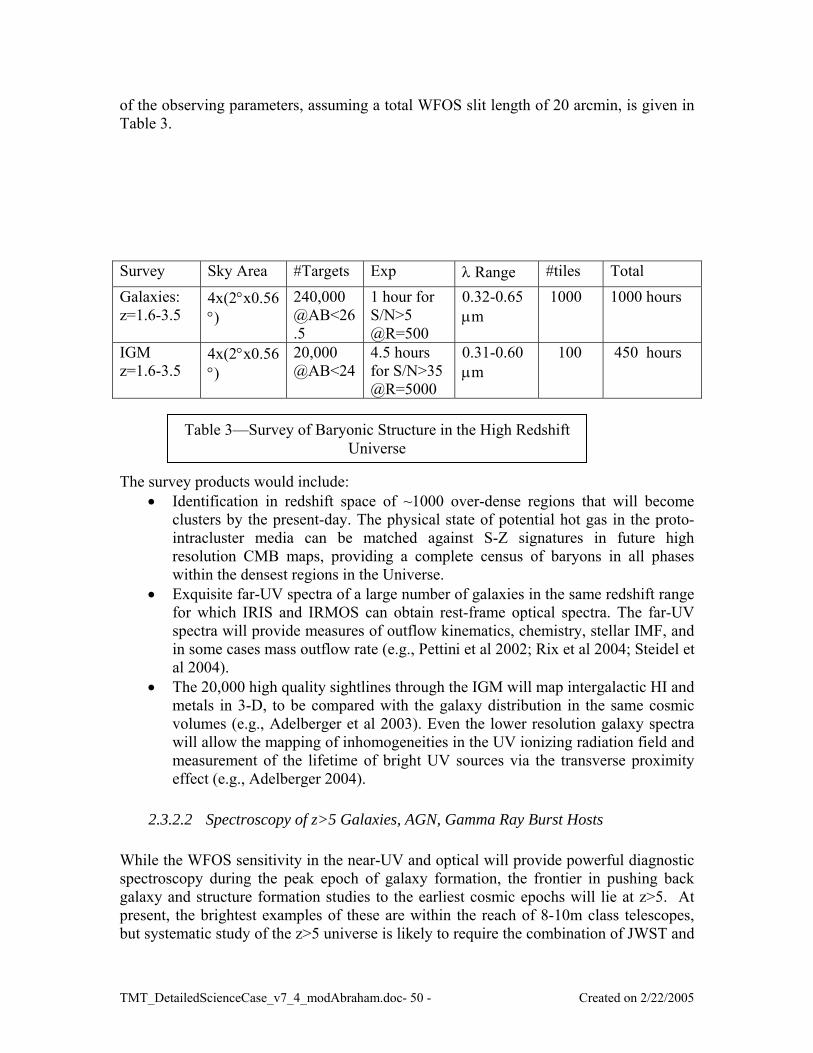
of the observing parameters, assuming a total WFOS slit length of 20 arcmin, is given in Table 3. Survey Sky Area #Targets Exp λ Range #tiles Total Galaxies: z=1.6-3.5
4x(2°x0.56°)
240,000 @AB<26.5
1 hour for S/N>5 @R=500
0.32-0.65 µm
1000 1000 hours
IGM z=1.6-3.5
4x(2°x0.56°)
20,000 @AB<24
4.5 hours for S/N>35 @R=5000
0.31-0.60 µm
100 450 hours
Table 3—Survey of Baryonic Structure in the High Redshift
Universe The survey products would include:
• Identification in redshift space of ~1000 over-dense regions that will become clusters by the present-day. The physical state of potential hot gas in the proto-intracluster media can be matched against S-Z signatures in future high resolution CMB maps, providing a complete census of baryons in all phases within the densest regions in the Universe.
• Exquisite far-UV spectra of a large number of galaxies in the same redshift range for which IRIS and IRMOS can obtain rest-frame optical spectra. The far-UV spectra will provide measures of outflow kinematics, chemistry, stellar IMF, and in some cases mass outflow rate (e.g., Pettini et al 2002; Rix et al 2004; Steidel et al 2004).
• The 20,000 high quality sightlines through the IGM will map intergalactic HI and metals in 3-D, to be compared with the galaxy distribution in the same cosmic volumes (e.g., Adelberger et al 2003). Even the lower resolution galaxy spectra will allow the mapping of inhomogeneities in the UV ionizing radiation field and measurement of the lifetime of bright UV sources via the transverse proximity effect (e.g., Adelberger 2004).
2.3.2.2 Spectroscopy of z>5 Galaxies, AGN, Gamma Ray Burst Hosts
While the WFOS sensitivity in the near-UV and optical will provide powerful diagnostic spectroscopy during the peak epoch of galaxy formation, the frontier in pushing back galaxy and structure formation studies to the earliest cosmic epochs will lie at z>5. At present, the brightest examples of these are within the reach of 8-10m class telescopes, but systematic study of the z>5 universe is likely to require the combination of JWST and
TMT_DetailedScienceCase_v7_4_modAbraham.doc- 50 - Created on 2/22/2005

TMT. The same diagnostic spectral features discussed in the context of the z=1.6-3.5 universe (primarily in the range of rest wavelengths 120-200 nm) are placed at observed wavelengths of 0.72-1.2 µm at z=5, and at 0.96-1.6 µm at z=7, a redshift range bracketing the era that is (based on current information) likely to harbor the era when stars and AGN in young galaxies reionized the IGM (e.g., Fan et al 2000) and when the first massive galaxies in the densest regions of the universe are likely to be forming. Even at R>5000, the Lyman α forest at z>5 is extremely thick, but patchy reionized regions will be recognizable, and through simultaneous spectroscopy of many background sources, even very faint ones, it will be possible to map out the 3-D process of reionization and correlate the reionized regions with sources of ionizing photons. In addition, low ionization metal lines just longward of Lyman α (particularly OI 1302) will provide much higher dynamic range measurements of the HI optical depth (modulo the IGM metallicity) (Oh 2002) and R~5000 is required for accurate measurements of the column densities of such ions. Very bright probes of the z~5-7 era are known to be relatively rare (e.g., Dickinson et al 2004), although it is quite likely that technology for fast localization of GRB afterglows (or other exotic and energetic phenomena in the high redshift universe that are as-yet unknown) may allow rapid-response TMT spectroscopy of very bright background objects. However, TMT+WFOS, if WFOS can be operated to wavelengths well beyond 1µ with R>5000, will be capable of obtaining high enough quality spectra that the reionization era and the sources of UV photons will be not only identified, but studied in some detail. Rest-frame optical nebular spectroscopy of the same objects using JWST would clearly be complementary and straightforward (e.g., Hα appears at 3.9--5.3µm for z~5-7). If partial image correction at ~0.8-1.5 µm wavelengths is feasible for WFOS, it should be possible to use apertures as small as ~0.3 arcsec without substantial loss of light for typical objects at z>5. At R>5000, the inter-OH background is reduced by a factor of ~100-200 compared to the broad-band background, so that the effective background in the J band window could be reduced to AB~21 per arcsec2, approximately the equivalent of the optical V band. TMT+WFOS could then obtain spectra with S/N=10 per resolution element for objects with AB=26.5 in 8 hours of integration. Based on small regions observed with HST (to be greatly improved upon either using wide field near-IR imagers in space and/or by JWST) the surface density of sources at z~6±1 will be ~1 arcmin-2 to AB(1µm)=27 (Yan & Windhorst 2004; Bunker et al 2004). Assuming a total addressable field of 75 arcmin2, approximately 50 objects could be observed simultaneously, making the total integration time of ~30 hours required for S/N~20 spectra palatable. Each pointing of WFOS would provide maps, over ~20-30 Mpc (co-moving) scales, of optically thin regions of the IGM (from the spectral region shortward of Lyman α), together with spectra suitable for chemical and kinematic analysis of the galaxies themselves and the opacity/metallicity of the increasing optically thick IGM. At the same time, additional apertures could be placed on much fainter galaxies at the same redshifts, providing identification-quality spectra (and high S/N Lyman α emission line profiles) throughout the same volume, with sensitivity rivaling or exceeding that of JWST, together with the spectral resolution needed for astrophysical interpretation.
TMT_DetailedScienceCase_v7_4_modAbraham.doc- 51 - Created on 2/22/2005

2.3.2.3 Elliptical Galaxy Dynamics with WFOS (P. Cote, NRC/HIA/DAO) While our knowledge of the dark matter distribution within galaxies has improved dramatically during the era of 8-10m telescopes, spiral galaxies have continued to receive a disproportionate share of the attention. This is understandable since acquiring the data needed to model the mass distribution within elliptical galaxies — which are as common as spirals — poses a far greater observational challenge. Since ellipticals contain little or no cold gas, probing their large-scale mass distribution usually involves measuring radial velocities for discrete test particles (such as planetary nebulae or globular clusters) orbiting in the galaxy's gravitational potential. Studies to date have painted a confusing picture, with some galaxies appearing to be dark matter dominated at R ~ Re, and others showing little or no evidence for dark matter out to ~ 4Re (see, e.g., Napolitano et al. 2004). At present, radial velocity samples of 250 or more globular clusters have been accumulated for just three galaxies: M87, M49 and NGC 1399. These were obvious first targets for multi-object spectrographs on 8m-class telescopes since they are the nearest ellipticals with rich globular cluster systems. But for these same reasons, they constitute a biased sample in terms of luminosity and environment: i.e., they are among the brightest galaxies in the Local supercluster and occupy unique locations in the highest density regions of the Virgo and Fornax Clusters. The WFOS instrument promises to revolutionize our understanding of the dynamics of elliptical galaxies and their globular cluster systems. Radial surveys of globular clusters in the Virgo galaxies M87 and M49 — carried out primarily with Keck and LRIS — have yielded radial velocities for 250–300 clusters brighter than V ~ 22.7 in each galaxy (e.g., Côté et al. 2003). Since the globular clusters in elliptical galaxies have a near-Gaussian magnitude distribution, with MV = -7.4 and σ ~ 1.4, we expect the turnover of the globular cluster luminosity function to occur at V ~ 23.8 at the distance of the Virgo Cluster — the nearest large collection of elliptical galaxies. This demonstrates that radial velocity surveys to date have sampled only a tiny fraction of the cluster luminosity function. As we show below, radial velocity measurement for globular clusters as faint as V ~ 25 should be routine with TMT+WFOS. As a result, it will soon be possible to accumulate enormous samples of radial velocities for the globular cluster systems of luminous galaxies such as M49 and M87. Moreover, TMT will enable astronomers to measure, for the first time, radial velocities for large numbers of globular clusters belonging to ellipticals of intermediate luminosity. The table below compares the number of elliptical galaxies from the Nearby Galaxies Catalog (Tully 1988) for which radial velocity surveys to a limiting magnitude of Vlim = 22.7 would yield minimum radial velocity samples of 250 and 1000 globular clusters. With a sample of 250 velocities, it is possible to measure the exponent governing the dark matter density falloff to a precision of ±0.4 under the assumption of isotropy; with 1000 velocities, one can measure the dark matter density profile to this precision and solve for the velocity anisotropy of the globular cluster system (e.g., Merritt & Tremblay 1993). Table 1 shows that, at the present time, samples of this size can be collected for 18 and 3 ellipticals, respectively. As expected, the absolute magnitudes MB of these galaxies are
TMT_DetailedScienceCase_v7_4_modAbraham.doc- 52 - Created on 2/22/2005 4:21 PM

heavily skewed toward high luminosity. On the other hand, with the limiting magnitude of Vlim ~ 25.5 expected for WFOS (see below), we find samples of 179 and 49 galaxies. The final column of Table 1 gives an estimate of the mean projected central velocity dispersion in those galaxies with 250 or more velocities. If we require that the uncertainties on individual velocity measurements to be no more than ~ 1/10th the intrinsic velocity dispersion, an observing program of this sort would therefore require a minimum spectral resolution of R ~ 1500 (assuming it is possible to centroid on the peak of the cross correlation function to within 0.1 resolution elements). Vlim (mag)
Ngc> 250 MB (mag)
Ngc> 1000 MB (mag)
<σ0> (km/s)
22.7 18 -21.8 to –19.2 3 -21.8 to –21.0 203± 34 25.5 179 -21.8 to –18.6 49 -21.8 to –20.3 163± 28 For the brightest galaxies, observations with WFOS would allow not only a comprehensive study of the dark matter distribution within elliptical galaxies, but would make it possible to carry out the first-ever investigation of how globular cluster orbital properties depend on galaxy properties, local environment, cluster age and chemical abundance. As a demonstration, we consider a hypothetical observing program to measure the orbital properties of globular clusters in M49. Although we consider the specific case of globular clusters, the lessons learned here apply equally well to the general class of observational programs that rely on radial velocity measurements of discrete test particles to probe the mass distribution within galaxies or galaxy clusters (e.g., the dynamics of galaxies from planetary nebulae and/or RGB stars, or cluster dynamics from dwarf galaxies, etc). Our calculations assume dark sky conditions, a spectral resolution of 6Å, a FWHM of 0.5˝, 0.15˝ pixels, 0.6˝ slits, a system throughput of 30%, and a slit density comparable to those achieved by the current generation of multi-object spectrographs on 8m-class telescopes: 3 slits per arcmin2. It is also assumed a globular cluster's velocity can be measured to a precision of 0.1 resolution element (±35 km/s) if the average signal-to-noise ratio per resolution element over the range 0.45–0.55 µm is S/N > 20 in an integration of 5400 seconds per mask. While the amount of observing time needed to execute the program will depend on the WFOS field of view, we conservatively estimate a total on-source integration time of ~30 hours.
TMT_DetailedScienceCase_v7_4_modAbraham.doc- 53 - Created on 2/22/2005 4:21 PM

The dashed curve in the upper panel of Figure 1 shows the actual globular cluster
lumdctenc
T
Figure 25: (Upper Panel) Input luminosity function of globular clusters belonging to M49 (dashed curve). The open histogram shows the luminosity function of the 2550 clusters with measured velocities in this simulated WFOS program. The luminosity function of the 263 clusters with existing velocity measurements — collected during two weeks of observing time with the CFHT, WHT and Keck telescopes — is shown as the shaded histogram. (Lower Panel) A simulated measurement of the anisotropy parameter, β, for the globular cluster system of M49. Different anisotropy parameters are shown by the different curves, from strongly radial (β = +0.99, upper curve), to strongly tangential (β= -99) orbits. The measured velocity dispersion profile recovers the assumed isotropic velocity distribution with high confidence.
minosity function for M49. The distribution of clusters with simulated radial velocity easurements is shown by the open histogram. For comparison, the luminosity
istribution of globular clusters with measured radial velocities — taken from the ompilation of Côté et al. (2003) and based on observations with CFHT, WHT and Keck lescopes — is shown by the shaded histogram. With an investment of roughly four ights of WFOS observing time, it will be possible to measure radial velocities for ~2500 lusters, a 10-fold increase over the current sample.
MT_DetailedScienceCase_v7_4_modAbraham.doc- 54 - Created on 2/22/2005 4:21 PM

With a sample of this size, it will be possible to measure not just the dark matter density profile, but also to solve for the cluster orbital properties. For instance, in our simulations, we have assumed an isotropic velocity dispersion tensor (β = 0) and adopted a two-component mass model for M49: a constant mass-to-light ratio ΥV = 5.9 in solar units for the galaxy itself and a surrounding NFW dark halo. The normalization of the two components has been chosen to give consistency with integrated-light stellar kinematical data in the galaxy core and X-ray mass measurements at large radii. As the lower panel of Figure 1 shows, observed velocity dispersion profile gives β = 0 with high confidence and rules out even marginally radial or tangential orbits. References Côté, P., McLaughlin, D.E., Cohen, J.G., & Blakeslee, J.P. 2003, ApJ, 591, 850 Merritt, D., & Tremblay, B., 1993, AJ, 106, 2229 (C03) Tully, B. 1988, Nearby Galaxies Catalog (Cambridge: Cambridge University Press).
TMT_DetailedScienceCase_v7_4_modAbraham.doc- 55 - Created on 2/22/2005 4:21 PM

2.4 MIRES: Mid-InfraRed Echelle Spectrometer
2.4.1 Overview of capability and expected performance MIRES is a high-spectral-resolution (R~100,000) instrument operating at the diffraction limit of the telescope in the mid-IR and must have high sensitivity and operational efficiency to achieve its science goals. This instrument will be one of the first instruments commissioned on the telescope. It will be fed by, or incorporate, a mid-IR AO system (MIRAO) using both natural (initially) and laser guide stars to deliver diffraction-limited images. It is desirable (goal) that this instrument can also serve as a mid IR imager.
2.4.2 Overview of anticipated science areas • Dissipation timescales for gas in terrestrial and giant planet regions of planet-
forming disks. Measurements of the gas content in disks around stars covering a range of ages and environments will be used to trace the evolution of the planet-forming environment. Diagnostic lines are H2S (12.4 and 17.0µm) and [Fe I] (24.3µm) and typical source flux levels are 10-17erg/s/cm. High spectral resolution is required for sensitivity.
• Identification of forming planets during the disk accretion phase. High spectral
resolution observations can be used to infer the presence of gaps in circumstellar disks cause by the formation of giant planets. This indirect determination requires measurement of spectral lines sensitive to a range of temperature in the stellar disks. CO (4.6µm) and H2S (12µm, 17µm) will be target transitions.
• The structure and kinematics of infalling envelopes of protostars. MIRES
observations at R~100,000 will be used to investigate the complex interactions that occur as a protostar evolves into a star+disk system with associated infall of material leading to growth in the star’s mass and the launching of the collimated outflows seen most spectacularly as Herbig-Haro objects. Here the high spatial resolution of the TMT at the diffraction limit is crucial as is the sensitivity at high spectral resolution.
2.4.3 Specific science cases 2.4.3.1 Dissipation timescales for gas in terrestrial and giant planet regions of
planet-forming disks. The timescale for dissipation of gas in circumstellar disks governs the viability of plausible giant planet formation mechanisms and consequently, the range of giant and terrestrial planet architectures. Moreover, the persistence of gas in the terrestrial planet region of the disk also affects the masses, eccentricities and consequently the habitability of terrestrial planets. At present, there appear to be two viable paths for the formation of giant planets: (1) rapid formation (t < 1 Myr) via gravitational instabilities in a massive circumstellar
TMT_DetailedScienceCase_v7_4_modAbraham.doc- 56 - Created on 2/22/2005 4:21 PM

accretion disk; and (2) relatively slow formation (t ~ 10 Myr) via (a) buildup of a rocky core having a mass of several earth masses, followed by (b) accretion of gas left over following completion of the main disk accretion phase. The first mechanism may be the most plausible path for producing the majority of the extrasolar giant planets known to date, while the second appears the most likely followed in forming Jupiter and the other gas giants in our solar system. Understanding the basic underlying physics of giant planet formation and the factors that control the distribution of planetary architectures for each formation mechanism is central to learning whether the architecture of our solar system is likely common or rare. Central to addressing this problem is constraining the timescale over which significant amounts of gas survive following the accretion phase. If the timescale for gas survival is short (t << 10 Myr) at distances beyond several AU in most systems, gas giant formation via accretion onto a rocky core is unlikely. Moreover, if the residual gas in the terrestrial is << 10-3 that of a minimum mass solar nebula, it becomes difficult to understand how the low eccentricity of the orbits of earth and its sister planets in the inner solar system came about.
Figure 26: Predicted line luminosities (solar units) for three potential tracers of gas mass. Molecular hydrogen provides a good tracer of gas mass until it saturates at ~ 0.01 Jupiter masses. At higher masses, [Fe I] (dashed line) provides a better measure of mass.
To establish gas survival timescales requires sensitive measurements of the gas content of disks surrounding stars spanning the relevant timescales. The desired sample includes
post-accretion phase solar-like stars located (a) in dense star-forming regions (e.g. Orion), where environmental conditions (uv radiation field and stellar density) may best reproduce those that obtained for most stars comprising the Milky Way disk; (b) in regions where star-formation is more isolated (and disk lifetimes could be longer) such as Ophiuchus or Taurus; (c) in older associations and clusters (e.g. Sco-Cen; η Cha; NGC 2391; NGC 2602; α Per; the Pleiades) located within 200 pc; and (d) in the field (distances less than 200 pc), with approximate stellar ages inferred from measures of activity (e.g. H alpha; Ca II emission). Sample sizes ~ 1000s are needed in order to span the range of ages, environments and outcome diversities expected. The nature of the target list demands the ability to measure disk gas content for stars as distant as 450 pc (Orion).
TMT_DetailedScienceCase_v7_4_modAbraham.doc- 57 - Created on 2/22/2005 4:21 PM

TMT will have the requisite sensitivity to carry out these measurements using as probes of gas content a variety of molecular (e.g. H2) and atomic (e.g. Fe I) tracers. Figure 1 depicts the line luminosities as a function of disk gas mass for 3 tracers: H2 S(2) 12.4µm, H2 S(1) 17.0µm, and [Fe I] 24.04µm predicted from recent thermo-chemical models produced by Gorti and Hollenbach (2004). In Table 1, we list for these 3 tracers the predicted luminosities for a range of disk gas masses. Note that 10-7 Lsun = 1.4 x 10⁻¹⁷ ergs cm-2 sec-1. Table 1: Predicted Feature Strength vs Gas Mass for Selected Gas Diagnostics Feature Wavelength
(µm) Mgas = 10-3 Msun Mgas = 10-4 Msun Mgas = 10-5 Msun
H2 S(2) 12.4 5.3x 10⁻⁸ Lsun 1.8x 10⁻⁸ Lsun 2.7x10⁻⁸ LsunH2 S(1) 17.0 7.2x 10⁻⁸ Lsun 4.2x 10⁻⁸ Lsun 6.1x 10⁻⁸ Lsun[Fe I] 24.3 2.0 10-6 Lsun 5.3x 10⁻⁷ Lsun 5.3x 10⁻¹⁰ Lsun In Table 2, we estimate the limiting distance to which disks of a given mass can be detected using each of these tracers. These correspond to a limiting flux, estimated by assuming (a) R = 100,000 spectra; (b) S/N =10 for robust detection; (c) an integration time of 104 sec; and (d) the monochromatic sensitivity estimated by Graham (Figure 2). Table 2: Limiting Distances for Detecting Emission for Disks with a Given Mass
Feature Limiting Flux ergs cm-2 sec-1
Mgas = 10-3 Msun Mgas = 10-4 Msun Mgas = 10-5 Msun
H2 S(2) 0.3x 10⁻¹⁷ 790 460 560 H2 S(1) 1.0x 10⁻¹⁷ 500 390 460 [Fe I] 1.0x 10⁻¹⁷ 2660 1740 40
We conclude that TMT can carry out surveys for disk gas content for ~ 1000 solar mass (0.3 to 1.5 Msun) targets selected from the above listed cluster and field star samples. The targets have V magnitudes ranging from 5 to 15 and K magnitudes from 3 to 13. Hence, they can serve as ‘tip-tilt stars’ and perhaps natural guide stars suitable for the higher (but still modest) order corrections needed to provide diffraction-limited images to the mid-IR spectrograph. What effect do site characteristics (altitude/temperature; precipitable water column) have on our ability to carry out this representative program? To do this, we again made use of Graham’s monochromatic sensitivity calculations. Exposure times were calculated to achieve a ‘typical’ line flux sensitivity of ~ 2 x 10-17 erg/s/cm, 10 sigma for the H2 0-0
TMT_DetailedScienceCase_v7_4_modAbraham.doc- 58 - Created on 2/22/2005 4:21 PM

S(1) 17.035 micron and 0-0 S(2) 12.278 micron lines, and the [Fe I] 24.03 micron line assuming a spectral resolution of 100,000.
Figure 27: Limiting sensitivity vs wavelength for SOFIA (blue), Keck (green) and TMT assuming R = 100,000, S/N = 10 and an integration time of 104 sec. Courtesy J. Graham, UCB.
The exposure times were calculated for a grid of site conditions including five elevations from 8000 to 16,000 ft (2440-4880 m) and six values of the water vapor burden (0.25 - 8 mm). The atmospheric temperature was assume to follow the international standard atmosphere (15 C at sea level and a mean lapse rate of 6.5 C per km). The ground ambient temperature was assumed to be 10 K warmer than the free atmosphere. The results are summarized in Figure 25. Examination of the Figure demonstrates that
obpe
TM
Figure 28: : Contours of exposure time in seconds for achieving line flux sensitivity of 2 x 10-17 erg/s/cm2 (10) for elevations between 2440-4880 m (8000-16,000 ft). Contours give the exposure time per target for a typical T Tauri star in Orion for each of the three gas mass diagnostics discussed above. The contour intervals are at (a) √2 for H2 , and (b) 2 for [Fe I] respectively. The telescope temperature runs from 9 C at 2440 m (8000 ft) to -6.6 C at 4880 m (16,000 ft). The dependence exhibits different behavior depending on the strength of the adjacent atmospheric absorption lines. For the S(2) and [Fe I] lines the principal factor determining the exposure time is water vapor. Both elevation/temperature and water vapor factor into the exposure time for the S(1) line
servations of the [Fe I] feature dominate the exposure time, and that the time required r target (for each of ~ 1000 targets) increases from 1x10⁴ sec to 8x10⁴ sec as the
T_DetailedScienceCase_v7_4_modAbraham.doc- 59 - Created on 2/22/2005 4:21 PM

precipitable water column increases from 0.5 mm to 1.5 mm. This illustrates the importance of selecting a site in which the fraction of time with PWV < 1mm is significant; PWV values exceeding 1.5mm effectively preclude observations of features analogous to the [Fe I] diagnostic.
2.4.3.2 Identification of forming planets during the disk accretion phase. As noted above, extrasolar giant planets (EGPs) may form rapidly, as a result of instabilities that arise in massive (~ 0.1 M*) accretion disks surrounding young stellar objects. Forming EGPs should produce tidal ‘gaps’ in the accretion disk. Optically thin emitting gas in these gaps can diagnose the presence of forming protoplanets and quantify their orbital distances and masses. Making such measurements can provide insight into both the formation mechanism for EGPs, and via comparison with the architectures of mature planetary systems, their dynamical evolution.
Figure 29: A simulation (left) depicting the dynamical effects of a newly-formed gas giant planet (the red dot embedded within a dark elliptical ring) on a disk of circumstellar gas and dust surrounding a young star. The gravitational effect of the planet on surrounding disk material opens up a gap, or ring, within which the amount of residual gas and dust is miniscule compared to the regions inward and outward of the ring. The residual gas produces a spectral signature (right panel, a simulated profile produced by a Jupiter mass planet orbiting a solar mass star at a distance of 1 AU), in this case a double-horned profile manifest in emission from carbon monoxide. The wavelength separation of the horns diagnoses the distance of the planet from its parent sun, while the width of each horn measures the width of the gap, which in turn diagnoses the mass of the planet. The simulated spectrum is representative of the expected performance of an R =100,000 mid-IR spectrograph on TMT for an 8-hour exposure. Courtesy G. Bryden (left) and J. Najita (right).
Determining the Keplerian velocity of emitting gas within the gap provides a measure of the EGP semi-major axis, while the mass of the EGP can in principle be assessed from width of the gap as inferred from the shape of the emission line arising from the gas
diagnostic. The targets here are young stellar objects still surrounded by circumstellar accretion disks – diagnosed via their infrared spectral energy distributions (large excess emission from dust embedded within the disk) and from optical photometry (uv excess) and spectroscopy (line profiles indicative of accretion along magnetospheric columns). A
TMT_DetailedScienceCase_v7_4_modAbraham.doc- 60 - Created on 2/22/2005 4:21 PM

variety of gas diagnostics sensitive to emission arising at different temperatures (300 K at 1 AU; 150 K at 5 AU) will be used; they include CO fundamental (4..6µ), H2 (12µ; 17µ). The number of candidate targets accessible at TMT sensitivity can be assessed from Figure 5, which depicts the frequency distributions of 6.7µ and 14.8µ flux values measured by ISO for a sample of young stellar objects spanning masses from 0.1 Msun to 3 Msun, surrounded by accretion disks, and located in the nearby Ophiuchus molecular cloud complex (dark grey-shaded histograms). Superposed (red lines) on these histograms are the detection limits estimated for TMT at wavelengths corresponding to the CO fundamental band (4.6µ) and the H2 S(2) line (12µ) for (1) resolution R = 100,000; (2) S/N = 100 in the continuum (enabling robust detection of lines 5% above the continuum), and (3) integration time 3 hours. These limits were estimated using the exposure time calculator developed for the NIO GSMT project by Brooke Gregory using as input assumptions: (a) fraction of light transmitted through the slit (λ > 5µ) ~ 0.5; (b) detector read noise of 4 e- (λ ~ 5µ); 30 e- (λ > 5µ) (NB (thermal background is the dominant noise sourd); (c) detector Q.E. of 0.8 (λ ~ 5µ); 0.4 (λ > 5m); (d) spectrograph throughput of 0.3; (e) 4 pixels/resolution element; (f) atmospheric transmission/emission as per FASCODE; (g) emissivity of 0.2; and (h) telescope temperature of 300K. We conclude that more than 100 sources in the Ophiuchus complex would be available for high resolution, high S/N spectroscopic study with TMT. Comparable numbers would be available in other complexes (Taurus; Chamaeleon; Lupus) located at similar distances. We also plot the limiting fluxes for YSOs located in the Orion molecular complex, which contains ~ 30 times the total number of sources, and moreover samples an environment (high stellar density; strong uv radiation field) though typical of the star-forming regions that give birth to the majority of stars populating the Galactic disk. CO fundamental measurements could be made for more than 1000 YSOs in Orion, while 200-400 Orion YSOs would be accessible at H2 S(2). Typical K-band brightness for the Ophiuchus sources range from 7 < K < 11, while in Orion, 10 < K < 14. Hence, these objects are bright enough to enable tip-tilt (and in many cases, higher order) corrections.
2.4.3.3 The structure and kinematics of infalling envelopes Individual stars are believed to form in optically opaque (A(v) > 1000 mag) rotating molecular cores of dimension ~ 0.1pc. To date, these protostellar cores have been studied primarily at mm- and sub-mm wavelengths, and largely in nearby (d < 500 pc) star-forming regions at spatial resolutions typically corresponding to 1000s of astronomical units. Such observations provide a measure of the core mass and large-scale morphology, and kinematic information sufficient to diagnose the onset of gravitational collapse.
TMT_DetailedScienceCase_v7_4_modAbraham.doc- 61 - Created on 2/22/2005 4:21 PM

At the earliest evolutionary phases, these cores are sufficiently opaque as to preclude detection of the forming star and its associated circumstellar accretion disk even at mid-infrared wavelengths. The presence of the star-disk system can be inferred from (a)
measurement of dust-
reprocessed mid- and far-IR emission from which the total luminosity of the forming star and its accretion disk can be inferred; and (b) the
kinematic signatures of
collimated molecular
obsts Ccq
Tfifv(p(
T
Figure 30: Histograms depicting the frequency distribution of source brightness for YSOs surrounded by accretion disks (dark grey) in the Ophiuchus molecular complex (Bontemps et al. 2001).
utflows thought to arise from a magnetically-driven wind originating at or near the oundary between the stellar magnetosphere and a circumstellar accretion disk. At later tages in stellar assembly, the optical depth of the envelope decreases, and emission from he star-disk-outflow system can be observed, first at mid-IR wavelengths, and later at horter wavelengths.
urrent facilities lack the combination of angular resolution, sensitivity and wavelength overage critical to enabling more quantitative study of the assembly process. Key uestions that must be addressed include:
(1) How do star-disk systems evolve from protostellar cores? (2) What determines the final mass of a star? Initial conditions in the protostellar
core? Feedback from a forming star-disk-wind system? (3) When and how are collimated outflows launched? How are their properties related
to those of the forming star-disk system? What role do they play in determining the final mass of the star?
(4) When and how do binary/multiple stars form?
MT will have the sensitivity to enable R ~ 100,000 spectroscopic analysis of star-orming cores, and the ability to diagnose thereby the structure and kinematics of nfalling envelopes, along with the jets and winds launched from the inner regions of the orming star-disk system. This high spectral resolution is required in order to match the elocity widths characteristic of (1) absorption features arising in infalling envelopes widths ~ 1-3 km/sec); (2) emission features (widths ~ 10 km/sec) arising in shocks roduced as envelope gas infalls supersonically onto the disk; fluxes in shock features e.g. H2) can in principle be linked to envelope mass accretion rates; and (3) emission
MT_DetailedScienceCase_v7_4_modAbraham.doc- 62 - Created on 2/22/2005 4:21 PM

features (widths 10-30 km/sec) arising in shocks at the boundary between collimated outflows and infalling material from the protostellar envelope.
Figure 31: Profiles of CO fundamental band absorption features obtained by Scoville et al. (1983) from high spectral resolution (R ~ 50,000) observations of the Becklin-Neugebauer Object – a high mass protostar deeply embedded within an optically opaque core. Observations of several tens of these profiles enabled Scoville et al. to derive temperature, density and velocity structure in the protostellar core and to derive the first quantitative estimate of mass inflow rate from protostellar core to a forming star-disk system
As an example, high resolution spectra using diagnostics such as molecular hydrogen, water, CO and both permitted and forbidden atomic transitions can be used to map
temperature, density and velocity along the line of sight through the protostellar core to the spatially unresolved inner parts (r < 1 AU) of the star-disk system (which serves as the bright ‘background’ against which these features can be measured). An illustration of the potential of such measurements is provided (see Figure 6) by the pioneering study of Scoville, Kleinmann and Hall (1983) for the Becklin-Neugebauer source – a massive (M > 10 Msun) protostar located in the Orion star-forming complex. These authors used R ~ 50,000 spectra to obtain profiles for a large number of absorption lines arising in the CO fundamental band. In turn, these profiles mapped both the velocity field and density distribution along the line of sight to BN – leading to the only extent determination of mass inflow rate from a protostellar core to a star-disk system: a critical quantity for assessing the relationship between resulting stellar mass and protostellar conditions. Figure 27 provides an indication of the wide range of sources accessible to TMT. The green-shaded histogram
depicts the distribution of observed fluxes among sources in the Ophiuchus molecular cloud complex that are still surrounded by optically-opaque (A(v) > 50 mag) protostellar envelopes (so-called ‘Class I sources’; see Figures 7 and 8) – the focus of this proposed study. The estimated bolometric luminosities of these sources ranges from 0.1 Lsun to 30 Lsun; associated forming stars are likely to have masses in the range 0.1 to 2 Msun. As above, the superposed red lines indicate the limiting flux for a 3 hour integration, yielding S/N = 100 in the continuum at a resolution R = 100,000. The blue lines indicate similar limits for objects located at the distance of the Orion molecular complex. The figure shows that all 15 Class I sources in Ophiuchus are accessible to TMT, while at Orion; most of a cohort of sources spanning a similar range of properties would be accessible as well. We note that Orion will (a) likely contain more than 30 times as many candidate
TMT_DetailedScienceCase_v7_4_modAbraham.doc- 63 - Created on 2/22/2005 4:21 PM

sources; and (b) likely include a significant number of more luminous Class I sources containing forming stars of higher mass.
Figure 32: HST NICMOS images of solar-mass star-disk systems just emerging from their protostellar cores. The protostellar core material is made visible via near-IR (2 micron) light scattered earthward by dust embedded in the inner regions of the infalling core. The disk is manifest in ‘silhouette’ against the bright scattered light arising from core material. In all cases, the central forming star is obscured from view by the optically opaque circumstellar disk material. The optical path from star to envelope is believed to be produced by a powerful collimated outflow emanating from the inner disk regions. The solid white lines indicate a scale of 500 AU. At the distance of Orion, TMT will be able to resolve structures of ~ 5 AU in size
Surveys with the Spitzer Space Telescope will provide complete target lists of actively star-forming cores during early collapse phases both in Orion (d ~ 450 pc), as well as in
more distant complexes (d ~ 2kpc) expected to harbor large samples of forming high and intermediate mass stars (which with few exceptions are absent in more proximate star-forming regions). JWST will carry out targeted studies of core and outflow morphologies via mid-IR imaging, and derive rough estimates of core and jet properties via low-resolution spectroscopy. TMT will provide the sensitivity needed to enable quantitative analysis of a large number of star-forming cores surrounding objects of different mass. Several hundred cores surrounding stars ranging in mass from 0.1 to 3 Msun can be observed out to Orion distances. Cores surrounding more luminous (and massive) protostars can be observed to distances of several kpc; the number of such targets is at present unknown, but estimated to be 30-300 for luminosities L > 1000 Lsun. Analysis of cores spanning a range of masses will be crucial to establishing the differences between cores that form low
and high mass stars, and to guiding development of a predictive theory of star formation. TMT will also have the spatial resolution to probe the morphologies of protostellar cores as well as highly collimated jets launched from the inner disk, and broader neutral winds At 10 microns, TMT will be able to provide images of nearby (d ~ 150 pc) cores and jets at a resolution of 1.5 AU; at Orion, the equivalent resolution will be ~ 4.5 AU. This will enable (via broad- and narrow- band imaging) study of:
(1) the detailed morphology of protostellar cores, and via comparison of thermal emission and scattered light with models, the temperature and density in the cores.
(2) the location and number of pre-stellar condensations, thus informing the origin of stellar multiplicity: formation via instabilities in circumstellar disks or via fragmentation within star-forming cores;
(3) the morphology of winds (narrowly collimated? broad enough to expel a significant amount of core material?) and, via reprocessed radiation arising at the
TMT_DetailedScienceCase_v7_4_modAbraham.doc- 64 - Created on 2/22/2005 4:21 PM

shock-heated interface between winds and surrounding molecular material, the mass outflow rate and wind energy input
(4) the structure of ionized jets, and from this structure, quantitative estimates of the number and cadence of high accretion rate episodes that take place during the stellar assembly phase.
Figure 33: Three color (J-, H-, and K- band) and polarimetric images of the envelope-disk systems surrounding two newly-formed intermediate mass stars obtained with the 3-m Shane telescope and the Lick laser guide star adaptive optics system.
Class I sources will (generally) not have near-IR counterparts. Hence, a key issue is the proximity of near-IR sources suitable for tip-tilt correction, and the availability of a laser guide star to provide higher order correction.
2.4.4 Trades in the Mid-IR The SAC will need to determine the relative value of (a) PWV; (b) altitude/temperature; (c) telescope emissivity in order to carry out a cost-performance trade. In doing so, it is useful to keep in mind the following: (a) that observing time is ~ telescope emissivity in the thermal infrared; (b) that observing times in excess of several hours may not result in S/N ~ t1/2 owing to the effects of systematics. The messages are: (a) some trade between atmospheric transmission/background emission and emissivity will be possible (e.g. trade cost of decreasing overall emissivity against the
cost of developing and operating at a very high altitude sight); and (b) PWV > 1mm will for most problems result in integration times so long that systematics (as yet unquantified) will dominate.
TMT_DetailedScienceCase_v7_4_modAbraham.doc- 65 - Created on 2/22/2005 4:21 PM

2.5 PFI: Planet Formation Instrument Science Case Summary 2.5.1 Overview of capability and expected performance
PFI is an imager/low resolution spectrograph working at the diffraction limit in the near-IR designed to detect and study planets orbiting nearby stars. The contrast goal for the first-light implementation is to be able to detect planets at ≤10-6 times the flux of the parent star at angular distances between 0.03 - 1 arcsec from the parent star. This will likely require a coronagraph or similar approach to reduce light from the parent star. PFI will also have the capability to obtain low-resolution spectra, probably using an IFU. Because the targets will be bright stars, a natural guide star AO system will be used with PFI.
2.5.2 Overview of anticipated science areas • Direct detection of giant planets orbiting young stars. Gas giants are expected to
be bright at near-IR wavelengths at birth and rapidly fade (factor of 100 in the first 150 Myr). For solar-like stars, a 1MJupiter planet will be brighter than 10-6 of its parent star for ~15Myr; a 5MJupiter planet will be visible brighter than this contrast limit for ~200Myr. PFI will be able to carry out a survey for these self-luminous giant planets to the distance of the Taurus and Ophiucus star-forming regions (150 parsecs).
• Characterization of giant planet atmospheres. Using a diffraction-limited slit or
finely-sampled IFU, PFI will have a unique ability to obtain low-resolution spectra of extra-solar planets. Chemical abundances, physical characteristics, and inferences about planet interiors will be derived. 2.5.3 Detailed Science Case (B. Macintosh, LLNL; J. Graham, UC Berkeley)
Over the past ten years, more than 100 planets have discovered, almost all through precision doppler measurements techniques. This powerful technique has completely changed our understanding of planetary system architectures and formation, but is limited to probing <5 AU semi-major axis and measures only the m*sin(i) and orbital properties. Over the next ten years, this picture can be expected to again change dramatically. The next significant step in extrasolar planet detection is likely to be direct imaging of extrasolar planets – a step that is likely to be taken for at least a few planets long before TMT is operational. By 2014, several systems capable of imaging extrasolar planets will be operational, including extreme adaptive optics (ExAO) on 8-10m telescopes, a dedicated Jovian-planet-finding space telescope such as Eclipse, and possibly the first Terrestrial Planet Finder mission, TPF-C. Extrasolar planet studies in the 30-m telescope era will begin to focus not merely on detection of a small number of planets but characterization of a statistically significant population of planets. For TMT to make a major contribution in this era it must develop a unique capability distinct from previous instruments, either probing planets or wavelengths that are otherwise inaccessible. We believe that TMT ExAO can make fundamental contributions in three areas:
1. Planet formation: searching for planets and planetary systems in the process of formation, using TMT’s advantage in λ/D to probe solar-system-like scales in nearby starforming regions
TMT_DetailedScienceCase_v7_4_modAbraham.doc- 66 - Created on 2/22/2005 4:21 PM

2. Planet populations: detecting a robust sample of planets spanning a wide range of
orbital separations inaccessible to radial-velocity and spacecraft techniques – primarily through detection of self-luminous planets at near-IR wavelengths – as a way of constraining the planet formation process
3. Planetary astrophysics: using spectroscopic techniques to study planetary atmospheres (and perhaps even interiors) over a wide range of mass or gravity vs Teff space.
The first of these is the area that the initial TMT ExAO instrument, Planet Formation Imager (PFI) will concentrate on.
2.5.4 ExAO system parameters ExAO system performance is currently a poorly-defined area; different analytic and computer models offer different sensitivity predictions, depending on assumptions made about factors such as atmospheric speckle lifetimes, wavefront controllers, and quasi-static optical errors. Since this document is intended to address the science need, we will not discuss these questions in great detail here, but instead adopt a simplified ExAO model in which a system is characterized by three parameters. The first is achievable contrast, defined as the ratio in brightness between a point source detectable at a given signal-to-noise ratio and its parent star. (For simplicity, we will assume contrast is uniform with angular separation.) The second parameter is the system limiting magnitude – the dimmest star on which it can achieve its contrast goal. In the design and operation of any high-contrast “Extreme” adaptive optics system (ExAO), there will always be a tradeoff between achievable contrast and target star magnitude: higher contrast will require brighter stars to overcome measurement noise in the wavefront sensor, especially as the size of the system’s subapertures decreases and the needed system update rate increaes. The third fundamental parameter is the inner working distance (IWD) – the smallest angular distance at which a given contrast can be achieved. An ExAO system must control both light scattered by wavefront errors but also light scattered by fundamental diffraction effects; the latter is the controlled by a coronagraph. The IWD is usually set by the coronagraph architecture, and since it is a diffraction effect it is proportional to λ/D. IWDs vary from 5-6 λ/D for simple Lyot coronagraphs, to 3-4 λ/D for advanced versions of traditional coronagraphs such as complicated apodization or band-limited coronagraphs, to ~2 λ/D or less for interferometric coronagraphs. Since IWD scales as λ/D it represents one of the biggest areas of advantage for TMT over space missions – a 3 λ/D coronagraph operating at H band will have a IWD of ~0.03 arcseconds, compared to 0.08 arcseconds for a 6-m TPF-C in I band. This allows TMT to study planets closer to their parent stars – a significant advantage for distant targets such as young stars. ExAO on a segmented telescope presents fewer challenges than one might think. Diffraction off of the gaps between segment gaps can be adequately controlled through a variety of coronagraph architectures. Residual telescope phase errors, on the other hand, do need to be small to achieve the very highest contrast levels.
TMT_DetailedScienceCase_v7_4_modAbraham.doc- 67 - Created on 2/22/2005 4:21 PM

2.5.5 Planet detection in 2014 The past ten years have seen an enormous advance in extrasolar planet detection; the next ten years may see nearly as much progress, both in indirect and direct detection methods. We will discuss briefly the likely major developments in planet detection as of 2014, the earliest likely first light for a TMT ExAO system.
2.5.5.1 Radial velocity surveys The most fundamental limitation of doppler surveys is of course time; detection requires ~1 orbital period, limiting the large-scale surveys that have been in progress for ~8 years to detecting planets at <4 AU for solar-type stars. By 2014, these surveys will be reaching 7 AU detection thresholds, probing well past the ice line into the realm of solar systems such as our own. Progress will continue past this line, albeit slowly – reaching 10 AU orbits will require 30 year baselines. The precision of Doppler techniques may also increase, allowing lower-mass planets to be detected, but of course if a 1 m/s survey were begun today it would only be reaching 4 AU in 2014. Current doppler searches concentrate on solar-type stars. New instrumentation such as optimized IR spectrometers (and ultimately larger telescopes) may extend this to large samples of late-type stars or even brown dwarfs. Doppler searches will remain unable to probe A-type stars (due to lack of spectral features) and younger (<500 Myr) stars (due to stellar activity.) Nonetheless, the doppler planet picture will be increasingly complete, and TMT ExAO must be designed to complement rather than compete with what will be an extremely mature technique.
2.5.5.2 Astrometry Though potentially very promising, astrometry has a mixed track record: the only planets initially detected to date through astrometric techniques are Uranus and Neptune, in spite of many false positives. As astrometric interferometers with broad science reach become operational, however, this will change. Keck outrigger and VLTI astrometry will be capable of detecting planets well below Saturn’s mass, and SIM could reach near earthlike masses for the best target stars. Astrometry will remain constrianed by time baseline requirements similar to radial velocity, however, and hence will similarly probe the inner rather than outer parts of solar systems. (Some have suggested that greater precision may allow mass determination based on partial orbits, but the available time baseline will be shorter). Astrometry will be exceptionally powerful in combination with other techniques, allowing rapid direct mass determination of radial-velocity-detected planets, and identifying (through long-term trends) possible planets in wide orbits that are well-suited to ExAO detection.
2.5.5.3 Direct interferometric detection Interferometers are potentially capable of extremely high angular resolution, and, through techniques such as nulling or differential phase measurement, of good rejection of starlight. This can potentially allow direct detection of planets in 51-Peg-like orbits (<0.1 AU). However, due to their small fields of view, limited UV coverage, and sparse apertures, interferometers have very little sensitivity to planets in wider orbits – the Keck interferometer has a field of view roughly equal to the diffraction limit of a single telescope. Interferometry imaging will therefore primarily allow characterization of the already-known radial velocity planets. The Fizeau-like interferometer on the LBT is an exception. With its wide field of view and low emissivity its operation is more analgous
TMT_DetailedScienceCase_v7_4_modAbraham.doc- 68 - Created on 2/22/2005 4:21 PM

to direct imaging with an AO system. Operating at 5 microns it may be capable of detecting planets through their IR emission, although since planetary 5 micron brightnesses now appear to have been overestimated (REF#) it may be limited to the very nearest stars.
2.5.5.4 Direct detection via coronagraphic spacecraft Direct detection of terrestrial planets (and determining whether they host life) is a major scientific goal of NASA – the Terrestrial Planet Finder mission. After considerable debate and study NASA is currently pursuing a two-pronged approach. A coronagraphic mission, TPF-C, will launch in ~2014, to be followed by a mid-IR interferometric mission in 2020. The baseline TPF-C is a 6x4-m monolithic elliptical telescope equipped with what is in essence a ultraprecise ultraslow adaptive optics system to correct internal telescope errors. TPF-C has a contrast goal of 0.5x10⁻¹⁰ for a large target sample (FGK stars out to ~25 pc, REF#). The nominal TPF-C mission will be optimized for visible light operation. Several proposals exist for precursor missions intended to detect reflected-light Jovian planets using 2-m class telescopes and similar active optics (e.g. Trauger ref#.) These missions are scientifically interesting but very carefully tuned for Jupiter analogs at 5 AU; planets closer to the target star will often be within the IWD. Planets in wider orbits will of course reflect less starlight and dfsrop below the detection threshold. Again, most proposed missions are optimized for visible light operation – at near-IR wavelengths, the small telescope produces an unacceptably large IWD.
2.5.5.5 8-10m telescope ExAO Several groups and observatories are studying ExAO systems for 8-10m telescopes including the NSF Center for Adaptive Optics’ XAOPI study for Keck (Macintosh et al 2003, 2004), two studies funded by ESO, and now conceptual design studies for a Gemini ExAO instrument at CfAO and University of Arizona. It is likely that 1-3 such systems will be deployed in ~2008 on VLT, Gemini and or Keck. Although details differ, such systems seem likely to achieve ~107 contrast on mR~7-8 stars, allowing detection of the youngest and most massive self-luminous planets, with an IWD of 0.1-0.15 arcseconds.
2.5.5.6 ALMA (Section needs to be written)
2.5.6 Comparison between different methods Comparing these different instruments is challenging, as some techniques (such as radial velocity) have a sensitivity defined in the m*sin(i) vs semi-major axis plane, while others (such as direct detection of self-luminous planets) are defined in a contrast-angular separation plane. Figure 1 shows the contrast-angular separation plots for the direct detection systems being discussed here. Figure 34 includes four simulated planet populations, assigned at the rate of 1 Jovian and 1 terrestrial planet per target star for a simulated solar neighborhood (R<8, d<50 pc) plus a separate population similar to that of the Taurus starforming region. All populations are of course speculative; this figure is intended only to give a general sense of the range of contrast / separations likely to be found.
TMT_DetailedScienceCase_v7_4_modAbraham.doc- 69 - Created on 2/22/2005 4:21 PM

The stellar population does not represent the exact solar neighborhood but instead a simulated magnitude-limited population following the local IMF and age distribution.
Th0.evorThkn0.ColuthquFiis plFrluunTM
TM
Figure 34: Simulated planet populations and instrument sensitivities. Courtesy J. Graham, UCB.
e terrestrial planet population represent a range of solid planets with orbital radii from 01 to 5 AU and masses from 0.1 to 10 earth masses; although by no means definitive or en scientifically supported, this range spans most planets likely to be detectable by TPF TMT. e Jovian planets populations are taken from a maximum-likelihood extrapolation of the own radial velocity planet distribution, with a mass function approximately flat from
5 – 10 Jupiter masses and a slowly rising semi-major-axis distribution to 50 AU. ntrast is calculated by combining the reflected light from the planet with any self-
minosity for younger or more massive planets; planets whose emitted light is greater an their reflected light are distinguished as “self-luminous Jovians” in the upper right adrant of the image. nally, a simulated population of very young planets in the Taurus and Ophiucus regions included. These planets have a narrower semi-major-axis distribution than the mature anets, representing a pre-migration population concentrated near the snow line. om this figure one can see that 8-10 m ExAO will probe a large fraction of the self-minous planets, while TPF will probe almost all of the Jovian planet distribution. The ique phase space accessible to TMT is found on the left side of the diagram, where T can take advantage of its large diameter to provide a small IWD.
T_DetailedScienceCase_v7_4_modAbraham.doc- 70 - Created on 2/22/2005 4:21 PM

The current plan for a first-light TMT ExAO capability is the Planet Formation Imager (PFI): An AO system optimized to image young stars such as those found in the Taurus or Ophiucus regions. This would require contrast ~10^5 – 10^7 around moderately dim targets –H<10-11 – at small angular scales (~0.03-0.04 arcseconds.) Such a system would require a near-infrared wavefront sensor and a relatively advanced coronagraph, but represents a science capability truly unique to 30-m telescopes.
2.5.7 Planet formation imager The primary goal for PFI is exploring protoplanetary systems in nearby star-forming regions such as Taurus or Ophiucus on 5-50 AU scales together with studies of slightly older systems such as the Beta Pictoris and TW Hydra group at even smaller separations – studying the entire history of the planet formation and migration process from ages of 2-100 Myr. Direct near-infrared imaging of such systems opens up a wide range of scientific possibilities. First, observations of the properties of planets or protoplanets in systems with ages 2-10 Myr will be crucial in distinguishing between different theories of planet formation. If planetary formation takes place rapidly e.g. through gravitational instabilities, (Gammie 2001; Johnson & Gammie 2003; Boss 2002) planets may be abundant in the youngest systems; such young planets will be extremely bright and could be easily directly imaged. By contrast, if planet formation takes place through core-accretion processes (Goldreich, Lithwick, & Sari 2004) planets will be rare or lower-mass in younger systems, with some additional luminosity due to accretion of gas. Second, studies of the planet population as a function of age will lead into insights into the planetary migration process. A variety of mechanisms may drive orbital evolution; the tidal gravitational interaction between the planet and a viscous disk (Goldreich & Tremaine 1979, 1980), the gravitational interaction between two or more Jupiter mass planets (Rasio & Ford 1996), and the interaction between a planet and a planetesimal disk (Murray et al. 1998). It is energetically favorable for a Keplerian disk to evolve by transporting mass inward and angular momentum outward (Lynden-Bell & Pringle 1974). Inward planetary drift appears inevitable, and this is what is found in certain simulations (Trilling, et al. 2002; Armitage et al. 2002). However, if planets form while the disk is being dispersed, or if multiple planets are present, outward migration can also occur. In a system consisting initially of two Jupiter-like planets a dynamical instability may eject one planet while the other is left in a tight, eccentric orbit. The second planet is not always lost. The observed Doppler exoplanet eccentricity distribution can be reproduced if the 51 Pegasi systems are formed by planet-planet scattering events and the second planet typically remains bound in a wide (a > 20 AU), eccentric orbit (Rasio and Ford 1996; Marzari & Weidenschilling 2002). Divergent migration of pairs of Jupiter-mass planets within viscous disks leads to mutual resonance crossings and excitation of orbital eccentricities such that the resultant ellipticities are inversely correlated with planet masses (Chiang, Fischer, & Thommes 2002). Given decreasing disk viscosity with radius and the consequent reduction in planetary mobility with radius, we expect eccentricities to decrease with radius, perhaps sharply if the magneto-rotational instability is invoked (Sano et al. 2000). By contrast, excitation of eccentricity by disk-planet interactions requires no additional planet to explain the ellipticities of currently known
TMT_DetailedScienceCase_v7_4_modAbraham.doc- 71 - Created on 2/22/2005 4:21 PM

solitary planets (Goldreich & Sari 2003). Clearly, observations of the incidence, mass, and eccentricity distributions of multiple planet systems as a function of age would sharpen our nebulous ideas regarding how planetary orbits are sculpted. Third, direct imaging and spectroscopy will allow study of the planetary atmospheres during and after the formation process. 8-10m telescope ExAO will likely be limited to R~30-50 spectra of extrasolar planets; TMT will allow higher spectral resolution and broader wavelength coverage, as well as probing different regions of planetary phase space and situations such as e.g. planets that are still accreting gas. Finally, PFI will be able to study the disks themselves. At the distance of Taurus, the angular resolution of TMT corresponds to ~1.5 AU; insufficient to see small gaps in protoplanetary disks, but possibly sufficient to see large-scale density variations driven by otherwise-invisible planets or instabilities. Spectroscopic capability could provide insight into conditions in the disk by probing water and silicate features as a function of disk radius. Polarimetry capabilities could also probe the properties of dust grains. Comparison with ALMA and far-IR data could better constrain the gas to dust ratios as a function of system age. To achieve these scientific goals, PFI has several key requirements: • Contrast: 106-107: By the standards of ExAO, PFI’s contrast requirements are
relatively relaxed. Although current models do not include enough detail in initial conditions to be trustworthy at very young ages, young planets should be extremely bright (Burrows et al, Baraffe et al). A major task of the PFI feasibility study will be to define the exact contrast requirements for both protoplanets and protoplanetary disk studies. A goal for the system is that its design not preclude higher-contrast operations, possibly with an upgraded DM, on brighter stars for future spectroscopic studies of mature planets in the solar neighborhood.
• Inner working distance: 0.03”: This requirement, on the other hand, will be
challenging to achieve: 0.03” corresponds to 2 λ/D at K band. It is driven by the need to probe ~3-5 AU scales in nearby star forming regions and fully exploit TMT’s large diameter.
• IR WFS with limiting magnitude: K=10 to 11: Target stars in Taurus and Ophiucus
are distant and red, requiring an infrared wavefront sensor and a design that balances both contrast and limiting magnitude. Use of TMT’s planned laser guide star constellation is another possibility, but most techniques required for high contrast imaging (e.g. spatially-filtered or focal-plane wavefront sensing) are incompatible with laser guide stars.
• Science wavelength coverage 1-2.5 microns (goal: 1-5 microns): IR operation is
needed to see through dusty protoplanetary disks and observe the peak of the planets’ blackbody spectra.
• Spectral resolution: 100: The ideal science instrument for PFI would be an integral
field unit to allow direct spectroscopic imaging. Spectral resolution ~100 will allow studies of 4 micron dust and ice features in addition to planetary features.
TMT_DetailedScienceCase_v7_4_modAbraham.doc- 72 - Created on 2/22/2005 4:21 PM

• Polarimetry: Dual-channel polarimetry (Perrin et al) is an extremely powerful
technique for studies of circumstellar dust. In PFI operation, it will be especially important to help distinguish protoplanets, circumstellar dust concentrations, and PSF artifacts.
TMT_DetailedScienceCase_v7_4_modAbraham.doc- 73 - Created on 2/22/2005 4:21 PM

2.6 NIRES: Near-Infrared Echelle Spectrometer (Needs work!) 2.6.1 Overview of capability and expected performance
NIRES is a high-resolution (20,000<R<100,000) spectrometer designed to work behind the narrow-field AO system and use a diffraction-limited slit or IFU. Wide wavelength coverage in a single exposure in the range between 1µm and 5µm will likely require a cross-dispersed spectrometer. An acquisition camera that can act as a small (10′′ diameter field) well-sampled imager will be part of this instrument. The narrow slit and high spectral resolution will lead to a very reduced inter-OH background and very low-noise detectors will be required.
2.6.2 Overview of anticipated science areas • Detailed abundance studies in Local Group Stars. The near-IR is rich in
molecular features and an ideal region in which to measure CNO abundances in cool stars. S/N≥70 and R≥35,000 are required. For stellar observations, NIRES will offer a D4 sensitivity gain over smaller telescopes. This is an enormous step forward and will allow surveys of stars in the Galactic bulge, throughout the Galactic halo and for galaxies to the outskirts of the Local Group.
• The intergalactic medium beyond z=7. NIRES is ideally suited for investigations
of the inter-galactic medium beyond z=7 (the redshift where hydrogen Lα is shifted in the near-IR).
• Doppler-based planet searches. One very attractive approach to detecting
terrestrial-mass planets is to target lower-mass stars which exhibit a large reflex motion for a given planet mass and orbit. For main-sequence stars less massive (and cooler) than the Sun, the Doppler information content becomes higher at near-IR wavelengths and the target stars become significantly brighter at near-IR wavelengths. NIRES will be extremely powerful for the detection of planets around K- and M-type main sequence stars.
• Abundances, chemistry and kinematics in star and planet-forming disks. There
are a large number of atomic and molecular transitions in the 1µm – 5µm region that have been used to understand early Solar System abundances and chemistry. As is the case with MIRES, working in the mid-IR, spectral resolution as high as 100000 is required for these investigations.
2.6.3 Specific science cases: detailed discussion 2.6.3.1 Detailed abundance studies of Local Group stars. 2.6.3.2 The intergalactic medium beyond z=7
TMT_DetailedScienceCase_v7_4_modAbraham.doc- 74 - Created on 2/22/2005 4:21 PM
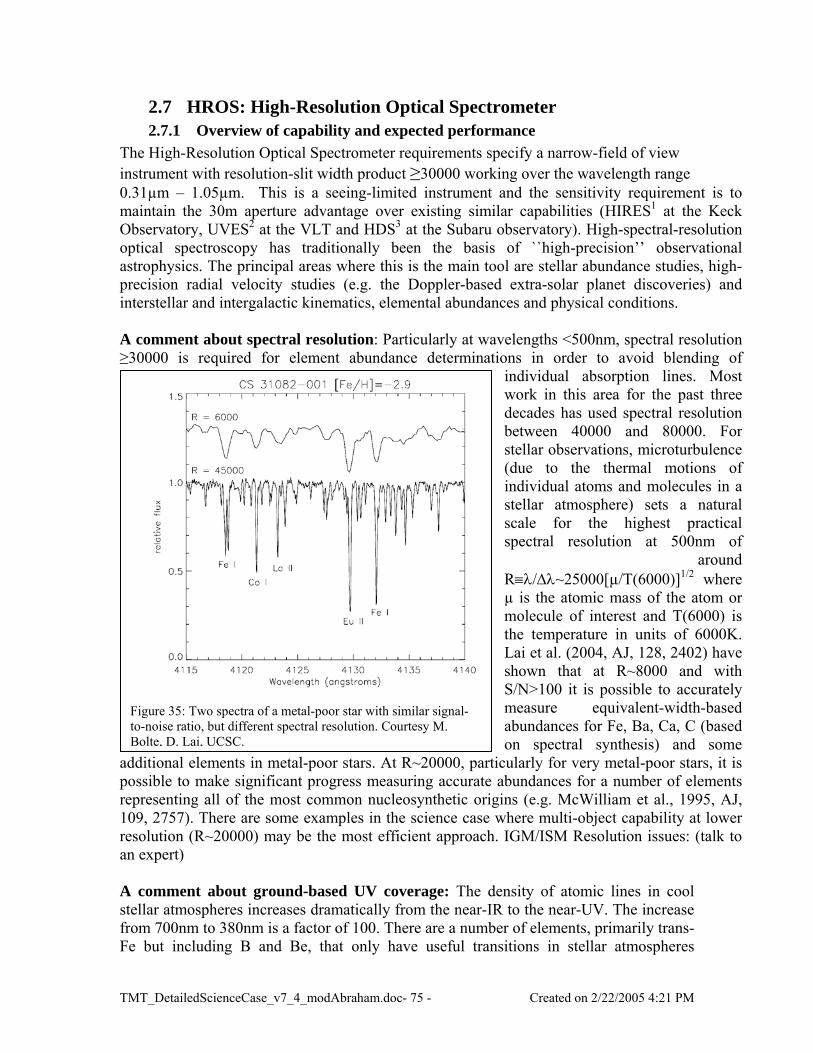
2.7 HROS: High-Resolution Optical Spectrometer 2.7.1 Overview of capability and expected performance
The High-Resolution Optical Spectrometer requirements specify a narrow-field of view instrument with resolution-slit width product ≥30000 working over the wavelength range 0.31µm – 1.05µm. This is a seeing-limited instrument and the sensitivity requirement is to maintain the 30m aperture advantage over existing similar capabilities (HIRES1 at the Keck Observatory, UVES2 at the VLT and HDS3 at the Subaru observatory). High-spectral-resolution optical spectroscopy has traditionally been the basis of ``high-precision’’ observational astrophysics. The principal areas where this is the main tool are stellar abundance studies, high-precision radial velocity studies (e.g. the Doppler-based extra-solar planet discoveries) and interstellar and intergalactic kinematics, elemental abundances and physical conditions. A comment about spectral resolution: Particularly at wavelengths <500nm, spectral resolution ≥30000 is required for element abundance determinations in order to avoid blending of
individual absorption lines. Most work in this area for the past three decades has used spectral resolution between 40000 and 80000. For stellar observations, microturbulence (due to the thermal motions of individual atoms and molecules in a stellar atmosphere) sets a natural scale for the highest practical spectral resolution at 500nm of
around R≡λ/∆λ~25000[µ/T(6000)]1/2 where µ is the atomic mass of the atom or molecule of interest and T(6000) is the temperature in units of 6000K. Lai et al. (2004, AJ, 128, 2402) have shown that at R~8000 and with S/N>100 it is possible to accurately measure equivalent-width-based abundances for Fe, Ba, Ca, C (based on spectral synthesis) and some
apr1ra AsfF
T
Figure 35: Two spectra of a metal-poor star with similar signal-to-noise ratio, but different spectral resolution. Courtesy M. Bolte, D. Lai, UCSC.
dditional elements in metal-poor stars. At R~20000, particularly for very metal-poor stars, it is ossible to make significant progress measuring accurate abundances for a number of elements epresenting all of the most common nucleosynthetic origins (e.g. McWilliam et al., 1995, AJ, 09, 2757). There are some examples in the science case where multi-object capability at lower esolution (R~20000) may be the most efficient approach. IGM/ISM Resolution issues: (talk to n expert)
comment about ground-based UV coverage: The density of atomic lines in cool tellar atmospheres increases dramatically from the near-IR to the near-UV. The increase rom 700nm to 380nm is a factor of 100. There are a number of elements, primarily trans-e but including B and Be, that only have useful transitions in stellar atmospheres
MT_DetailedScienceCase_v7_4_modAbraham.doc- 75 - Created on 2/22/2005 4:21 PM
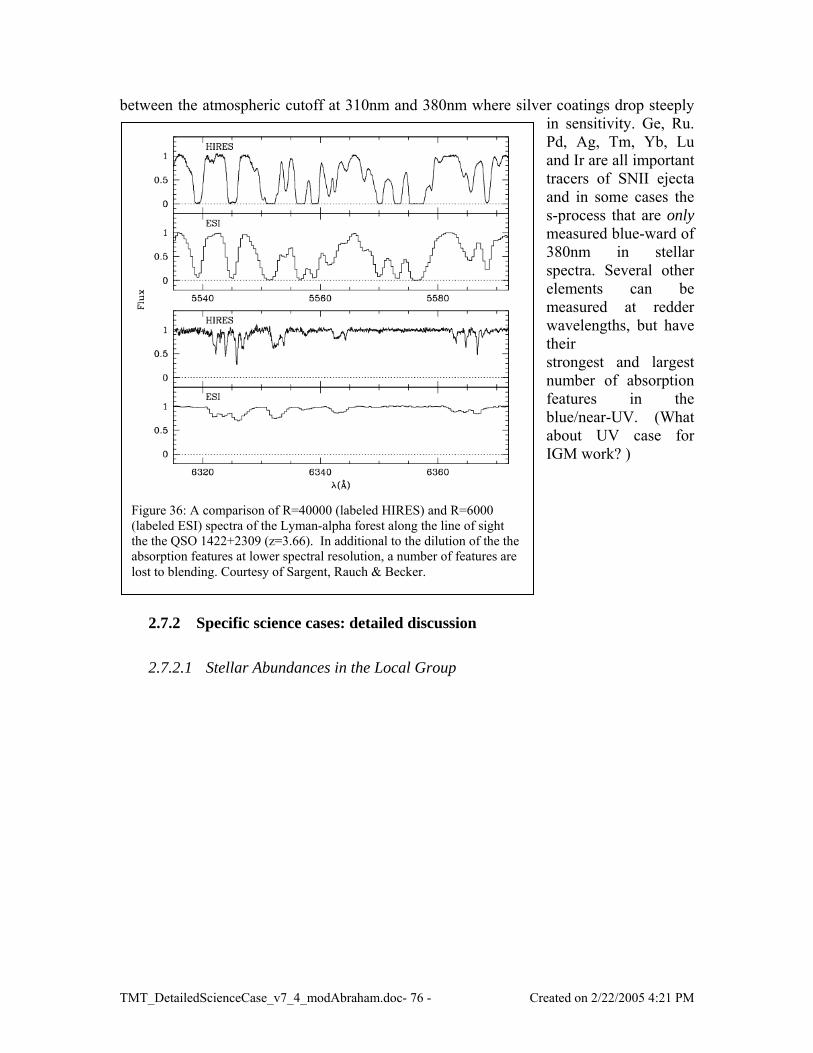
Figure 36: A comparison of R=40000 (labeled HIRES) and R=6000 (labeled ESI) spectra of the Lyman-alpha forest along the line of sight the the QSO 1422+2309 (z=3.66). In additional to the dilution of the the absorption features at lower spectral resolution, a number of features are lost to blending. Courtesy of Sargent, Rauch & Becker.
between the atmospheric cutoff at 310nm and 380nm where silver coatings drop steeply in sensitivity. Ge, Ru. Pd, Ag, Tm, Yb, Lu and Ir are all important tracers of SNII ejecta and in some cases the s-process that are only measured blue-ward of 380nm in stellar spectra. Several other elements can be measured at redder wavelengths, but have their strongest and largest number of absorption features in the blue/near-UV. (What about UV case for IGM work? )
2.7.2 Specific science cases: detailed discussion
2.7.2.1 Stellar Abundances in the Local Group
TMT_DetailedScienceCase_v7_4_modAbraham.doc- 76 - Created on 2/22/2005 4:21 PM

Figure 37: The faint limit for obtaining spectra suitable for high-quality abundance analysis at the distance moduli of various stellar populations. This figure is for the case of old and intermediate age metal-poor populations. The stellar models are from Girardi et al. (2002, A&A, 391, 195). Courtesy, M. Bolte (UC Santa Cruz)
The understanding of the basics of the chemical evolution of the Galaxy and Universe has been one of the great advances in astronomy (and science) in the last three decades. The observations underpinning these investigations are typically high S/N (>80), 40000<R<80000 (where R≡λ/∆λ) at blue/ground-based UV wavelengths of relatively bright stars (V<17 for 10m class telescopes). Detailed abundance measurements for elements with different nucleosynthetic origins provide directly ground truth for models of core-collapse supernovae and the s-process and physical conditions in AGB stars. Less directly, these types of measurements, particularly for metal-poor stars, can be used to determine the initial mass function for the earliest generations of stars, track star formation rates (via the ratio of SNII- to SNI-produced
elements), identify substructure tracing the accumulation of sub-galactic-sized fragments in the halo of the Galaxy and identify the nature of Pop III objects via their nucleosynthetic fingerprints. The frontiers to be explored in this area with the TMT and a UV/optical high-resolution spectrometer are those opened up by extending the faint limit by approximate three magnitudes. There is already progress being made in the area of measuring the abundance of Fe and sometimes Ca in individual stars of Galactic companion dSph and the M31 halo. The 30m contribution will be to allow abundance analysis of the full chemical periodic table, Some specific examples are listed below.
2.7.2.1.1 Main-sequence stars in globular clusters: Star-to-star abundance differences among the giant stars within a given globular cluster have been measured for C, N, O elements and sometimes Al and Mg for more than two decades. Although often attributed to unexpectedly deep mixing in the stars, the first extensions of this work to the main-sequence show that the intra-cluster dispersions are seen even below the main-sequence turnoff. This result suggests that the star-to-star differences were set at the time of star formation in the clusters. Progress in this area requires significant samples of globular cluster main-sequence stars (V>18.5 in the
TMT_DetailedScienceCase_v7_4_modAbraham.doc- 77 - Created on 2/22/2005 4:21 PM

nearest clusters) in a number of clusters with different structural and overall abundance properties.
2.7.2.1.2 In-situ abundance studies in the Galactic Halo Our knowledge of the kinematics and abundance patterns in the outer Galactic halo is based in large part on relatively nearby stars whose orbits have brought them within a
few kpc of the Sun. In-situ studies of stars in the outer halo field and outer halo globular clusters will be routine with the TMT. There are a number of important questions to be resolved. The ages of the outer-halo globular clusters in the galaxy have been derived assuming the same run of [α/Fe] with [Fe/H] as has been measured for the near-halo clusters and field stars. For old populations, [∂Age/∂α]~-5Gyr/dex and the age differences determined for the outer-most clusters could be easily erased (or enhanced) when accurate measurements are made for stars in these clusters (Stetson et al., 1999,
aiabls
Tfwcfa
T
Figure 38: The same as figure 36 except solar-metallicity, younger stellar populations are considered. Courtesy, M. Bolte (UC Santa Cruz).
AJ, 117, 247). The chemical bundance properties of objects in the outer halo on orbits that do not bring them into the nner Galaxy may prove crucial to sorting out the assembly history of the Galaxy. This is n area in which little has been done and, because of the faintness of old giant stars eyond 50 kpc from the Galactic center, the current generation of telescopes will most ikely remain in the role of identifying bona-fida denizens of the distant halo for followup tudies with TMT.
2.7.2.1.3 Detailed abundance measurements for significant samples of stars in Local Group Dwarfs
he dwarf galaxies surrounding the Galaxy have shown remarkably diverse star-ormation histories based on color-magnitude diagram (CMD) studies. Because of the ell-known degeneracies of age and metallicity in the CMD, to properly interpret the
omplex CMDs of the dSph requires color-independent determination of at least [Fe/H] or individual stars. The mix of abundance ratios for stars in individual dSph galaxies lso show the evidence of complex and varied star formation histories in the local dSph
MT_DetailedScienceCase_v7_4_modAbraham.doc- 78 - Created on 2/22/2005 4:21 PM

galaxies (although these studies are very difficult in the 10-8m telescope era and only their early stages). The most obvious differences come about as a result of different mixes of the products of SNII (occurring on short time scales) and SNI, but there are a number of abundance ratio signatures that can probe the star-formation histories in even more detail. One application of studies that characterize the abundance ratios – ranges and trends with dSph properties – is to compare the results with the abundance characteristics of the halo field populations. This will be a powerful test of the hierarchical formation scenarios for assembly of the early Galaxy from dSph-like objects. Although the full R=40000 spectral resolution is best for this type of study, this is an area for which lower spectral resolution could be traded for multiplexing capability.
2.7.2.1.4 Precision Radial Velocities: Planets around K and M dwarfs As of 2005, the vast majority of extra-solar planets have been discovered through radial velocity monitoring of host stars of planets and planetary systems. The presence of planets is inferred via the small periodic reflex motions of the host stars around the system center of mass. The most successful of the programs has used the Keck 1 10m telescope and HIRES spectrometer to discover more than 100 extra-solar planets (e.g. Marcy et al., 2005, ApJ, 619, 570). Key to the program is extremely high stability and velocity precision (~2 m/sec per observation). The stability is provided in large part by the location of HIRES in a controlled environment on the Keck Nasmyth platform. The velocity precision is achieved through a combination of high S/N (~300), high spectral resolution (~45000), the superposition of wavelength fiducial lines via an iodine cell and by use of wide spectral coverage (averaging over many spectral features). The searches have concentrated on nearby, bright stars, predominantly F- and G-type stars because of the high S/N requirement. To date, extra-solar planets discovered via these techniques have been gas giants with masses generally larger than that of Jupiter. However, with ever-improving velocity precision, sub-Jupiter-mass planets have been recently discovered, with the current record Msin(i) ~0.1MJupiter (=30MEarth). The distribution of Msin(i) rises to lower mass with a power law dM/dN ∼ M-1 suggesting that planets with 1 – 30 Earth masses are numerous. The exciting step forward in this area for a TMT is the potential for discovery of extra-solar planets into the regime of terrestrial planets. A principal important factor will be the extension of the search to lower-mass main-sequence stars. The 10x improvement in light-gathering capability of TMT will increase the stellar sample by a factor of 30 with the majority of the added stars being low-luminosity K and M stars. The smaller inertial mass of the host stars directly lowers the planet-mass detection lower limit. The Earth induces a motion of 3 cm/sec in the Sun – beyond the reach of even TMT. However, by extending the planet searches to M stars and improving the measurement precision from 2 to 1m/sec with TMT it will be possible to detect extra-solar planets with masses as low as 5 Earth masses in stellar habitable zone. Another important direction to explore with very high S/N spectra is the radially-resolved characterization of atmospheric motions in the parent stars. Velocity “jitter” has been a limiting factor for pushing velocity precision below the 1m/sec level. By temporally resolving absorption line profiles for lines that form in different layers of a star’s atmosphere, it may be possible to characterize the jitter
TMT_DetailedScienceCase_v7_4_modAbraham.doc- 79 - Created on 2/22/2005 4:21 PM

in a way that will allowed a component of it to be corrected for. Investigations into this area are underway now and in the TMT era will likely allow a significant expansion of the sample of stars for which such techniques will lead to <1m/sec precision .
2.7.2.1.5 IGM abundances and kinematics to z=6.5 Get Jason P. & Sara to contribute some words. Surface density of sources, overview of science.
2.7.2.1.6 Variation of the Fine Structure Constant Measuring the variation of fundamental physical constants, such as the fine-structure constant α is one of the most profound applications of quasar absorption line spectroscopy (e.g. Chand et al., 2005, A&A 430, 47). By measuring small shifts in the observed wavelengths of various resonance transitions in high redshift QSO absorbers (such as the damped Lyman alpha systems, DLAs) claims have been made that α has changed by ~0.005% over the last 10 gigayears. The change in α is inferred from relative absorption line velocities shifted by ~100 m/s. The detection of such a small shift is technically challenging, particularly since the data used for this work were obtained at a resolution of R~45000 (~6 km/s). Indeed, some groups have been unable to reproduce this result, and there remains considerable debate over its veracity. HROS would provide two important strides forward in this field, providing a factor of 10 increase in velocity accuracy which could potentially resolve the currently discrepant results. Firstly, even with a factor of ten (i.e. larger aperature, but no AO benefit) improvement over current instruments such as HIRES, HROS could observe the current sample of DLAs at R~120,000 whilst maintaining the required S/N. Perhaps more importantly, with the inclusion of an iodine cell, the accuracy of the wavelength scale would be improved to ~5 m/s. Since extremely high S/N ratios are required to extract spectra from iodine cell data, only one QSO with a DLA is (barely) bright enough ($V \sim 14.5$) to be observed with an iodine cell on an 8-10m telescope. Pushing down a further 3 magnitudes would bring some 50 more QSOs into the reach of an iodine cell. The highly successful techniques which have been applied to detect extra-solar planets could therefore be used to detect a varying fine structure constant.
TMT_DetailedScienceCase_v7_4_modAbraham.doc- 80 - Created on 2/22/2005 4:21 PM

2.8 WIRC: Wide-field InfraRed Camera 2.8.1 Overview of capability and expected performance
WIRC is a direct imaging camera to work behind the moderate field, diffraction-limited AO system (likely some form of MCAO). It should provide superlative diffraction-limited images through a variety of filters, providing excellent photometric accuracy and high-quality astrometric information. The performance of WIRC is closely tied to the AO system feeding it.
2.8.2 Overview of anticipated science areas
• High-precision, faint-object astrometry. Galactic center “wide-field” astrometry, parallax of faint stars to distances > 1Kpc, proper motions throughout the Galaxy and proper motions of galaxies in the Local Group will all be within the reach of the TMT. The TMT emphasis in this area will be for sources fainter than V~19, the faint limit of the NASA SIM mission.
• Stellar populations and star formation histories of galaxies in the local
Universe. Color-magnitude diagram based studies to recover chemical enrichment and star-formation histories for galaxies to at least 10 Mpc will possible. This will dramatically increase the sample of galaxies for which detailed evolutionary histories will be derived allowing the cosmic dispersion at a given Hubble type to be measured and the first direct determinations of star formation histories in gE galaxies. Disentangling stellar populations in the color-magnitude plane requires colors and magnitudes measured with a precision ≤ 0.05 mag.
Created on 2/22/2005 4:21 PM
2.8.3 Specific Science Cases 2.8.3.1 Stellar
Populations in the Local Universe
The ``in situ’’ study of the process of galaxy formation in which galaxies are observed at large z and lookback time has begun in the 8-10m telescope era and will be revolutionized by the TMT. A powerful alternative approach to understanding the processes of galaxy formation and evolution is to use the z=0 stellar
T
MT_DetailedScienceCase_v7_4_modAbraham.doc- 81 - Figure 39: Model near-IR CMD for a wide range of ages and [Fe/H] ranging from solar to -2.4. A limiting photometric magnitude of K=26.5 is indicated for the distances of M31 to the Virgo cluster. Olsen et al., 2003,
``fossil record’’. The basic understanding of the star formation, chemical evolution, and accretion history of the Galaxy was developed based on color-magnitude diagram studies, abundances of elements in stars from different Galactic populations, and the relations between stellar kinematics, ages and metallicities. With HST and 8-10m telescopes, resolved-star stellar populations work has been extended to the Galactic dwarf galaxy companions and to some extent to M31 and its companions. With the TMT + AO, CMD “decomposition” studies can be carried out to at least 10 Mpc and direct detection of old stellar population main sequence turnoffs will be possible throughout the Local Group.
2.8.3.1.1 Local Universe Galaxy Sample With the current generation of facilities (8/10m groundbased telescopes and the 2.4m HST), resolved-star population studies have been restricted to the Galaxy, the nearby Galaxy companion dwarf galaxies and, for giant stars brighter than the level of the horizontal branch, M31 and some if its companions. The extension of this type of study from the Galaxy and M31 groups to galaxies within 6Mpc increases the sample of large, Sb spirals from two to eight galaxies, the number of luminous Sc galaxies from zero to eleven galaxies, the number of gE galaxies from zero to one (this increases to four if the techniques can be used to 10Mpc) and the number of LMC-type dIrr galaxies from one to twelve. Table 1 lists the galaxy groups known to 10 Mpc.
Group Distance (Mpc) # Galaxies Declination comments M31 0.7 9 +20 Sculptor 2.5 18 -31 NGC253
starburst Sb Canes I 3.1 30 +36 M81 3.8 11 +69 Interacting
pair NGC 5128 3.8 15 -41 Nearest gE M101 6.3 7 +54 NGC 5194 6.3 17 +44 Canes II 7.8 22 +45 Leo I 9.6 25 +13 gE
2.8.3.1.2 Resolved Stellar Populations: Photometry The color-magnitude diagram (CMD) studies of star clusters and dwarf galaxy companions of the Galaxy have been used with great success to estimate distances, overall metallicity and age, and to separate out distinct (in metallicity and age) populations (e. g. Smecker-Hane, Stetson & Hesser, 1994, AJ, 108, 507.). Specific CMD features of importance are:
TMT_DetailedScienceCase_v7_4_modAbraham.doc- 82 - Created on 2/22/2005 4:21 PM

• Apparent level of the horizontal branch (HB) as a standard candle for distance measurements.
• The apparent brightness of the tip of the RGB for estimating distances.
• The apparent magnitude of the main-sequence turnoff (MSTO) for direct
estimates of the age(s) of a stellar population.
• Slope and color of the red-giant branch (RGB) along with its intrinsic color width for estimating [Fe/H] and metallicity distributions.
• The morphology of the horizontal branch/red clump.
• The detailed distribution of stars in the CMD, usually interpreted via comparison
to synthetic CMDs generated assuming a range of star-formation histories. For reference, Table 2 shows the apparent brightness of these fiducial CMD features at the distances of M31 (0.75Mpc), the M81 group (4Mpc), NGC3379 (giant elliptical in the Leo group at 10Mpc) and the Virgo cluster.
MSTO (10Gyr) Horizontal Branch RGB Tip I/K I/K I/K
Absolute 3.8/3.2 0/-1.2 -4/-7.5 M31 28.1/27.5 24.3/23.1 20.3/16.8 M81 31.5/30.9 27.8/26.6 24.8/20.3 NGC 3379 33.8/33.2 30.0/28.8 26.0/22.5 Virgo 35.2/34.7 31.5/30.3 27.5/24.0
- Created on 2/22/2005 4:21 PM
Robust techniques have been developed for extracting the ages, abundances, distances, reddenings, and mass functions from field star CMDs (e.g. Dolphin, 1997; Harris &
Zaritsky, 2001). In the following sections simulated 30m+MCAO images, standard crowded-field photometric analysis and the Dolphin (1997) analysis procedures to demonstrate the capability and limitations of a TMT for measuring star formation histories in galaxies beyond the Milky Way. These simulations were carried out by Olsen, Blum & Rigaut (2003, hereafter OBR) and are described in more detail in this paper. The general approach is to construct images of fields in galaxies from the
T
MT_DetailedScienceCase_v7_4_modAbraham.doc- 83Figure 40: Recovered color-magnitude data for simulated image of M32. The green, blue and red lines show the input stellar populations in this plane. Courtesy, K. Olsen, NOAO.

distance of M31 to Virgo using a model TMT+MCAO delivered point-spread-function and a range of star formation histories. The input stellar population luminosity function and CMD locations are drawn from the models of Girardi et al. (2000). The full range of population mixtures has not yet been explored, but several cases have been evaluated. The point spread functions (PSFs) used to represent stars have diffraction-limited cores with FWHM of 0.009 arcsec in J and 0.015 arcsec in K, and Strehl ratios of 0.2 in J and 0.6 in K. Two idealized cases have been realized. For some of the simulations, a PSF with no spatial variations was used. For the rest of the simulations a spatially-variable PSF was used. The variable PSFs were generated by Brent Ellerbroek, and have Strehl ratios that decrease from ~85% to ~80% from center to edge in K and from ~62% to ~50% in J.
2.8.3.1.3 Simulations: M32
The first example of the method is for M32, the dE companion of M31. The simulated image is centered on the M32 core and is 20 arcsec on a side. Figure 35 shows the
DAa nthr
Annat
TM
Figure 41: Left panel, Input stellar populations for the simulated image of M32. Right panel, recovered stellar populations based on Figure 35 CMD analysis.
OPHOT/ALLSTAR CMD derived from OBR’s simulated TMT images of M32 using on-variable PSF and modest Strehls. In this idealized case, it is easy to distinguish the ee input sequences in the recovered CMD of the core of M32.
2.8.3.1.4 Simulations: NGC 3379
2.8.3.2 The Galactic Center 2.8.4 Additional requirements on the architecture of an MCAO imager used
for astrometry astrometric MCAO system must constrain Zernike modes 4-6 using either a single ural guide star (NGS) which is bright enough to sense defocus and astigmatism or
T_DetailedScienceCase_v7_4_modAbraham.doc- 84 - Created on 2/22/2005 4:21 PM

provide two additional tip-tilt stars, making their total number 3. The differential tilts between the three tip-tilt stars constrain these modes. This requirement occurs because the tip and tilt of laser guide stars (LGS) are undetermined. As a consequence, the information brought by them is insufficient for a full solution of the tomographic problem. In addition to tip and tilt, differential astigmatism and defocus between the two DMs is unconstrained. These three unconstrained modes do not influence on-axis image quality, but produce differential tilt between the different parts of the field of view. If multiple tip-tilt sensors are used, the MCAO system must provide for a facility to align them. If the tip-tilt sensors for the three NGSs are misplaced, the MCAO system will compensate these errors in the closed loop, hence the field will be distorted. For example, the plate scale will change if the upper DM has a static defocus. Calibration procedures must be applied to ensure that these errors do not compromise the astrometric performance of an MCAO system (e.g., flattening of the upper DM before closing the loop). The limitations on astrometric accuracy imposed by the atmosphere are discussed in detail in TMT technical report #XX (Graham 2003).
TMT_DetailedScienceCase_v7_4_modAbraham.doc- 85 - Created on 2/22/2005 4:21 PM