dramatic changes in dna conductance with stretching...
TRANSCRIPT
Nanoscale
PAPER
Cite this: Nanoscale, 2016, 8, 16044
Received 27th April 2016,Accepted 7th August 2016
DOI: 10.1039/c6nr03418g
www.rsc.org/nanoscale
Dramatic changes in DNA conductance withstretching: structural polymorphism at a criticalextension†
Saientan Bag,a Santosh Mogurampelly,‡a William A. Goddard IIIb,c andPrabal K. Maiti*a
In order to interpret recent experimental studies of the dependence of conductance of ds-DNA as the
DNA is pulled from the 3’end1–3’end2 ends, which find a sharp conductance jump for a very short (4.5%)
stretching length, we carried out multiscale modeling to predict the conductance of dsDNA as it is
mechanically stretched to promote various structural polymorphisms. We calculate the current along the
stretched DNA using a combination of molecular dynamics simulations, non-equilibrium pulling
simulations, quantum mechanics calculations, and kinetic Monte Carlo simulations. For 5’end1–5’end2
attachments we find an abrupt jump in the current within a very short stretching length (6 Å or 17%)
leading to a melted DNA state. In contrast, for 3’end1–3’end2 pulling it takes almost 32 Å (84%) of stret-
ching to cause a similar jump in the current. Thus, we demonstrate that charge transport in DNA can
occur over stretching lengths of several nanometers. We find that this unexpected behaviour in the B to S
conformational DNA transition arises from highly inclined base pair geometries that result from this
pulling protocol. We found that the dramatically different conductance behaviors for two different pulling
protocols arise from how the hydrogen bonds of DNA base pairs break.
Introduction
Understanding how charge transport in dsDNA depends on itsenvironment is important for designing such applications asbio-sensors or nanowires1–5 and for understanding oxidativedamage6–11 and DNA repair. The charge transport propertiesof DNA have previously been reported to be that of aninsulator,12,13 a conductor,14–16 a semiconductor, and even asuperconductor.17 This lack of reproducibility and the strongdependence on the external environment have made thesubject of DNA conductance quite controversial. The chargetransport in DNA is mediated by π–π stacking interaction(coupling) through its bases, which in turn is controlled by therise and twist of the bases and by the externalenvironment.18–20 Consequently, to obtain reproducible DNA
conductance measurements, the experiments necessarilyrequire a reproducible electronic coupling between the bases,which is difficult to achieve experimentally.21–23 Sophisticatedsingle molecule experiments on DNA by Xu et al.,19 Legrandet al.24 and Song et al.25 have concluded that26 DNA is asemiconductor under ambient conditions. In ionic solutionsin which DNA is able to keep its native state, DNA mainly exhi-bits semiconducting properties. In these experiments19,24,25
the DNA was kept in an ionic environment between two elec-trodes and the current was measured either by scanning tun-neling microscopy or by the break junction technique.
Extensive theoretical calculations have been reported on thecharge transport of DNA. Cramer et al.27 used the Marcus–Hush formalism to calculate the I–V characteristics of the DNAwhere the Marcus–Hush parameter was calculated using theextended Su–Schrieffer–Heeger Hamiltonian. Mallajosyula et al.18
combined MD simulations using a force field with first principlesquantum mechanics (QM) calculations to calculate the trans-mission coefficient for charge transport through DNA.
Recently, Tao et al.28 studied the dependence of the conduc-tance of ds-DNA as DNA is pulled from the 3′end1–3′end2ends. They observed a sharp conductance jump for a very short(4.5%) stretching length, which they attributed to the breakingof hydrogen bonds between the terminal base-pairs at the DNAtermini. In a related study, they compared the critical stretching
†Electronic supplementary information (ESI) available. See DOI: 10.1039/c6nr03418g‡Present address: Department of Chemical Engineering, The University of Texasat Austin, Austin, Texas 78712, USA.
aCenter for Condensed Matter Theory, Department of Physics, Indian Institute of
Science, Bangalore 560012, India. E-mail: [email protected] Centenary Chair Professor, Department of Physics, Indian Institute of
Science, Bangalore 560012, IndiacMaterials and Process Simulation Center, California Institute of Technology,
Pasadena, California 91125, USA
16044 | Nanoscale, 2016, 8, 16044–16052 This journal is © The Royal Society of Chemistry 2016
Publ
ishe
d on
08
Aug
ust 2
016.
Dow
nloa
ded
by C
alif
orni
a In
stitu
te o
f T
echn
olog
y on
06/
09/2
016
17:4
3:12
.
View Article OnlineView Journal | View Issue
length (the length at which the conduction jump occurs) ofvarious closed-end and free end DNA systems.29 Tao et al.30 alsostudied the molecular conductance and piezoresistivity of dsDNAfor various lengths and sequences. In a very recent study, Artéset al.31 reported the increase in conductance of the DNA duringits conformational change from B to A form.
In addition to the stretching of DNA from 3′end1–3′end2 asstudied by Tao et al., there are primarily three other modes tostretch DNA, leading to very different kinds of structures32,33
depending on the stretching protocol. This raises the questionof how the conductance in dsDNA depends on the mode ofmechanical stretching.
In this paper we report a semiclassical Marcus–Hush typecalculation of the charge transport through the dsDNA basesand present the current vs. stretching length behavior for eachof the four pulling protocols considered in our simulations.Our calculations combine MD simulations, non-equilibriumpulling simulations, QM calculations, and kinetic Monte Carlosimulations. In all four cases, the jump in current was seen asthe DNA is stretched but at different stretching lengths. Thestretching length at which the jump in current occurs isdefined as the critical stretching length lc. For the case of5′end1–5′end2 pulling, we found a short lc of 6 Å, leading to amelted DNA state, while for 3′end1–3′end2 pulling, we found ahigh lc of 32 Å, before the transformation from B to S-DNA.The lc for the other two protocols (3′end1–5′end2 and3′end1–5′end1) was found to have intermediate values.
The paper is organized as follows: in the next section wedescribe the all atom MD simulations and the non-equilibriumpulling simulations which were used to predict the structuresarising from mechanical pulling. In the Methodology section wedescribe the Marcus–Hush formalism and the calculation schemefor the current through the DNA kept between two electrodes. Theresults are described in the section Results and discussion. In thesection Summary and conclusion we summarize the results.
Simulation details
The initial structures of the duplex DNA was generated usingthe nucgen module available in the AMBER suite of34 pro-grams. We then simulated dsDNA with lengths of 12, 14, 16,18 and 20 base pairs, using the following sequences:
• d(CGCGAATTCGCG),• d(CGCGAAATTTCGCG),• d(CGCGAAAATTTTCGCG),• d(CGCGAAAAATTTTTCGCG) and• d(CGCGAAAAAATTTTTTCGCG).Each dsDNA structure was solvated in a box of water using
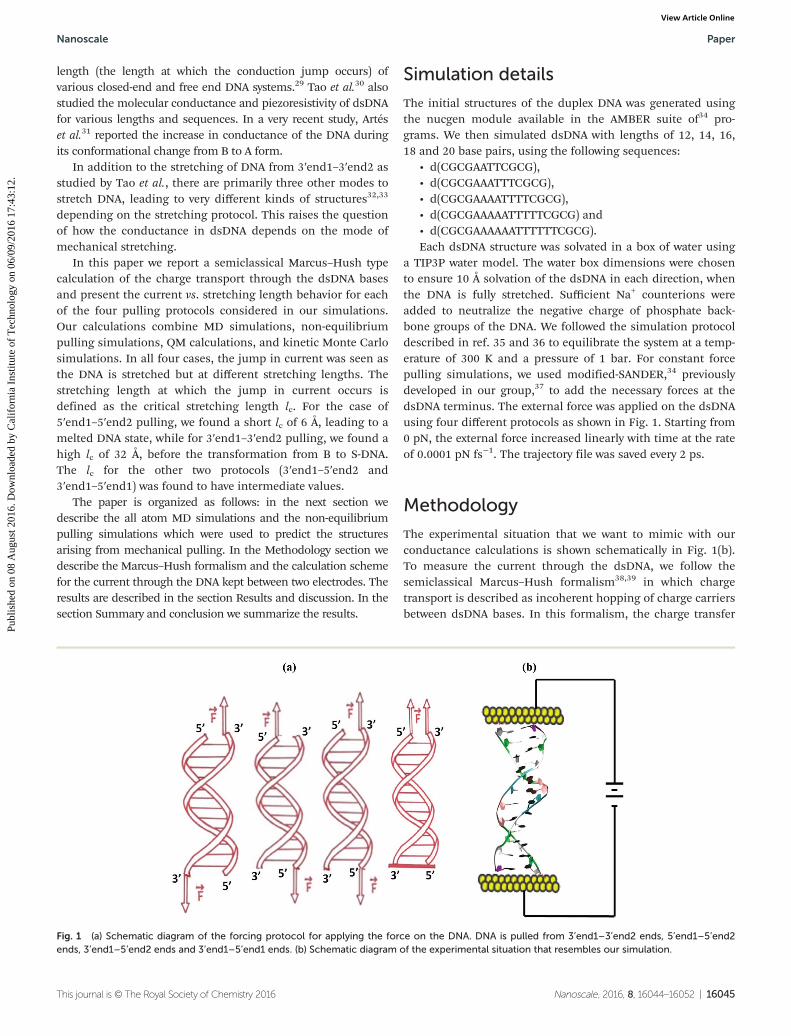
a TIP3P water model. The water box dimensions were chosento ensure 10 Å solvation of the dsDNA in each direction, whenthe DNA is fully stretched. Sufficient Na+ counterions wereadded to neutralize the negative charge of phosphate back-bone groups of the DNA. We followed the simulation protocoldescribed in ref. 35 and 36 to equilibrate the system at a temp-erature of 300 K and a pressure of 1 bar. For constant forcepulling simulations, we used modified-SANDER,34 previouslydeveloped in our group,37 to add the necessary forces at thedsDNA terminus. The external force was applied on the dsDNAusing four different protocols as shown in Fig. 1. Starting from0 pN, the external force increased linearly with time at the rateof 0.0001 pN fs−1. The trajectory file was saved every 2 ps.
Methodology
The experimental situation that we want to mimic with ourconductance calculations is shown schematically in Fig. 1(b).To measure the current through the dsDNA, we follow thesemiclassical Marcus–Hush formalism38,39 in which chargetransport is described as incoherent hopping of charge carriersbetween dsDNA bases. In this formalism, the charge transfer
Fig. 1 (a) Schematic diagram of the forcing protocol for applying the force on the DNA. DNA is pulled from 3’end1–3’end2 ends, 5’end1–5’end2ends, 3’end1–5’end2 ends and 3’end1–5’end1 ends. (b) Schematic diagram of the experimental situation that resembles our simulation.
Nanoscale Paper
This journal is © The Royal Society of Chemistry 2016 Nanoscale, 2016, 8, 16044–16052 | 16045
Publ
ishe
d on
08
Aug
ust 2
016.
Dow
nloa
ded
by C
alif
orni
a In
stitu
te o
f T
echn
olog
y on
06/
09/2
016
17:4
3:12
. View Article Online
rate ωik from the ith charge hopping site to the kth hopping siteis given by
ωik ¼ j Jikj2ℏ
ffiffiffiffiffiffiffiffiffiffiπ
λkBT
rexp � ΔGik � λð Þ2
4λkBT
� �ð1Þ
where Jik is the transfer integral, defined as
Jik ¼ hϕ ijĤjϕ ki ð2Þ
Here ϕi and ϕk are the diabatic wave functions localized on theith and kth sites, respectively. Ĥ is the Hamiltonian for the twosite system between which the charge transfer takes place,ΔGik is the free energy difference between the two sites, λ isthe reorganization energy, ℏ is Planck’s constant, kB is theBoltzmann constant, and T is the absolute temperature.
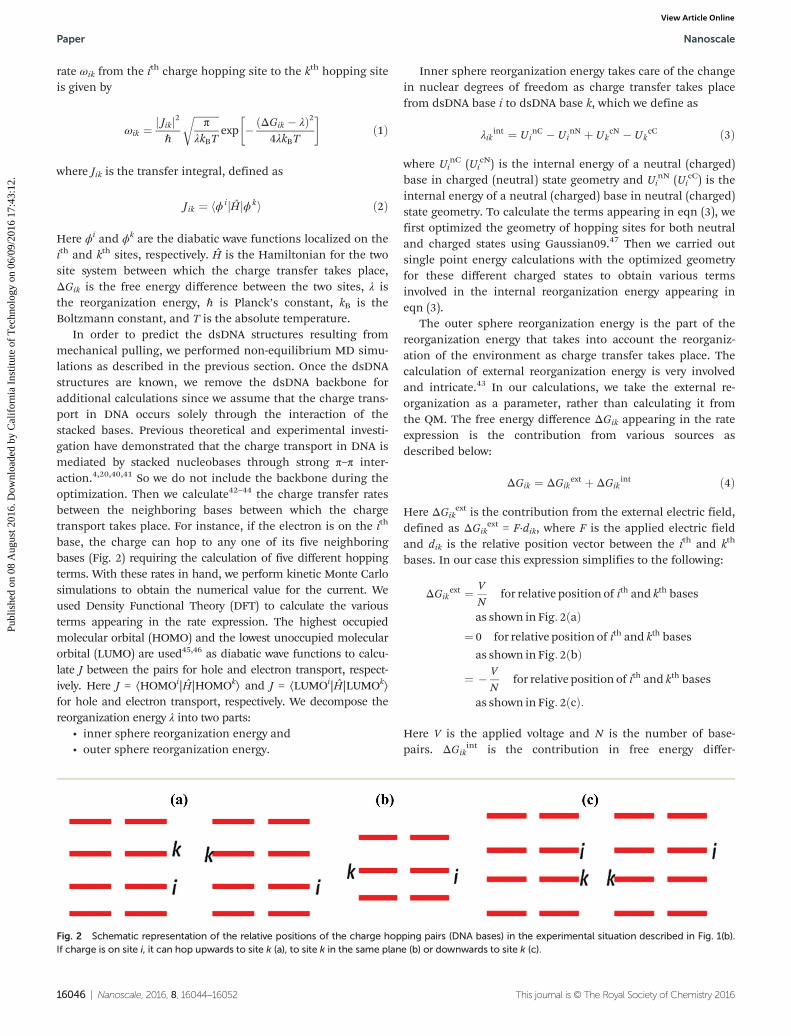
In order to predict the dsDNA structures resulting frommechanical pulling, we performed non-equilibrium MD simu-lations as described in the previous section. Once the dsDNAstructures are known, we remove the dsDNA backbone foradditional calculations since we assume that the charge trans-port in DNA occurs solely through the interaction of thestacked bases. Previous theoretical and experimental investi-gation have demonstrated that the charge transport in DNA ismediated by stacked nucleobases through strong π–π inter-action.4,20,40,41 So we do not include the backbone during theoptimization. Then we calculate42–44 the charge transfer ratesbetween the neighboring bases between which the chargetransport takes place. For instance, if the electron is on the ith
base, the charge can hop to any one of its five neighboringbases (Fig. 2) requiring the calculation of five different hoppingterms. With these rates in hand, we perform kinetic Monte Carlosimulations to obtain the numerical value for the current. Weused Density Functional Theory (DFT) to calculate the variousterms appearing in the rate expression. The highest occupiedmolecular orbital (HOMO) and the lowest unoccupied molecularorbital (LUMO) are used45,46 as diabatic wave functions to calcu-late J between the pairs for hole and electron transport, respect-ively. Here J = ⟨HOMOi|Ĥ|HOMOk⟩ and J = ⟨LUMOi|Ĥ|LUMOk⟩for hole and electron transport, respectively. We decompose thereorganization energy λ into two parts:
• inner sphere reorganization energy and• outer sphere reorganization energy.
Inner sphere reorganization energy takes care of the changein nuclear degrees of freedom as charge transfer takes placefrom dsDNA base i to dsDNA base k, which we define as
λikint ¼ Ui
nC � UinN þ Uk
cN � UkcC ð3Þ
where UinC (Ui
cN) is the internal energy of a neutral (charged)base in charged (neutral) state geometry and Ui
nN (UicC) is the
internal energy of a neutral (charged) base in neutral (charged)state geometry. To calculate the terms appearing in eqn (3), wefirst optimized the geometry of hopping sites for both neutraland charged states using Gaussian09.47 Then we carried outsingle point energy calculations with the optimized geometryfor these different charged states to obtain various termsinvolved in the internal reorganization energy appearing ineqn (3).
The outer sphere reorganization energy is the part of thereorganization energy that takes into account the reorganiz-ation of the environment as charge transfer takes place. Thecalculation of external reorganization energy is very involvedand intricate.43 In our calculations, we take the external re-organization as a parameter, rather than calculating it fromthe QM. The free energy difference ΔGik appearing in the rateexpression is the contribution from various sources asdescribed below:
ΔGik ¼ ΔGikext þ ΔGik
int ð4Þ
Here ΔGikext is the contribution from the external electric field,
defined as ΔGikext = F·dik, where F is the applied electric field
and dik is the relative position vector between the ith and kth
bases. In our case this expression simplifies to the following:
ΔGikext ¼ V
Nfor relative position of ith and kth bases
as shown in Fig: 2ðaÞ¼ 0 for relative position of ith and kth bases
as shown in Fig: 2ðbÞ¼ � V
Nfor relative position of ith and kth bases
as shown in Fig: 2ðcÞ:
Here V is the applied voltage and N is the number of base-pairs. ΔGik
int is the contribution in free energy differ-
Fig. 2 Schematic representation of the relative positions of the charge hopping pairs (DNA bases) in the experimental situation described in Fig. 1(b).If charge is on site i, it can hop upwards to site k (a), to site k in the same plane (b) or downwards to site k (c).
Paper Nanoscale
16046 | Nanoscale, 2016, 8, 16044–16052 This journal is © The Royal Society of Chemistry 2016
Publ
ishe
d on
08
Aug
ust 2
016.
Dow
nloa
ded
by C
alif
orni
a In
stitu
te o
f T
echn
olog
y on
06/
09/2
016
17:4
3:12
. View Article Online
ence due to different internal energies, which can be writtenas
ΔGikint ¼ Ui
cC � UinN þ Uk
cC � UknN ð5Þ
where UicC (Ui
nN) is the internal energy of base i in the charged(neutral) state and geometry. We calculated ωik for all hoppingpairs and simulate the charge transport dynamics using thekinetic Monte Carlo (MC) method.
We emphasize here that we have only calculated the chargetransport rates between the bases, whereas to completely simu-late the experimental situation one should also calculate therates between the base and the electrode. We have not expli-citly calculated these rates. The explicit calculation scheme forthese rates can be found in an article by Rosa Di Felice’sgroup.48 These rates are chosen such that the calculated con-ductivity becomes independent of these rates (see ESI sectionI†). Consequently, the conductivity that we report here isexpected to correspond to the intrinsic conductivity of theDNA.
For kinetic MC, we developed a code44 with the followingalgorithm. We assign a unit positive charge (for hole trans-port) or negative charge (electron transport) to any hoppingsite i. At this point we initialize the time as t = 0. If site i has Nneighbours, then the waiting time τ for the charge is calcu-lated according to the equation:
τ ¼ �ω�1i lnðr1Þ ωi ¼
XNk¼1
ωik
" #ð6Þ
and time is updated as t = t + τ. Here k is the index of theneighbours (the hopping sites to which the charge can hop)coupled to the particular hopping site i and r1 is a uniformrandom number between 0 and 1. To decide where the chargewill hop among N neighbours, we chose the largest k for whichPkωik
ωi� r2. Here k is the index of the neighbours of site i and
r2 is another uniform random number between 0 and 1. Theabove condition will ensure that the side k is selected with
probabilityωik
ωi. Next the position of the charge is updated and
the above process is repeated. The current through the DNA iscalculated as follows:
I ¼ ehvi ¼ ehli=t⟨v⟩ is the average velocity of the charge and ⟨l⟩ is the averagedistance that the charge has moved in time t.
Results and discussion
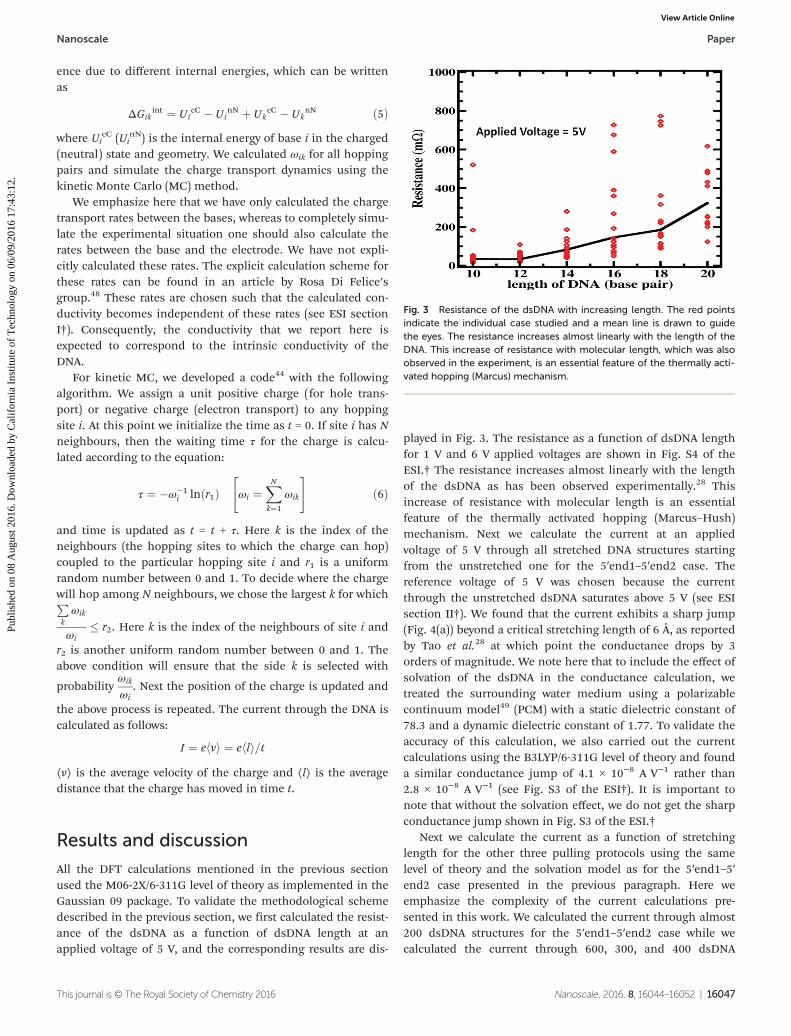
All the DFT calculations mentioned in the previous sectionused the M06-2X/6-311G level of theory as implemented in theGaussian 09 package. To validate the methodological schemedescribed in the previous section, we first calculated the resist-ance of the dsDNA as a function of dsDNA length at anapplied voltage of 5 V, and the corresponding results are dis-
played in Fig. 3. The resistance as a function of dsDNA lengthfor 1 V and 6 V applied voltages are shown in Fig. S4 of theESI.† The resistance increases almost linearly with the lengthof the dsDNA as has been observed experimentally.28 Thisincrease of resistance with molecular length is an essentialfeature of the thermally activated hopping (Marcus–Hush)mechanism. Next we calculate the current at an appliedvoltage of 5 V through all stretched DNA structures startingfrom the unstretched one for the 5′end1–5′end2 case. Thereference voltage of 5 V was chosen because the currentthrough the unstretched dsDNA saturates above 5 V (see ESIsection II†). We found that the current exhibits a sharp jump(Fig. 4(a)) beyond a critical stretching length of 6 Å, as reportedby Tao et al.28 at which point the conductance drops by 3orders of magnitude. We note here that to include the effect ofsolvation of the dsDNA in the conductance calculation, wetreated the surrounding water medium using a polarizablecontinuum model49 (PCM) with a static dielectric constant of78.3 and a dynamic dielectric constant of 1.77. To validate theaccuracy of this calculation, we also carried out the currentcalculations using the B3LYP/6-311G level of theory and founda similar conductance jump of 4.1 × 10⁻⁸ A V−1 rather than2.8 × 10−8 A V−1 (see Fig. S3 of the ESI†). It is important tonote that without the solvation effect, we do not get the sharpconductance jump shown in Fig. S3 of the ESI.†
Next we calculate the current as a function of stretchinglength for the other three pulling protocols using the samelevel of theory and the solvation model as for the 5′end1–5′end2 case presented in the previous paragraph. Here weemphasize the complexity of the current calculations pre-sented in this work. We calculated the current through almost200 dsDNA structures for the 5′end1–5′end2 case while wecalculated the current through 600, 300, and 400 dsDNA
Fig. 3 Resistance of the dsDNA with increasing length. The red pointsindicate the individual case studied and a mean line is drawn to guidethe eyes. The resistance increases almost linearly with the length of theDNA. This increase of resistance with molecular length, which was alsoobserved in the experiment, is an essential feature of the thermally acti-vated hopping (Marcus) mechanism.
Nanoscale Paper
This journal is © The Royal Society of Chemistry 2016 Nanoscale, 2016, 8, 16044–16052 | 16047
Publ
ishe
d on
08
Aug
ust 2
016.
Dow
nloa
ded
by C
alif
orni
a In
stitu
te o
f T
echn
olog
y on
06/
09/2
016
17:4
3:12
. View Article Online
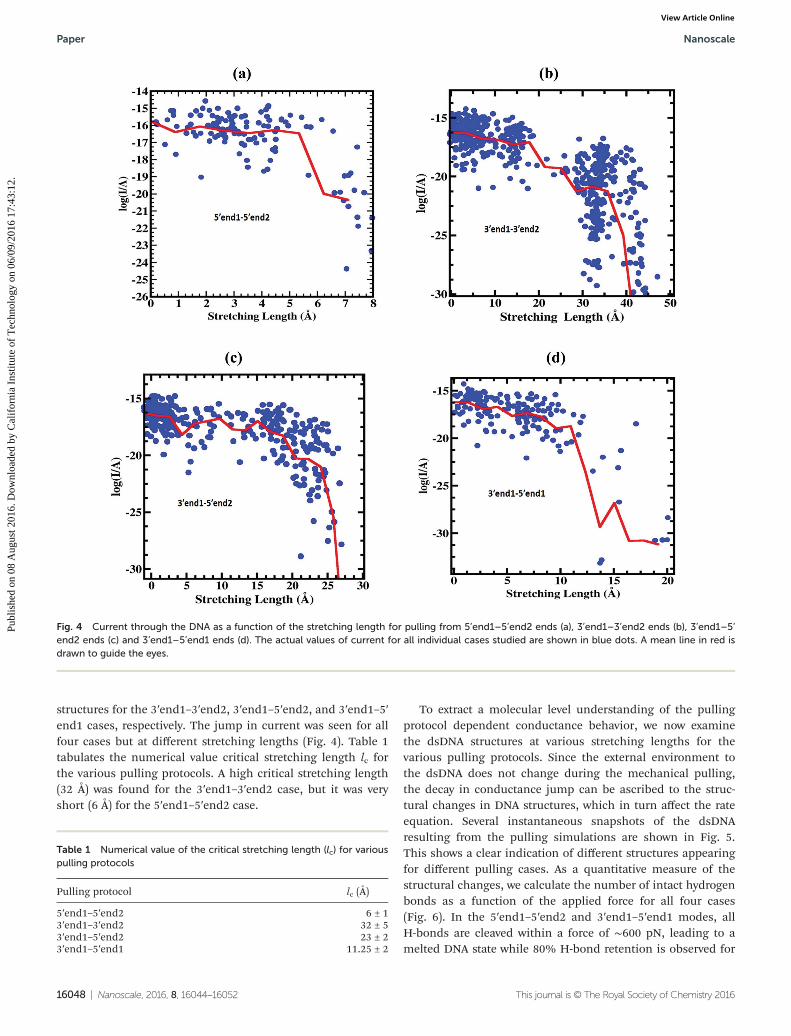
structures for the 3′end1–3′end2, 3′end1–5′end2, and 3′end1–5′end1 cases, respectively. The jump in current was seen for allfour cases but at different stretching lengths (Fig. 4). Table 1tabulates the numerical value critical stretching length lc forthe various pulling protocols. A high critical stretching length(32 Å) was found for the 3′end1–3′end2 case, but it was veryshort (6 Å) for the 5′end1–5′end2 case.
To extract a molecular level understanding of the pullingprotocol dependent conductance behavior, we now examinethe dsDNA structures at various stretching lengths for thevarious pulling protocols. Since the external environment tothe dsDNA does not change during the mechanical pulling,the decay in conductance jump can be ascribed to the struc-tural changes in DNA structures, which in turn affect the rateequation. Several instantaneous snapshots of the dsDNAresulting from the pulling simulations are shown in Fig. 5.This shows a clear indication of different structures appearingfor different pulling cases. As a quantitative measure of thestructural changes, we calculate the number of intact hydrogenbonds as a function of the applied force for all four cases(Fig. 6). In the 5′end1–5′end2 and 3′end1–5′end1 modes, allH-bonds are cleaved within a force of ∼600 pN, leading to amelted DNA state while 80% H-bond retention is observed for
Table 1 Numerical value of the critical stretching length (lc) for variouspulling protocols
Pulling protocol lc (Å)
5′end1–5′end2 6 ± 13′end1–3′end2 32 ± 53′end1–5′end2 23 ± 23′end1–5′end1 11.25 ± 2
Fig. 4 Current through the DNA as a function of the stretching length for pulling from 5’end1–5’end2 ends (a), 3’end1–3’end2 ends (b), 3’end1–5’end2 ends (c) and 3’end1–5’end1 ends (d). The actual values of current for all individual cases studied are shown in blue dots. A mean line in red isdrawn to guide the eyes.
Paper Nanoscale
16048 | Nanoscale, 2016, 8, 16044–16052 This journal is © The Royal Society of Chemistry 2016
Publ
ishe
d on
08
Aug
ust 2
016.
Dow
nloa
ded
by C
alif
orni
a In
stitu
te o
f T
echn
olog
y on
06/
09/2
016
17:4
3:12
. View Article Online
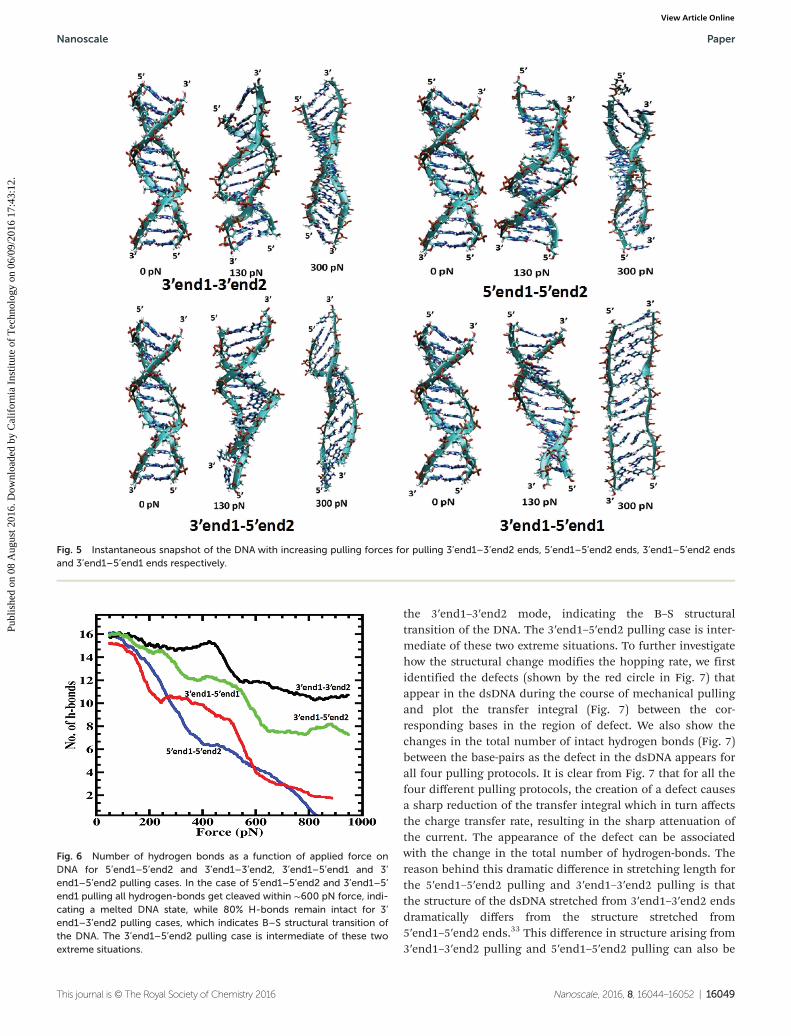
the 3′end1–3′end2 mode, indicating the B–S structuraltransition of the DNA. The 3′end1–5′end2 pulling case is inter-mediate of these two extreme situations. To further investigatehow the structural change modifies the hopping rate, we firstidentified the defects (shown by the red circle in Fig. 7) thatappear in the dsDNA during the course of mechanical pullingand plot the transfer integral (Fig. 7) between the cor-responding bases in the region of defect. We also show thechanges in the total number of intact hydrogen bonds (Fig. 7)between the base-pairs as the defect in the dsDNA appears forall four pulling protocols. It is clear from Fig. 7 that for all thefour different pulling protocols, the creation of a defect causesa sharp reduction of the transfer integral which in turn affectsthe charge transfer rate, resulting in the sharp attenuation ofthe current. The appearance of the defect can be associatedwith the change in the total number of hydrogen-bonds. Thereason behind this dramatic difference in stretching length forthe 5′end1–5′end2 pulling and 3′end1–3′end2 pulling is thatthe structure of the dsDNA stretched from 3′end1–3′end2 endsdramatically differs from the structure stretched from5′end1–5′end2 ends.33 This difference in structure arising from3′end1–3′end2 pulling and 5′end1–5′end2 pulling can also be
Fig. 5 Instantaneous snapshot of the DNA with increasing pulling forces for pulling 3’end1–3’end2 ends, 5’end1–5’end2 ends, 3’end1–5’end2 endsand 3’end1–5’end1 ends respectively.
Fig. 6 Number of hydrogen bonds as a function of applied force onDNA for 5’end1–5’end2 and 3’end1–3’end2, 3’end1–5’end1 and 3’end1–5’end2 pulling cases. In the case of 5’end1–5’end2 and 3’end1–5’end1 pulling all hydrogen-bonds get cleaved within ∼600 pN force, indi-cating a melted DNA state, while 80% H-bonds remain intact for 3’end1–3’end2 pulling cases, which indicates B–S structural transition ofthe DNA. The 3’end1–5’end2 pulling case is intermediate of these twoextreme situations.
Nanoscale Paper
This journal is © The Royal Society of Chemistry 2016 Nanoscale, 2016, 8, 16044–16052 | 16049
Publ
ishe
d on
08
Aug
ust 2
016.
Dow
nloa
ded
by C
alif
orni
a In
stitu
te o
f T
echn
olog
y on
06/
09/2
016
17:4
3:12
. View Article Online
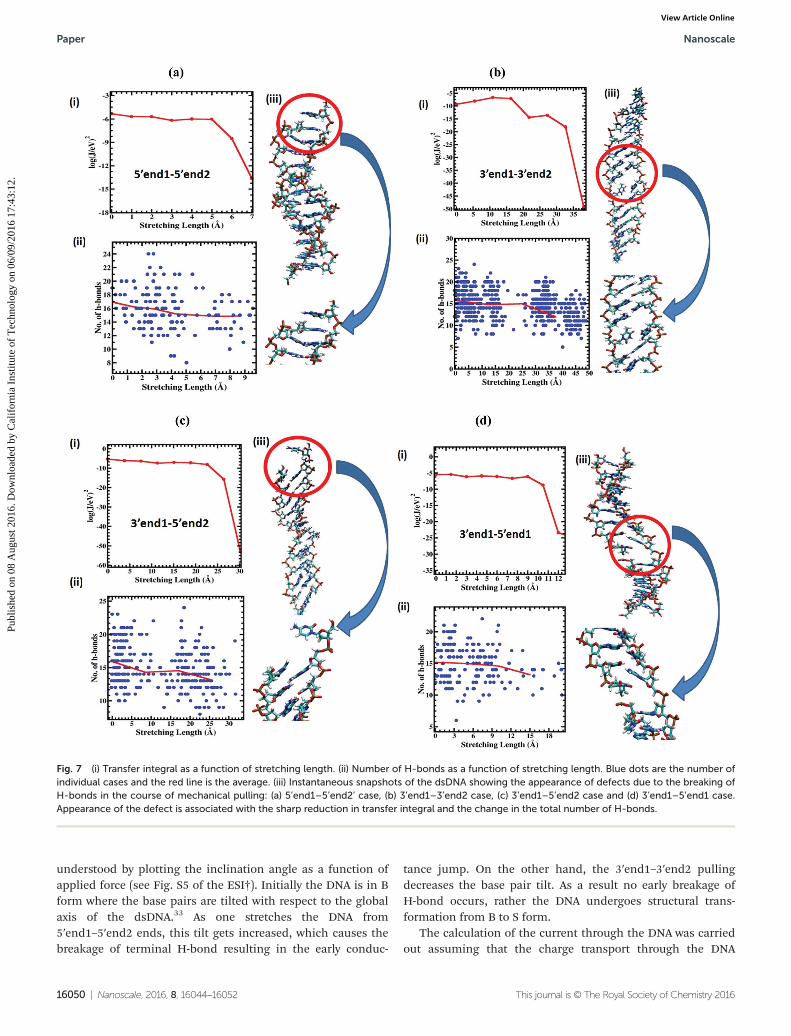
understood by plotting the inclination angle as a function ofapplied force (see Fig. S5 of the ESI†). Initially the DNA is in Bform where the base pairs are tilted with respect to the globalaxis of the dsDNA.33 As one stretches the DNA from5′end1–5′end2 ends, this tilt gets increased, which causes thebreakage of terminal H-bond resulting in the early conduc-
tance jump. On the other hand, the 3′end1–3′end2 pullingdecreases the base pair tilt. As a result no early breakage ofH-bond occurs, rather the DNA undergoes structural trans-formation from B to S form.
The calculation of the current through the DNA was carriedout assuming that the charge transport through the DNA
Fig. 7 (i) Transfer integral as a function of stretching length. (ii) Number of H-bonds as a function of stretching length. Blue dots are the number ofindividual cases and the red line is the average. (iii) Instantaneous snapshots of the dsDNA showing the appearance of defects due to the breaking ofH-bonds in the course of mechanical pulling: (a) 5’end1–5’end2’ case, (b) 3’end1–3’end2 case, (c) 3’end1–5’end2 case and (d) 3’end1–5’end1 case.Appearance of the defect is associated with the sharp reduction in transfer integral and the change in the total number of H-bonds.
Paper Nanoscale
16050 | Nanoscale, 2016, 8, 16044–16052 This journal is © The Royal Society of Chemistry 2016
Publ
ishe
d on
08
Aug
ust 2
016.
Dow
nloa
ded
by C
alif
orni
a In
stitu
te o
f T
echn
olog
y on
06/
09/2
016
17:4
3:12
. View Article Online
happens via incoherent hopping of charge through the bases.Since the DNA we have studied is short in length (12 bp), thetransport of charge will have also a contribution from tunnel-ing.50,51 However the main conclusions (critical stretchinglength) of the paper remain and do not change due to theinclusion of tunneling (see section X of the ESI†).
The stretching length vs. current calculation describedabove was performed at 300 K. To understand the effect oftemperature on the dynamics we also calculated the responsefor 5′end1–5′end2 pulling at 350 K and 250 K. The H-bond pro-files are shown in Fig. S7(a) of the ESI.† The dependence ofthe number of H-bonds as a function of force is similar at allthree temperatures but we found faster H-bond decay withforce at higher temperature. However, the conductance jumpat 6 Å remains largely unaffected by the temperature as shownin Fig. S7(b) of the ESI.† These results that the decrease inH-bonds with force is faster at high temperatures suggest thatthere is an activation process involving a barrier of 0.114 eV,52
whereas the temperature independence of the transition at 6 Ålength suggests that this may be geometrically related to thestiff bonds of the system.
The high voltage of 5 V was chosen from the experimentalV–I characteristics of the DNA, where it is observed that thecurrent saturates at high voltage. At low voltage the currentwill be low but the behavior of stretching length vs. currentplot does not change. To demonstrate this, we report in Fig. S8of the ESI† the current vs. stretching length for bias voltages of1 V and 0.5 V. The critical stretching length does not change atthe smaller bias, but of course the current is lower.
Our calculations have assumed that the external reorganiz-ation energy is zero. However introducing the external reorgan-ization energy would not affect the behavior of current as afunction of end-to-end length of the dsDNA; it only reducesthe total magnitude of the current (see ESI section VI†).
All the calculations reported in this section are for a specificsequence of the DNA. In order to show that the structuralchanges of the dsDNA (which are responsible for the conduc-tance jump) for various pulling protocols do not depend sig-nificantly on the specific sequence of the DNA, we carried outstudies for two other dramatically different sequences. Asshown in section IX (Fig. S9†) of the ESI,† the differentsequences lead to the same structural patterns with pulling.Thus we expect the results reported to be independent of thespecific DNA sequence.
Summary and conclusion
In summary, we have predicted the behaviour of currentthrough dsDNA molecules kept between two electrodes as westretch the molecule mechanically using four different proto-cols. Our calculation of current is based on the thermally acti-vated hopping mechanism, which takes into account a veryrealistic description of DNA structures and of the externalenvironment of the DNA. We found that the response ofcurrent through DNA under mechanical pulling depends
strongly on the pulling mechanism. We found an abrupt jumpin current of almost three orders of magnitude within a veryshort stretching length (6 Å) in the case of 5′end1–5′end2pulling while in the case of 3′end1–3′end2 pulling it takesalmost 32 Å of stretching (84%) to observe a similar jump incurrent. We demonstrate that this change of current is associ-ated with the change of the transfer integral Jik, which is mani-fested by the structural changes of DNA.
Thus these calculations provide an atomistic understandingof the behavior of DNA conductance under mechanicaltension. These results further explain the piezoresistive behav-ior30 of DNA, which is an important property for its appli-cation in nanodevices. The point at which there is a jump inconductance as a function of stretching will also help in devel-oping a DNA based mechanical switch.53 We expect that thesecalculations should help further development of DNAnanotechnology.
Acknowledgements
We thank DST, India for financial support. We thank DrAndres Jaramillo-Botero for helpful discussions. Support forWAG was from NSF EFRI-1332411.
References
1 C. R. Treadway, M. G. Hill and J. K. Barton, Chem. Phys.,2002, 281, 409–428.
2 S. Delaney and J. K. Barton, J. Org. Chem., 2003, 68, 6475–6483.
3 G. B. Schuster, Long-range charge transfer in DNA II,Springer Science & Business Media, 2004.
4 R. Endres, D. Cox and R. Singh, Rev. Mod. Phys., 2004, 76,195.
5 D. Porath, G. Cuniberti and R. Di Felice, in Long-RangeCharge Transfer in DNA II, Springer, 2004, pp. 183–228.
6 D. B. Hall, R. E. Holmlin and J. K. Barton, Nature, 1996,382, 731–735.
7 D. Ly, L. Sanii and G. B. Schuster, J. Am. Chem. Soc., 1999,121, 9400–9410.
8 E. Meggers, D. Kusch, M. Spichty, U. Wille and B. Giese,Angew. Chem., Int. Ed., 1998, 37, 460–462.
9 I. Saito, T. Nakamura, K. Nakatani, Y. Yoshioka, K. Yamaguchiand H. Sugiyama, J. Am. Chem. Soc., 1998, 120, 12686–12687.
10 B. Armitage, Chem. Rev., 1998, 98, 1171–1200.11 S. O. Kelley and J. K. Barton, Science, 1999, 283, 375–381.12 P. De Pablo, F. Moreno-Herrero, J. Colchero, J. G. Herrero,
P. Herrero, A. Baró, P. Ordejón, J. M. Soler and E. Artacho,Phys. Rev. Lett., 2000, 85, 4992.
13 Y. Zhang, R. Austin, J. Kraeft, E. Cox and N. Ong, Phys. Rev.Lett., 2002, 89, 198102.
14 H. Fink and C. Schönenberger, Nature, 1999, 398, 407–410.15 D. Porath, A. Bezryadin, S. De Vries and C. Dekker, Nature,
2000, 403, 635–638.
Nanoscale Paper
This journal is © The Royal Society of Chemistry 2016 Nanoscale, 2016, 8, 16044–16052 | 16051
Publ
ishe
d on
08
Aug
ust 2
016.
Dow
nloa
ded
by C
alif
orni
a In
stitu
te o
f T
echn
olog
y on
06/
09/2
016
17:4
3:12
. View Article Online
16 K. H. Yoo, D. H. Ha, J. O. Lee, J. W. Park, J. Kim, J. J. Kim,H. Y. Lee, T. Kawai and H. Y. Choi, Phys. Rev. Lett., 2001,87, 198102.
17 A. Y. Kasumov, M. Kociak, S. Gueron, B. Reulet, V. Volkov,D. Klinov and H. Bouchiat, Science, 2001, 291, 280–282.
18 S. S. Mallajosyula, J. C. Lin, D. L. Cox, S. K. Pati andR. R. P. Singh, Phys. Rev. Lett., 2008, 101, 176805.
19 B. Xu, P. M. Zhang, X. L. Li and N. J. Tao, Nano Lett., 2004,4, 1105–1108.
20 R. Venkatramani, S. Keinan, A. Balaeff and D. N. Beratan,Coord. Chem. Rev., 2011, 255, 635–648.
21 X. Cui, A. Primak, X. Zarate, J. Tomfohr, O. Sankey,A. Moore, T. Moore, D. Gust, G. Harris and S. Lindsay,Science, 2001, 294, 571–574.
22 M. Magoga and C. Joachim, Phys. Rev. B: Solid State, 1997,56, 4722.
23 F. Moresco, L. Gross, M. Alemani, K. H. Rieder, H. Tang,A. Gourdon and C. Joachim, Phys. Rev. Lett., 2003, 91,036601.
24 O. Legrand, D. Côte and U. Bockelmann, Phys. Rev. E: Stat.Phys., Plasmas, Fluids, Relat. Interdiscip. Top., 2006, 73,031925.
25 B. Song, M. Elstner and G. Cuniberti, Nano Lett., 2008, 8,3217–3220.
26 M. Wolter, P. B. Woiczikowski, M. Elstner and T. Kubař,Phys. Rev. B: Condens. Matter, 2012, 85, 075101.
27 T. Cramer, S. Krapf and T. Koslowski, J. Phys. Chem. C,2007, 111, 8105–8110.
28 C. Bruot, L. Xiang, J. L. Palma and N. Tao, ACS Nano, 2015,9, 88–94.
29 C. Bruot, L. Xiang, J. L. Palma, Y. Li and N. Tao, J. Am.Chem. Soc., 2015, 137, 13933–13937.
30 C. Bruot, J. L. Palma, L. Xiang, V. Mujica, M. A. Ratner andN. Tao, Nat. Commun., 2015, 6, 8032.
31 J. M. Artés, Y. Li, J. Qi, M. Anantram and J. Hihath, Nat.Commun., 2015, 6, 8870.
32 A. Lebrun and R. Lavery, Nucleic Acids Res., 1996, 24, 2260–2267.
33 C. Danilowicz, C. Limouse, K. Hatch, A. Conover,V. W. Coljee, N. Kleckner and M. Prentiss, Proc. Natl. Acad.Sci. U. S. A., 2009, 106, 13196–13201.
34 D. A. Pearlman, D. A. Case, J. W. Caldwell, W. S. Ross,T. E. Cheatham, S. DeBolt, D. Ferguson, G. Seibel andP. Kollman, Comput. Phys. Commun., 1995, 91, 1–41.
35 P. K. Maiti, T. A. Pascal, N. Vaidehi and W. A. Goddard,Nucleic Acids Res., 2004, 32, 6047–6056.
36 P. K. Maiti and B. Bagchi, Nano Lett., 2006, 6, 2478–2485.37 M. Santosh and P. K. Maiti, J. Phys.: Condens. Matter, 2009,
21, 034113.38 R. A. Marcus, Rev. Mod. Phys., 1993, 65, 599.39 W. Q. Deng, L. Sun, J. D. Huang, S. Chai, S. H. Wen and
K. L. Han, Nat. Protoc., 2015, 10, 632–642.40 S. Priyadarshy, S. M. Risser and D. N. Beratan, J. Biol. Inorg.
Chem., 1998, 3, 196–200.41 S. O. Kelley, E. M. Boon, J. K. Barton, N. M. Jackson and
M. G. Hill, Nucleic Acids Res., 1999, 27, 4830–4837.42 J. Kirkpatrick, V. Marcon, J. Nelson, K. Kremer and
D. Andrienko, Phys. Rev. Lett., 2007, 98, 227402.43 V. Rühle, A. Lukyanov, F. May, M. Schrader, T. Vehoff,
J. Kirkpatrick, B. Baumeier and D. Andrienko, J. Chem.Theory Comput., 2011, 7, 3335–3345.
44 S. Bag, V. Maingi, P. K. Maiti, J. Yelk, M. A. Glaser,D. M. Walba and N. A. Clark, J. Chem. Phys., 2015, 143,144505.
45 P. Borsenberger, L. Pautmeier and H. Bässler, J. Chem.Phys., 1991, 94, 5447–5454.
46 M. D. Newton, Chem. Rev., 1991, 91, 767–792.47 M. Frisch, G. Trucks, H. B. Schlegel, G. Scuseria, M. Robb,
J. Cheeseman, G. Scalmani, V. Barone, B. Mennucci andG. E. Petersson, Gaussian 09, 2009.
48 W. Sun, A. Ferretti, D. Varsano, G. Brancolini, S. Corni andR. Di Felice, J. Phys. Chem. C, 2014, 118, 18820–18828.
49 J. Tomasi, B. Mennucci and R. Cammi, Chem. Rev., 2005,105, 2999–3094.
50 B. Giese, J. Amaudrut, A.-K. Köhler, M. Spormann andS. Wessely, Nature, 2001, 412, 318–320.
51 G. Li, N. Govind, M. A. Ratner, C. J. Cramer andL. Gagliardi, J. Phys. Chem. Lett., 2015, 6, 4889–4897.
52 S. Mogurampelly, S. Panigrahi, D. Bhattacharyya, A. Soodand P. K. Maiti, J. Chem. Phys., 2012, 137, 054903.
53 D. Řeha, A. A. Voityuk and S. A. Harris, ACS Nano, 2010, 4,5737–5742.
Paper Nanoscale
16052 | Nanoscale, 2016, 8, 16044–16052 This journal is © The Royal Society of Chemistry 2016
Publ
ishe
d on
08
Aug
ust 2
016.
Dow
nloa
ded
by C
alif
orni
a In
stitu
te o
f T
echn
olog
y on
06/
09/2
016
17:4
3:12
. View Article Online