drawing in virtual reality: a virtual sketching tool for designers€¦ · a virtual sketching tool...
TRANSCRIPT
Drawing In Virtual Reality:
A Virtual Sketching tool for Designers
Juho [email protected]
Vivian [email protected]
Johannes [email protected]
Yuanlai [email protected]
Royal Institute of Technology
January 2016
Abstract
In our project we studied the usability of a new multimodal virtual drawing technology and the potentialof its artistic expression through the creation of sketching tool for artists. We examined if multimodalityencourages more artistic expression from users, and its effect on the user experience. The project wasinspired by Pablo Picasso’s projected light drawings from 1949. Picasso couldn’t observe his drawing inreal time with the technology available at the time. We have developed a tool with which the drawer cansee the strokes of their drawing in real time.
An usability test was conducted in a Visualization studio (VIC) at KTH University with real time livefeed from a laptop computer back-projected through a projector. The users controlled a 8 LED flashlightto track the light. A piano sound was added as an additional modular, where the different coordinates ofthe light triggered different MIDI notes. We studied whether feedback of sound has a positive effect onartistic expression and motivates people to draw more.
The project concludes that we were able to make recommendations regarding the possible future studiesof hand controlled virtual drawing. Our study found that there was no statistical significance betweenhaving sound and not having it. This study might give useful information in Virtual Reality Drawing andAugmented reality drawing in the future.
Keywords: Free-hand drawing, Multimodality, Usability, Artistic expression, Sketching.
1

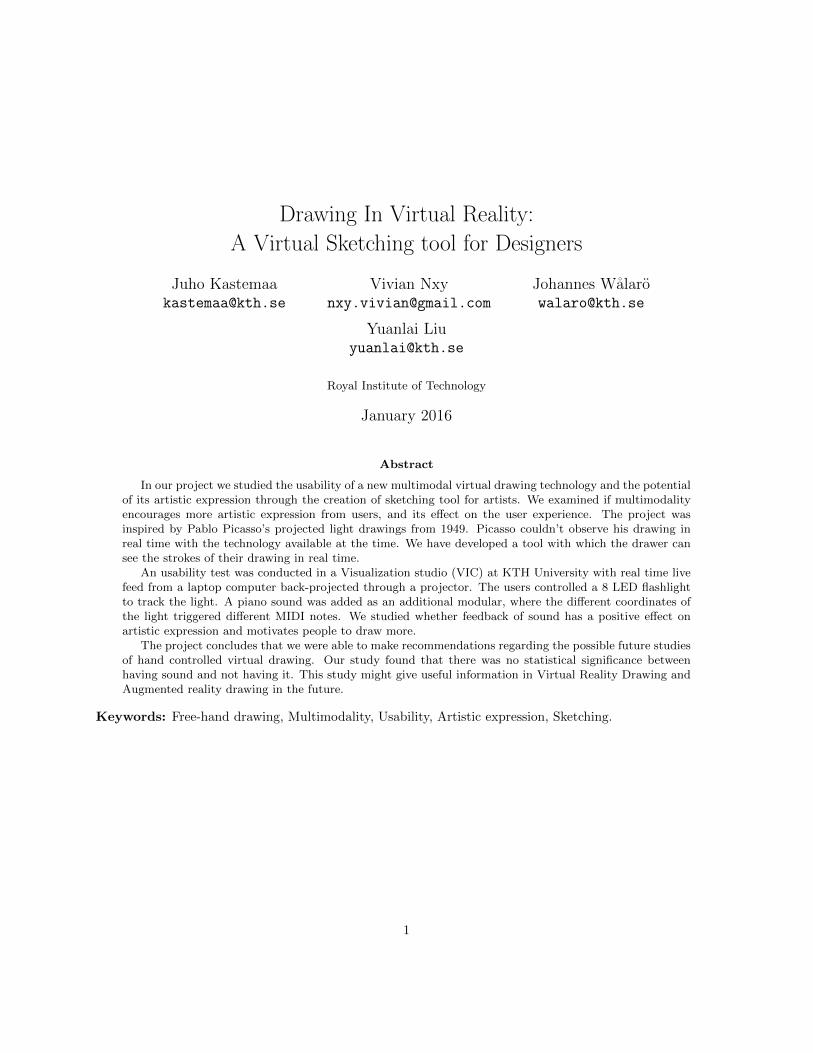
Figure 1: “An angel” Examples of art created dur-ing our study. The participants created several piecesof art using our sketching tool for designers.
1 Background
This project started when we saw a video from JamesVincent’s article [1] about Glen Keane drawing in vir-tual reality. We wanted to experience this technologyand thought of how it could be used. For example,as a virtual collaboration tool for students, a virtualsketching tool for designers or a tool for artist whowant to create new kinds of art forms using sculp-tural drawing as a tool. Inspirations were also drawnfrom Picasso’s famous “Light Drawings” [2], wherethe images captured shows the artist drawing witha small electric light in a dark room. In his art, hewas known for his excellent use of minimalistic linesto create highly expressive pieces. In these “LightDrawings”, his figure is shown in full concentrationand it was almost as if the process of the creation ofthe art piece was reflected. We are not as talented asPicasso, drawing with light while imaging the paint-ing in mind still seems magic for us. But why notrealize the magic with our modern technologies? Thebiggest challenges for us to draw in Picasso’s way isthat we can not imagine a painting in the air whileseeing nothing-memory leaves following the light. Soif we can figure out a way to presenting the painting,we will approach Picasso’s magic. To better under-stand the related field in our chosen project, we did
Figure 2: “A Chinese Fish” Example of art createdduring our study. A Chinese fish was created duringthe experiments in our study.
some research on previous relevant work. Deering [3]introduced HoloSketch, a system which supports avariety of editing operations (i.e movement, group-ing, scaling and attributes). It was interesting tonote that it mentioned most of the 2D and 3D draw-ing packages featured an array of screen buttons andmenu selectors at one corner of the drawing space.McGill [4] also highlighted that interacting with re-ality is a challenge in VR Head-Mounted Displays, inthat being aware of the presence of others in the realenvironment compromises with the virtual immersionthe user experiences. In order to bridge this barrierto consumer adoption, the study suggests incorpo-rating minimal amount of reality in, enabling usersto be more aware of their real surroundings whilestill being immersed in virtual reality. Shin, Dun-ston and Wang [5] explored the two mechanism ofview change in a 3D virtual environment, with it be-ing observer movement, where the user explores theobject by moving around the object, as compared tomodel rotation, where the user explores the objectby rotating it. It concludes that a user’s perceptionof 3D objects in an augmented reality environmentdepends on the type of view change, and that itsresults reflected that performance was better for ob-server movement than that of model rotation. Keefe,Feliz, Moscovich, Laidlaw and Laviola [6] showed the
2

system that provides artists the approach of using 3Danalogy of 2D brush strokes to create 3D art works inan immersive cave environment. It is a big challengeto build a virtual reality system with which artists areable to interact naturally. The CavePainting systemcompleted the task by showing that artists havingminimal experience with computers had no troublelearning the gesture-based interface.
Makela, Reunanen, and Takala [7] introduced a 3Dpainting system in its early stages, with the main goalof exploring the program’s usability and artistic po-tential. The usability testing was assessed throughboth given tasks and free artistic sketching, and thesewere recorded through observations and interviews.They also found that common technical limitationsof virtual environments were reflected in the results,with factors such as latency and tracking inaccuracycaused “inaccurate cursor placement, shaky strokesand overall unresponsiveness of the system”, whereasthe clumsiness of hardware devices caused some re-strictions to the user’s fine motor movement, hencehindering his handicraft work.
All the studies explored the possibilities and po-tentials of drawing or other manipulations in virtualreality from different directions. The results showednot only that abundant possibilities hold in draw-ing in virtual reality, but also that by approachingin different ways, unexpected achievements may ap-pear. With all these in mind, we camp up the ideathat probing the use of light in virtual reality drawingand also adding other modalities like sound to exam-ine any significance could be made while drawing dueto the new feature.
2 Method
2.1 The experiment
Our goal was to study if multimodality (the feedbackof sound) in virtual drawing motivates people to drawmore and whether multimodality has a positive effecton artistic expression.
2.2 Experimental setup
The experiment was conducted in the Visualizationstudio (VIC) at KTH. The real time image from lap-top computer was back-projected through one pro-jector (JVC D-ILA 4K) to a big 4K screen. Thecomputer used its integrated web camera which wassituated in front of the 4K screen. The sounds usedYamaha DM1000 sound mixer and were played fromfour loudspeakers using mono sound with an outputsound intensity of around 70 dBA. The user handleda one hand 8 LED flashlight (NEBO LarryTM 8 LEDPocket Work Light) that we called a “lightsaber”.The flashlight had a bright and long shaped lightsource. We chose to use this, because it allows forthe user to regulate the amount of light. It also hada button to switch the light on and off.
2.3 Design and procedure
We set up a stationary environment in a semi darkroom, where users still managed to see their sur-roundings. Here, users were able to draw and explorethe canvas with the use of a torchlight. The drawingoccurred when the torch was switched on and a lightwas detected against the dark background, leavingits mark as the user moves the torch around in thecanvas.
For this, we did the programming in “Max 7”, avisual programming software developed by Cycling‘74. The program itself was ran on a MAC OS X.In the Max patch, what happens is that live videoinput is received from the webcam through the ob-ject “jit.grab”, where it digitize videos and decom-presses the signals into a Jitter matrix. From thevideo, we then decide to track the color white asit provides the best contrast against a dark back-ground. The light coordinates is then tracked from“jit.findbounds”, where it calculates the bounding di-mension for a range of values indicated. In this ob-ject, it scans a matrix of values in the range, sendingthe minimum point value as a list of numbers outfrom the left outlet, and the maximum point value asa list out the second outlet. From there, we ran-domised the colors from the coordinates detected,combining the drawing image together with the live
3

Figure 3: “Live video input from webcam” Usinglight source in Max 7 visual programming environ-ment.
video using “jit.alphablend”, where the alpha channelof the input matrix (live input video from webcam)is used as a per-cell crossfade value, and is blendedbetween the input matrices in the left and right inlets(the drawing).
To add an additional modular to our program, weincluded sound, where the different coordinates of thelight would then trigger different MIDI notes. Hereit mimics a basic midi controller with the tracking ofthe light, and various thresholds were implementedto keep the notes in a range, where the x-coordinatesmanipulate the pitch and the y-coordinates manipu-late the frequency. This is done with the object “no-teout”, where the coordinates of the light are packedand transmitted as a value to a MIDI device.
2.4 User tests
After setting up the program, we designed an usabil-ity testing with a general aim to understand if ourusers can use the product well, to assess the over-all effectiveness of our prototype and to identify theobstacles and challenges faced while using the proto-type. But more specifically, we are interested if themultimodality, from the addition of sound, add any-thing to the user experience of our prototype.
The 10 test users were students from KTH, that
Figure 4: An example of four different tasks givento the participants. Drawing a straight line, basicgeometric shapes, connecting the dots on the screenand an animal of their choice.
belonged to different majors. Half of them were ex-posed to the program with the additional modalityof sound, and the other half, with only the visualmodality. Once in the dark room, they were briefon the study and given a consent form to sign (referto Appendix A). They were then given brief instruc-tions on how the light would enable them to draw.They were then given a minute to explore freely onthe canvas. Following that, the users were given 4 dif-ferent tasks (drawing a straight line, basic geometricshapes, connecting the dots on the screen and draw-ing an animal of their choice), one after another oncethey completed the given task on hand. The userswere also briefed to voice out their thought process asthey work their way through the tasks. After the ex-periment, the users were asked a question: “The testis now finished. Would you like to continue drawing alittle bit more with?” To further understand how theusers thought of the program, they were given a ques-tionnaire at the end of the testing (refer to AppendixB).
2.5 Result methodology
Participants were divided in two sets, with five par-ticipants in each set. Each participant was to indi-
4

vidually do a series of tasks, and give their subjec-tive opinion on their experience with using the tool.The first set of participants did the tasks with sound,and the other set without, to see if introducing anadditional modality (sound) would have an impacton the subjects response to the tool. The partici-pants were asked to rate their experience with six‘choice questions’ (Strongly Disagree, Disagree, Nei-ther Agree nor Disagree, Agree or Strongly Agree,which for the purposes of analysis will be assignedthe numerical values 1 to 5) along with four free-textquestions.
We used the Rank-sum test [8] (also known as“Mann-Whitney U test”, “Wilcoxon-Mann-Whitneytest”, or “Wilcoxon Rank-sum test”, to interpret thedata for the first six questions, since this was likert-scale type data and was assumed to be ordinal andmight not have followed a normal-distribution. Thenull hypothesis was that there was no difference withsound or without. We chose a 5% [9] (α = 0.05) levelof statistical significance for a two-tailed test.
3 Results
Question WithSound
WithoutSound
1. The interface waseasy to navigate.
(3, 3, 3,4, 5)
(2, 3, 4, 4,5)
2. I think most peo-ple would figure outhow to use interfacethis very quickly.
(4, 4, 4,5, 5)
(4, 5, 5, 5,5)
3. Figuring out howto draw with this in-terface was difficult.
(2, 2, 2,3, 4)
(1, 2, 2, 2,3)
4. I think I wouldneed to ask questionsto know how to usethis interface.
(2, 2, 4,4, 4)
(1, 1, 2, 2,3)
5. This has inte-grated the basic no-tion of drawing.
(2, 4, 4,5)
(4, 4, 4, 5,5)
6. I would be inter-ested to use this in-terface again.
(3, 4, 4,4, 4)
(3, 4, 4, 4,5)
3.1 Analysis of quantitative results
We used the Rank-Sum test, which meant that wefirst sorted the responses according to score, and thenranked them in order, if responses shared score, theirrank was the average rank of all responses with thatparticular score. We then got the total rank-scorewith:
We then get the total rank-score with:|S|∑n=1
Sn and|T |∑n=1
Tn respectively and then the U score
is:
UV =
|V |∑n=1
Vn −1
2∗ |V | ∗ (|V |+ 1) (1)
The lowest U score was then compared to the criticalvalue of the critical z-value table [9].
3.1.1 Question 1, The interface was easy tonavigate with
Srank =5∑
n=1Sn = 1.5 + 6 + 6 + 6 + 6 = 25.5
US =5∑
n=1Sn − 1
2 ∗ 5 ∗ 6 = 10.5
Trank =5∑
n=1Tn = 1.5 + 6 + 6 + 6 + 10 = 29.5
UT =5∑
n=1Tn − 1
2 ∗ 5 ∗ 6 = 14.5
The smallest value, 10.5 was selected for Criticalvalue test. The critical value in this case (|S| = 5and |N | = 5) was 2. Since 10.5 was not less or equalto the critical value, we had to accept the null hy-pothesis in this instance.
3.1.2 Question 2, I think most people wouldfigure out how to use interface this veryquickly
Srank =5∑
n=1Sn = 2.5 + 2.5 + 2.5 + 7.5 + 7.5 = 22.5
US =5∑
n=1Sn − 1
2 ∗ 5 ∗ 6 = 7.5
Trank =5∑
n=1Tn = 2.5 + 7.5 + 7.5 + 7.5 + 7.5 = 32.5
5

UT =5∑
n=1Tn − 1
2 ∗ 5 ∗ 6 = 17.5
The smallest value, 7.5 was selected for Critical valuetest. The critical value in this case (|S| = 5 and|N | = 5) was 2. Since 7.5 was not less or equal to thecritical value, we had to accept the null hypothesis inthis instance.
3.1.3 Question 3, Figuring out how to drawwith this interface was difficult
Srank =5∑
n=1Sn = 4.5 + 4.5 + 4.5 + 8.5 + 10 = 32
US =5∑
n=1Sn − 1
2 ∗ 5 ∗ 6 = 17
Trank =5∑
n=1Tn = 1 + 4.5 + 4.5 + 4.5 + 8.5 = 23
UT =5∑
n=1Tn − 1
2 ∗ 5 ∗ 6 = 8
The smallest value, 8 was selected for Critical valuetest. The critical value in this case (|S| = 5 and|N | = 5) is 2. Since 8 was not less than the criticalvalue, we had to accept the null hypothesis in thisinstance.
3.1.4 Question 4, I think I would need to askquestions to know how to use this in-terface
Srank =5∑
n=1Sn = 4.5 + 4.5 + 9 + 9 + 9 = 36
US =5∑
n=1Sn − 1
2 ∗ 5 ∗ 6 = 21
Trank =5∑
n=1Tn = 1.5 + 1.5 + 4.5 + 4.5 + 7 = 19
UT =5∑
n=1Tn − 1
2 ∗ 5 ∗ 6 = 4
The smallest value, 4 was selected for Critical valuetest. The critical value in this case (|S| = 5 and|N | = 5) is 2. Since 4 was not less or equal to thecritical value, we had to accept the null hypothesis inthis instance.
3.1.5 Question 5, This has integrated the ba-sic notion of drawing
Srank =4∑
n=1Sn = 1 + 4 + 4 + 8 = 17
US =4∑
n=1Sn − 1
2 ∗ 4 ∗ 5 = 7
Trank =5∑
n=1Tn = 4 + 4 + 4 + 8 + 8 = 28
UT =5∑
n=1Tn − 1
2 ∗ 5 ∗ 6 = 13
The smallest value, 7 was selected for Critical valuetest. The critical value in this case (|S| = 4 and|N | = 5) was 1. Since 7 is not less or equal to thecritical value, we had to accept the null hypothesis inthis instance.
3.1.6 Question 6, I would be interested to usethis interface again
Srank =5∑
n=1Sn = 1.5 + 6 + 6 + 6 + 6 = 25.5
US =5∑
n=1Sn − 1
2 ∗ 5 ∗ 6 = 10.5
Trank =5∑
n=1Tn = 1.5 + 6 + 6 + 6 + 10 = 29.5
UT =5∑
n=1Tn − 1
2 ∗ 5 ∗ 6 = 14.5
The smallest value, 10.5 was selected for Criticalvalue test. The critical value in this case (|S| = 5and |N | = 5) is 2. Since 10.5 was not less or equal tothe critical value, we had to accept the null hypoth-esis in this instance.
3.2 Analysis of qualitative results
In addition to the quantitative questions, the partic-ipants were also asked some more qualitative ques-tions, what follows is a short summary:
“Which task did you find it hardest to complete andwhy?”
• The hardest task was to draw an animal since itneeds some sharp details to look good. It is hardto draw something sharp with the stick.
6

• The circle, it was hard to end up where youstarted!
• Connecting the dots, because they were near theedges of the screen and a bit hard to reach.
• To draw a straight line.
The results suggest that different people thoughtdifferent tasks were the most difficult, which wouldbe encouraging, since it would imply that there is no‘single’ point of failure with the process.
“What problems did you face while going through thetasks, and how do you think these can be improved?”
• Drawing thinner or thicker lines was not imme-diately understood.
• Depending on the distance to the camera itseemed like the view got distorted.
• Some light reflections on the floor.
• I can not draw a very straight line. Maybe somekind of automatic correctness can be utilized.
“What do you think can be improved in your expe-rience with the prototype?”
• Easier on-off switch to make interruptions duringthe drawing.
• Give it a better connection with the screen.
• Maybe some ”anti-shake” control which makesit easier to draw straight lines
• Maybe an undo button instead of clearing theentire screen.
• Better on/off button on the light sable.
“If you could make a significant change with theinterface, what would you do and why?”
• Make uniform the thickness of the line accordingto the position.
• Making it easier to clear the screen, some kindof eraser function perhaps.
• Maybe showing a visible pointer where you areaiming.
In summation of the points above, most users wanteda way to enhance the precision of the tool, to makeit easier to accomplish the given tasks and to makeit easier and more intuitive to use.
4 Discussion
Makela, Reunanen, and Takala [7] study found tech-nical limitations of virtual environments, with factorssuch as latency and tracking inaccuracy caused “in-accurate cursor placement, shaky strokes and overallunresponsiveness of the system”, whereas the clum-siness of hardware devices caused some restrictionsto the user’s fine motor movement, hence hinderinghis handicraft work. Our results reflects this commonconcern, with most users wanting a way to enhancethe precision of the tool, in order to make it easierto accomplish the given tasks and to make more in-tuitive to use. Although our study didn’t use virtualreality helmets, many user experienced similaritieswith Makela, Reunanen, and Takala [7] study suchas clumsiness and low latency.
Our study didn’t find significant results if the feed-back of sound in virtual drawing motivates people todraw more or whether multimodality has a positiveeffect on artistic expression. This lack of statisticalsignificance could be due to the result of a small sam-ple size, and therefore lack of information gathered tocontribute to a statistical significance. Future stud-ies could look into this with a larger sample size assome recent studies [10] suggest that the activity ofvisual cortex can be modulated by sound. Some ex-periments [11] [12] [13] also prove that the perceptionof objects is a cross-modal process, and sound can en-hance the detection of visual imagery and sometimesalter the perception of a visual result. In our study,four people out of ten participants, where two peoplewith sounds and two people without sounds wantedcontinue drawing after we asked if they are eager toexplore the interface more. There was no significantevidence if the sound made them to continue draw-ing or not. Further studies could also be made with a
7

questionnaire directly related to the experience withsounds.
The two modalities studied in our project weresound and vision. Movement of a hand added andadded impression of depth while drawing was also in-corporated. All the users internalized the use of thenew media relatively quickly after a debriefing studysession. Our experiment also suggested that the par-ticipants enjoyed the drawing tasks. The soundsplayed while the participant was drawing seemed notto have big difference in their artistic expression. Theparticipants seemed to be fully immersed in using thenew tool with and without sounds.
Future studies may consider changing the drawingsound from a piano key to a more relevant sound, forexample, to the sound of a swiping pencil or paint-brush as it might give a different result due to the per-haps fuller experience. One limitation in our projectwas that the room had to be dark enough in orderfor the program to work well. The darkness mighthave interrupted the user’s interaction with the toolwhile seeing themselves from the screen at the sametime. A lighter room might help the user to see theirsilhouettes more clearly and perhaps contribute to amore pleasant drawing experience with them beingmore aware of their surroundings.
References
[1] Vincent., J. 2015. Watch legendary Dis-ney animator Glen Keane draw in virtualreality. The Verge. September 11, 2015.http://www.theverge.com/2015/9/11/9309727/virtual-reality-drawing-glen-keane-disney
[2] Starr, B. 2012. Picasso’s Light Drawings: StillShining from 1949. Visual News. May 14, 2012.http://www.visualnews.com/2012/05/14/still-shining-from-1949-picassos-light-drawings/
[3] Deering., Michael F. 1995. HoloSketch: a virtualreality sketching/animation tool. ACM Trans.Comput.-Hum. Interact. 2, 3 September 1995,220-238.
[4] Mcgill, M., Murray-Smith, R., Boland, D., &Brewster, S. 2015. A Dose of Reality. Proceedingsof the 33rd Annual ACM Conference ExtendedAbstracts on Human Factors in Computing Sys-tems.
[5] Shin, D., Dunston, P., & Wang, X. 2005. Viewchanges in augmented reality computer-aided-drawing. ACM Transactions on Applied Percep-tion ACM Trans. Appl. Percept. TAP, 1-14.
[6] Keefe, D., Feliz, D., Moscovich, T., Laidlaw, D.,& Laviola, J. 2001. CavePainting. Proceedings ofthe 2001 Symposium on Interactive 3D Graphics.
[7] Makela, W., Reunanen, M., Takala, T. 2004. Pos-sibilities and limitations of immersive free-handexpression: a case study with professional artists.In Proceedings of the 12th annual ACM interna-tional conference on Multimedia (MULTIMEDIA’04). ACM, New York, NY, USA, 504-507.
[8] Wainwright, L. (2009) Critical Values of theMann-Whitney U. Retrieved from http:ocw.umb.edu/psychology/psych-270/other-materials/RelativeResourceManager.pdf
[9] Critical z-value table. Critical val-ues of the Mann-Whitney Uhttp://ocw.umb.edu/psychology/psych-270/other-materials/RelativeResourceManager.pdf
[10] Tanaka, James W. 1999. Color diagnostic-ity in object recognition[J]. Perception & Psy-chophysics. August 1999, Volume 61, Issue 6, pp1140-1153.
[11] Neuroscience And Neuropsychology. 4 December2001 - Volume 12 - Issue 17 - pp 3849-3852.
[12] Noesselt, T. Sound increases the saliency of vi-sual events. 2008. Brain Research. 18 July 2008,Volume 1220, Pages 157–163.
[13] Shams, L. Visual illusion induced by sound. 2008Cognitive Brain Research. June 2002, Volume 14,Issue 1, Pages 147–152.
8