dredge material evaluation and utilization plan for new jerseydredge material evaluation and...
TRANSCRIPT

Dredge Material Evaluation and Utilization Plan for New Jersey
FINAL REPORT July 2003
Submitted by
In cooperation with
New Jersey Department of Transportation Office of Maritime Resources
and U.S. Department of Transportation
Federal Highway Administration
Harry W. Janes Eco-Complex
59 Dudley Road New Brunswick, NJ 08901
SROA-RU3971
Mr. Thomas Bennert* Research Engineer
Mr. Farhad Jafari** Geotechnical Engineer
*Center for Advanced Infrastructure & Transportation (CAIT) Dept. of Civil and Environmental Engineering
Rutgers, The State University 100 Brett Road
Piscataway, NJ 08854-8014
Dr. Nenad Gucunski* Professor
Mr. Scott Douglass*** Dredging Program Manager
***Office of Maritime Resources, New Jersey Department of Transportation, PO Box 837, Trenton, New Jersey, 08625
Dr. Ali Maher* Director and Professor
** Soilteknik, Inc., Basking Ridge, NJ 07920
Disclaimer Statement
"The contents of this report reflect the views of the author(s) who is (are) responsible for the facts and the
accuracy of the data presented herein. The contents do not necessarily reflect the official views or policies of the New Jersey Department of Transportation or the Federal Highway Administration. This report does not constitute
a standard, specification, or regulation."
The contents of this report reflect the views of the authors, who are responsible for the facts and the accuracy of the
information presented herein. This document is disseminated under the sponsorship of the Department of Transportation, University Transportation Centers Program, in the interest of
information exchange. The U.S. Government assumes no liability for the contents or use thereof.

1. Report No. 2. Government Accession No.
TECHNICAL REPORT STANDARD TITLE PAGE
3. Rec ip ient ’s Cata log No.
5 . Repor t Date
8. Performing Organization Report No.
6. Performing Organizat ion Code
4. Ti t le and Subt i t le
7. Author(s)
9. Performing Organization Name and Address 10. Work Unit No.
11. Contract or Grant No.
13. Type of Report and Period Covered
14. Sponsoring Agency Code
12. Sponsoring Agency Name and Address
15. Supplementary Notes
16. Abstract
17. Key Words
19. Security Classif (of this report)
Form DOT F 1700.7 (8-69)
20. Security Classif. (of this page)
18. Distribution Statement
21. No of Pages 28
22. Price
July 2003
CAIT/Rutgers
Final Report 2001-2002
SROA-RU3971
New Jersey Department of Transportation CN 600 Trenton, NJ 08625
Federal Highway Administration U.S. Department of Transportation Washington, D.C.
As a result of the ban on the disposal of contaminated dredged sediments in the NY Bight, the states of New York and New Jersey have embarked on a rigorous program of seeking environmentally friendly solutions to the handling of dredged material, including beneficial use of stabilized dredged material (SDM) in roadway applications. A pilot study was initiated in 1998 to construct two embankments on a site in Elizabeth, NJ, where SDM was successfully used as a cover for more than 100 acres of commercial development area. The pilot study included a laboratory phase for geotechnical evaluation of SDM, and a field phase for monitoring and evaluation of the construction process, as well as the performance of the fills following construction. The results of the laboratory phase, as reported in this paper, demonstrate that SDM satisfies most of the geotechnical criteria for fill construction, except those for durability, requiring proper coverage and protection similar to those provided for fills constructed on cohesive soils.
geotechnical, stabilized dredged material (SDM), New York/New Jersey Harbor
Unclassified Unclassified
SROA-RU3971
Ali Maher, Thomas Bennert, Farhad Jafari, W.S. Douglas and Nenad Gucunski
Dredge Material Evaluation and Utilization Plan for New Jersey

ii
TABLE OF CONTENTS ABSTRACT: 1 INTRODUCTION 1 OBJECTIVE 3 TESTING PROGRAM AND METHODS 3
Test Results 5 1. Classification 5
Sample Type 6 Figure 2 Atterberg limits for RDM and SDM. 7
2. Moisture-Density Relationship 7 Sample Type 8
3. Consolidation 9 4. Permeability ASTM D-5084 11 5. Shear Strength 12 5.1 Effect of Curing Temperature 15 6. Resilient Modulus (AASHTO TP46-94) 16 7. Swell Potential 17
Curing (Month) 19 Compacted Moisture 19 Saturated Moisture % 19
8. Durability 19 8.1 Freeze-Thaw Tests 19 8.2 Wet-dry Tests 20
CONCLUSIONS AND RECOMMENDATIONS 20 ACKNOWLEDGEMENTS 22 References 23
iii
LIST OF TABLES
Table 1 Gradation Results............................................................................................... 5 Table 2 Average Atterberg Limits for SDM..................................................................... 6 Table 3 Moisture-Density Relationships ......................................................................... 8 Table 4 Consolidation Test Results............................................................................... 10 Table 5 Permeability Results......................................................................................... 12 Table 6 CU Triaxial Test Summary ............................................................................... 13 Table 7 Effect of Temperature on Shear Strength of SDM............................................ 15 Table 8 Comparison of Resilient Modulus Values Between SDM and Typical NJ Base
Materials ................................................................................................................ 17 Table 9 Swell Pressure Test Results............................................................................. 19
LIST OF FIGURES
Figure 1 The New York / New Jersey Harbor and major navigation channels. ............... 2 Figure 2 Atterberg limits for RDM and SDM. ................................................................... 7 Figure 3 Effect of compaction on soil-cement mixtures (Cotton, 1962). ........................ 14 Figure 4 Effect of curing temperature on moisture reduction: 70o F (a), 40o F (b). ...... 16

1
ABSTRACT: As a result of the ban on the disposal of contaminated dredged sediments in the NY Bight, the states of New York and New Jersey have embarked on a rigorous program of seeking environmentally friendly solutions to the handling of dredged material, including beneficial use of stabilized dredged material (SDM) in roadway applications. A pilot study was initiated in 1998 to construct two embankments on a site in Elizabeth, NJ, where SDM was successfully used as a cover for more than 100 acres of commercial development area. The pilot study included a laboratory phase for geotechnical evaluation of SDM, and a field phase for monitoring and evaluation of the construction process, as well as the performance of the fills following construction. The results of the laboratory phase, as reported in this paper, demonstrate that SDM satisfies most of the geotechnical criteria for fill construction, except those for durability, requiring proper coverage and protection similar to those provided for fills constructed on cohesive soils. INTRODUCTION The Port of New York and New Jersey is the largest port on the East coast of the United States, situated in the metropolitan center of the Hudson Raritan Estuary complex (Figure 1). The New York / New Jersey Harbor complex is naturally shallow, with an average depth of 19 feet at low tide. Due to the port’s strategic position in regional and international trade, the Corps of Engineers has provided some 250 miles of engineered waterways at depths ranging from 20 to 45 feet. Plans are underway to deepen the main channels to 53 feet during this decade. Maintenance of these waterways, crucial to safe navigation, requires dredging 4-6 million yd3 of sediment, or “dredged material”, annually. Unfortunately, at least half of the material scheduled for removal is contaminated with industrial chemicals and trace metals from historical and ongoing sources, making management of the material challenging.

2
Figure 1 The New York / New Jersey Harbor and major navigation channels.
Historically, dredged materials from the channels and berths in the port have been relocated to other parts of the harbor, used to fill in shallows, or dumped in the ocean. Following the London Convention, the United States Environmental Protection Agency (USEPA) directed consignees to evaluate dredged material for its potential environmental impact prior to dredging. Materials found suitable for open water disposal were to be placed in one or more designated sites. In the case of the NY/NJ Harbor, this meant placing the material at a 2.2 square mile area off Sandy Hook, NJ, known locally as the “Mud Dump”. Starting in 1991, further modifications to the ocean disposal testing requirements resulted in stringent restrictions on disposal at the site. In 1993, environmental groups began legally challenging even the most recent regulations, eventually resulting in an outright ban of disposal of dredged materials at the site by 1997. Today, only material considered to be completely free of potential to cause environmental harm is placed at the site, doubling as a cap of older, more contaminated materials. Unfortunately, these new regulations did nothing to slow the rate of sedimentation in the harbor complex. Berths and channels in this heavily trafficked system require nearly continuous maintenance to ensure safe passage of commercial vessels. The port community was unprepared for the loss of management options for dredged material. Managers were forced to either delay dredging or pay sums 15-20

3
times higher than usual. Dredging had all but ceased in the port, threatening the maritime industry. In response the States of New Jersey and New York, the U.S. Army Corps of Engineers (Corps) and the Port Authority of New York and New Jersey (PANYNJ) created teams to find alternative methods for management of contaminated dredged material. One of the alternatives considered was to seek beneficial use of stabilized dredged material (SDM) in upland disposal sites. This entails the stabilization of dredged material with pozzolanic admixtures to create structural and non-structural fills for various applications, including those in brownfield development projects and transportation infrastructure systems. The beneficial use of SDM as a fill has been demonstrated to be cost effective for high volume usage. For example, approximately 600,000 cubic yards of SDM were successfully used as structural fill for the construction of parking areas for the Jersey Gardens Mall in Elizabeth, NJ. In this project, the developer utilized dredged material amended with Portland cement for the grading, filling and capping required for the remediation of the landfill. Amending dredged material with Portland cement yields three benefits: it binds contaminants to the sediment particles, it removes excess water and it improves the structural characteristics of the silt and clay particles. During the course of the Jersey Gardens development project, the Office of Maritime Resources of the New Jersey Department of Transportation (NJDOT) initiated a pilot study to evaluate the feasibility of SDM as a fill material for roadway embankments. Two embankments were constructed on existing municipal solid waste fills at the Jersey Gardens Mall site using SDM as the fill material. The project had two phases: a laboratory phase (phase I) consisting of a comprehensive geotechnical evaluation of SDM for beneficial re-use applications, and a field phase (phase II) consisting of performance evaluation of embankments following construction. OBJECTIVE The primary objective of this study was to determine the geotechnical properties of SDM and thus, the potential for use in high volume applications, such as fills, embankments, and roadway base materials. This investigation was the laboratory phase (phase I) of the project conducted on the site of Jersey Gardens Mall in Elizabeth, NJ. The work on the project began in 1999 and was completed in 2001. The results of the field evaluation phase of the study are reported elsewhere (1). TESTING PROGRAM AND METHODS The controlling parameters for the laboratory investigation were the type and the content of admixtures (cement and fly ash) that were used in the field phase, as well as the sequence of mixing, curing and placement activities specific to the project. The preparation of SDM in the field was conducted on the Jersey Gardens site using a pugmill system. After preparation, the stabilized dredge material (SDM) was placed on various locations at the site for curing. Unlike typical soil-cement mixtures in which the soil and cement are mixed and then immediately compacted, the SDM, due to its high
4
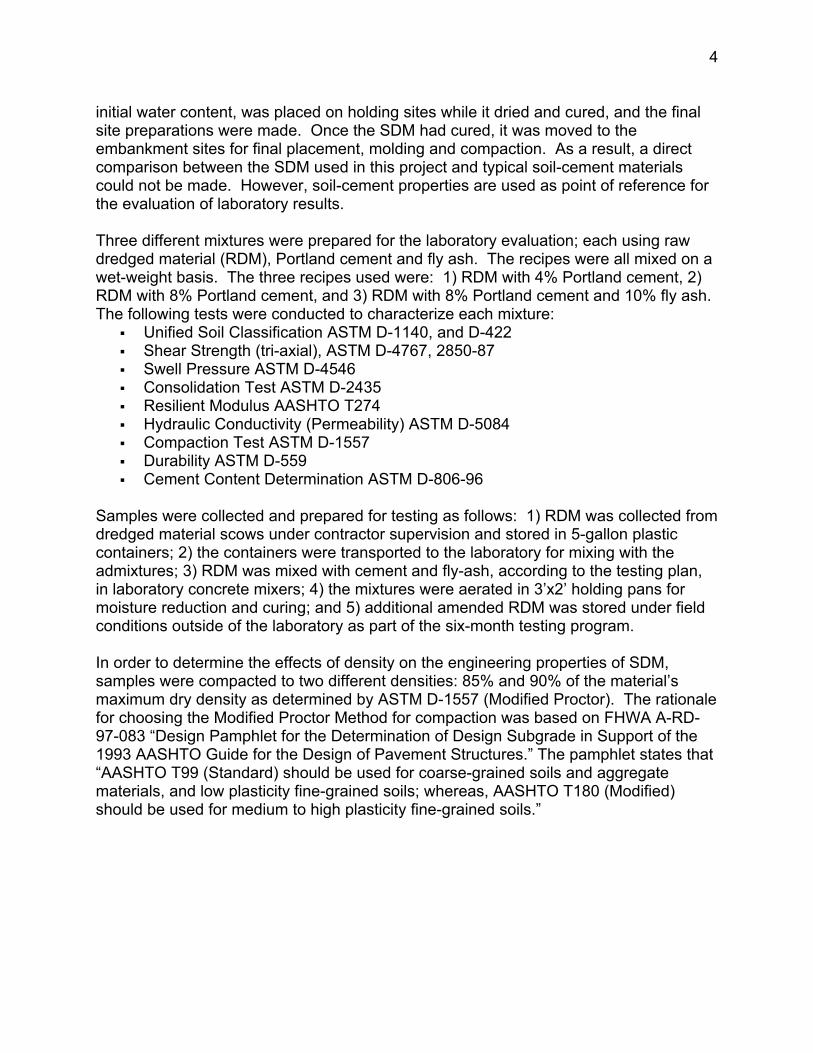
initial water content, was placed on holding sites while it dried and cured, and the final site preparations were made. Once the SDM had cured, it was moved to the embankment sites for final placement, molding and compaction. As a result, a direct comparison between the SDM used in this project and typical soil-cement materials could not be made. However, soil-cement properties are used as point of reference for the evaluation of laboratory results. Three different mixtures were prepared for the laboratory evaluation; each using raw dredged material (RDM), Portland cement and fly ash. The recipes were all mixed on a wet-weight basis. The three recipes used were: 1) RDM with 4% Portland cement, 2) RDM with 8% Portland cement, and 3) RDM with 8% Portland cement and 10% fly ash. The following tests were conducted to characterize each mixture:
Unified Soil Classification ASTM D-1140, and D-422 Shear Strength (tri-axial), ASTM D-4767, 2850-87 Swell Pressure ASTM D-4546 Consolidation Test ASTM D-2435 Resilient Modulus AASHTO T274 Hydraulic Conductivity (Permeability) ASTM D-5084 Compaction Test ASTM D-1557 Durability ASTM D-559 Cement Content Determination ASTM D-806-96
Samples were collected and prepared for testing as follows: 1) RDM was collected from dredged material scows under contractor supervision and stored in 5-gallon plastic containers; 2) the containers were transported to the laboratory for mixing with the admixtures; 3) RDM was mixed with cement and fly-ash, according to the testing plan, in laboratory concrete mixers; 4) the mixtures were aerated in 3’x2’ holding pans for moisture reduction and curing; and 5) additional amended RDM was stored under field conditions outside of the laboratory as part of the six-month testing program. In order to determine the effects of density on the engineering properties of SDM, samples were compacted to two different densities: 85% and 90% of the material’s maximum dry density as determined by ASTM D-1557 (Modified Proctor). The rationale for choosing the Modified Proctor Method for compaction was based on FHWA A-RD-97-083 “Design Pamphlet for the Determination of Design Subgrade in Support of the 1993 AASHTO Guide for the Design of Pavement Structures.” The pamphlet states that “AASHTO T99 (Standard) should be used for coarse-grained soils and aggregate materials, and low plasticity fine-grained soils; whereas, AASHTO T180 (Modified) should be used for medium to high plasticity fine-grained soils.”

5
Test Results 1. Classification Particle size distribution tests, including sieve analysis and hydrometer tests were conducted on the three mixtures: SDM with 4% Portland cement, SDM with 8% Portland cement, and SDM with 8% Portland cement plus 10% fly ash. In addition, Atterberg limits, including plastic limit and liquid limit, were conducted on the same samples. Tests were conducted in conformance with ASTM D1140 and D422. A summary of gradation test results for three different types of SDM at two different curing times (1 month and 6 months) is presented in Table 1. According to the results, dredged material is mostly silt with low percentages of fine sand and clay. Sediments dredged from navigational channels do not naturally contain coarse or medium sand (although incidental pieces of gravel were found in some samples), because sand will settle before it reaches still waters. In addition, these sediments cannot contain high percentages of clay, because clay particles will stay in suspension. However, deepening dredging in undisturbed areas might result in the generation of material containing significant amounts of gravel and rock mixed with fine material. This study did not address this type of material.
Table 1 Gradation Results
Grain Size Summary (Sieve + Hydrometer Data)
% Gravel % Sand % Fines D50
Sample Type Stockpiling Time Sample # Coarse Fine Coarse Medium Fine Silt Clay (mm)4% PC 1 Month 1 0 0.8 0.8 3.3 9.4 71.6 14.1 0.0573
2 0 1.8 0.8 3.4 5.9 74.1 14 0.03433 0 0.7 0.7 2.9 10 73 12.7 0.0433
Average 0 1.1 0.7667 3.2 8.4333 72.9 13.6 0.0454% PC 6 Months 1 0 1.4 1.2 4.2 10.1 67.4 15.7 0.0355
2 0 1.9 1.2 3.3 7.9 65.8 19.9 0.02613 0 1.7 1.2 2.7 6.7 72.3 15.4 0.0348
Average 0 1.6667 1.2 3.4 8.2333 68.5 17 0.03218% PC 1 Month 1 0 0 0.3 0.9 18.7 59.1 21 0.0146
2 0 0 0.3 0.9 16.1 69.5 13.2 0.02343 0 0 0.3 1.1 13.7 73.7 11.2 0.027
Average 0 0 0.3 0.96667 16.167 67.433 15.133 0.02178% PC 6 Months 1 0 0.6 1.7 4.4 27.5 60.6 5.2 0.0556
2 0 0.7 1.6 2.8 33.4 56 5.5 0.6513 0 0.5 1.8 3.1 25.6 62.7 6.3 0.0379
Average 0 0.6 1.7 3.43333 28.833 59.767 5.6667 0.24828% PC + 10% FA 1 Month 1 3.8 6.7 5.4 6.6 5.4 64.1 8 0.0716
2 0 10.4 8.8 9.2 7.3 56.8 7.5 0.06183 3.4 2.5 4.2 5.5 4.5 70.2 9.7 0.0577
Average 2.4 6.5333 6.1333 7.1 5.7333 63.7 8.4 0.06378% PC + 10% FA 6 Months 1 0 0.5 1.3 2.9 5.3 63.7 26.3 0.0289
2 0 0.5 1 2.2 5.3 68.1 22.9 0.02513 0 0.7 1.5 3.1 5.3 58.5 30.9 0.0147
Average 0 0.5667 1.2667 2.73333 5.3 63.433 26.7 0.0229Raw Dredge N/A 1 0 0.9 1.1 1.6 4.5 66.7 25.2 0.0107
2 0 0.8 0.7 2.6 6.3 68.4 21.2 0.0127Average 0 0.85 0.9 2.1 5.4 67.55 23.2 0.0117
6
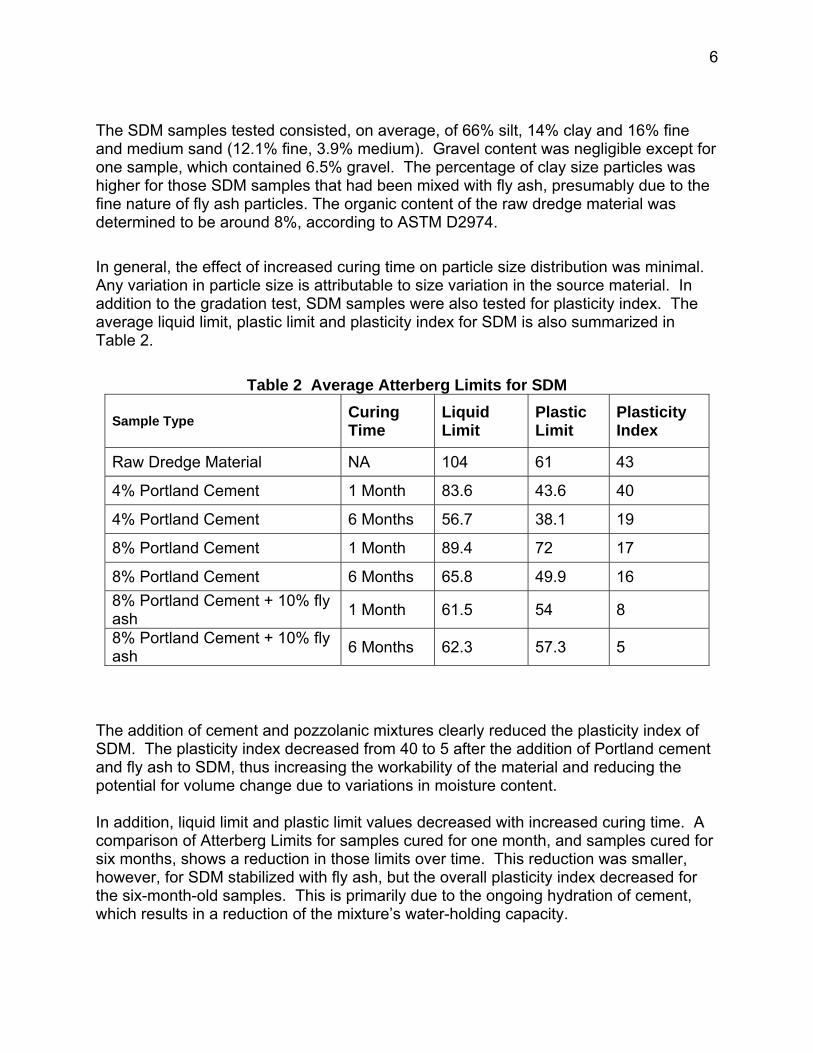
The SDM samples tested consisted, on average, of 66% silt, 14% clay and 16% fine and medium sand (12.1% fine, 3.9% medium). Gravel content was negligible except for one sample, which contained 6.5% gravel. The percentage of clay size particles was higher for those SDM samples that had been mixed with fly ash, presumably due to the fine nature of fly ash particles. The organic content of the raw dredge material was determined to be around 8%, according to ASTM D2974.
In general, the effect of increased curing time on particle size distribution was minimal. Any variation in particle size is attributable to size variation in the source material. In addition to the gradation test, SDM samples were also tested for plasticity index. The average liquid limit, plastic limit and plasticity index for SDM is also summarized in Table 2.
Table 2 Average Atterberg Limits for SDM
Sample Type Curing Time
Liquid Limit
Plastic Limit
Plasticity Index
Raw Dredge Material NA 104 61 43
4% Portland Cement 1 Month 83.6 43.6 40
4% Portland Cement 6 Months 56.7 38.1 19
8% Portland Cement 1 Month 89.4 72 17
8% Portland Cement 6 Months 65.8 49.9 16 8% Portland Cement + 10% fly ash 1 Month 61.5 54 8
8% Portland Cement + 10% fly ash 6 Months 62.3 57.3 5
The addition of cement and pozzolanic mixtures clearly reduced the plasticity index of SDM. The plasticity index decreased from 40 to 5 after the addition of Portland cement and fly ash to SDM, thus increasing the workability of the material and reducing the potential for volume change due to variations in moisture content. In addition, liquid limit and plastic limit values decreased with increased curing time. A comparison of Atterberg Limits for samples cured for one month, and samples cured for six months, shows a reduction in those limits over time. This reduction was smaller, however, for SDM stabilized with fly ash, but the overall plasticity index decreased for the six-month-old samples. This is primarily due to the ongoing hydration of cement, which results in a reduction of the mixture’s water-holding capacity.

7
Based on the Atterberg Limits, all the samples tested are below the A-line and to the right of the LL=50 line on the Plasticity Chart, as shown in Figure 2. Therefore, the SDM could be classified as Elastic Silt (MH).
Atterburg Limit Data
Sample No. Liquid Limit Plastic Limit Plasticity Index Symbol4% PC ( 1 Month) 83.6 43.6 40.0
4% PC (6 Months) 56.7 38.1 18.6
8% PC (1 Month) 89.4 72.0 17.4
8% PC (6 Months) 65.8 49.9 15.9
8% PC + 10% FA (1 Month) 61.1 54.0 7.1
8% PC + 10% FA (6 Months) 62.3 57.3 5.0
Virgin Dredge Material 104.1 61.0 43.1
Figure 2 Atterberg limits for RDM and SDM. 2. Moisture-Density Relationship The three different mixtures of SDM were tested for moisture-density relationship. For each recipe, samples were cured in the laboratory for both one and six month durations. The tests were conducted in accordance with ASTM D-1557 (Modified Proctor). For each recipe, several samples were tested with moisture contents on the wet and dry side of the optimum. A summary of the test results is presented in Table 3.
0
10
20
30
40
50
60
70
0 10 20 30 40 50 60 70 80 90 100 110LIQUID LIMIT, %
PLA
STIC
ITY
IND
EX, %
CL
CL- ML MLorCL
MHorOH
CH
A-LINEor OL
orOHU-LINE

8
Table 3 Moisture-Density Relationships
Optimum Values 90% of Optimum 85% of
Optimum Sample Type
Stockpiling Time γd max
(Mg/m3)
w% OPT (%)
γd (Mg/m3)
w% (%)
γd (Mg/m3)
w% (%)
4% PC 1 Month 1.26 28.5 1.13 44.0 1.07 47.3
4% PC 6 Months 1.24 26.0 1.11 36.0 1.05 41.0
8% PC 1 Month 1.25 31.0 1.13 48.3 1.07 52.8
8% PC 6 Months 1.22 31.5 1.10 48.5 1.04 52.0 8% PC + 10% FA 1 Month 1.26 28.0 1.13 45.0 1.07 47.5
8% PC + 10% FA 6 Months 1.25 29.3 1.13 46.7 1.07 51.4
Sandy Silt+8%PC* 1 Month 1.91 10.5
Fine Sand+8% PC* 1 Month 1.82 15.4
* PCA, 1991 As described before, the preparation of samples varied slightly from the conventional methods. Specifically, after mixing, the SDM samples generally contained high moisture contents and needed to be air-dried prior to compaction. Once the moisture content approximated the optimum moisture content, one sample was compacted while the remaining samples were further air-dried. This process continued until several samples were compacted at moisture contents below the optimum. To establish the moisture-density curve for each recipe, eight points, or more, were used. The maximum point on a parabola, which connects the test points, determines the maximum dry density and the optimum moisture content. Dry-density values at 85% and 90% of the maximum were used in the preparation of samples for other laboratory tests. According to the test results, maximum dry densities ranged from 76.6 pcf to 78.8 pcf (1.23 to 1.26 Mg/m3), and optimum moisture contents ranged from 26% to 31.5%. A slight reduction in maximum dry density was observed when the percentage of cement and the curing time were increased prior to compaction of the material. This is similar to findings made by Kezdi (2), where the maximum dry densities of cement-treated silts were found to decrease slightly with increasing cement content.
9
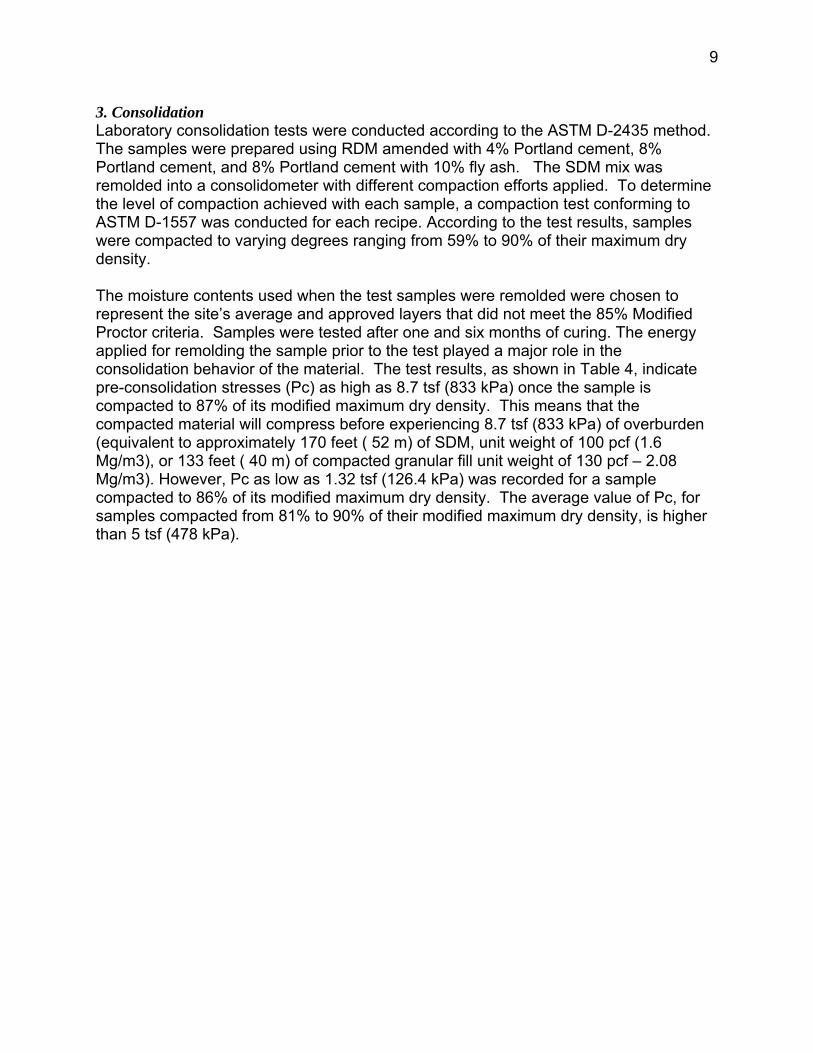
3. Consolidation Laboratory consolidation tests were conducted according to the ASTM D-2435 method. The samples were prepared using RDM amended with 4% Portland cement, 8% Portland cement, and 8% Portland cement with 10% fly ash. The SDM mix was remolded into a consolidometer with different compaction efforts applied. To determine the level of compaction achieved with each sample, a compaction test conforming to ASTM D-1557 was conducted for each recipe. According to the test results, samples were compacted to varying degrees ranging from 59% to 90% of their maximum dry density. The moisture contents used when the test samples were remolded were chosen to represent the site’s average and approved layers that did not meet the 85% Modified Proctor criteria. Samples were tested after one and six months of curing. The energy applied for remolding the sample prior to the test played a major role in the consolidation behavior of the material. The test results, as shown in Table 4, indicate pre-consolidation stresses (Pc) as high as 8.7 tsf (833 kPa) once the sample is compacted to 87% of its modified maximum dry density. This means that the compacted material will compress before experiencing 8.7 tsf (833 kPa) of overburden (equivalent to approximately 170 feet ( 52 m) of SDM, unit weight of 100 pcf (1.6 Mg/m3), or 133 feet ( 40 m) of compacted granular fill unit weight of 130 pcf – 2.08 Mg/m3). However, Pc as low as 1.32 tsf (126.4 kPa) was recorded for a sample compacted to 86% of its modified maximum dry density. The average value of Pc, for samples compacted from 81% to 90% of their modified maximum dry density, is higher than 5 tsf (478 kPa).

10
Table 4 Consolidation Test Results
FA = Fly Ash, PC = Portland Cement
Sample Type Curing Time Moisture Content% Dry Density*(psf)/ Pc (tsf) Cc Cr e0 Cc/(1+eo)
Saturated Remolded Max. Dry Density
SDM (4% PC) 1 month 69.1 68.4 (46.8/ 78.7)=59% 0.88 0.87 0.03 2.691 0.236SDM (4% PC) 1 month 89.4 87.9 (47.7/ 78.7)=61% 4.14 0.88 0.04 2.674 0.240SDM (4% PC) 6 month 89.8 55.7 (64.3/ 77.4)=83% 2.54 0.44 0.03 1.687 0.164SDM (4% PC) 6 month 91.2 53.9 (67.6/ 77.4)=87% 8.7 0.39 0.02 1.608 0.150SDM (4% PC) 6 month 70.6 40.6 (69.6/ 77.4)=90% 2.19 0.49 0.03 1.565 0.191SDM (8% PC) 1 month 95.1 74.4 (53.7/ 78.5)=68% 2.51 0.51 0.02 2.057 0.167SDM (8% PC) 1 month 92.9 63.3 (58.8/ 78.5)=75% 6.4 0.51 0.02 1.793 0.183SDM (8% PC) 1 month 89 53.5 (63.6/ 78.5)=81% 7.45 0.22 0.02 1.582 0.085SDM (8% PC) 6 month 62.1 64.4 (46/ 76.6)= 60% 1.41 0.9 0.03 2.717 0.242SDM (8% PC) 6 month 82.7 76.7 (48.8/ 76.6)=64% 2.38 0.83 0.02 2.431 0.242SDM (8% PC) 6 month 89.2 86.5 (47.8 76.6)=62% 2.83 0.83 0.02 2.542 0.234
SDM (8% PC,10% FA) 1 month 64.1 60 (50.7/ 78.8)=64% 2.64 0.72 0.03 2.623 0.199SDM (8% PC,10% FA) 1 month 81.4 69.6 (53.8/ 78.8)=68% 1.92 0.54 0.02 2.397 0.159SDM (8% PC,10% FA) 1 month 85.2 79.3 (52.9/ 78.8)=67% 0.97 0.58 0.03 2.605 0.161SDM (8% PC,10% FA) 6 month 93 54.9 (64.2/78.4)=82% 7 0.33 0.02 1.546 0.130SDM (8% PC,10% FA) 6 month 89.1 56 (67.9/78.4)=87% 8.27 0.41 0.02 1.766 0.148SDM (8% PC,10% FA) 6 month 73.2 46 (67.4/ 78.4)=86% 1.32 0.43 0.02 1.766 0.155
Organic Silt, Bayonne, NJ* 75.1 58.9 pcf 0.15 0.54 1.86 0.189Organic peat, Elizabeth, NJ* 90 46.5 pcf 1.38 0.7 2.6 0.194
Elastic Silt, Elizabeth, NJ* 70.4 54.3 pcf 1.17 0.69 2.14 0.220Organic Silt, Woodbridge, NJ 158.8 27.3 pcf 0.89 3.5 6.08 0.494
*Remolded Dry Density (before consolidation) * Obtained from OENJ Cherokee, Inc.

11
The compression index (Cc) values range from 0.22 to 0.9. Both of these values were recorded for SDM with 8% Portland cement. In general, for all recipes tested, once compaction reaches 81%, the compression index will not exceed 0.5. In that case, a Pc of 2 tsf or more should be expected. The compression ratio (CR =Cc/1+e0) varied from 0.085 to 0.24. This value did not exceed 0.19 for samples compacted to 83% or above. The results also show that based on consolidation settlement estimates, SDM embankments could be constructed to a height of 50 feet (15 m) with negligible settlement taking place within the SDM fill. This conclusion is supported by the results of the field settlement program reported by Maher, et al. In the case of the two embankments in this study, and in similar cases where construction is proposed on marginal foundation soils, settlement is primarily a function of the foundation soil and its consolidation characteristics. 4. Permeability ASTM D-5084 Twenty-four samples were prepared and tested for permeability (hydraulic conductivity). Three different recipes for amending RDM were used in the sample preparation: 4% Portland cement, 8% Portland cement, and 8% Portland cement with 10% fly ash. The three different recipes were sampled at one month and at six months. Half of the samples were compacted to 85% and the other half were compacted to 90% of their maximum dry density, as determined by Modified Proctor (ASTM D-1557). The results of permeability tests are presented in Table 5. The permeability results ranged from 1.25x10⁻⁶ cm/sec to 4.3x10 –7 cm/sec. The lowest values were recorded for samples of RDM amended with 8% Portland cement and 10% fly ash. Also, samples amended with 4% Portland cement generally had lower permeability than did samples amended with 8% Portland cement. This may be due to the apparent effect of cementation on imposing a flocculated fabric arrangement in SDM.
12
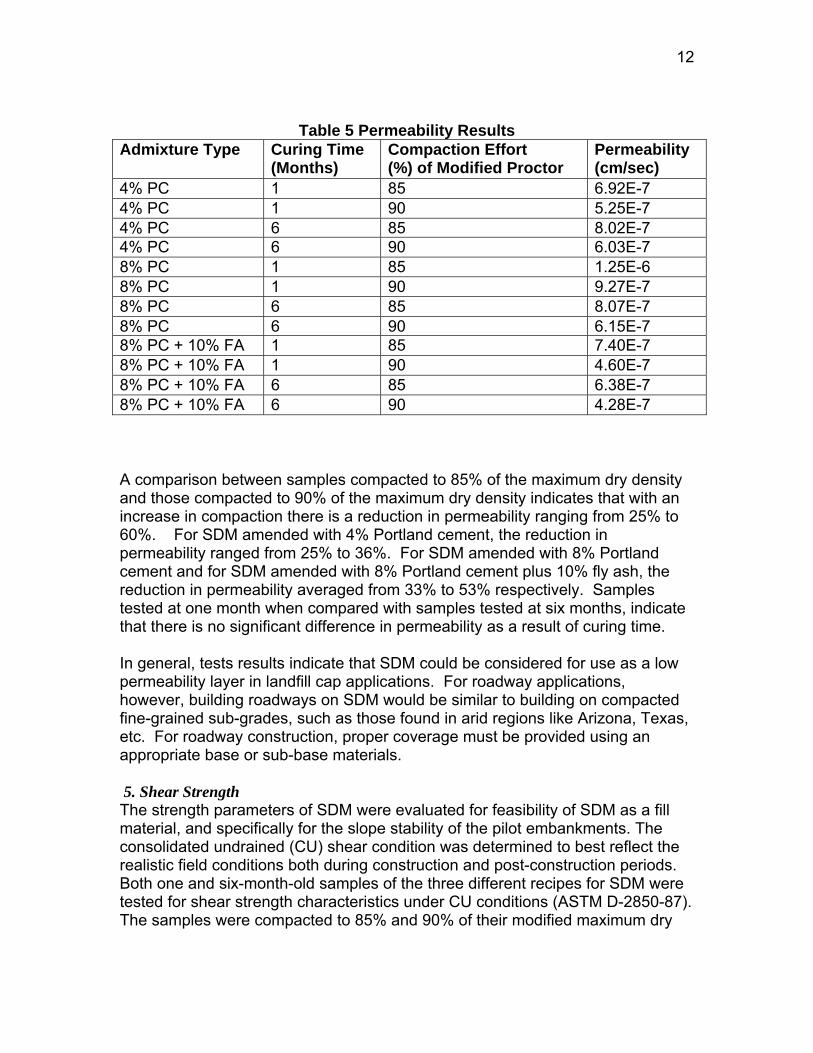
Table 5 Permeability Results
Admixture Type Curing Time (Months)
Compaction Effort (%) of Modified Proctor
Permeability (cm/sec)
4% PC 1 85 6.92E-7 4% PC 1 90 5.25E-7 4% PC 6 85 8.02E-7 4% PC 6 90 6.03E-7 8% PC 1 85 1.25E-6 8% PC 1 90 9.27E-7 8% PC 6 85 8.07E-7 8% PC 6 90 6.15E-7 8% PC + 10% FA 1 85 7.40E-7 8% PC + 10% FA 1 90 4.60E-7 8% PC + 10% FA 6 85 6.38E-7 8% PC + 10% FA 6 90 4.28E-7 A comparison between samples compacted to 85% of the maximum dry density and those compacted to 90% of the maximum dry density indicates that with an increase in compaction there is a reduction in permeability ranging from 25% to 60%. For SDM amended with 4% Portland cement, the reduction in permeability ranged from 25% to 36%. For SDM amended with 8% Portland cement and for SDM amended with 8% Portland cement plus 10% fly ash, the reduction in permeability averaged from 33% to 53% respectively. Samples tested at one month when compared with samples tested at six months, indicate that there is no significant difference in permeability as a result of curing time. In general, tests results indicate that SDM could be considered for use as a low permeability layer in landfill cap applications. For roadway applications, however, building roadways on SDM would be similar to building on compacted fine-grained sub-grades, such as those found in arid regions like Arizona, Texas, etc. For roadway construction, proper coverage must be provided using an appropriate base or sub-base materials.
5. Shear Strength The strength parameters of SDM were evaluated for feasibility of SDM as a fill material, and specifically for the slope stability of the pilot embankments. The consolidated undrained (CU) shear condition was determined to best reflect the realistic field conditions both during construction and post-construction periods. Both one and six-month-old samples of the three different recipes for SDM were tested for shear strength characteristics under CU conditions (ASTM D-2850-87). The samples were compacted to 85% and 90% of their modified maximum dry

13
density and total and effective strength parameters were determined for stability analysis (Table 6).
Table 6 CU Triaxial Test Summary Total Stress
Effective Stress Sample Type Stockpiling
Time Compaction Effort (%)
φ C (kPa) φ’ C’
(kPa) 4% PC 1 Month 85 35 51.47 39 52.38 90 37 85.42 39 71.34 4% PC 6 Months 85 28 64.30 46 33.85 90 34 73.78 41 57.69 8% PC 1 Month 85 37 73.06 40 72.0 90 26 231.07 30 215.758% PC 6 Months 85 35 105.00 36 111.5 90 36 167.30 44 135.608% PC + 10% FA 1 Month 85 37 72.39 89.34 90 29 108.50 34 103.618% PC + 10% FA 6 Months 85 26 40.55 36 31.36 90 39 68.08 40 71.82 Silt Loam+8% cement* 28 days γd = 113,w=15% 37 1,048
Silt Clay Loam+6% cement* 28 days γd =
112,w=15.7% 36 687.20
* PCA, Bulletin D32 (samples not saturated, no pore pressure measured) The effective C and φ or (C′ and φ′) were calculated after the Mohr circles for effective stresses were plotted. As expected, the effective friction angle values were generally larger than the total values for SDM. No significant change or trend in the magnitude of the frictional angle, and, with the addition of cement and fly ash could be observed. This is similar to previous findings by Balmer (3), Clough, et al. (4) and Van Riessen and Hansen (5); where different soil types, amended with varying cement contents, were extensively tested and showed no significant change in frictional angle as a function of the varying amount of cement. In general, an average angle of 34o can be estimated for long-term stability analysis of embankments constructed with SDM. On average, there is an 8° increase in the effective friction angle compared with the total friction angle. Cohesion, however, decreases as the friction angle increases.

14
The results in table 3.6 show that compaction plays a significant role in the magnitude of strength parameters. For all the samples tested, a 5% increase in dry density resulted in increased strength. On average, the un-drained C values increased by 35%. Moreover, the average increases in φ′ and C′ were 1 % and 50%, respectively. On this basis, it can be concluded that compaction is the most important physical stabilizer of SDM with respect to strength parameters. A general comparison of SDM with typical soil-cement and cement-modified soils shows that with the same percentage of added cement, and similar compaction efforts (90% of optimum for SDM, and optimum for soil-cement) cement-modified soils are denser than SDM, have slightly higher friction angles, and have a much higher cohesion intercept under triaxial shear conditions. Also shown in Table 6 are differences between SDM and typical soil-cement and cement-modified soils. One reason for SDM being less cohesive than soil-cement is that during the process of remolding for compaction, parts of cementitious bonds between hydrated cement particles and the soil matrix become broken. With typical soil-cement or cement-modified soils hydration and curing take place immediately after compaction, in part because compaction prior to curing causes soil grains to be forced into direct contact with cement grains resulting in an "agglomeration of soil-cement grains interspersed in the soil mass" (6). In comparison, with SDM, the sequence of sample preparation is reversed and some of the previously gained strength is lost during the break-up upon compaction (see Figure 3).
Before compactionCement Modified Soil
After CompactionCompacted Soil-Cement
Soil
Cement
Before compactionCement Modified Soil
After CompactionCompacted Soil-Cement
Soil
Cement
Figure 3 Effect of compaction on soil-cement mixtures (Cotton, 1962).

15
5.1 Effect of Curing Temperature The hydration of pozzolanic materials, including Portland cement, is a temperature dependent reaction. At temperatures below 40° F, the pozzolanic reactions between the cement and soil particles slow down. As a result, the improvements associated with the addition of cement, i.e., moisture content reduction and improved strength are minimized. Therefore, it may be prudent to limit the placement of SDM to warm seasons (April through October in New Jersey). The processing and curing of the material, however, can take place throughout the year. To quantify the effects of low temperatures on the curing of Portland cement, and on the strength gain/moisture reduction of SDM, samples of raw dredge material (RDM) were amended with different percentages of Portland cement and fly ash and then tested for shear strength and moisture content. For sample preparation, RDM was mixed with 4%, 6%, and 8% Portland cement and with 4% Portland cement and 5% fly ash. Immediately after mixing, the samples were placed in molds and minimum compaction was applied to mimic the initial field drying process. Half of the samples cured at (70° F) and the other half were kept at 40° F. The samples were tested for their Unconfined Compressive strength (ASTM D-2166) at different intervals: after 24 hours, 7 days, 14 days and 28 days. In addition to strength tests, the moisture content of the samples was calculated to determine the effects of pozzolanic additives in reducing moisture. The temperature effects on strength gain and moisture reduction are presented in Table 7, and Fig 3, respectively.
Table 7 Effect of Temperature on Shear Strength of SDM Sample Type
Curing Temperature in F
Strength (kPa) 1 day Curing
Strength (kPa) 7 Day Curing
Strength (kPa) 14 Day Curing
Strength (kPa) 28 Day Curing
RDM+4%PC 40 -- -- -- --
RDM+4%PC 70 10.34 26.21 41.02 56.53
RDM+6%PC 40 7.58 17.23 31.71 29.64
RDM+6%PC 70 18.61 58.6 84.8 85.49
RDM+8%PC 40 12.41 24.13 26.89 28.95
RDM+8%PC 70 18.61 59.29 84.8 85.49 RDM+4%PC/ 5% FA 40 4.82 -- 17.23 20.68
As shown in the table, the curing temperature played a significant role in the amount and rate of strength gain in the SDM tested. Therefore, if economically

16
0
0.2
0.4
0.6
0.8
1
0 10 20 30
Days
x100
(% o
f ini
tial w
ater
)
6% PC8% PC4% PC + 5% FA
0.4
0.6
0.8
1
0 10 20 30Days
x100
(% o
f ini
tial w
ater
)
6% PC
8% PC
4% PC +5% FA
feasible, dredged material should be amended during the warm seasons of the year. Moreover, temperature affects the rate and degree of moisture reduction in SDM, as shown in Fig 3. This reduction can vary from 45% to 80% of the initial water content as temperature increases from to 40° to 70°. At low temperatures, moisture reduction occurs immediately after the mixing, whereas at 70°, cement hydration takes place over a longer period of time, resulting in further moisture reduction.
(a) (b)
Figure 4 Effect of curing temperature on moisture reduction:
70o F (a), 40o F (b). 6. Resilient Modulus (AASHTO TP46-94) The resilient modulus is a dynamic soil property used in the mechanistic design of pavements. The test provides a means of characterizing base, sub-base and sub-grade materials under simulated field loading conditions and is the basis for a deterministic approach to pavement design. In the resilient modulus test, the materials are tested under a variety of conditions, some of which include stress state, moisture content, temperature, gradation and density. A detailed description of the test method and sub grade resilient properties of NJ soils is given by Maher, et al (7). For this study, the resilient properties of SDM were determined for all the mixture types used. Specimen preparation was in accordance with AASHTO TP46-94 Standard Test Method for Determining the Resilient Modulus of Soils and Aggregate Materials. This methodology classifies sub-grade soils in two categories. Type 1 soil is classified by the following criteria: less than 70% of the material passes the number 2.00 mm sieve and less than 20% passes the

17
75-μm, and the material has a plasticity index of 10 or less. These soils are compacted in a 152-mm-diameter mold. Type 2 soils include all materials that do not meet the criteria for type 1. These soils, such as SDM, are compacted in 71-mm-diameter mold. Table 8 summarizes the resultant resilient modulus values for SDM mixtures and those for three New Jersey sub-grade soils that currently underlie roadways in New Jersey. According to the table, SDM compares favorably to the soil taken from Route 23 and the sub-grade soils taken from Route 206 and Route 295 in NJ, indicating sufficient resiliency under dynamic loads.
Table 8 Comparison of Resilient Modulus Values Between SDM and Typical
NJ Base Materials Sample Type
StockpilingPeriod (months)
Compaction Effort (%)
ResilientModulus(psi)
Resilient Modulus (MPa)
85 4827.5 33.28 4% PC 1 90 7720.2 53.22 85 5167.9 35.62 4% PC 6 90 8752 60.34 85 11911 82.12 8% PC 1 90 12326 84.98 85 8432 58.13 8% PC 6 90 8945 61.67 85 5610 38.68 8%PC + 10%
FA 1
90 9254 63.80 85 1498 10.32 8%PC + 10%
FA 6
90 6601 45.51 Rt. 23 in NJ (medium to fine sand)
max dry density
9633 66.42
Rt. 295 in NJ (medium to fine silty sand)
max dry density
6405 44.16
Rt. 206 in NJ (silt with fine sand)
max dry density
6554 45.19
7. Swell Potential Samples of SDM were also tested for swell pressure in order to determine if SDM could be used in applications where the material would be in contact with structures sensitive to swell pressures and excessive deformations. For

18
example, if SDM were used as a base material in roadways, excessive swell pressures and deformations will be detrimental to the integrity of the pavement. For this study, samples of RDM were mixed with 4% Portland cement, 8% Portland cement, and 8% Portland cement plus 10% fly ash. Samples were cured in the laboratory for one month and for six months. These samples were then compacted to different densities in order to determine at what point the density level and moisture content would become critical in generating excessive swell pressure and deformation. Swell tests were performed in accordance with ASTM D-4546.
The laboratory data indicate several trends. The strain or percent swell was not significant for any of the samples tested. The strain values ranged from 0.1 to 1.2 percent, with an average of 0.6. The maximum strain belonged to the sample amended with 8% Portland cement plus10% fly ash (1.2%). This magnitude of volume change is considered low and, therefore, not detrimental to adjacent structures. The swell pressure, however, was high for samples compacted to 94% or higher of their maximum dry density with moisture contents on the dry side of optimum. For these samples, the overall average swell pressure was 1.005 tsf (96.25 kPa). The average for one-month old samples was slightly higher at 1.34 tsf (128.32 kPa), with an average strain of 1.1%. Although strains were not high for any of the samples tested, the swell pressure generated was moderate. For SDM that was mixed with 8% Portland cement and compacted to 95% of its maximum dry density, the swell pressure was measured as high as 1.96 tsf (187.69 kPa). However, considering low associated strains, SDM would not have any detrimental effect on adjacent structures. For samples compacted on the wet side of their optimum moisture content, much lower swell pressures and strains were measured. The average swell pressure for those samples was 0.14 tsf (13.41 kPa), and the average strain was 0.3%. This is due to the fact that fine-grained soils have a flocculated structure at low moisture contents (below optimum moisture content). At moisture contents above optimum, the structure of the soil particles becomes more dispersed and layered. For dispersed structures, additional moisture does not result in significant volume changes.

19
Table 9 Swell Pressure Test Results
Sample Type
Curing (Month)
Compacted Moisture %
% Max. Dry Density (on wet side)
Saturated Moisture %
Swell Pressure (tsf)
Percent Swell (%)
4% PC 1 43.7 90 85.7 0.1 0.1
4% PC 1 25.9 97 58.8 0.88 1.0
4% PC 6 41.4 90 78.7 0.15 0.4
4% PC 6 22.6 96 48.8 0.44 0.8
8% PC 1 52.0 88 99.1 0.14 0.3
8% PC 1 22.8 95 50.6 1.95 1.1
8% PC 6 41.6 90 79.9 0.25 0.6
8% PC 6 28.2 97 62.3 0.76 1.0 8% PC + 10% FA 1 45.6 87 82.4 0.1 0.2
8% PC + 10% FA 1 27.9 94 56.8 1.2 1.2
8% PC + 10% FA 6 45 92 88.2 0.1 0.2
8% PC + 10% FA 6 21 96 44.8 0.8 0.6
8. Durability 8.1 Freeze-Thaw Tests The major durability concerns regarding SDM include potential strength loss due to freeze-thaw cycles and moisture variation. The freeze-thaw test simulates the internal expansive forces that result from the moisture in fine-grained soils. During freeze-thaw cycles, SDM experiences an increase in volume and a loss in strength. Some soil-cement mixtures have the ability to regain strength under certain conditions; specifically, the availability of reactive calcium oxide, adequate temperature and a high pH environment. For SDM, these conditions do not exist; therefore, any strength loss will be permanent. In order to study the effects of freeze-thaw cycles on SDM, samples were prepared from the three different recipes. The testing was performed in accordance with ASTM D560. Samples were compacted to 85 and 90% of their

20
maximum dry density, as determined by Modified Proctor. To provide a point of reference, a natural clay sample was also tested for its behavior during freeze-thaw cycles. According to the test results, none of the samples could withstand more than three freeze-thaw cycles before failing. Significant volume change (ranging from 1.8% to 58%) was experienced during testing. Considering that the average volume change for the natural clay sample was 2%, it may be concluded that the freeze-thaw effect is several times more severe for SDM than it is for natural clay. As a result, all SDM should be protected against frost in order to maintain the cement contents within the percentages used for this project. Frost depth in New Jersey is approximately 2.5 to 3 feet (0.75 to 0.9 m). Under these conditions, SDM should be kept at least three feet below the surface. This should apply to both pavements and embankment slopes.
8.2 Wet-dry Tests Wet-dry tests are conducted to simulate shrinkage forces in cement-modified or soil-cement specimens. Wet-dry cycle tests were conducted on the three different recipes of SDM. Tests were conducted according to ASTM D-559. All of the samples with the exception of one (8% PC @ 90% Modified Proctor) collapsed before experiencing 12 wet-dry cycles. Volume changes were in the range of 10% to 48% of the original volume. Therefore, SDM should be protected against frequent wet-dry cycles with placement of proper coverage for roadway applications, or low permeability layers in general fill applications. Furthermore, if SDM is compacted at moisture contents below the shrinkage limit, the potential for the development of tensile cracks and a consequent loss in strength could be minimized. CONCLUSIONS AND RECOMMENDATIONS Beneficial use of stabilized dredged material (SDM) has been shown to be a practical option for the management of navigational dredged material in the Port of NY and NJ. The laboratory study described in this paper evaluated the geotechnical properties of stabilized dredge material (SDM) from the NY/NJ Harbor for potential high volume applications in roadway construction. The study was the first phase of a two-phase pilot project sponsored by the New Jersey Department of Transportation for finding alternative methods for beneficial use of the 2-4 million yd3 of contaminated sediments dredged annually, to maintain the maritime the transportation system that serves the port. The results of the laboratory study demonstrate that stabilized dredge material (SDM) satisfies most of the geotechnical criteria for construction of fills and embankments, except those for durability: freeze-thaw and wet-dry cycles. Proper coverage and protection need to be provided for SDM fills to address durability issues, similar to those addressed in the construction fills with cohesive soils. A summary of the test results as described in the paper is as follows:
21
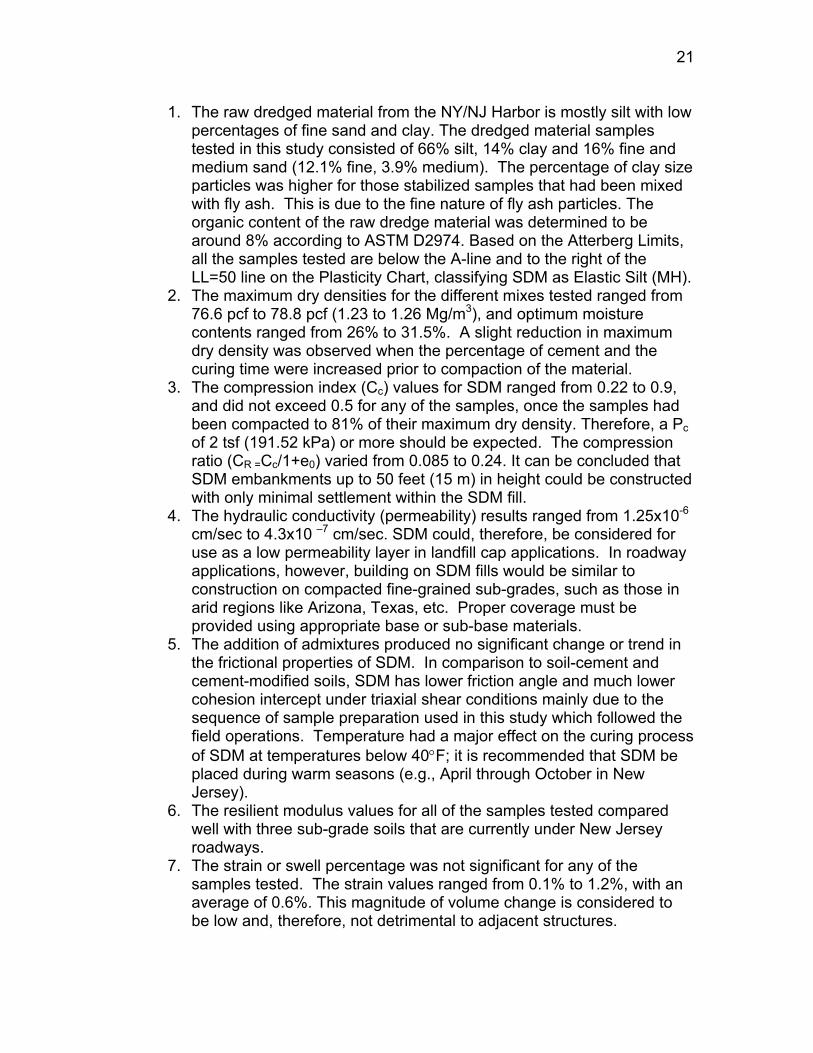
1. The raw dredged material from the NY/NJ Harbor is mostly silt with low percentages of fine sand and clay. The dredged material samples tested in this study consisted of 66% silt, 14% clay and 16% fine and medium sand (12.1% fine, 3.9% medium). The percentage of clay size particles was higher for those stabilized samples that had been mixed with fly ash. This is due to the fine nature of fly ash particles. The organic content of the raw dredge material was determined to be around 8% according to ASTM D2974. Based on the Atterberg Limits, all the samples tested are below the A-line and to the right of the LL=50 line on the Plasticity Chart, classifying SDM as Elastic Silt (MH).
2. The maximum dry densities for the different mixes tested ranged from 76.6 pcf to 78.8 pcf (1.23 to 1.26 Mg/m3), and optimum moisture contents ranged from 26% to 31.5%. A slight reduction in maximum dry density was observed when the percentage of cement and the curing time were increased prior to compaction of the material.
3. The compression index (Cc) values for SDM ranged from 0.22 to 0.9, and did not exceed 0.5 for any of the samples, once the samples had been compacted to 81% of their maximum dry density. Therefore, a Pc of 2 tsf (191.52 kPa) or more should be expected. The compression ratio (CR =Cc/1+e0) varied from 0.085 to 0.24. It can be concluded that SDM embankments up to 50 feet (15 m) in height could be constructed with only minimal settlement within the SDM fill.
4. The hydraulic conductivity (permeability) results ranged from 1.25x10⁻⁶ cm/sec to 4.3x10 –7 cm/sec. SDM could, therefore, be considered for use as a low permeability layer in landfill cap applications. In roadway applications, however, building on SDM fills would be similar to construction on compacted fine-grained sub-grades, such as those in arid regions like Arizona, Texas, etc. Proper coverage must be provided using appropriate base or sub-base materials.
5. The addition of admixtures produced no significant change or trend in the frictional properties of SDM. In comparison to soil-cement and cement-modified soils, SDM has lower friction angle and much lower cohesion intercept under triaxial shear conditions mainly due to the sequence of sample preparation used in this study which followed the field operations. Temperature had a major effect on the curing process of SDM at temperatures below 40°F; it is recommended that SDM be placed during warm seasons (e.g., April through October in New Jersey).
6. The resilient modulus values for all of the samples tested compared well with three sub-grade soils that are currently under New Jersey roadways.
7. The strain or swell percentage was not significant for any of the samples tested. The strain values ranged from 0.1% to 1.2%, with an average of 0.6%. This magnitude of volume change is considered to be low and, therefore, not detrimental to adjacent structures.

22
8. The results from durability tests indicate that SDM is susceptible to frost action (several times more susceptible than natural clay) and should be placed below frost line. Based on the wet-dry tests, proper soil cover needs to be provided at all times to minimize strength loss due to erosion. Compacting SDM at moisture contents below the shrinkage limit would minimize the potential for tensile cracks and thereby minimize any further strength loss in the material.
ACKNOWLEDGEMENTS This research was funded by the Port Authority of New York and New Jersey through the Joint Dredging Plan for the NY/NJ harbor, administered by the Office of Maritime Resources, New Jersey Department of Transportation.

23
References
1. Maher, A., Bennert, T., Jafari, F., and Douglas, W.S., Field Evaluation of Constructed Stabilized Dredged Material Fills, to be submitted to the International Journal of Solid Waste Technology, 2003.
2. Kezdi, A. Handbook of Soil Mechanics. VEB Verlag fur Bawsen, Berlin,
1970. 3. Balmer, G.G., Shear Strength and Elastic Properties of Soil-Cement
Mixtures Under Triaxial Loading. Portland Cement Association Bulletin, D32, 1958.
4. Clough, G.W., Sitar, N., Bachus, R. C., and Rad, N, Cemented Sand
Under Static Loading. Journal of Geotechnical Engineering, American Society of Civil Engineers,, Vol. 107, No. GT6, 1981, pp.799-817.
5. Van Riessen, G. J., and Hansen, K. Cement-stabilized Soil for Coal
Retaining Berms. Special Technical Publication 30, American Society of Civil Engineers, 1992, pp.981-992.
6. Cotton, M.D., Soil-Cement Technology – a Resume. Journal of the
Portland Cement Association Research and Development Laboratories, Vol.4, No.1, 1962, pp.13-21.
7. Maher, A., Bennert, T., Papp, W. Resilient Properties of New Jersey Sub-
grade Materials. Presented to the New Jersey Department of Transportation, Trenton, NJ, 2000.