dredged material management: cads, treatment, & upland ... · dredged material management:...
TRANSCRIPT

1
Dredged Material Management: CADs, Treatment, & Upland
C id tiConsiderationsThomas J. Fredette, PhD
US Army Corps of EngineersEngineer Research and Development
CenterCenter
Management Alternatives
2

2
Impacts Open-W t
Island Upland Treat-t
NoD d i
Some Alternative Environmental Issues (1)
Water ment DredgingDredging
TransferLossesStorm
Truck
StagingArea
3
Impacts Open-W t
Island Upland Treat-t
NoD d i
Some Alternative Environmental Issues (2)
Water ment DredgingAquifer
Neighbor-hoodLeachateTreatmentTreatmentExtractantDisposalWaterQuality
4
3
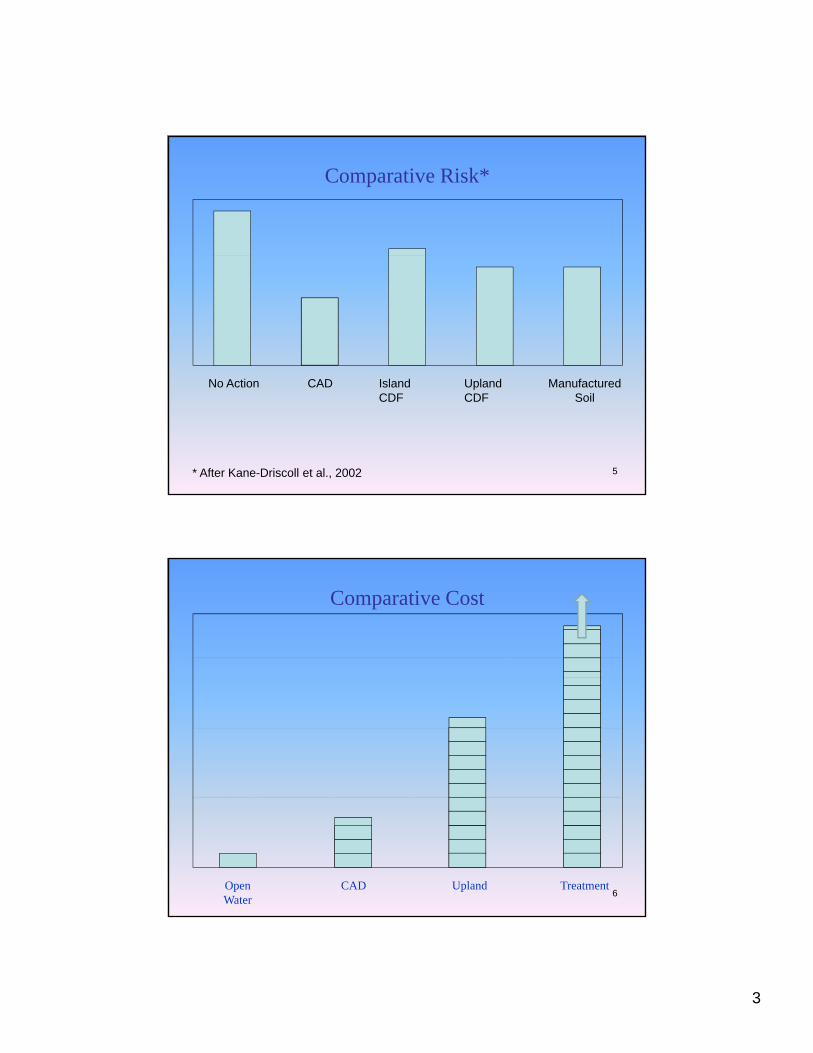
Comparative Risk*
No Action Island CDF
CAD Upland CDF
Manufactured Soil
* After Kane-Driscoll et al., 2002 5
Comparative Cost
CADOpen Water
Upland Treatment6

4
Ted Williams Tunnel – Upland
> $150/CY (1990)
7
1 MCY = 64 ac @ 10 ft
8

5
Geotextile Tube Dewatering/Storage
.
Images Compliments of Mineral Processing Services, LLC, South Portland , ME
9
Sediment Treatment
Small Volumes
Low Process Rates
Needs Accessible Site
High Cost
R id l Di lResidual Disposal
10

6
45000
50000
50000Trips/1M CY
20000
25000
30000
35000
40000
9091
0
5000
10000
15000
Barge Rail Car Truck
200
9091
11
12

7
13
Confined Aquatic Disposal (CAD) Cell
14

8
Bay/Estuary
Regulations
CWA vs. MPRSA
Bay Site
Territorial Sea BaselineCAD Cell
CWA
Ocean
Offshore Site
MPRSA
15
Boston Harbor CADsMystic River
16

9
CAD Cells in New England
Boston Harbor
New Bedford Harbor
Norwalk Harbor New London HarborProvidence Harbor
Hyannis Harbor
17
Confined Aquatic Disposal Cells
1981 – Norwalk Harbor, ~ 2,500 cu m
1989 – New Bedford Harbor Pilot
NE CAD Alternative Experience
1997-2000 – Boston Harbor, 1,200,000 cu m
1998 – Hyannis Harbor, 57,000 cu m
2003-? - Providence Harbor, 900,000 cu m
2006 - Norwalk Harbor, 27,000 cu m
2005-? – New Bedford Harbor - TBD
2006 - New London Harbor, 117,000 cu m
2008-2010 – Boston Harbor
2010 – New London Harbor18

10
C12
M19
Supercell
M12
M8-11
M5
M4M2Mystic River
Chelsea RiverInner Confluence
Tobin BridgeBoston Harbor CADs
IC2
Inner Confluence
• 11 cells total, with approximately 2 million cy excavated up to 6011 cells total, with approximately 2 million cy excavated up to 60 feet below the surrounding harbor bottom
• 1 cell in 1997, 5 cells in 1998, 3 cells in 1999, and 2 cells in 2008
• 8 cells were capped between 1997 and 2000, C12 remains uncapped with additional capacity, capping recently completed for 2008 cells
19
71°23'40"W71°24'0"W
"N "N
Providence CADs- data collection
• Extensive characterization data as part of EIS
• Extensive water column monitoring program as part
(3AR
(5R
(6/7R
(4R
(3R
(1R
41°4
8'40
"
41°4
8'40
" monitoring program as part of permit for disposal
• Additional monitoring of dredging performed by ERDC
• Ongoing RICRMC monitoring of bathymetry(
71°23'40"W71°24'0"W
41°4
8'20
"N
41°4
8'20
"N
0 500 1,000250Feet
J:\Water\ProjectFiles\P90\9000DAMOS\Misc_Projects\Providence\Figures\CAD_closeup.mxdProjection: Conformal Conic Coordinate System: RI State Plane (m) Datum: NAD 83
Z
March 2006
Approximate CAD cell boundaries
• Full project summary report
• 2009 bathymetry, SPI, and video transects survey
20

11
1981 – Rotterdam, Netherlands, 1.1 MCY
1984 – Seattle, WA Duwamish, 1100 cy
1987 – One Tree Island Marina, WA
Other CAD Alternative Experience
1992 - Hong Kong, 13 MCY
1992 – Ross Island, Portland OR, 160 KCY
1997 - Newark Bay, 2 MCY
2000 – Puget Sound Naval Shipyard, 377 KCY
2001 - Los Angeles, Energy Island, 100 KCY
2006 – Oslofjord, Norway, 880 KCY
2008 - Port Hueneme, CA, 327 KCY
2008 – Melbourne, Australia, 23 MCY
2010 – Manila, Philippines21
• Geology
CAD Considerations
• Cost
• Capacity
• Channel Deepening
%
%
%
%
%
%
%
%
%
%
%
%
% % %%
%
%
%
%
D300
D250S
D250N
D200
U200
U250N
U300
U250S
M5
M6
M8/11
SupercellM19 merged
M4M2
B2
B11
B12
B1
B3 B4 B5B6
B9
B7
B10
B8downstream
upstream
Tracer Grab Station Sediment Tracer SurveysB t H b 2002% Background Survey
• Capping? Boston Harbor CAD CellsLNG Vessel
Projection: Lambert Conformal ConicCoordinate System: Stateplane, MA MainlandDatum: NAD83Units: MetersOriginal Map in Color
File: bh_tracer2002_baselinew.cdb Compiled by: C.L.Seidel, SAIC, 8/26/03
8100 0 100 Meters
Boston Harbor 2002% T1 SurveyTracer Deployment Area
Magenta TracerYellow Tracer
22

12
Construction Logistics
Maintenance Sediments
Native Sediment
Bedrock 23
Starter Cell Storage Barges
CAD Cells
24

13
Bulking Considerations
Lif 2
Lift 3
Lift 2
Lift 1
25
Fluid Loss Conditions
Clay Sand/Till
26

14
CAD Surge?
27
CAD Filling History
28
15
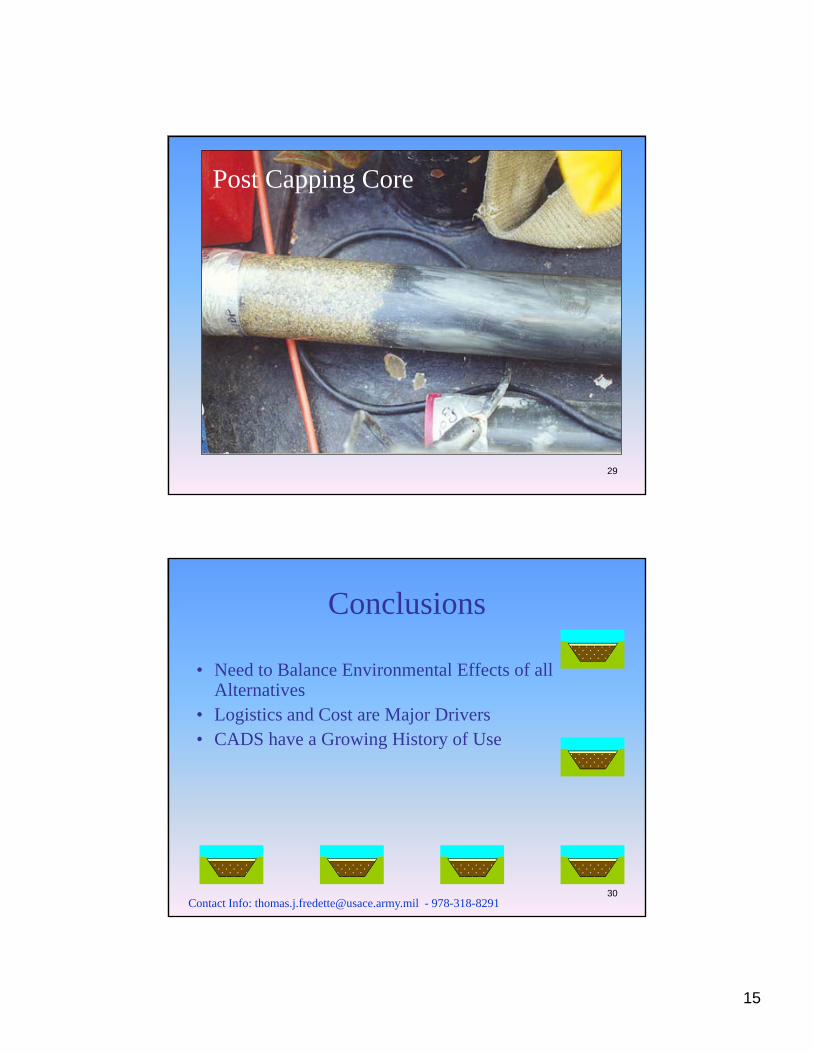
Post Capping Core
29
Conclusions
• Need to Balance Environmental Effects of all Alternatives
• Logistics and Cost are Major Drivers• CADS have a Growing History of Use
Contact Info: [email protected] - 978-318-829130

16
Further Reading
• Fredette, T. J., P. E. Jackson, C. J. Demos, D. A. Hadden, S. H. Wolf, T. A. Nowak Jr., and. E. DeAngelo. 2000. The Boston Harbor Navigation Improvement Project CAD Cells: Recommendations for Future Projects Based on Field Experience and Monitoring Proceedings of the Western Dredging AssociationProjects Based on Field Experience and Monitoring. Proceedings of the Western Dredging Association, Twentieth Technical Conference and Twenty-second Texas A&M Dredging Seminar, June 25-28, Warwick, RI. Pp. 291-302.
• Fredette, T.J. 2006. Why confined aquatic disposal cells often make sense. Integrated Environ. Assess. Man. 2(1): 1-4.
• Wolf, S., M. Greenblatt, T.J. Fredette, D.A. Carey, S. Kelly, R.J. Diaz, P. Neubert, I. Williams, and J.H. Ryther. 2006. Stability and Recovery of Capped in-Channel CAD Cells: Boston Harbor, Massachusetts. Proceedings of the Western Dredging Association Twenty-Sixth Technical Conference and Thirty-Eighth Texas A&M Dredging Seminar, 26-28 June 2006, San Diego, CA. Center for Dredging Studies , Ocean Engineering Program Civil Engineering Department Texas A&M University College Station TX PpEngineering Program, Civil Engineering Department, Texas A&M University, College Station, TX. Pp. 451-460.
Contact Info: [email protected] - 978-318-829131