drew cbea quarterly report may 2021 - mcneesedrewecon.org
TRANSCRIPT

Drew CBEA Quarterly Report May 2021
About the Center
The H.C. Drew Center for
Business and Economic
Analysis (Drew CBEA)
collects, tracks, and analyzes
data relevant to the economy
of Southwest Louisiana.
A joint venture between
McNeese State University and
the SWLA Alliance, the center
strives to serve the community
with high quality economic
analysis, reports, and data
collections.
Visit our website and follow us
on social media to see what
we have to offer.
Contact
Phone: 337-475-5560
Website:
mcneesedrewecon.org
@mcneesedrewecon
fb.com/mcneesedrewecon
1st Quarter 2021 Issue
This issue of the Drew CBEA report focuses on data illustrating the continuing
recovery from the COVID-19 pandemic and rebuilding from Hurricanes Laura and
Delta. As the area continues rebuilding, pretty much all parishes are seeing dramatic
increases in their tax revenues and a continuing trend of new business filings. The
figures show most parishes are still below pre-pandemic levels in terms of
employment but taxable sales and sales tax collections have seen an increase.
Residents are also seeing increased assistance in the form of higher SNAP benefits
in each parish. The area has also seen upticks in exports and gaming revenues (in
spite of one casino establishment remaining shut down).
There has been much talk about state population estimates from the Decennial
Census. From these results, some states gained seats and some lost, while others,
like Louisiana, saw no change. There has been very little talk, however, about the
Vintage estimates that were recently released showing population estimates from
2010-2020 for states, metropolitan areas, counties/parishes, etc. The end of this
report dives into the latest population estimates for the Lake Charles MSA and each
of the five parishes. While total figures and changes over the decade are shown,
changes are also analyzed in connection with births/deaths, and net migration.
Thank you for reading and, as always, if you have any questions, feel free to contact
the Drew CBEA with any questions.
Dan Groft, Ph.D.
Director, H.C. Drew Center for Business and Economic Analysis

Contents
Lake Charles MSA .......................................................................................................................................................... 3
Housing Statistics ................................................................................................................................................... 5
Transportation Statistics ......................................................................................................................................... 6
Gaming Statistics .................................................................................................................................................... 7
Allen Parish ................................................................................................................................................................... 8
Beauregard Parish........................................................................................................................................................ 11
Calcasieu Parish .......................................................................................................................................................... 14
Cameron Parish ........................................................................................................................................................... 17
Jefferson Davis Parish.................................................................................................................................................. 20
Population Estimates Analysis of Southwest Louisiana ................................................................................................. 23
Sources ....................................................................................................................................................................... 27

Selected Employment Indicators – Lake Charles MSA
In the 1st quarter of 2021, the Lake Charles MSA (consisting of Calcasieu and Cameron parishes) has continued to experience large decreases in employment compared to the same quarter the previous year. However, compared to the 4th quarter of 2020, there has been growth as the area continues to rebuild from hurricanes and the economy further opens up.
Total nonfarm employment (presented in thousands of jobs in the table) fell by 18,800 jobs over the year for a 17.1% decrease. Looking at the industries shows no industry gained jobs over the year (not counting mining). Construction experienced the largest percentage drop at 38% drop losing 7,500 jobs. Leisure & Hopsitality fell 3,100 jobs (-21.6%) while Manufacturing only lost 600 jobs (-5.3%). Professional and Business services lost 2,000 jobs for a 19.6% drop. Trade,
Transportation, and Utilities lost 2,500 jobs (-13.9%) and government lost 1,100 jobs (-7.0%).
This loss in employment also led to large drops in earnings measures. Average weekly earnings of all employees fell 5.7% while average hourly earnings fell 4.1%. Although not shown, average weekly hours of all employees in the first quarter fell 1.7% over the year.
(measures in thousands of workers) Qtr1 - 2020 Qtr2 - 2020 Qtr3 - 2020 Qtr4 - 2020 Qtr1 - 2021
Total Nonfarm 109.9 94.6 91.0 89.8 91.1
Year-Over-Year Change -5.0 -21.5 -22.5 -23.7 -18.8
Year-Over-Year % Change -4.4 -18.5 -19.8 -20.9 -17.1
Mining and Logging 0.3 0.3 0.3 0.4 0.4
Year-Over-Year Change 0.0 0.0 0.0 0.1 0.1
Year-Over-Year % Change 0.0 0.0 11.1 33.3 22.2
Construction 19.8 14.7 13.1 12.5 12.3
Year-Over-Year Change -4.5 -9.9 -9.7 -10.1 -7.5
Year-Over-Year % Change -18.5 -40.2 -42.5 -44.6 -38.0
Manufacturing 10.8 10.7 10.4 10.2 10.2
Year-Over-Year Change 0.1 -0.1 -0.4 -0.6 -0.6
Year-Over-Year % Change 0.6 -0.6 -3.4 -5.3 -5.3
Trade, Transportation, and Utilities 17.9 16.3 16.0 14.7 15.4
Year-Over-Year Change -0.4 -1.8 -2.3 -3.8 -2.5
Year-Over-Year % Change -2.4 -10.1 -12.6 -20.4 -13.9
Professional and Business Services 10.4 9.0 8.7 8.2 8.3
Year-Over-Year Change 0.0 -1.5 -1.5 -1.7 -2.0
Year-Over-Year % Change 0.0 -14.0 -14.9 -17.1 -19.6
Leisure and Hospitality 14.5 10.5 10.7 10.3 11.4
Year-Over-Year Change -0.2 -4.8 -4.4 -4.3 -3.1
Year-Over-Year % Change -1.4 -31.4 -29.1 -29.5 -21.6
Government 15.3 14.6 13.3 14.0 14.2
Year-Over-Year Change 0.0 -1.0 -1.6 -1.4 -1.1
Year-Over-Year % Change -0.2 -6.6 -10.8 -9.1 -7.0
Average Weekly Earnings (All Employees) 763.25 728.66 755.4 760.5 719.8
Year-Over-Year Change -50.0 -72.2 -65.2 -58.9 -43.5
Year-Over-Year % Change -6.1 -9.0 -7.9 -7.2 -5.7
Average Hourly Earnings (All Employees) 22.99 21.89 22.52 22.26 22.1
Year-Over-Year Change 0.6 -1.0 -1.2 -1.8 -0.9
Year-Over-Year % Change 2.8 -4.5 -5.1 -7.6 -4.1
60
70
80
90
100
110
120
130
Th
ou
sa
nd
s
Lake Charles MSA Employment Measures
Total Nonfarm Household Employment
-40.0
-20.0
0.0
20.0
%
Total Employment % Change - Available Sectors
Qtr 1 2020 - Qtr 1 2021

Selected Employment Indicators – Lake Charles MSA
Qtr1 - 2020 Qtr2 - 2020 Qtr3 - 2020 Qtr4 - 2020 Qtr1 - 2021
Household Employment 104,733 88,843 88,328 88,313 88,650
Year-Over-Year Change -2,143 -19,222 -18,355 -18,438 -16,083
Year-Over-Year % Change -2.0 -17.8 -17.2 -17.3 -15.4
Household Unemployment 4,973 12,361 10,176 8,793 7,104
Year-Over-Year Change 920 8,191 5,374 4,299 2,131
Year-Over-Year % Change 22.7 196.5 111.9 95.7 42.9
Labor Force 109,706 101,203 98,504 97,106 95,753
Year-Over-Year Change -1,222 -11,031 -12,982 -14,139 -13,952
Year-Over-Year % Change -1.1 -9.8 -11.6 -12.7 -12.7
Unemployment Rate (%) 4.5 12.2 10.4 9.1 7.4
Year-Over-Year Change 0.9 8.5 6.1 5.0 2.9
The quarterly average unemployment rate in the MSA currently sits at 7.4% which represents a 2.9 percentage point increase from a year ago. Lake Charles currently has the 3rd highest 1st quarter unemployment rate of all MSA’s in the state, behind Hammond and New Orleans. The household employment measure fell by 16,083 over the year in the 1st quarter for a 15.4% decrease. The number of unemployed increased by 2,131. This represented a dramatic 42.9% increase. As the labor force is the total of unemployed and employed, the total change in the labor force was a drop of 13,952 (-12.7%). Job openings in the 1st quarter of 2021 averaged 5,496. Openings increased by 470 (9.3%) over the year.
Overall, both the household and nonfarm employment measures show the MSA had been falling slightly (mainly due
to construction projects finishing), but took a dramatic drop in the third and fourth quarters due to the pandemic and
Hurricanes Laura and Delta. Jobs have been increasing but are still below pre-pandemic levels.
Qtr1 - 2020 Qtr2 - 2020 Qtr3 - 2020 Qtr4 - 2020 Qtr1 - 2020
Total Job Openings 5,026 3,875 4,954 4,723 5,496
Year-Over-Year Change -561 -1,695 -1,675 -876 470
Year-Over-Year % Change -10.0 -30.4 -25.3 -15.6 9.3
0
20,000
40,000
60,000
80,000
100,000
120,000
Qtr1 Qtr2 Qtr3 Qtr4
Lake Charles MSA Employment
2019 2020 2021
0
2
4
6
8
10
12
14
Qtr1 Qtr2 Qtr3 Qtr4
%
Lake Charles MSA Unemployment Rate
2019 2020 2021
0
2,000
4,000
6,000
8,000
10,000
12,000
14,000
Qtr1 Qtr2 Qtr3 Qtr4
Lake Charles MSA Unemployment
2019 2020 2021

Housing Statistics
The housing statistics show that prices in the area were rising slower than the state and the nation. Looking at price changes over-the-year, from the first quarter of 2020 to the same quarter in 2021, housing prices have only risen 0.2% in the Lake Charles MSA compared to 4.0% in LA and 6.0% in the US.
Housing Permits – Lake Charles MSA
In the first quarter of 2021, single unit permits fell by 15
over-the-year while multi-unit permits fell by 6 bringing the
total decrease to 21. This represented an 8.3% decrease.
The YTD figures show drops of 15 in single unit and 6 for
multi-unit bringing the total decrease to 21. The
percentage change for total permits YTD was –8.3%. In
terms of valuation, single unit permits fell $2.7 million while
multi-unit permit valuations fell $739,000 for a total
decrease of $3.4 million. This represented an 8% drop
year-over-year in the 1st quarter of 2021 for valuation of all
permits. In terms of YTD numbers, the total year-over-year
change in valuation for single unit permits was a drop of
$2.7 million while the drop-in multi-unit permits was $739
thousand leading to a total drop in valuation of $3.4
million. The percentage change in valuation for all permits YTD was a decrease of 8.0%.
The graph of building permits shows that there was a slight dip in permits during the 2nd quarter of 2020 (during the
pandemic). Since that time, total permits have been at a slightly higher level. Part of this is no doubt due to hurricane
rebuilding in the 4th quarter of 2020 continuing into the 1st quarter of 2021.
Home Price Index Comparisons
Qtr4– 2019 Qtr4 – 2020 Year-over-Year % Change
Lake Charles HPI
130.1 130.3 0.2
Louisiana HPI 123.4 128.3 4.0
US HPI 142.1 150.7 6.0
Qtr-1 2020 Qtr-1 2021
YoY Change
YoY % Change
Qtr-1 2020 YTD Qtr-1 2021 YTD YoY Change YoY % Change
Number
Total 253 232 -21 -8.3 253 232 -21 -8.3 Single 237 222 -15 -6.3 237 222 -15 -6.3
Multi-unit
16 10 -6 -37.5 16 10 -6 -37.5
Valuation
(thousands $) Total 42,883 39,465 -3,418 -8.0 42,883 39,465 -3,418 -8.0
Single 41,427 38,746 -2,681 -6.5 41,427 38,746 -2,681 -6.5 Multi-unit
1,458 719 -739 -50.7 1,458 719 -739 -50.7
95
105
115
125
135
145
155
FHFA Quarterly Housing Price Indexes(Qtr1-2011 = 100)
US LA LC
0
100
200
300
400
0
100
200
300
Qtr1 - 2020 Qtr2 - 2020 Qtr3 - 2020 Qtr4 - 2020 Qtr1 - 2021
Num
be
r o
f U
nits (
tota
l se
rie
s)
Num
be
r o
f U
nits
Lake Charles MSA Building Permits
Single Unit Total Multiunit Total

Transportation Statistics
Lake Charles Regional Airport
The Lake Charles regional airport experienced a large downturn in activity during the 4th quarter. While some of the drop was due to the pandemic, more was due to the damages inflicted by Hurricanes Laura and Delta.
Passengers departing in the 4th quarter of 2020 fell 11,845 (-68%) since the 4th quarter of 2019 and those arriving have decreased 11,927 (-69.3%). In terms of flights, there has been a decrease of 369 flights (-68.6%) departing Lake Charles over that same period while the number of flights arriving has fallen by 365 (-68.1%). The graphs showing these measures point to downward trends driven by mainly by the 2nd quarter drop due to COVID and the 4th quarter drop due to the storms. This activity should pick up as repairs are completed and American Airlines resumes flights.
Lake Charles Port Statistics
The Lake Charles port has seen a continued uptick in exports in the 1st quarter of 2021 compared to the previous year. The figures in the table below show the value of exports rose $31 million (+1.7%) over the year while the total value of imports fell $149 million (-26.2%). The total weight of all exports rose 266 million kg (+5.8%) while the total weight of all imports fell 1,090 million kg (-61.5%).
Qtr-4 2019 Qtr-4 2020 YoY Change YoY % Change
Passengers
Departures 17,422 5,577 -11,845 -68.0
Arrivals 17,200 5,273 -11,927 -69.3
Flights
Departures 538 169 -369 -68.6
Arrivals 536 171 -365 -68.1
Qtr-1 2020 Qtr-1 2021 YoY Change YoY % Change
Value (millions $)
Exports 1,784 1,815 31 1.7
Imports 569 420 -149 -26.2
Shipping Weight (millions kg)
Exports 4,601 4,867 266 5.8
Imports 1,774 683 -1,090 -61.5
1,000
2,000
3,000
Qtr12019
Qtr22019
Qtr32019
Qtr42019
Qtr12020
Qtr22020
Qtr32020
Qtr42020
Qtr12021
To
tal V
alu
e (
Million
s U
S $
)
Lake Charles Port - Value
Exports Imports
2,000
4,000
6,000
8,000
10,000
Qtr12019
Qtr22019
Qtr32019
Qtr42019
Qtr12020
Qtr22020
Qtr32020
Qtr42020
Qtr12021
To
tal S
hip
pin
g W
iegh
t (m
illio
ns k
g)
Lake Charles Port - Weight
Exports Imports
0
5,000
10,000
15,000
20,000
Qtr42018
Qtr12019
Qtr22019
Qtr32019
Qtr42019
Qtr12020
Qtr22020
Qtr32020
Qtr42020
Lake Charles Regional Airport Passengers
Departures Arrivals Linear (Arrivals)
0
100
200
300
400
500
600
Qtr42018
Qtr12019
Qtr22019
Qtr32019
Qtr42019
Qtr12020
Qtr22020
Qtr32020
Qtr42020
Lake Charles Regional Airport Flights
Departures Arrivals

Gaming Statistics
Gaming establishments have
been operating at reduced
capacity. Restrictions and the
temporary closing of Isle of Capri
are still preventing revenues and
admissions from reaching pre-
pandemic levels, despite recent
gains. Revenues are above 1st
quarter 2020 figures which had
some effects of the
pandemic.Total revenues in
SWLA for the 1st quarter of 2021
increased $20.4 million for a
11.5% increase compared to the
same quarter the previous year.
Isle of Capri collected no revenue
in the 1st quarter of 2021 due to
closure. L‘Auberge had an
increase of $19.9 million for a
34.5% increase. The Golden
Nugget had an annual percentage
increase in AGR of 18.4% with an
absolute increase of $11.9 million.
Delta Downs experienced a $7.1
million rise in AGR over the year
for a 19.5% increase. These
figures indicate a solid recovery in
the gaming market despite restrictions.
The region saw a very slight drop in the share of total state revenues. The three SWLA establishments made up
39.7% of the total AGR from riverboats and slots and tracks in the state, falling only slightly from 39.9% in the 1st
quarter of 2020 (which included Isle of Capri). The SWLA gaming industry still has a similar share despite having one
casino closed.
Qtr1 - 2020 Qtr2 - 2020 Qtr3 - 2020 Qtr4 - 2020 Qtr1 - 2021
Total State AGR (millions) 444.0 229.2 413.7 420.8 497.7
Year-Over-Year Change (millions) -117.4 -319.0 -121.8 -104.2 53.6
Year-Over-Year % Change -20.9 -58.2 -22.7 -19.8 12.1
Total SWLA AGR (millions) 177.2 103.6 146.7 166.8 197.7
Year-Over-Year Change (millions) -49.0 -119.8 -71.8 -47.1 20.4
Year-Over-Year % Change -21.7 -53.6 -32.9 -22.0 11.5
Total AGR (millions)
Isle of Capri 18.4 9.3 10.2 0.0 0.0
Year-Over-Year Change (millions) -7.4 -15.0 -12.1 -20.9 -18.4
Year-Over-Year % Change -28.6 -61.7 -54.3 -100.1 -100.0
L'Auberge 57.7 33.6 49.0 63.2 77.6
Year-Over-Year Change (millions) -19.2 -41.4 -25.8 -12.2 19.9
Year-Over-Year % Change -24.9 -55.2 -34.5 -16.2 34.5
Golden Nugget 65.0 39.6 54.9 68.3 76.9
Year-Over-Year Change (millions) -10.3 -38.3 -23.9 -7.4 11.9
Year-Over-Year % Change -13.6 -49.2 -30.3 -9.8 18.4
Delta Downs 36.1 21.1 32.5 35.3 43.2
Year-Over-Year Change (millions) -12.2 -25.1 -10.0 -6.6 7.1
Year-Over-Year % Change -25.2 -54.3 -23.5 -15.8 19.5
Share of Total SWLA AGR
Isle of Capri 10.4% 9.0% 7.0% 0.0% 0.0%
L'Auberge 32.6% 32.4% 33.4% 37.9% 39.3%
Golden Nugget 36.6% 38.2% 37.4% 41.0% 38.9%
Delta Downs 20.4% 20.4% 22.2% 21.2% 21.8%
Share of Total State AGR
Isle of Capri 4.2% 4.1% 2.5% 0.0% 0.0%
L'Auberge 13.0% 14.7% 11.8% 15.0% 15.6%
Golden Nugget 14.6% 17.3% 13.3% 16.2% 15.4%
Delta Downs 8.1% 9.2% 7.9% 8.4% 8.7%
SWLA Total AGR 39.9% 45.2% 35.4% 39.6% 39.7%
30%
5030%
10030%
15030%
20030%
25030%
-50
0
50
100
150
200
250
Feb-21 Mar-21 Qtr4 - 2017 Qtr1 - 2018 Qtr2 - 2018 Qtr3 - 2018 Qtr4 - 2018 Qtr1 - 2019
SW
LA
Sh
are
of T
ota
l R
ive
rbo
ars
an
d S
lots
Ad
juste
d G
ross R
eve
nu
es (
millio
ns $
)
SWLA Gaming Revenues and Market Share
Isle of Capris L'auberge Golden Nugget Delta Downs SWLA Riverboat & Slots at Track Market Share

Selected Employment Indicators – Allen Parish
Qtr1 - 2020 Qtr2 - 2020 Qtr3 - 2020 Qtr4 - 2020 Qtr1 - 2021
Household Employment 8,492 7,337 7,298 7,601 7,525
Year-Over-Year Change 172 -1,130 -1,057 -865 -967
Year-Over-Year % Change 2.1 -13.3 -12.6 -10.2 -11.4
Household Unemployment 554 1,127 801 628 559
Year-Over-Year Change 96 668 291 124 5
Year-Over-Year % Change 21.0 145.4 57.1 24.5 1.0
Labor Force 9,046 8,464 8,099 8,229 8,085
Year-Over-Year Change 269 -462 -766 -742 -962
Year-Over-Year % Change 3.1 -5.2 -8.6 -8.3 -10.6
Unemployment Rate (%) 6.1 13.3 9.9 7.6 6.9
Year-Over-Year Change 0.9 8.1 4.2 2.0 0.8
Qtr1 - 2020 Qtr2 - 2020 Qtr3 - 2020 Qtr4 - 2020 Qtr1 - 2021
Total Job Openings 161 139 193 161 175
Year-Over-Year Change 10 -18 26 11 13
Year-Over-Year % Change 6.8 -11.3 15.6 7.1 8.3
In the 1st quarter of 2021, Allen parish saw a drop in the
labor force of 962 (-10.6%). This was broken down by an
increase in household unemployment of 5 over the year
(+1.0%) while the number of employed persons fell 967 (-
11.4%) over the year. The unemployment rate rose 0.8
percentage points over the year to 6.9%.
Job openings in the 1st quarter of 2021 averaged 175. Openings rose by 13 (+8.3%) over the year.
The graphs show the levels of household employment,
unemployment, and the unemployment rate for each
quarter compared to the same quarter the previous two
years. In the 1st quarter of 2021, Allen has had generally higher unemployment and lower employment figures while
the labor force has been steady over the year.
6,000
7,000
8,000
9,000
Qtr1 Qtr2 Qtr3 Qtr4
Allen Parish Employment
2019 2020 2021
0
2
4
6
8
10
12
14
Qtr1 Qtr2 Qtr3 Qtr4
%
Allen Parish Unemployment Rate
2019 2020 2021
0
200
400
600
800
1,000
1,200
Qtr1 Qtr2 Qtr3 Qtr4
Allen Parish Unemployment
2019 2020 2021

New Business Filings
The graph to the left shows the amount of new
business filings each quarter compared to the
same quarter in the previous two years.
The number of new business filings in Allen
parish was 38 in the 1st quarter of 2021 which
was the 16 more than the same quarter in 2020
and 20 more compared to the same quarter 2
years ago. The YTD total for the 1st quarter of
2020 was 38. This was 16 businesses higher
than the 1st quarter of 2020 YTD and 20 business
lower than the 1st quarter of 2019 YTD.
Qtrly New Business Filings Qtr1 Qtr2 Qtr3 Qtr4
2019 18 22 22 22
2020 22 22 38 46
2021 38
SNAP Benefits
Allen parish had a continuing increase in SNAP
recipients, households and benefits over the year.
The parish had an average of 4,884 recipients of
SNAP benefits in the 1st quarter of 2021. 723 more
people received benefits compared to the 1st quarter
of 2020 for an 17.4% increase over this time. The
total number of households receiving SNAP was
2,261 which was 417 more than the same quarter in
the previous year. This represented a 22.6%
increase. In terms of benefits, the parish received $1
million in total during the 1st quarter of 2021, which
was a $513.8 thousand increase over-the-year. This
was a 95.8% rise in benefits in the parish. Looking
at the graph illustrates over the past two years an
overall decreasing trend in benefits before a sharp rise due to the effects of the COVID-19 pandemic and effects of the
storms.
Qtrly New Business Filings YTD Qtr1 Qtr2 Qtr3 Qtr4
2019 18 40 62 84
2020 22 44 82 128
2021 38
Qtr1 - 2020 Qtr2 - 2020 Qtr3 - 2020 Qtr4 - 2020 Qtr1 - 2021 YoY Change YoY % Change
Recipients 4,162 4,386 4,513 4,867 4,884 723 17.4
Households 1,845 1,973 2,068 2,241 2,261 417 22.6
Benefits 536,533 771,752 817,835 921,432 1,050,320 513,787 95.8
0
200,000
400,000
600,000
800,000
1,000,000
1,200,000
0
1,000
2,000
3,000
4,000
5,000
6,000
Qtr1 -2019
Qtr2 -2019
Qtr3 -2019
Qtr4 -2019
Qtr1 -2020
Qtr2 -2020
Qtr3 -2020
Qtr4 -2020
Qtr1 -2021
# R
ecip
ien
ts / H
ou
se
ho
lds
# R
ecip
ien
ts / H
ou
se
ho
lds
Allen Parish SNAP Data
Recipients Households Benefits
0
5
10
15
20
25
30
35
40
45
50
Qtr1 Qtr2 Qtr3 Qtr4
Allen Parish New Domestic Business Filings
2019 2020 2021
Tax Collections
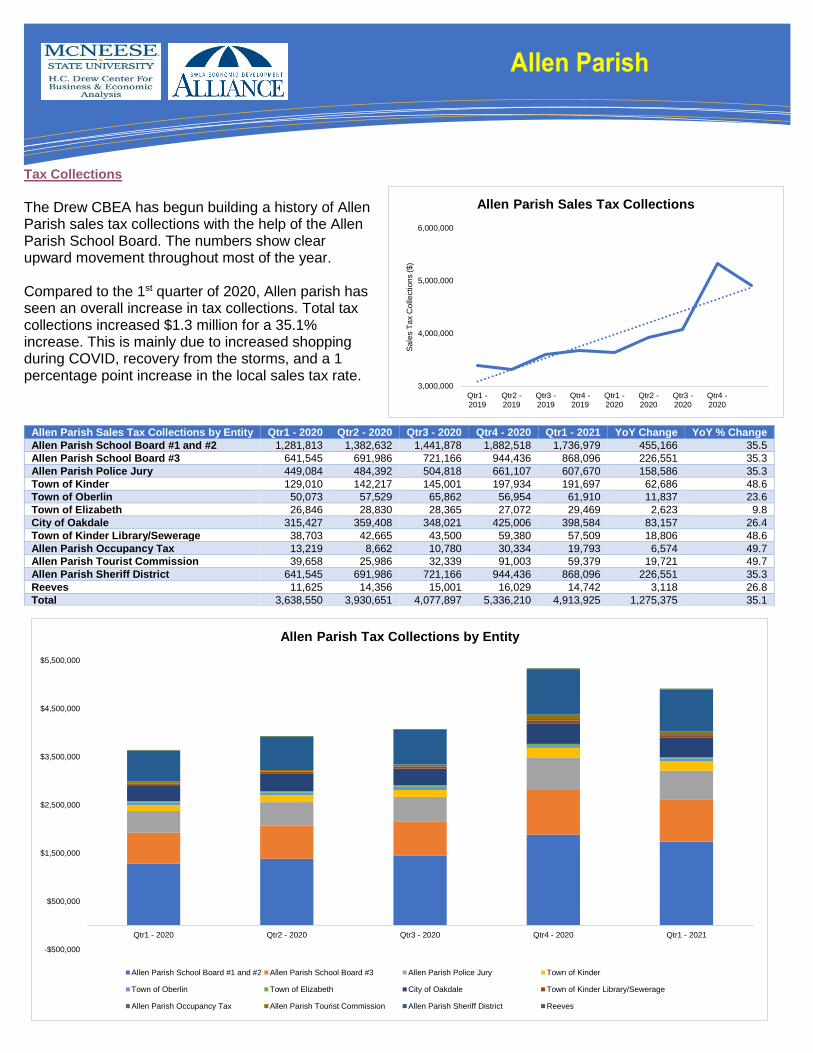
The Drew CBEA has begun building a history of Allen Parish sales tax collections with the help of the Allen Parish School Board. The numbers show clear upward movement throughout most of the year. Compared to the 1st quarter of 2020, Allen parish has seen an overall increase in tax collections. Total tax collections increased $1.3 million for a 35.1% increase. This is mainly due to increased shopping during COVID, recovery from the storms, and a 1 percentage point increase in the local sales tax rate.
Allen Parish Sales Tax Collections by Entity Qtr1 - 2020 Qtr2 - 2020 Qtr3 - 2020 Qtr4 - 2020 Qtr1 - 2021 YoY Change YoY % Change
Allen Parish School Board #1 and #2 1,281,813 1,382,632 1,441,878 1,882,518 1,736,979 455,166 35.5
Allen Parish School Board #3 641,545 691,986 721,166 944,436 868,096 226,551 35.3
Allen Parish Police Jury 449,084 484,392 504,818 661,107 607,670 158,586 35.3
Town of Kinder 129,010 142,217 145,001 197,934 191,697 62,686 48.6
Town of Oberlin 50,073 57,529 65,862 56,954 61,910 11,837 23.6
Town of Elizabeth 26,846 28,830 28,365 27,072 29,469 2,623 9.8
City of Oakdale 315,427 359,408 348,021 425,006 398,584 83,157 26.4
Town of Kinder Library/Sewerage 38,703 42,665 43,500 59,380 57,509 18,806 48.6
Allen Parish Occupancy Tax 13,219 8,662 10,780 30,334 19,793 6,574 49.7
Allen Parish Tourist Commission 39,658 25,986 32,339 91,003 59,379 19,721 49.7
Allen Parish Sheriff District 641,545 691,986 721,166 944,436 868,096 226,551 35.3
Reeves 11,625 14,356 15,001 16,029 14,742 3,118 26.8
Total 3,638,550 3,930,651 4,077,897 5,336,210 4,913,925 1,275,375 35.1
3,000,000
4,000,000
5,000,000
6,000,000
Qtr1 -2019
Qtr2 -2019
Qtr3 -2019
Qtr4 -2019
Qtr1 -2020
Qtr2 -2020
Qtr3 -2020
Qtr4 -2020
Sa
les T
ax C
olle
ctio
ns ($
)
Allen Parish Sales Tax Collections
-$500,000
$500,000
$1,500,000
$2,500,000
$3,500,000
$4,500,000
$5,500,000
Qtr1 - 2020 Qtr2 - 2020 Qtr3 - 2020 Qtr4 - 2020 Qtr1 - 2021
Allen Parish Tax Collections by Entity
Allen Parish School Board #1 and #2 Allen Parish School Board #3 Allen Parish Police Jury Town of Kinder
Town of Oberlin Town of Elizabeth City of Oakdale Town of Kinder Library/Sewerage
Allen Parish Occupancy Tax Allen Parish Tourist Commission Allen Parish Sheriff District Reeves
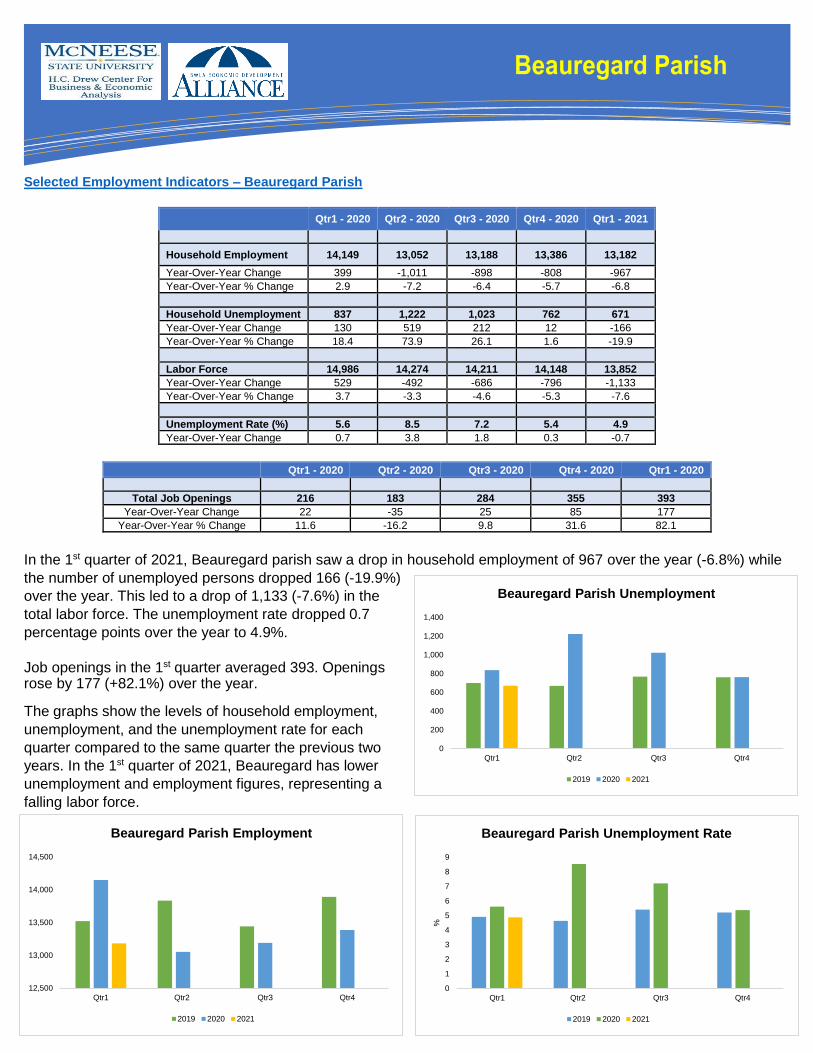
Selected Employment Indicators – Beauregard Parish
Qtr1 - 2020 Qtr2 - 2020 Qtr3 - 2020 Qtr4 - 2020 Qtr1 - 2021
Household Employment 14,149 13,052 13,188 13,386 13,182
Year-Over-Year Change 399 -1,011 -898 -808 -967
Year-Over-Year % Change 2.9 -7.2 -6.4 -5.7 -6.8
Household Unemployment 837 1,222 1,023 762 671
Year-Over-Year Change 130 519 212 12 -166
Year-Over-Year % Change 18.4 73.9 26.1 1.6 -19.9
Labor Force 14,986 14,274 14,211 14,148 13,852
Year-Over-Year Change 529 -492 -686 -796 -1,133
Year-Over-Year % Change 3.7 -3.3 -4.6 -5.3 -7.6
Unemployment Rate (%) 5.6 8.5 7.2 5.4 4.9
Year-Over-Year Change 0.7 3.8 1.8 0.3 -0.7
Qtr1 - 2020 Qtr2 - 2020 Qtr3 - 2020 Qtr4 - 2020 Qtr1 - 2020
Total Job Openings 216 183 284 355 393
Year-Over-Year Change 22 -35 25 85 177
Year-Over-Year % Change 11.6 -16.2 9.8 31.6 82.1
In the 1st quarter of 2021, Beauregard parish saw a drop in household employment of 967 over the year (-6.8%) while
the number of unemployed persons dropped 166 (-19.9%)
over the year. This led to a drop of 1,133 (-7.6%) in the
total labor force. The unemployment rate dropped 0.7
percentage points over the year to 4.9%.
Job openings in the 1st quarter averaged 393. Openings rose by 177 (+82.1%) over the year.
The graphs show the levels of household employment,
unemployment, and the unemployment rate for each
quarter compared to the same quarter the previous two
years. In the 1st quarter of 2021, Beauregard has lower
unemployment and employment figures, representing a
falling labor force.
12,500
13,000
13,500
14,000
14,500
Qtr1 Qtr2 Qtr3 Qtr4
Beauregard Parish Employment
2019 2020 2021
0
200
400
600
800
1,000
1,200
1,400
Qtr1 Qtr2 Qtr3 Qtr4
Beauregard Parish Unemployment
2019 2020 2021
0
1
2
3
4
5
6
7
8
9
Qtr1 Qtr2 Qtr3 Qtr4
%
Beauregard Parish Unemployment Rate
2019 2020 2021

New Business Filings
The graph shows the amount of new business
filings each quarter compared to the same
quarter in the previous two years.
The number of new business filings in
Beauregard parish was 102 in the 1st quarter of
2021 which was 43 more than the same quarter
the previous year and 27 more compared to the
same quarter 2 years ago. The YTD total for the
1st quarter of 2021 was 102. This was 43 more
businesses than the 1st quarter of 2020 YTD and
27 businesses higher than the 1st quarter of 2019
YTD.
Qtrly New Business Filings Qtr1 Qtr2 Qtr3 Qtr4
2019 75 55 58 52
2020 59 60 76 92
2021 102
SNAP Benefits
Beauregard parish has had a sharp increase in SNAP recipients, households and benefits over the year. The parish
had an average of 6,304 recipients of SNAP benefits in the 1st quarter of 2021. 1,511 more people received benefits
compared to the 1st quarter of 2020 for a 31.5% increase over this time. The total number of households receiving
SNAP averaged 2,810 which was 681 more than the same quarter in the previous year. This represented a 32%
increase. In terms of benefits, the parish received an
average of $1.2 million in total during the 1st quarter
of 2021, which was a $574.9 thousand increase
over-the-year. This was a 90.4 % rise in benefits in
the parish. Looking at the graph illustrates a
relatively flat trend in benefits before a sharp rise.
This trend is also shown in the number of
households and recipients receiving benefits. The
pandemic has led to more people receiving a
greater amount of benefits.
Qtrly New Business Filings YTD Qtr1 Qtr2 Qtr3 Qtr4
2019 75 130 188 240
2020 59 119 195 287
2021 102
Qtr1 - 2020 Qtr2 - 2020 Qtr3 - 2020 Qtr4 - 2020 Qtr1 - 2021 YoY Change YoY % Change
Recipients 4,793 5,492 5,905 6,309 6,304 1,511 31.5
Households 2,129 2,454 2,636 2,812 2,810 681 32.0
Benefits 636,193 898,771 934,335 1,058,026 1,211,119 574,927 90.4
0
200,000
400,000
600,000
800,000
1,000,000
1,200,000
1,400,000
0
1,000
2,000
3,000
4,000
5,000
6,000
7,000
Qtr1 -2019
Qtr2 -2019
Qtr3 -2019
Qtr4 -2019
Qtr1 -2020
Qtr2 -2020
Qtr3 -2020
Qtr4 -2020
Qtr1 -2021
Am
ou
nt
of
Be
ne
fits
($
)
# R
ecip
ien
ts / H
ou
se
ho
lds
Beauregard Parish SNAP Data
Recipients Households Benefits
0
20
40
60
80
100
120
Qtr1 Qtr2 Qtr3 Qtr4
Beauregard Parish New Domestic Business Filings
2019 2020 2021

Tax Collections
Beauregard parish has seen an increase in its sales tax
collections in the 1st quarter of 2021, compared to the
same quarter the previous year. Sales tax collections
rose by $1.2 million over the year for a 14% increase.
Part of this no doubt comes from increased purchases in
the parish after the storms. Looking at the entities that
receive sales tax distributions shows that DeRidder
collects the most revenue. These are sales conducted
within the city limits. This category saw a year-over-year
increase of $154.8 thousand (+7.5%) over the year. All
other entities all experienced increases in sales tax
collections.Police Jury collections grew the largest at
$355.5 thousand (+22.2%). School board revenues, All and NM, rose by $241.6 thousand (+13.9%) and $240.0
thousand (14%), resepctively. PJ Courthouse collections rose $59.6 thousand (+13.7%) and BPSO increased $119.2
thousand (+13.7%) over the year. Finally, Merryville collections rose $23.5 thousand (+26.3%).
Sales Tax Collections (thous $)
Qtr1 - 2020 Qtr2 - 2020 Qtr3 - 2020 Qtr4 - 2020 Qtr1 - 2021 YoY Change YoY % Change
DeRidder 2,067.4 2,350.9 1,955.1 2,075.1 2,222.1 154.8 7.5
Police Jury 1,600.3 1,413.2 1,630.0 1,673.5 1,955.9 355.5 22.2
PJ Courthouse 434.6 442.1 424.5 442.0 494.1 59.6 13.7
School All 1,740.8 1,773.0 1,702.9 1,781.4 1,982.4 241.6 13.9
School NM 1,709.5 1,738.7 1,667.3 1,734.5 1,949.6 240.0 14.0
Merryville 89.4 92.1 92.9 98.7 112.8 23.5 26.3
BPSO 869.2 884.8 851.7 884.9 988.3 119.2 13.7
Total 8,511.1 8,694.7 8,324.5 8,690.1 9,705.2 1,194.1 14.0
6,000
7,000
8,000
9,000
10,000
Qtr1 -2018
Qtr2 -2018
Qtr3 -2018
Qtr4 -2018
Qtr1 -2019
Qtr2 -2019
Qtr3 -2019
Qtr4 -2019
Qtr1 -2020
Qtr2 -2020
Qtr3 -2020
Qtr4 -2020
Qtr1 -2021
To
tal S
ale
s T
ax C
olle
ctio
ns (
tho
us $
)
Beauregard Parish Sales Tax Collections
0
2,000
4,000
6,000
8,000
10,000
12,000
Qtr1 - 2020 Qtr2 - 2020 Qtr3 - 2020 Qtr4 - 2020 Qtr1 - 2021
Sa
les T
ax C
olle
ctio
ns (
tho
us $
)
Beauregard Parish Sales Tax Collections by Entity
DeRidder Police Jury PJ Courthouse School All School NM Merryville BPSO

Selected Employment Indicators – Calcasieu Parish
Qtr1 - 2020 Qtr2 - 2020 Qtr3 - 2020 Qtr4 - 2020 Qtr1 - 2021
Household Employment 100,978 85,659 85,163 85,146 85,470
Year-Over-Year Change -2,065 -18,534 -17,694 -17,781 -15,508
Year-Over-Year % Change -2.0 -17.8 -17.2 -17.3 -15.4
Household Unemployment 4,810 12,101 9,967 8,617 6,958
Year-Over-Year Change 893 8,071 5,316 4,269 2,148
Year-Over-Year % Change 22.8 200.2 114.3 98.2 44.7
Labor Force 105,788 97,760 95,129 93,763 92,429
Year-Over-Year Change -1,172 -10,463 -12,377 -13,511 -13,360
Year-Over-Year % Change -1.1 -9.7 -11.5 -12.6 -12.6
Unemployment Rate (%) 4.6 12.3 10.5 9.2 7.5
Year-Over-Year Change 0.9 8.6 6.2 5.1 3.0
Qtr1 - 2020 Qtr2 - 2020 Qtr3 - 2020 Qtr4 - 2020 Qtr1 - 2021
Total Job Openings 4,875 3,772 4,824 4,578 5,358
Year-Over-Year Change -570 -1,654 -1,548 -800 484
Year-Over-Year % Change -10.5 -30.5 -24.3 -14.9 9.9
In the 1st quarter of 2021, Calcasieu parish saw a drop in
the labor force of 13,360 (-12.6%). This was due to a drop
in household employment of 15,508 over the year (-
15.4%) while the number of unemployed persons rose
2,148 (+44.7%). The unemployment rate rose 3.0
percentage points over the year to 7.5%.
Job openings in the 1st quarter averaged 5,358. Openings rose by 484 (+9.9%) over the year.
The graphs show the levels of household employment,
unemployment, and the unemployment rate for each
quarter compared to the same quarter the previous two
years. Calcasieu had lower employment levels through
2021 compared to the previous years. The unemployment measures have been higher than in 2020 though that may
not continue due to a falling labor force. Calcasieu employment figures have been hit the hard by the storms.
0
20,000
40,000
60,000
80,000
100,000
120,000
Qtr1 Qtr2 Qtr3 Qtr4
Calcasieu Parish Employment
2019 2020 2021
0
2
4
6
8
10
12
14
Qtr1 Qtr2 Qtr3 Qtr4
%
Calcaiseu Parish Unemployment Rate
2019 2020 2021
0
2,000
4,000
6,000
8,000
10,000
12,000
14,000
Qtr1 Qtr2 Qtr3 Qtr4
Calcaiseu Parish Unemployment
2019 2020 2021

Tax Collections
Calcasieu parish has recently seen large increases in taxable sales. Much of the increases come from building materials and motor vehicles as rebuilding and repairs commence after the storms. Other categories are still being
affected by the pandemic and recession. Sales tax collections, plus occupancy, have risen by $20.2 million over the year for a 23.5% increase. General sales taxes rose by $19.8 million (+23.5%) over the year. Occupancy taxes were higher. These taxes rose $0.4 million for a 25.4% increase. This occurred as total taxable sales in the parish rose $379.1 million (+25.9%) over the year. Almost all categories of sales generally increased. The most striking (in percentage terms) were Building Materials (+119.3%), Utility (+116.6%) and Motor Vehicles (+36.8%). Miscellaneous Services and General Merchandise sales in the parish also increased 23.4% and 21.8%, respectively. Large decreases were seen in Gaming (-22.5%) and Apparel (-12.3%). The results point to rebuilding from the hurricanes causing increases as well as increased activity coming out of the pandemic.
YTD figures show that total taxable sales have risen in the parish by $379.1 million compared to the 1st quarter of 2020 YTD figure for a 25.9% increase. This led to a $20.2 million increase in sales tax collections (+23.5%).
Collections (mil $) Qtr1 - 2020 Qtr2 - 2020 Qtr3 - 2020 Qtr4 - 2020 Qtr1 - 2021 YoY Change YoY % Change
Food 158.1 170.9 147.8 140.4 162.3 4.2 2.7
Apparel 38.9 17.0 31.7 20.2 34.1 -4.8 -12.3
Merchandise 271.9 276.0 255.1 286.8 331.2 59.3 21.8
Automotive & Gas 63.0 66.5 79.2 82.2 74.9 11.9 18.8
Furniture 74.4 59.6 62.8 62.6 89.1 14.7 19.8
Bldg Mat. 140.3 151.5 148.2 348.5 307.7 167.4 119.3
Misc. Services 126.9 100.2 97.9 180.9 156.6 29.7 23.4
Manufacturing 262.5 277.6 222.1 247.0 285.9 23.4 8.9
Utility 39.1 42.3 34.0 57.3 84.7 45.6 116.6
Misc. 32.8 23.6 29.8 26.7 27.8 -5.0 -15.2
M.V. 133.2 111.8 137.4 176.0 182.2 49.0 36.8
Gaming 30.9 19.2 30.0 29.8 23.9 -7.0 -22.5
Restaurants 94.2 81.5 81.5 62.4 85.0 -9.2 -9.8
Total 1466.2 1397.7 1357.6 1721.0 1845.3 379.1 25.9
Collections (mil $) Qtr1 - 2020 Qtr2 - 2020 Qtr3 - 2020 Qtr4 - 2020 Qtr1 - 2021 YoY Change YoY % Change
General Sales Tax Collections 84.3 80.5 77.5 90.9 104.1 19.8 23.5
Occupancy Taxes 1.5 1.1 1.5 2.5 1.9 0.4 25.4
Sales Tax Collections 85.8 81.6 79.0 93.4 106.1 20.2 23.5
Taxable Sales YTD (mil $) Qtr 1 Qtr 2 Qtr 3 Qtr 4
2019 1,764.7 3,596.1 5,210.1 6,685.0
2020 1,466.2 2,863.9 4,221.5 5,942.4
2021 1,845.3
Sales Tax YTD (mil $) Qtr 1 Qtr 2 Qtr 3 Qtr 4
2019 102.4 207.5 304.9 392.8
2020 85.8 167.4 246.4 339.8
2021 106.1
0
20
40
60
80
100
120
0
200
400
600
800
1,000
1,200
1,400
1,600
1,800
2,000
Qtr1 -2019
Qtr2 -2019
Qtr3 -2019
Qtr4 -2019
Qtr1 -2020
Qtr2 -2020
Qtr3 -2020
Qtr4 -2020
Qtr1 -2021
Sa
les T
ax C
olle
ctio
ns (
millio
ns $
)
Ta
xa
ble
Sa
les (
millio
ns $
)
Calcasieu Parish Taxable Sales and Sales Tax Collections
Taxable Sales Sales Tax Collections (plus Occupancy)
0
50
100
150
200
250
300
350
400
450
Ta
xa
ble
Sa
les (
mil $
)
Calcasieu Parish Taxable Sales - Qtr 1 YTD
Qtr1 - 2019 Qtr1 - 2020 Qtr1 - 2021

New Business Filings
The graph shows the amount of new business
filings each quarter compared to the same
quarter in the previous two years.
The number of new business filings in Calcasieu
parish was 787 in the 1st quarter of 2021 which
was 348 more than the same quarter the
previous year and 327 more compared to the
same quarter 2 years ago. The YTD total for the
1st quarter of 2021 was 787. This was 348 more
businesses than the 1st quarter of 2020 YTD and
327 businesses higher than the same quarter of
2019 YTD.
SNAP Benefits
Calcasieu parish has had an increase in SNAP
recipients, households and benefits over the year.
The parish had an average of 36,259 recipients of
SNAP benefits in the 1st quarter of 2021. This was
7,345 more people receiving benefits compared to
the 1st quarter of 2020 for an 25.4% increase over
this time. The total number of households receiving
SNAP averaged 16,810 which was 3,932 more than
the same quarter in the previous year. This
represented a 30.5% increase. In terms of benefits,
the parish received an average of $7.5 million in
total during the 1st quarter of 2021, which was a $3.6
million increase over-the-year. This was a 93.3%
increase in benefits in the parish. Looking at the
graph illustrates an overall flat trend in benefits in 2019 before spiking in the 2nd quarter of 2020 and continuing. This
trend is also shown in the number of households and recipients receiving benefits as the coronavirus pandemic and
hurricanes have affected the local economy.
Qtrly New Business Filings Qtr1 Qtr2 Qtr3 Qtr4
2019 460 490 425 344
2020 439 537 767 746
2021 787
Qtrly New Business Filings YTD Qtr1 Qtr2 Qtr3 Qtr4
2019 460 950 1375 1719
2020 439 976 1743 2489
2021 787
Qtr1 - 2020 Qtr2 - 2020 Qtr3 - 2020 Qtr4 - 2020 Qtr1 - 2021 YoY Change YoY % Change
Recipients 28,914 32,455 34,636 37,172 36,259 7,345 25.4
Households 12,877 14,726 15,863 17,179 16,810 3,932 30.5
Benefits 3,872,104 5,544,380 5,888,494 6,675,059 7,486,287 3,614,183 93.3
0
1,000,000
2,000,000
3,000,000
4,000,000
5,000,000
6,000,000
7,000,000
8,000,000
0
5,000
10,000
15,000
20,000
25,000
30,000
35,000
40,000
Qtr1 -2019
Qtr2 -2019
Qtr3 -2019
Qtr4 -2019
Qtr1 -2020
Qtr2 -2020
Qtr3 -2020
Qtr4 -2020
Qtr1 -2021
Am
ou
nt
of
Be
ne
fits
($
)
# R
ecip
ien
ts / H
ou
se
ho
lds
Calcasieu Parish SNAP Data
Recipients Households Benefits
0
100
200
300
400
500
600
700
800
900
Qtr1 Qtr2 Qtr3 Qtr4
Calcasieu Parish New Domestic Business Filings
2019 2020 2021

Selected Employment Indicators – Cameron Parish
Qtr1 - 2020 Qtr2 - 2020 Qtr3 - 2020 Qtr4 - 2020 Qtr1 - 2021
Household Employment 3,755 3,184 3,165 3,167 3,179
Year-Over-Year Change -78 -688 -662 -658 -576
Year-Over-Year % Change -2.0 -17.8 -17.3 -17.2 -15.3
Household Unemployment 162 260 209 176 145
Year-Over-Year Change 27 121 57 30 -17
Year-Over-Year % Change 20.2 86.8 37.7 20.3 -10.5
Labor Force 3,917 3,444 3,375 3,343 3,325
Year-Over-Year Change -50 -568 -604 -628 -593
Year-Over-Year % Change -1.3 -14.2 -15.2 -15.8 -15.1
Unemployment Rate (%) 4.1 7.5 6.2 5.2 4.4
Year-Over-Year Change 0.7 4.0 2.4 1.6 0.2
In the 1st quarter of 2021, Cameron parish had a drop in
household employment of 576 over the year (-15.3%) while
the number of unemployed persons dropped by 17 (-
10.5%). This meant a decrease of 593 (-15.1%) in the total
labor force. The unemployment rate increased 0.2
percentage points over the year to 4.4%.
Job openings in the 1st quarter of 2021 averaged 137. Openings fell by 14 (-9.3%) over the year.
Cameron Parish had a lower employment level in 2021
compared to the same quarter the previous year while the
unemployment measure was also slightly lower. As
Cameron has been hit by hard by two hurricanes and this
has resulted in falling labor force.
Qtr1 - 2020 Qtr2 - 2020 Qtr3 - 2020 Qtr4 - 2020 Qtr1 - 2021
Total Job Openings 151 103 130 145 137
Year-Over-Year Change 9 -40 -127 -76 -14
Year-Over-Year % Change 6.3 -28.1 -49.5 -34.2 -9.3
0
500
1,000
1,500
2,000
2,500
3,000
3,500
4,000
4,500
Qtr1 Qtr2 Qtr3 Qtr4
Cameron Parish Employment
2019 2020 2021
0
1
2
3
4
5
6
7
8
Qtr1 Qtr2 Qtr3 Qtr4
%
Cameron Parish Unemployment Rate
2019 2020 2021
0
50
100
150
200
250
300
Qtr1 Qtr2 Qtr3 Qtr4
Cameron Parish Unemployment
2019 2020 2021

Tax Collections
Cameron parish collects no local sales tax, so it is not possible to show the monthly or quarterly trends in those
particular tax collections in the parish. However, Cameron is the parish in SWLA that is generally responsible for the
highest amount of state severance tax collections. In order to give some view into the severance tax collections in the
parish, below are figures and data relating to the recent severance tax collections by category for Cameron.
The graph on the above left shows the total severance tax collections from each source with the line representing total
collections. The graph on the upper right shows the latest first quarter YTD figures for each severance tax type (as
well as total) over the past three years.
Severance Tax Collections Qtr1 - 2020 Qtr2 - 2020 Qtr3 - 2020 Qtr4 - 2020 Qtr1 - 2021 YoY Change YoY % Change
Oil Tax 2,758,732 1,513,188 881,297 589,588 1,286,389 -1,472,344 -53.4
Gas Tax 476,917 409,637 323,106 147,297 218,223 -258,694 -54.2
Tax Collected on all Timber Products 0 0 0 0 0 0 NA
Total Tax Collected 3,235,649 1,922,825 1,204,403 736,885 1,504,611 -1,731,038 -53.5
The largest amount of severance tax collections from Cameron are taxes on oil. Oil tax collections in the 1st quarter of
2021 fell by $1.4 million compared to the same quarter the previous year. This represented an 53.4% drop as oil
prices fell due to the pandemic and the hurricane disrupted production. In terms of gas collections, those fell $258.7
thousand over that period for a 54.2% decrease. Timber product collections have been zero. Total severance taxes
collected from the parish have fallen $1.7 million over the year in the 1st quarter of 2021 for an 53.5% decrease.
However, the 1st quarter collections did represent an improvement from the 4th quarter of 2020.
The YTD figures show in 2020 there was a substantial drop in total severance taxes collected compared to the
previous year. In the 1st quarter 2020 YTD, severance taxes fell $1.7 million for a fall of -53.5%. As mentioned
previously, much of this can be traced to the drop in oil prices and production activity throughout the state and nation
due to the pandemic and Hurricane Laura.
Total Severance Tax Collections (YTD) Qtr1 Qtr2 Qtr3 Qtr4
2019 4,276,091 8,368,328 11,341,916 14,881,376
2020 3,235,649 5,158,474 6,362,877 7,099,761
2021 1,504,611
0
2,000,000
4,000,000
6,000,000
Qtr1 -2019
Qtr2 -2019
Qtr3 -2019
Qtr4 -2019
Qtr1 -2020
Qtr2 -2020
Qtr3 -2020
Qtr4 -2020
Qtr1 -2021
Cameron Parish Severance Tax Collections
Oil Tax Gas Tax
Tax Collected on all Timber Products Total Tax Collected
0
3,000,000
6,000,000
Oil Tax Gas Tax Total Tax
Cameron Parish Severance Tax Collecitons -Qtr 1 YTD
2019 2020 2021

New Business Filings
The graph shows the amount of new business
filings each quarter compared to the same
quarter in the previous two years.
The number of new business filings in Cameron
parish was 10 in the 1st quarter of 2021 which
was 8 more than the same quarter the previous
year and 4 more compared to the same quarter 2
years ago. The YTD total for the 1st quarter of
2021 was 10. This was 8 more business than the
1st quarter of 2020 YTD and 4 businesses higher
than the 1st quarter of 2019 YTD.
SNAP Benefits
Cameron parish has had drops in SNAP recipients
and households while experiencing a sharp rise in
benefits over the year. The parish had an average of
576 recipients of SNAP benefits in the 1st quarter of
2020. This was 120 fewer people receiving benefits
compared to the 1st quarter of 2020 for a 17.2%
decrease over this time. The total number of
households receiving SNAP averaged 252 which
was 41 less than the same quarter in the previous
year. This represented a 14% decrease. While the
number of recipients and households decreased,
benefits rose substantially. The parish received an
average of $166.7 thousand in total during the 1st
quarter of 2020, which was an $78 thousand
increase over-the-year. This was an 87.8% increase in benefits in the parish. Looking at the graph illustrates recipients
and households falling throughout the year while benefits have sharply increased in the last quarter due to the
pandemic and storms. Part of this falling participation is most likely due to population loss from the storms.
Qtrly New Business Filings Qtr1 Qtr2 Qtr3 Qtr4
2019 6 7 8 5
2020 2 10 12 6
2021 10
Qtrly New Business Filings YTD Qtr1 Qtr2 Qtr3 Qtr4
2019 6 13 21 26
2020 2 12 24 30
2021 10
Qtr1 - 2020 Qtr2 - 2020 Qtr3 - 2020 Qtr4 - 2020 Qtr1 - 2021 YoY Change YoY % Change
Recipients 696 631 579 605 576 -120 -17.2
Households 293 268 250 262 252 -41 -14.0
Benefits 88,766 128,470 136,963 150,788 166,746 77,979 87.8
0
20,000
40,000
60,000
80,000
100,000
120,000
140,000
160,000
180,000
0
100
200
300
400
500
600
700
800
900
Qtr1 -2019
Qtr2 -2019
Qtr3 -2019
Qtr4 -2019
Qtr1 -2020
Qtr2 -2020
Qtr3 -2020
Qtr4 -2020
Qtr1 -2021
Am
ou
nt
of
Be
ne
fits
($
)
# R
ecip
ien
ts / H
ou
se
ho
lds
Cameron Parish SNAP Data
Recipients Households Benefits
0
2
4
6
8
10
12
14
Qtr1 Qtr2 Qtr3 Qtr4
Cameron Parish New Domestic Business Filings
2019 2020 2021

Selected Employment Indicators – Jefferson Davis Parish
Qtr1 - 2020 Qtr2 - 2020 Qtr3 - 2020 Qtr4 - 2020 Qtr1 - 2021
Household Employment 12,676 11,301 11,669 11,806 11,660
Year-Over-Year Change 123 -1,555 -1,316 -1,031 -1,015
Year-Over-Year % Change 1.0 -12.1 -10.1 -8.0 -8.0
Household Unemployment 648 1,340 1,036 833 733
Year-Over-Year Change 72 766 364 227 85
Year-Over-Year % Change 12.4 133.3 54.1 37.4 13.1
Labor Force 13,324 12,641 12,705 12,639 12,393
Year-Over-Year Change 194 -789 -952 -804 -931
Year-Over-Year % Change 1.5 -5.9 -7.0 -6.0 -7.0
Unemployment Rate (%) 4.9 10.6 8.2 6.6 5.9
Year-Over-Year Change 0.5 6.3 3.3 2.1 1.0
In the 1st quarter of 2021, Jefferson Davis parish saw a
decrease of 931 (-7.0%) in the total labor force. This was
broken down by a drop in household employment of 1,015
over the year (-8.0%) while the number of unemployed
persons rose 85 (+13.1%). The unemployment rate
increased 1.0 percentage points over the year to 5.9%.
Job openings in the 1st quarter of 2021 averaged 364. Openings rose by 52 (+16.5%) over the year.
The graphs show the levels of household employment,
unemployment, and the unemployment rate for each
quarter compared to the same quarter the previous two
years. Jeff Davis parish had lower figures for employment in 2021 compared to the previous year, with higher
unemployment figures.
Qtr1 - 2020 Qtr2 - 2020 Qtr3 - 2020 Qtr4 - 2020 Qtr1 - 2020
Total Job Openings 312 235 220 293 364
Year-Over-Year Change 35 -11 -17 -5 52
Year-Over-Year % Change 12.5 -4.6 -7.2 -1.7 16.5
10,500
11,000
11,500
12,000
12,500
13,000
Qtr1 Qtr2 Qtr3 Qtr4
Jeff Davis Parish Employment
2019 2020 2021
0
200
400
600
800
1,000
1,200
1,400
1,600
Qtr1 Qtr2 Qtr3 Qtr4
Jeff Davis Parish Unemployment
2019 2020 2021
0
2
4
6
8
10
12
Qtr1 Qtr2 Qtr3 Qtr4
%
Jeff Davis Parish Unemployment Rate
2019 2020 2021

New Business Filings
The graph shows the amount of new business filings each quarter compared to the same quarter in the previous two years. The number of new business filings in Jefferson
Davis parish was 93 in the 1st quarter of 2021 which
was 44 more than the same quarter the previous
year and 28 more compared to the same quarter 2
years ago. The YTD total for the 1st quarter of 2021
was 93. This was 44 more businesses than the 1st
quarter of 2020 YTD and 28 businesses higher than
the 1st quarter of 2019 YTD.
SNAP Benefits
Jefferson Davis parish has had increase in SNAP
recipients, households and benefits over the year.
The parish had an average of 6,295 recipients of
SNAP benefits in the 1st quarter of 2021. This was
1,178 more people receiving benefits compared to
the 1st quarter of 2020 for a 23% increase over this
time. The total number of households receiving
SNAP averaged 2,863 which was 622 more than the
same quarter in the previous year. This represented
a 27.7% increase. In terms of benefits, the parish
received an average of $1.3 million in total during
the 1st quarter of 2021, which was a $660 thousand
rise over-the-year. This was a 99.1% increase in
benefits in the parish. Looking at the graph
illustrates an overall decreasing trend in benefits beginning in 2019 before spiking in the second quarter of 2020. This
has been followed by continued growth. This trend is also shown in the number of households and recipients receiving
benefits. This is no doubt due to the pandemic.
Qtrly New Business Filings Qtr1 Qtr2 Qtr3 Qtr4
2019 65 65 44 41
2020 49 51 80 65
2021 93
Qtrly New Business Filings YTD Qtr1 Qtr2 Qtr3 Qtr4
2019 65 130 174 215
2020 49 100 180 245
2021 93
Qtr1 - 2020 Qtr2 - 2020 Qtr3 - 2020 Qtr4 - 2020 Qtr1 - 2021 YoY Change YoY % Change
Recipients 5,117 5,484 5,782 6,219 6,295 1,178 23.0
Households 2,241 2,440 2,595 2,821 2,863 622 27.7
Benefits 665,681 966,671 1,024,278 1,151,357 1,325,623 659,942 99.1
0
200,000
400,000
600,000
800,000
1,000,000
1,200,000
1,400,000
0
1,000
2,000
3,000
4,000
5,000
6,000
7,000
Qtr1 -2019
Qtr2 -2019
Qtr3 -2019
Qtr4 -2019
Qtr1 -2020
Qtr2 -2020
Qtr3 -2020
Qtr4 -2020
Qtr1 -2021
Am
ou
nt
of
Be
ne
fits
($
)
# R
ecip
ien
ts / H
ou
se
ho
lds
Jefferson Davis Parish SNAP Data
Recipients Households Benefits
0
10
20
30
40
50
60
70
80
90
100
Qtr1 Qtr2 Qtr3 Qtr4
Jeff Davis Parish New Domestic Business Filings
2019 2020 2021

Tax Collections
Tax Collections (mil $) Qtr1 - 2020 Qtr2 - 2020 Qtr3 - 2020 Qtr4 - 2020 Qtr1 - 2021 YoY Change YoY % Change
Total Sales Tax Collections 6.7 7.0 7.3 8.7 8.3 1.6 24.4
Jefferson Davis Parish saw an increase in its sales tax collections in the 1st quarter of 2021, compared to the same quarter the previous year. Sales tax collections have increased by approximately $1.6 million over the year for a 24.4% increase. This occurred as taxable sales in the parish rose by $25.6 million (+22.6%) over the year. The largest absolute increase occurred in General Merchandise (+$7.7 million, +19.0%). Food also experienced a large increase (+$5.0 million, +21.4%) as did Auto (+$3.7 million, +18.5%). Manufacturing experienced a large percentage increase of 129.2% but only represented a $1 million increase. The most striking increase occurred in Transportation. This mostly likely occurred due to railard operations, increased deliveries due to the influx of contractors and repair work, and the addition of logistics companies to the transportation group. The 1st quarter of 2021 YTD figures show that total taxable sales have increased in the parish by $25.6 million compared to the same quarter in 2020 for an 22.6% increase. This led to a $1.6 million increase in 2021 YTD sales tax collections (+24.4%).
Taxable Sales (mil $) Qtr1 - 2020 Qtr2 - 2020 Qtr3 - 2020 Qtr4 - 2020 Qtr1 - 2021 YoY Change YoY % Change
Food 23.3 26.2 25.6 31.0 28.3 5.0 21.4
Apparel 1.5 0.9 1.2 1.4 2.1 0.7 45.1
Gen'l Merch 40.6 49.6 35.7 45.8 48.3 7.7 19.0
Auto 19.8 23.1 32.1 30.9 23.5 3.7 18.5
Furniture 2.0 1.8 2.0 2.1 2.5 0.5 23.0
Lumber, Bldg, Contractors 7.5 9.2 10.7 11.8 8.0 0.5 6.2
Misc. Serv. 8.7 6.6 6.9 8.1 10.1 1.4 15.6
Manufacturing 0.8 0.5 0.2 0.5 1.7 1.0 129.2
Utilities 2.9 2.9 3.3 4.4 4.0 1.2 41.2
Oil & Gas 3.5 3.7 1.7 5.5 3.1 -0.4 -11.3
Lease/Rental 1.6 1.1 1.3 5.1 3.0 1.4 90.7
Occupancy 0.7 1.1 0.8 3.1 1.3 0.6 82.4
Transportation 0.0 0.0 0.0 0.9 2.3 2.3 13,874.9
Entertainment 0.1 0.1 0.1 0.3 0.3 0.2 163.8
Total 113.0 127.0 121.7 150.9 138.6 25.6 22.6
Taxable Sales YTD (mil $) Qtr 1 Qtr 2 Qtr 3 Qtr 4
2019 113.6 236.0 359.1 473.2
2020 113.0 240.0 361.7 512.6
2021 138.6
Sales Tax YTD (mil $) Qtr 1 Qtr 2 Qtr 3 Qtr 4
2019 6.7 13.5 20.4 27.0
2020 6.7 13.7 21.0 29.7
2021 8.3
0.0
1.0
2.0
3.0
4.0
5.0
6.0
7.0
8.0
9.0
10.0
0
20
40
60
80
100
120
140
160
Qtr1 -2018
Qtr2 -2018
Qtr3 -2018
Qtr4 -2018
Qtr1 -2019
Qtr2 -2019
Qtr3 -2019
Qtr4 -2019
Qtr1 -2020
Sa
les T
ax C
olle
ctio
ns (
mil $
)
Ta
xa
ble
Sa
les m
il $
)
Jefferson Davis Parish Taxable Sales and Sales Tax Collections
Total Taxable Sales Total Sales Tax Collections
0
10
20
30
40
50
60
Ta
xa
ble
Sa
les (
mil $
)
Jeff Davis Parish Taxable Sales - 1st Quarter YTD
Qtr1 - 2020 Qtr1 - 2021

On May 4, 2021, the US Census released the latest 2020 Vintage Population Estimates for the nation, states,
counties, metropolitan statistical areas, and other geographies. Vintage estimates are released each year and the
release of the 2020 estimates allow for an opportunity to compare estimates to the 2020 Decennial Census to
evaluate accuracy. Vintage 2020 estimates are based on the 2010 Decennial Census and do not incorporate any
results from the 2020 Decennial Census. While the 2020 Decennial Census has been receiving most of the attention
due to the consequences regarding the apportionment of Representatives, the Vintage estimates provide great insight
into the population dynamics of many different areas.
These Vintage estimates show the amount of population for each area as of July 1st of each year (which is why they
are often called “midyear” estimates). Therefore, any results will not show the effects of Hurricane Laura or Hurricane
Delta on the population of affected parishes and only some slight effects of the COVID-19 pandemic. However, we
can see how the population is estimated to have changed over the past ten years. Comparing the national and state
estimates shows the state and local areas have lagged the nation in percentage terms. While the nation has grown
6.5% from 2010 – 2020, the state has only grown by 2.2%. Lake Charles MSA growth has more than doubled the
state at 5.2% over that same time frame. Lake Charles has been the third fastest growing MSA in terms of population
behind Hammond (12.6%) and New Orleans (6.4%).
When looking at the parishes individually, Beauregard, Calcasieu, and Cameron, have all experienced increases while Allen and Jefferson Davis Parishes have had population declines from 2010 – 2020. While Beauregard had the fastest percentage growth of 5.7%, this represented a 2,049 increase in the population. Calcasieu had the second largest increase at 5.3% representing a 10,287 increase. The largest drop occurred in Jefferson Davis Parish which lost 421 residents for 1.3% drop.
-1.0%
5.7%5.3%
1.3%
-1.3%
5.2%
2.2%
6.5%
-2%
0%
2%
4%
6%
8%
AllenParish
BeauregardParish
CalcasieuParish
CameronParish
JeffersonDavisParish
LakeCharles
MSA
Louisiana UnitedStates
Population % Change: 2010 - 2020
-2.1%
3.7%
12.6%
-0.4%
4.7% 5.2%
-2.9%
6.4%
-1.9%-4%
0%
4%
8%
12%
16%
MSA Population % Change: 2010 - 2020
-20,000
-10,000
0
10,000
20,000
30,000
40,000
4,500,000
4,550,000
4,600,000
4,650,000
4,700,000
2010 2011 2012 2013 2014 2015 2016 2017 2018 2019 2020
Cha
ng
e in
Po
pu
latio
n
To
tal P
op
ula
tio
n
Louisiana Popuplation and Change
Change Total
-40,000
-30,000
-20,000
-10,000
0
10,000
20,000
2011 2012 2013 2014 2015 2016 2017 2018 2019 2020
Dom
estic,
Inte
rna
tio
na
l, a
nd
Net
Louisiana Migration
Domestic International Net Migration

In terms of changes year to year, the state has seen continuous drops in population. Since 2017, the Louisiana has
averaged an annual population growth rate of -0.2%. Even before this time the graph to the left on the previous page
shows that the increases in population were experiencing a downward trend prior to entering negative territory in
2017. The graph on the previous page to the right shows the state has been experienced negative net migration each
year since 2016.
The Lake Charles MSA experienced a different pattern
before 2020 led to the first annual drop in population
from 2010 – 2020. The graph of Lake Charles MSA
shows a steadily increasing population from 2012
before hitting a peak increase in 2016. From 2015 to
2016, the MSA experienced a 1.1% increase in
population as the area gained over 2,300 residents.
After that time, the population continued to increase, but
at a slower pace. The last year of 2020 shows that the
MSA had a 0.3% drop in population as Lake Charles
lost over 700 residents.
The figures show that while there was a very slight drop in births and a slight increase in deaths from 2019, leading to
a smaller natural increase, the drop in population was due to a fall in migration. While international migration has been
positive every year throughout the decade, the drops in domestic migration have grown larger since 2018.
-1,000
-500
0
500
1,000
1,500
2,000
2,500
190,000
195,000
200,000
205,000
210,000
215,000
2010 2011 2012 2013 2014 2015 2016 2017 2018 2019 2020
Ch
an
ge
in
Po
pu
latio
n
To
tal P
op
ula
tio
n
Lake Charles MSA Population and Change
Change Total
0
200
400
600
800
1000
1200
-3000
-2000
-1000
0
1000
2000
3000
4000
2011 2012 2013 2014 2015 2016 2017 2018 2019 2020
bir
thd
a a
nd
Dea
ths
Natu
ral In
cre
ase
Lake Charles MSA Births, Deaths, and Natural Increase
Births Deaths Natural Increase
-200
-150
-100
-50
0
50
100
25,400
25,500
25,600
25,700
25,800
2010 2011 2012 2013 2014 2015 2016 2017 2018 2019 2020
Cha
ng
e in
Po
pu
latio
n
To
tal P
op
ula
tio
n
Allen Parish Popuplation and Change
Change Total
-250
-200
-150
-100
-50
0
50
2011 2012 2013 2014 2015 2016 2017 2018 2019 2020
Dom
estic,
Inte
rna
tio
na
l, a
nd
Net
Allen Parish Migration
Domestic International Net Migration
-2,000
-1,500
-1,000
-500
0
500
1,000
1,500
2011 2012 2013 2014 2015 2016 2017 2018 2019 2020
Dom
estic,
Inte
rna
tio
na
l, a
nd
Net
Lake Charles MSA Migration
Domestic International Net Migration

Graphs for each parish in Southwest Louisiana show that some parishes have been experiencing overall growth while others have remined steady or experienced slight drops. The changes in Allen have been the volatile of all the parishes. Many of these changes can be attributed to migration patterns. Allen Parish has seen a declining population and domestic net migration in the parish has been negative each year except 2014.
Beauregard parish is one of the most interesting parishes to investigate as the overall trend in population has generally been upward sloping. However, there are three years during this decade in which the population slightly fell. While each year there was a natural increase (more births than deaths), the domestic out-migration in 2013, 2014, and 2018 led to drops in population each of those years.
Calcasieu Parish has a similar population trend compared to the state. However, that trend lags as the parish was still seeing increases in population and migration while the state started to see decreases. However, the parish only saw declining population in 2020 with growth in the rest of the years. This drop in 2020 was due to net migration falling to greater levels since 2016. By 2017, net migration became negative, indicating that more people left the parish than moved in. Note, this data does not include the effects of Laura and Delta, so these effects may be similar for data ending in July 2021 when it is released next year
-200
0
200
400
600
800
34,000
35,000
36,000
37,000
38,000
39,000
2010 2011 2012 2013 2014 2015 2016 2017 2018 2019 2020
Cha
ng
e in
Po
pu
latio
n
To
tal P
op
ula
tio
n
Beauregard Parish Popuplation and Change
Change Total
-1,000
-500
0
500
1,000
1,500
2,000
2,500
185,000
190,000
195,000
200,000
205,000
2010 2011 2012 2013 2014 2015 2016 2017 2018 2019 2020
Cha
ng
e in
Po
pu
latio
n
To
tal P
op
ula
tio
n
Calcasieu Parish Popuplation and Change
Change Total
-400
-200
0
200
400
600
2011 2012 2013 2014 2015 2016 2017 2018 2019 2020
Dom
estic,
Inte
rna
tio
na
l, a
nd
Net
Beauregard Parish Migration
Domestic International Net Migration
-2000
-1500
-1000
-500
0
500
1000
1500
2011 2012 2013 2014 2015 2016 2017 2018 2019 2020
Dom
estic,
Inte
rna
tio
na
l, a
nd
Net
Calcasieu Parish Migration
Domestic International Net Migration

While Cameron Parish has traditionally had very low international migration, the area had started to see significant in-migration and population gains after 2012. As the large economic development projects began construction, more people moved into the area. After losing residents in 2011 and 2012, the parish gained population every year until 2019. The last few years have shown relatively steady levels of total population. The effects of the recent storms will show up in future releases and will probably exhibit population declines.
Jefferson Davis Parish has also experienced volatile year to year growth. Growth has only been positive for three years since 2010. The parish was the only one to have a natural decrease (more deaths than births) since 2011 as 2018 and 2020 both had natural decreases. In terms of net migration, the figures show the parish had an annual average loss of 84 citizens since 2011. As the Decennial Census release resulted in Louisiana keeping the number of seats in the House of Representatives, these Vintage 2020 estimates shed further light on estimates of the population change. The state has had falling population since 2017 driven in large part to out migration. Our region, driven mainly by Calcasieu, had been experiencing overall growth until the recent drop in 2020. This drop will most likely continue in the next release due to the storms. The population will need to grow to continue the economic recovery and provide the much needed labor for economic growth. Recent trends in population will have to reverse in order for SWLA to attain a full robust recovery.
-300
-200
-100
0
100
200
6,250
6,500
6,750
7,000
7,250
2010 2011 2012 2013 2014 2015 2016 2017 2018 2019 2020
Cha
ng
e in
Po
pu
latio
n
To
tal P
op
ula
tio
n
Cameron Parish Popuplation
Change Total
-300
-200
-100
0
100
200
30,750
31,000
31,250
31,500
31,750
2010 2011 2012 2013 2014 2015 2016 2017 2018 2019 2020
Cha
ng
e in
Po
pu
latio
n
To
tal P
op
ula
tio
n
Jefferson Davis Parish Popuplation and Change
Change Total
-300
-250
-200
-150
-100
-50
0
50
100
2011 2012 2013 2014 2015 2016 2017 2018 2019 2020
Dom
estic,
Inte
rna
tio
na
l, a
nd
Net
Cameron Parish Migration
Domestic International Net Migration
-300
-250
-200
-150
-100
-50
0
50
100
150
2011 2012 2013 2014 2015 2016 2017 2018 2019 2020
Dom
estic,
Inte
rna
tio
na
l, a
nd
Net
Jefferson Davis Parish Migration
Domestic International Net Migration

The following sources were utilized for each of the graphs and tables shown in the report. Data transformations are
described in the footnotes and it should be noted some of the totals in the report may be off due to rounding. The
monthly data used for the report, and more not shown, is available at our website, mcneesedrewecon.org/.
1. Lake Charles MSA Employment Indicators – BLS CES/SAE and LAUSa
Total nonfarm employment, average weekly hours, and average weekly earnings statistics for the area come
from the BLS State and Metro Area Employment, Hours, & Earnings (SAE) measures which are derived from
the Current Employment Statistics (CES). The household employment measures for the MSA (and parishes)
come from the BLS Local Area Employment Statistics (LAUS). The CES/SAE measures are derived from a
survey of businesses while LAUS figures come from a survey of households that become part of a BLS
formula/model to derive the household employment statistics. For more information, please contact the Drew
CBEA.
2. Quarterly Housing Price Indexes - Federal Housing Finance Agency (rebased to have the first quarter of 2011
equal 100)
3. Lake Charles MSA Building Permits – Census Building Permits Survey (BPS)b
Note: While the building permit YTD figures in this report are calculated by summing up the monthly values,
they may not match the YTD values given from pulling data directly from the Census BPS. The YTD monthly
values at the BPS are changed due to late and missed filings. However, the monthly values of permits and
valuations, which this report uses, are not changed at the Census BPS. These differences appear to be fairly
minor, however. For more information, please contact the Drew CBEA.
4. Lake Charles Regional Airport Statistics – Bureau of Transportation Statistics, TranStats b
5. Lake Charles Port Statistics – Census USA Trade Online b
6. Lake Charles Gaming Statistics – Louisiana Department of Public Safety & Corrections, Louisiana Gaming
Control Board b
7. Parish Employment Indicators – BLS LAUSa
The labor force is the sum of household employment and household unemployment.
8. Parish Job Openings – Louisiana Workforce Commissiona
9. New Business Filings – Louisiana Secretary of State b
10. Parish SNAP Benefits – Louisiana Department of Children & Family Servicesa
11. Allen Parish Tax Collections – Allen Parish School Board b
12. Beauregard Parish Tax Collections – Beauregard Parish Sheriff’s Office b
13. Calcasieu Parish Tax Collections – Calcasieu Parish School Board b
14. Cameron Parish Severance Tax Collections – Louisiana Department of Revenue b
15. Jefferson Davis Parish Tax Collections – Jefferson Davis Parish School Board b
16. Unemployment Insurance Claims – Louisiana Workforce Commission
a. Quarterly values are obtained from averaging the monthly values
b. Quarterly values are obtained from summing the monthly values