drinking water infrastructure needs survey and assessment · 2007 drinking water infrastructure...
TRANSCRIPT

Drinking Water Infrastructure Needs Survey and Assessment
Fourth Report to Congress

Cover photos (clockwise from top right): Girl in pool, www.iStockphoto.com; Water tower, www.iStockphoto.com; Desolation Wilderness, California, Amy Draut; Flocculators in a Butte, Montana treatment facility, Montana Department of Environmental Quality; Upper Rogue River, Oregon, Amy Draut; Man with daughter at drinking fountain, www.iStockphoto.com; Inside the new pipe gallery at the Neuse Regional Water and Sewer Authority in North Carolina, Jim McRight, North Carolina Department of Environment and Natural Resources; Water utility worker, www. iStockphoto.com; Distribution main at the construction site of a new treatment plant in Helena, Montana, City of Helena; Girl drinking water, Sandie Koenig; Construction at a water treatment facility in Corsicana, Texas, Texas Water Development Board; Quabbin Reservoir, Massachusetts, Charles Hernick
Office of Water (4606M) EPA 816-R-09-001 February 2009 www.epa.gov/safewater

Drinking Water Infrastructure Needs Survey and
Assessment
Fourth Report to Congress
U.S. Environmental Protection Agency Office of Water
Office of Ground Water and Drinking Water Drinking Water Protection Division
Washington, D.C. 20460


CHAPTER 1: FINDINGS NATIONAL NEED...................................................................................1
2007 Total National Need .....................................................................................................................1
2007 Total National Need Compared to EPA’s Previous Assessments ....................................................3
Total National Need by Project Type .....................................................................................................5
Transmission and Distribution Needs ...........................................................................................6
Treatment Needs ...........................................................................................................................7
Source Needs ................................................................................................................................7
Storage Needs ................................................................................................................................8
Other Needs .................................................................................................................................8
Need by System Size..............................................................................................................................9
Needs Associated with SDWA Regulations ..........................................................................................10
Existing Regulations ....................................................................................................................10
Proposed or Recently Promulgated Regulatory Needs ..................................................................11
Security Needs ....................................................................................................................................13
American Indian and Alaskan Native Village Water System Needs .....................................................14
CHAPTER 2: FINDINGS STATE NEED .........................................................................................17
State-Specific Needs ...........................................................................................................................17
Changes in State-Specific Need through Assessment Cycles ................................................................22
Continuing Evolution of the DWINSA ..............................................................................................24
Key Observations on Each Assessment’s Approach ..............................................................................25
Unique Needs of Water Systems in U.S. Territories .............................................................................26
APPENDIX A SURVEY METHODS ................................................................................................29
APPENDIX B DATA COLLECTION ...............................................................................................39
APPENDIX C POLICIES .................................................................................................................45
APPENDIX D ACCURACY, PRECISION, AND UNCERTAINTY .................................................53
APPENDIX E SUMMARY OF FINDINGS FOR SYSTEMS SERVING 10,000 AND
FEWER PERSONS.........................................................................................................................57
GLOSSARY ..........................................................................................................................................
Contents
EXECUTIVE SUMMARY.......................................................................................................................i
61


Exhibit 1.11: Total 20-Year American Indian and Alaskan Native Village Water System Need
by Project Type ...............................................................................................................14
Exhibit 1.12: 20-Year American Indian and Alaskan Native Village Water System Need
by EPA Region ..............................................................................................................15
Exhibit 2.1: State 20-Year Need Reported by Project Type...................................................................18
Exhibit 2.2: State 20-Year Need Reported by System Size....................................................................19
Exhibit 2.3: Overview of 20-Year Need by State ..................................................................................20
Exhibit 2.4: State 20-Year Need Reported for Partially Surveyed States ................................................21
Exhibit 2.5: Historic State Need Reported for Each DWINSA ............................................................23
Exhibit 2.6: 20-Year Need Reported by U.S. Territories .......................................................................26
Exhibit A.1: Community Water System Stratification for the 2007 Assessment ...................................31
Exhibit A.2: Medium and Large Community Water System Sample Size ............................................32
Exhibit A.3: Small Community Water System Sample Size..................................................................34
Exhibit B.1: DWINSA Allowable and Unallowable Projects ...............................................................40
Exhibit E.1: 2007 State Need Reported by Project Type for CWSs Serving a Population of
10,000 and Fewer ..........................................................................................................
Exhibits
Exhibit ES.1: DWINSA Comparison of 20-Year National Need ...........................................................i
Exhibit 1.1: Total National 20-Year Need ..............................................................................................1
Exhibit 1.2: Total National 20-Year Need Comparison to Previous DWINSA Findings .......................3
Exhibit 1.3: Total 20-Year Need Comparison to Other Assessments ......................................................4
Exhibit 1.4: Total 20-Year Need by Project Type ....................................................................................5
Exhibit 1.5: Total 20-Year Need by System Size and Type and Project Type ...........................................5
Exhibit 1.6: Community Water System 20-Year Need by Size and Population.......................................9
Exhibit 1.7: Total Regulatory vs. Non-Regulatory 20-Year Need .........................................................10
Exhibit 1.8: Total 20-Year National Regulatory Need ..........................................................................10
Exhibit 1.9: Total National 20-Year Need for Proposed and Recently Promulgated Regulations ..........12
Exhibit 1.10: Total National 20-Year Security Needs ...........................................................................13
58


Acknowledgments
Many dedicated individuals contributed to the 2007 Drinking Water Infrastructure Needs Survey and Assessment. We would like to thank the state and U.S. Environmental Protection Agency (EPA) Needs Assessment coordinators and their supporting staffs and contractors for their active participation and continuing interest in the project. Not listed here are the operators and managers of the approximately 3,250 systems who spent their valuable time completing the questionnaires sent to them. We thank them for their assistance.
Mark Spinale - U.S. EPA Region 1 Theodore Dunn - Connecticut Patrick Rogers - Massachusetts Roger Crouse - Maine Richard Skarinka - New Hampshire Gary Chobanian - Rhode Island Eric Blatt - Vermont
Ray Kvalheim - U.S. EPA Region 2, U.S. Virgin Islands Roger Tsao, Todd Taylor - New Jersey Steve Marshall, Dave Phillips - New York Adamaris Quinones - Puerto Rico
Ken Pantuck - U.S. EPA Region 3 Jennifer Bruneau - District of Columbia John Degour - Delaware Chris Carski - Maryland Hardik Patel - Pennsylvania Dale Kitchen, Jeremy Hull - Virginia Bob Decrease - West Virginia
Dale Froneberger - U.S. EPA Region 4 Chris Strickland - Alabama Isaac Santos, Paul Brandl, Craig Diltz - Florida Chris Smith - Georgia Sarah Tucker - Kentucky Sheila Williams, William Moody - Mississippi Sid Harrell, Vince Tomaino - North Carolina Sheila Watts - South Carolina Khaldoun Kailani - Tennessee
William Tansey - U.S. EPA Region 5 Dave McMillan - Illinois Sarah Hudson - Indiana Richard Benzie - Michigan Lucas Martin - Minnesota Stacy Barna - Ohio James Witthuhn - Wisconsin
Dave Reazin - U.S. EPA Region 6 Raymond Thompson - Arkansas Julie Comeaux - Louisiana Mary Day - New Mexico Steven Hoffman - Oklahoma Fawn Pruet, Don Th ompson - Texas
Rao Surampalli - U.S. EPA Region 7 Roy Ney, Jennifer Bunton - Iowa William Carr - Kansas Steve Jones - Missouri Steve McNulty - Nebraska
Brian Friel - U.S. EPA Region 8 John Payne - Colorado Marc Golz - Montana Chuck Abel - North Dakota Jim Anderson - South Dakota Julie Cobleigh - Utah
Jose Caratini, Barry Pollock - U.S. EPA Region 9, U.S. Territories Jonathan Bernreuter - Arizona Michael Ngai, Dat Tran - California Stuart Yamada - Hawaii Adele Basham - Nevada
Richard Green - U.S. EPA Region 10 Christopher Clark - Alaska Carol Garrison - Idaho George Waun - Oregon Peter Beaton - Washington
U.S. EPA Offi ce of Water Robert Barles - Needs Assessment Coordinator Peter Shanaghan - DWSRF Team Leader Charles Job - Drinking Water Infrastructure Branch Chief The Cadmus Group, Inc. - Prime Contractor

City of Helena, Montana
The base of a 1.5 million gallon storage tank under construction in Helena, Montana.

Executive Summary
Total National Need
The U.S. Environmental Protection Agency’s (EPA’s) fourth national assessment of public water system infrastructure needs shows a total twenty-year capital improvement need of $334.8 billion. This estimate represents infrastructure projects necessary from January 1, 2007, through December 31, 2026, for water systems to continue to provide safe drinking water to the public. The national total comprises the infrastructure investment needs of the nation’s approximately 52,000 community water systems and 21,400 not-for-profit noncommunity water systems, including the needs of American Indian and Alaskan Native Village water systems, and the costs associated with proposed and recently promulgated regulations. Th e findings are based on the 2007 Drinking Water Needs Survey and Assessment (DWINSA or Assessment) which relied primarily on a statistical survey of public water systems (approximately 3,250 responses).
The estimate covers infrastructure needs that are eligible for, but not necessarily financed by, Drinking Water State Revolving Fund (DWSRF) monies (note- DWSRF is designed to supplement, not replace, investment funding by states and localities as well as rate payers). Projects eligible for DWSRF funding include the installation of new infrastructure and the rehabilitation, expansion, or replacement of existing infrastructure. Projects may be needed because existing infrastructure is deteriorated or undersized, or to ensure compliance with regulations. Cost estimates assume comprehensive construction costs including
engineering and design, purchase of raw materials and equipment, construction and installation labor, and fi nal inspection.
EPA recognizes that there are legitimate and significant water system needs that are not eligible for DWSRF funding, such as raw water dams and reservoirs, projects related primarily to population growth, and water system operation and maintenance costs. However, because the Assessment is directly associated with the allocation of DWSRF capitalization grants, needs ineligible for DWSRF funding are not included in the estimate.
Exhibit ES.1: DWINSA Comparison of 20-Year National Need
Year 1995 1999 2003 2007
National $200.4 $198.2 $331.4 $334.8
Need The national 20-year need estimate is reported in billions of January 2007 dollars.
$334.8 Billion is Needed
The nation’s drinking water utilities need $334.8 billion in infrastructure investments over the next 20 years for thousands of miles of pipe as well as thousands of treatment plants, storage tanks, and other key assets to ensure the public health and economic well-being of our cities, towns, and communities.
Authority, Purpose, and History
The 1996 Safe Drinking Water Act Amendments mandated that EPA conduct an assessment of the nation’s public water systems’ infrastructure needs every 4 years, and use the findings to allocate Drinking Water State Revolving Fund (DWSRF) capitalization grants to states. The DWSRF was established to help public water systems obtain financing for improvements necessary to protect public health and comply with drinking water regulations. From 1997 to 2007, states loaned $12.6 billion to water systems for 5,550 projects.
National Need Compared to Previous Needs Assessments
EPA conducted three previous Assessments, in 1995, 1999, and 2003. Exhibit ES.1, which adjusts the findings to 2007 dollars, shows the 2007 Assessment’s total national need
i

2007 Drinking Water Infrastructure Needs Survey and Assessment
to be comparable to the 2003 estimate, continuing the success of better capturing longer term needs that were underreported in the two earlier surveys. While the 2003 and 2007 eff orts share a similar statistical approach and total national need findings, the 2007 Assessment emplo yed specifi c eff orts to greatly improve the consistency of methods for estimating needs across the states and water systems.
Individual State Need
Th e 2007 Assessment shows significant changes in some states ’ needs from previous Assessments. Th ese changes will result in modifi cations to individual states’ DWSRF allotments. While shifts in states’ needs can be attributed to expected changes in the status of projects from one survey to the next, some of the shifts in the 2007 findings ar e due to this Assessment’s emphasis on improving method consistency across states and water systems.
Regulatory Need
Th e fi ndings of the 2007 Assessment indicate that the need associated directly with Safe Drinking Water Act (SDWA) regulations remains a small percentage, 16 percent, of the total national need. Most water system needs are not directly related to violations of, or compliance with, SDWA regulations. Most needs are ongoing investments that systems must make to continue delivering safe drinking water to their customers.
Small System Need
For the 2007 Assessment, EPA sent water system professionals to 600 randomly selected small systems to collect information about their needs. Small systems were defined as ser ving 3,300 persons or fewer. Similar fi eld surveys of small water systems were conducted for the 1995 and 1999 Assessments, but the 2003 Assessment relied on the results of the 1999 survey adjusted to 2003 dollars. Th e new field sur vey of small systems allowed for the application of the cost models used to estimate needs of medium and large systems, providing a more consistent approach across all system sizes. The 2007 r esults show a small systems need of $59.4 billion, or 18 percent of the total national need, a result similar to that of the previous filed sur vey of these systems.
Needs of American Indian and Alaskan Native Village Water Systems
Th e needs of water systems serving American Indians and Alaskan Native Villages are a small percentage of the nation’s total need; however, they represent a high need per household. Many water systems for American Indian tribes and Alaskan Native Villages are located in remote rural areas or in areas with permafrost. Th ese conditions present special challenges for providing drinking water service. Th e fi ndings presented in this report are based on an in-depth survey of these systems conducted in 1999 adjusted to 2007 dollars.
Water Industry Capital Investment Planning and Documentation of Needs
Systems submitted a variety of planning documents and excerpts of documents in support of projects reported for the 2007 Assessment. These documents made clear that as our nation ’s infrastructure continues to age and deteriorate, many water systems are using asset management strategies to better understand and address their infrastructure rehabilitation and replacement challenges. However, for many other systems, the information and documentation provided indicates that a significant gap still exists betw een information about their inventory of infrastructure and their knowledge of that infrastructure’s condition or remaining useful life.
ii


2007 Drinking Water Infrastructure Needs Survey and Assessment
Denver Water
A 40-by-60-foot sinkhole on Interstate 25 outside of Denver, Colorado formed after a water main ruptured. The rupture was caused by an emergency pump shutoff that increased pressure from 180 psi to 300 psi. The break was repaired within 72 hours.

Exhibit 1.1: Total National 20-Year Need (in billions of January 2007 dollars)
System Size and Type Need
Large Community Water Systems*
$116.3 (serving over 100,000 persons)
Medium Community Water Systems*
$145.1 (serving 3,301-100,000 persons)
Small Community Water Systems $59.4
(serving 3,300 and fewer persons)
Not-for-Profi t Noncommunity Water Systems† $4.1
Total State Need $324.9
American Indian and Alaskan Native Village Water Systems† $2.9
Costs Associated with Proposed and Recently $7.0
Promulgated Regulations
Total National Need $334.8
Chapter 1: Findings - National Need
2007 Total National Need
Th e 20-year national infrastructure need estimated by the 2007 Assessment is $334.8 billion. The br eakout of the national need by system size and type is presented in Exhibit 1.1.
Th e results were derived from the responses to a probability sample of approximately 3,250 community water systems1 (CWSs). The r esults for the not-for-profi t noncommunity water systems2 (NPNCWSs) and American Indian andAlaskan Native Village water systems were extrapolated from a similar assessment conducted in 1999. The total national need also includes the costs associated with meeting recently proposed or promulgated regulations that are too new to be a consideration in water systems’ investment plans; those costs are derived from EPA’s economic analyses (EAs) supporting each regulation.
Th e need reported in the Assessment includes projects for expanding, replacing, or rehabilitating existing infrastructure.
Note: Numbers may not total due to rounding. * “Large” and “medium” systems are defi ned differently for this Assessment than previous Assessments. See Appendix A for more information. † Based on 1999 Assessment fi ndings adjusted to 2007 dollars.
Construction at the Fort Peck-Dry Prairie Regional Water System in northwest Montana. Montana Department of Environmental Quality
1
1 A community water system is a public water system that serves at least 15 connections used by year-round residents or that regularly serves at least 25 residents year-round. Cities, towns, and small communities such as retirement homes are examples of community water systems. 2 A noncommunity water system is a public water system that is not a community water system and that serves a nonresidential population of at least 25 individuals daily for at least 60 days of the year. Schools and churches are examples of noncommunity water systems.

2007 Drinking Water Infrastructure Needs Survey and Assessment
It also includes projects to construct new infrastructure in order to preserve the physical integrity of water systems and to convey drinking water to existing residential, commercial, and industrial customers. Projects vary greatly in scale, complexity, and cost—from rehabilitating a small storage tank, to replacing an entire treatment plant, to constructing a high-capacity pipeline.
Th e results presented in this report will determine the allocation of DWSRF capitalization grants for federal fiscal y ears 2010 through 2013. Ther efore, the need does not include projects that are ineligible for DWSRF funding. A summary of the types of projects included in the Assessment, as well as specific unallo wable projects, is presented in Appendix B. EPA recognizes that projects not eligible for DWSRF funding can be significant, if not critical, water system needs, but they are outside the scope of this Assessment. In addition, the Assessment does not seek to capture information on the financing alternativ es being pursued or considered by systems for individual projects. Th e DWSRF is in fact intended as a supplement to, not a replacement for funding by states, localities, and rate payers.
Th e approach and methodologies for discerning needs are further detailed in Appendix A. Th e specifi c project allowability criteria are discussed in Appendix B.
The $334.8 billion represents the need associated with thousands of miles of pipe, thousands of treatment plant and source projects, and billions of gallons of storage. Investments in water systems not only provide assurances of continued delivery of safe drinking water to our homes, schools, and places of business, they are key to local economies across our nation.
As stated in a recent report by the U.S. Conference of Mayors:
“The estimates exhibit a wide range, but the consensus is that public infrastructure investment yields positive returns, and investment in water and sewer infrastructure has greater returns than most other types of public infrastructure.
• A recent study estimates that one dollar of water and sewer infrastructure investment increases private output (Gross Domestic Product, GDP) in the long-term by $6.35.
• With respect to annual general revenue and spending on operating and maintaining water and sewer systems, the US Department of Commerce’s Bureau of Economic Analysis estimates that for each additional dollar of revenue (or the economic value of the output) of the water and sewer industry, the increase in revenue (economic output) that occurs in all industries is $2.62 in that year.
• The same analysis estimates that adding 1 job in water and sewer creates 3.68 jobs in the national economy to support that job.”
Th e U.S. Conference of Mayors. Local Government Investment in Municipal Water And Sewer Infrastructure: Adding Value To Th e National Economy. Richard A. Krop, Ph.D., Charles Hernick, and Christopher Frantz. The Cadmus G roup, Inc. August 14, 2008.
Additional Source: Pereira, A.M. “Is all public capital created equal?” Review of Economics and Statistics, 82:3 (2000): 513–518.
2

Findings - National Need
2007 Total National Need Compared to EPA’s Previous Assessments
Th e 2007 total national need of $334.8 billion is comparable to the 2003 estimate of $331.4 billion (as adjusted to 2007 dollars), continuing the earlier Assessment’s success in better capturing previously underreported longer term needs for infrastructure rehabilitation and replacement. Both the 2003 and 2007 Assessments clearly point to the nation’s water systems having entered a “rehabilitation and replacement era” in which much of water utilities’ existing infrastructure has reached or is approaching the end of its useful life.
Exhibit 1.2 compares the need from this Assessment to past Assessments. Cost indices were used to adjust previous needs to the 2007 Assessment’s month and year. Although there are numerous cost indices available, EPA used the Construction Cost Index (CCI) compiled by McGraw Hill Constructionbecause it includes adjustments for labor rates as well as the cost of materials. It
is worth noting that the CCI shows a cost increase of approximately 3 percent per year from 1995 through 2003, but an approximately 5 percent increase per year from 2003 through 2007.
While the 2007 Assessment shares a similar approach and total national finding with the 2003 Assessment, the results of this most recent eff ort were derived from survey policies purposefully designed to ensure more consistent application of need-estimating methodologies across all states and water systems. These 2007 Assessment policies, including required documentation to support survey acceptance of projects, are detailed in Appendix C.
Exhibit 1.2: Total National 20-Year Need Comparison to Previous DWINSA Findings (in billions of dollars)
1995 1999 2003 2007
Total National Need (as listed in $138.4 $150.9 $276.8 $334.8
Assessment Year's Report to Congress)
Cost adjustment factor to January 2007 dollars (based on Construction Cost 44.8% 31.3% 19.7% -Index)
Total National Need (adjusted to $200.4 $198.2 $331.4 $334.8
January 2007 dollars)
www.iStockphoto.com
3

2007 Drinking Water Infrastructure Needs Survey and Assessment
Exhibit 1.3 compares the EPA Assessments to other important assessment eff orts. All estimates are presented in 2007 dollars. EPA’s DWINSA continues to estimate a need within the range identified in these r eports:
• The Congr essional Budget Office (CBO) r eport “Future Investment in Drinking Water and Wastewater Infrastructure,” which estimates annual water system needs of $14.6 billion to $25.2 billion. This extrapolates to a 20-y ear need in the range of $292 to $504 billion.3
• EPA’s “Clean Water and Drinking Water Infrastructure Gap Analysis,” which estimated drinking water systems’ 20-year capital needs in the range of $204 billion to $590 billion with a point estimate of $363 billion.4
• The Water Infrastructure Network’s (WIN’s) “Clean and Safe Water for the 21st Century - A Renewed National Commitment to Water and Wastewater Infrastructure,” which estimates water system needs of $25 billion annually. Th is extrapolates to $503 billion over 20 years.5
Exhibit 1.3: Total 20-Year Need Comparison to Other Assessments
$200$198 $331 $335 $503
EPA ‘95 and ’99 Assessments
EPA ‘03 and ’07 Assessments
WIN Estimate
Gap Analysis
$204 to $590
CBO Estimate
$292 to $504
$100 $200 $300 $400 $500 $600 Estimates in billions of January 2007 dollars
3 Congressional Budget Office, “Future Investment in Drinking Water and Wastewater Infrastructure,” (November 2002), p. ix. Needs were reported in 2001 dollars and have been adjusted to January 2007 dollars for comparison purposes. 4 U.S. Environmental Protection Agency, “Clean Water and Drinking Water Infrastructure Gap Analysis,” (September 2002), p. 5. Needs were assumed to be in 1999 dollars based on the date of the report and planning period used. Needs have been adjusted to January 2007 dollars for comparison purposes. 5 Water Infrastructure Network, “Clean and Safe Water for the 21st Century - A Renewed National Commitment to Water and Wastewater Infrastructure,” (undated), p. 3-1. Needs were assumed to be in 1999 dollars based on the planning period and data used. Needs have been adjusted to January 2007 dollars for comparison purposes.
4

E(
xhibit 1.4: Total 20-Year Need by Project Type in billions of January 2007 dollars)
Total National Need Treatment $334.8 Billion $75.1
Transmission
22%
6%
11%
Source and Distribution $19.8 60%$200.8
Other $2.3
Storage $36.9
Findings - National Need
Total National Need by Project Type
Infrastructure needs of water systems can be grouped into four major categories based on project type. Th ese project types are source, transmission and distribution, treatment, and storage. Each category fulfi lls an important function in delivering safe drinking water to the public. Most needs were assigned to one of these categories. An additional “other” category is composed of projects that do not fit into one of the four categories. Exhibit 1.4 shows the total national need by project type. Exhibit 1.5 shows the total national need by water system size and type, as well as by project type.
Note: Numbers may not total due to rounding.
Exhibit 1.5: Total 20-Year Need by System Size and Type and Project Type (in billions of January 2007 dollars)
Distribution System Size and Type and Treatment Storage Source Other Total Need
Transmission Large Community Water Systems (serving over $72.5 $26.6 $9.9 $6.5 $0.9 $116.3 100,000 persons)*
Medium Community Water Systems (serving 3,301 to $91.5 $29.8 $15.9 $7.1 $0.8 $145.1 100,000 persons)*
Small Community Water Systems (serving 3,300 $34.7 $10.3 $8.5 $5.2 $0.6 $59.4 and fewer persons)
Not-for-Profit Noncommunity Water $0.5 $0.8 $1.9 $0.8 $0.0 $4.1Systems†
Total State Need $199.2 $67.6 $36.3 $19.6 $2.3 $324.9
American Indian and Alaskan Native Village $1.6 $0.6 $0.6 $0.2 $0.0 $2.9Water Systems†
Costs Associated with Proposed and Recently Promulgated Regulations $7.0 $7.0(taken from EPA economic analyses)
Total National Need $200.8 $75.1 $36.9 $19.8 $2.3 $334.8
Note: Numbers may not total due to rounding. * “Large” and “medium” community water systems are defi ned differently for this Assessment than in previous Assessments. See Appendix A for more information. † Based on 1999 Assessment fi ndings adjusted to 2007 dollars.
5

2007 Drinking Water Infrastructure Needs Survey and Assessment
Transmission and Distribution Needs
Transmission and distribution projects are the largest category of need at $200.8 billion over the next 20 years (60 percent of the total need). Although the least visible component of a public water system, the buried pipes of a transmission and distribution network generally account for most of a system’s capital value. Even small rural systems may have several hundred miles of pipe. In larger cities, replacement or rehabilitation of even small segments of the extensive underground networks of water supply pipes can be costly, both from the perspective of the cost of construction and the costs related to disruption to the city’s commerce. Regardless of water system size, projects dealing with water mains and related infrastructure present challenges. Pipe projects are typically driven by a utility’s need to continue providing potable water to its customers while preventing contamination of the water prior to delivery.
Th e majority of this $200.8 billion need is for replacing or refurbishing aging or deteriorating transmission and distribution mains. These pr ojects are critical to the delivery of safe drinking water and can help ensure compliance with many regulatory requirements. Failures in transmission and distribution lines can interrupt the delivery of water and possibly allow contamination of the water.
Th e rate at which water mains require replacement or rehabilitation varies greatly by pipe material, age of the pipe, soil characteristics, weather conditions, and construction methods. Systems that have been unable to rehabilitate or replace mains may have proportionally more aged infrastructure, and therefore a higher level of need. In addition, some pipe materials tend to degrade prematurely; galvanized pipe is particularly susceptible to corrosion in certain soils, and unlined cast iron pipe is susceptible to internal corrosion. Furthermore, health concerns associated with asbestos during pipe repair make asbestos cement pipe
undesirable for some systems. Many water suppliers are replacing these types of mains with ductile iron or polyvinyl chloride pipe.
Other projects in the transmission and distribution category are; installing new pipe to loop dead end mains to avoid stagnant water, installing water mains in areas where existing homes do not have a safe and adequate water supply, and installing or rehabilitating pumping stations to maintain adequate pressure. Th is category also includes projects to address the replacement of appurtenances, such as valves that are essential for controlling flo ws and isolating problem areas during repairs, hydrants to flush the distribution system to maintain water quality, backflo w-prevention devices to avoid contamination, and meters to record fl ow and water consumption.
Ray Kvalheim, EPA Region 2
Minerals can build up in old water mains, leading to pressure and bacteriological problems. Pipe can be replaced, or it can be rehabilitated using a “pig” to scour the inside of the pipe and remove the deposits.
6

Findings - National Need
Top photo: Jeanne Cargill, Wisconsin Department of Natural Resources Bottom photo: Charles Pycha, EPA Region 5
Membrane technologies continue to advance as a viable treatment alternative as systems strive to produce higher quality fi nished water.
7
Treatment Needs
The total 20-year national need for treatment is estimated to be $75.1 billion. This category includes the construction, expansion, and rehabilitation of infrastructure to reduce contamination through various treatment processes (e.g., fi ltration, disinfection, corrosion control). A large percentage of the regulatory need is in this category. Treatment facilities vary significantly depending on the quality of their source water and type of contamination present. Treatment systems range from a simple chlorinator for disinfection to a complete conventional treatment system with coagulation and flocculation (processes that cause particles suspended in the water to combine for easier removal), sedimentation, fi ltration, disinfection, laboratory facilities, waste handling, and computer automated monitoring and control devices.
Treatment technologies are used to remove or inactivate disease-causing organisms, or to remove or prevent the formation of harmful chemicals.
The treatment category also includes projects to remove contaminants that adversely affect the taste, odor, and color of drinking water. Treatment for these “secondary contaminants” often involves softening the water to reduce magnesium and calcium levels, or applying chemical sequestrants for iron or manganese contamination. Although not a public health concern, the aesthetic problems caused by secondary contaminants may prompt some consumers to seek more palatable, but less safe or affordable sources of water.
Source Needs
The total 20-year national need for source water infrastructure is estimated at $19.8 billion. The source category includes needs for constructing or rehabilitating surface water intake structures, drilled wells, and spring collectors. Needs for dams and raw water reservoirs are excluded from DWSRF funding and this Assessment.
Drinking water comes from either ground water or surface water sources. Wells typically are considered ground water sources. Rivers, lakes, other open bodies of water, and wells under the direct influence of surface water are considered surface water sources. Whether drinking water originates from ground or surface water sources, its raw water quality is an

2007 Drinking Water Infrastructure Needs Survey and Assessment
important component in protecting public health. A high-quality water supply can minimize the possibility of microbial or chemical contamination and may not require extensive treatment facilities. Many source water needs involve construction of new surface water intake structures or drilling new wells to obtain higher quality raw water.
A water source should provide an adequate supply to enable the water system to maintain minimum pressures. Low water pressure may result in the intrusion of contaminants into the distribution system. The 2007 Assessment includes projects to expand the capacity of intake structures and add new wells to address supply deficiencies facing existing customers.
Storage Needs
The 20-year national need estimated for storage projects is $36.9 billion. This category includes projects to construct, rehabilitate, or cover fi nished water storage tanks, but it excludes dams and raw water reservoirs (unless the raw water basins are onsite and part of the treatment process) because they are specifically excluded from DWSRF funding. It is critical that water systems have suffi cient storage to provide adequate supplies of treated water to the public, particularly during periods of peak demand. Th is storage enables the system to maintain the minimum pressure required throughout the distribution system to prevent the intrusion of contaminants into the distribution network.
Other Needs
Needs not included in the previous four categories are grouped as “other” needs. These needs account for $2.3 billion of the total 20-year national need. Examples of “other” projects are system-wide telemetry, supervisory control and data acquisition (SCADA) systems, and water system security measures that were not assigned to another category.
Drought
An emerging need encountered in the 2007 Assessment is new source water infrastructure to offset existing and anticipated drought conditions. In the past several years, water systems across the United States have been adversely affected by drought. Because drought is not always long-term or permanent, the DWSRF-eligibility of projects based on speculated continuation of the drought condition was not clear. EPA does not question that water systems are being affected by drought conditions. However, only a small percentage of the systems participating in the Assessment have completed plans to address the drought impacts. When documentation was lacking or nonexistent, EPA had to decide whether a speculative permanent solution or a less costly temporary solution should be considered for inclusion in the Assessment. EPA also investigated the drought-related projects to ensure they were primarily to provide drinking water to existing consumers and not for projected growth demand. EPA believes the drought-related needs reported in the 2007 Assessment capture a small portion of the drought-related need water utilities may face in the future.
Jim McRight, North Carolina Department of Environment and Natural Resources
Construction of a 2 million gallon clearwell at the new water treatment plant west of Kinston, North Carolina, funded partially by the DWSRF.
8

Findings - National Need
Need by System Size
Exhibit 1.6 shows the relationship between infrastructure need, population served, and the number of community water systems by size category. As this exhibit demonstrates, large systems account for a small portion of the number of community water systems in the country, but they serve 45 percent of the population receiving water from community water systems and account for 36 percent of the drinking water infrastructure investment need. Small systems cannot take advantage of economies-of-scale like large systems and so have higher costs per customer. Small systems represent, by far, the largest number of systems, but they account for only 9 percent of the population served. In addition, in relation to population served, they account for a disproportionate 19 percent of the community water system need. Medium systems represent the largest portion of the need, and their need is more proportional to the population served.
Exhibit 1.6: Community Water System 20-Year Need by Size and Population*
CWS Need Water Systems Population Served
% of System Size$ Billions† % of CWS Number of % of Water Population
Need Systems‡ Systems‡ Population
(millions)§ Served§
Large Community Water Systems ** $116.3 36% 584 1% 128.6 45%
(serving over 100,000 persons)
Medium Community Water Systems (serving 3,301 to $145.1 45% 8,749 17% 130.7 46% 100,000 persons)**
Small Community Water Systems (serving 3,300 and fewer $59.4 19% 41,748 82% 24.1 9% persons) Note: Numbers may not total due to rounding. * This exhibit reports the need for community water systems. It does not discuss fi ndings for not-for-profi t noncommunity systems, needs associated with proposed or recently promulgated regulations, or needs for American Indian or Alaskan Native Village water systems. † Need reported in billions of January 2007 dollars. ‡ Based on the DWINSA sample frame as discussed in Appendix A of this report. § Data on population served from EPA’s Factoid: Drinking Water and Ground Water Statistics for 2007. EPA 816-K-07-004. March 2008. Does not include populations for systems defi ned as “Federal Systems” or “Native American,” but does include populations served by Alaskan Native Village water systems. Factoid distinguished system sizes for “very small,” “small,” “medium,” “large,” and “very large,” allowing direct comparisons to system size in the Assessment. ** “Large” and “medium” community water systems are defi ned differently for this Assessment than in previous Assessments. See Appendix A for more information.
9

Exhibit 1.7: Total Regulatory vs. Non-Regulatory 20-Year Need (in billions of January 2007 dollars)
Total National Need $334.8 Billion
Non-Regulatory $282.8
84%
Note: Numbers may not total due to rounding.
16%
Regulatory $52.0
2007 Drinking Water Infrastructure Needs Survey and Assessment
Needs Associated with SDWA Regulations
As shown in Exhibit 1.7, 16 percent of the total national need, $52.0 billion, is for compliance with the SDWA regulations. This need includes existing regulations as well as regulations which are proposed or recently promulgated (see below). Although all of the projects in the Assessment are needed to further the goals of the SDWA, most needs are not for obtaining or maintaining compliance with a specifi c regulation. Most infrastructure projects are needed to ensure continued provision of potable water to a utility’s customers. Projects that are directly attributable to specifi c SDWA regulations are collectively referred to
as the “regulatory need.” Most of the regulatory need involves the upgrade, replacement, or installation of treatment technologies.
The Assessment divides the regulatory need in several ways: existing regulations, proposed and recently promulgated regulations, and microbial or chemical regulations. Exhibit 1.8 provides a matrix of the regulatory needs by these categories.
Existing Regulations
Microbial Contaminants.
The surface water treatment regulations (Surface Water Treatment Rule, Interim Enhanced Surface Water Treatment Rule, Filter Backwash Recycling Rule, Long Term 1 Enhanced Surface Water Treatment Rule, and covers for finished water reservoirs required by the Long Term 2 Enhanced Surface Water Treatment Rule) and the Total Coliform Rule are existing SDWA regulations that address microbial contamination. Treatment requirements for the Long Term 2 Enhanced Surface Water Treatment Rule are included in the proposed and recently promulgated regulation need.
Note: Numbers may not total due to rounding.
10
Stage 1 Disinfectants/Disinfection Byproducts
Exhibit 1.8: Total 20-Year National Regulatory Need (in billions of January 2007 dollars)
Regulation Type Microbial
Regulations Chemical
Regulations Total Regulatory
Need
Existing Regulations $29.4 $15.6 $45.0
Proposed or Recently Promulgated Regulations
$3.6 $3.3 $7.0
Total Regulatory Need $33.0 $19.0 $52.0

Findings - National Need
Rule regulates the maximum disinfectant and disinfection byproducts levels in distribution systems and is commonly grouped with the microbial rules.
Projects for compliance with existing regulations were reported by systems in the Assessment and account for more than half of the total regulatory need and almost all of the microbial contaminant-related need. Th is reflects the fact that the majority of the nation’s large municipal systems use surface water sources. Under all of these regulations, systems using surface water sources must provide treatment to minimize microbial contamination. In most cases, this means installing, upgrading, or rehabilitating treatment plants to control pathogens, such as the bacterium E. coli, the virus Hepatitis A, and the protozoans Giardia lamblia and Cryptosporidium. Disinfection also helps protect the system from Total Coliform Rule violations.
Chemical Contaminants.
This estimate includes projects attributable to the Nitrate/Nitrite Standard, the revised Arsenic Standard, the Lead and Copper Rule, and other regulations that set maximum contaminant levels (MCLs) or treatment techniques for organic and
inorganic chemicals. Examples of projects are, infrastructure that aerates water to remove volatile organic compounds such as tetrachloroethylene, or ion exchange units that remove contaminants from the water. This category includes regulations governing more than 80 inorganic or organic chemicals for which infrastructure projects may be needed.
Assigning Arsenic Needs for Small Systems in the 2007 DWINSA
In January 2001, EPA revised the arsenic standard to a maximum contaminant level (MCL) of 10 μg/L. Systems that cannot meet the revised MCL may have capital improvement needs to address arsenic in their source water. The 2007 DWINSA requested that systems identify their needs associated with the revised arsenic standard on their surveys.
Because the sample of small systems is a national sample, and because of the non-uniform distribution of arsenic throughout the country, the DWINSA workgroup was concerned that the findings of the small system survey would not be representative of specific states’ need. In short, states with more arsenic problems should be assigned a higher small system “arsenic need.”
To account for these needs, EPA took a threefold approach.
• First, small systems with arsenic-related needs were identified. EPA used the national water system database (SDWIS) and enlisted the help of states to determine which small systems will have to address the revised arsenic standard.
• Second, a “need” associated with addressing the high arsenic levels was estimated for individual small systems based on information provided by the states and the DWINSA cost models.
• Third, these two factors were used to calculate each state’s total need for small systems to address the revised arsenic standard.
11
Proposed or Recently Promulgated Regulatory Needs
In general, water systems can readily identify the infrastructure needs required for compliance with existing regulations, but most systems have not determined the infrastructure needed to comply with proposed or recently promulgated regulations. Th erefore, relying on systems to report the infrastructure needs for proposed or recently promulgated regulations might

2007 Drinking Water Infrastructure Needs Survey and Assessment
misstate the true need. Consequently, EPA derived the capital infrastructure estimates from the EA that the Agency published when proposing each regulation, or from the final EA if the regulation has been recently promulgated.
However, since the EAs rely on regional data, they are not appropriate predictors of state-specific needs. Therefore, the costs associated with the proposed or recently promulgated regulations are allocated at a national level, not apportioned to each state.
The proposed or recently promulgated regulations included in the 2007 Assessment are:
Montana Department of Environmental Quality
To meet the Long Term 2 Enhanced Surface Water Treatment Rule, systems may need to provide additional disinfection infrastructure. This ozone contact chamber is an example of a type of disinfection that may be applied. Treatment needs for recently promulgated regulations were estimated separate from the states’ surveys, through EAs.
• Proposed Radon Rule
• Final Stage 2 Disinfectants/Disinfection Byproducts Rule
• Final Long Term 2 Enhanced Surface Water Treatment Rule (treatment needs only)
• Final Ground Water Rule
The total cost of complying with these regulations is included in the 2007 Assessment as future regulatory needs. The capital cost estimates for each of these rules are provided in Exhibit 1.9.
Exhibit 1.9: Total National 20-Year Need for Proposed and Recently Promulgated Regulations (in billions of January 2007 dollars)
Proposed or Recently Promulgated Regulation*
Estimated Total Regulatory Need*
Long Term 2 Enhanced Surface Water Treatment Rule $2.2
Stage 2 Disinfectants/Disinfection Byproducts Rule $1.0
Ground Water Rule $0.4
Radon Rule† $3.3
Total Proposed or Recently Promulgated Regulatory Need
$7.0
* Estimates obtained from the appropriate Final or Proposed Rule “Economic Analysis.” These estimates include only capital costs (i.e., they exclude operation and maintenance costs). † The total capital costs were determined by averaging the capital costs from the Economic Analysis for the proposed Radon Rule.
12

Findings - National Need
Security Needs
Vulnerability assessments and the identification of security needs for water systems are rapidly evolving. Since the September 11, 2001 attacks, there has been a concentrated national focus on our vulnerabilities, and water systems are no exception. Th e Public Health Security and Bioterrorism Preparedness and Response Act of 2002 requires any community water system that serves a population of more than 3,300 to prepare a vulnerability assessment. For many water systems, particularly the large systems, security measures have become fully integrated into the capital costs of major infrastructure improvements.
Projects in the 2007 Assessment that were specifically listed as security need account for $422.0 million. However, the total cost that systems incur to protect their infrastructure and their customers’ water quality is likely far greater because many of these costs are now commonly incorporated into the construction cost of infrastructure projects rather than considered separately. The majority of security needs are mostly “hidden” in the other needs reported by this Assessment.
Exhibit 1.10 shows the breakdown of the stand-alone security needs by type of project, including fencing, electronic or cyber security, other physical security measures, monitoring equipment, and other projects listed as having multiple types of security needs. Note that these categories are slightly different from those reported in the 2003 Assessment. They were changed to align with the categories now used within the water supply industry.
Exhibit 1.10: Total National 20-Year Security Needs (in millions of January 2007 dollars)
Fencing Total Security Need $422.0 Million
52%
19%
10%
15%
4%
$80.2
Other Physical $39.9
Combination Projects and
Other $220.6 Electronic/
Cyber $64.8
Monitoring $16.5
Note: Numbers may not total due to rounding.
EPA Region 9
Storage tanks are equipped with caged ladders for safety and are secured to deter trespassers.
13

American Indian and Alaskan Native Village Water System Needs
Because of the effor t invested in the 1999 Assessment and the high confidence lev el in the data from that eff ort, EPA did not resurvey the American Indian and Alaskan Native Village water systems for the 2007 Assessment. Instead, the need established in 1999 was adjusted to 2007 dollars and used as an estimate for the 2007 need. Accordingly, the American Indian and Alaskan Native Village water systems need to invest an estimated $2.9 billion in capital improvements over the next 20 years.
Th e total 20-year need for American Indian water systems is $1.5 billion. The total 20-y ear need for Alaskan Native Village water systems is $1.4 billion. These estimates do not include the need associated with the revised Arsenic Standard. Exhibit 1.11 shows the total American Indian and Alaskan Native Village water system need by project type.
Note: Numbers may not total due to rounding.
*These numbers do not include the need associated with the Arsenic Rule.
Exhibit 1.11: Total 20-Year American Indian and Alaskan Native Village Water System Need by Project Type (in millions of January 2007 dollars)
American Indian Water System Need*
Treatment $235.5
16%
7%
12%
Source $105.2
64%
OtherTransmission $15.3 and
Distribution $976.3 Storage
$180.4 Total Need $1.5 Billion
Alaskan Native Village Water System Need*
46%
Treatment $300.4Transmission
and Distribution
$636.9 21%
4%
Source $56.6
29%
Other $1.0
Total Need $1.4 Billion Storage
$406.7
Alaska Department of Environmental Conservation
Residents fill up at a coin-operated watering point in Tuluksak, Alaska. The terrain and permafrost conditions require above-ground pipes in some parts of the state.

Exhibit 1.12: 20-Year American Indian and Alaskan Native Village Water System Need by
PA Region (in millions of January 2007 dollars)
Total American Indian and Alaskan Native
Region Village Water System
Need Region 1 $5.2
Region 2 $7.9
Region 3* $0.0
Region 4 $23.4
Region 5 $206.6
Region 6 $199.5
Region 7 $18.8
Region 8 $175.1
Region 9† $720.8
Region 10‡ $155.4
Alaskan Native Systems $1,401.6
Need to Comply with the Revised $17.6
E
Total $2,931.8
The remote locations of many widely dispersed communities and the limited availability of water resources are among the logistical challenges that account for the high per-household need of American Indian water systems.
The need for Alaskan Native Village water systems differs from more typical community water systems in that costs for storage in Alaskan Native Village water systems exceed those for treatment needs. Th ese water systems face higher costs because of their remote arctic locations and the unique design and construction standards required in permafrost conditions.
Exhibit 1.12 presents the American Indian and Alaskan Native Village water system need by EPA Region.
Arsenic Standard
* There are no American Indian water systems in EPA Region 3. † Navajo water systems are located in EPA Regions 6, 8, and 9, but for purposes of this report, all Navajo water system needs are reported in EPA Region 9. ‡ Needs for Alaskan Native Village water systems are not included in the EPA Region 10 total.
A well pump house and storage tank at a small water system in Arizona. EPA Region 9

2007 Drinking Water Infrastructure Needs Survey and Assessment
California Department of Health Services
Construction of a 0.75 million gallon storage tank in Kerman, California.
16

17
Chapter 2: Findings - State Need
State-Specifi c Needs
Since federal fi scal year 1998, the SDWA has required EPA to allot DWSRF grants to each state based on the fi ndings of the most recent DWINSA. Because of this Assessment’s role in determining DWSRF capitalization grant allocations, obtaining highly credible andstatistically valid estimates of each state’s need is crucial. Exhibits 2.1 and 2.2 show the total DWSRF-eligible need for states, Puerto Rico, Washington, D.C., and the U.S. Territories by project type and system size. Exhibit 2.3 is a map indicating each state’s 20-year total need.
DWSRF capitalization grants for fi scal years 2010 through 2013 will be allocated to states based on
the fi ndings of the 2007 Assessment. Th e funding is allocated by fi rst setting aside a 1.5 percent allotment to American Indian and Alaskan Native Villagewater systems and a 0.33 percent allotment to the U.S. Territories (the U.S. Virgin Islands, Guam, the Commonwealth of the Northern Mariana Islands, and American Samoa); the Assessment fi ndings are used to help divide these set-asides among these entities. Th e remaining funds are then divided among the states, Puerto Rico, and Washington, D.C. based on the Assessment’s determination of each state’s relative percentage of the total “state need” with each receiving no less than the 1 percent minimum allotment.
States that received the minimum allocation of 1 percent in the most recent allocation were given the option of a lower level of participation in the Assessment. Th ese states’ needs are reported as one group referred to as “partially surveyed” states. Th is option is explained
later in this chapter.
Th e state need does not include costs associated with proposed or recently promulgated regulations or the need of American Indian or Alaskan Native Village water systems.
Partnership for Determining State Need
The substantial effort involved in collecting data and calculating water systems’ 20-year needs relies on a partnership between EPA, the states, and the utilities themselves. Each partner makes a valuable contribution to estimating the DWSRF-eligible needs of drinking water systems.
Water System. Operators and managers of water utilities have on-the-ground knowledge of their system’s infrastructure and condition. These personnel are in the best position to assess their infrastructure needs.
States. State personnel often have considerable knowledge of the systems in their state, and states have staffs whose members are trained to assist systems in completing this Assessment. The states work with EPA towards consensus development of Assessment policies and methods to ensure consistency across the states.
EPA. EPA’s primary roles are to serve as the quality assurance agent for the data collection effort, to ensure that survey policies and methodologies are met, and to serve as a technical resource to assist with capturing complete and accurate 20-year needs. EPA provides checks and balances for survey submittals to encourage full reporting, to ensure consistency and fairness between states, and to control any state bias.
Jeanne Cargill, Wisconsin Department of Natural Resources
This new microfi ltration plant in Ashland, Wisconsin replaced a treatment plant that was over 100 years old.

2007 Drinking Water Infrastructure Needs Survey and Assessment
18
Exhibit 2.1: State 20-Year Need Reported by Project Type (in millions of January 2007 dollars)
* For the 2007 DWINSA the need for states that opt out of the medium system portion of the survey is presented cumulatively and not by state. The list of the 14 partially surveyed states can be seen in Exhibit 2.4.
StateTransmission/
DistributionSource Treatment Storage Other Total
Alabama $3,343.9 $71.6 $386.5 $285.3 $12.0 $4,099.4
Alaska $478.2 $56.4 $121.3 $150.0 $6.5 $812.4
Arizona $3,819.0 $460.3 $2,150.2 $900.1 $81.1 $7,410.7
Arkansas $3,667.5 $149.3 $966.0 $478.3 $17.4 $5,278.5
California $22,988.5 $2,515.3 $7,549.7 $5,735.6 $257.3 $39,046.3
Colorado $3,156.7 $371.7 $2,150.2 $696.7 $24.8 $6,400.1
Connecticut $807.1 $134.9 $280.6 $151.6 $19.7 $1,394.0
District of Columbia $836.8 $0.0 $0.4 $35.5 $1.5 $874.2
Florida $7,234.9 $887.3 $3,552.1 $975.4 $173.5 $12,823.1
Georgia $6,295.6 $406.2 $1,390.5 $751.5 $93.9 $8,937.7
Illinois $8,982.0 $1,576.3 $2,907.8 $1,386.7 $164.2 $15,017.1
Indiana $3,814.2 $353.8 $1,096.1 $648.5 $31.8 $5,944.4
Iowa $4,356.8 $271.9 $990.8 $467.2 $26.4 $6,113.1
Kansas $2,784.4 $187.1 $684.1 $339.7 $35.0 $4,030.2
Kentucky $3,643.6 $121.7 $699.0 $474.8 $38.9 $4,978.1
Louisiana $5,100.7 $305.7 $1,024.8 $427.4 $41.3 $6,900.1
Maryland $3,497.6 $180.6 $1,134.5 $606.0 $24.7 $5,443.4
Massachusetts $4,456.4 $340.9 $1,130.1 $823.4 $39.1 $6,790.0
Michigan $7,657.6 $529.6 $2,548.5 $1,035.8 $71.3 $11,842.8
Minnesota $2,819.3 $372.0 $1,982.9 $770.3 $43.9 $5,988.4
Mississippi $1,604.4 $284.7 $907.2 $429.8 $17.2 $3,243.3
Missouri $4,801.8 $324.7 $1,281.2 $635.7 $42.3 $7,085.6
Nebraska $1,017.7 $140.5 $309.2 $300.8 $8.4 $1,776.6
Nevada $1,116.4 $892.3 $202.2 $460.6 $19.8 $2,691.3
New Jersey $4,722.9 $307.1 $1,850.4 $1,056.7 $24.7 $7,961.6
New York $15,417.0 $1,915.5 $6,986.2 $2,707.8 $110.9 $27,137.3
North Carolina $6,037.1 $670.7 $2,237.7 $1,032.7 $77.1 $10,055.2
Ohio $8,374.2 $564.2 $2,235.6 $1,330.4 $94.6 $12,599.0
Oklahoma $2,603.5 $142.0 $858.9 $493.5 $14.1 $4,112.1
Oregon $1,520.6 $156.3 $546.1 $536.0 $26.2 $2,785.3
Pennsylvania $7,644.9 $557.1 $1,834.5 $1,284.2 $58.7 $11,379.3
Puerto Rico $1,079.5 $80.6 $1,037.4 $325.2 $14.8 $2,537.5
South Carolina $1,102.7 $75.2 $222.3 $210.2 $17.9 $1,628.3
Tennessee $2,356.3 $109.2 $692.8 $368.0 $21.2 $3,547.6
Texas $15,950.2 $1,600.3 $5,785.2 $2,695.8 $99.2 $26,130.8
Virginia $3,806.3 $196.0 $1,293.3 $722.8 $43.6 $6,061.9
Washington $5,765.5 $717.3 $1,580.0 $1,502.7 $190.6 $9,756.0
Wisconsin $3,550.5 $385.1 $1,467.5 $758.7 $24.2 $6,186.0
Partially Surveyed States* $10,478.1 $1,131.1 $3,347.3 $2,099.5 $136.3 $17,192.4
Subtotal $198,690.3 $19,542.3 $67,421.3 $36,091.3 $2,246.3 $323,991.4 American Samoa $43.7 $10.6 $15.9 $22.0 $0.6 $92.8
Guam $223.6 $2.0 $8.6 $29.7 $0.0 $263.9
Commonwealth of the Northern Mariana Islands
$123.2 $28.7 $61.8 $65.8 $9.7 $289.3
U.S. Virgin Islands $138.3 $7.1 $45.9 $59.8 $2.3 $253.3
Subtotal $528.8 $48.4 $132.2 $177.2 $12.7 $899.4 Total State Need $199,219.1 $19,590.7 $67,553.5 $36,268.5 $2,259.0 $324,890.8

Findings - State Need
19
Exhibit 2.2: State 20-Year Need Reported by System Size (in millions of January 2007 dollars)
* For the 2007 DWINSA the need for states that opt out of the medium system portion of the survey is presented cumulatively and not by state. The list of the 14 partially surveyed states can be seen in Exhibit 2.4.
State Large Medium Small NPNCWS Total
Alabama $998.5 $2,709.8 $387.2 $3.8 $4,099.4
Alaska $85.1 $302.3 $363.8 $61.1 $812.4
Arizona $4,381.4 $2,121.3 $889.4 $18.5 $7,410.7
Arkansas $443.6 $3,854.3 $973.3 $7.3 $5,278.5
California $21,345.9 $14,098.1 $3,500.9 $101.4 $39,046.3
Colorado $2,079.0 $3,246.6 $1,073.2 $1.3 $6,400.1
Connecticut $288.3 $451.2 $627.0 $27.5 $1,394.0
District of Columbia $874.2 $0.0 $0.0 $0.0 $874.2
Florida $5,135.7 $5,769.3 $1,790.4 $127.7 $12,823.1
Georgia $2,663.4 $4,716.0 $1,544.5 $13.8 $8,937.7
Illinois $5,248.1 $7,006.7 $2,652.2 $110.2 $15,017.1
Indiana $1,417.2 $3,291.0 $1,059.9 $176.3 $5,944.4
Iowa $458.2 $4,190.3 $1,446.2 $18.4 $6,113.1
Kansas $766.5 $2,017.8 $1,242.3 $3.5 $4,030.2
Kentucky $757.5 $3,879.0 $340.5 $1.1 $4,978.1
Louisiana $3,354.7 $2,249.4 $1,281.0 $14.9 $6,900.1
Maryland $3,924.1 $853.3 $567.8 $98.2 $5,443.4
Massachusetts $1,683.3 $4,649.7 $424.0 $32.9 $6,790.0
Michigan $4,952.6 $4,677.0 $1,740.9 $472.2 $11,842.8
Minnesota $672.0 $3,631.7 $1,416.5 $268.3 $5,988.4
Mississippi $227.0 $1,432.2 $1,574.5 $9.6 $3,243.3
Missouri $1,342.2 $3,860.3 $1,844.0 $39.1 $7,085.6
Nebraska $379.0 $632.2 $749.4 $16.0 $1,776.6
Nevada $2,098.2 $291.2 $287.7 $14.2 $2,691.3
New Jersey $3,636.5 $3,502.2 $619.4 $203.6 $7,961.6
New York $17,956.6 $5,434.9 $3,619.7 $126.2 $27,137.3
North Carolina $3,043.9 $4,907.5 $1,734.1 $369.7 $10,055.2
Ohio $3,172.1 $7,449.7 $1,695.0 $282.2 $12,599.0
Oklahoma $714.8 $1,917.2 $1,457.9 $22.3 $4,112.1
Oregon $674.2 $958.2 $1,097.3 $55.6 $2,785.3
Pennsylvania $3,950.8 $4,542.2 $2,604.6 $281.8 $11,379.3
Puerto Rico $823.6 $1,109.4 $603.3 $1.2 $2,537.5
South Carolina $295.4 $806.1 $510.6 $16.2 $1,628.3
Tennessee $555.8 $2,224.9 $738.1 $28.8 $3,547.6
Texas $7,614.8 $13,376.3 $5,091.9 $47.7 $26,130.8
Virginia $2,474.4 $2,216.5 $1,279.4 $91.7 $6,061.9
Washington $2,686.7 $4,586.7 $2,366.6 $116.1 $9,756.0
Wisconsin $1,299.2 $3,074.9 $1,328.4 $483.5 $6,186.0
Partially Surveyed States* $1,664.1 $8,537.0 $6,686.7 $304.5 $17,192.4
Subtotal $116,139.0 $144,574.7 $59,209.6 $4,068.2 $323,991.4 American Samoa $0.0 $59.5 $33.3 $0.0 $92.8
Guam $203.1 $60.8 $0.0 $0.0 $263.9
Commonwealth of the Northern Mariana Islands
$0.0 $158.6 $130.6 $0.0 $289.3
U.S. Virgin Islands $0.0 $197.4 $55.9 $0.0 $253.3
Subtotal $203.1 $476.4 $219.9 $0.0 $899.4 Total State Need $116,342.1 $145,051.1 $59,429.5 $4,068.2 $324,890.8

2007 Drinking Water Infrastructure Needs Survey and Assessment
20
Exhibit 2.3: Overview of 20-Year Need by State
20-year need in billions of January 2007 dollars
Less than $1.0
$1.0 - $2.9
$3.0 - $10.0
More than $10.0
Puerto Rico
U.S. Virgin Islands
American Samoa
Guam
Commonwealth of the Northern Mariana Islands
- Does not include needs for American Indian and Alaskan Native Village water systems.- The needs for American Samoa, Guam, the Commonwealth of the Northern Mariana Islands, and the U.S. Virgin Islands are less than
* The list of the 14 partially surveyed states can be seen in Exhibit 2.4.
Partially surveyed states*
$1 billion each.
District ofColumbia

Findings - State Need
States that received the minimum DWSRF allotment of 1 percent in the most recent allocation were given the option of surveying only the large systems in their state, and not collecting data for medium-sized systems. (Small system data were collected by EPA.) Th is option was provided to reduce the burden on these states and allow for resources to be focused on the large systems. Of the 24 states (including Washington, D.C. and Puerto Rico) that received the minimum allocation based on the 2003 DWINSA fi ndings, 14 chose this “partially surveyed” option. For these states, the medium system need was estimated based on data from fully surveyed states. Because this method does not meet the Assessment’s stringent data quality objectives at the state level, the needs of these states contribute to the estimate of the total national need but are not reported individually by state. Exhibit 2.4 shows the large and small system need estimated by state, and the total medium system need for the partially surveyed states.
More of the need of the partially surveyed states is for small and medium systems than among the rest of the nation. Large system need makes up a relatively small share of the total among partially surveyed states because these states generally do not have as many systems serving more than 100,000 persons as other states.
21
Exhibit 2.4: State 20-Year Need Reported for Partially Surveyed States (in millions of January 2007 dollars)
Large Medium Small State NPNCWSs
CWSs CWSs CWSs Delaware $22.0 $258.0 $3.2
Hawaii $30.1 $160.0 $1.0
Idaho $114.2 $738.5 $37.7
Maine $63.1 $442.2 $34.5
Montana $83.6 $687.6 $50.7
New Hampshire $98.7 $686.6 $61.9
New Mexico $230.0 $687.5 $15.4
North Dakota $0.0 $401.3 $5.3
Rhode Island $342.3 $70.0 $16.1
South Dakota $72.0 $462.9 $5.1
Utah $517.7 $490.7 $13.0
Vermont $0.0 $453.0 $0.2
West Virginia $90.4 $860.9 $48.2
Wyoming $0.0 $287.4 $12.2
Total Partially Surveyed $1,664.1 $8,537.0 $6,686.7 $304.5
State Need
2007 Drinking Water Infrastructure Needs Survey and Assessment
Changes in State-Specific Need through Assessment Cycles
As shown in Exhibit 2.5, the state-specifi c results of the 2007 Assessment, when compared to previous Assessments, show that states’ needs change, and some change more signifi cantly than others during the 4-year intervals between Assessments. Changes in relative needs of states from one Assessment to the next can be attributed to two primary factors:
• Changes in Projects Planned, Initiated, and Completed. Congress specifi ed that the DWINSA be repeated at 4-year intervals to capture changes in system infrastructure needs. Changes in the reported needs of individual systems from one survey period to the next can have a signifi cant effect on the overall state need. For instance, in one Assessment a state may have a large system that has identifi ed a project with very substantial costs. During that Assessment cycle, that state’s need may be increased due to this large project. However, if construction of this project begins prior to the next Assessment cycle, those needs would no longer be included, and this state’s need may be lower. In addition, conditions within a state may change dramatically over a 4-year period and have an impact on that state’s need. For example, Louisiana’s needs increased substantially from 2003 to 2007 to address the post-Hurricane Katrina infrastructure needs of water systems in New Orleans and the surrounding area.
• Changes in National and State Assessment Approaches. State-specifi c needs will be affected by how the Assessment has evolved since the first Assessment was conducted in 1995. The Assessment’s “bottom-up” approach of submitting and accepting documented needs on a project-by-project basis for each individually sampled system has remained essentially unchanged. However, signifi cant
changes that can have an impact on individual states needs have been implemented regarding the parties responsible for data collection, the type of documentation required to support acceptance of an identified need, and policies and approaches implemented to ensure complete and quality data collection by the states. The 2003 Assessment provided flexibility to the states and water systems regarding approaches for estimating longer term rehabilitation and replacement needs. States not only used different assumptions for estimating those needs but also invested different levels of effort into conducting the Assessment. The 2007 Assessment put considerable emphasis on gaining consistency across all states and water systems in both the means and the level of effort for these estimations. Th is was done through the establishment of well-defi ned policies on project documentation requirements and mechanisms to track each state’s progress in achieving a complete assessment of needs. The policies and mechanisms are described in Appendix C. The impact of the policies varied by state, depending on their approach to the previous Assessment.
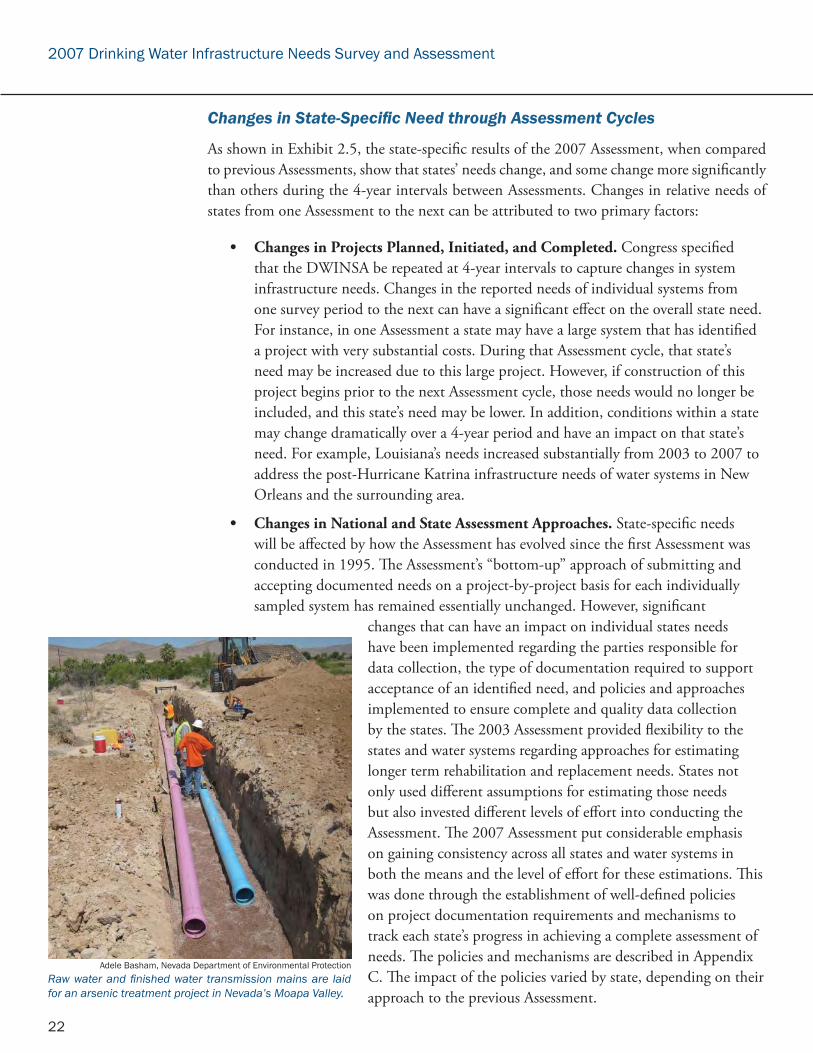
Adele Basham, Nevada Department of Environmental Protection
Raw water and finished water transmission mains are laid for an arsenic treatment project in Nevada’s Moapa Valley.
22

Findings - State Need
Exhibit 2.5: Historic State Need Reported for Each DWINSA (20-year need in millions of January 2007 dollars)
State 1995 1999 2003 2007 State 1995 1999 2003 2007
Alabama $2,402.1 $1,419.6 $2,022.2 $4,099.4 New Jersey $5,230.9 $4,805.3 $8,280.6 $7,961.6
Alaska $1,116.5 $768.6 $816.0 $812.4 New Mexico $1,509.5 $1,368.4 $1,104.3 *
Arizona $1,959.8 $2,130.8 $10,920.0 $7,410.7 New York $14,596.7 $17,277.3 $17,736.3 $27,137.3
Arkansas $2,930.9 $2,014.7 $4,237.2 $5,278.5 North Carolina $3,929.3 $3,555.4 $13,147.5 $10,055.2
California $27,237.6 $22,969.0 $33,372.9 $39,046.3 North Dakota $849.7 $643.3 $726.6 *
Colorado $2,821.8 $3,323.3 $6,374.3 $6,400.1 Ohio $7,103.0 $6,512.8 $11,595.6 $12,599.0
Connecticut $1,964.1 $1,322.1 $782.0 $1,394.0 Oklahoma $2,940.9 $3,074.2 $5,752.4 $4,112.1
Delaware $538.0 $399.3 $288.4 * Oregon $3,110.0 $3,557.9 $5,110.0 $2,785.3
District of Columbia
$190.5 $543.8 $178.9 $874.2 Pennsylvania $6,885.4 $6,905.8 $13,159.6 $11,379.3
Florida $6,276.3 $4,891.3 $18,009.5 $12,823.1 Puerto Rico $3,263.2 $2,589.7 $2,728.6 $2,537.5
Georgia $4,770.0 $3,160.4 $10,797.5 $8,937.7 Rhode Island $950.7 $757.9 $482.1 *
Hawaii $623.8 $192.6 $972.9 * South Carolina $2,114.8 $1,077.6 $1,491.5 $1,628.3
Idaho $854.5 $677.6 $870.4 * South Dakota $823.3 $577.5 $1,185.2 *
Illinois $7,744.9 $8,076.4 $16,160.9 $15,017.1 Tennessee $2,709.0 $1,851.9 $3,317.3 $3,547.6
Indiana $2,424.5 $2,224.2 $4,827.7 $5,944.4 Texas $17,900.6 $17,161.7 $33,729.8 $26,130.8
Iowa $3,265.9 $3,738.6 $4,195.5 $6,113.1 Utah $1,513.5 $674.9 $846.4 *
Kansas $2,861.4 $2,161.6 $2,312.1 $4,030.2 Vermont $664.9 $403.1 $472.7 *
Kentucky $3,220.0 $2,323.7 $3,363.2 $4,978.1 Virginia $4,262.0 $2,699.4 $3,430.6 $6,061.9
Louisiana $2,828.1 $1,671.7 $4,917.4 $6,900.1 Washington $5,835.5 $5,184.2 $7,988.6 $9,756.0
Maine $1,253.0 $654.8 $996.0 * West Virginia $1,578.3 $1,339.6 $1,032.1 *
Maryland $1,859.9 $2,194.6 $4,745.5 $5,443.4 Wisconsin $2,703.2 $4,068.7 $7,110.2 $6,186.0
Massachusetts $8,606.9 $7,717.7 $10,243.3 $6,790.0 Wyoming $565.6 $580.8 $357.0 *
Michigan $6,423.3 $8,915.4 $13,543.7 $11,842.8 Partial Participation States*
* * * $17,192.4
Minnesota $3,529.0 $4,070.6 $6,538.3 $5,988.4 Subtotal $197,882.0 $182,564.5 $315,746.0 323,991.4
Mississippi $2,281.8 $1,787.1 $1,969.1 $3,243.3 American Samoa $32.5 $47.8 $38.7 $92.8
Missouri $2,720.1 $2,862.8 $7,134.3 $7,085.6 Guam $154.5 $150.6 $334.0 $263.9
Montana $959.3 $1,145.1 $945.1 * Commonwealth of the North Mariana Islands
$50.7 $98.3 $236.9 $289.3
Nebraska $1,379.5 $1,092.8 $1,621.3 $1,776.6 U.S. Virgin Islands $323.0 $212.3 $216.0 $253.3
Nevada $759.9 $791.2 $1,092.2 $2,691.3 Subtotal $560.7 $508.9 $825.6 $899.4
New Hampshire $1,038.0 $655.9 $713.2 * Total $198,442.7 $183,073.4 $316,571.6 $324,890.8
* For the 2007 DWINSA the need for partially surveyed states that opted out of the medium system portion of the survey is presented cumulatively and not by state.
23

2007 Drinking Water Infrastructure Needs Survey and Assessment
24
Continuing Evolution of the DWINSA
Each DWINSA’s approach, policies, and guidelines infl uenced the total national need and individual state needs reported for that eff ort. In all cases, specifi c project documentation requirements and data quality objectives were set by a workgroup of state and EPA stakeholders and maintained by EPA. If the 2003 Assessment represented a success in better capturing longer term needs than the 1995 and 1999 eff orts, the 2007 Assessment’s achievement was in helping guide states toward a more consistent methodology in assessing those types of needs. EPA believes the development and implementation of the more refi ned and specifi c project allowability policies (further outlined in Appendix C) resulted in the 2007 Assessment representing the most thoroughly planned and comprehensive of the four Assessments conducted.
EPA’s quadrennial Assessment will continue to evolve, with each cycle providing valuable input as to how the next Assessment can be improved. In addition, it is anticipated that challenges which may not have been signifi cant in previous Assessments will arise and aff ect water utilities. EPA will work with the states to improve each survey while maintaining the integrity of the Assessment.
One objective of the 2007 Assessment was to improve the consistency of needs estimates across states and water systems. Th ese project estimates rely heavily on required supporting documentation. Based on the documentation provided, many water systems are using asset management strategies to better understand their longer term infrastructure investment needs and to implement more decisive and compelling planning. Th is planning helps achieve the necessary support from rate adequate fi nancial support to adof systems there remains a signitheir knowledge of that infrastrAssessment, EPA will workwith the states to examinehow the exercise can not only capture an updated status of asset planning by water systems but also further the adoption of such planning.
payers, investors, and local and state governments to gain dress these needs. However, it is also clear that for a number fi cant gap between identifying their inventory of assets and ucture’s condition or remaining useful life. For the 2011
Sarah Hudson, Indiana DWSRF
The City of Fort Wayne, Indiana constructed a new pump building to remedy poor pumping confi gurations, allowing storage facilities to be more fully used.

Key Observations on Each Assessment’s Approach
1995
For the first survey, conducted in 1995, the DWSRF was not yet in existence and EPA worked directly with many utilities to complete the survey with limited involvement from the states. A state/EPA workgroup helped plan and design the Assessment. Some states participated in data collection; however, many were unable to invest resources beyond encouraging system cooperation. In addition, the 1995 Assessment included needs for raw water dams and reservoirs, projects that were later determined to be DWSRF-ineligible for future Assessments. (Note – while needs for dams and reservoirs were included in 1995 Assessment, these needs were removed in the calculation for the 1998 through 2001 DWSRF allotments.)
1999
For the 1999 Assessment, the federal DWSRF program had been established and project-eligibility criteria were defined that specifically excluded raw water dams and reservoirs. Therefore these infrastructure needs were not included in the 1999 Assessment. The DWINSA workgroup established Assessment policies regarding water meters, backflow-prevention devices, and service lines. Although these needs were considered allowable for the Assessment, constraints were placed on documentation of ownership and whether projects for their replacement could be included. New to the 1999 Assessment was the inclusion of the need of not-for-profit noncommunity water systems. Also, state programs were expected to participate in data collection for this Assessment.
2003
Refinements made to the survey instrument in 2003 encouraged systems and states to think more broadly about systems’ existing infrastructure condition and deficiencies, particularly in regard to long-term needs for replacing or rehabilitating their existing infrastructure assets. Considerable effort was invested in promoting a comprehensive approach to inventorying existing assets and estimating the needs for likely rehabilitation or replacement over the next 20 years. EPA provided flexibility to surveyed water systems and their states to forecast these longer term needs. In the 2003 Assessment, states and systems responded with varying means of determining asset inventories and with different assumptions about the life cycles of those assets (e.g., estimates of when buried pipe would need to be replaced or rehabilitated). In addition, the workgroup amended policies regarding the replacement of water meters as an allowable need. In 1999, meter replacements were allowed only if documentation was provided indicating that the system owned the meter. In 2003, documentation of ownership was not required. These changes resulted in a significant increase in the total national need and an increase in most states’ individual state needs. EPA’s objective to better capture the true 20-year need was met, but the states and EPA agreed that a more consistent methodology should be pursued in the next Assessment effort.
2007
In planning for the 2007 Assessment, EPA and the states came to a consensus that more consistency was needed across the states in regard to both methods for determining needs and each state’s approach to capturing those needs. Building on the methods and approaches used by the states in the 2003 effort, consensus was reached on consistent policies regarding replacement and rehabilitation assumptions and documentation requirements to support survey-allowable projects. EPA’s quality assurance reviews included significant efforts to ensure the policies were followed by all states.

Exhibit 2.6: 20-Year Need Reported by U.S. Territories
Territory Total Need*
American Samoa $92.8
Guam $263.9
Commonwealth of the Northern Mariana Islands
$289.3
U.S. Virgin Islands $253.3
Unique Needs of Water Systems in U.S. Territories
Under SDWA §1452(a)(1)(D)(ii), Congress allocates 0.33 percent of DWSRF monies to the U.S. Territories (e.g., American Samoa, the Commonwealth of the Northern Mariana Islands, Guam, and the U.S. Virgin Islands) to be used as grants for water systems. For the 2007 Assessment, EPA mailed questionnaires to all large systems and to a probability sample of medium-sized systems in the U.S. Territories to assess the needs of water systems on these islands.
The Assessment data showed that water systems in the territories face unique challenges in providing safe drinking water to their citizens. While drinking water issues can vary from island to island, the overall challenges for all of the U.S. Territories include:
• Rapidly Deteriorating Infrastructure. In many island climates, corrosive soils and years of delivering previously untreated water have contributed to a prematurely deteriorated distribution system. Inadequate storage and lack of redundancy in the water systems make it difficult to take infrastructure off line for required maintenance or replacement.
• Seasonal, Transient Customers. A high volume of tourists creates considerable fl uctuations in seasonal water demand that are difficult to design for. Cruise ships and other forms of tourism present huge peak demands on water systems already working at capacity.
• Limited Source Options. The ability to serve existing homes as well as a growing population is limited by a lack of quality sources of water. The islands’ water supplies are dependent upon limited fresh water sources, ground water aquifers which are susceptible to contamination, and the use of rainwater catchments.
• Ground Water Contamination. Aquifer contamination from waste and sediment runoff, on-site wastewater treatment systems, illegal dumping, and salt water intrusion threatens the quality and quantity of water pumped from aquifers.
*20-year need in millions of January 2007 dollars.
U.S. Virgin Islands
Due to limited ground water supply and aging infrastructure, the U.S. Virgin Islands, including the islands of St. Croix, St. John, and St. Thomas, face current and future water shortages. On St. Croix many homes have requested new water service from the island’s single municipal water system, but their requests cannot be met due to inadequate supply and the lack of piping to connect them to the system. Approximately 85 percent of St. Croix’s pipe is ductile iron. Much of this pipe was installed over 50 years ago, has corroded, and must be replaced. In addition, desalinization plants on all three islands must be replaced because many have been in operation for over 20 years (well beyond manufacturer recommendations) and are in disrepair due to age and little or no maintenance. Fluctuations in demand from seasonal, transient customers on cruise ships also significantly strain undersized water treatment facilities on St. John and St. Thomas. Demand for water on St. John fluctuates from 100,000 gallons per day during the low-demand season to over 300,000 gallons per day when demand is high. This situation leads to operational problems and water shortages.

American Samoa
EPA has estimated that up to 50 percent of the population of American Samoa lacks safe drinking water. This shortage is due, in part, to ground water contamination which is becoming a concern because the main aquifer lies beneath the fastest growing area in the territory, the Tafuna Plains. In addition to the strain on the aquifer from increased withdrawals, population development has resulted in increasing human and animal pollution. Already 17 percent of residents tested positive for leptospirosis, a potentially deadly waterborne disease associated with animal waste. Contributing further to the problem, the vegetative buffer mitigating the amount of pollutants reaching the ground water is decreasing with the increase in building construction.
Commonwealth of the Northern Mariana Islands (CNMI)
The Commonwealth Utility Corporation in Saipan, the largest island in CNMI, is unable to provide 24-hour water service to over 40 percent of its customers because of the inadequate number and poor condition of its water sources, coupled with system leakage caused by extremely old and dilapidated infrastructure. Many water system facilities, including transmission and distribution mains and storage tanks, pre-date World War II and require replacement. Salt water intrusion threatens the quality of ground water sources and is a serious issue on Saipan, where it has led to exceedingly high salinity levels in the drinking water. Due to the high salinity of the water, most residents drink bottled water.
Guam
Guam faces significant challenges posed by pollutants entering drinking water sources both from unmanaged sewage, including many unsewered areas with individual on-site systems only, and from problems associated with erosion and runoff. The sole source limestone/karstic aquifer that serves most of Guam is highly susceptible to surface contamination and, based on further study, may be designated as ground water under the direct influence of surface water. Guam’s water system also suffers from general dilapidation of infrastructure.
Barry Pollock, EPA Region 9
In 2005, the catastrophic failure of a 1 million gallon storage tank in Guam (left) damaged two neighboring tanks, knocking one of them out of service (right) and reducing the system’s storage capacity by 25 percent.

2007 Drinking Water Infrastructure Needs Survey and Assessment
EPA Region 9
A water tank level gauge displays the water level in the tank using a floating buoy to move the gauge. This tank has 19 feet of water in it and can hold up to 24 feet.
28

Charles Pycha, EPA Region 5
Construction of a microfiltration treatment plant in Mankato, Minnesota. This project was funded by the DWSRF.
Appendix A - Survey Methods
The 20-year period captured by the 2007 Drinking Water Needs Survey and Assessment (DWINSA) runs from January 1, 2007, through December 31, 2026. The Assessment is based on a survey of approximately 3,250 community water systems and an adjustment of findings from previous surveys for the needs of not-forprofit noncommunity water systems and water systems serving American Indian communities and Alaskan Native Villages. Except where noted, the statistical and survey methodologies of the 2007 Assessment are identical to those used in the 1995, 1999, and 2003 Assessments. The most significant change is related to the survey of medium systems, which is described in more detail later in this Appendix.
U.S. Environmental Protection Agency (EPA), with input from a workgroup of state representatives, developed the methods for the 2007 Assessment. The questionnaire used in the 2007 Assessment was essentially the same as the 2003 Assessment questionnaire. However, the workgroup revised some of the project documentation policies and data collection procedures in order to ensure that a more comprehensive and consistent approach was applied by all of the states (see Appendix C for additional information on documentation requirements.)
Assessing the Needs of Water Systems in States and U.S. Territories
The 1996 Safe Drinking Water Act (SDWA) Amendments direct EPA to assess the needs of water systems and to use the results of the quadrennial Assessment to allocate Drinking Water State Revolving Fund (DWSRF) monies. The DWSRF monies are allocated based on each state’s share of the total state need with a minimum of 1 percent of the state allotment guaranteed to each state, Puerto Rico, and the District of Columbia. Th e need represents all community water systems as well as not-for-profit noncommunity systems in the states, Puerto Rico, and the District of Columbia. The results of the Assessment are also used to allocate the 0.33 percent of the DWSRF appropriation designated for the U.S. Territories. Therefore, the Assessment was designed to generate separate estimates of need for the U.S. Virgin Islands and the Pacific island territories (Guam, American Samoa, and the Commonwealth of the Northern Mariana Islands).
29

2007 Drinking Water Infrastructure Needs Survey and Assessment
Frame
Th e frame is a list of all members (sampling units) of a population from which a sample will be drawn for a survey. For this Assessment, the frame consisted of all community water systems in each state, Puerto Rico, the District of Columbia, and the U.S. Territories. To ensure that the survey accounted for all community water systems in the nation, the universe of water systems was obtained from the federal Safe Drinking Water Information System (SDWIS-FED). SDWISFED is EPA’s centralized database of public water systems. It includes the inventory of all public water systems and provides information regarding population served and whether a system uses ground water, surface water, or both.
Each state was asked to review the frame and verify or correct all information on each system’s source water type and population served. EPA used this updated information to create a database of the universe of community water systems. A sample of systems was then selected from this updated frame.
ham, Nevada Department of Environmental Protection Adele Bas
These substandard tanks (towere replaced with a new tanzero percent interest loan.
) at the Three T Water system in Nevada k (bottom) using a DWSRF disadvantaged
p Because there are thousands of water systems in the nation, EPA must rely on a random sampling of the systems identified in the frame. EP A set a precision
target of ± 10 percent with 95 percent confidence. To meet this target, all large systems were surveyed, a random sample of medium systems was selected in each fully surveyed state, and a national random sample of small systems was selected.
Stratifi ed Sample
To determine state need, water systems are grouped (stratified) b y size (population served) and by source (surface or ground water). Exhibit A.1 shows the possible population and source water strata.
For the purposes of assigning a population to each system, consecutive populations are included in the system population because of the assumption that, in general, critical infrastructure of the selling-system would need to be sized to accommodate the demand of the population directly served by the system and the consecutive population.
Systems are categorized as surface water if they have at least one source that is surface water or ground water under the direct influence of sur face water (GWUDI). Systems are categorized as ground water if they do not have a surface water or GWUDI source.
30
The gr ound water

Appendix A - Survey Methods
category includes ground water systems and systems that do not have a source of their own and purchase finished water from another system (regardless of whether the purchased water comes from a surface water or ground water source). The decision to include purchased water systems in the ground water systems category was based on the 1995 Assessment’s fi ndings that, in general, indicated the needs of purchased water systems more closely resemble those of ground water systems than of surface water systems with source water treatment.
Conducting the Survey of Large Systems
For the 2007 Assessment, a large system is defined as serving more than 100,000 persons, either through direct connections or as a wholesale water system. Because of the unique nature of systems in this size category and because they represent a large portion of the nation’s need, these systems are sampled with certainty, meaning that all systems receive a questionnaire. In the previous Assessments (1995, 1999, 2003), the large system category was defined as systems serving populations of more than 40,000 or 50,000. Th e 2007 Assessment set this category at a higher threshold to reduce costs and burden on the states. The overall precision targets were still met. Systems serving 50,000 to 100,000 persons were included in the approach for medium systems.
Exhibit A.1: Community Water System Stratification for the 2007 Assessment
Population Surface Water Ground Water
Large > 100,000
Medium
50,001 - 100,000
25,001 - 50,000 or 10,001 - 50,000*
10,001 - 25,000
3,301 - 10,000
Small
501 - 3,300
101 - 500
< 100
*In some states, systems serving 10,001 - 50,000 can be considered one stratum and precision targets can be met. The most efficient sample is drawn from each state.
Sampled with certainty - All systems receive
questionnaire
State-specific samples for
participating states
National sample for
small systems
31

2007 Drinking Water Infrastructure Needs Survey and Assessment
Exhibit A.2: Medium and Large Community Water System Sample Size
State
Total Number of Systems in Inventory Number of Systems Selected in Sample
Population Served Population Served
3,301 - 100,000
> 100,000 Total 3,301 -
100,000 > 100,000 Total
Alabama 336 18 354 131 18 149
Alaska 17 1 18 14 1 15
Arizona 117 10 127 22 10 32
Arkansas 171 3 174 93 3 96
California 562 114 676 93 114 207
Colorado 147 12 159 33 12 45
Connecticut 52 7 59 43 7 50
Delaware 23 3 26 - 3 3
District of Columbia - 1 1 - 1 1
Florida 338 44 382 75 44 119
Georgia 202 16 218 48 16 64
Hawaii 28 2 30 - 2 2
Idaho 44 1 45 - 1 1
Illinois 443 19 462 76 19 95
Indiana 200 13 213 98 13 111
Iowa 132 3 135 44 3 47
Kansas 113 6 119 39 6 45
Kentucky 259 7 266 107 7 114
Louisiana 216 8 224 91 8 99
Maine 34 1 35 - 1 1
Maryland 50 5 55 21 5 26
Massachusetts 226 12 238 52 12 64
Michigan 292 14 306 51 14 65
Minnesota 158 2 160 63 2 65
Mississippi 195 2 197 164 2 166
Missouri 201 6 207 84 6 90
Montana 33 1 34 - 1 1
Nebraska 42 2 44 22 2 24
Nevada 31 5 36 10 5 15
New Hampshire 35 2 37 - 2 2
Each large system was asked to complete the questionnaire and return it along with accompanying documentation to its state coordinator. The state coordinators reviewed the questionnaires to ensure that the systems included all their needs, the information entered on the questionnaire was correct, and the projects were eligible for DWSRF funding. During their state reviews, states often contacted systems to obtain additional information. Th e states then submitted the questionnaire and all documentation to EPA for a fi nal review.
Of the 584 large systems that received a survey for the 2007 Assessment, 570 completed the questionnaire—a response rate of 97 percent. Exhibit A.2 shows the number of large systems in the frame as well as the sample size for each state.
32
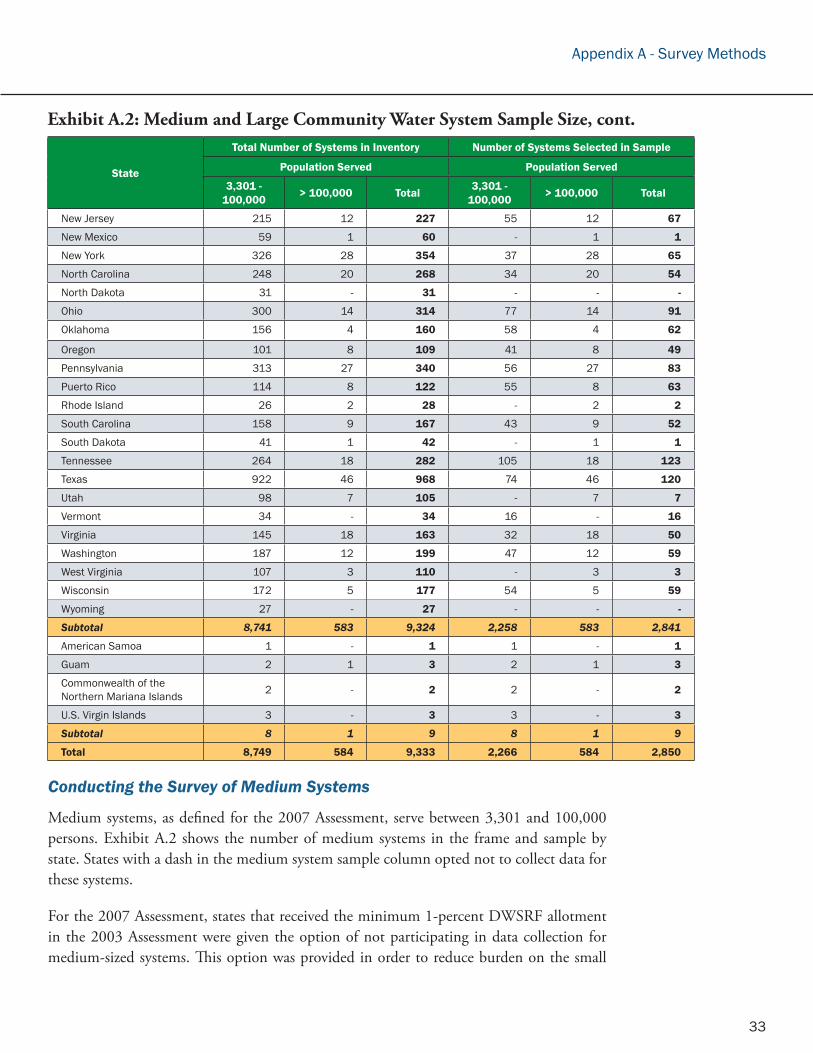
Wyoming 27 - 27 - - -
Subtotal 8,741 583 9,324 2,258 583 2,841
American Samoa 1 - 1 1 - 1
Guam 2 1 3 2 1 3
Commonwealth of the Northern Mariana Islands
2 - 2 2 - 2
U.S. Virgin Islands 3 - 3 3 - 3
Subtotal 8 1 9 8 1 9
Total 8,749 584 9,333 2,266 584 2,850
Exhibit A.2: Medium and Large Community Water System Sample Size, cont.
State
Total Number of Systems in Inventory Number of Systems Selected in Sample
Population Served Population Served
3,301 - 100,000
> 100,000 Total 3,301 -
100,000 > 100,000 Total
New Jersey 215 12 227 55 12 67
New Mexico 59 1 60 - 1 1
New York 326 28 354 37 28 65
North Carolina 248 20 268 34 20 54
North Dakota 31 - 31 - - -
Ohio 300 14 314 77 14 91
Oklahoma 156 4 160 58 4 62
Oregon 101 8 109 41 8 49
Pennsylvania 313 27 340 56 27 83
Puerto Rico 114 8 122 55 8 63
Rhode Island 26 2 28 - 2 2
South Carolina 158 9 167 43 9 52
South Dakota 41 1 42 - 1 1
Tennessee 264 18 282 105 18 123
Texas 922 46 968 74 46 120
Utah 98 7 105 - 7 7
Vermont 34 - 34 16 - 16
Virginia 145 18 163 32 18 50
Washington 187 12 199 47 12 59
West Virginia 107 3 110 - 3 3
Wisconsin 172 5 177 54 5 59
Appendix A - Survey Methods
Conducting the Survey of Medium Systems
Medium systems, as defined for the 2007 Assessment, serve between 3,301 and 100,000 persons. Exhibit A.2 shows the number of medium systems in the frame and sample by state. States with a dash in the medium system sample column opted not to collect data for these systems.
For the 2007 Assessment, states that received the minimum 1-percent DWSRF allotment in the 2003 Assessment were given the option of not participating in data collection for medium-sized systems. This option was provided in order to reduce burden on the small
33

Exhibit A.3: Small Community Water System Sample Size
Total Number Number of of Systems in Systems in
Inventory Selected Sample
Systems Serving 3,300 or Fewer 41,748 Persons
2007 Drinking Water Infrastructure Needs Survey and Assessment
states that receive the same allotment regardless of the findings of the survey. Of the minimum allocation states, 14 chose not to participate in this portion of the survey. Th e medium system need for states that chose this option was estimated based on data from participating states. Because this method does not meet the Assessment’s formal precision targets at the state level, the needs of these partially surveyed states contribute to the estimate of the total national need, but medium system need is not reported individually by state.
For states that participated in the medium system portion of the survey, the data collection process was similar to that of large systems with the system completing the survey, the state providing input, and the final review conducted by EPA.
Once the need for systems in the fully surveyed states was calculated, it was used to determine the need for the partially surveyed states. An average need per stratum from fully surveyed states was calculated and applied to the inventory of systems in the partially surveyed states.
Of the 2,266 medium systems that were randomly selected and received a survey, 2,082 completed the questionnaire for a response rate of 92 percent.
Conducting the Survey of Small Systems
Exhibit A.3 shows the total inventory and sample size for the national sample of small systems. Small systems, as defined for the 2007 Assessment, serve 3,300 or fewer persons. Because small systems often lack the resources to complete information collection requests and do not always have the resources to produce longer term planning documents, EPA does not ask these systems to complete a questionnaire. Instead, EPA collects the data by sending qualified, trained professionals to interview system personnel and document project needs. This process was used for small systems in the 1995 and 1999 Assessments as well as the 2007 Assessment. In 2003, in an effort to reduce costs, EPA used the 1999 need estimates adjusted to 2003 dollars.
For the small system survey, a national sample of 600 systems was selected to represent the national need of the 41,748 small systems. To select this sample, EPA used two-stage probability proportional-to-size sampling (PPS) with six strata. Systems were stratifi ed based on population served (i.e., less than or equal to 100, 101 to 500, and 501 to 3,300 persons)
34
600

Appendix A - Survey Methods
and source water type (i.e., ground or surface water.) Systems were grouped by county or clusters of counties. In the first stage, a random sample of counties or cluster of counties were selected. The probability that a county or county cluster was selected was proportional to the number of small systems in each stratum in the county or county cluster. In the second stage, five systems were selected randomly from each county or county cluster. Th is approach minimized travel and expenses for site visits. A total of 600 systems were selected.
Needs data from the 600 small systems were collected by EPA contractors. To ensure that the data collected were as accurate as possible, EPA contracted with water industry professionals, including engineers, operators, and state primacy agency experts, to complete the small system surveys. These site visitors participated in a 2-day training session on the Assessment methodology and were trained to assess the current condition of a small water system and to estimate its 20-year needs.
Since trained and qualified contractors completed the surveys on-site with the system representatives, there was a high confidence in the surveys. The surveys were submitted directly to EPA for review rather than first going through a state representative. After data collection, the needs of small systems were assigned to each state by multiplying the average need per stratum by the number of small systems in that stratum (from the inventory of small systems in each state). It is important to note that conducting a field survey in this manner allows for consistent estimation of project needs across all surveyed systems.
System Weight
As in the previous efforts, the 2007 Assessment assigned weights to the findings from each surveyed water system to determine total state needs. Because all large systems are included in the survey, each large system has a weight of 1. The state need for large systems was determined by summing the cost of each project for each system and then summing the need for each large system in the state. Systems were not re-weighted for nonresponse.
For medium systems, EPA determined the number of water systems that must be included in each stratum in order to achieve the desired level of precision. Th e surveyed systems were selected and assigned an initial weight for their specific state equal to the total number
EPA Region 9
35

2007 Drinking Water Infrastructure Needs Survey and Assessment
of systems in that stratum divided by the number of systems in that stratum’s sample. A final weight was recalculated for each stratum with adjustments for non-response and systems changing stratum (population or source changes). Each fully surveyed state’s need for medium systems was determined by summing the cost of each project for each system, and then multiplying each system’s need by the system’s fi nal weight.
The number of medium sized water systems selected from each stratum was determined by the total number of systems in that stratum (shown in Exhibit A.1), the percentage of that state’s need represented by that stratum in the most recent Assessment, and the relative variance of the need within that stratum in the most recent Assessment. Th e sample is allocated among the strata in a manner that lets the survey achieve the desired level of precision with the smallest sample size for each state.
Small system weighting was conducted in a manner similar to the medium systems, but was assigned on a national scale rather than a state-level scale. The small system national need is determined by summing the cost of each project for each system and then multiplying each system’s need by the system’s final weight. The small system state need was estimated by determining the average system need for a stratum and multiplying the average by the number of small systems a given state has in that stratum.
In compliance with the Paperwork Reduction Act (PRA) (44U.S.C. 3501 et seq.), the survey design and instrument were reviewed and approved by the Office of Management and Budget (OMB). The Information Collection Request (ICR) for the survey can be accessed in the Federal Register/Vol. 71, No.206/Wednesday, October 25, 2006/Notices p62439.
Assessing the Need of Not-for-Profit Noncommunity Systems
Not-for-profit noncommunity water systems (NPNCWS) are eligible for DWSRF funding. The 2007 need for NPNCWSs was based on the findings of the 1999 Assessment in which a statistical survey of these systems was conducted. Th ese findings were adjusted to January 2007 dollars using the Construction Cost Index (CCI).
During the 1999 Assessment, EPA collected data from a national sample of 100 NPNCWSs through site visits. Unlike the sampling design for community water systems, the NPNCWS sample was not stratified into size and source categories because EPA lacked the empirical information on variance necessary for developing strata. The sample used for the 1999 Assessment for NPNCWSs was designed to provide a 95 percent confidence interval that is within a range of +/- 30 percent of the estimated need.
36
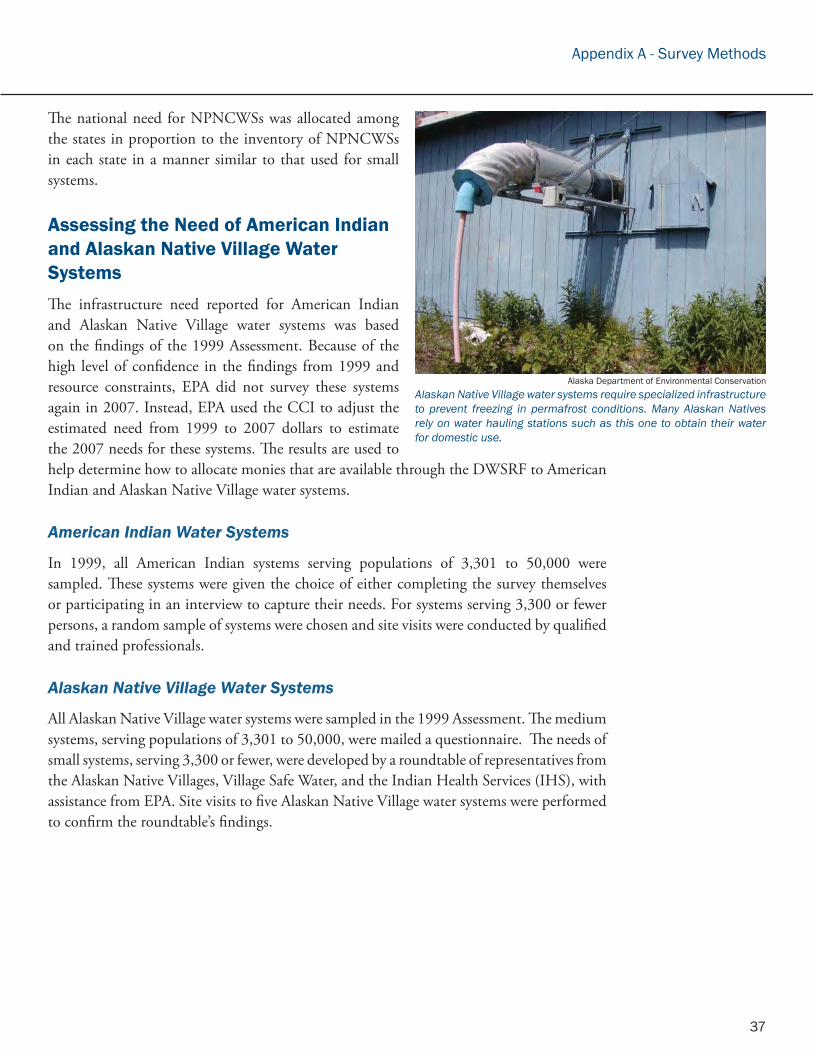
Appendix A - Survey Methods
The national need for NPNCWSs was allocated among the states in proportion to the inventory of NPNCWSs in each state in a manner similar to that used for small systems.
Assessing the Need of American Indian and Alaskan Native Village Water Systems
The infrastructure need reported for American Indian and Alaskan Native Village water systems was based on the findings of the 1999 Assessment. Because of the high level of confidence in the findings from 1999 and resource constraints, EPA did not survey these systems again in 2007. Instead, EPA used the CCI to adjust the estimated need from 1999 to 2007 dollars to estimate the 2007 needs for these systems. The results are used to help determine how to allocate monies that are available through the DWSRF to American Indian and Alaskan Native Village water systems.
American Indian Water Systems
In 1999, all American Indian systems serving populations of 3,301 to 50,000 were sampled. These systems were given the choice of either completing the survey themselves or participating in an interview to capture their needs. For systems serving 3,300 or fewer persons, a random sample of systems were chosen and site visits were conducted by qualifi ed and trained professionals.
Alaskan Native Village Water Systems
All Alaskan Native Village water systems were sampled in the 1999 Assessment. Th e medium systems, serving populations of 3,301 to 50,000, were mailed a questionnaire. The needs of small systems, serving 3,300 or fewer, were developed by a roundtable of representatives from the Alaskan Native Villages, Village Safe Water, and the Indian Health Services (IHS), with assistance from EPA. Site visits to five Alaskan Native Village water systems were performed to confirm the roundtable’s fi ndings.
Alaska Department of Environmental Conservation
Alaskan Native Village water systems require specialized infrastructure to prevent freezing in permafrost conditions. Many Alaskan Natives rely on water hauling stations such as this one to obtain their water for domestic use.
37

2007 Drinking Water Infrastructure Needs Survey and Assessment
38

Appendix B - Data Collection
To determine the scope of water systems’ 20-year need, data are collected in the form of capital improvement projects. States and other agencies work with the surveyed systems to identify applicable projects. To be included in EPA’s Assessments, each project had to meet each of the following four criteria:
• The project must be for a capital improvement.
• The project must be eligible for Drinking Water State Revolving Fund (DWSRF) funding.
• The project must be in furtherance of the public health protection goals of the Safe Drinking Water Act (SDWA).
• The project must be submitted with supporting information that documents the three other criteria are met.
Projects included in the Assessment generally fall into one of two categories that describe the reason for the project:
• Replacement or rehabilitation of existing infrastructure due to age or deterioration.
• New or expanded infrastructure to meet an unmet need for the current population or to comply with an existing regulatory requirement.
Projects for infrastructure generally expected to need rehabilitation or replacement in the 20-year period covered by the Assessment were accepted with minimal documentation describing their scope and the reason for the need. However, other types of projects required independently generated documentation that not only identifi ed the need but also showed clear commitment to the project by the water system’s decision-makers. Exhibit B.1 summarizes the types of projects that were included and the types that were unallowable.
For the purposes of assigning a cost to each need, the survey required that the water system either provide an existing documented cost estimate or the information necessary for EPA to assign a cost. This information was referred to as the “design parameter” and is discussed in more detail in this Appendix.
Survey Instrument
As with previous Assessments, the 2007 questionnaire was the survey instrument for reporting all needs. All large water systems and a random sample of medium systems were mailed a survey package, which included the questionnaire, instructions for completing the
Photo by Robert Barles
39

2007 Drinking Water Infrastructure Needs Survey and Assessment
Exhibit B.1: DWINSA Allowable and Unallowable Projects
DWINSA Allowable Projects
Criteria:
• Eligible for DWSRF funding
• Capital improvement needs
• In furtherance of the public health goals of the SDWA
• Within the Assessment time frame
• Adequate documentation
Project Types:
• New or expanded/upgraded infrastructure to meet the needs of existing customers
• Replacement or rehabilitation of existing undersized or deteriorated infrastructure
DWINSA Unallowable Projects
• Raw water reservoir- or dam-related needs
• Projects needed primarily to serve future population growth
• Projects solely for fi re suppression
• Projects for source water protection
• Non-capital needs (including studies, operation and maintenance)
• Needs not related to furthering the SDWA’s public health objectives
• Acquisition of existing infrastructure
• Projects not the responsibility of the water system
• Needs associated with compliance with proposed or recently promulgated regulations (Derived instead from EPA’s economic analyses and added to the national total)
• Projects or portions of projects started prior to January 1, 2007
• Projects or portions of projects needed after December 31, 2026
questionnaire, and a list of codes used to convert the information to a database format. These documents were also used by the site visitors for recording small system needs.
The instructions provided to the water systems included information on the background and purpose of the Assessment as well as how to identify projects that should be included in the questionnaire. In addition to infrastructure needs, the survey also requested basic information from the water systems such as the size of the population served, the number of service connections, the production capacity, the source water type, and the system’s ownership type. This information was compared to the information used for the sample frame. Discrepancies in source and population were investigated to ensure accurate information was used for the statistical sample.
Project Documentation
Each project listed on the questionnaire was required to have accompanying written documentation of its scope and why it was needed. Written documentation included master plans, capital improvement plans, sanitary survey reports, and other sources of project information. Whether the documentation could be written for the 2007 Assessment or had to be pre-existing depended on the type of project that was described. All documentation for every project was reviewed by EPA to ensure that the project met the allowability criteria for the Assessment. See Appendix C for more information on the project allowability policies.
40
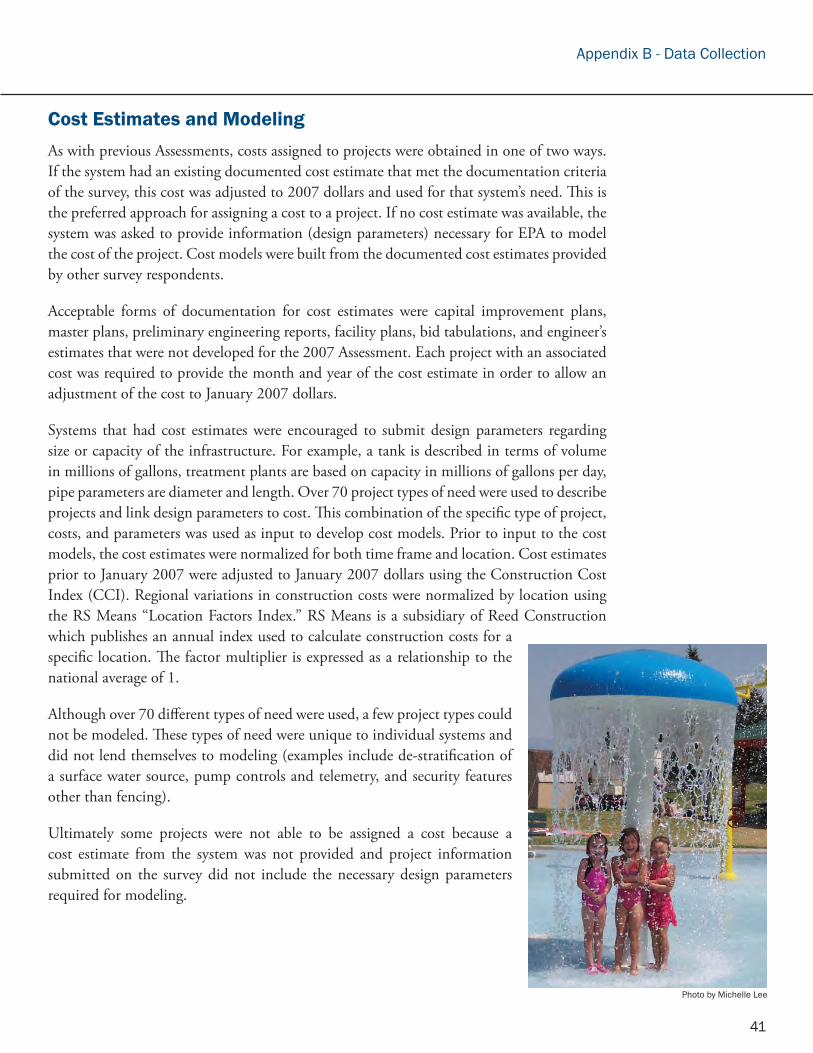
Appendix B - Data Collection
Cost Estimates and Modeling
As with previous Assessments, costs assigned to projects were obtained in one of two ways. If the system had an existing documented cost estimate that met the documentation criteria of the survey, this cost was adjusted to 2007 dollars and used for that system’s need. Th is is the preferred approach for assigning a cost to a project. If no cost estimate was available, the system was asked to provide information (design parameters) necessary for EPA to model the cost of the project. Cost models were built from the documented cost estimates provided by other survey respondents.
Acceptable forms of documentation for cost estimates were capital improvement plans, master plans, preliminary engineering reports, facility plans, bid tabulations, and engineer’s estimates that were not developed for the 2007 Assessment. Each project with an associated cost was required to provide the month and year of the cost estimate in order to allow an adjustment of the cost to January 2007 dollars.
Systems that had cost estimates were encouraged to submit design parameters regarding size or capacity of the infrastructure. For example, a tank is described in terms of volume in millions of gallons, treatment plants are based on capacity in millions of gallons per day, pipe parameters are diameter and length. Over 70 project types of need were used to describe projects and link design parameters to cost. This combination of the specific type of project, costs, and parameters was used as input to develop cost models. Prior to input to the cost models, the cost estimates were normalized for both time frame and location. Cost estimates prior to January 2007 were adjusted to January 2007 dollars using the Construction Cost Index (CCI). Regional variations in construction costs were normalized by location using the RS Means “Location Factors Index.” RS Means is a subsidiary of Reed Construction which publishes an annual index used to calculate construction costs for a specific location. The factor multiplier is expressed as a relationship to the national average of 1.
Although over 70 different types of need were used, a few project types could not be modeled. These types of need were unique to individual systems and did not lend themselves to modeling (examples include de-stratifi cation of a surface water source, pump controls and telemetry, and security features other than fencing).
Ultimately some projects were not able to be assigned a cost because a cost estimate from the system was not provided and project information submitted on the survey did not include the necessary design parameters required for modeling.
Photo by Michelle Lee
41

2007 Drinking Water Infrastructure Needs Survey and Assessment
A screen shot from the DWINSA Web site.
Web Site and Database
EPA used a 2007 surevy-specific Web site to provide an efficient method of tracking and monitoring questionnaire responses for states and Regions. The Web site allowed controlled viewing of survey information and provided a means for states to provide additional project information if needed. Water systems, state contacts, and EPA had secure login access to the Web site. The Web site was a modification of the one used successfully for the 2003 Assessment.
Once logged into the Web site, water systems had access to their own project data, states had access to all project data for the water systems in their state, and EPA regional offices had access to the project data of states within their region. Web site users were given “read only” or “read/write” access depending on whether information posted to the Web site could be changed by that entity. This created a transparent process and open communication between systems, states, and EPA while also maintaining a secure environment so that
persons without reason to see the data did not have access.
The Web site also served as a means of communication between states and EPA. As EPA completed the quality assurance reviews of each questionnaire, the information was uploaded to the Web site database along with specifi c indications of any changes that had been made to the projects and why the changes were implemented.
Each state was able to view all its systems’ projects and submit additional information for projects that had been changed or deemed unallowable through EPA’s quality assurance review.
42
Quality Assurance
As with all three earlier Assessments, the fi ndings of the 2007 Assessment are reinforced by adherence throughout the project to the principles embodied in the EPA Guidelines for Ensuring and Maximizing Information Quality. Th e most fundamental assurance of the high degree of information quality is the implementation of the Agency’s Quality System. EPA implements the system through the development of a quality assurance project plan (QAPP) for each project, which details the specific pr ocedures for quality assurance and quality control.

Appendix B - Data Collection
Because the Agency uses the results of this Assessment to allocate DWSRF capitalization grants to states, this Assessment (like those that preceded it in 1995, 1999, and 2003) sought to maximize the accuracy of the state-level estimates of infrastructure needs. Decisions about precision levels, policies, and procedures were established by a state/EPA workgroup that met regularly during the 2007 Assessment.
Accuracy was maximized at the national, state, system, and project levels through the following steps. First, since this was a sample survey, the workgroup established targets for precision of estimates in the sampling to shape the national sample design. Th ese precision targets are discussed in Appendix A.
Second, EPA used quality assurance procedures from the QAPP to ensure that “eligible infrastructure” was clearly defined and that documentation standards were rigorously enforced. As noted previously, for a project to be included in the 2007 Assessment, systems and states had to submit documentation describing the purpose and scope of each project. The documentation was reviewed by EPA to determine whether each project met the eligibility criteria. The workgroup established the documentation requirements so that uniform criteria were applied to all questionnaires.
Of the 94,852 projects submitted to the survey, EPA accepted 79 percent. The 21 percent that were not allowed failed to meet the documentation criteria or appeared to be ineligible for DWSRF funding. Some projects were adjusted to correct a variety of measurement problems, such as overlaps between two projects (raising the issue of double-counting), inconsistency of recorded data with project documentation, and the use of overly aggressive (short) infrastructure life cycles by states where system planning documents were not used or available.
Third, after the survey review process, the project data were entered into a database using dual data entry procedures to ensure the information was correctly transferred. Th e uploaded data then went through a systematic verification process to identify any outliers or data-entry errors. Each project, the systems’ source water type, total pipe length, population, and number of connections were reviewed for any unusual entries. The data were then compared at the state and national levels to identify any outliers in the data. EPA investigated the outliers by reviewing the system’s project documentation. If the documentation did not provide enough information to verify the project, EPA contacted the state or the system for confi rmation.
43

2007 Drinking Water Infrastructure Needs Survey and Assessment
Photo by Charles Hernick
Windsor Dam at the Quabbin Reservoir in Massachusetts.
44

Jim McRight, North Carolina Department of Environment and Natural Resources
Construction of a pump station at the Neuse Regional Water and Sewer Authority in Kinston, North Carolina. This project was identified in the 2003 Assessment and partially funded by the DWSRF.
Appendix C - Policies
EPA recognizes that it is critical to the credibility of the 2007 Assessment and fairness to the states that EPA work with the DWINSA workgroup to set clear and well-defined data collection policies and for EPA to apply these policies consistently to all systems and states. The policies are aimed at ensuring that the Assessment meets its Congressional intent, maintains the credibility of the findings, and establishes a level playing fi eld for the states. To this end, the policies developed ensure two essential criteria - that only allowable needs be included, and that all needs be adequately documented according to Assessment criteria.
Project Allowability
Because the findings of the Assessment are used to allocate DWSRF monies, only needs associated with DWSRF-eligible projects are included in the findings. Eligibility criteria for the DWSRF are established in the Safe Drinking Water Act. SDWA Section 1452(a)(2) states that DWSRF funds may be used:
“only for expenditures (not including monitoring, operation, and maintenance expenditures) of a type or category which the Administrator has determined, through guidance, will facilitate compliance with national primary drinking water regulations applicable to the system under Section 1412 or otherwise significantly further the health protection objectives of this title....”
Needs are submitted in the form of capital infrastructure projects. To be considered an allowable need, a project must be eligible for DWSRF funding, be in furtherance of the public health protection objectives of SDWA, fall within the prescribed 20-year time frame (January 1, 2007, through December 31, 2026), and be adequately documented.
Projects Must Be for a Capital Improvement Need
Projects that do not address a specific, tangible capital infrastructure need are not included. Non-capital needs include operational and maintenance costs, water rights or fee payments, conducting studies, computer software for routine operations, and employee wages and other administrative costs.
45

2007 Drinking Water Infrastructure Needs Survey and Assessment
Projects Must Be Eligible for DWSRF Funding
Projects ineligible for DWSRF funding are identified in the DWSRF regulation and include:
• Dams or the rehabilitation of dams.
• Water rights.
• Raw water reservoirs or rehabilitation of reservoirs (except for fi nished water reservoirs and reservoirs that are part of the treatment process and are on the property where the treatment facility is located).
• Projects needed primarily for fi re protection.
• Projects needed primarily to serve future population growth. (Projects needed to address a defi ciency affecting current users must be sized only to accommodate a reasonable amount of population growth expected to occur over the useful life of the facility.)
Projects Must Be in Furtherance of the Public Health Goals of the SDWA
Projects that are driven by objectives, not based on public health protection and the goals of the SDWA, are not included in the survey. These needs can include projects for improving appearances, infrastructure demolition, buildings and parking facilities not essential to providing safe drinking water, acquisition of land for an unallowable project, and infrastructure needed to extend service to homes that currently have an adequate drinking water supply.
Projects Must Fall Within the 20-Year Period of the Assessment
Projects for which construction began prior to January 1, 2007, and projects that are not needed until after December 31, 2026, fell outside the time frame for the Assessment and were not included.
Projects Must Be Adequately Documented
Project documentation is a critical piece of the Assessment’s credibility and fairness to states. It is described in more detail later in this Appendix.
Other Unallowable Needs
Besides the project criteria discussed above, other limitations established by the workgroup were:
• Infrastructure needs that occur more than once during the 20-year survey period could be listed only once on the survey.
• Multiple projects meeting the same need, such as rehabilitating a tank and later replacing the same tank, could not all be included.
46

Appendix C - Policies
• Projects for compliance with specific pr oposed or recently promulgated regulations were not accepted from water systems. These costs w ere instead estimated and added to the national total by EPA directly.
• Projects driven solely by a non-water-related issue such as a highway relocation were not included.
• Projects to acquire existing infrastructure were not considered capital infrastructure costs.
• Most vehicles and tools were considered operation and maintenance costs.
• Projects that are not the responsibility of the public water system, such as homeowners’ portions of service line replacements, were not included.
If projects associated with an unallowable need were submitted, they were excluded from the Assessment by EPA. EPA understands that these projects often represent legitimate and even critical needs that a water system must pursue to continue to provide service to its customers. However, because they do not meet the allowability criteria they are not the subject of the DWINSA.
Documentation Requirements
EPA and the workgroup implemented improvements for the 2007 Assessment based on the lessons learned in the 2003 Assessment. Revisions to the DWINSA approach primarily centered on the documentation requirements for certain types of projects and were driven by the desire to ensure a consistent approach to data collection and to the assessment of need applied by each state.
High-quality documentation is required to justify the need for a project, defend cost estimates provided by the water system, provide a defensible assessment of national need, and ensure fair allotment of DWSRF monies. The documentation of need and cost for each project was carefully reviewed to ensure that the criteria set in the DWINSA approach and established by consensus of EPA and the workgroup were met.
Photo by Jenna Wang
A clamp used to repair a water main break.
47

Weight of Evidence
Documentation must include adequate system-specifi c and project-specifi c details to verify that the project meets the allowability criteria and to justify that the project is needed. Reviewers weighed the evidence provided to determine if the submitted project met the criteria.
2007 Drinking Water Infrastructure Needs Survey and Assessment
Types of Documentation
In an effort to ensure more consistency in each state’s approach to the assessment of its water systems’ needs, the workgroup defined for the 2007 Assessment three types of documentation that could be provided to describe a need or provide a cost:
• Independent Documentation. A document or report generated through a process independent of the Assessment. Because these documents were not generated specifically for the Assessment, it is assumed that there is no intentional bias of over reporting of need.
• Survey-generated Documentation. A statement or document discussing the need for a project generated specifically for the Assessment by the system or the state.
• Combination Documentation. A combination of independent and survey-generated documentation to justify project need or cost. Independent documentation does not always directly address the reason a project is being pursued by a system and therefore may not establish allowability criteria. Systems often added survey-generated documentation to independent documents to clarify the need for the project.
Documentation of Need
Documentation of need explains the scope of the project, explains why the project is needed, and gives an indication of the public health need that would be addressed by the project. In order for the project to be accepted, the documentation of need must:
• Provide sufficient information for EPA to review the allowability of the project.
• Provide adequate data to check the accuracy of the data entered on the questionnaire.
• Be dated and be less than 4 years old.
One of the primary changes in approach from the 2003 Assessment was that EPA and the DWINSA workgroup defined the type of documentation required for each specifi c project type. These minimum requirements were set to allow a minor level of effort by states and water systems to document straight-forward projects. Doing so made more resources available to identify and document projects in which allowability was more questionable. Projects fell into the following levels of documentation requirements:
• Projects that required independent documentation of need.
• Projects for which survey-generated documentation was permitted but to which a weight-of-evidence review was applied.
• Projects accepted with any forms of documentation.
48

Appendix C - Policies
The level of documentation required depended on the type of project and whether the project was for new infrastructure or for the replacement, rehabilitation, or expansion/ upgrade of existing infrastructure. Any of the three forms of documentation were acceptable for projects to rehabilitate or replace infrastructure assumed to have a life-cycle of 20 years or less.
Projects likely to be driven by a need that is not DWSRF-eligible (such as to accommodate growth or meet fire suppression needs) generally required independent documentation. Most projects for the installation of new infrastructure fell into this category. For those projects, such as the construction of a new treatment system or new storage tank, the independent documentation was reviewed and EPA applied a “weight-of-evidence” approach to determine whether the project could be included in the Assessment.
Projects for Which Independent Documentation was Required
Generally, projects that required independent documentation of need were likely to be unallowable needs (such as projects to meet anticipated growth) or for infrastructure likely to have an expected life of more than 20 years (such as a water main). EPA and the workgroup assumed that systems pursuing needs in this category are often in the process of formal planning and therefore independent documents are likely to exist. Projects requiring independent documentation included:
• Sources – installation of a new surface water source or new aquifer storage and recovery wells.
• Treatment – installation, replacement, or expansion/upgrade of a complete treatment plant.
• Pipe – rehabilitation or replacement of a substantial portion of the system’s water mains (in excess of 10 percent of the total system based on a rate of 0.5 percent annually).
Projects for Which Survey-Generated Documentation was Allowed, but a Weight of Evidence Review was Applied
Needs that were subject to a weight-of-evidence review included projects that were significant in scope or that may be for unallowable need (such as anticipated growth), but are not necessarily likely to be included in a planning document. For these projects, systems were asked to provide enough information for the reviewer to ascertain whether the project was for an allowable need. These projects included:
Montana Department of Environmental Quality
Corrosion on a wellhead indicates well rehabilitation may be necessary in the near future.
• Sources – construction of new wells or springs and replacement or rehabilitation of any source.
49

2007 Drinking Water Infrastructure Needs Survey and Assessment
• Treatment – installation of a new ultraviolet (UV) treatment or membrane filtration system (for projects not solely for compliance with the Long Term 2 Enhanced Surface Water Treatment Rule).
• Storage – construction or replacement of a finished water storage tank.
• Pipe – installation of new water mains and any new water main appurtenances such as valves and hydrants.
• Security – motion detector, in-line monitoring devices, or other sophisticated security system components.
Projects for Which All Forms of Documentation Were Accepted
Projects for infrastructure that is generally expected to require rehabilitation or replacement within a 20-year period were accepted with minimum documentation of need. Survey-generated documentation was sufficient for these projects, which included:
• Sources – installation, replacement or rehabilitation of well pumps, raw water pumps, and other miscellaneous source projects.
• Treatment – rehabilitation of a complete treatment plant or installation of any treatment system components (other than new UV and new membrane fi ltration).
• Storage – rehabilitation of any finished water storage tank, cover of fi nished water storage tank, and installation of hydropneumatic tanks and cisterns.
• Pumping – installation, replacement, or rehabilitation of any pump or pump station.
• Pipe – rehabilitation or replacement of water mains up to 10 percent of the system’s total pipe inventory.
• Other infrastructure such as replacement of lead service lines and installation of control valves, backflow prevention, meters, controls, and emergency power.
Documentation of Cost
To estimate a 20-year national and individual state need, every project must have an estimated cost. There were two primary methods for assigning costs to a project:
• Systems provided an independent cost estimate.
Sarah Hudson, Indiana DWSRF
Elevated storage tank in Greensburg, Indiana.
50

Appendix C - Policies
• Systems provided adequate information for EPA to estimate a cost using a cost model.
For systems that provided a cost estimate, the documentation must:
• Include the date the estimate was derived.
• Be generated through a process independent of the Assessment.
• Be no more than 10 years old (earlier than January 1, 1997).
• Not include loan origination fees, finance charges, bond issuance fees or costs, interest payments on a loan, or inflationary multipliers for future projects.
Since projects with adequately documented costs were the basis of the cost models, systems were encouraged to provide both cost and design parameters for as many projects as possible so that the data could be used to build new cost models.
If a cost was not provided, key information on design parameters and project type was required for EPA to assign a cost to the project using a cost model. However, EPA was unable to model a few types of infrastructure projects (e.g., projects that were too unique or site-specific). In those cases, a documented cost estimate was required in order for the cost to be included in the Assessment.
As with previous Assessments, EPA will publish a document detailing the costs models developed and used in the 2007 Assessment. The publication should be available by mid2009.
51

2007 Drinking Water Infrastructure Needs Survey and Assessment
52

Appendix D - Accuracy, Precision, and Uncertainty
Uncertainty, precision, and bias affect the accuracy of an estimate based on a statistical sample. While a sample can be designed to meet certain precision targets, other sources of uncertainty and potential biases may diminish the accuracy of estimates.
Uncertainty
Th ere are two types of uncertainty at play in the DWINSA. Real uncertainties are created as survey respondents predict future needs. EPA is asking systems not only to provide their existing needs, but also to anticipate what their future needs will be. It is difficult to predict future needs. Since no one knows, for example, when a pump will fail or exactly what it will cost to fix or replace it when it does fail, there is real uncertainty about the accuracy of estimates of future investment needs.
A second source of uncertainty is the use of a probability sample to estimate need. Uncertainties are created due to the inherent limitations of statistical analyses. The use of a random sample and cost models create such stochastic (i.e., random or arising from chance) uncertainties in the survey. In assessing the impact that the sample has on the estimate, EPA distinguishes between two sources of stochastic uncertainty: precision and bias.
Precision
Precision is the degree to which additional measures would produce the same or similar results. Two factors affect the pr ecision of sample-based estimates. First is the inherent variability of the data. If systems’ needs are similar, the margin of error will be smaller than if needs vary greatly across systems. The second factor is the siz e of the sample. Larger samples produce more precise estimates than smaller ones.
Th e use of a random sample introduces uncertainty in the estimate. A diff erent sample would lead to a differ ent estimate of each state’s need, since there will always be some variability among differ ent systems selected in a sample. Because the DWINSA relies on a random sample, the sample should provide an unbiased estimate of the total need. Th e level of confidence in the estimate is r eflected in the confi dence interval.
EPA’s goal is to be 95 percent confident that the margin of err or for the survey is +/- 10 percent of the total need for systems serving more than 3,300 persons for each fully surveyed
EPA Region 9
A 300,000 gallon storage tank and pumping facility at a water system in Arizona.

2007 Drinking Water Infrastructure Needs Survey and Assessment
state, assuming that the data provided are unbiased. (The estimates for individual partially surveyed states do not meet these precision targets. DWINSA also has separate precision targets for systems serving 3,300 or fewer persons.)
If the systems that responded to the survey reported the cost of their investment needs for all projects, sampling error would be the only stochastic source of uncertainty. But systems do not have cost estimates for most of the projects they reported. EPA imputed the cost of these projects using cost models based on cost estimates submitted for other projects. As with sampling, there is a degree of predictable error associated with such modeling.
Bias
Sampling error is random. It is as likely to lead to an estimate that is greater than the true value as it is lower than the true value. Bias, however, is not random. An estimator is biased if its expected value is different from the true value. An estimator is upwardly biased if it consistently leads to an estimate that is greater than the true value. It is downwardly biased if it consistently leads to an estimate that is less than the true value. The DWINSA has both upwards and downward biases. EPA implemented policies and procedures to mitigate the impact of these biases.
Downward bias
Past DWINSAs and studies of these Assessments have shown that systems are likely to underestimate their needs. There is little theory or empirical evidence to suggest that systems overstate their needs. This understatement is brought on for two primary reasons. One is that the bulk of a system’s infrastructure is underground in the form of transmission and distribution mains. It is difficult to assess the need for addressing these out-of-sight assets. The second is that the survey assesses systems’ 20-year need. Many systems have not undertaken the long-term planning necessary to identify future infrastructure needs.
Upward bias
In part to help address the downward bias introduced by systems’ underestimating their needs, EPA enlisted the help of states in the data collection eff ort. However, because states are the recipients of the capitalization grants determined by the Assessment, there is an incentive for states to overestimate their systems’ needs. Th is situation introduces a possible upward bias in the estimate of the needs generated by systems with state input.
Th is bias likely does not apply to the DWINSA estimate of small system need. The small system sur vey is conducted by EPA, without states’ direct involvement.
Photo by Rudd Coffey
Water main break repair in Watertown, Massachusetts.
54

Appendix D - Accuracy, Precision, and Uncertainty
For this reason, there is no upward bias in this portion of the survey. In addition, because small system surveys are conducted by trained professionals, EPA expects very little downward bias.
Approximately 25 states and territories and the District of Columbia have needs of less than 1 percent of the national need. These states receive the minimum DWSRF allocation regardless of the need reported (1 percent for states, Puerto Rico, and the District of Columbia; 0.33 percent for U.S. Territories). For this reason, there is likely no upward bias in the allocation for these states, and only the downward bias discussed above infl uences need in these states.
With input from states as well as a peer-review process, EPA implemented policies to help address both upward and downward bias. These policies included:
• Projects to rehabilitate or replace infrastructure generally considered in need of attention within a 20-year period were allowed based on system- or state-signed statements and project descriptions. States encouraged systems to consider their entire inventory and document all such needs if legitimate.
• Projects to rehabilitate or replace infrastructure not necessarily considered in need of attention within a 20-year period were allowed with documentation independent of the Assessment or a system or state’s statement if it included additional project-specific information such as an assessment of age, current condition, and maintenance history.
• Projects that include the installation/construction of new infrastructure generally received a high degree of scrutiny to ensure that they met allowability criteria
• Some infrastructure was only allowed if independent documentation was provided. They included new surface water sources, new treatment plants, the replacement or expansion of an existing treatment plant, and widespread replacement or rehabilitation of the distribution system (defined as more than 10 percent of the existing pipe inventory).
55

2007 Drinking Water Infrastructure Needs Survey and Assessment
56

Appendix E - Summary of Findings for Systems Serving 10,000 and Fewer Persons
Community Water Systems Serving 10,000 People and Fewer
The SDWA requires that states use at least 15 percent of their DWSRF funding for fi nancial assistance to community water systems (CWS) serving populations of 10,000 and fewer. The Assessment shows that the vast proportion of needs, $320.1 billion of the total national needs of $334.8 billion, are for CWSs. Th e not-for-profit noncommunity water systems make up the much smaller portion of the total needs. Of the $320.1 billion, CWSs serving 10,000 and fewer persons represent 31.2 percent or approximately $100 billion of needs (includes CWSs in U.S. Territories). Exhibit E.1 presents the 20-year needs for these smaller community systems by state and project type. It also compares the reported need of these systems to the state’s total community water system need. All data in Exhibit E.1 exclude needs related to not-for-profit noncommunity water systems.
57

2007 Drinking Water Infrastructure Needs Survey and Assessment
58
State
CWSs Serving 10,000 or Fewer People
Total 20-Year Need of
All CWS*
% of CWS Need Related
to Systems Serving 10,000
or Fewer Persons.*
Transmission/Distribution
Source Treatment Storage Other
Total 20-Year Need of CWS Serving
10,000 or Fewer People.*
Alabama $1,022.1 $38.0 $100.7 $110.4 $3.6 $1,274.7 $4,095.6 31.1%
Alaska $382.5 $42.8 $106.4 $99.3 $6.0 $637.0 $751.3 84.8%
Arizona $695.2 $124.5 $305.9 $217.8 $8.7 $1,352.0 $7,392.1 18.3%
Arkansas $1,740.7 $107.2 $364.6 $255.7 $9.4 $2,477.7 $5,271.2 47.0%
California $3,383.5 $521.7 $839.4 $791.7 $74.6 $5,610.9 $38,944.9 14.4%
Colorado $958.1 $177.3 $562.4 $247.7 $12.5 $1,958.0 $6,398.8 30.6%
Connecticut $367.9 $103.2 $108.9 $87.3 $8.1 $675.4 $1,366.5 49.4%
District of Columbia
$0.0 $0.0 $0.0 $0.0 $0.0 $0.0 $874.2 0.0%
Florida $1,802.7 $218.9 $335.3 $332.6 $34.4 $2,723.7 $12,695.5 21.5%
Georgia $1,486.6 $202.5 $402.8 $288.6 $29.5 $2,410.0 $8,924.0 27.0%
Illinois $2,880.2 $283.1 $920.7 $650.6 $32.3 $4,766.8 $14,907.0 32.0%
Indiana $1,570.9 $124.7 $310.1 $259.0 $12.3 $2,277.1 $5,768.1 39.5%
Iowa $1,159.8 $173.0 $476.8 $279.9 $14.9 $2,104.4 $6,094.7 34.5%
Kansas $1,663.1 $130.4 $378.9 $246.4 $12.2 $2,430.9 $4,026.7 60.4%
Kentucky $952.4 $40.2 $154.5 $161.5 $9.4 $1,318.0 $4,977.0 26.5%
Louisiana $1,546.1 $161.9 $358.6 $269.4 $24.5 $2,360.5 $6,885.2 34.3%
Maryland $390.4 $77.1 $152.8 $125.0 $15.9 $761.3 $5,345.2 14.2%
Massachusetts $799.2 $114.6 $166.5 $207.6 $8.2 $1,296.1 $6,757.1 19.2%
Michigan $1,921.8 $302.8 $754.1 $392.2 $33.0 $3,403.8 $11,370.6 29.9%
Minnesota $1,241.1 $174.6 $605.7 $318.0 $14.5 $2,353.9 $5,720.1 41.2%
Mississippi $1,283.4 $186.0 $515.7 $332.9 $14.1 $2,332.1 $3,233.7 72.1%
Missouri $2,811.5 $216.3 $479.9 $400.8 $21.3 $3,929.9 $7,046.5 55.8%
Nebraska $616.6 $93.7 $165.4 $253.0 $7.5 $1,136.1 $1,760.6 64.5%
Nevada $232.6 $33.9 $71.5 $108.9 $6.7 $453.7 $2,677.1 16.9%
New Jersey $672.3 $87.2 $222.9 $195.8 $6.3 $1,184.5 $7,758.1 15.3%
* Excludes NPNCWS
Exhibit E.1: 2007 State Need Reported by Project Type for CWSs Serving a Population of 10,000 and Fewer (20-year need in millions of 2007 dollars)

Appendix E - Summary of Findings for Systems Serving 10,000 and Fewer Persons
Exhibit E.1: 2007 State Need Reported by Project Type for CWSs Serving a Population of 10,000 and Fewer (20-year need in millions of 2007 dollars), cont.
State
CWSs Serving 10,000 or Fewer People
Total 20-Year Need of All
CWS*
% of CWS Need
Related to Systems Serving 10,000
or Fewer Persons.*
Transmission/ Distribution
Source Treatment Storage Other
Total 20-Year Need of CWS Serving
10,000 or Fewer People.*
New York $2,837.3 $369.8 $978.1 $588.2 $39.0 $4,812.3 $27,011.1 17.8%
North Carolina $1,776.3 $233.5 $416.3 $395.0 $28.4 $2,849.5 $9,685.5 29.4%
Ohio $2,196.2 $191.3 $739.1 $406.7 $31.2 $3,564.5 $12,316.8 28.9%
Oklahoma $1,580.1 $121.4 $421.6 $301.7 $13.2 $2,437.9 $4,089.8 59.6%
Oregon $697.2 $110.0 $268.0 $182.3 $15.1 $1,272.5 $2,729.8 46.6%
Pennsylvania $2,262.9 $367.7 $644.0 $474.6 $29.2 $3,778.3 $11,097.6 34.0%
Puerto Rico $370.1 $42.2 $181.5 $104.9 $11.3 $710.1 $2,536.3 28.0%
South Carolina $324.3 $48.0 $95.1 $74.3 $5.3 $547.0 $1,612.1 33.9%
Tennessee $1,185.8 $62.4 $200.5 $164.1 $8.4 $1,621.2 $3,518.8 46.1%
Texas $5,579.0 $735.9 $1,816.3 $1,214.3 $57.4 $9,402.9 $26,083.1 36.0%
Virginia $1,106.8 $142.5 $343.0 $270.1 $21.5 $1,883.9 $5,970.2 31.6%
Washington $2,009.8 $409.5 $682.9 $581.9 $57.4 $3,741.5 $9,640.0 38.8%
Wisconsin $1,193.0 $168.1 $459.3 $290.7 $14.5 $2,125.6 $5,702.6 37.3%
Partially Surveyed States†
$5,756.9 $792.6 $1,802.8 $1,272.4 $92.6 $9,717.2 $16,887.9 57.5%
Subtotal $60,456.5 $7,530.2 $17,909.0 $12,953.0 $844.3 $99,693.0 $319,923.3 31.2% American Samoa
$18.7 $2.9 $6.7 $4.7 $0.3 $33.3 $92.8 35.9%
Guam $12.5 $0.0 $8.5 $11.6 $0.0 $32.6 $263.9 12.3%
Commonwealth of the Northern Mariana Islands
$100.1 $19.9 $24.7 $33.1 $2.9 $180.6 $289.3 62.4%
U.S. Virgin Islands
$31.3 $7.1 $9.7 $6.9 $0.9 $55.9 $253.3 22.1%
Subtotal $162.5 $29.8 $49.6 $56.3 $4.1 $302.4 $899.4 33.6% Total $60,619.0 $7,560.1 $17,958.6 $13,009.3 $848.4 $99,995.4 $320,822.6 31.2%
* Excludes NPNCWS † For the 2007 DWINSA the need for states that opt out of the medium system portion of the survey is presented cumulatively and not by state. The list of the 14 partially surveyed states can be seen in Exhibit 2.4.
59

2007 Drinking Water Infrastructure Needs Survey and Assessment
60

Glossary
Capital Improvement Plan (CIP): a document produced by a local government, utility, or water system that thoroughly outlines, for a specified period of time, all needed capital projects, the reason for each project, and the projects’ costs.
Coliform bacteria: a group of bacteria whose presence in a water sample indicates the water may contain disease-causing organisms.
Community water system (CWS): a public water system that serves at least 15 connections used by year-round residents or that regularly serves at least 25 residents year-round. Examples include cities, towns, and communities such as retirement homes.
Current infrastructure needs: new facilities or deficiencies in existing facilities identifi ed by the state or system for which water systems would begin construction as soon as possible to avoid a threat to public health.
Engineer’s report: a document produced by a professional engineer that outlines the need and cost for a specific infrastructure project.
Existing regulations: drinking water regulations promulgated by EPA under the authority of the Safe Drinking Water Act; existing regulations can be found at Title 40 Part 141, the Code of Federal Regulations (40 CFR 141).
Finished water: water that is considered safe to drink and suitable for delivery to customers.
Future infrastructure needs: infrastructure defi ciencies that a system expects to address in the next 20 years because of predictable deterioration of facilities. Future infrastructure needs do not include current infrastructure needs. Examples are storage facility and treatment plant replacement where the facility currently performs adequately but will reach the end of its useful life in the next 20 years. Needs solely to accommodate future growth are not included in the DWINSA.
Ground water: any water obtained from a source beneath the surface of the ground, which has not been classified as ground water under the direct influence of surface water.
Growth: The expansion of a water system to accommodate or entice future additional service connections or consumers. Needs planned solely to accommodate projected future growth are not included in the Assessment. Eligible projects, however, can be designed for growth expected during the design-life of the project. For example, the Assessment would allow a treatment plant needed now and expected to treat water for 20 years. Such a plant could be designed for the population anticipated to be served at the end of the 20-year period.
61

2007 Drinking Water Infrastructure Needs Survey and Assessment
Infrastructure needs: the capital costs associated with ensuring the continued protection of public health through rehabilitating or constructing facilities needed for continued provision of safe drinking water. Categories of infrastructure need include source development and rehabilitation, treatment, storage, and transmission and distribution. Operation and maintenance needs are not considered infrastructure needs and are not included in this document.
Large water system: in this document, this category comprises community water systems serving more than 100,000 persons.
Medium water system: in this document, this category comprises community water systems serving from 3,301 to 100,000 persons.
Microbiological contamination: the occurrence of protozoan, bacteriological, or viral contaminants in a water supply.
Noncommunity water system: a public water system that is not a community water system and that serves a nonresidential population of at least 25 individuals daily for at least 60 days of the year. Examples of not-for-profit noncommunity water systems include schools and churches.
Public water system: a system that provides water to the public for human consumption through pipes or other constructed conveyances, if such system has at least 15 service connections or regularly serves an average of at least 25 individuals daily at least 60 days out of the year.
Regulatory need: a capital expenditure required for compliance with Safe Drinking Water Act regulations.
Safe Drinking Water Act (SDWA): a law passed by Congress in 1974 and amended in 1986 and 1996 to ensure that public water systems provide safe drinking water to consumers (42 U.S.C.A. §300f to 300j-26).
Small water system: in this document, this category comprises community water systems serving up to 3,300 persons.
Source rehabilitation and development: a category of need that includes the costs involved in developing or improving sources of water for public water systems.
State: in this document, state refers to all 50 states of the United States plus Puerto Rico, the District of Columbia, American Samoa, Guam, the Commonwealth of Northern Mariana Islands, and the U.S. Virgin Islands.
Storage: a category of need that addresses finished water storage for public water systems.
62

Glossary
Supervisory Control and Data Acquisition (SCADA): an advanced control system that collects all system information and allows an operator, through user-friendly interfaces, to view all aspects of the system from one place.
Surface water: all water that is open to the atmosphere and subject to surface run-off , including streams, rivers, and lakes.
Transmission and distribution: a category of need that includes installation, replacement, or rehabilitation of transmission or distribution lines that carry drinking water from the source to the treatment plant or from the treatment plant to the consumer.
Treatment: a category of need that includes conditioning water or removing microbiological or chemical contaminants. Filtration of surface water, pH adjustment, softening, and disinfection are examples of treatment.
Watering point: a central source from which people who do not have piped water can obtain drinking water for transport to their homes.
63

2007 Drinking Water Infrastructure Needs Survey and Assessment
Jim McRight, North Carolina Department of Environment and Natural Resources
A view of a treatment plant and underground pipe gallery in North Carolina.
64

