driver drowsiness monitoring based on yawning detection · driver drowsiness monitoring based on...
TRANSCRIPT
Driver Drowsiness Monitoring Based On Yawning Detection
By
Shabnam Abtahi
A Thesis Presented to Faculty of Graduate Studies and Research
In partial fulfillment of the
Requirements for the degree of
Masters of Applied Science
in Electrical and Computer Engineering
University of Ottawa
© Shabnam Abtahi, Ottawa, Canada, 2012

i
I hereby declare that I am the sole author of this thesis. This is a true copy of the thesis, including
any required final version, as accepted by examiners. Also, I authorize the University of Ottawa
to lend this document to other institutions for the purpose of scholarly research.
Shabnam Abtahi
I further authorize the University of Ottawa to reproduce this document by photocopying or by
any other means, in total or in part, at the request of other institution or individuals for the
purpose of research
Shabnam Abtahi

ii
Abstract
Driving while drowsy is a major cause behind road accidents, and exposes the driver to a much
higher crash risk compared to driving while alert. Therefore, the use of assistive systems that
monitor a driver’s level of vigilance and alert the fatigue driver can be significant in the
prevention of accidents. This thesis introduces three different methods towards the detection of
drivers’ drowsiness based on yawning measurement. All three approaches involve several steps,
including the real time detection of the driver’s face, mouth and yawning. The last approach,
which is the most accurate, is based on the Viola-Jones theory for face and mouth detection and
the back projection theory for measuring both the rate and the amount of changes in the mouth
for yawning detection. Test results demonstrate that the proposed system can efficiently measure
the aforementioned parameters and detect the yawning state as a sign of a driver’s drowsiness.

iii
Acknowledgements
I would like to express my deep and sincere gratitude to my supervisor Dr. Shervin
Shirmohammadi for giving me the opportunity to work on this project and also for his support
and assistance with the research.
Besides my supervisor, I would like to thank Dr. Behnoosh Hariri for all her guidance, patience
and kindness throughout this project.
I would also like to thank all my friends and relatives for participating in collecting image and
video datasets.
Last but not least, I would not have been able to achieve any of my success if not for the support
of my parents, Nastaran and Ghasem and my sisters, Maryam and Yasaman. Their constant
encouragement and love keeps me motivated.

iv
Table of Contents
Abstract ii
Acknowledgements iii
Table of Figures vi
Table of Tables viii
List of Acronyms and Definitions ix
Chapter 1 - Introduction 1
1.1 Motivation ..................................................................................................... 2
1.2 Objective ....................................................................................................... 3 1.3 Drowsiness Detection Methods ..................................................................... 3
1.4 Research Contributions ................................................................................. 5 1.5 Research Publications ................................................................................... 6 1.6 Thesis Outline ............................................................................................... 6
Chapter 2 - Literature Review 8
2.1 Driver’s Performance .................................................................................... 8
2.2 Driver’s State............................................................................................... 10 2.2.1 Physiological ................................................................................... 10 2.2.2 Behavioural Features ....................................................................... 12
Chapter 3 - Proposed Systems 23
3.1 Color Segmentation ..................................................................................... 25 3.1.1 Face Detection ................................................................................. 25 3.1.2 Eye Detection .................................................................................. 27
3.1.3 Mouth Detection .............................................................................. 27 3.1.4 Yawn Detection ............................................................................... 28
3.2 Active Contour Model ................................................................................. 28 3.2.1 Wavelet Transform .......................................................................... 29 3.2.2 Integration Projection ...................................................................... 30
3.2.3 Face Detection ................................................................................. 31 3.2.4 Face Profile Matching ..................................................................... 32
3.2.5 Face tracking ................................................................................... 34 3.2.6 Mouth Detection .............................................................................. 35 3.2.7 Yawn Detection ............................................................................... 37
3.3 Viola-Jones Method .................................................................................... 38 3.3.1 Platform Specification ..................................................................... 39 3.3.2 Viola-Jones Theory ......................................................................... 40

v
3.3.3 OpenCV Implementation ................................................................ 45
3.3.4 Face Detection ................................................................................. 48 3.3.5 Mouth Detection .............................................................................. 52 3.3.6 Yawn Detection ............................................................................... 53
Chapter 4 - Dataset Collection 55
4.1 Camera ........................................................................................................ 55 4.2 Environment ................................................................................................ 56
4.3 Participants .................................................................................................. 57 4.4 Videos.......................................................................................................... 58 4.5 Basic Videos Statistics ................................................................................ 58
Chapter 5 - Results and Discussion 61
5.1 Color Segmentation ..................................................................................... 61
5.2 Snake Contour Model.................................................................................. 65 5.3 Viola-Jones Method .................................................................................... 67
Chapter 6 - Conclusion and Future Work 74
6.1 Conclusion ................................................................................................... 74
6.2 Future Work ................................................................................................ 75
Chapter 7 - References 77
Appendix A – 85
Appendix B – 87

vi
Table of Figures
Figure 1 – Yawning Detection Algorithm 24
Figure 2 – Face candidates centroids 32
Figure 3 – Average Y-Profile and X-Profile 33
Figure 4 – An example of face and mouth contour detection 36
Figure 5 – Changes in mouth contour area during yawning 38
Figure 6 – Rectangle Features 41
Figure 7 – Haar-like features 42
Figure 8 – Cascade of Classifiers 44
Figure 9 – Different Haar-like features used by the classifier for face detection 45
Figure 10 – Two Rectangles for the Calculating Feature 47
Figure 11 – Search for Face Location with Different Scale Ratios 50
Figure 12 – Search for Face Location in an Image 51
Figure 13 – Search for Face Location in an Image with Different Scale Ratios 51
Figure 14 – Participants 57
Figure 15 – Female Participants 59
Figure 16 – Male Participants 59
Figure 17 – Skin Detection 61
Figure 18 – Eye Detection by Applying Eye-Map 62
Figure 19 – Mouth Detection by Applying Mouth_Map 63
Figure 20 – Yawn Detection 64

vii
Figure 21 – Level 1 Daubechies Wavelet Transform 65
Figure 22 – Sequence of mouth contours in yawning 66
Figure 23 – Face and Mouth Detection by Viola-Jones Theory 68
Figure 24 – Yawning Detection in Sequence of Video Frame 70

viii
Table of Tables
Table 1 - Camera installed on the mirror ....................................................................................... 71
Table 2 - Camera installed on the dash.......................................................................................... 73

ix
List of Acronyms and Definitions
NHTSA National Highway Traffic Safety Administration
HRV Heart Rate Variability
LF/HF Low Frequency/High Frequency
BP Back Propagation
FBP Fast Back Propagation
s-FCM spatial Fuzzy C-Means
BP ANN Back Propagation Artificial Neural Network
CUs Computational Units
ARM Advanced RISC Machine
CWT Continuous Wavelet Transform
DWT Discrete Wavelet Transform
DTW Dynamic Time Warping

1
Chapter 1 - Introduction
Driver fatigue not only impacts the alertness and response time of the driver but it also increases
the chances of being involved in car accidents. National Highway Traffic Safety Administration
(NHTSA) analysis data indicate that driving while drowsy is a contributing factor to 22 to 24%
of car crashes, and that driving while drowsy results in a four- to six-times higher near-
crash/crash risk relative to alert drivers [1]. The near crash/crash risks of driver drowsiness may
vary based on time of day or ambient lighting situations. Drowsiness is slightly increased when
there is no high roadway or traffic demand and also in the darkness. A higher probability of
drowsiness-related baseline epochs was identified during free-flow traffic densities, on divided
roadways and areas free of roadway junctions. Drowsy driving denotes a situation when the driver
is in a state of mental and physical fatigue, which includes decreasing mental alertness and a
sensation of weariness and reduction in eye scanning behaviors [2]. A severely drowsy driver will
exhibit extended incompetence to safely perform a driving maneuver, be unaware of the
vehicle’s turning radius, perform driving maneuvers under the incorrect assumption that it is
safe, experience eye lid closures and have difficulties keeping his/her head in a lifted position,
minimal body/eye movement and repeated yawning [1]. When the driver is impaired by fatigue,
his/her ability levels, driving behaviours, proficiencies and decisions are adversely affected and,
in these situations, the high accident rate is due to the fact that sleepy drivers fail to take correct
actions prior to a collision [3]. An important irony in driver’s fatigue is that the driver may be too
tired to realize his/her own level of drowsiness. This important problem is often ignored by the
driver. Drowsy driving is a serious issue in our society not only because it affects those who are

2
driving while drowsy, but because it puts all other road users in danger. Therefore, the use of
assisting systems that monitor a driver’s level of vigilance is crucial to prevent road accidents.
These systems should then alert the driver in the case of drowsiness or inattention.
1.1 Motivation
A common activity in most people’s life is driving; therefore, improving driving (making driving
safe) is an important issue in everyday life. Even though the driver’s safety is improving in road
and vehicle design, the total number of serious crashes is still increasing. Reducing the number
of car crashes would benefit millions of people around the world. Most of these crashes result
from impairments of the driver’s attention. There are four major types of attentional impairments
that affect driver’s reaction, and include alcohol, aging, distraction and fatigue. Approximately
40% of deaths from crashes in U.S. highways can be attributed to alcohol. Aging results in
slower response to hazards. Drivers’ distraction is increasing as vehicle technologies such as
navigation systems, cell phones and the internet become more advanced. Compared with the
above three impairments, fatigue is often cited in accidents since drivers tend to adopt risky
strategies to drive at night [1]. The U.S. National Highway Traffic Safety Administration has
reported that driving while drowsy is one of the reasons behind road accidents, and exposes the
driver to a much higher crash risk compared to driving while alert [2]. Based on the Ontario
Ministry of Transportation’s Driver’s Handbook, drivers’ abilities are affected by drowsiness and
fatigue long before they notice that they are getting tired. All of the above are therefore
motivations to design and implement an assistive monitoring system in order to detect drivers’
drowsiness and fatigue.

3
1.2 Objective
The goal of this research is the use of assistive systems that monitor a driver’s level of
drowsiness. The detection system in general may determine both driver related features
(physiological data) and vehicle related features (driving performance data). This requires
computing relevant measures to predict the onset of drowsiness. After the detection of
drowsiness, the system alerts the driver to take appropriate preventive action in order to avoid
serious car crash. The objective of this research is to develop an accurate and reliable system to
detect a driver’s drowsiness based on his or her yawning. The system will alert the drivers in the
case of sleepiness when a number of yawning situations increase in a short period of time. Three
different methods were developed in order to find the best way that has high accuracy and reduce
the probability of having insufficient alertness. A brief explanation about each method for
detecting drivers’ drowsiness and subsequently alerting them will be discussed in section 1.3.
1.3 Drowsiness Detection Methods
Many special body and face gestures are used as signs of driver fatigue, including yawning, eye
tiredness, eye movement and falling head, which indicate that the driver is no longer in a proper
driving condition. Accordingly, to detect driver drowsiness, a monitoring system is required in
the car. The aim of using this system is to reduce the number of accidents due to drivers’ fatigue
and hence improve the transportation safety. A great variety of methods for fatigue detection has
been proposed by other researchers and will be discussed in Chapter 2 -. Three separate methods
were implemented in this research in order to find the best and reliable method, which will be
briefly described in this section and the detailed explanation of each method will be discussed in
Chapter 3 -.
4
1- The first method is focused on color segmentation of the driver’s facial characteristics.
The first step in this method is to determine the face region in order to remove the
background and clarify the search area. This step will be done based on analyzing the
skin color properties in RGB, YCbCr and HSV color spaces. In the next step, the eyes
and mouth will be located by utilizing the specific formula for each component based on
the color segmentation. The eye component will be used as a reference point to confirm
the location of the mouth. The mouth component will be located in the form of a white
area in the lower half of the face in the center of the eyes’ location. The geometrical
properties of the white area will be changed when the mouth position changes from
normal to yawning condition. In this case, the height of the mouth becomes greater and
the system will propose this condition as an instance of yawning.
2- In the second method, the yawning condition will be detected by applying an active
contour model. In the first step of this method, the face area will be located using the
same technique as method one, by applying skin color segmentation in the video frames.
In this method the result of face detection based on skin color properties will be three
face candidates. The correct face candidate will be selected after matching the face
template with each candidate. The template was the combination of ten faces’ images, to
which the Daubechies wavelet was applied. After locating the face area, the mouth will
be detected by using the mouth map formula in the lower half of the face. The active
contour model will be utilized in this part to detect the area around the mouth. As the
mouth becomes wider and wider to change the form from normal to yawning the snake
contour model will continuously get the shape of the mouth. By counting the number of
pixels in the snake contour and following the routine of the yawning condition, the
system will be programmed to alert the driver when necessary.

5
3- The last and most reliable method in this development is based on using the concept of
the Viola-Jones face detection algorithm, which is already implemented in OpenCV. This
theory uses a large number of faces to train the classifier with the features resulting from
integral images. Then, the Adaboost algorithm will be utilized to select the most
important features of the face. The important features will create the cascade of the
classifiers, which decides whether the face is detected or not. The mouth location will be
located by using the same concept as face detection. After finding the mouth area, the
histogram of the mouth will be found in the first frame and will be assigned as a
reference histogram for yawning detection. The histogram in the next frames will be
found and compared with the reference histogram and the back projection theory will be
applied. In this theory, the histogram differences will be determined and it will be
changed when the mouth goes into the yawn state. As the differences between the
reference histogram and next frames’ histogram become greater, the system will alert the
driver. This method was programmed on an APEX board, produced by CogniVue
Corporation, which has a camera that can be used in the car and will produce realistic
conditions for an in-car scenario.
Detailed information for each theory will be discussed in Chapter 3 -and the result for each
method will be given in Chapter 5 -
1.4 Research Contributions
This thesis presents an assistive system that monitors a driver’s level of awareness and alerts the
driver in case of sleepiness. The system will be installed in the car in front of the driver to
monitor his/her face during driving.
Several contributions are included in this new system, which are as follows:

6
Analysis of the characteristics of driver drowsiness and its detection using three different
methods
Design and development of a drowsiness detection system based on Viola-Jones theory
features
Construction of a large dataset of actual driver videos and images in different
environments and conditions including various face poses, illumination, facial
expression, age, facial hair, weather conditions, etc.
Proof-of-concept and performance evaluation as validation of the design and theory
Porting and re-implementation of the proposed method to an actual in-car smart camera
system: CogniVue Corporation's APEX platform, which has a limited instruction set and
resources. The system was successfully demoed at the 2011 ACM/IEEE International
Conference on Distributed Smart Cameras, and the technology was transferred to
CogniVue Corp.
1.5 Research Publications
S. Abtahi, B. Hariri, S.Shirmohammadi, “Driver Drowsiness Monitoring Based on Yawning
Detection”, Proc.IEEE International Instrumentation and Measurement Technology
Conference, Binjiang (Hangzhou), China, May 10-12, 2011
B. Hariri, S. Abtahi, S. Shirmohammadi, L. Martel, "Vision Based Smart in-Car Camera
System for Driver Yawning Detection", Proc. ACM/IEEE International Conference on
Distributed Smart Cameras, Ghent, Belgium, August 23 - 26, 2011
1.6 Thesis Outline
The majority of this thesis presents the design and evaluation of the driver monitoring system to
evaluate drivers’ fatigue. It reviews existing approaches related to the topic, details different

7
methods and the final proposed system, and finally presents a set of results and associated
evaluations.
The remainder of this thesis is structured as follows:
Chapter 2 - Literature Review provides information on existing approaches about driving
drowsiness detection
Chapter 3 - Proposed Systems specifies three different methods for the design of the
drowsiness detection system in detail
Chapter 4 - Dataset Collection presents the procedure of collecting the required dataset for
testing the methods
Chapter 5 - Results and Discussion presents the evaluation results for all three implemented
methods, which were discussed in section 3
Chapter 6 - Conclusion and Future Work summarizes and concludes the thesis, while
outlining venues for future research
8
Chapter 2 - Literature Review
Driver drowsiness is a major cause of road accidents. Therefore, much research has been done in
order to develop precise monitoring systems to increase transportation safety and decrease the
number of deaths caused by fatigued drivers. The methods for assessing driver drowsiness are
generally related to the measurement of the driver’s state, driver performance and a combination
of the driver’s state and performance. For each method, different criteria must be analyzed, for
example yawning, head position and eye closure can be studied in a driver’s state measurement,
while lane tracking and tracking distances between vehicles are involved in the studies of a
driver’s performance. Based on the result of different researches, the most accurate technique
towards driver fatigue detection is dependent on physiological phenomena like brain waves,
heart rate, pulse rate and respiration. But these techniques are intrusive and require the
attachment of some electrodes on the driver, which are likely to cause annoyance to him/her.
Therefore, to monitor the driver’s vigilance, different techniques of computer vision can be used,
which are natural and non-intrusive. These techniques focus on observable visual behaviours
from changes in a human’s facial features like eyes, head and face [4].
2.1 Driver’s Performance
The objective measure of how the vehicle is being controlled by the driver is a key component of
the driver’s performance. These measures are the least invasive way of detecting driver state
since there are no direct interactions with the driver. But on the other hand, these measures are a
direct result of the driver’s input to the vehicle’s control, such as steering, throttle and brake.
Vehicles are gradually equipped with systems for detecting driver metrics; therefore these

9
measures are particularly suitable. The driver metrics consist of lane position, headway and
steering wheel angle. Driver performance can be influenced by many factors, such as experience,
distraction and driving conditions; therefore, driving performance is not necessarily closely
correlated with driver state. A number of studies about the driver’s performance have been done
by other researchers, which have mainly employed lane tracking and also tracking of the distance
between the driver’s vehicle and the car in front.
Tuncer et al. proposed an assistant system to track a lane, which will be activated for those
drivers who are not able to perform a good job of lane keeping [3]. In order to develop the lane
keeping controller system, a series of robust, parameter space based and velocity scheduled
control design techniques were carried out, using the Control of Mechatronics Systems toolbox.
For lane detection and lane tracking, a camera based image processing algorithm is required,
which will use offline and real time hardware-in-the-loop simulations. In order to process the
video frames coming from an in-vehicle camera pointed towards the road ahead, a PC is used
that detects and computes the tracking of the lane, which it does by carrying out the fitting of
composite Bezier curves to the curved lanes. In the next step, a dSpace microautobox is used to
obtain the lane data from the PC and the Carmaker vehicle data from the dSpace compact
simulator. It will then calculate the required steering actions and send them to the Carmaker
vehicle model.
In the drowsiness detection method proposed by Pilutti et al. [5], driver assessment is determined
in the context of a road departure warning and intervention system. In this method, the vehicle
lateral position is used as the input and steering wheel position as the output in order to develop a
system that will be updated during driving. The driver’s performance will be determined by
analyzing the changes in the bandwidth and/or parameters of such a model.

10
2.2 Driver’s State
2.2.1 Physiological
Any physical changes that occur within the body during the onset of fatigue are considered to be
physiological measures, which are a direct measure of fatigue. In general, different physiological
measures have been used in attempts to detect tiredness, such as heart rate and body temperature.
The electroencephalogram is another physiological concept that has become widely accepted as
key for determining a person’s state with respect to sleepiness and wakefulness. An
electroencephalogram offers an objective degree of sleepiness that can be obtained in real time;
therefore, it is one of the most promising tools for detecting driver state of fatigue.
Electroencephalogram was the emphasis of the literature review of physiological measures
because it is viewed as the most precise physiological measure of drowsiness.
The activity in the brain can be determined by electroencephalographic measurements. The
brain’s level of alertness will be changed by electrical activity, which allows the detection of
sleepiness and different stages of sleep. In the paper proposed by Picot, a fatigue detection
system is based on brain and visual activity [6]. A single electroencephalographic channel is
used in order to monitor the brain activity for drowsiness detection. The measurement of
electrical activity of the brain—electroencephalographic—will be determined by placing the
electrodes on the scalp. Electroencephalographic data can be analyzed where rhythmic activities
are calculated in several physiologically significant frequency bands in the frequency domain. In
order to detect drowsiness, any change in α, θ and β will be analyzed in electroencephalographic
data, for example, an increase of the α and θ activities and a decrease of the β activity. α and θ
are linked to relaxed and eyes closed states and β is linked to active concentration. The main goal

11
of the electroencephalographic based detection system is to detect important variations of
activity in the appropriate frequency ranges. Visual activity is detected through blinking
detection and characterization. Cascading decision rules are then used to merge both brain and
visual information according to a medical scale of drowsiness evaluation. Merging detection
systems allows the fatigue detection system to detect three levels of drowsiness: “awake,”
“drowsy” and “very drowsy.”
Furman et al. [7] method analyzed driver fatigue condition by using an electrocardiography
based approach. For their experiment, electrocardiography, electroencephalography,
electromyography, eye movement and video of ten participants were recorded while they were
asked to alternately undergo a Maintenance of Wakefulness Test or a Driving Simulation Test
every two hours. In the falling asleep condition, the Heart Rate Variability (HRV) in the very
low frequency range decreases consistently a few minutes before complete sleep occurs. The
results obtained by their experiments suggested that derived parameters in the time and time-
frequency domains may offer a suitable device for monitoring drivers' drowsiness.
According to Shan and Bowlds’ technique, a pulse wave sensor is used to detect a driver’s
drowsiness [8]. The mentioned sensor measures heart pulse wave from the driver’s palm. The
technique next employs an adaptive filter to cancel the measurement noise produced by the
change of the gripping force. The sensor, along with the adaptive filter, is provided a clear heart
pulse wave for later heart rate variability analysis. By utilizing the power spectrum density of the
subjects’ heart rate time series, the low frequency to high frequency (LF/HF ratio) can be
measured. The result of the LF/HF ratio indicates decreasing trends as drivers go from awake to
drowsy.

12
Hayashi et al. proposed another method of driver drowsiness detection by pulse wave analysis
with a neural network [9]. Since the biological signal such as pulse wave sharply reflects a
human’s mental condition, this method is used to measure the driver’s awareness condition. In
order to reduce noise signals by the driver’s movement, the sensor measuring the pulse wave was
attached on a driver’s wrist. Three indexes from the obtained pulse wave will be evaluated, such
as sympathetic nerve activity and parasympathetic nerve activity, from Heart Rate Variability
analysis and will be given as an input to the neural network to determine the driver’s state of
drowsiness.
2.2.2 Behavioural Features
The ability of the driver to drive can be determined by the way he/she is behaving while behind
the wheel. Behaviors indicative of tiredness or other unsafe driving situations such as distraction
take the form of yawning, blinking, eyes closure, head movements, use of mobile devices and
eye glance patterns.
The first step towards drowsiness detection based on behavioural features is to detect the driver’s
face. In this case, the search area for any facial feature will be reduced to the face region. There
are numerous techniques towards face detection processing; images containing faces have been
developed in different research categories such as face recognition, face tracking, pose
estimation and expression recognition. To build a system that will be able to analyze the
information included in face images, a robust and efficient face detection algorithm is required.
The objective of face detection is to recognize all image regions that contain a face without
considering its position, orientation and lighting conditions.

13
2.2.2.1 Face Detection
For face detection itself, several approaches have been used in the related literature. Knowledge
based methods [10] try to encode human knowledge about the characteristics of a typical face,
such as the relationships between facial features, and use them as a way to detect faces in an
image.
The goal of the feature invariant approaches [11] [12] is to find structural face features, such as
eyebrows, eyes, nose, mouth and hairline, which persist under various poses, viewpoints or
lighting and use those features to detect faces. Such features are mostly extracted using edge
detectors. For example, Sirohey proposed a method to identify the face from a cluttered
background based on segmentation [13]. The Canny edge detector and heuristics are used as an
edge map to remove and group edges. Then, the ellipse is fitted to the boundary between the
head region and the background and the face will be detected. Another method of face detection
based on locating facial features is developed by Graf et al. [14]. In this method, the
morphological operations will be applied to find the areas that have high intensity with certain
shapes. Based on the prominent peak value of the image histogram, the adaptive threshold will
be chosen to create binarized images. Then, the connected component in the binarized images
will be evaluated as candidates for the facial features in order to determine the face location. Han
et al. proposed a method of face detection based on a morphology technique to perform eye
analogue segmentation since eyes and eyebrows are the salient and relatively stable features in
the human face [15]. The located eye-analogue will be used to search for the potential face
regions with a geometrical combination of eye, nose and mouth. A trained backpropagation (BP)
neural network will get all potential face images and verify the face location.

14
The texture of human faces [16] or human skin color [17] [18] have also proven to be effective
features that can be used towards face detection. In the method proposed by Ying et al. [19], they
considered skin color as the most important feature that can be separated from other parts of the
background by using the maximal varieties variance threshold. Saxe and Foulds developed a face
detection system that uses histogram intersection in the HSV color space to highlight the skin
region [20]. In their method, an initial patch of skin color will be used to initiate the iterative
algorithm. In order to detect skin color, the method presents a control histogram, which will be
applied on different patches in the image and the current histogram for comparison. Then, the
threshold value will be assigned to be compared with the result from histogram comparison to
analyze the skin region.
Template matching methods [21] [22] store several standard patterns of different faces to
describe the face as a whole or the facial features separately, and compute the correlations
between an input image and the stored patterns in order to determine the degree of similarity of
the pattern to a face.
Craw et al. [23] proposed the following method: the frontal view face is detected based on
template matching. The extracted edges from Sobel filtering will be grouped together to locate
the face. Then, the same procedure will be repeated to find other facial features such as eyes,
mouth and nose in the candidate face. Another method of face detection is described by A. Samal
et al. [24] based on using silhouettes as templates for face localization. Principal component
analysis is utilized to collect a set of face silhouettes, which are represented by an array of bits.
Then, the Hough transform and eigen-silhouettes will be used for face localization.
In appearance based methods, the face models are learned from a set of training images, which
include the representative variability of facial appearance. Such methods can take advantage of

15
neural networks, which are applied in many pattern recognition problems, Support Vector
Machines, Naïve Bayes Classifiers or Hidden Markov Models as tools to evaluate the matching
of the pattern to the training database.
Tsai et al. proposed a method of face detection using eigenface and neural networks [25]. In this
method, the eigenface algorithm is utilized to find the face regions candidates. The neural
network with the backpropagation (BP) algorithm is then used to examine the face candidates. In
this system, the input vector of the neural network is the projection weights of the face space. At
the end, template based face verification is used to confirm the face region from the output of the
neural network. Another method of face detection based on BP neural network and Bayesian
decision is described by Liu et al. [26]. The first step in their method is to extract possible faces
from the images by applying a skin color algorithm. In the second step, the BP neural network
model is utilized to determine whether the human face exists in the region based on the output of
the skin color model. At the end, the Bayesian decision theory will be used to classify the face or
non-face pattern and also to improve the correct rate of face detection.
Shavers et al. used the concept of support vector machines to develop a face detection system
[27]. The λ coefficients that correspond to support vector machine support vectors are calculated
from a set of training images, which consist of face and non-face images. The system will simply
determine the support vector machine’s detection rate for the simplest kernel function and will be
able to decide whether the image presented to the system is a face or non-face image.
El-Khamy et al. describe a method of human face recognition by the use of a neural network
algorithm and statistical feature extraction [28]. The edge of the face image is detected by
applying a Sobel filter in the preprocessing step. Then, the two-dimension black and white image
will be transformed to a one-dimensional vector. Finally, seven features will be extracted based

16
on the statistical analysis. The fast back propagation algorithm will be used in the recognition
step.
Ruan and Yin [29] proposed a fast face detection method by using two different approaches of
skin color information and linear support vector machines. In the first step of their method, the
information about skin color related to the YCbCr color space will be extracted from the image
and exclude the background region from the images. Then the sample features from the skin
region will be transferred to the support vector machine classifier for training and classifying.
The linear support vector machine will be used to separate non-face regions from the remaining
regions.
Current state of the art face detection systems are mostly based on the use of classifiers. The
most famous and commonly used face detection scheme in this category is the Viola-Jones face
detection algorithm [30]. It is able to efficiently detect neutral frontal faces as it has been trained
with a large database of faces. Detailed information about this method will be explained in
section 3.3.
Erdem et al. combined two methods of face detection for more accurate and reliable results [31].
The first method is the Haar feature based face detector, which was developed by Viola and
Jones [32]for gray scale images and the second method is a skin color filter, which provides
complementary information in color images. In their method, the image is passed through a Haar
feature based face detector, which has a high number of false detection and low number of
missed faces. Then, the skin-color post-filtering method is used to eliminate many of these false
detections.

17
2.2.2.2 Eye Closure
Different methods of driver’s fatigue detection are implemented by other researchers
specifically focussed on changes and movement in the eyes. These techniques analyze changes in
the driver’s direction of gaze, eye closure and blinking rate.
As people become drowsy, their blinking patterns change. Sigary proposed a method of hypo-
vigilance detection by processing of the eye region and without an explicit eye detection stage
[33]. In order to extract symptoms of fatigue and distraction, a horizontal projection of the top
half segment of the facial image is required. For drowsiness determination, the percentage of eye
closure and eyelid distance changes over time.
Another drowsiness detection method based on eyelid movement was proposed by Liu et al.
[34]. In their method based on the eyelid changes from a temporal differences image, the fatigue
situation will be analyzed. The number of white pixels can be used for the fatigue judgement
criterion in the first step. Then, the number of pixels with positive change in the three level
difference image and the number of pixels with negative change between current frame and
previous frame will represent eyelid movement from open to closed, which will be useful as an
indicator of drowsiness.
Omidyeganeh et al. [35] used a method of fatigue detection by applying the Structural Similarity
Measure to find the eye location. In their method, structural similarity measure value will be
evaluated between -1 and 1. When two images are the same, the max gained value will be 1 and
when there are some differences, the result will be -1. Then the horizontal and vertical projection
will be applied on the eye region to determine the amount of eye closure and align the detected
eye region.

18
Tabrizi and Zoroofi [36]proposed a non-intrusive and simple way of fatigue detection by
determining whether the eye is open or closed. In their algorithm the three steps were analyzed,
such as determining eye regions by eye map and locating pupil center by the center of mass of
the eye region image and the last step is refining the pupil center and detecting the iris boundary.
In order to analyze eye state for determining the drowsiness stage, a chromatic based algorithm
has been used, which has a better detection rate for closed eye.
The paper presented by Arimitsu [37] discussed the method of awakening drivers based on seat
belt vibration as a stimulating device. The seat belt motor retractor produces the vibration
stimulus, which was composed of pulsation tension. The key components that determined the
awakening effect of the stimulus are magnitude, duration and repetition rate of the additional
tension. The driving simulator is used to measure the driver’s drowsiness by detecting changes in
the driver’s eye movements measured by electrooculography. Any changes in facial expression
of the driver observed by the examiners through a video camera, subjective evaluation and lane
deviation are also useful to determine fatigued drivers.
2.2.2.3 Yawning
Azim et al. [38] propose a yawning detection system that relies on eye closure duration measured
by information about eye state and yawning analysis based on mouth condition. Face detection
by use of the Viola-Jones theory [32] was the first step in their method to eliminate the frame
region in the face area to reduce the search area. The state of eye closure is used to determine the
vigilance and fatigue level of the drivers, which also depends on choosing the best candidates
from the bright blob in the upper half of the face in which the size, intensity, position and
distance are considered. The mouth is detected by using spatial fuzzy c-means (s-FCM)
clustering in the extracted mouth window from the face region. For analyzing the drowsiness of
19
the driver, the width to height ratios of eyes and mouth are used as inputs for the support vector
machine for classification. The support vector machine determines the state of driver drowsiness
based on closed or half open eyes in several consecutive frames with or without yawning
condition at the same time. The alarm is generated after the system concludes that the driver is in
a critical condition and must rest.
In order to find the state of driver drowsiness, Yufeng et al. [39] proposed a method focused on
finding the face in the first step. This step can be determined by using the difference in images
between two images in a sequence of images. The adaptive threshold method can be used to
segment the moving area that the face and head outline are in for this localization. The location
of the chin and the nostril area are determined in the next step based on considering the location
of the chin in the lower half of the face region. The directional integral projection will be used to
find the midpoint of the nostrils. The yawning state is determined based on calculating the
distance between the chin and the location of the midpoint of the nostrils.
Driver’s fatigue is detected in the proposed method of Saradadevi et al. [40] based on tracking
mouth condition and recognizing yawning. In their method, the cascade of classifiers proposed
by Viola-Jones [32] was used in order to find the mouth location. A cascade of boosted
classifiers of simple Haar-wavelet features on different scales and positions is calculated by
canny integral image. The Adaboost learning algorithm is then utilized to select the combination
of features and find the mouth location. The support vector machine is then applied to produce a
prediction model for the target value of data instances in the testing model. The support vector
machine trains the mouth and yawning images by transforming data to the support vector
machine software and conducts scaling on the data by using the Radial Basis Function Kernel.

20
The support vector machine supports the method to find the yawning condition and alert the
driver in case of drowsiness.
In the method proposed by Ying et al. [41], driver fatigue and drowsiness are determined by
monitoring the changes in the state of the mouth and eyes’ positions. In terms of face detection,
their method considers the skin color as the most important feature that can be separated from
another part of the background by using the maximal varieties variance threshold. Mouth
location will be found by applying horizontal and vertical projection in the face area considering
the color red as a key component for this method. In order to find the state of the driver’s
alertness level, a BP neural network consisting of the main characteristics of the mouth and eyes
is required. The driver’s lips and eyes’ features will be added to the mentioned neural network as
an input to train it in order to be able to recognize between the normal position and yawning and
also the closed eyes’ conditions. Derived results from the neural network show if the driver is in
a state of decreased alertness.
The robust and reliable method of face detection based on the Viola-Jones theory [32] has been
used by Wang and Shi [42] in order to limit the mouth search area to the face region. The mouth
region will be located based on multi-threshold binarization in intensity space and also using the
Gaussian model in RGB color space. The lip corner will be found by calculating the integral
projection of the mouth in the vertical direction. The two lines running through the lower and
upper lip boundaries resulting from the integral projection represent the mouth openness. In this
method, the yawning stage will be determined by finding the degree of mouth openness in terms
of the aspect ratio of the mouth bounding rectangle. A large mouth openness over a predefined
threshold for a continuous number of frames means that the driver is in a state of drowsiness.

21
Two cameras are used in the proposed method of Li et al. [43] to detect driver’s fatigue in real
time. In their method, one low resolution camera was installed in the car to supply the driver’s
head position and one high resolution camera to locate the mouth region in each frame. Skin
color as a significant feature of face was used to detect the driver’s face location based on its
exclusive characteristic in the Cb and Cr color space. Haar-like features were used to locate the
mouth in each frame and the historical position of the mouth was used to track the mouth in a
series of frames. In order to determine the yawning condition, the ratio of mouth height and
width was studied.
In the method studied by Fan et al. [44], the driver’s face was detected by using a Gravity-Center
template. Once the face is located, the information about facial organs can be located roughly.
The horizontal grey projection is used to detect the mouth’s left and right corners. Similarly, the
vertical corner of the mouth will be found by applying the vertical grey projection on the face.
Gabor wavelet is used in the next step to detect mouth image features. At the end, the linear
discriminant analysis is taken as a classifier to detect yawning.
Jimenez et al. [45]described a new method of fatigue detection in drivers based on the percentage
of closing eyes and detection of yawning and nodding. After finding the face region by using the
Viola-Jones theory, the eye and mouth will be located based on the candidate region of interest
in the face area. After converting the image into gray scale, the threshold that was assigned by
using the histogram of each eye location will be applied on the area. The eye state will be
determined by analyzing the histogram of white sclerotic and identifying the shape of eye upper
curvature compared to the eyebrow. The yawning condition is detected first by threshold
calculation after histogram analysis by seeking the maximum concentration of pixels. When the
amplitude ratio of the mouth doubles its minimal size, the yawning situation is found.

22
Rongben et al. [46] in their method for fatigue detection analyzed the driver’s vigilance based on
mouth condition. In the first step of their development, the interest of area for the mouth was
selected by finding the face location using color analysis. In order to detect the mouth, skin and
lip pixels segmentation by Fisher classifier was applied. Then, lip features were extracted by
connected component analysis. Kalman’s filter was used to track the mouth in the video frames.
Three different mouth conditions, such as normal, yawning and talking state, were represented as
an output of BP ANN by analyzing the mouth region’s geometric features in order to make up an
eigenvector as the input of a BP ANN.
According to the method of Alioua et al. [47], drowsiness and fatigue conditions can be
determined by microsleep and yawning detections, respectively. Local Successive Mean
Quantization Transform is used at the beginning to detect face location. Then, the face is split up
according to Sparse Network of Winnows classifier. The Circular Hough Transform will be
applied on the eyes and mouth extracted regions in order to determine the yawning situation. The
yawning condition is detected if the large dark area with a circular form that shows the mouth is
widely open.
The fatigue detection system developed by Narole et al. [48] relies on the driver’s eyes and
mouth conditions. After finding a face region by skin color segmentation, the eye and mouth area
can be detected by a thresholding and segmentation process. For this purpose, the lip pixels can
be identified by using the Red/Green ratio, which has different values for skin and for lips. At the
end, the neural network along with genetic algorithm are used to detect the driver’s drowsiness.
23
Chapter 3 - Proposed Systems
To detect the drowsiness of drivers, the most important element is a reliable system to monitor
the driver and determine whether he/she is fatigued. Even though drowsiness is a concept that is
understood by anyone, it is a very complex task to quantify it.
Within the literature of drowsy driver research, drowsiness is frequently detected and rated based
on subjective, physiological, behavioral and performance based measurement. This section
proposes three implemented methods of drowsiness monitoring system based on yawning
detection in order to reach the goal of having a reliable and robust system. These three methods
are implemented and tested separately to get the accurate and real time system.
The first method focuses on fatigue detection in terms of color segmentation for finding face and
mouth location and the geometrical properties of mouth condition for determining the occurrence
of yawning condition.
The second method locates the face area based on template matching and color segmentation.
The mouth area is acquired by color condition and actively applying a contour model, which will
be helpful to detect yawning condition since it has the nature of flexibility to get the form of the
mouth area.
The last method, which as will be shown later is more robust and accurate than the
other two methods, detects the face and mouth based on the Viola-Jones theory. The yawning
condition is determined by applying back projection theory and comparing the histograms of the
mouth in the first frame with the following frames.

24
Each method of drowsiness detection is discussed in detail below. Figure 1 – Yawning Detection
Algorithmshows the general algorithm of drowsiness detection system.
Figure 1 – Yawning Detection Algorithm

25
3.1 Color Segmentation
The driver fatigue detection procedure consists of different phases to properly analyze changes in
the mouth of the driver. These phases are categorized the same as shown in Figure 1 – Yawning
Detection Algorithmand each phase will be introduced in detail in the following sections:
3.1.1 Face Detection
Given a single image, the goal of face detection is to identify all image regions that comprise a
face regardless of its position, orientation and lighting conditions. Such a problem is challenging
because faces are non-rigid and have a high degree of variability in size, shape, color and texture
[49]. It is basically assumed that the camera is installed inside the vehicle facing the driver at a
fixed angle. Therefore, the problem of relative camera-face pose is less challenging in our case
while head position might still vary from driver to driver. There is also a great deal of variability
among faces including shape, color and size. The presence of facial features such as beards,
moustaches and glasses can also make a great deal of difference. The other important factor
consists of the lighting conditions. These are mainly affected by the environment light, which
can change depending on the weather conditions and time.
Keeping all the above considerations in mind, one of the functional ways to detect the face is by
detecting the skin color and texture. However, it should be noted that the detection scheme should
be invariant to skin type and change in lighting conditions. Therefore, a set of bounding rules can
be taken advantage of for different color spaces (RGB, YCbCr and HSV) in order to improve the
detection efficiency [50]. As it is shown in the following algorithm, these bounding rules were
applied with “if-AND” way. The RGB color space is used to detect skin color at uniform or
lateral daylight illumination and under flashlight illumination:
(R > 95) AND (G > 40) AND (B > 20) AND

26
(max{R, G, B} - min{R, G, B} > 15) AND
(|R - G| > 15) AND
(R > G) AND
(R > B) AND
(R > 220) AND
(G > 210) AND
(B > 170) AND
(R > B) AND
(G > B) (1)
The Cb-Cr color space is a strong determination of skin color. The following rules apply to this
color space:
(Cr <= 1.5862 * Cb + 20) AND
(Cr >= 0.3448 * Cb + 76.2069) AND
(Cr >= -4.5652 * Cb + 234.5652) AND
(Cr <= -1.15 * Cb + 301.75) AND
(Cr <= -2.2857 * Cb + 432.85) (2)
The last space to be used is the HSV space. Hue values exhibit the most noticeable separation
between skin and non-skin regions.
H < 25 and H > 230 (3)

27
The result of face detection based on color segmentation will be discussed in section 5.1.
3.1.2 Eye Detection
After detecting the face, the location of the eyes will be detected. The main reason behind locating
the eyes is to use them as a verification method in order to make sure that the location of the
mouth in the face is correctly detected (using the geometrical relation between eyes and mouth in
the human face).
In order to detect the eyes, the eye maps based on chrominance components are built [51]
according to the following equation:
{
} (4)
Figure 18 in section 5.1 shows the result of eye detection.
3.1.3 Mouth Detection
The next step towards yawning detection is to find the location of the mouth and lips. To do so,
the mouth area will be segmented in the face. The strong difference between lips color and face
color is used in this method. In the mouth region, the color red is the strongest component while
the blue component is the weakest [51]. In this method, the mouth area is detected based on color
information, after the face is located. The following equations (5) and (6) are used to generate the
mouth map:
(
)
(5)
∑
∑
(
⁄
)
(6)

28
The result of the mouth map formula on the face image will be the light area on the lower half of
the face, which shows the mouth region. This result will be shown in section 5.1.
3.1.4 Yawn Detection
Yawning detection is performed in two main steps: In the first step, the yawn component will be
detected in the face independent of the mouth location. This component is basically the hole in the
face as the result of wide mouth opening. In the second step, the mouth location will be used to
verify the validity of the detected component.
After skin segmentation, the largest hole located inside the face is selected as the candidate for a
yawning mouth. This hole is actually related to a non-skin area inside the face that can be related
to eyes, mouth or open mouth. It can be assumed that the open mouth will be the largest of the
three in a yawning state. In this way, a candidate for the yawning mouth is located. The
information will be used from the detected mouth to verify the detected yawning mouth.
3.2 Active Contour Model
This approach can be summarized in the following steps: The possible area where the face is
located is found based on skin segmentation. Then, the possible face candidates will be searched
for around those areas. To verify the possible matching of a region to a face, the Daubechies
wavelet will be first applied to the region and the first level horizontal component of the wavelet
will be taken. The result will highlight the edges, which helps in removing the background noise.
The vertical projection and the horizontal projection of the upper half of the region will be
calculated and its similarity with the projections of a template face will be measured. The details
of each step will be further explained in the following subsections. But before getting into the
details, we will briefly explain the wavelet and projection methods that are used in the proposed
approach.

29
3.2.1 Wavelet Transform
The Continuous Wavelet Transform (CWT) offers information on how to construct a time-
frequency representation of a signal. This transform provides a time and frequency localization
of the image. The continuous wavelet transform of a signal f(x) is determined by equations (7)
and (8):
∫
(7)
√ (
) (8)
In the above equation, φ* is the analyzing wavelet, which is called the mother wavelet. The
mother wavelet will be the reference in generating daughter wavelets, which are used in the
calculation of wavelet coefficients. These daughter wavelets are the translated and scaled
versions of the mother wavelet. Equation (8) shows an example of a daughter wavelet where
parameter “a” represents the scale and has to be positive and parameter “b” represents the
translation. As can be seen from the above equation, the continuous wavelet transform is
calculated by continuously shifting the mother wavelet function and calculating the correlation
between the daughter wavelets and the main function. Discrete Wavelet Transform (DWT) has
been proposed as an alternative to CWT and is more efficient in terms of implementation. DWT
decomposes the signal in different frequency bands with different resolutions. This is achieved
by passing the signal through a number of half-band high pass and low pass filters. Therefore,
DWT decomposes a signal into approximate and detailed sub-bands. The approximation part of
the wavelet transform is the result of the convolution of the image with a low pass filter and is
more robust against noise. Daubechies functions are among the most popular filter transfer
functions for DWT, which have been used for face detection.

30
3.2.2 Integration Projection
The integration projection is one of the most commonly used methods to extract the features in
image processing. This method maps a two dimensional region into a one dimensional vector
along either the horizontal or vertical direction. The one dimensional vector is the result of
summing up all the pixels in a specific direction (vertical or horizontal), which then reduces the
feature dimension [52]. In this case, the two dimensional intensity values within the face image
are reduced to one direction. The following equations (9) and (10) give the detailed process of
calculating horizontal and vertical projection:
[ ] ∑ (9)
[ ] ∑ (10)
Applying the wavelet transform formula on the face image in the color space will result in a gray
scale image. The intensity of the pixels in the gray image is proportional to the frequency
components in their neighborhoods. Therefore, the skin region of the face will turn black as there
is no significant high frequency component occurring in that area. On the edge of the face where
facial features occur, the pixels will get the value close to 1 since there will be a color change,
i.e. from skin to eyebrow, skin to eyes or skin to mouth on the face. The vertical projection can
be used on the upper half of the face to find the location of the eyes and the horizontal projection
can be used on the y-axis of the whole image to get the location of the eyes and lips [53].
Applying the wavelet decomposition to the resulting projection will help remove some of the
noise in the profile. The approximation result, using one dimension wavelet transform, will then
smooth the x and y profile and will eliminate the noises on the vectors. The average of the x-
profile and y-profile of 10 different faces with similar sizes was used to get the final template for
31
matching the one dimensional vectors with original images. Figure 21 in section 5.2 shows the
candidate faces and their wavelet transform.
3.2.3 Face Detection
As mentioned before, the first step towards face detection is to segment the possible areas where
the face is located based on the properties of human skin in the RGB and YCbCr color spaces.
The details of the skin color detection technique are explained in section 3.1.1. The output of the
skin segmentation step will be a black and white image where the bright regions are possible
locations of the face. This helps to remove a considerable amount of unnecessary details from the
background. However, it should be noted that the results might still include objects in the
background whose colors are close to skin color. Therefore, the output of this stage should go
through further processing to remove any areas that have been falsely segmented as face region.
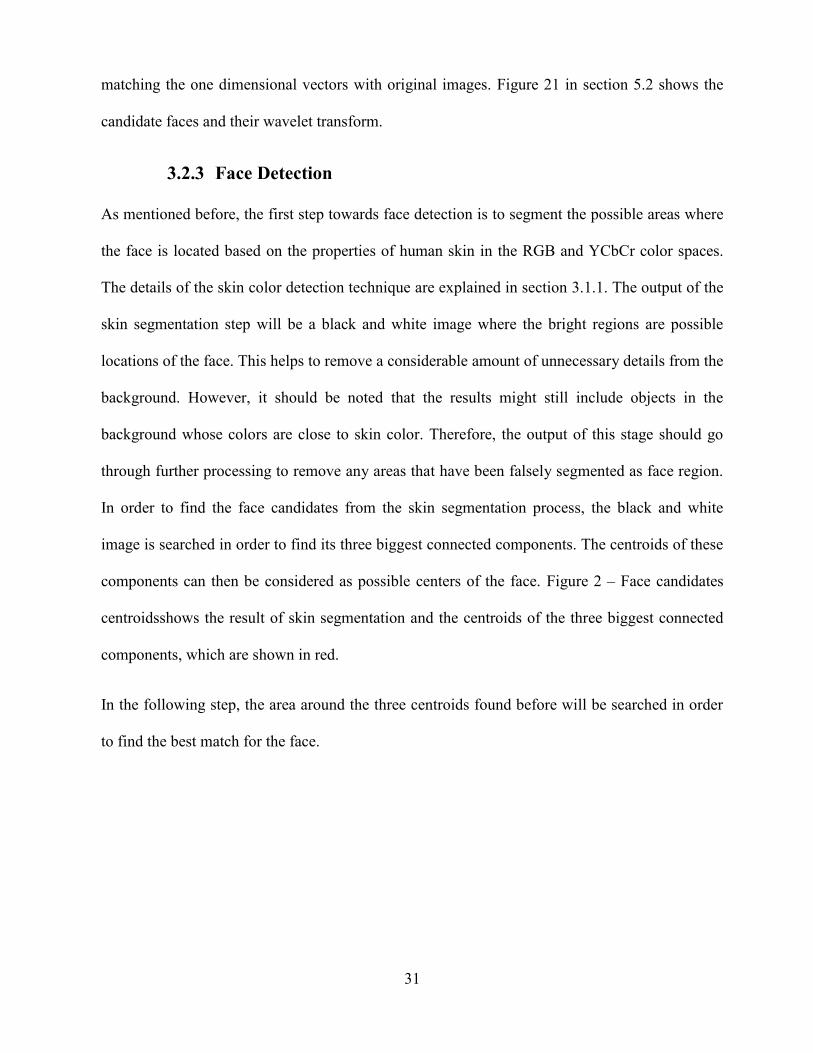
In order to find the face candidates from the skin segmentation process, the black and white
image is searched in order to find its three biggest connected components. The centroids of these
components can then be considered as possible centers of the face. Figure 2 – Face candidates
centroidsshows the result of skin segmentation and the centroids of the three biggest connected
components, which are shown in red.
In the following step, the area around the three centroids found before will be searched in order
to find the best match for the face.
32
Figure 2 – Face candidates centroids
3.2.4 Face Profile Matching
Once the face location candidates are detected, template matching can be applied to the area
around each candidate in order to find the exact location of the face. This step also helps to
distinguish the face region from other areas such as the neck that have been segmented as skin
region in the previous step. In order to find the exact location of the face, the area around the
centroids from the previous step will be searched for the best match with a template face profile.
The face profile is commonly defined as the horizontal and vertical projection of the face in gray
scale. However, a Daubechies wavelet will be applied to the face and the horizontal component
of the first level coefficients will be used as the input to the projection stage. The reason for
using the vertical wavelet coefficients instead of the original image is the effectiveness of the
wavelet in removing the profile noise that is caused by the change in lighting and shadows.
After applying the Daubechies wavelet on the faces, the edges are shown to be well detected and
the noise level is quite low. This will be the input to the projection calculation step. After
applying the wavelet to the face, the Y-profile and the X-profile of the upper part of the face are
calculated. The shape of these profiles pretty much defines the feature point characteristics
fFigure 3.

33
Figure 3 – Average Y-Profile and X-Profile
Figure 3 – Average Y-Profile and X-Profileshows the Y-profile and the X-profile of a sample
face. As can be seen in figure 3, the Y-profile has peaks that relate to the location of the
eyebrows, eyes, nose and mouth and the upper face X-profile has peaks that relate to the eyes.
Therefore, the matching of these profiles to the profile of a region can be a measure of the
similarity of that region to a face. The similarity measure that is proposed to use is Dynamic
Time Warping (DTW). DTW is an effective technique for measuring the similarity between two

34
sequences independent of their shift and scaling. Therefore, it is a good similarity measurement
technique for the face profiles as it can reveal the similarity of two face profiles even if the faces
have different sizes or the location of the facial features slightly shift (one has a longer forehead
than the other…). Prior to the start of the profile matching process, a template profile that best
represents a face is required. The template profile image is found by applying the wavelet
transform and integration projection to the images of a face database and averaging over the
whole normalized set. The resulting projection will then be used as the template in the detection
process. The face detection procedure starts by finding the x-profile and y-profile of face sized
regions in the vicinity of the centroid points from the skin segmentation results. The size of the
face is defined to be in a range that covers the size of all the possible faces that should be
detected. The DTW distance is then calculated between the profile of the candidate region and
the template profile. At the end of the template matching process, the location of the face is
defined as being the region whose profile has the lowest distance to the template profile
according to DTW measure.
3.2.5 Face tracking
Having found the face in one frame, the detected face can be used as a template and the program
can start tracking it in the subsequent frames until the system loses track of the face and the face
must be detected again. The basic idea behind the tracking process is to use a Kalman Filter to
predict the next location of the face and search around the predicted location for the best match
with the template face. The similar measure that is used in the template matching process is 2D
correlation. The location of the face is determined as the location where the correlation is the
maximum with respect to the template face. If the correlation results go below a certain
threshold, the system loses track of the face. Therefore, it goes back to the face detection phase
to detect the face again. This might happen in the cases when the driver moves his/her head

35
faster than usual or turns his/her head to left or right. After the detection of the face, the mouth
contour should be detected and tracked. This will be discussed in the following section.
3.2.6 Mouth Detection
After the detection of the face, the mouth region is selected at the bottom half of the face area.
The first step towards mouth segmentation is the usage of the color properties of the mouth in
order to highlight the mouth in the face area. In the mouth region, the color red is the strongest
component compared to the green and blue components. Such a property can be exploited into
defining a mouth map function that highlights the mouth area when it is applied to the face
region. Section 3.1.3 explains the detailed process of finding the mouth map based on the red-
difference and blue-difference Chroma components. The output of applying the mouth map to
the face is a gray scale image where brighter pixels represent the mouth area. Even though the
mouth area is highlighted in the output, there might be some other regions that have been falsely
classified as mouth according to mouth map criteria.
Therefore, a post processing steps such as dilation, erosion and finding the biggest connected
component technique can be used in the area to find the mouth location. After detecting the
mouth, the active contour model will be applied in that area to find the mouth contour with a
better precision. The advantage of the active contour model (snake contour model) will be
utilized to extract the mouth contour. The use of the active contour model is an efficient way of
segmenting the mouth after the mouth color map is applied and the mouth is highlighted in the
face. The snake model is pretty useful compared to the first method in a yawning detection
system for detecting the lip contours in the face, as it is quite robust against the noise that is
present due to the inaccurate segmentation of the mouth in the mouth map.

36
Figure 4 – An example of face and mouth contour detection
The concept of snake contours will be briefly explained in this section. The snake method aims
at spline interpolation of a line around object boundaries. It starts from a set of initial points in an
image and deforms in several iterations to reach the object boundaries in the image.
The change in the shape of the snake is deformed in a way to minimize three sets of energies that
are known as internal, external and constraint energies. External energies are defined by image
boundaries that attract the snake towards themselves. Internal energies determine the internal
energy of the spline due to stretching and bending. External energies are related to the image
forces. The external source of energy from the image causes the snakes to be attracted towards
lines, edges and termination points in the image. The external energy coming from the image is
therefore the sum of the energies from lines, edges and termination points as defined in the
following equation (11):
(11)
Finally, the constraint energies are related to external constraint forces.
The total image energy can be expressed as a weighted combination of the three energy
functions. The overall energy function minimized by the snake is defined in the following
equation (12):

37
∫
(12)
where V is the set of points on the snake. The use of snake contours in lip reading has been
previously discussed in [54] [55]. The aim of this part is to find a snake on the external lips, in
which case the snake will then be updated, as the shape of the lips changes over time. Once the
snake reaches the boundary of the object, it starts to settle down in the boundary and move more
slowly. If the object moves slightly, the snake is able to track the motion and reside in the new
boundary. In the following section, the use of snake contour patterns for detection of yawning in
a video will be discussed.
3.2.7 Yawn Detection
The yawn is assumed to be modeled with a sequence of large vertical mouth openings. When the
mouth starts to open, the mouth contour area starts to increase. The mouth normally opens much
wider in yawning condition compared to speaking and the mouth opening cycle is longer in the
yawning situation. This helps to differentiate yawning from speaking. Figure 5 – Changes in
mouth contour area during yawningshows the changes in the mouth contour area in the 38
frames where a yawn is happening.

38
Figure 5 – Changes in mouth contour area during yawning
We have applied the active contour model to more than 50 yawning images and yawning to more
than 10 videos with different characteristics. The videos have been recorded in various
conditions such as different light reflection and directional lightings. The result will be discussed
in 5.2.
3.3 Viola-Jones Method
The third method towards drivers’ yawning detection will be explained in this section. This part
will present a working system that is capable of real time monitoring of a driver to detect
drowsiness based on yawning detection. The platform is an embedded real time video processing
system that analyzes the video recorded by the camera installed either under the front mirror or
on the dash of the car in front of the driver. The hardware and its associated cameras are based
on CogniVue Corporation’s APEX automotive smart camera platform. The APEX core has 96
parallel Computational Units (CUs) running in parallel with an ARM processor as the data
distribution and collection unit. The computer vision software has been developed specially for
this specific hardware and application, and is composed of several blocks including face
detection, face tracking, mouth detection, mouth tracking and finally yawning detection based on
the state of the mouth. These are the same as the previous methods, since, looking for the
yawning condition in the whole frame with changing light and background condition is a
cumbersome task; hence, the search space is first reduced by finding the face in video frames. In
this method, the face and mouth detection technique is based on the Viola-Jones theory [32],
which is a fast and robust method for object detection. The results of applying the third method
on the dataset videos showed that the performance of this method is fast and can be considered
as real time with high accuracy compared to the other two methods. Therefore, the C++

39
implementation of Viola-Jones is ported to the embedded platform and optimized to meet the
real time requirement of the monitoring system. Viola-Jones takes advantage of Haar-like
features that can be computed very fast using the integral image. Moreover, it uses AdaBoost for
feature selection and a cascade of classifiers that help decrease the misclassification error and
increase the detection time due to early rejection in the first stages. Starting from the C++
implementation of OpenCV, the code is redesigned in order to make it compatible with the
parallel processing architecture of the APEX platform. The code is also simplified as much as
possible to make the porting process easier while trying to preserve its functionality.
The specification of the platform will be discussed in the following section before explaining the
third method in detail.
3.3.1 Platform Specification
The automotive APEX platform contains the CogniVue CV2203 highly-programmable Image
Cognition Processors (ICP). It consists of an ARM 926EJTM 350MHz master processor, 34B
Ops/sec low-power DSP subsystem using patented massively parallel Array Processor Unit
(APU), a second 350MHz ARM 926 processor, H/W acceleration blocks, wide-bandwidth
stream DMAs, internal dual 64-bit AXI data buses to/from all blocks, 16Mbyte DDR SDRAM,
and 1Gbit NAND Flash. While it supports 96 parallel Computational Units (CUs) which allow
heavy massive processing, and can encode/decode D1 MPEG4 video at 30fps, the platform does
not support floating point operations, divisions, or numbers larger than 16 digits. These
limitations cause specific design and implementation choices.
To overcome lack of floating point operation, fixed point operation was used by scaling all the
floating point numbers by 2N to discard the digits after the floating point. In this case N depends
on the number of required floating point digits to maintain enough accuracy. The number 2 is
40
selected (instead of the more intuitive 10) since scaling by powers of two has the advantage of
easily shifting numbers to right and left for multiplying and dividing by 2 without using floating
number operations. Both sides of all operations required scaling, so that scaling won't affect the
final results.
Another layer of scaling was applied to prevent overflow in intermediate results, due to the
limited number of digits per number. For example, to multiply a few big numbers and then
divide them by a big number, even though the final result is less than 16 bits, there is overflow in
the intermediate multiplication result. The approach was to scale those numbers down before
multiplying them, and then scaled up the result.
Design and implementation for the real time performance of the system on the computationally
limited hardware comes with its own set of challenges, which will be discussed in the following
sections in further detail but first, the detailed explanation of the Viola-Jones theory will be given
in 3.3.2.
3.3.2 Viola-Jones Theory
The method of object detection using the Viola-Jones theory is capable of processing images
extremely rapidly while achieving a high detection rate. There are three main techniques
involved with this model. The first technique is an integral image, which is useful for very fast
feature evaluations. The second technique is a process for creating a classifier by selecting a
small number of features using Adaboost. The last technique is a method of combining
classifiers in a cascade structure.
In the first step, the integral image is applied on each frame in order to find Haar-like features.
Since features can act to encode ad hoc domain knowledge that is problematic to learn using a

41
finite quantity of training data and also, the feature based system operates much faster than the
pixel-based, therefore, the object detection system is designed based on features rather than
pixels. Three kinds of features that are reminiscent of Haar basis functions are used in the system
for it to work properly. The following figure 6 shows all three kinds of features. A two rectangle
feature is computed by calculating the difference between the sum of pixels within two
rectangular regions. A three rectangle feature calculates the sum within two outside rectangles
subtracted from the sum in a center rectangle. The last kind of feature is a four rectangle feature,
which is determined by finding the difference between diagonal pairs of rectangles.
Figure 6 – Rectangle Features
In order to find the rectangle features, the concept of integral image can be used. The value of the
integral image at any point (x, y) contains the sum of all the pixels above and to the left of (x, y)
inclusive:
∑ (13)
where is the integral image and is the original image.

42
Figure 7 – Haar-like features
Furthermore, the summed area can be calculated in a single pass over the image by considering
the fact that the value in the summed area at (x,y) is:
(14)
After computing the summed area, any one of the Haar-like features can be evaluated in constant
time at any scale or location with just four array references, which are shown in Figure 7.
∑
(15)
In the next step, a small number of important representative features will be selected to construct
classifiers. Since within an image sub-window the number of Haar-like features is very large, the
learning procedure must ignore the majority of the available features, and focus on a small set of
critical features that play the most important role in the classification decision. The AdaBoost
algorithm is utilized in the system to select these key features and to train the classifier. In order
to boost the classification performance of a simple learning algorithm, the Adaboost learning
algorithm is required to combine a collection of weak classification functions to form a strong
classifier. Each weak classifier can be dependent on only a single feature, therefore, selecting a
new weak classifier, can be considered as a feature selection process. A large set of classification

43
functions is combined using a weighted majority vote; however, this task is challenging to assign
a large weight with each good classification function and a smaller weight with poor functions.
The weight will be initialized at the beginning by
where m and L are the
number of negatives and positives respectively. Then the weight will be normalized by
∑
(16)
where is a probability distribution. The classifier will be trained for each feature, j and the
error will be determined with respect to .
∑ | | (17)
The classifier with the lowest error will be selected and the weight will be updated at this stage
by:
(18)
The final strong classifier will be determined by the following equations:
{ ∑
∑
(19)
where
.
The last step towards face detection is to construct a cascade of classifiers that increase the
detection performance while radically decreasing computation time. The main goal of this part is
to ensure that simpler classifiers are constructed to reject the majority of sub-windows before

44
using more complex classifiers in order to achieve low false positive rates. The stages of the
cascade are started with a two feature weak classifier, which causes the detection performance to
be far from acceptable as an object detection system. Three processing steps are required to be
done for the classifier to reduce the number of sub-windows, such as: 1- estimate the feature
rectangle, 2- evaluate the weak classifier for each feature and 3- combine a number of a few
classifiers to build a strong classifier.
In the procedure of detecting an object, the system starts by analyzing the result of the first
classifier and the positive result of this classifier triggers the evaluation of a second classifier.
The second classifier is adjusted to achieve very high detection rates and the result from this
classifier triggers the third one, which faces more tasks than the previous ones and the same steps
will be continued for the next classifiers. A negative result at any point in the procedure will lead
to the fast rejection of the sub-window. The algorithm of the detection cascade is shown in
Figure 8.
Figure 8 – Cascade of Classifiers
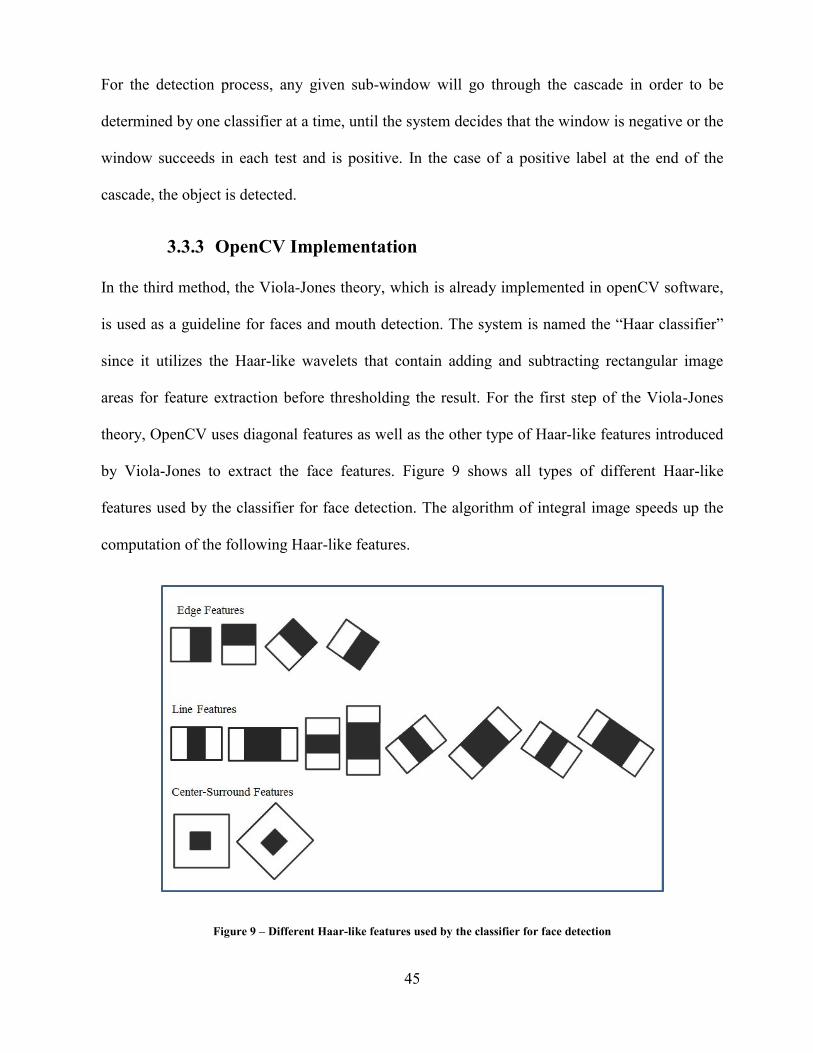
45
For the detection process, any given sub-window will go through the cascade in order to be
determined by one classifier at a time, until the system decides that the window is negative or the
window succeeds in each test and is positive. In the case of a positive label at the end of the
cascade, the object is detected.
3.3.3 OpenCV Implementation
In the third method, the Viola-Jones theory, which is already implemented in openCV software,
is used as a guideline for faces and mouth detection. The system is named the “Haar classifier”
since it utilizes the Haar-like wavelets that contain adding and subtracting rectangular image
areas for feature extraction before thresholding the result. For the first step of the Viola-Jones
theory, OpenCV uses diagonal features as well as the other type of Haar-like features introduced
by Viola-Jones to extract the face features. Figure 9 shows all types of different Haar-like
features used by the classifier for face detection. The algorithm of integral image speeds up the
computation of the following Haar-like features.
Figure 9 – Different Haar-like features used by the classifier for face detection

46
In the second step, for training the T weak classifiers, the boosting algorithm is required, which,
in this case, is composed of decision trees with at most a few (three) levels of splits in most
cases. In the final decision making procedure, a weighted vote is assigned by each of the
classifiers. Each split is determined by whether the value (v) of the particular feature (f) is below
or above the threshold (t).
{
(20)
The threshold value will be set in the first pass through the data set, which classifies the input in
the best way. The resulting error will be used by boosting to determine the weight vote. Then, the
feature will be reweighted low or high based on the correctness of classification.
The OpenCV face detection function was trained with a huge number of face and non-face
images with a fixed size of 20*20 pixels. The Haar-like features were applied on these images
and all the information about those features that have been selected using Adaboost from the set
of all features was saved in an .xml file in OpenCV. In order to detect a face based on the Viola-
Jones theory, the training algorithm in OpenCV uses 22 stages of classifiers with different
numbers of trees and nodes. Each stage includes a number of decision trees and the number of
decision trees gets larger resulting in more strong classifiers as we go to higher stages. For
example, the first stage has only 3 trees but the last stage, which is stage number 22, has 212
trees. All decision trees have only a single node.
A few lines of .xml for only the first stage are shown in Appendix A. The explanation of this
.xml part will be given in detail in the following part. . All other stages have the same pattern and
are stored in OpenCV open source files. Line 1 indicates that the training data set are vocalized
by the images of size 20*20.

47
Three trees are shown in the codes, each with its own properties and values. Lines 12 and 13
provide the information for the first two rectangle feature. The numbers given in line 12, <_>3 7
14 4 -1. </_>, are respectively x0, y0, width0, height0 and weight0 and belong to the first rectangle,
and the numbers in line 13, <_>3 9 14 2 2.</_>, are x1, y1, width1, height1 and weight1 and are
related to the second rectangle. Figure 10 shows the two rectangles on the coordinate system.
Figure 10 – Two Rectangles for the Calculating Feature
In order to find the value of the first feature, the following equation will be applied based on
using the integral image:
(21)
The result of decision_value1 will be compared to the threshold value, which is already defined
in line 15.

48
If the result of the decision_value1 is greater than the threshold, the value saved in right_val, in
line 17, will be returned and if the result from calculating decision_value1 is smaller than the
threshold, the saved value in left_val, line 16, will be returned.
{
(22)
The same procedure will be done for all the trees in each stage. After comparing the
decision_result of each tree with its own threshold and returning the value, that specific value
will be saved. At the end of the stage, all the values from each tree of its own will be added
together. The final result of the added value will be compared to the threshold of the stage
classifier, shown in line 41. If the result value is greater than the stage classifier, the voting
answer to the “detected face” will be yes (+1); otherwise, the voting answer will be no (-1),
which means the system could not find any faces in that area. The same algorithm will be applied
on all 22 stages and the result of the “detected face” number will be added together. If the sum of
the voting value becomes 22, it means all the stages are voted the face is located in that specific
location but if any of the voters gives -1 as a result, the algorithm will be rejected from the
location immediately and will be moved to the next location.
In the above algorithm, all trees were based on finding features by only two rectangles but in
general, there are some cases that have three rectangles involved in finding the feature.
3.3.4 Face Detection
The face detection algorithm in the third method is based on the Viola-Jones technique, which is
implemented in OpenCV, as was discussed in 3.3.3. The same concept as OpenCV face detection
was simplified in C++ and then transported to the APEX board.

49
In the first step of the face detection process, all the provided data of the trained features in
OpenCV will be extracted and stored in five separate files in order to use them in the algorithm
to save computational time in the real time monitoring system. These files, which are the results
of the training features, will be used later in the detection algorithm. In this case, the monitoring
system can utilize the saved value instead of training the classifier and applying the integral
image to find the features from the beginning. Each file contains one of the following groups of
data: feature_coordinate, feature_threshold, feature_val, stage_classifier and feature_weight.
For the face detection process, two tasks must be considered. As was already mentioned, the
Haar-like features are trained with a large number of 20*20 images but the face detection
algorithm does not necessarily detect only the faces with the same size. In order to overcome this
condition, the features must be scaled. In the case of having faces larger than 20*20, the feature
coordinates and the feature weight of each node will be rescaled. Therefore, the first task is to
search for the faces with different sizes depending on the difference between the driver’s face
and also their distance to the camera in the video frame. Therefore, different scale ratios of the
features were used to search for the face location in the implemented code, as is shown in Figure
11. The scale ratio varies based on the size of the face that is supposed to be detected.
In order to find the table of scale ratio for different face sizes, the possible face sizes for different
drivers based on the frame size were considered. For example, in the case of having a frame with
the size of 480*640 and considering the distance of the driver to the camera, we assumed the
largest possible face size can be 460*460 and the smallest face size can be 100*100. Therefore,
by taking this information into consideration, 18 scale ratios were assigned to detect the driver’s
face in the videos. In order to increase the speed of the detection system and shorten the
computation time required to scale the Haar-like features for different face sizes, all of the data
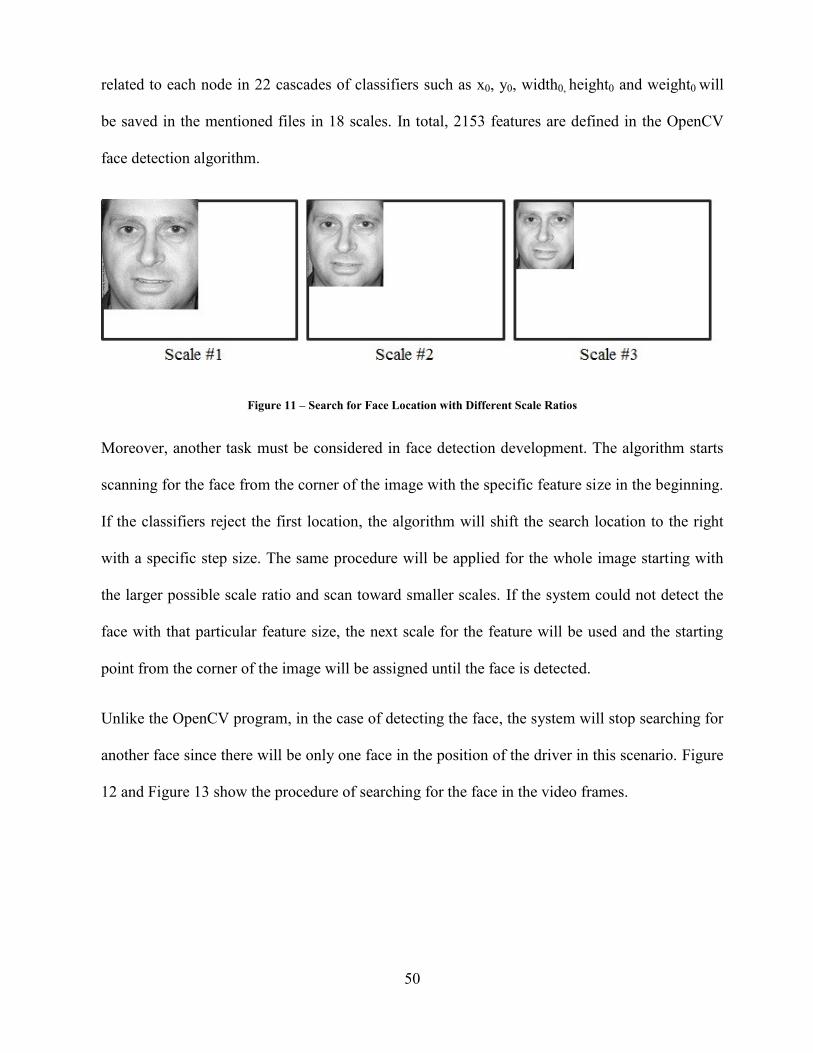
50
related to each node in 22 cascades of classifiers such as x0, y0, width0, height0 and weight0 will
be saved in the mentioned files in 18 scales. In total, 2153 features are defined in the OpenCV
face detection algorithm.
Figure 11 – Search for Face Location with Different Scale Ratios
Moreover, another task must be considered in face detection development. The algorithm starts
scanning for the face from the corner of the image with the specific feature size in the beginning.
If the classifiers reject the first location, the algorithm will shift the search location to the right
with a specific step size. The same procedure will be applied for the whole image starting with
the larger possible scale ratio and scan toward smaller scales. If the system could not detect the
face with that particular feature size, the next scale for the feature will be used and the starting
point from the corner of the image will be assigned until the face is detected.
Unlike the OpenCV program, in the case of detecting the face, the system will stop searching for
another face since there will be only one face in the position of the driver in this scenario. Figure
12 and Figure 13 show the procedure of searching for the face in the video frames.

51
Figure 12 – Search for Face Location in an Image
Figure 13 – Search for Face Location in an Image with Different Scale Ratios

52
The step size should be selected based on the face size; for example, it should be bigger for
bigger face sizes in order to expedite the search process.
Since the face tracking algorithm is not fast and accurate enough in the APEX board, the face
detection theory is applied on every frame to find the face location. After finding the face
location in the video frames, the x and y coordinates of the left corner of the face and the size of
the height and width of the face will be saved to eliminate the search area for detecting the mouth
location for the next step of the drowsiness detection.
3.3.5 Mouth Detection
After detection of the face, the mouth location must be extracted. A similar procedure as the face
detection will be utilized for this section. In addition to the face detection algorithm, OpenCV
has a mouth detection algorithm and feature. This mouth detector is computed with 7000 positive
samples.
A large number of normal mouth images in the size of 25*15 were used to train the classifier.
The OpenCV mouth detector contains 16 cascade classifiers and each has a different number of
trees. The first cascade in this case has 12 trees and the last cascade has 217 trees. The total
number of features for determining the mouth location is 1515.
Since the result of face detection has high accuracy, for the implementation of the mouth
detection algorithm in C++, the lower half of the face was the target of the mouth search region.
After locating the mouth in the frame, the data related to the mouth location and size will be
passed to the yawning detection part.

53
3.3.6 Yawn Detection
The last part of the process is to determine yawning in order to alert the driver in case of
drowsiness. The first step towards reaching this goal is to calibrate the system. This function will
be done by finding the location and histogram of the driver’s mouth in the first frame. The term
histogram is obtained by counting the number of times each color occurs in the image array. The
histogram of the normal closed mouth position in the first frame will be saved as a reference for
further calculation. For determining the yawning condition in this method, the back projection
theory will be used. The explanation of this theory will be presented first and then the usage of
this theory in the last method will be discussed.
The basic idea in back projection theory is to create a similar image giving the similarity of each
pixel of the candidate object to be matched (the candidate) to the object of interest (the
reference). Generally, the features used for back-projection are intensity values of the gray scale
image. In order to calculate the back projection, the histogram of the reference image, in this
scenario the normal closed mouth, will be computed and then the histogram of the candidate
images will be compared with the referenced one. In this case, the measurement results from an
image at each location over the specific region of interest should be taken to form an array. A
multi-dimensional normalized histogram array is constructed by sampling from the image array.
Each new image of the location of the mouth is selected and then converted into an image array
over a chosen region of interest. Then, the histogram bin will be determined for each of the
arrays that are related to the mouth region. The calculated new mouth histogram is compared to
the reference mouth histogram. This process is repeated for the mouth region of the entire video
frame. An appropriate threshold will be used to convert the gray scale image to black and white
based on the back projection concept. Then, the number of black and white pixels that show the
mouth area and the whole image area will be counted. In the case of having a yawning position,

54
the number of black pixels will be increased. Therefore, by comparing the number of black
pixels in each frame with the previous one, the mouth movement will be observed. If the order of
changes in black pixels shows that the black pixels are increasing and decreasing within a
specific number of frames and time, the yawning condition can be detected.

55
Chapter 4 - Dataset Collection
The face is a very non-rigid and complex structure; therefore, the appearance of a face is affected
by a large number of different factors including “identity, face pose, illumination, facial
expression, age, occlusion, and facial hair” [56]. As a result, to create reliable algorithms
sensitive to these facial variations, a sufficiently large dataset is required that includes “carefully
controlled variations of these factors.” This dataset contains static images of people in different
environment and also videos of people in the driving position. To collect the dataset, the
following components were configured:
1- Camera
2- Environment
3- Participants
4- Photos and Videos
Each component will be described in detail in the following sections.
4.1 Camera
To ensure a realistic setup, we worked with our industry partner CogniVue Corporation, whose
APEX line of products specialize in smart in-car camera systems. Two different locations for
installing the camera were considered in the video dataset collection. In the first scenario, the
camera was installed under the front mirror and in the second scenarios, the camera was installed
on the dash of the car. In both situations, the videos were collected using a Canon A720Is digital
camera with the resolution set at 640x480 pixels and 24-bit true color (RGB) at 30 frames per

56
second, resulting in a video that matches with the video produced by real driver monitoring
systems.
Beside in-car videos, 180 images were taken to test the system in the early stages of the
monitoring system development. These photos were collected randomly with different cameras.
4.2 Environment
In the dataset, the collected videos were taken in the car during day time. However, the videos
were recorded in various lighting situations in order to provide a more complete dataset. The
videos were recorded from early morning till sunset. Also, the weather varied from sunny to
rainy, causing different lighting conditions. It should be noted that there are no faces other than
the driver’s face in the videos, mostly due to the angle of the camera, although there is some
background movement in some of the videos, which include other people walking across the
frame. It should also be noted that night time videos were not collected, because for yawning
detection at night, either the lighting must be controlled in the car, in which case normal day time
detection approaches would work too, or else infrared cameras must be used to overcome the
extreme darkness of the image, which leads to completely different approaches of image
processing and computer vision.
The photos for the image dataset were collected in different locations. The participants were
asked to stand where the background is either simple or complex. A few participants were asked
to stay where the background has a similar color as the face color with different lighting
conditions to make the scenario more complicated and challenging for the face detection method
based on color segmentation.

57
4.3 Participants
The participants were asked to sit in the driver's seat and fasten their seat belt to make the
scenario more realistic for the video dataset. The dataset contains videos of 54 male and 44
female volunteers of different ages, ethnicities and facial characteristics. The statistics about the
participants will be discussed in section 4.5. A high variety of appearances existed among these
98 volunteers in the dataset. People participated with and without glasses, men with and without
beard, men with and without moustache, women with and without scarf, different hairstyles and
different clothing. Similar characteristics for the participants were considered in image dataset
collection, except the environment where the participants were being photographed excluded the
driving scenario. Figure 14 shows a random selection of eight of the volunteers for the video and
image dataset.
Figure 14 – Participants
All of the participants signed an agreement allowing their videos to be used for non-commercial
and research purposes, which is attached as Appendix A.
58
4.4 Videos
In the first scenario three sets of videos were taken. In the first video, the person was asked to sit
in the driver’s seat, fasten the seatbelt and act as if driving. In the second video of the same
person, she/he was asked to talk or sing while driving. This video can be used to distinguish
between talking/singing compared to yawning, where both scenarios might lead to an open
mouth but only yawning should be detected. In the third video of the same driver, she/he was
asked to wait for a few seconds and then yawn afterwards. The videos last between 15–40
seconds. A few participants were asked to have a fourth video of their yawning while they were
talking. These videos are more challenging for the researchers since the yawning happens right
in the middle of talking, and so it might be more difficult to detect the former. Finally, some
participants acted with and without their prescription glasses or sunglasses. After collecting 342
videos, the audio was removed to reduce size.
In the second scenario, in which the camera was located on the dash of the car, the drivers were
asked to sit on the front seat and fasten their seatbelt. In this scenario, only one video was taken
from each participant. The participants were asked to pretend that they were driving in normal,
talking and yawning positions in a single video. The combination of these three phases was
useful to improve the system in order to distinguish between these cases at the same time and
detect the yawning position accurately.
4.5 Basic Videos Statistics
As mentioned earlier, volunteers of different genders, ages and ethnicity participated in our video
dataset collection. Having a wide variety in participants gives a better and more reliable dataset
in order to increase the accuracy of yawning detection systems. The age distribution of the
participants is shown in Figure 15 and Figure 16.

59
Figure 15 – Female Participants
Figure 16 – Male Participants
We also included different facial characteristics. Statistically, we have videos for the
following:
Female participants:
With prescription eyeglasses: 10 people
With sunglasses: 10 people
0
5
10
15
20
25
16-20 20-30 30-40 40-up
Nu
mb
er
of
Par
tici
pan
ts
Age of participants
0
5
10
15
20
25
30
16-20 20-30 30-40 40-up
Nu
mb
er
of
Par
tici
pan
ts
Age of Participants

60
Without glasses: 33 people
With scarf: 3 people
Without scarf: 40 people
Male participants:
With prescription eye glasses: 25 people
With sunglasses: 5 people
Without glasses: 28 people
With moustache: 3 people
Without moustache: 45 people
With beard: 4 people
Without beard: 44 people
In terms of ethnicity, we have people with various skin, hair and eye color, including blonde,
brunette, Caucasian, African, middle-eastern and Asian individuals.

61
Chapter 5 - Results and Discussion
5.1 Color Segmentation
The first method towards yawning detection is based on color segmentation. This method is
divided into four phases, which are face detection, eye detection, mouth detection and yawning
detection. As is discussed in section 3.1.1, the face will be detected by highlighting skin color
based on applying the formula on different color spaces. The result of the skin location technique
is a black and white image that highlights the skin location by converting the face to white and
the background and the areas around the driver to black. This background elimination reduces
the subsequent errors due to false object detection in the background. The face is detected by
finding the biggest white connected component and then cutting that area.
Figure 17 – Skin Detection

62
After finding the face area, the eye will be located in the upper half of the face. The eye map
formula will be applied on the face region and it will highlight the eyes’ regions. Then, the eye
map image is converted to a black and white image using proper thresholding. This new image is
supposed to include the eyes in white while the rest is all black. However, several pre-processing
steps including erosion, dilation and finding the biggest connected components as eyes are
required. Moreover, some geometrical features of the eyes will be used in the final step to reject
the false detections. Therefore, the geometrical features are not used for detection and they will
be used only for verification purposes. Figure 18 shows the result of the discussed technique for
detecting eye location.
Figure 18 – Eye Detection by Applying Eye-Map
The next step is mouth detection based on the location of the eyes and considering the lower half
of the face. After applying the mouth map formula, which is discussed in section 3.1.3, the result
will then go through some post processing steps, such as black and white conversion, erosion,
dilation and finding the biggest connected components in the same way as the eye detection
scheme. The geometrical features of the face and relative location of the mouth with respect to the

63
eyes can be exploited in this step to verify the validity of the detected mouth. The result of the
mouth map algorithm after applying the pre-processing steps is shown in Figure 19.
Figure 19 – Mouth Detection by Applying Mouth_Map
After locating the mouth region, the next step is to determine whether the condition of the mouth
is yawning, talking or normal. As has already been discussed, the white area in the black
background shows the mouth area and the form of the mouth. As the white area getting larger it
means the mouth is changing into the yawning position. The verification criteria is the number of
pixels located in the yawning mouth with respect to the number of mouth pixels as well as the
relative location of the open mouth with respect to the lips. Therefore, if the driver is yawning,
his/her mouth will be widely open so the area of the white pixels will be increased. In this case, by
counting the number of white pixels compared to the number of the white pixels in the closed
mouth position and also by determining the ratio of the width and height of the white area, the
condition of the mouth will be determined. The result of the normal and yawning mouth condition
is shown in Figure 20.

64
Figure 20 – Yawn Detection
Color information is an effective tool for recognizing facial areas and specific facial features if
the skin color model can be accurately modified for different lighting environments. However,

65
such skin color models are not adequately suitable where the spectrum of the light source differs
significantly. In other words, color appearance is frequently not stable due to changes in both
background and foreground lighting [49].
5.2 Snake Contour Model
In the second method, for determining the yawning condition, the active contour model will be
applied on the mouth area. As is discussed in section 3.2.3 for locating the exact face area, the
template matching process with the template face profile is required. In order to find the face
profile, a Daubechies wavelet will be applied to random faces. Then, the vertical and horizontal
wavelet coefficient will be used instead of the original image. Figure 21 shows the result of
applying the wavelet to a number of images in a face database.
Figure 21 – Level 1 Daubechies Wavelet Transform
As is shown in Figure 21, the edges in the face profile are well detected and the noise level in
this case is quite low. Therefore, the template matching will be a suitable technique for this
method. The next step is to apply the mouth map formula, which was defined in section 3.1.3 on
the selected faces. As a result, the middle column of Figure 22 for each face condition will be
found.
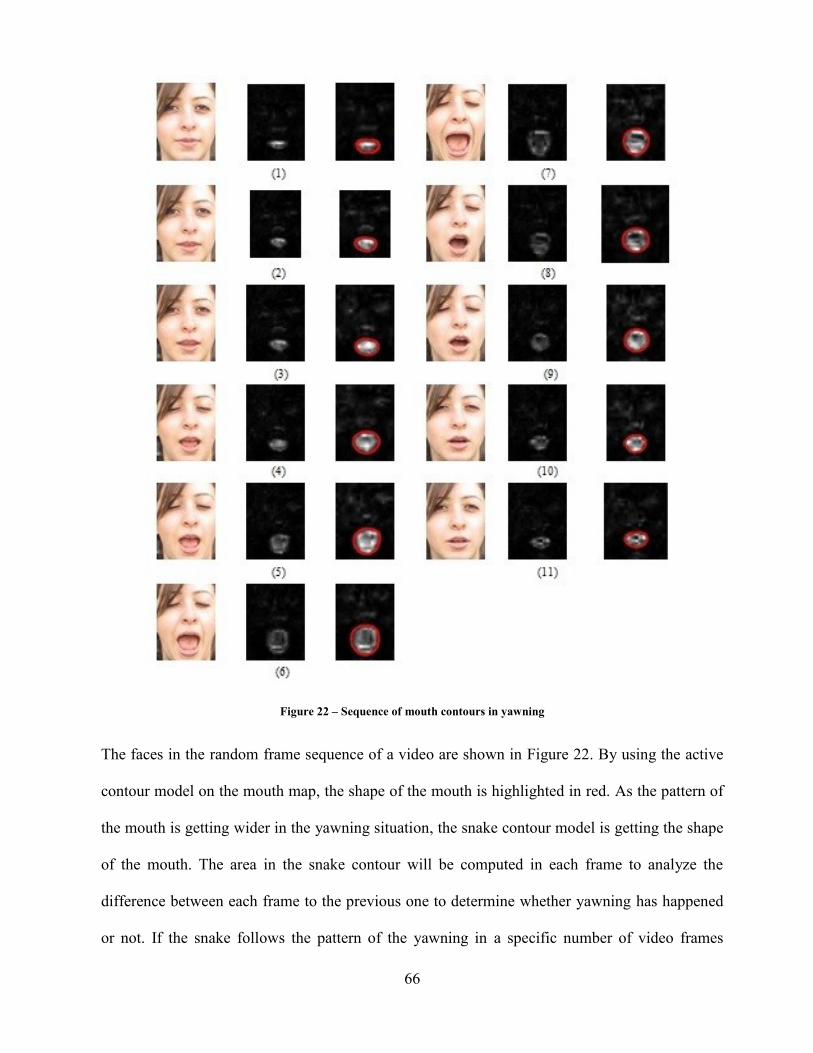
66
Figure 22 – Sequence of mouth contours in yawning
The faces in the random frame sequence of a video are shown in Figure 22. By using the active
contour model on the mouth map, the shape of the mouth is highlighted in red. As the pattern of
the mouth is getting wider in the yawning situation, the snake contour model is getting the shape
of the mouth. The area in the snake contour will be computed in each frame to analyze the
difference between each frame to the previous one to determine whether yawning has happened
or not. If the snake follows the pattern of the yawning in a specific number of video frames
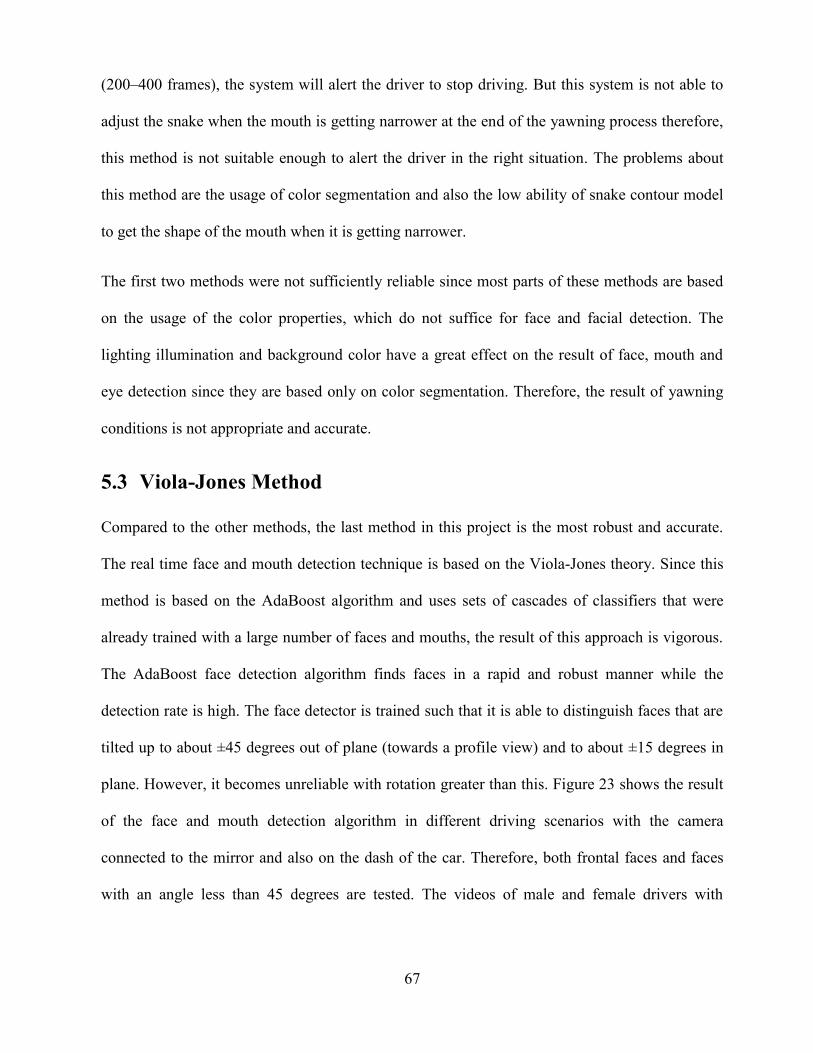
67
(200–400 frames), the system will alert the driver to stop driving. But this system is not able to
adjust the snake when the mouth is getting narrower at the end of the yawning process therefore,
this method is not suitable enough to alert the driver in the right situation. The problems about
this method are the usage of color segmentation and also the low ability of snake contour model
to get the shape of the mouth when it is getting narrower.
The first two methods were not sufficiently reliable since most parts of these methods are based
on the usage of the color properties, which do not suffice for face and facial detection. The
lighting illumination and background color have a great effect on the result of face, mouth and
eye detection since they are based only on color segmentation. Therefore, the result of yawning
conditions is not appropriate and accurate.
5.3 Viola-Jones Method
Compared to the other methods, the last method in this project is the most robust and accurate.
The real time face and mouth detection technique is based on the Viola-Jones theory. Since this
method is based on the AdaBoost algorithm and uses sets of cascades of classifiers that were
already trained with a large number of faces and mouths, the result of this approach is vigorous.
The AdaBoost face detection algorithm finds faces in a rapid and robust manner while the
detection rate is high. The face detector is trained such that it is able to distinguish faces that are
tilted up to about ±45 degrees out of plane (towards a profile view) and to about ±15 degrees in
plane. However, it becomes unreliable with rotation greater than this. Figure 23 shows the result
of the face and mouth detection algorithm in different driving scenarios with the camera
connected to the mirror and also on the dash of the car. Therefore, both frontal faces and faces
with an angle less than 45 degrees are tested. The videos of male and female drivers with

68
different facial properties were used and the face detection results for all participants were
acceptable.
Figure 23 – Face and Mouth Detection by Viola-Jones Theory
Method three based on the Viola-Jones theory works perfectly on the videos that were taken for
this purpose.
This method was tested on both, PC and APEX board. On the PC, our results showed that for the
videos where the camera is installed under the front mirror, the successful rate of detecting the

69
face is about 85%, but the rate of detecting the mouth and subsequent yawning is about 40% due
to the angle of the drivers’ face to the camera. For the videos where the camera is installed on the
dash, the face and mouth region are detected correctly and in real-time; and the success rate of
detecting yawning is 95%, since the camera captures a frontal view of the drivers’ face, making
detection easier. The mouth detection in this scenario is 85% and the yawning detection is 60%.
The result from this method is shown in figure 23.
On the APEX board, we only tested the real time demo where the camera is installed on table.
The success rate of face detection in this case was 90%, although the frame rate was not fixed as
it depends on the number of iterations required to locate the face, and that varies depending on
the location of the face in the frame, distance to camera and face size. On average, the speed of
detection for both face and mouth was 2-3 fps which is enough for yawning detection purposes.
The speed of tracking was much higher, over 20 fps, although it was less reliable than detection,
and during tracking the system needed to fall back to detection a lot more on APEX than on the
PC. The result of the yawning detection accuracy is determined by calculating the percentage of
changing the color of the frames around the mouth from red to green as the participant is
yawning. Overall, the average success rate for yawning detection was 80% on APEX.
This experiment was also presented as a demo in the conference; therefore, besides the collected
dataset videos, it was performed on different people who attended the conference in real time as
they sat in front of the camera and pretended they were tired.
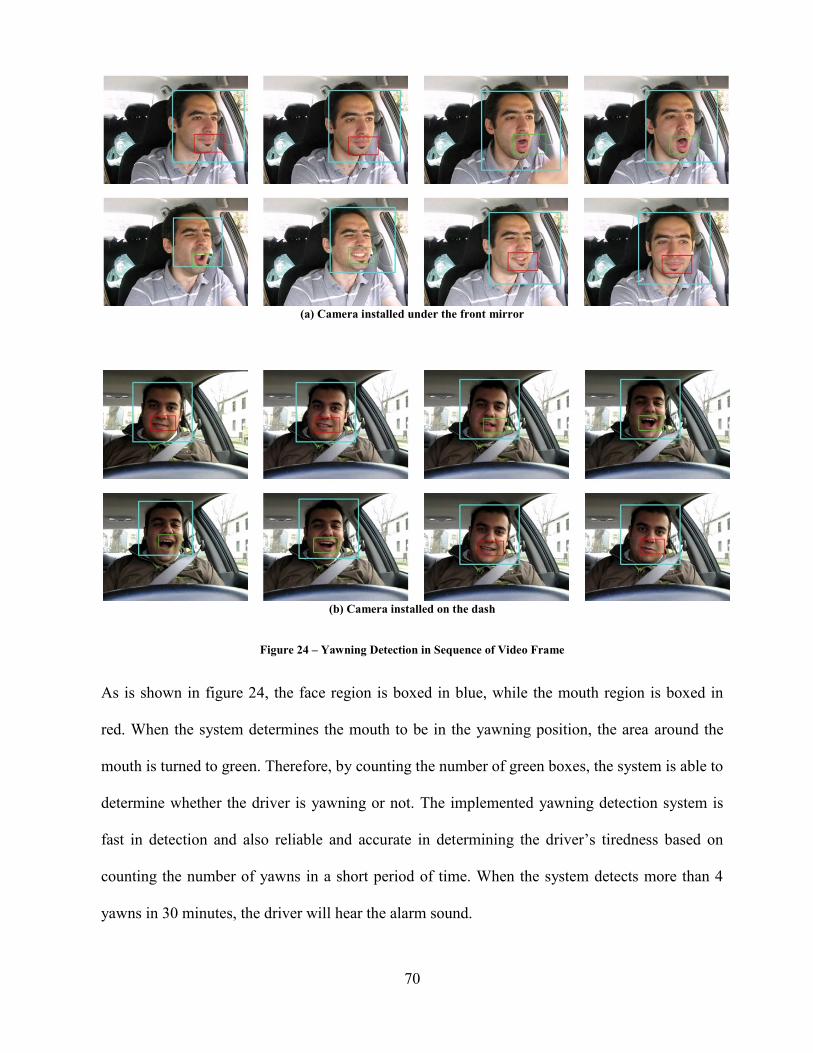
70
(a) Camera installed under the front mirror
(b) Camera installed on the dash
Figure 24 – Yawning Detection in Sequence of Video Frame
As is shown in figure 24, the face region is boxed in blue, while the mouth region is boxed in
red. When the system determines the mouth to be in the yawning position, the area around the
mouth is turned to green. Therefore, by counting the number of green boxes, the system is able to
determine whether the driver is yawning or not. The implemented yawning detection system is
fast in detection and also reliable and accurate in determining the driver’s tiredness based on
counting the number of yawns in a short period of time. When the system detects more than 4
yawns in 30 minutes, the driver will hear the alarm sound.

71
Before transferring the new simplified and modified codes on the APEX board, it was tested on
two sets of dataset and compared with OpenCV face and mouth detection. Tables 1 and table 2
show the results of face detection, mouth detection and yawning detection in modified codes.
Table 1 is based on running the code for 10 participant’s video, 5 female and 5 male, in the
scenario of the camera installation on the mirror.
Individual Video type Face
Detection
Mouth
Detection
Yawning
Detection
accuracy accuracy accuracy
Male 1
Normal 98% 92%
Talking/singing 100% 70%
Yawning 95% 75% 30%
Female 1
Normal 100% 100%
Talking/singing 100% 89%
Yawning 100% 90% 20%
Male 2
Normal 100% 82%
Talking/singing 100% 75%
Yawning 90% 80% 30%
Female 2
Normal 92% 90%
Talking/singing 76% 70%
Yawning 68% 40% 72%
Male 3
Normal 87% 80%
Talking/singing 95% 78%
Yawning 100% 70% 0%
Female 3
Normal 90% 85%
Talking/singing 78% 60%
Yawning 100% 80% 60%
Male 4
Normal 90% 70%
Talking/singing 80% 40%
Yawning 90% 32% 0%
Female 4
Normal 100% 100%
Talking/singing 95% 85%
Yawning 100% 90% 10%
Male 5
Normal 100% 10%
Talking/singing 45% 0%
Yawning 20% 0% 0%
Female 5
Normal 95% 20%
Talking/singing 90% 45%
Yawning 100% 58% 0% Table 1 – Camera installed on the mirror

72
The results of
the Viola-Jones
method are
more accurate
in the case
where the
camera is
installed on the
dash of the car
and recording
the driver’s
face from the
frontal view.
Table 2 shows
the results for
20 participant’s
video, 10
female and 10
male.Individual
Video type Face
Detection
Mouth
Detection
Yawning
Detection
accuracy accuracy accuracy
Male 1
Normal/
Talking/
Yawning
100% 98% 90%
Female 1
Normal/
Talking/
Yawning
100% 85% 92%
Male 2
Normal/
Talking/
Yawning
100% 88% 70%
Female 2
Normal/
Talking/
Yawning
100% 70% 88%
Male 3
Normal/
Talking/
Yawning
100% 85% 95%
Female 3
Normal/
Talking/
Yawning
90% 55% 0%
Male 4
Normal/
Talking/
Yawning
80% 40% 45%
Female 4
Normal/
Talking/
Yawning
100% 87% 80%
Male 5
Normal/
Talking/
Yawning
82% 70% 80%
Female 5 Normal/ 90% 75% 65%

73
Talking/
Yawning
Male 6
Normal/
Talking/
Yawning
100% 95% 30%
Female 6
Normal/
Talking/
Yawning
100% 70% 68%
Male 7
Normal/
Talking/
Yawning
70% 65% 0%
Female 7
Normal/
Talking/
Yawning
100% 95% 70%
Male 8
Normal/
Talking/
Yawning
100% 75% 50%
Female 8
Normal/
Talking/
Yawning
80% 78% 70%
Male 9
Normal/
Talking/
Yawning
80% 80% 50%
Female 9
Normal/
Talking/
Yawning
95% 80% 90%
Male 10
Normal/
Talking/
Yawning
98% 70% 60%
Female 10
Normal/
Talking/
Yawning
100% 95% 30%
Table 2 - Camera installed on the dash
74
Chapter 6 - Conclusion and Future Work
The experimental results were shown and discussed in the previous chapter. In this chapter, the
conclusions of the results, as well as recommendations for future work, are given.
6.1 Conclusion
This research analyzed three methods for detection of driver drowsiness, based on yawing action.
In the first and second methods, finding the driver’s face and mouth were dependent on color
segmentation under different illumination conditions. Skin color information was used to detect a
person’s face in an image since human faces have a special color distribution. For mouth
detection, the lip color was the focus of the system’s detection process because the color red is
held as the strongest component. However, this approach has two major problems: 1) in the case
of having too bright or too dark illumination, the system fails in skin or lip color detection and 2)
when the background has similar color distribution to the skin color, the system is not able to
identify the differences. In the second methods besides the two mentioned problems, the active
contour model was not suitable enough for yawning detection since it was not able to adjust itself
with the mouth shape in most cases. In the situation when the system fails to detect face location,
the mouth detection will fail accordingly since the system will search for the mouth location in
the face region candidate. Due to these problems, a third method was introduced, which is based
on the Viola-Jones theory. This method utilizes the face and mouth features in OpenCV xml
files. For yawning detection, the back projection technique was performed. The results from this
75
method have high accuracy and reliability, therefore, the algorithm was transferred to the
CogniVue APEX board. The demonstration platform uses a small camera, which is the same as
the camera that should be installed under the front mirror of a car in a practical scenario. The
output of the camera will be processed in the embedded platform and the results of face and
mouth tracking as well as yawning alert signal can be seen on the monitor that is connected to
the system. To make the system work without a computer and only on a computationally limited
embedded platform, much effort has been made in designing and optimizing algorithms and
codes in order for them to work in real time and without requiring advanced hardware platforms.
6.2 Future Work
The presented technique of detecting drivers’ drowsiness based on their yawning had various
limitations, which may be addressed as future work. The following recommendations have been
made for future research on the detection of driver’s drowsiness:
According to the statistical report from NHTSA, in general, far fewer drowsiness related
baseline epochs were recognized during the daylight hours while a greater number were
observed during darkness; therefore, having a hybrid system that uses data from both the
infrared and visible range will be more useful and necessary.
As having access to a database of thousands of yawning faces is not quite possible, the
particular approach that is not based on classifiers is used to adapt the face detection
system in this research. Due to the analysis of different methods, it is shown that when
the system is trained based on a large number of samples, it will be more accurate.
Therefore, training the yawning detection algorithm will be appropriate.
76
In order to have the option of installing the camera on either the dash of the car or on the
front mirror and also get the good results in both cases, re-training the Viola-Jones theory
for these two dataset will be useful.
Some drivers cover their mouth while yawning or they have different signs of sleepiness
like eye closure or falling head; in this case, future work may consist of combining the
detection of different fatigue signs.
The algorithm was tested under two different conditions. 1) In the computer: on the
collection of dataset videos, which was taken in the parked cars as is described in section
4, in the stable lighting condition and with a Canon A720Is digital camera. 2) On the
APEX board: in this situation, the board with the camera attached to it was located in the
lab under controlled lightning conditions. For future work, it would be better for the
system to be tested with the APEX board in the real driving scenario in different lighting
conditions to reduce the false detection error in the real time condition.
In the yawning condition, the rectangle around the candidate mouth changes from red to
green in the computer based condition; in the car scenario, the alarm system must alert
the driver to wake him or her up in the case of having a few numbers of yawning
condition in the short period of time.

77
Chapter 7 - References
[1] J.D.Lee, "Fifty years of driving safety research," Human Factors:The journal of the Human
Factors and Ergonomics Society, vol. 50, no. 3, pp. 521-528, 2008.
[2] S. Klauer, T. Dingus, V. Neale, J. Sudweeks and J. Ramsey, "The impact of driver
inattention on near-crash/crsh risk: An analysis using 100-car naturalistic driving study
data," Springfield, Virginia, 2006.
[3] . Tun er, L. ven , F. Co kun and E. Karsl gil, Vision based lane keeping assistance
control triggered by a driver inattention monitor," in IEEE International Conference on
Systems Man and Cybernetics (SMC), Istanbul, 10-13 Oct. 2010.
[4] W. Qiong, Y. Jingyu, R. Mingwu and Z. Yujie, "Driver Fatigue Detection: A Survey," The
Sixth World Congress on Intelligent Control and Automation, vol. 2, pp. 8587-8591, 2006.
[5] T. Pilutti and A. Ulsoy, "Identification of driver state for lane-keeping tasks," IEEE
Transactions on Systems, Man and Cybernetics, Part A: Systems and Humans, vol. 29, no.
5, pp. 486-502, 1999.
[6] A. Picot, S. Charbonnier and A. Caplier, "On-Line Detection of Drowsiness Using Brain
and Visual Information," IEEE Transactions on Systems, Man and Cybernetics, Part A:
Systems and Humans, no. 99, pp. 1-12, 2011.

78
[7] G. Furman, A. Baharav, C. Cahan and S. Akselrod, "Early detection of falling asleep at the
wheel: A Heart Rate Variability approach," Computers in Cardiology, pp. 1109-1112, 2008.
[8] S. Hu and R. Bowlds, "Pulse wave sensor for non-intrusive driver's drowsiness detection,"
in Engineering in Medicine and Biology Society, 2009. EMBC 2009. Annual International
Conference of the IEEE, Minneapolis, MN, 2009.
[9] K. Hayashi, K. Ishihara, H. Hashimoto and K. Oguri, "Individualized drowsiness detection
during driving by pulse wave analysis with neural network," in Proceedings of the 8th
International IEEE Conference on Intelligent Transportation Systems, Austria , 2005.
[10] G. Yang and T. Huang, "Human Face Detection in Complex," Pattern Recognition, vol. 27,
no. 1, pp. 53-63, 1994.
[11] K. Yow and R. Cipolla, "Feature-Based Human Face Detection," Image and Vision
Computing, vol. 15, no. 9, pp. 713-735, 1997.
[12] T. Leung, M. Burl and P. Perona, "Finding Faces in Cluttered Scenes Using Random
Labeled Graph Matching," in Proc. Fifth IEEE Int’l Conf. Computer Vision, Cambridge,
MA, 1995.
[13] S. Sirohey, "Human Face Segmentation and Identification," in Technical Report CS-TR-
3176, Maryland, 1993.
[14] H. Graf, T. Chen, E. Petajan and E. Cosatto, "Locating Faces and Facial Parts," in Proc.
First Int’l Workshop Automatic Face and Gesture Recogniction, 1995.

79
[15] C. Han, H. Liao, K. Yu and L. Chen, "Fast Face Detection via Morphology-Based Pre-
Processing," in Proc. Ninth Int’l Conf. Image Analysis and Processing, 1998.
[16] Y. Dai and Y. Nakano, "Face-Texture Model Based on SGLD and Its Application in Face
Detection in a Color Scene," Pattern Recognition, vol. 29, no. 6, pp. 1007-1017, 1996.
[17] R. Kjeldsen and J. Kender, "Finding Skin in Color Images," in Proc. Second Int'l Conf.
Automatic Face and Gesture Recognition, 1996.
[18] S. McKenna, S. Gong and Y. Raja, "Modelling Facial Colour and Identity with Gaussian
Mixtures," Pattern Recognition, vol. 31, no. 12, pp. 1883-1892, 1998.
[19] Y. Ying, S. Jing and Z. Wei, "The Monitoring Method of Driver's Fatigue Based on neural
network," in International Conference on Mechatronics and Automation, 2007, Harbin,
2007.
[20] D. Saxe and R. Foulds, "Towards Robust Skin Identification in Video Images," in Proc.
Second Int’l Conf. Automatic Face and Gesture Recognition, 1996.
[21] I. Craw, D. Tock and A. Bennett, "Finding Face Features," in Proc. Second European Conf.
Computer Vision, 1992.
[22] A. Lanitis, C. Taylor and T. Cootes, "An Automatic Face Identification System Using
Flexible Appearance Models," Image and Vision Computing, vol. 13, no. 5, pp. 393-401,
1995.
[23] I. Craw, H. Ellis and J. Lishman, "Automatic Extraction of Face Features," Pattern

80
Recognition Letters, vol. 5, pp. 183-187, 1987.
[24] A. Samal and P. Iyengar, "Human Face Detection Using Silhouettes," Int’l J. Pattern
Recognition and Artificial Intelligence, vol. 9, no. 6, pp. 845-867, 1995.
[25] C. Tsai, W. Cheng, J. Taur and C. Tao, "Face Detection Using Eigenface and neural
network," in IEEE International Conference on Systems, Man and Cybernetics, Taipei ,
2006.
[26] X. Liu, G. Geng and X. Wang, "Automatically face detection based on BP neural network
and Bayesian decision," in Sixth International Conference on Natural Computation (ICNC),
Yantai, Shandong, 2010.
[27] C. Shavers, R. Li and G. Lebby, "An SVM-based approach to face detection," in
Proceeding of the Thirty-Eighth Southeastern Symposium on System Theory, Cookeville,
TN , 2006.
[28] S. El-Khamy, O. Abdel-Alim and M. Saii, "Neural network face recognition using statistical
feature extraction," in Seventeenth National Radio Science Conference, Minufiya , Egypt ,
2000.
[29] J. Ruan and J. Yin, "Face Detection Based on Facial Features and Linear Support Vector
Machines," in International Conference on Communication Software and Networks, Macau,
2009.
[30] P. Viola and M. Jones, "Rapid Object Detection Using a Boosted Cascade of Simple
Features," in IEEE Computer Society Conference on Computer Vision and Pattern

81
Recognition, 2001.
[31] C. Erdem, S. Ulukaya, A. Karaali and A. Erdem, "Combining Haar Feature and skin color
based classifiers for face detection," in IEEE International Conference on Acoustics, Speech
and Signal Processing (ICASSP), 2011.
[32] P. Viola and M. Jones, "Robust real-time face detection," International Journal of
Computer Vision , vol. 57, no. 2, pp. 137-154, 2001.
[33] M. Sigari, "Driver Hypo-vigilance Detection Based on Eyelid Behavior," in Seventh
International Conference on Advances in Pattern Recognition, 2009.
[34] D. Liu, P. Sun, Y. Xiao and Y. Yin, "Drowsiness Detection Based on Eyelid Movement," in
2010 Second International Workshop on Education Technology and Computer Science
(ETCS), 2010.
[35] M. Omidyeganeh, A. Javadtalab and S. Shirmohammadi, "Intelligent driver drowsiness
detection through fusion of yawning and eye closure," in IEEE International Conference on
Virtual Environments Human-Computer Interfaces and Measurement Systems (VECIMS),
2011.
[36] P. Tabrizi and R. Zoroofi, "Open/Closed Eye Analysis for Drowsiness Detection," in First
Workshops on Image Processing Theory, Tools and Applications, 2008.
[37] S. Arimitsu, K. Sasaki, H. Hosaka, M. Itoh, K. Ishida and A. Ito, "Seat Belt Vibration as a
Stimulating Device for Awakening Drivers," IEEE/ASME Transactions on Mechatronics,
vol. 12, no. 5, pp. 511-518, 2007.

82
[38] T. Azim, M. Jaffar and A. Mirza, "Automatic Fatigue Detection of Drivers through Pupil
Detection and Yawning Analysis," in Fourth International Conference on Innovative
Computing, Information and Control , 2009.
[39] L. Yufeng and Z. Wang, "Detecting Driver Yawning in Successive Images," in The 1st
International Conference on Bioinformatics and Biomedical Engineering, 2007.
[40] M. Saradadevi and P. Bajaj, "Driver Fatigue Detection Using Mouth and Yawning
Analysis," IJCSNS International Journal of Computer Science and Network Security, vol. 8,
no. 6, pp. 183-188, June 2008.
[41] Y. Yang, J. Sheng and W. Zhou, "The Monitoring Method of Driver's Fatigue Based on
neural network," in International Conference on Mechatronics and Automation, 2007.
ICMA 2007, 2007.
[42] T. Wang and P. Shi, "Yawning detection for determining driver drowsiness," in
Proceedings of 2005 IEEE International Workshop on VLSI Design and Video Technology,
2005.
[43] L. Li, Z. Li and Y. Chen, "Yawning detection for monitoring driver fatigue based on two
cameras," in 12th International IEEE Conference on Intelligent Transportation Systems,
2009.
[44] X. Fan, B. Yin and Y. Sun, "Yawning Detection for Monitoring Driver Fatigue," in
International Conference on Machine Learning and Cybernetics, 2007.
[45] R. Jimenez, F. Prieto and V. Grisales, "Detection of the Tiredness Level of Drivers Using

83
Machine Vision Techniques," in Electronics, Robotics and Automotive Mechanics
Conference , 2011.
[46] W. Rongben, G. Lie, T. Bingliang and J. Lisheng, "Monitoring Mouth Movement for Driver
Fatigue or Distraction with One Camera," in Proceedings The 7th International IEEE
Conference on Intelligent Transportation Systems, 2004.
[47] N. Alioua, A. Amine, M. Rziza and D. Aboutajdine, "FAST MICROSLEEP AND
YAWNING DETECTIONS TO ASSESS," in PROCEEDINGS of the Sixth International
Driving Symposium on Human Factors in Driver Assessment, Training and Vehicle Design.
[48] N. Narole and P. Bajaj, "A Neuro- enetic System Design for Monitoring Driver’s Fatigue:
A Design Approach," in First International Conference on Emerging Trends in Engineering
and Technology, 2008. ICETET '08. , 2008.
[49] M. Yang , D. Kriegman and N. Ahuja, "Detecting faces in images: A survey," IEEE Trans.
Pattern Analysis and Machine Intelligence, vol. 24, no. 1, pp. 34-58, 2002.
[50] N. Rahman, K. Wei and J. See, "RGB-H-CbCr Skin Colour Model for Human Face
Detection," in In Proceedings of The MMU International Symposium on Information &
Communications Technologies, 2006.
[51] H. Rein-Lein, M. Abdel-Mottaleb and A. Jain, "Face detection in color images," IEEE
Trans. Pattern Analysis and Mechine Intelligence, vol. 24, no. 5, 2002.
[52] C. Chen, "Information Fusion of wavelet projection features for face recognition," in In:
Proc. International Joint Conf. on Neaural Network, Hong Kong, 2008.

84
[53] W. Miao-miao and L. Zhen, "Eyes detection based on One-Dimensional Wavelet
Transform," in International Symposium on Computational Intelligence and Design,
Hangzhou, 2010.
[54] M. Barnard, E. Holden and R. Ownes, "Lip tracking using pattern matching snakes," in
2002, Melbourne, Australia, The 5th Asian conference on Computer Vision.
[55] G. Chiou and J. Hwang, "Lipreading from color video," IEEE Transactions on Image
Processing, vol. 6, no. 8, pp. 1192-1195, 1997.

85
Appendix A –
XML Code for Stage 0 of Cascade
1- <size>20 20</size>
2- <stages>
3- <_>
4- <!-- stage 0 -->
5- <trees>
6- <_>
7- <!-- tree 0 -->
8- <_>
9- <!-- root node -->
10- <feature>
11- <rects>
12- <_>3 7 14 4 -1.</_>
13- <_>3 9 14 2 2.</_></rects>
14- <tilted>0</tilted></feature>
15- <threshold>4.0141958743333817e-003</threshold>
16- <left_val>0.0337941907346249</left_val>
17- <right_val>0.8378106951713562</right_val></_></_>
18- <!-- tree 1 -->
19- <_>
20- <!-- root node -->
21- <feature>
22- <rects>

86
23- <_>1 2 18 4 -1.</_>
24- <_>7 2 6 4 3.</_></rects>
25- <tilted>0</tilted></feature>
26- <threshold>0.0151513395830989</threshold>
27- <left_val>0.1514132022857666</left_val>
28- <right_val>0.7488812208175659</right_val></_></_>
29- <_>
30- <!-- tree 2 -->
31- <_>
32- <!-- root node -->
33- <feature>
34- <rects>
35- <_>1 7 15 9 -1.</_>
36- <_>1 10 15 3 3.</_></rects>
37- <tilted>0</tilted></feature>
38- <threshold>4.2109931819140911e-003</threshold>
39- <left_val>0.0900492817163467</left_val>
40- <right_val>0.6374819874763489</right_val></_></_></trees>
41- <stage_threshold>0.8226894140243530</stage_threshold>
42- <parent>1</parent>
43- <next>-1</next></_>

87
Appendix B –
Informed Consent Form
This research project is being conducted by the research group of Professor Shervin Shirmohammadi at
the School of Information Technology and Engineering of the University of Ottawa.
Purpose: This informed consent form is to make sure that you understand the nature of your involvement
in this study, and to obtain your informed consent to participate in this study.
Procedure: You will be asked to sit in the driver’s seat of a parked car. Three different videos have to be
taken from the frontal view of your face in conditions of yawning, talking, and normal closed mouth. The
entire recording session will last about 5 minutes.
Withdrawing from the study: Your participation in this study is voluntary. You may withdraw from the
study at any time, by verbally informing the investigator or any of the researchers, even after signing the
form. There will be no consequences following this action.
Compensation: You will not receive monetary compensation for this study.
Disclosure: You agree for the above-mentioned videos captured of you to be made available to
researchers, from all over the world, for research and further study, on publically-accessible websites and
for non-commercial purposes.
Confidentiality: ther than the above “Disclosure”, all other information about you collected during the
study will be kept strictly confidential. Your name will not be associated with the collected data in any
way. The data collection will be conducted by Dr. Shirmohammadi, his graduate students, or research
fellows, or his research assistant.
In closing: With your participation, you will be given a copy of this consent form. At the conclusion of
the study, should you wish, you will be provided with a summary of the results. You may ask questions at
any time, even after signing this consent form.
Signatures: I have read the above description of the study and understand the conditions of participation.
My signature indicates that I agree to participate in the study.
Name of participant (please print name here):
_____________________________________________
Participant’s Signature:
_______________________________ Date:
Researcher’s Signature:
________________________________ Date: