drivers of blood donation collection costs: a case...
TRANSCRIPT

Copyright UCT
Drivers of Blood Donation Collection Costs: A Case Study at the Western Province Blood Transfusion Service
A Research Report
presented to
The Graduate School of Business
University of Cape Town
In partial fulfilment
of the requirements for the
Masters of Business Administration Degree
by
Jonathan Davids
December 2011
Supervised by: Professor Enrico Uliana

Copyright UCT
ii
PLAGIARISM DECLARATION
I know that plagiarism is wrong. Plagiarism is to use another’s work and pretend that
it is one’s own.
I have used a recognised convention for citation and referencing. Each significant
contribution and quotation from the works of other people has been attributed, cited
and referenced.
I certify that this submission is my own work.
I have not allowed and will not allow anyone to copy this essay with the intention of
passing it off as his or her own work
Jonathan Davids

Copyright UCT
iii
TABLE OF CONTENTS
Plagiarism Declaration.................................................................................................. ii
Table of Contents ......................................................................................................... iii
List of Tables and Figures ........................................................................................... vi
Glossary of Terms ...................................................................................................... vii
Acknowledgements.................................................................................................... viii
Abstract ........................................................................................................................ ix
1 Introduction ........................................................................................................... 1
1.1 Research Area and Problem ............................................................................ 1
1.2 Research Questions and Scope ....................................................................... 2
1.3 Research Assumptions .................................................................................... 2
1.4 Research Ethics ............................................................................................... 3
1.5 Structure of the Report .................................................................................... 3
2 Literature Review .................................................................................................. 4
2.1 Activity Based Costing ................................................................................... 4
2.2 Strategic Cost Drivers ..................................................................................... 5
2.3 ABC Implementation Challenges ................................................................... 5
2.4 Limiting the Number of Cost Drivers ............................................................. 6
2.5 Cost Analyses Using Linear Regression Techniques ..................................... 6
2.6 Multiple Techniques for Understanding Costs ............................................... 7
2.7 Conclusion ...................................................................................................... 8
3 Research Methodology ........................................................................................ 10
3.1 Research Approach ....................................................................................... 10
3.2 Research Strategy .......................................................................................... 11
3.3 Research Design, Data Collection Methods and Research Instruments ....... 12
3.4 Sampling ....................................................................................................... 13
3.5 Research Criteria ........................................................................................... 14

Copyright UCT
iv
3.6 Data Analysis Methods ................................................................................. 15
3.7 Limitations .................................................................................................... 16
4 Research Findings, Analysis and Discussion ...................................................... 17
4.1 Research Findings from Initial Interviews .................................................... 17
4.1.1 The Definition of Collection Costs ........................................................ 17
4.1.2 Major Cost Areas ................................................................................... 17
4.1.3 Data Sources .......................................................................................... 18
4.1.4 Source of Consumables Costs ............................................................... 18
4.1.5 Source of Staff Costs ............................................................................. 18
4.1.6 Source of Capex Costs ........................................................................... 20
4.1.7 Initial Insights into Cost Drivers ........................................................... 20
4.2 Quantitative Findings and Analysis .............................................................. 21
4.2.1 Consumables Costs ................................................................................ 21
4.2.2 Staff Costs .............................................................................................. 24
4.2.3 Capex Costs ........................................................................................... 28
4.2.4 All Costs ................................................................................................ 31
4.3 Discussion ..................................................................................................... 35
4.3.1 Scale of Operations ................................................................................ 35
4.3.2 Scope of Operations ............................................................................... 35
4.3.3 Experience of the Firm and Employees ................................................. 35
4.3.4 Technology Used ................................................................................... 36
4.3.5 Complexity of Products and Services .................................................... 37
4.3.6 Workforce Involvement ......................................................................... 37
4.3.7 Total Quality Management .................................................................... 38
4.3.8 Capacity Utilization ............................................................................... 38
4.3.9 Layout Efficiency .................................................................................. 40
4.3.10 Product/Service Configuration .............................................................. 40

Copyright UCT
v
4.3.11 Linkages with Suppliers and Customers................................................ 41
4.3.12 Conclusion ............................................................................................. 41
5 Research Conclusions .......................................................................................... 44
5.1 Research Area and Problem .......................................................................... 44
5.2 Cost Drivers .................................................................................................. 44
5.3 Cost Drivers by Collection Method and Clinic Classification ...................... 44
5.4 Research Limitations..................................................................................... 46
5.5 Future Research Directions ........................................................................... 46
References.................................................................................................................... 48
Appendix ..................................................................................................................... 50
Appendix 1: Count of Clinics Held, by Collection Method and Clinic Classification
................................................................................................................................. 50
Appendix 2: Capex Costs and Useful Life .............................................................. 51
Copyright UCT
vi
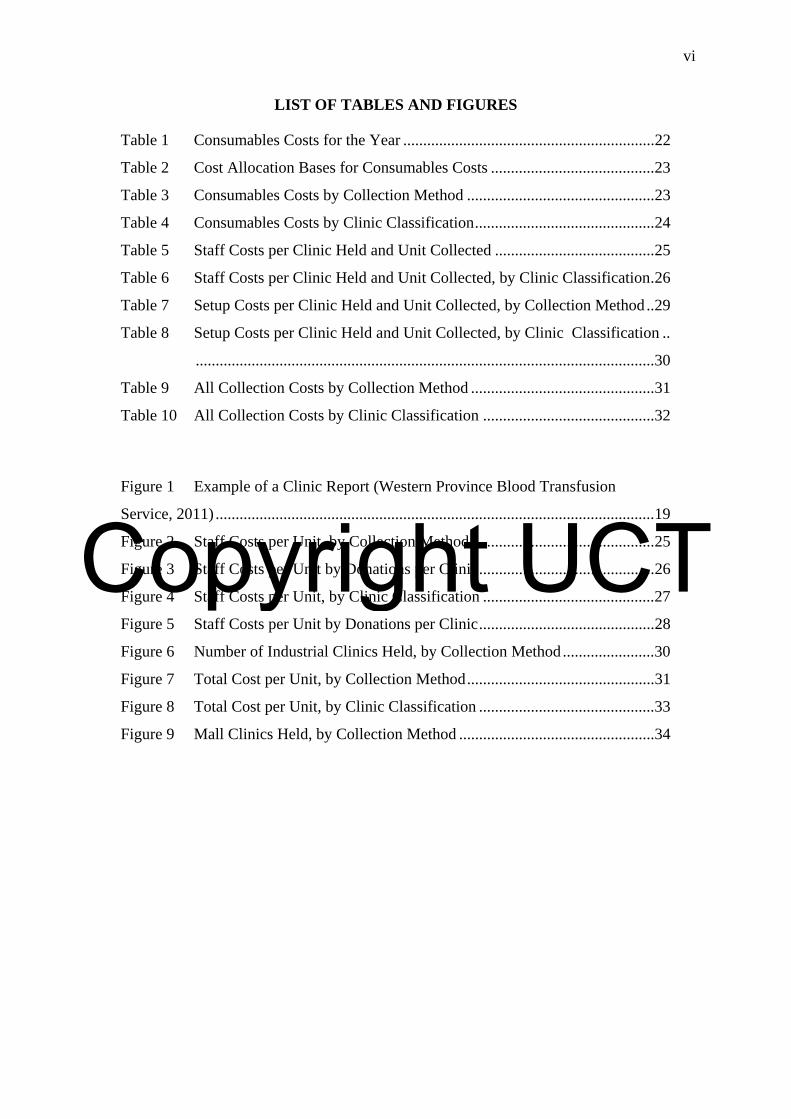
LIST OF TABLES AND FIGURES
Table 1 Consumables Costs for the Year ............................................................... 22
Table 2 Cost Allocation Bases for Consumables Costs ......................................... 23
Table 3 Consumables Costs by Collection Method ............................................... 23
Table 4 Consumables Costs by Clinic Classification ............................................. 24
Table 5 Staff Costs per Clinic Held and Unit Collected ........................................ 25
Table 6 Staff Costs per Clinic Held and Unit Collected, by Clinic Classification . 26
Table 7 Setup Costs per Clinic Held and Unit Collected, by Collection Method .. 29
Table 8 Setup Costs per Clinic Held and Unit Collected, by Clinic Classification ..
................................................................................................................... 30
Table 9 All Collection Costs by Collection Method .............................................. 31
Table 10 All Collection Costs by Clinic Classification ........................................... 32
Figure 1 Example of a Clinic Report (Western Province Blood Transfusion
Service, 2011) .............................................................................................................. 19
Figure 2 Staff Costs per Unit, by Collection Method .............................................. 25
Figure 3 Staff Costs per Unit by Donations per Clinic ............................................ 26
Figure 4 Staff Costs per Unit, by Clinic Classification ........................................... 27
Figure 5 Staff Costs per Unit by Donations per Clinic ............................................ 28
Figure 6 Number of Industrial Clinics Held, by Collection Method ....................... 30
Figure 7 Total Cost per Unit, by Collection Method ............................................... 31
Figure 8 Total Cost per Unit, by Clinic Classification ............................................ 33
Figure 9 Mall Clinics Held, by Collection Method ................................................. 34
Copyright UCT
vii
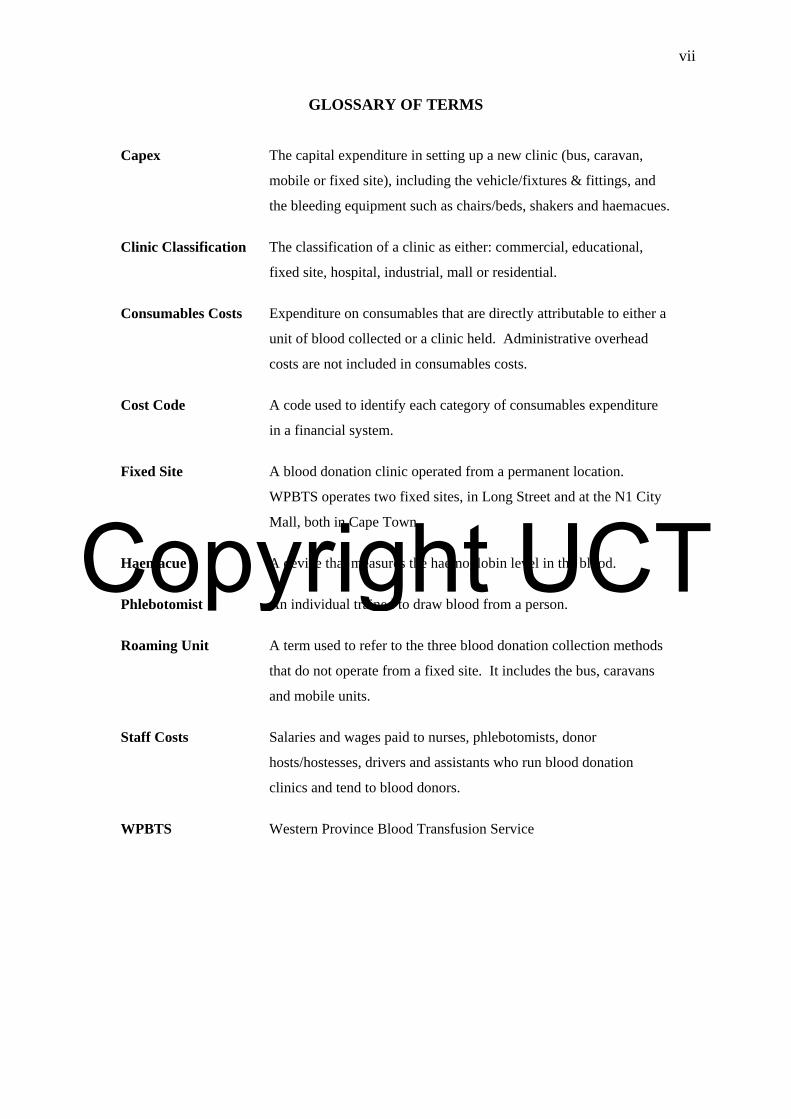
GLOSSARY OF TERMS
Capex The capital expenditure in setting up a new clinic (bus, caravan,
mobile or fixed site), including the vehicle/fixtures & fittings, and
the bleeding equipment such as chairs/beds, shakers and haemacues.
Clinic Classification The classification of a clinic as either: commercial, educational,
fixed site, hospital, industrial, mall or residential.
Consumables Costs Expenditure on consumables that are directly attributable to either a
unit of blood collected or a clinic held. Administrative overhead
costs are not included in consumables costs.
Cost Code A code used to identify each category of consumables expenditure
in a financial system.
Fixed Site A blood donation clinic operated from a permanent location.
WPBTS operates two fixed sites, in Long Street and at the N1 City
Mall, both in Cape Town.
Haemacue A device that measures the haemoglobin level in the blood.
Phlebotomist An individual trained to draw blood from a person.
Roaming Unit A term used to refer to the three blood donation collection methods
that do not operate from a fixed site. It includes the bus, caravans
and mobile units.
Staff Costs Salaries and wages paid to nurses, phlebotomists, donor
hosts/hostesses, drivers and assistants who run blood donation
clinics and tend to blood donors.
WPBTS Western Province Blood Transfusion Service

Copyright UCT
viii
ACKNOWLEDGEMENTS
I am grateful to Helen Ferris, Collections Manager at WPBTS, for the many hours
spent in interviews and meetings with me, for sourcing data and for all her
encouragement throughout the research.
I thank Professor Enrico Uliana, Executive Director of Finance at UCT, for his
support, guidance and patience throughout the research process.
I am grateful to my wife, Zulphah, for her support over two long years of MBA
studies. Thanks for your understanding! Thanks to my son, Xavier, for being my
inspiration.
Special thanks go to my mother-in-law, Lutfia, for her unwavering support over the
last two years and for looking after Xavier when I really needed a break.
I thank Marika Champion, Manager of Promotions and Public Relations at WPBTS,
for suggesting the study, facilitating it and allowing access to her staff and data.
To Maureen Lawrence, assistant to Professor Uliana, thank you for managing
Enrico’s calendar so well and making sure that I was always able to meet with Enrico
when I needed to.
I also thank Renier Myburgh, Senior Programmer, IT at WPBTS, for providing clinic
data and going the extra mile in answering my queries.
Thank you Mariana Nelson, Promotions at WPBTS, for allowing me to rummage
through you filing cabinets of clinic reports.
Jonathan Davids
Copyright UCT
ix
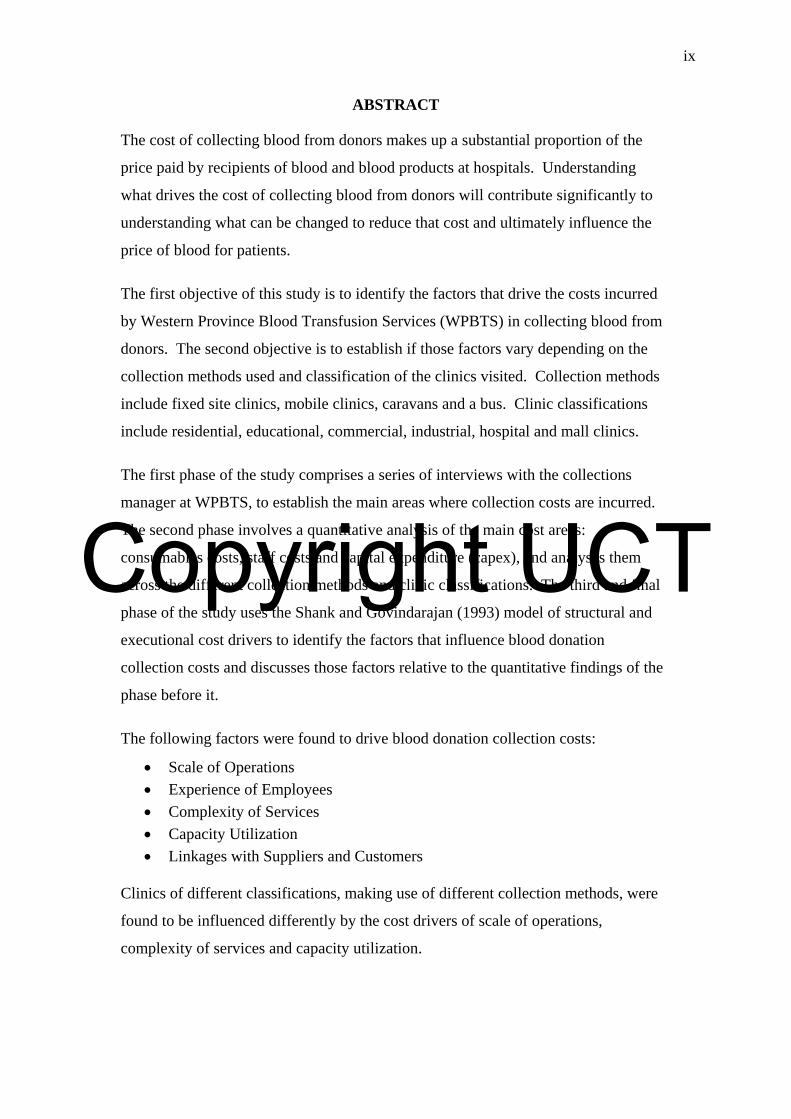
ABSTRACT
The cost of collecting blood from donors makes up a substantial proportion of the
price paid by recipients of blood and blood products at hospitals. Understanding
what drives the cost of collecting blood from donors will contribute significantly to
understanding what can be changed to reduce that cost and ultimately influence the
price of blood for patients.
The first objective of this study is to identify the factors that drive the costs incurred
by Western Province Blood Transfusion Services (WPBTS) in collecting blood from
donors. The second objective is to establish if those factors vary depending on the
collection methods used and classification of the clinics visited. Collection methods
include fixed site clinics, mobile clinics, caravans and a bus. Clinic classifications
include residential, educational, commercial, industrial, hospital and mall clinics.
The first phase of the study comprises a series of interviews with the collections
manager at WPBTS, to establish the main areas where collection costs are incurred.
The second phase involves a quantitative analysis of the main cost areas:
consumables costs, staff costs and capital expenditure (capex), and analyses them
across the different collection methods and clinic classifications. The third and final
phase of the study uses the Shank and Govindarajan (1993) model of structural and
executional cost drivers to identify the factors that influence blood donation
collection costs and discusses those factors relative to the quantitative findings of the
phase before it.
The following factors were found to drive blood donation collection costs:
Scale of Operations
Experience of Employees
Complexity of Services
Capacity Utilization
Linkages with Suppliers and Customers
Clinics of different classifications, making use of different collection methods, were
found to be influenced differently by the cost drivers of scale of operations,
complexity of services and capacity utilization.

Copyright UCT
DRIVERS OF BLOOD DONATION COLLECTION COSTS 1
1 INTRODUCTION
1.1 Research Area and Problem
The Western Province Blood Transfusion Service (WPBTS) is an incorporated
association not for gain and its main activities are the collection, testing, processing
and distribution of blood and certain derivatives of blood (Western Province Blood
Transfusion Service, 2010).
As a non-profit organisation, WPBTS prices its blood and blood products relative to
its input costs. Within WPBTS, there is a drive to keep operating costs low, in order
to keep the selling price of blood low. A low selling price is particularly important to
price-sensitive hospitals run by the South African government (the customer), which
has been known to question the selling price set by WPBTS. (Champion, 2011)
WPBTS makes use of a number of collection methods, operating fixed site donation
centres and roaming units. The roaming units include mobile clinics, caravans and a
bus. Mobile clinics are dependent on venues such as church halls, community centres
or places of business, while the bus and caravan collection methods are self-contained
units that host onboard facilities for blood donation.
Roaming units visit places of business, residential areas, educational institutions and
hospitals. The various collection methods and clinic classifications described here
result in widely varying costs of collection. This means that some collection methods
or types of sites visited may be expensive compared to others. (Champion, 2011)
The purpose of the study is to identify the factors that drive operating costs at
WPBTS, specifically within the donation collections division. The study is focused
on the collections division because the cost of collecting blood from donors makes up
one of the biggest proportions of the cost of running the WPBTS. With a better
understanding of what drives collection costs, WPBTS will be in a better position to
design effective cost-reduction programmes.
This research will inform decision-making around blood donation collection, which
may result in an overall reduction in the price of blood at hospitals, thereby
improving the efficiency of delivering this life-sustaining product to hospitals in
South Africa.

Copyright UCT
DRIVERS OF BLOOD DONATION COLLECTION COSTS 2
1.2 Research Questions and Scope
Understanding the factors that drive the cost of collecting blood from donors will
allow the WPBTS to make informed decisions about the ways in which costs may be
reduced. The primary research question is:
Which are the key factors that drive the costs incurred by WPBTS in collecting
blood from donors?
If the factors driving collection costs vary by collection method and clinic
classification, WPBTS will be in a position to make strategic choices about the
collection methods they use and the types of locations that they visit. The second
research question is:
Do the factors that drive collection costs vary depending on collection method
used and classification of the clinics visited by WPBTS?
The scope of the research is limited to understanding cost drivers in the collections
division of WPBTS. The study has not investigated collection costs at any other
blood service organisation such as the South African National Blood Service
(SANBS). This limited scope implies that results may not be generalised to other
divisions within WPBTS or the collections division at SANBS.
The study considers both fixed site and roaming blood donation clinics operated by
WPBTS but only considers the roaming clinics that are based at WPBTS
headquarters in Cape Town. Roaming clinics headquartered in Worcester, Paarl and
George have been excluded from the study, so as to remove a level of complexity
because the cost dynamics of roaming units operating in those regions are different to
those operating in Cape Town and its surrounds.
1.3 Research Assumptions
The research relies on the availability of quality historical cost data from existing
sources within WPBTS. Saunders, Lewis, & Thornhill (2009) highlight that while
the advantage of using a secondary data source is that the information already exists
in the organisation, the potential pitfall may be that because that data was collected
for a different purpose by the organisation, the data may not suit the purpose of the

Copyright UCT
DRIVERS OF BLOOD DONATION COLLECTION COSTS 3
research. The assumption regarding the quality of available data has been met in that
the data provided by WPBTS has been of an adequate level of detail and was
sufficient for the purposes of this study.
WPBTS expressed concern over the time which might be required to gather
secondary data from various sources, which would depend on the level of detail
required and the volume of data. The assumption at the outset was that this would not
pose a problem. Subsequently, this assumption has been met.
1.4 Research Ethics
Confidentiality of data relating to individuals covered by this study is of paramount
importance. At no point has the researcher or research supervisor divulged any
personal data relating to either blood donors or WPBTS staff to any parties outside of
WPBTS. Data related to WPBTS staff wages have not been shared with any
unauthorised individual, not even individuals employed by WPBTS.
WPBTS expressed concern over sensitivity around specific amounts of money paid to
certain suppliers. This problem has been avoided by not reporting costs at such a fine
level of detail. As a result, there has been no need to mathematically distort any
figures presented in this report.
The research includes interviews with the manager of the collections division. These
interviews cover matters relating to the costs incurred by the collections division and
the researcher has not met with any privacy issues in tying the views expressed to the
identity of the interviewee.
1.5 Structure of the Report
This introductory chapter is followed by Chapter 2, a review of the literature relevant
to the research problem. Chapter 3 describes the research methodology adopted in
this study. Chapter 4 presents the research findings, analyses those findings and
discusses the implications of the findings on the research problem. Chapter 5
concludes the research report and addresses the research questions.
Copyright UCT
DRIVERS OF BLOOD DONATION COLLECTION COSTS 4
2 LITERATURE REVIEW
The literature review considers a number of models that have found prominence in
the field of management accounting. This section presents a general overview of
Activity Based Costing and Strategic Cost Drivers, followed by a review of recent
studies that have analysed cost drivers in various organisational settings. The final
sub-section of the literature review concludes with a summary of what was found in
the literature and its implications for the frameworks used in this study.
2.1 Activity Based Costing
Kaplan (1988) describes individual product cost measurement as one of four areas
addressed by cost systems and Cooper (1988) describes the challenges experienced
by manufacturing firms in their attempt to accurately assign production costs to
different products. In respect of volume-related costs, such as direct labour hours, it
is appropriate for those costs to be assigned to a product because those direct labour
hours are a legitimate cost driver. However, conventional cost systems tend to also
use a single, volume-related allocation base, such as direct labour hours, to trace
shared or volume-unrelated costs to different products. This practice makes for
inaccurate product costing.
Cooper (1988) presents Activity-Based Costing (ABC) as an alternative methodology
that produces more accurate product costs. ABC considers the costs of the activities
that produce the product and assigns costs to the product in proportion to those
activities consumed by the product.
The ABC methodology is relevant to understanding the cost structure of the
collections division of WPBTS. The collections division incurs both donation-
volume-related costs, which are directly related to the collection of an individual unit
of blood, such as the bag and needle kit, as well as volume-unrelated costs such as the
staff costs associated with running the clinic. Since batch-level (clinic-level) staff
costs are of similar magnitude to unit-level donation costs, an ABC system should, in
theory, help to assign product costs to units donated much more accurately than a
conventional costing system.
Copyright UCT
DRIVERS OF BLOOD DONATION COLLECTION COSTS 5
2.2 Strategic Cost Drivers
Shank and Govindarajan (1993) recommend that a firm pursuing a cost leadership
strategy should develop keen insights into its cost structure. This should allow the
firm to control its cost drivers better than its competitors, in pursuit of sustainable
competitive advantage. Building on the work of Riley (1987) and Scherer (1980),
Shank and Govindarajan (1993) describe two categories of cost drivers, namely
structural cost drivers and executional cost drivers. Structural cost drivers include the
(1) scale of operations, (2) scope of operations in the context of the value chain, (3)
experience of the firm and its employees in providing present products and services,
(4) technology used by the firm and (5) complexity of products and services offered.
Executional cost drivers include (1) levels of work force involvement, (2) total
quality management, (3) capacity utilization, (4) plant layout efficiency, (5) product
configuration and (6) exploiting linkages with suppliers and/or customers.
WPBTS does not seek sustainable competitive advantage since it is not in
competition with any other blood transfusion service. However, there is value in
WPBTS understanding its cost structure and controlling its cost drivers in order to
deliver a cost-effective service. The framework of structural and executional cost
drivers is as relevant to WPBTS as it is to firms in pursuit of cost leadership.
2.3 ABC Implementation Challenges
Abernethy, Lillis, Brownell, & Carter (2001) affirm the intuitive appeal of ABC cost
systems but note that ABC cost systems have not been extensively implemented in
practice, citing the works of Innes & Mitchell (1995) and Chenhall & Langfield-
Smith (1998). The literature points to a middle-ground between the complexity of a
full-blown ABC system and the use of a crude, single volume-based costing system
by considering a subset of cost drivers which capture the essence of what drives costs
in a production environment.
Arnaboldi & Lapsley (2004) describe the challenges in implementing ABC at an
organisation that produces health care products from blood transfusion services. One
of the key lessons from the study is that the ABC system implementation process
required that system developers have an understanding of the production processes, in
order to ascertain cost drivers. The study also highlights challenges experienced by
Copyright UCT
DRIVERS OF BLOOD DONATION COLLECTION COSTS 6
one of the manufacturing plants in collecting cost driver information. Financial
information was reliable since it was housed in well-structured databases while non-
financial information was unreliable and difficult to collect since it was gathered from
non-homogeneous reports.
2.4 Limiting the Number of Cost Drivers
Researchers have developed mathematical models that can be used to select an
optimal number of cost drivers that balance the cost of using multiple cost drivers
with the benefits of more accurate cost allocation (Homburg, 2001; Schniederjans &
Garvin, 1997). Such a technique may be useful in this study, to isolate a small
selection of cost drivers which capture the essence of what drives collection costs,
without the need to implement an ABC system. The appropriateness of this approach
will be informed by the number of cost drivers identified through this study. If many
cost drivers are found, then it may be useful to consider a method for reducing those
cost drivers to a more manageable sub-set. However, if few cost drivers are identified
then the research will make use of all of those cost drivers, without the need to limit
the number of cost drivers.
2.5 Cost Analyses Using Linear Regression Techniques
Davidson & Dewsnup (2009) analyse the cost and revenue structure of a blood bank
using least squares regression analysis. They estimate the incremental cost of each
unit of blood collected, based on eighty-two observations of monthly expenditure
data relating to all functional units of the blood bank. Because the study uses
monthly aggregated data, the authors describe difficulty in estimating costs associated
with different collection methods because their input data includes costs shared by
different collection methods. As a result, they are not able to conclude that any
method of collection is more or less expensive than the others.
The Davidson & Dewsnup (2009) study also used linear regression to analyse
aggregated monthly expenditure data to produce a statistically significant estimation
of the marginal cost for each unit of blood collected by the Lane Memorial Blood
Bank. However, for a three month period falling within the period that that study was
based on, the organisation experienced large increases in monthly expenditure due to
large capital investments. Over that same period, the number of units of blood

Copyright UCT
DRIVERS OF BLOOD DONATION COLLECTION COSTS 7
collected did not increase in step with the increase in monthly expenditure. This
highlights a potential weakness of using linear regression as a local linear
approximation of a phenomenon over time. If the variables being regressed are not
linearly related, then the linear regression does not accurately model reality.
Davidson & Dewsnup (2009) introduce a constant variable to represent inflationary
increases in costs over time. However, we cannot be sure that this variable truly
represents changes in price levels due to inflationary effects or if costs increased
generally because of a change in the operating efficiency over time. This highlights a
weakness in the study which attempts to establish a marginal cost of collecting a unit
of blood when the data that the study is based on spans almost seven years. That
research was meant to be cross-sectional in time, yet the data collected seems more
appropriate to a longitudinal study.
This cross-sectional study at the WPBTS focused on data spanning a relatively short
period of time. This is discussed in more detail in the Research Methodology section
to follow.
2.6 Multiple Techniques for Understanding Costs
Bjørnenak (2000) uses a number of approaches to identify and analyse operating cost
differences between various public schools (both primary and secondary) in
Norway’s four largest cities. The study uses a regression analysis, activity analysis,
structural cost driver analysis and a product attribute analysis. The regression
analysis tests the significance of each variable’s ability to predict the net operating
cost per school (the dependent variable). After eliminating insignificant explanatory
variables, ten variables are used to explain 91% of the variation in operating costs at
each school. This regression analysis yields strong results but the author notes that
the weakness of the regression technique is that it does not give insight into why, how
and by how much each of those variables contributes to net operating cost.
The second phase of the study by Bjørnenak (2000) uses an activity analysis approach
to disaggregate the single net operating cost value reported for each school. In doing
so, the researcher is able to understand the cost structure of each school, based on the
cost drivers that make up that cost. The author highlights that the approach used does
not follow the ABC methodology strictly and does not attempt to allocate shared

Copyright UCT
DRIVERS OF BLOOD DONATION COLLECTION COSTS 8
activity costs to different groups of pupils. Instead, the activity analysis technique
merely attempts to explain differences between the average costs per pupil at different
schools.
The third phase of the study by Bjørnenak (2000) found that the listing and grouping
of cost drivers by Shank & Govindarajan (1993) was not fully compatible with their
observations of cost drivers at public schools in Norway. They found value in adding
two more categories of cost drivers, namely institutional cost drivers and
discretionary policies, to the list suggested by Shank & Govindarajan (1993).
2.7 Conclusion
To reach an understanding of what drives costs in an organisation, a number of
approaches and analysis methods can be used. From the literature reviewed, it
appears that linear regression is a popular choice. However, this technique is often
used without a fundamental framework of what drives costs. As a result, a variable
can be shown to have significant correlation with some measure of cost but the
researcher may be left in want of an explanation as to whether or not that variable
really drives costs or why a given variable is strongly related to cost.
A theoretical framework such as ABC presents a model for thinking about what
drives costs. ABC proposes that activities drive costs and activities are the most
reliable measure by which to assign batch-related costs to different products. Studies
show that ABC is not widely implemented in practice. However, the framework does
allow for a comprehensive list of cost drivers to be identified. Thereafter, the
researcher may narrow focus on those cost drivers that are economical to measure,
and those that have the most explanatory power or produce most accurate results of
product costs.
In this study, the ABC framework has been used as a guide to thinking through the
activities involved in blood donation collection, the direct and indirect costs involved
and the assignment of those costs to different collection methods and clinic
classifications. ABC is integral to the quantitative analysis phase of the study and in
addressing the first research question about the key factors that drive blood donation
collection costs.

Copyright UCT
DRIVERS OF BLOOD DONATION COLLECTION COSTS 9
The framework of structural and executional cost drivers suggested by Shank &
Govindarajan (1993) provides a schema through which organisations can think
through the cost structure implications of their strategic choices. In this study, the
cost drivers framework is used to question the ways in which different blood donation
collection methods are utilised and how different clinic types are operated. The use
of the cost drivers framework is integral to addressing the second research question
about the extent to which the factors that drive collection costs vary depending on
collection method used and clinic classification.

Copyright UCT
DRIVERS OF BLOOD DONATION COLLECTION COSTS 10
3 RESEARCH METHODOLOGY
This chapter describes the methodology followed in this study. It highlights the
research approach and strategy by considering ontology, epistemology, axiology, and
research paradigm and research approach. The sections that follow consider the
research design, data collection method and research instruments used in the study.
Finally, this chapter concludes with sections on how sampling has been conducted,
how data has been analysed and the limitations brought about by the sampling and
analysis choices.
3.1 Research Approach
The researcher has taken an objectivist approach to the research. From an ontological
perspective, the author contends that factors which drive costs of blood donation
collection are objective entities which can be measured in monetary terms. Those
factors which drive costs are not deemed to be influenced by the social actors in the
system, such as blood donors or the WPBTS staff that collects donations.
The researcher also adopts a positivist view regarding the epistemology of the
research. Only the observable costs associated with collections are used to derive an
explanation of what drives costs in the donations division. The research does not
focus on social phenomena such as the reasons why donors donate blood. This view
was adopted despite the contention that social phenomena could influence the number
of donations received at a clinic, at a particular location. It could be argued that this
phenomenon influences efficiencies of that clinic, and thereby influences the cost of
collection. However, there is no reliable way of quantifying the extent to which such
social phenomena influence the cost of collection. Consequently, this has not formed
part of the study.
Regarding axiology, the researcher has collected data, analysed results and drawn
conclusions in a way that is free of any bias, and in so doing, has maintained an
objective approach throughout the research process.
The research into cost drivers at WPBTS fits into the functionalist paradigm in that,
firstly, it is assumed that costs are driven by rational explanations and not social
phenomena, as described previously. Secondly, the research is regulatory, seeking

Copyright UCT
DRIVERS OF BLOOD DONATION COLLECTION COSTS 11
explanations for what currently drives collection costs. It is not the author’s intention
to criticise the various collection methods and seek radical change in collection
methods but rather to gain deeper insight into the characteristics of different
collection methods and what drives collection costs.
Finally, the research approach follows that of an inductive study which aims to
understand what drives collection costs and thereby build a model which explains
those cost drivers. Armed with such a model, WPBTS is in a position to make
strategic choices regarding the collection methods that it should employ.
3.2 Research Strategy
The research strategy is that of a single case study. In line with the definition of a
case study from Robson (2002), the research is an empirical investigation into the
particular contemporary phenomenon of blood donation collection costs, in its real
life context of the WPBTS collections division. As explained in more detail in the
next sub-section, the case study strategy lends itself to exploratory and explanatory
research (Saunders, Lewis, & Thornhill, 2009).
A single case study strategy was used because the phenomenon of blood donation
collection costs is quite unique to the collections division of WPBTS. The South
African National Blood Service (SANBS) operates the only other blood service in
South Africa, which also makes use of a variety of collection methods. However, a
comparative case study would not have shed any more light on what drives collection
costs at WPBTS. Also, a comparative case study strategy might have diluted the
focus on cost drivers at WPBTS. For example, in a comparative case study a lot more
effort would have been put into designing interview questions that allow for
comparison between cases. On the other hand, a single case study strategy has lended
itself to less structured questions, allowing the researcher to explore the pertinent
issues without being forced to adhere to a pre-conceived formula of questions. The
researcher asserts that exploring the pertinent issues in that way has lead to a more
accurate diagnosis of cost drivers at WPBTS.
Following the categorisation of case studies by Yin (2003), the single unit of analysis
for this study is the collections division of the WPBTS. No other divisions have been

Copyright UCT
DRIVERS OF BLOOD DONATION COLLECTION COSTS 12
investigated since the method of operation of the collections division is quite unique.
The collections division has been treated as a holistic case study.
3.3 Research Design, Data Collection Methods and Research Instruments
The design of the proposed research takes the form of a single case study which
includes exploratory and explanatory aspects. The study is exploratory in that it seeks
to understand what is currently happening at WPBTS in terms of blood donation
collection costs. In line with the definition of exploratory studies proposed by
Robson (2002), this study asks questions and assesses the collection cost phenomena
in a new light. According to Saunders et al. (2009), an exploratory study is useful for
reaching a clearer understanding of a problem.
The research is also explanatory in that it has established causal relationships between
factors that influence the cost of collection and the operating costs of the WPBTS
collections division. The emphasis is on explaining this causal relationship
(Saunders, Lewis, & Thornhill, 2009).
The data collection method has followed a mixed methods approach which has seen
the gathering of both qualitative data in the form of interviews as well as quantitative
data in the form of historical collection costs. The qualitative data has aided in the
exploratory aspects of the study while the quantitative data has helped explain the
observed phenomena (Saunders, Lewis, & Thornhill, 2009). Qualitative data has
been analysed qualitatively and quantitative data has been analysed quantitatively.
The research method is cross-sectional, allowing an understanding of cost drivers at
this point in time. The study is not longitudinal as it has not sought to explain how
cost drivers have varied over time. Collection costs spanning a relatively short a time
frame has been gathered (i.e. one year), avoiding the risk of collecting information
from too short a time frame and deriving distorted results caused by local variation
particular to that short time frame. A justification for the sampling method and
chosen timeframe can be found in the sub-section on Sampling.
Research instruments include interviews and gathering of historical, secondary
operational data on collection costs incurred by WPBTS. Due to its less rigid
structure, interviews were preferred over surveys in the exploratory phase, which
Copyright UCT
DRIVERS OF BLOOD DONATION COLLECTION COSTS 13
identified some of the pertinent issues around blood donation collection costs.
Results from exploratory interviews influenced the range of quantitative financial and
operational data requested from WPBTS and the following sub-section on sampling
describes the technique for extracting necessary data. Data analysis methods are also
explained in more detail in the Research Methodology section. Interviews have also
been a key research instrument in the final phase of the study when reviewing results
from the quantitative analysis in discussions with the manager of the collections
division.
3.4 Sampling
The researcher made use of non-probabilistic sampling techniques for both phases of
data gathering. In the initial phase of the research, interviews were held with the
collections manager and the manager of promotions and public relations at WPBTS.
These interviewees were chosen on the basis of a non-probabilistic, purposive
sampling technique because interviews with those individuals enabled the researcher
to answer the research questions and meet the objectives of the study (Saunders,
Lewis, & Thornhill, 2009). As explained by Saunders et al. (2009), this sampling
method lends itself to case study research.
The quantitative data gathering phase also used a non-probabilistic sampling
technique. This choice of technique was driven by two considerations. Firstly, there
was no need to make statistically robust inferences about the population of collections
costs based on the chosen sample, since the research has not followed a deductive
approach. Instead, a sample was chosen so as to be representative of the population
of collections costs across the range of collection methods and classification of clinics
visited. The main consideration was that the sample should be unbiased and fairly
representative of the underlying population.
The second reason why a non-probabilistic sampling technique was used is because
the cost of collecting relevant data. Approximately two thousand six hundred clinics
were held in the year under investigation. For this size of population, to derive a
ninety-five percent representative sample of that year’s collection costs through
sampling would have required about three hundred and forty observations. Given the
complexity of information that needed to be collected for each clinic held, this sample

Copyright UCT
DRIVERS OF BLOOD DONATION COLLECTION COSTS 14
size would have been prohibitively big in terms of the time that would have been
required to collect the data.
A sub-category of purposive non-statistical sampling called typical case sampling was
used in this study (Saunders, Lewis, & Thornhill, 2009). The intention of this
sampling technique was to provide illustrative values for collections costs across the
range of collection methods and classifications of clinics visited. To ensure that the
study was not biased toward collection costs for a certain time of the year, a full
year’s collection costs were incorporated into the study. The sampling technique saw
twenty observations of collection costs associated with each collection method (fixed
site, mobile, caravan and bus) and twenty observations of collection costs associated
with each clinic classification (educational institution, residential, commercial, etc.),
for the period 1 September 2010 to 31 August 2011.
3.5 Research Criteria
This section considers factors that may influence the reliability of the study and
describes approaches taken to mitigate these threats to reliability. Participant bias
was mitigated by reassuring interviewees that whatever was said off the record in
interviews would be respected by the interviewer, and that the interviewer welcomed
suggestions on how any sensitive issues might be tackled, without drawing attention
to the individual who may have raised the contentious issue. During the interviews,
no such issues arose and there appeared to be no risk of participant bias.
Observer error was minimised by recording interviews so as to transcribe them more
accurately than what would be the case if only hand-written notes were taken. Other
issues pertinent to reliability of the study are discussed in more detail in the sub-
section on data analysis methods.
Research validity is bolstered by a second round of interviews that was conducted
with the manager of the collections division, following the quantitative data collection
and analysis stages. This second round of interviews allowed for the preliminary
results to be scrutinised and critiqued by the collections manager, and allowed for any
disagreements and objections to be factored into the study and into the final results.

Copyright UCT
DRIVERS OF BLOOD DONATION COLLECTION COSTS 15
As noted in the earlier sub-section on research design, the research takes the form of a
single case study because of the uniqueness of the operations of the WPBTS
collections division. As such, the results of the research might not be generalised to
other operational settings. However, given that the scope of the research omits
certain towns in which WPBTS operates satellite collections operations, the findings
may be generalised to those operations since they use the same collection methods,
visit the same types of locations and operate in the same institutional setting.
The findings of this study cannot be generalised to the collections function of
SANBS. However, the research approach might be easily transferable to the
collections division of the SANBS.
3.6 Data Analysis Methods
With the consent of the interviewees, interviews from the initial phase of the study
were digitally audio-recorded. Thereafter, the interviews were transcribed in
summary form. Before conducting these interviews, the intention was to transcribe
these interviews verbatim. However, given that more than ten hours of interviews and
meetings were held, verbatim transcription would have been time-consuming and
would have yielded an only marginally more vivid portrayal of the
interviews/meetings.
The initial interviews were exploratory, sourcing interviewees’ opinions on what
drives collection costs. The opinions were summarised into key points and informed
the data that would be collected in the second phase of the study. This method of data
analysis follows an inductive approach and despite the warnings of Saunders et al.
(2009), this phase of interviewing and subsequent analysis should not be time-
consuming since it entails few interviewees and has a narrow focus on eliciting
opinions as to what drives costs.
Quantitative analysis techniques have been used to present and describe the
quantitative financial information collected in the second phase of the study. Tukey’s
(1977) exploratory data analysis approach is used to graphically illustrate differences
in cost drivers using, primarily, bar graphs. At the research proposal stage, it was
anticipated that box plots of average collection costs would serve as a useful tool for
graphically illustrating differences in costs and that other graphical techniques such as
Copyright UCT
DRIVERS OF BLOOD DONATION COLLECTION COSTS 16
comparative proportional pie charts and scatter plots might be used, but these have
not been necessary. Differences in collection costs are adequately illustrated using bar
graphs.
Descriptive statistics have been used to describe central tendency (the mean) and
dispersion (standard deviation and inter-quartile ranges) of numerical data, in order to
draw comparisons between collection costs of different collection methods and clinic
classifications. However, more advanced statistical techniques such as significance
testing, regression testing and analysis of variance have not been used in the study
since the study does not take the form of hypothesis testing.
3.7 Limitations
Limitations of the study are described throughout this report. They relate specifically
to the research design, methods, sampling and the implications of the results of the
analysis, and particularly to the extent to which the results of this study may be
generalised to other settings. Results have not been generalised to other operating
divisions in WPBTS but may be generalised to the collections divisions operated by
WPBTS and headquartered in Worcester, Paarl and George. Results have not been
generalised to the collections function of the SANBS.
Copyright UCT
DRIVERS OF BLOOD DONATION COLLECTION COSTS 17
4 RESEARCH FINDINGS, ANALYSIS AND DISCUSSION
The first section of this chapter presents the research findings from the initial
interviews with the manager of donor collections. The second section presents the
quantitative findings of the study, along with an analysis of those findings. The third
and final section discusses the earlier findings and analysis, and incorporates insights
from the collections manager around the Shank & Govindarajan (1993) framework of
structural and executional cost drivers.
4.1 Research Findings from Initial Interviews
A series of initial interviews were held with the collections manager. The purpose of
those meetings was to give the researcher an overview of WPBTS operations, to
come to a common understanding of the purpose of the study and to refine its scope.
This section presents some of the insights from those initial meetings. It includes a
description of the major cost areas investigated by this study, the sources of data and
the initial views of the collections manager regarding what drives collection costs.
Many of the findings from this section informed the structure and design of the
quantitative phase of the study, which follows in section 4.2.
4.1.1 The Definition of Collection Costs
For the purposes of this study, collection costs start with the costs incurred in
collecting blood from donors. This means that recruitment costs such as public
relations and marketing are excluded from this study. Collections costs end at the
point just before the donated blood is transported to WPBTS headquarters for testing
and further processing.
Certain kinds of blood donations, such as autologous donations and aphaeresis
donations, though technically falling within the donations division of WPBTS, are
also excluded from this study because of their highly specialised nature and because
they do not form part of the mainstream work of the collections division.
4.1.2 Major Cost Areas
Initial interviews identified a few major areas where costs are incurred by the
collections division. These include the consumables costs associated with every
donation received, the cost of staff who tend to donors at clinics and the capital
Copyright UCT
DRIVERS OF BLOOD DONATION COLLECTION COSTS 18
expenditure (capex) in setting up a new fixed site or roaming collection vehicle.
These three areas of costs are the focus of the quantitative portion of this study.
Shared administrative costs of running the collections division are excluded from the
quantitative portion of the study because this category of costs had no bearing on the
different collection methods used or the classification of clinics visited.
4.1.3 Data Sources
A number of data sources were identified in order to portray collections costs in terms
of the three major cost areas described earlier: consumables costs, staff costs and
capex costs. In addition, a dataset was sourced containing the number of donations
received at each clinic for the year under investigation (1 September 2010 to 31
August 2011).
4.1.4 Source of Consumables Costs
The financial software used by WPBTS reports consumables expenditure on a
monthly basis, for each operating division of the organisation. The report shows a
monthly total for each cost code. Unfortunately, the financial system does not itemise
individual consumables expenditure on the level of clinic held or clinic classification.
This practice would, understandably, be impractical and meant that monthly
consumables expenditure needed to be allocated to different blood donation collection
methods and clinic classifications based on the number of units collected or the
number of clinics held. This methodology is consistent with the ABC classification
by Horngren, Datar, Foster, Rajan, & Ittner (2009) of output unit-level costs and
batch-level costs. All other costs appearing on the consumables expenditure report
were deemed to be facility-sustaining costs and, as discussed earlier, were excluded
from this study.
4.1.5 Source of Staff Costs
Staff costs represent the salaries and wages paid to nurses, phlebotomists, donor
hosts/hostesses, drivers and assistants who run blood donation clinics and tend to
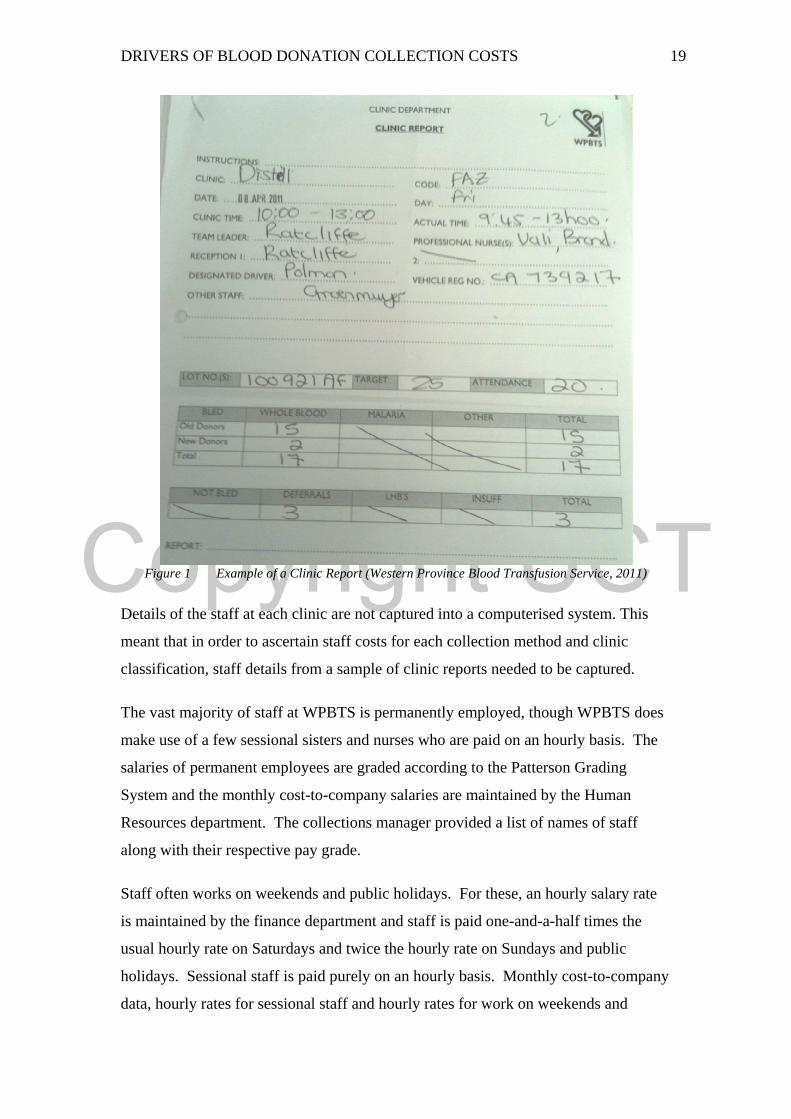
donors. For each clinic held, a clinic report is compiled, showing the details of the
clinic (such as name, code, date, time and location), staff on duty and information on
number of donations at the clinic. An example of a clinic report is shown in Figure 1.
Copyright UCT
DRIVERS OF BLOOD DONATION COLLECTION COSTS 19
Figure 1 Example of a Clinic Report (Western Province Blood Transfusion Service, 2011)
Details of the staff at each clinic are not captured into a computerised system. This
meant that in order to ascertain staff costs for each collection method and clinic
classification, staff details from a sample of clinic reports needed to be captured.
The vast majority of staff at WPBTS is permanently employed, though WPBTS does
make use of a few sessional sisters and nurses who are paid on an hourly basis. The
salaries of permanent employees are graded according to the Patterson Grading
System and the monthly cost-to-company salaries are maintained by the Human
Resources department. The collections manager provided a list of names of staff
along with their respective pay grade.
Staff often works on weekends and public holidays. For these, an hourly salary rate
is maintained by the finance department and staff is paid one-and-a-half times the
usual hourly rate on Saturdays and twice the hourly rate on Sundays and public
holidays. Sessional staff is paid purely on an hourly basis. Monthly cost-to-company
data, hourly rates for sessional staff and hourly rates for work on weekends and
Copyright UCT
DRIVERS OF BLOOD DONATION COLLECTION COSTS 20
public holidays were combined with a sample of data collected from clinic reports to
give an accurate picture of the staff cost of running various clinics.
4.1.6 Source of Capex Costs
Setup costs for fixed sites and roaming clinics include general equipment (such as
furniture) and bleeding equipment (such as chairs, haemacues and shakers). Fixed
sites incur venue setup costs, while roaming clinics incur vehicle purchase costs. For
each of these capital expenditure items, an estimation of the useful life of the item
would allow for an estimation of the average annual depreciation associated with the
setup costs of each collection method.
WPBTS recently conducted an exercise to establish the costs involved in relocating
their N1 City fixed site from one location in the mall to another. This meant that cost
estimates for the relocation as well as the purchase of new bleeding equipment were
at hand for the purposes of this study. The collections manager was also able to
provide vehicle, trailer and mobile equipment costs for comparison. This data can be
found in Appendix 2.
4.1.7 Initial Insights into Cost Drivers
Before the quantitative analysis phase of the study, the researcher interviewed the
collections manager on what, in her experience, have been the drivers of blood
donation collection costs. Many of the insights from the collection manager
presented in this sub-section are referred to in the quantitative analysis section
(section 4.2) which follows.
The collections manager expected that staff costs and consumables costs, such as
blood packs, would be the most significant costs to collecting blood from donors.
The blood packs used to draw the blood from donors feature a sophisticated multiple-
chamber system that ensures that the donor’s blood is never exposed to air from the
time the unit is donated, through to its testing, separation into components, storage in
a blood bank and transfusion to a patient. The blood pack also features a high-quality
needle and contains all the necessary supplements needed to keep the blood alive and
nourished for a determined period. For these reasons, the blood packs are relatively
expensive and it is a cost incurred for each donation received since blood packs are
not re-usable.
Copyright UCT
DRIVERS OF BLOOD DONATION COLLECTION COSTS 21
The collections manager also expected that staff costs would be a major contributor to
the overall cost of collection. The collections division makes use of a high
complement of professional staff earning salaries commensurate with their levels of
training and experience. It was felt that the most cost-effective method for collecting
blood from donors would probably be through mobile clinics, which feature twelve
beds, typically take many staff members to a residential clinic location and bleed a
high number of donors.
The collections manager explained that when hosting clinics at schools and tertiary
education institutions, the pre-donation interview, monitoring and counselling of
donors are done in an intensive way, because relatively more donors are new to blood
donation at these clinics. This necessitates a higher complement of nursing sisters
and other staff at these clinics. For example, at a school where the bleeding target is
30-50 units for that day, one or two sisters are dedicated to screening or counselling at
the front of the clinic. This translates to an additional two to three nursing sisters for
such a visit, depending on the target number of units. The required staffing levels are
also influenced by the length of time that the clinic is held and the rate of donations
expected. The collections manager felt that these factors would translate into higher
costs per unit collected at educational institutions.
The collections manager commented that many of the capex costs involved in setting
up new clinics would be common to both fixed sites and roaming clinics, and that the
differences between these costs for different collection methods would be relatively
small.
4.2 Quantitative Findings and Analysis
This section presents the quantitative findings of the study and analyses those
findings. Each of the subsections to follow focuses on one of the three major cost
areas identified: consumables costs, staff costs and capex costs. The final sub-section
draws together the findings from the previous three, to form an overall picture of
blood donation collections costs.
4.2.1 Consumables Costs
The monthly report of costs of consumables used by WPBTS contained sixteen cost
codes deemed to form part of this study, because they related to either donation unit-
Copyright UCT
DRIVERS OF BLOOD DONATION COLLECTION COSTS 22
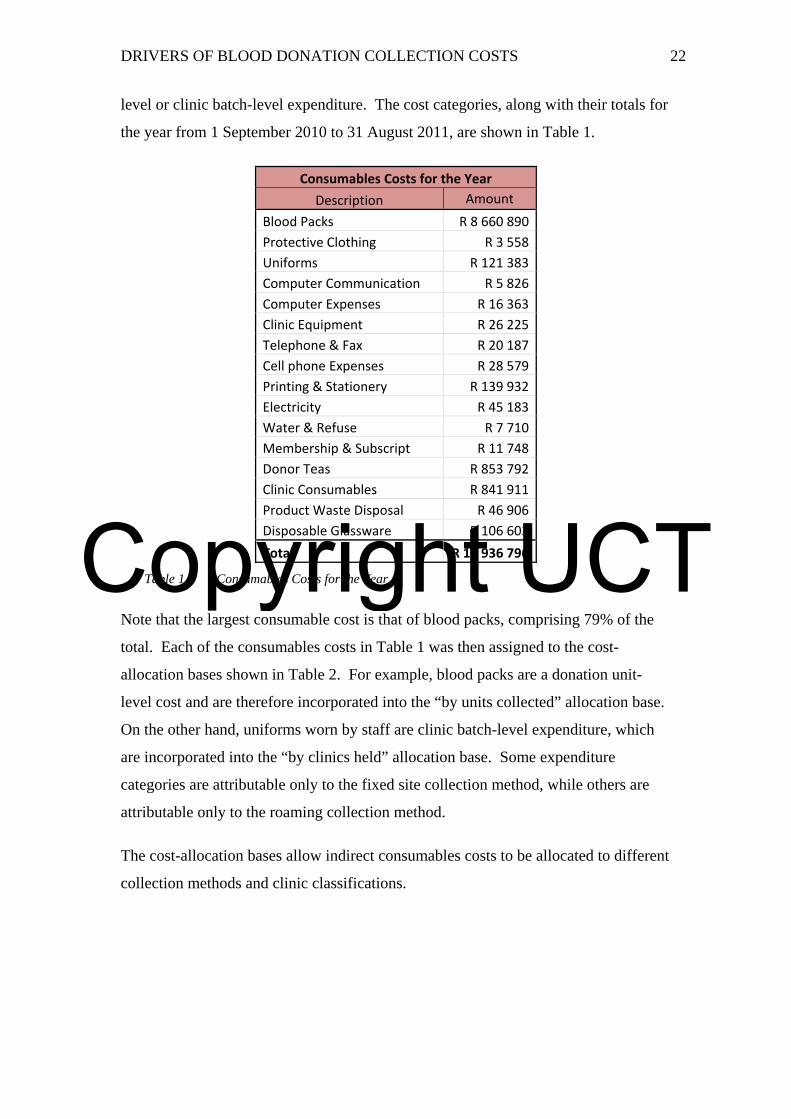
level or clinic batch-level expenditure. The cost categories, along with their totals for
the year from 1 September 2010 to 31 August 2011, are shown in Table 1.
Consumables Costs for the Year
Description Amount
Blood Packs R 8 660 890
Protective Clothing R 3 558
Uniforms R 121 383
Computer Communication R 5 826
Computer Expenses R 16 363
Clinic Equipment R 26 225
Telephone & Fax R 20 187
Cell phone Expenses R 28 579
Printing & Stationery R 139 932
Electricity R 45 183
Water & Refuse R 7 710
Membership & Subscript R 11 748
Donor Teas R 853 792
Clinic Consumables R 841 911
Product Waste Disposal R 46 906
Disposable Glassware R 106 603
Total R 10 936 796
Table 1 Consumables Costs for the Year
Note that the largest consumable cost is that of blood packs, comprising 79% of the
total. Each of the consumables costs in Table 1 was then assigned to the cost-
allocation bases shown in Table 2. For example, blood packs are a donation unit-
level cost and are therefore incorporated into the “by units collected” allocation base.
On the other hand, uniforms worn by staff are clinic batch-level expenditure, which
are incorporated into the “by clinics held” allocation base. Some expenditure
categories are attributable only to the fixed site collection method, while others are
attributable only to the roaming collection method.
The cost-allocation bases allow indirect consumables costs to be allocated to different
collection methods and clinic classifications.
Copyright UCT
DRIVERS OF BLOOD DONATION COLLECTION COSTS 23
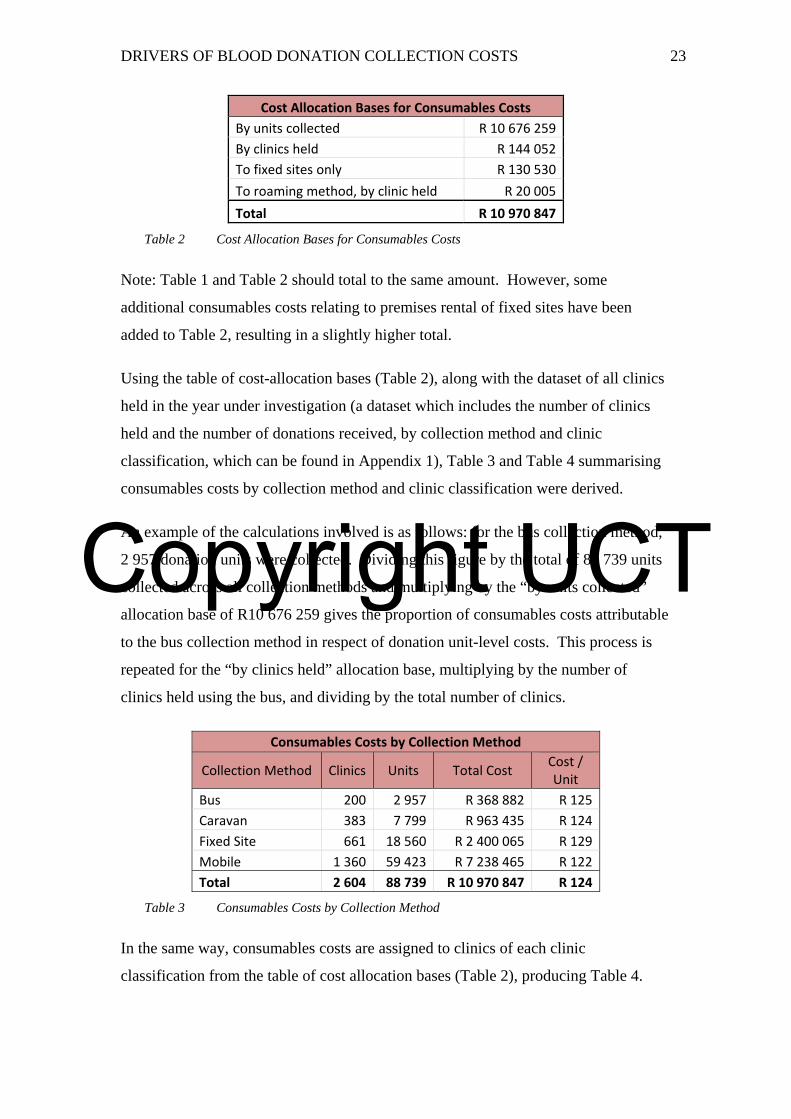
Cost Allocation Bases for Consumables Costs
By units collected R 10 676 259
By clinics held R 144 052
To fixed sites only R 130 530
To roaming method, by clinic held R 20 005
Total R 10 970 847
Table 2 Cost Allocation Bases for Consumables Costs
Note: Table 1 and Table 2 should total to the same amount. However, some
additional consumables costs relating to premises rental of fixed sites have been
added to Table 2, resulting in a slightly higher total.
Using the table of cost-allocation bases (Table 2), along with the dataset of all clinics
held in the year under investigation (a dataset which includes the number of clinics
held and the number of donations received, by collection method and clinic
classification, which can be found in Appendix 1), Table 3 and Table 4 summarising
consumables costs by collection method and clinic classification were derived.
An example of the calculations involved is as follows: for the bus collection method,
2 957 donation units were collected. Dividing this figure by the total of 88 739 units
collected across all collection methods and multiplying by the “by units collected”
allocation base of R10 676 259 gives the proportion of consumables costs attributable
to the bus collection method in respect of donation unit-level costs. This process is
repeated for the “by clinics held” allocation base, multiplying by the number of
clinics held using the bus, and dividing by the total number of clinics.
Consumables Costs by Collection Method
Collection Method Clinics Units Total Cost Cost / Unit
Bus 200 2 957 R 368 882 R 125
Caravan 383 7 799 R 963 435 R 124
Fixed Site 661 18 560 R 2 400 065 R 129
Mobile 1 360 59 423 R 7 238 465 R 122
Total 2 604 88 739 R 10 970 847 R 124
Table 3 Consumables Costs by Collection Method
In the same way, consumables costs are assigned to clinics of each clinic
classification from the table of cost allocation bases (Table 2), producing Table 4.
Copyright UCT
DRIVERS OF BLOOD DONATION COLLECTION COSTS 24
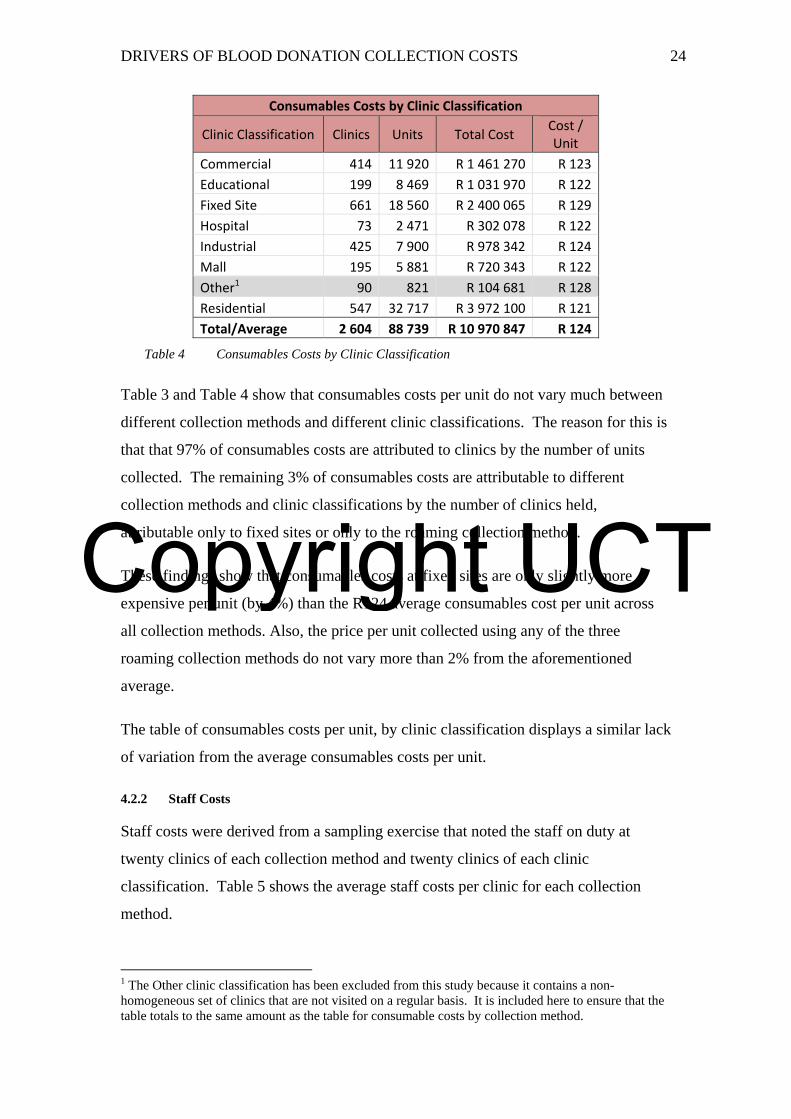
Consumables Costs by Clinic Classification
Clinic Classification Clinics Units Total Cost Cost / Unit
Commercial 414 11 920 R 1 461 270 R 123
Educational 199 8 469 R 1 031 970 R 122
Fixed Site 661 18 560 R 2 400 065 R 129
Hospital 73 2 471 R 302 078 R 122
Industrial 425 7 900 R 978 342 R 124
Mall 195 5 881 R 720 343 R 122
Other1 90 821 R 104 681 R 128
Residential 547 32 717 R 3 972 100 R 121
Total/Average 2 604 88 739 R 10 970 847 R 124
Table 4 Consumables Costs by Clinic Classification
Table 3 and Table 4 show that consumables costs per unit do not vary much between
different collection methods and different clinic classifications. The reason for this is
that that 97% of consumables costs are attributed to clinics by the number of units
collected. The remaining 3% of consumables costs are attributable to different
collection methods and clinic classifications by the number of clinics held,
attributable only to fixed sites or only to the roaming collection method.
These findings show that consumables costs at fixed sites are only slightly more
expensive per unit (by 4%) than the R124 average consumables cost per unit across
all collection methods. Also, the price per unit collected using any of the three
roaming collection methods do not vary more than 2% from the aforementioned
average.
The table of consumables costs per unit, by clinic classification displays a similar lack
of variation from the average consumables costs per unit.
4.2.2 Staff Costs
Staff costs were derived from a sampling exercise that noted the staff on duty at
twenty clinics of each collection method and twenty clinics of each clinic
classification. Table 5 shows the average staff costs per clinic for each collection
method.
1 The Other clinic classification has been excluded from this study because it contains a non-homogeneous set of clinics that are not visited on a regular basis. It is included here to ensure that the table totals to the same amount as the table for consumable costs by collection method.
Copyright UCT
DRIVERS OF BLOOD DONATION COLLECTION COSTS 25
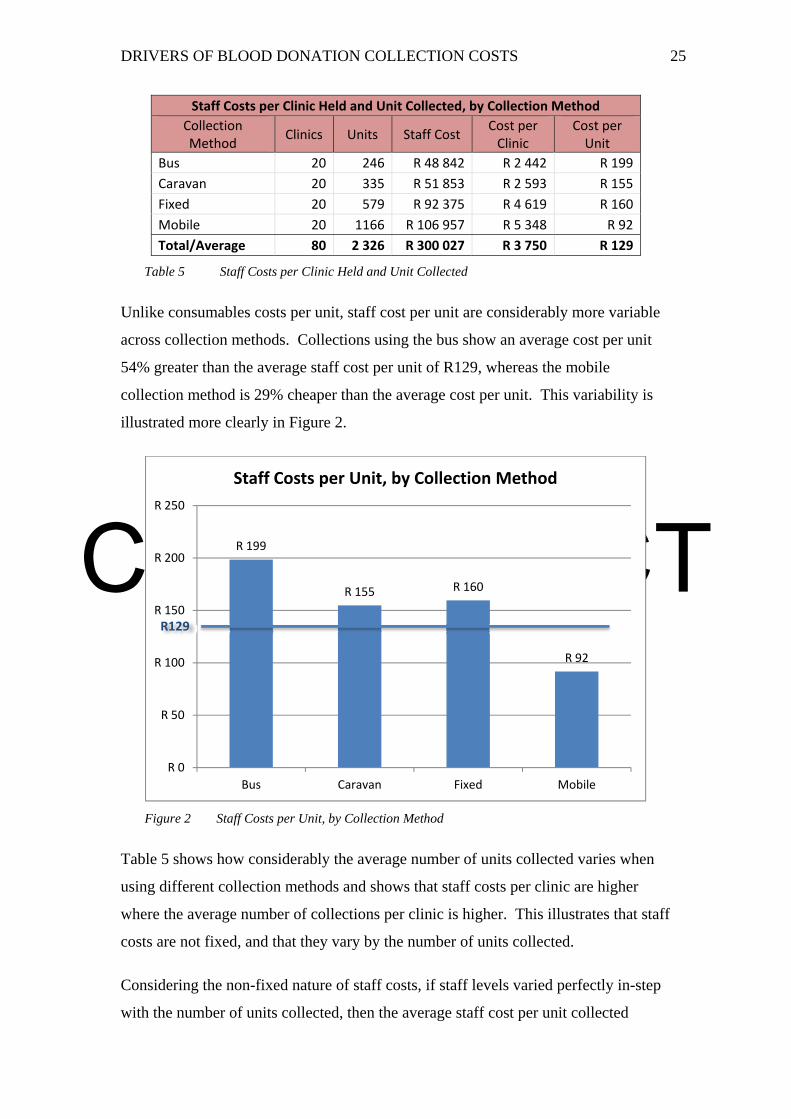
Staff Costs per Clinic Held and Unit Collected, by Collection Method Collection Method
Clinics Units Staff Cost Cost per Clinic
Cost per Unit
Bus 20 246 R 48 842 R 2 442 R 199
Caravan 20 335 R 51 853 R 2 593 R 155
Fixed 20 579 R 92 375 R 4 619 R 160
Mobile 20 1166 R 106 957 R 5 348 R 92
Total/Average 80 2 326 R 300 027 R 3 750 R 129
Table 5 Staff Costs per Clinic Held and Unit Collected
Unlike consumables costs per unit, staff cost per unit are considerably more variable
across collection methods. Collections using the bus show an average cost per unit
54% greater than the average staff cost per unit of R129, whereas the mobile
collection method is 29% cheaper than the average cost per unit. This variability is
illustrated more clearly in Figure 2.
Figure 2 Staff Costs per Unit, by Collection Method
Table 5 shows how considerably the average number of units collected varies when
using different collection methods and shows that staff costs per clinic are higher
where the average number of collections per clinic is higher. This illustrates that staff
costs are not fixed, and that they vary by the number of units collected.
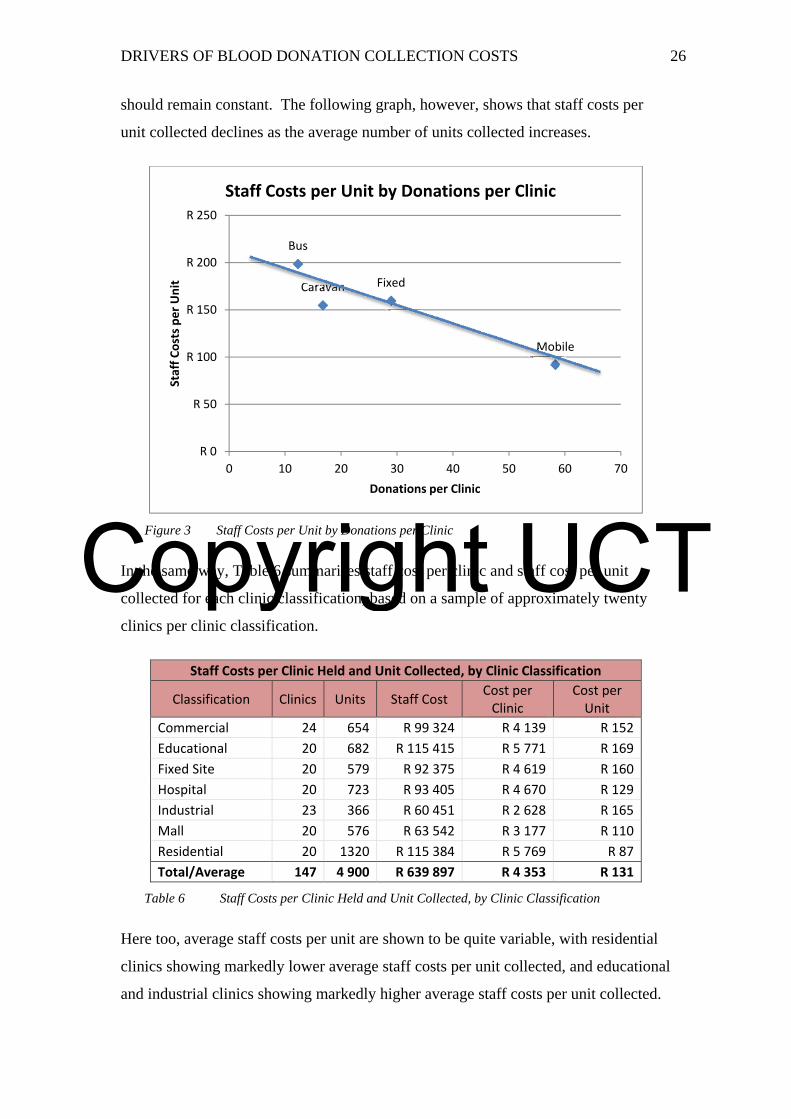
Considering the non-fixed nature of staff costs, if staff levels varied perfectly in-step
with the number of units collected, then the average staff cost per unit collected
R 199
R 155 R 160
R 92
R 0
R 50
R 100
R 150
R 200
R 250
Bus Caravan Fixed Mobile
Staff Costs per Unit, by Collection Method
R129
Copyright UCT
DRIVERS OF BLOOD DONATION COLLECTION COSTS 26
should remain constant. The following graph, however, shows that staff costs per
unit collected declines as the average number of units collected increases.
Figure 3 Staff Costs per Unit by Donations per Clinic
In the same way, Table 6 summarises staff cost per clinic and staff cost per unit
collected for each clinic classification, based on a sample of approximately twenty
clinics per clinic classification.
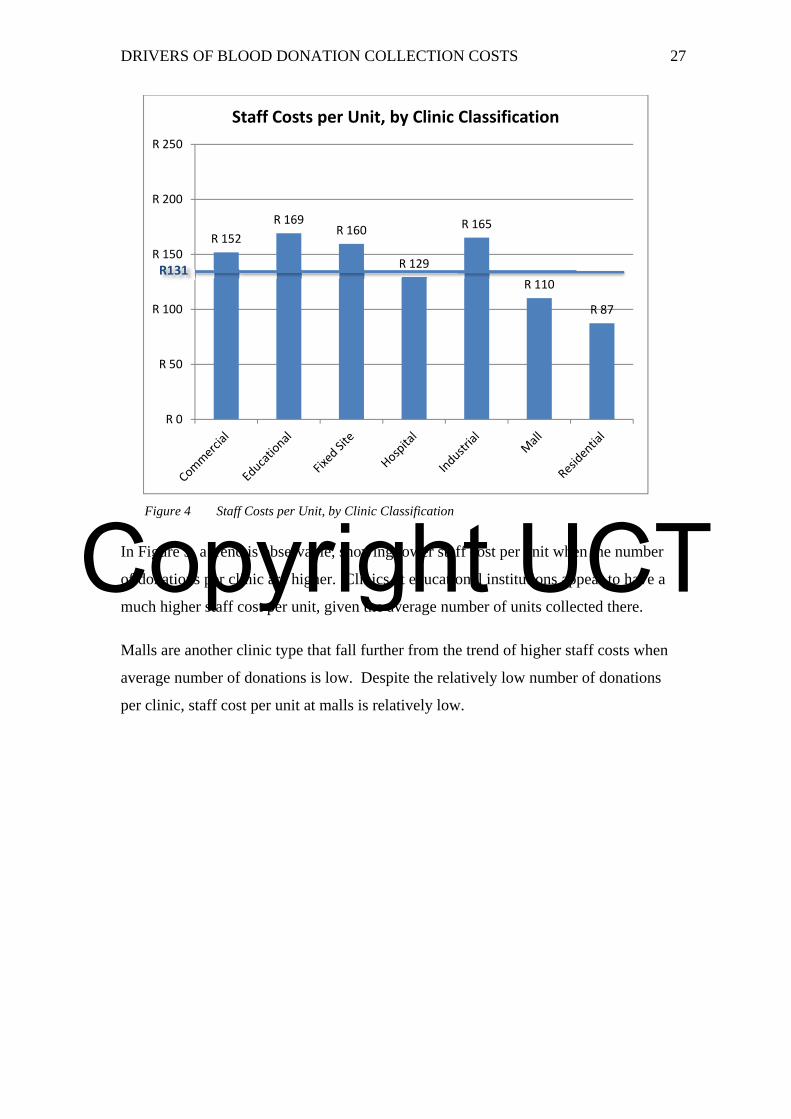
Staff Costs per Clinic Held and Unit Collected, by Clinic Classification
Classification Clinics Units Staff Cost Cost per Clinic
Cost per Unit
Commercial 24 654 R 99 324 R 4 139 R 152
Educational 20 682 R 115 415 R 5 771 R 169
Fixed Site 20 579 R 92 375 R 4 619 R 160
Hospital 20 723 R 93 405 R 4 670 R 129
Industrial 23 366 R 60 451 R 2 628 R 165
Mall 20 576 R 63 542 R 3 177 R 110
Residential 20 1320 R 115 384 R 5 769 R 87
Total/Average 147 4 900 R 639 897 R 4 353 R 131
Table 6 Staff Costs per Clinic Held and Unit Collected, by Clinic Classification
Here too, average staff costs per unit are shown to be quite variable, with residential
clinics showing markedly lower average staff costs per unit collected, and educational
and industrial clinics showing markedly higher average staff costs per unit collected.
Bus
Caravan Fixed
Mobile
R 0
R 50
R 100
R 150
R 200
R 250
0 10 20 30 40 50 60 70
Staff Costs per Unit
Donations per Clinic
Staff Costs per Unit by Donations per Clinic
Copyright UCT
DRIVERS OF BLOOD DONATION COLLECTION COSTS 27
Figure 4 Staff Costs per Unit, by Clinic Classification
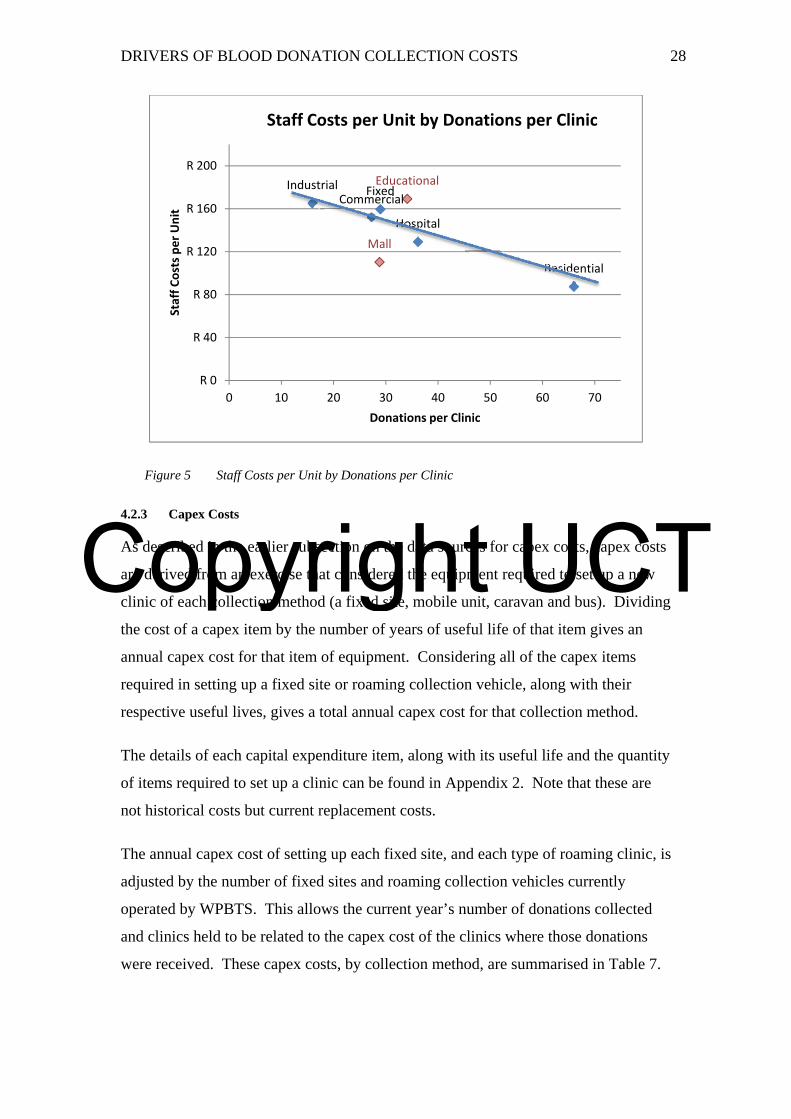
In Figure 5, a trend is observable, showing lower staff cost per unit when the number
of donations per clinic are higher. Clinics at educational institutions appear to have a
much higher staff cost per unit, given the average number of units collected there.
Malls are another clinic type that fall further from the trend of higher staff costs when
average number of donations is low. Despite the relatively low number of donations
per clinic, staff cost per unit at malls is relatively low.
R 152
R 169R 160
R 129
R 165
R 110
R 87
R 0
R 50
R 100
R 150
R 200
R 250
Staff Costs per Unit, by Clinic Classification
R131
Copyright UCT
DRIVERS OF BLOOD DONATION COLLECTION COSTS 28
Figure 5 Staff Costs per Unit by Donations per Clinic
4.2.3 Capex Costs
As described in the earlier subsection on the data sources for capex costs, capex costs
are derived from an exercise that considered the equipment required to set up a new
clinic of each collection method (a fixed site, mobile unit, caravan and bus). Dividing
the cost of a capex item by the number of years of useful life of that item gives an
annual capex cost for that item of equipment. Considering all of the capex items
required in setting up a fixed site or roaming collection vehicle, along with their
respective useful lives, gives a total annual capex cost for that collection method.
The details of each capital expenditure item, along with its useful life and the quantity
of items required to set up a clinic can be found in Appendix 2. Note that these are
not historical costs but current replacement costs.
The annual capex cost of setting up each fixed site, and each type of roaming clinic, is
adjusted by the number of fixed sites and roaming collection vehicles currently
operated by WPBTS. This allows the current year’s number of donations collected
and clinics held to be related to the capex cost of the clinics where those donations
were received. These capex costs, by collection method, are summarised in Table 7.
Commercial
EducationalFixed
Hospital
Industrial
Mall
Residential
R 0
R 40
R 80
R 120
R 160
R 200
0 10 20 30 40 50 60 70
Staff Costs per Unit
Donations per Clinic
Staff Costs per Unit by Donations per Clinic
Copyright UCT
DRIVERS OF BLOOD DONATION COLLECTION COSTS 29
Capex per Clinic Held and Unit Collected, by Collection Method
Collection Method Clinics Units CapexCapex
per ClinicCost
per Unit
Bus 200 2 957 R 178 483 R 892 R 60
Caravan 383 7 799 R 172 633 R 451 R 22
Fixed 661 18 560 R 87 069 R 132 R 5
Mobile 1 360 59 423 R 469 467 R 345 R 8
Total/Average 2 604 88 739 R 907 652 R 349 R 10
Table 7 Setup Costs per Clinic Held and Unit Collected, by Collection Method
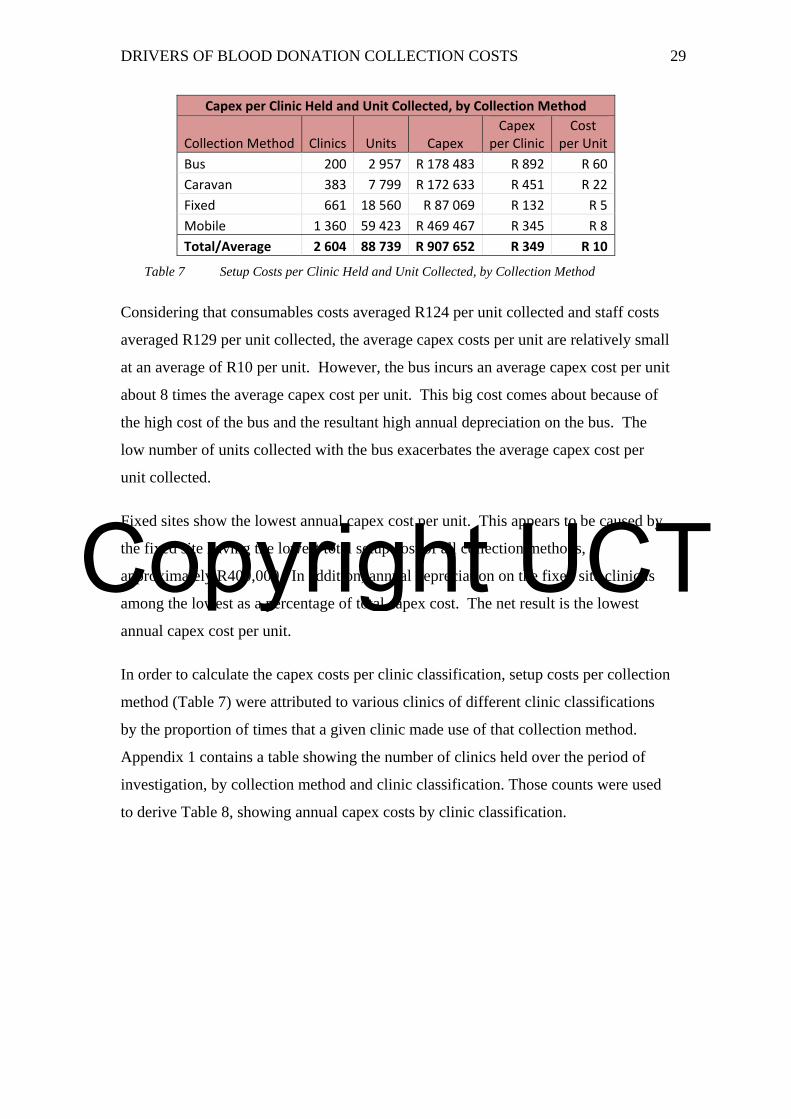
Considering that consumables costs averaged R124 per unit collected and staff costs
averaged R129 per unit collected, the average capex costs per unit are relatively small
at an average of R10 per unit. However, the bus incurs an average capex cost per unit
about 8 times the average capex cost per unit. This big cost comes about because of
the high cost of the bus and the resultant high annual depreciation on the bus. The
low number of units collected with the bus exacerbates the average capex cost per
unit collected.
Fixed sites show the lowest annual capex cost per unit. This appears to be caused by
the fixed site having the lowest total setup cost of all collection methods,
approximately R400,000. In addition, annual depreciation on the fixed site clinic is
among the lowest as a percentage of total capex cost. The net result is the lowest
annual capex cost per unit.
In order to calculate the capex costs per clinic classification, setup costs per collection
method (Table 7) were attributed to various clinics of different clinic classifications
by the proportion of times that a given clinic made use of that collection method.
Appendix 1 contains a table showing the number of clinics held over the period of
investigation, by collection method and clinic classification. Those counts were used
to derive Table 8, showing annual capex costs by clinic classification.

Copyright UCT
DRIVERS OF BLOOD DONATION COLLECTION COSTS 30
Capex per Clinic Held and Unit Collected, by Clinic Classification
Clinic Classification Clinics Units Capex Capex per Clinic Cost per Unit
Commercial 414 11 920 R 180 819 R 437 R 15
Educational 199 8 469 R 73 916 R 371 R 9
Fixed Site 661 18 560 R 87 069 R 132 R 5
Hospital 73 2 471 R 26 802 R 367 R 11
Industrial 425 7 900 R 205 122 R 483 R 26
Mall 195 5 881 R 113 487 R 582 R 19
Other2 90 821 R 31 068 R 345 R 38
Residential 547 32 717 R 189 369 R 346 R 6
Total/Average 2 604 88 739 R 907 652 R 349 R 10
Table 8 Setup Costs per Clinic Held and Unit Collected, by Clinic Classification
Because capex cost per clinic classification is derived from capex costs per collection
method, the variation in capex cost per clinic classification can be explained in terms
of the extent to which they make use of that collection method. Take the example of
the capex costs associated with Industrial clinics. The pie chart in Figure 6 shows
that Industrial clinics mostly made use of the relatively expensive bus and caravan
collection methods. Similarly, the relatively high capex cost per unit at mall clinics is
explained by the extensive use of the bus and caravan at those clinics.
Figure 6 Number of Industrial Clinics Held, by Collection Method
2 The Other clinic classification has been excluded from this study because it contains a non-homogeneous set of clinics that are not visited on a regular basis. It is included here to ensure that the table totals to the same amount as the table for capex costs by collection method.
62
232
131
Industrial Clinics Held, by Collection Method
Bus
Caravan
Mobile
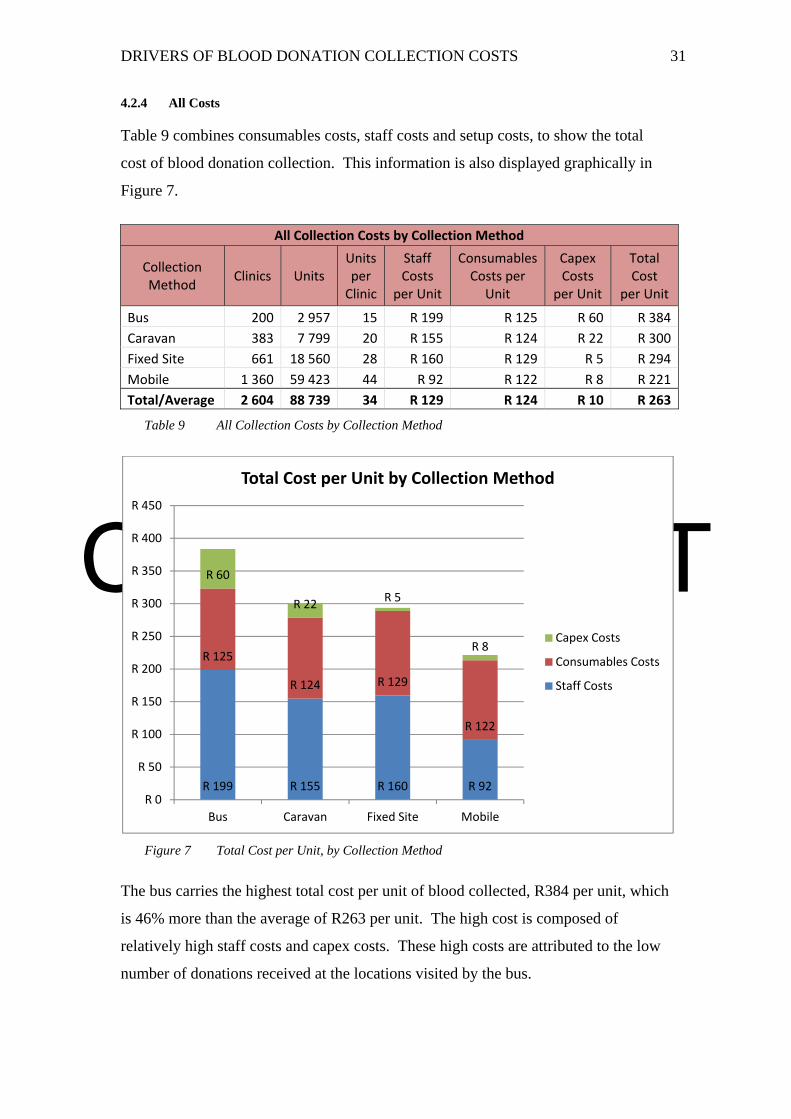
Copyright UCT
DRIVERS OF BLOOD DONATION COLLECTION COSTS 31
4.2.4 All Costs
Table 9 combines consumables costs, staff costs and setup costs, to show the total
cost of blood donation collection. This information is also displayed graphically in
Figure 7.
All Collection Costs by Collection Method
Collection Method
Clinics Units Units per Clinic
Staff Costs
per Unit
ConsumablesCosts per
Unit
Capex Costs
per Unit
Total Cost
per Unit
Bus 200 2 957 15 R 199 R 125 R 60 R 384
Caravan 383 7 799 20 R 155 R 124 R 22 R 300
Fixed Site 661 18 560 28 R 160 R 129 R 5 R 294
Mobile 1 360 59 423 44 R 92 R 122 R 8 R 221
Total/Average 2 604 88 739 34 R 129 R 124 R 10 R 263
Table 9 All Collection Costs by Collection Method
Figure 7 Total Cost per Unit, by Collection Method
The bus carries the highest total cost per unit of blood collected, R384 per unit, which
is 46% more than the average of R263 per unit. The high cost is composed of
relatively high staff costs and capex costs. These high costs are attributed to the low
number of donations received at the locations visited by the bus.
R 199 R 155 R 160 R 92
R 125
R 124 R 129
R 122
R 60
R 22R 5
R 8
R 0
R 50
R 100
R 150
R 200
R 250
R 300
R 350
R 400
R 450
Bus Caravan Fixed Site Mobile
Total Cost per Unit by Collection Method
Capex Costs
Consumables Costs
Staff Costs
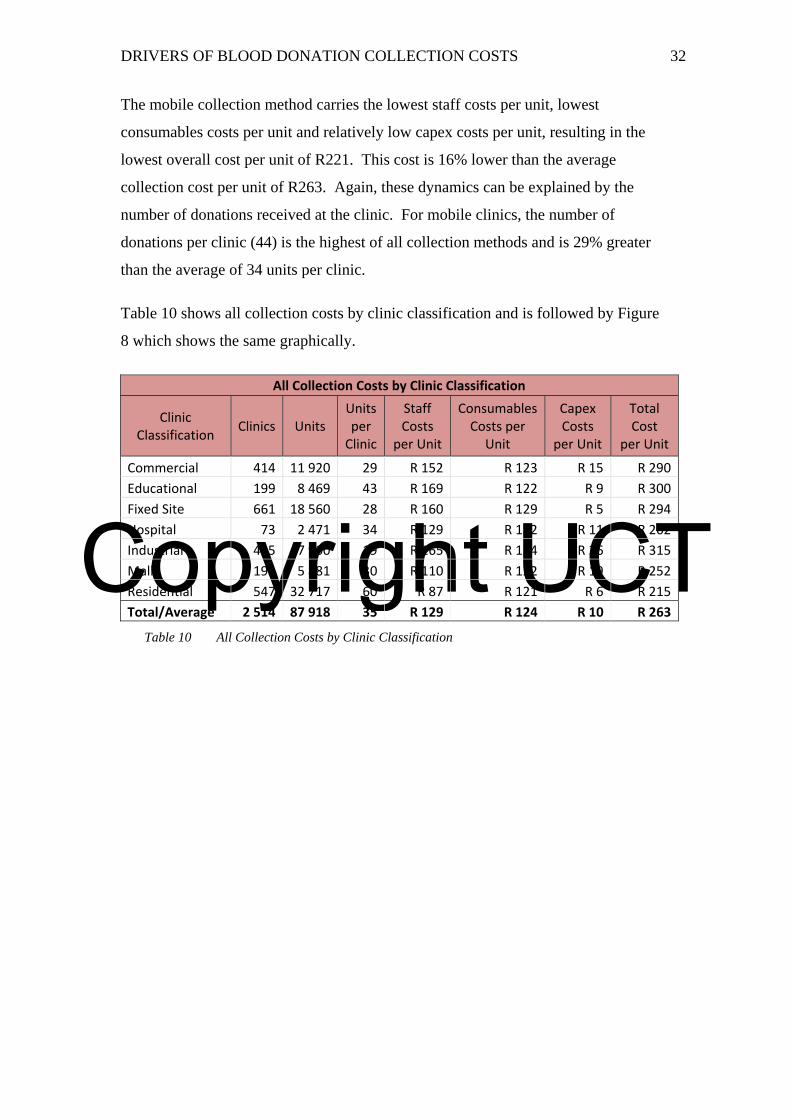
Copyright UCT
DRIVERS OF BLOOD DONATION COLLECTION COSTS 32
The mobile collection method carries the lowest staff costs per unit, lowest
consumables costs per unit and relatively low capex costs per unit, resulting in the
lowest overall cost per unit of R221. This cost is 16% lower than the average
collection cost per unit of R263. Again, these dynamics can be explained by the
number of donations received at the clinic. For mobile clinics, the number of
donations per clinic (44) is the highest of all collection methods and is 29% greater
than the average of 34 units per clinic.
Table 10 shows all collection costs by clinic classification and is followed by Figure
8 which shows the same graphically.
All Collection Costs by Clinic Classification
Clinic Classification
Clinics Units Units per Clinic
Staff Costs
per Unit
ConsumablesCosts per
Unit
Capex Costs
per Unit
Total Cost
per Unit
Commercial 414 11 920 29 R 152 R 123 R 15 R 290
Educational 199 8 469 43 R 169 R 122 R 9 R 300
Fixed Site 661 18 560 28 R 160 R 129 R 5 R 294
Hospital 73 2 471 34 R 129 R 122 R 11 R 262
Industrial 425 7 900 19 R 165 R 124 R 26 R 315
Mall 195 5 881 30 R 110 R 122 R 19 R 252
Residential 547 32 717 60 R 87 R 121 R 6 R 215
Total/Average 2 514 87 918 35 R 129 R 124 R 10 R 263
Table 10 All Collection Costs by Clinic Classification
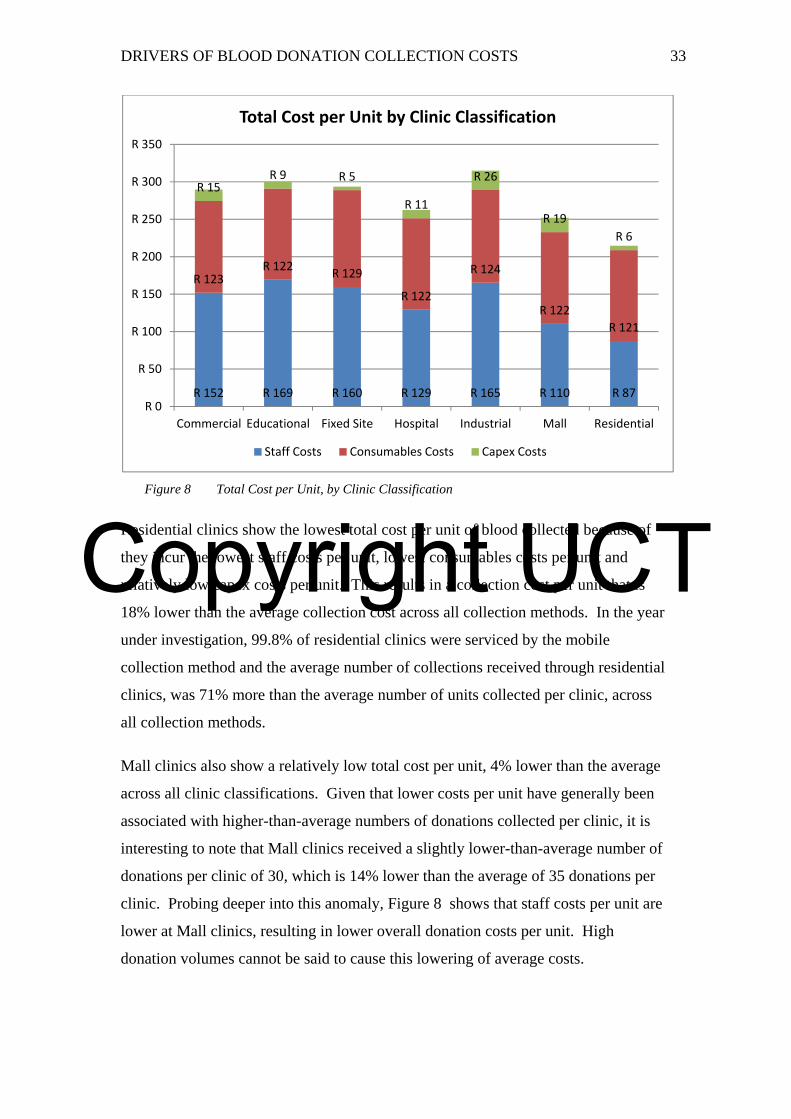
Copyright UCT
DRIVERS OF BLOOD DONATION COLLECTION COSTS 33
Figure 8 Total Cost per Unit, by Clinic Classification
Residential clinics show the lowest total cost per unit of blood collected because of
they incur the lowest staff costs per unit, lowest consumables costs per unit and
relatively low capex costs per unit. This results in a collection cost per unit that is
18% lower than the average collection cost across all collection methods. In the year
under investigation, 99.8% of residential clinics were serviced by the mobile
collection method and the average number of collections received through residential
clinics, was 71% more than the average number of units collected per clinic, across
all collection methods.
Mall clinics also show a relatively low total cost per unit, 4% lower than the average
across all clinic classifications. Given that lower costs per unit have generally been
associated with higher-than-average numbers of donations collected per clinic, it is
interesting to note that Mall clinics received a slightly lower-than-average number of
donations per clinic of 30, which is 14% lower than the average of 35 donations per
clinic. Probing deeper into this anomaly, Figure 8 shows that staff costs per unit are
lower at Mall clinics, resulting in lower overall donation costs per unit. High
donation volumes cannot be said to cause this lowering of average costs.
R 152 R 169 R 160 R 129 R 165 R 110 R 87
R 123R 122
R 129
R 122
R 124
R 122
R 121
R 15R 9 R 5
R 11
R 26
R 19
R 6
R 0
R 50
R 100
R 150
R 200
R 250
R 300
R 350
Commercial Educational Fixed Site Hospital Industrial Mall Residential
Total Cost per Unit by Clinic Classification
Staff Costs Consumables Costs Capex Costs
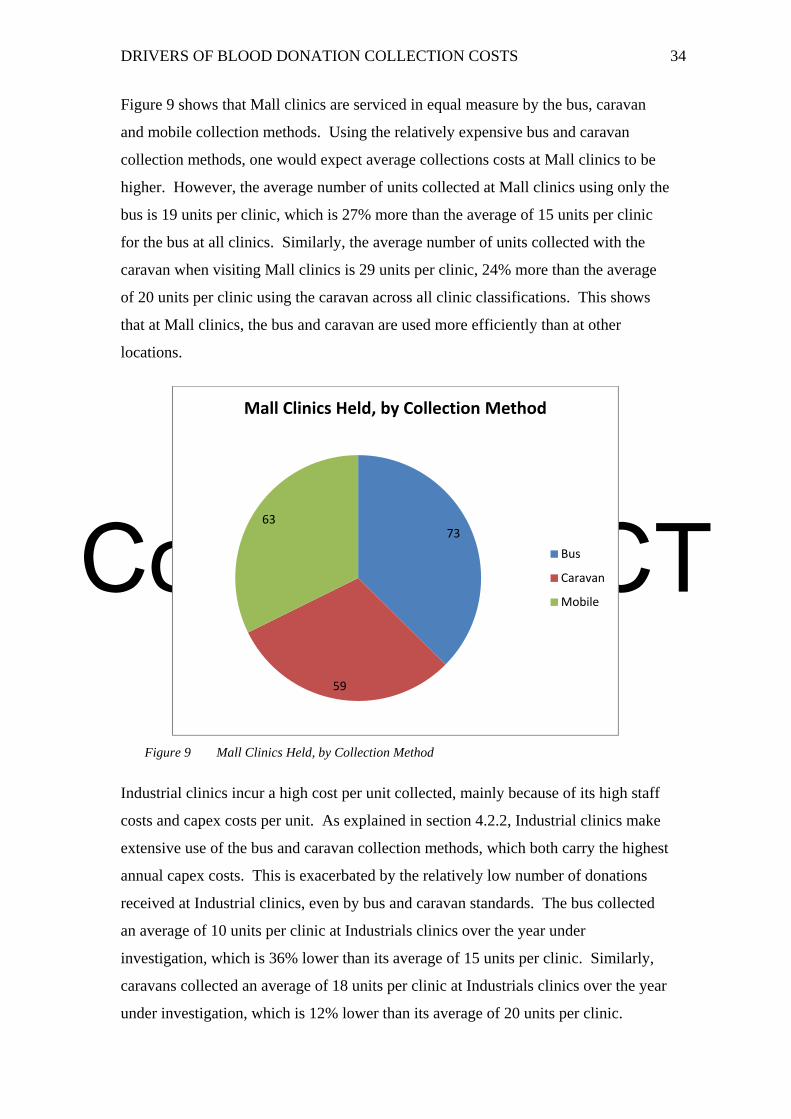
Copyright UCT
DRIVERS OF BLOOD DONATION COLLECTION COSTS 34
Figure 9 shows that Mall clinics are serviced in equal measure by the bus, caravan
and mobile collection methods. Using the relatively expensive bus and caravan
collection methods, one would expect average collections costs at Mall clinics to be
higher. However, the average number of units collected at Mall clinics using only the
bus is 19 units per clinic, which is 27% more than the average of 15 units per clinic
for the bus at all clinics. Similarly, the average number of units collected with the
caravan when visiting Mall clinics is 29 units per clinic, 24% more than the average
of 20 units per clinic using the caravan across all clinic classifications. This shows
that at Mall clinics, the bus and caravan are used more efficiently than at other
locations.
Figure 9 Mall Clinics Held, by Collection Method
Industrial clinics incur a high cost per unit collected, mainly because of its high staff
costs and capex costs per unit. As explained in section 4.2.2, Industrial clinics make
extensive use of the bus and caravan collection methods, which both carry the highest
annual capex costs. This is exacerbated by the relatively low number of donations
received at Industrial clinics, even by bus and caravan standards. The bus collected
an average of 10 units per clinic at Industrials clinics over the year under
investigation, which is 36% lower than its average of 15 units per clinic. Similarly,
caravans collected an average of 18 units per clinic at Industrials clinics over the year
under investigation, which is 12% lower than its average of 20 units per clinic.
73
59
63
Mall Clinics Held, by Collection Method
Bus
Caravan
Mobile

Copyright UCT
DRIVERS OF BLOOD DONATION COLLECTION COSTS 35
4.3 Discussion
This section discusses the earlier quantitative findings in the context of the Strategic
Cost Drivers framework of Shank and Govindarajan (1993). It incorporates the
perspectives of the collections manager on both the quantitative results and the cost
drivers.
Each sub-section to follow is dedicated to one of the structural or executional cost
drivers of the Strategic Cost Drivers Framework.
4.3.1 Scale of Operations
According to the collections manager, the scale of operations is important to the
collections division because a fine balance is needed in how many units are collected
on an ongoing basis. Adequate stock levels are essential. And yet, the collections
division is not free to collect large volumes of units from donors since blood expires
and it would cause waste if too many units were collected. For these reasons, the
challenge of managing costs within the collections division is not overcome by
simply sending out cheap mobile units to collect large volumes of blood donations
from donors at residential clinics.
The scale of operations is considered to be a major cost driver and is discussed in
more detail in conjunction with capacity utilisation in sub-section 4.3.8.
4.3.2 Scope of Operations
The WPBTS has a number of divisions, which fulfil a number of functions along the
blood transfusion value chain. There are divisions for marketing and donor
recruitment, donation collections, testing and transport to hospitals. The WPBTS also
operates a blood bank. Therefore, the collections division operates within a broader
scope of operations. However, the scope of the collections division itself is quite
narrow and it does not have much leeway to change the scope of its functions. For
these reasons, Scope is not of strategic relevance to the collections division and is not
a cost driver.
4.3.3 Experience of the Firm and Employees
The WPBTS has operated for 73 years and is experienced in delivering blood
transfusion services, including collections from donors. The firm is not

Copyright UCT
DRIVERS OF BLOOD DONATION COLLECTION COSTS 36
inexperienced in what it does, and therefore it is not a cost driver. On the other hand,
its immense experience cannot necessarily be said to lower costs. Regardless, the
experience of the firm is not something that can be changed by WPBTS; it is a given.
As a result, the experience of the firm is not a strategically relevant cost driver for the
purpose of this study, since WPBTS has no control over this aspect of its operations.
According to the collections manager, levels of staff experience within the collections
division vary. The division employs a number of experienced registered nurses and
team leaders, who tend to be long-standing staff members and earn higher salaries.
However, it also employs younger donor hosts and hostesses, especially having
recently set up a new collections team. For these reasons, the level of experience of
employees is a cost driver for the collections division of WPBTS.
In terms of donor hosts and hostesses, there is a preference toward having more
mature people fill these roles, given the high levels of responsibility expected of
them. There is no explicit strategy in terms of the preference for more or less
experienced nursing staff. As a result, the experience of employees is a cost driver
and is of strategic relevance to the collections division. However, this study has not
probed the levels of experience of staff in its quantitative investigations and, as a
result, is not in a position to comment on the levels of staff experience as a cost
driver.
4.3.4 Technology Used
The WPBTS makes use of technologically advanced equipment in its testing division.
However, the collections division is not technology-driven. Until a few years ago,
WPBTS made use of an old technique for measuring the haemoglobin levels in a
donor’s blood before allowing them to donate. Only recently has a more modern
Haemacue machine been adopted for this purpose, and it does not come at a high
price.
Another example of the use of technology is the shaker, which is used to keep the
blood in the bag moving while it is being extracted from the donor. The collections
manager recently evaluated the purchase of a sophisticated item of equipment for this
purpose which would have come at a high cost of R20,000 each, while not being as

Copyright UCT
DRIVERS OF BLOOD DONATION COLLECTION COSTS 37
rugged as the existing equipment used for the same purpose. It was decided to not
purchase the new technology shaker.
The example of the Haemacue and the shaker shows that the collections division does
not over-invest in technology, especially since it is not a technology-driven division.
For these reasons, technology is not of strategic relevance to the collections division
and is not a significant factor in this study.
4.3.5 Complexity of Products and Services
A single product is derived from the work of the collections division: a unit of blood.
However, complexity lies in the number of different methods used by the division to
collect blood from donors. The largest proportion of donations is collected from
roaming units. Roaming units seek out donors in the neighbourhoods they live, their
places of work, hospitals or educational institutions. In this way, WPBTS collects
repeat donations from existing donors as well as finding new donors, particularly
through visiting educational institutions.
WPBTS caters for donors who have different needs and constraints in terms of
personal mobility and availability of time. Roaming units bring clinics closer to the
donor, while fixed site clinics operate every day of the week, allowing for time
flexibility.
To cater for fluctuations in the demand for blood and to efficiently service different
sized clinics, WPBTS operates a number of collection methods: a bus, caravans,
mobiles and fixed sites, each with different maximum capacities for simultaneous
donations.
The complexity of the operations of the collections division is considered a major
cost driver and more is said on this in the subsection on capacity utilisation in sub-
section 4.3.8.
4.3.6 Workforce Involvement
The work of the collections division is not as highly-creative as a team of software
developers or similar knowledge workers. For this reason, WPBTS may not need to
invest in top talent or ensure that staff is highly engaged in their work. However,
donor hosts and hostesses play a crucial role in engaging with donors and the public.

Copyright UCT
DRIVERS OF BLOOD DONATION COLLECTION COSTS 38
For this reason, it is essential that they are adequately trained and are kept engaged in
their work and motivated to maintain the image of the publicly-facing division of the
organisation. Donors are upset if they are not met with the friendliness and courtesy
that they expect from WPBTS.
According to the collections manager, workforce involvement is essential to the
running of the service. The collections division currently does a good job of
maintaining workforce involvement and training in this regard is ongoing. In fact,
ongoing training is part of the organisation’s ethics policy on recruitment and
retention.
For the purposes of this study, however, workforce involvement did not represent a
strategically-relevant driver of costs since high levels of workforce involvement are
not a choice but a given. At the same time, high levels of workforce involvement are
not anticipated to have a major impact on the cost structure of the division or the
recruitment/retention of donors.
4.3.7 Total Quality Management
The WPBTS is accredited by the South African National Accreditation System
(SANAS) and maintains high levels of quality within the organisation, particularly
within the testing laboratories and the blood banks. For the collections division, the
highest levels of quality are maintained in ensuring the safety of the donor and the
blood during the donation process. However, donors are likely to consider quality
levels a hygiene factor: Quality is absolutely essential, but raising quality levels will
not result in more donations received. A high level of quality in safety is a given in
the mind of the donor. Therefore, total quality management is not a strategic choice
for the purposes of this study.
4.3.8 Capacity Utilization
The collections division has the ability to scale the size of its clinics by altering the
number of staff assigned to a clinic and choosing a collection method with an
appropriate capacity relative to the number of units expected at that clinic. This
ability to manage capacity is important since staff costs make up a large proportion of
the cost of collecting blood from donors. Assigning too many staff members to a

Copyright UCT
DRIVERS OF BLOOD DONATION COLLECTION COSTS 39
clinic that yields a low number of donations impacts the overall cost-effectiveness of
that clinic.
At the opposite end of the spectrum, if a clinic receives more donors in a short time-
frame than what it can accommodate, donors will need to wait before having their
donation taken. This can result in a donor leaving the clinic, deferring donation to
another day. The experience of the WPBTS has been that donors often take a long
time to return because their personal circumstances may change, they travel; get a
mild illness and many such little hindrances keep them away.
Regarding the earlier findings on costs per unit using different collection methods, the
collections manager found it surprising that the average staff cost per unit on the bus
was considerably more than that of the caravan, given the similarities between these
collection methods. Both are self-contained roaming units that are not dependent
upon a venue and, whereas the bus has the capacity to bleed five donors
simultaneously, the caravan is able to bleed a similar four donors simultaneously.
The collections manager explained that the bus tended to be used at newly-established
collection sites and that the number of donations received at those sites may be
relatively low. There is a trend toward more donations being received at well-
established clinics because it takes a while before potential donors at a given location
become aware of the roaming clinic and its visiting schedule at that location. With
time, more donors will attend the clinic, resulting in lower staff costs per unit
collected.
Clinics held at Hospitals also show a low average staff cost per unit, attributed to the
relatively high number of donations received there while keeping staff costs per clinic
at a similar level to fixed site clinics. According to the collections manager, Hospitals
enjoy a captive audience with an elevated sense of the need for blood donations.
Hence, many donations are received at Hospitals. Capacity utilisation at Hospital
clinics is managed efficiently.
Industrial clinics showed the highest overall cost per unit across all clinic
classifications, owing to the high staff costs per unit. At Industrial clinics, the staff
cost per clinic is the lowest across all clinic classifications, proving that the
collections division is aware of the need to lower staffing levels at these clinics.
Copyright UCT
DRIVERS OF BLOOD DONATION COLLECTION COSTS 40
Despite this, the average number of donations per clinic received is so low that the
resultant staff cost per unit is still among the highest. This highlights the need to
either lower staffing levels at Industrial clinics even further or raise the average
number of donations received at Industrial clinics. According to the collections
manager, the low number of donations at Industrial clinics is partly attributed to
employers at the clinic sites not allowing their staff the necessary time off to donate.
Another reason is that Industrial clinics are not open to the public, meaning donations
can only be received from staff at that organisation at that clinic. This lowers the
number of donations received there and results in under-utilised capacity.
4.3.9 Layout Efficiency
Blood donation is not a high-volume operation featuring many steps. A donor
typically completes a form, has their haemoglobin levels checked, sits down in a chair
and has their blood pressure checked before the needle is inserted. Layout efficiency,
for the purposes of being able to process more donors per hour is not a strategic focus
for WPBTS. Having said that, an initiative is underway to have a donor’s blood
pressure checked earlier in the process so as to minimise time wasted in completing
the earlier steps before finding out that the donor’s blood pressure is not what it
should be. Despite this, layout efficiency is not a cost driver for the collections
division since minor process tweaks such as these do not have major cost implications
for the service. As such, layout efficiency is not a cost driver for the purposes of this
study.
4.3.10 Product/Service Configuration
Following on from the example of blood pressure checks in the context of layout
efficiency discussed under sub-section 4.3.9, the collections division has an ongoing
programme of up-skilling its donor hosts/hostesses to become phlebotomists. This
will allow for a re-configuration of the blood donation process at the clinic, whereby
the registered nurse on duty will be able to spend more time with donors during the
screening phase, as well as taking blood pressure readings. This improved
configuration will be of benefit to donors, who will be made to feel more secure in
the phase leading up to the donation. However, as for the arguments under sub-
section 4.3.9, these minor process and layout tweaks do not drive costs or
fundamentally change the division’s ability to collect blood from donors.

Copyright UCT
DRIVERS OF BLOOD DONATION COLLECTION COSTS 41
4.3.11 Linkages with Suppliers and Customers
As described in the sub-section 4.3.2 on scope of operations, the collections division
operates within a narrow band of the value chain of blood transfusion. From this
perspective, the supplier that the collections division should foster linkages is the
promotions department, which is responsible for donor recruitment and arranging
venues for the roaming clinics. This is an area in which the two divisions have
worked closely in recent years and where more work needs to be done. Fostering
better linkages and synergies between the promotions and collections divisions is
essential to a more effective operation.
The customer of the collections division is the testing division. An example of down-
stream linkage with the testing division is when the collections division screens
donors. The collections division is performing a function associated more with
testing, which ensures the safety of the blood. Another area of downstream linkage is
the choice of bag used to collect the donation. The bag features a multiple-chamber
sealed system that helps in the production of blood products. It is also of a high
quality to ensure that no breakage occurs in latter phases of freezing, which are also
steps not associated with the collections division.
Linkages with suppliers and customers, therefore, do impact the cost structure of the
collections division. However, in light of the defined scope of this study, which
considers only costs incurred directly by the collections division, the lack of focus on
this strategic cost driver is a limitation of this study.
4.3.12 Conclusion
Following the Shank and Govindarajan (1993) framework, the factors that have been
found to drive collections costs are as follows:
Scale of Operations
Experience of Employees
Complexity of Services
Workforce Involvement
Total Quality Management
Capacity Utilization
Linkages with Suppliers and Customers

Copyright UCT
DRIVERS OF BLOOD DONATION COLLECTION COSTS 42
However, given that the collections division does not have a choice in the extent to
which it is able to influence various cost drivers (i.e. the cost driver is accepted as a
given), only a few of the cost drivers mentioned above are of strategic relevance to
the collections division. The list of strategically-relevant cost drivers is as follows:
Scale of Operations
Experience of Employees
Complexity of Services
Capacity Utilization
Linkages with Suppliers and Customers
A limitation of this study is that levels of experience of employees as well as linkages
with suppliers and customers were not investigated quantitatively. Therefore, this
study delivers conclusions on only the following strategically relevant cost drivers:
Scale of Operations
Complexity of Services
Capacity Utilization
The three strategically relevant cost drivers are inter-related. The need for flexibility
in the number of units that the service collects on an ongoing basis drives the need for
scalable operations; scalable in the capacity of its collection methods, the number of
staff it utilises and the ways in which donors are sourced. The net result is that the
service makes use of a complex array of collection methods and clinic classifications.
Across this complex array of collection methods and clinic classifications, capacity
utilisation is of paramount importance in running a cost-effective service.
Residential clinics, making use of the mobile collection method, showed the lowest
average cost per unit collected because of its high number of donations received.
High staff costs per clinic are counter-balanced by the high number of donations, such
that staff costs per unit are the lowest across all collection methods and clinic
classifications. This is an example of effective capacity utilisation through high
number of donations received while controlling staff costs.
The bus displayed high collection costs per unit because of the low number of
donations received on the bus. The impact of the low number of donations received
is that staff costs per unit and capex costs are the highest across all collection
methods. The high capex cost per unit is exacerbated by the high purchase price of

Copyright UCT
DRIVERS OF BLOOD DONATION COLLECTION COSTS 43
the bus which results in the bus having highest annual depreciation cost of all
collection methods. Evidently, the capacity of the bus is not utilised effectively.
Clinics held at Hospitals showed a low average staff cost per unit, because of its
relatively high number of donations received there, while keeping staff costs per
clinic at a similar level to fixed site clinics. This is an example of effective capacity
utilisation through high number of donations received while controlling staff costs.
Industrial clinics showed the highest overall cost per unit across all clinic
classifications due, in part, to high staff costs per unit collected. Despite Industrial
clinics having the lowest staff cost per clinic, the low number of donations received at
these clinics results in a relatively high staff cost per unit. This is an example of
ineffective capacity utilisation through low number of donations received while being
unable to lower staff costs to a point that does not result in high staff costs per unit.

Copyright UCT
DRIVERS OF BLOOD DONATION COLLECTION COSTS 44
5 RESEARCH CONCLUSIONS
5.1 Research Area and Problem
The cost of collecting blood from donors makes up a substantial portion of the cost of
running the Western Province Blood Transfusion Service (WPBTS). Thus, collection
costs make up a substantial proportion of the price paid by recipients of blood and
blood products at hospitals. Understanding what drives the cost of collecting blood
contributes significantly to understanding what can be changed in order to reduce that
cost and ultimately influence the price of blood.
5.2 Cost Drivers
Using the Shank and Govindarajan (1993) framework of structural and executional
cost drivers, this research explored factors affecting the cost of collecting blood
donations by the WPBTS. The following factors were found to drive collection costs:
Scale of Operations
Experience of Employees
Complexity of Services
Capacity Utilization
Linkages with Suppliers and Customers
The list above addresses the first research question into the key factors that drive
collections costs.
5.3 Cost Drivers by Collection Method and Clinic Classification
In order to assess cost drivers by collection method and clinic classification, this
research focused on three of the cost drives identified in section 5.2, through
interviews and a quantitative appraisal of costs:
Scale of Operations
Complexity of Services
Capacity Utilization
The need for flexibility in the number of units that the service collects on an ongoing
basis drives the need for scalable operations; scalability in the capacity of its
collection methods, the number of staff it utilizes and the ways in which donors are
sourced. The net result is that the service makes use of a complex array of collection
methods and clinic classifications. Across this complex array of collection methods

Copyright UCT
DRIVERS OF BLOOD DONATION COLLECTION COSTS 45
and clinic classifications, capacity utilization is of paramount importance to running a
cost-effective service.
The quantitative analysis phase of the study explored capacity utilization through
consumables costs, staff costs and capital expenditure (capex) costs associated with
clinics of various collection methods and clinic classifications. By comparing those
costs to the number of clinics held and the number of donations received at various
clinics, the differences in capacity utilization across collection methods and clinic
classifications were evident.
Residential clinics, making use of the mobile collection method, showed the lowest
average cost per unit collected because of its high number of donations received.
High staff costs per clinic are counter-balanced by the high number of donations
received, such that staff costs per unit are the lowest across all collection methods and
clinic classifications. This is an example of effective capacity utilisation through high
number of donations received while controlling staff costs.
The bus displayed high collection costs per unit because of the low number of
donations received on the bus. The impact of the low number of donations received
is that staff costs per unit and capex costs are the highest across all collection
methods. The high capex cost per unit is exacerbated by the high purchase price of
the bus, which results in the bus having the highest annual depreciation cost of all
collection methods. The capacity of the bus is not utilised effectively.
However, the bus and caravan collection methods are not inherently expensive. The
example of clinics held at Malls show that effective capacity utilization is pivotal. If
the bus and caravan could be utilised in more locations that yield high numbers of
donations, such as Malls, then they would reflect as more cost-effective.
Clinics held at Hospitals showed a low average staff cost per unit, because of the
relatively high number of donations received there, while keeping staff costs per
clinic at a similar level to fixed site clinics. This is an example of effective capacity
utilisation through high number of donations received while controlling staff costs.
Industrial clinics showed the highest overall cost per unit across all clinic
classifications due, in part, to high staff costs per unit collected. Despite Industrial

Copyright UCT
DRIVERS OF BLOOD DONATION COLLECTION COSTS 46
clinics having the lowest staff cost per clinic, the low number of donations received at
these clinics results in a relatively high staff cost per unit. This is an example of
ineffective capacity utilisation through low number of donations received while being
unable to lower staff costs to a point that does not result in high staff costs per unit.
The second research question is answered by the extent to which clinics adopting
different collection methods and clinic classifications display different cost
behaviour, showing that the cost drivers do vary by collection method and clinic
classification.
5.4 Research Limitations
This study did not explore in depth the cost driver of linkages with suppliers and
customers. Regarding linkages, there may be synergies with the promotions division
and the testing division that drive collections costs. For this reason, additional cost
drivers may be significant to the operations of the collections division.
This study also did not consider administrative overhead costs. Shared administrative
costs of running the collections division are excluded from the quantitative portion of
the study because they had no bearing on the different collection methods used or
classification of clinics visited. However, there may be strategic choices that can be
made as regards the administration of the collections division, but these have not been
explored in this study.
The experience of employees was discussed as a cost driver and was found to be of
strategic relevance to the collections division. However, this study has not probed the
levels of experience of staff in its quantitative investigations and, as a result, is not in
a position to comment on the levels of staff experience as a cost driver.
5.5 Future Research Directions
This study highlighted areas of possible improvement in the cost-effectiveness of
blood donation collection. Continuing on this theme, a number of future research
directions are proposed.

Copyright UCT
DRIVERS OF BLOOD DONATION COLLECTION COSTS 47
Staff costs per clinic could be benchmarked against the capacity of the collection
method used. This would enable WPBTS to identify clinics that are over-staffed or
under-staffed relative to the capacity of the clinic.
WPBTS should investigate the specific Industrial clinics that produce consistently
low numbers of donations. These locations could potentially be visited less often or
be removed from the clinic schedule all-together.
WPBTS should investigate ways in which the bus could be utilised more effectively,
at locations that yield higher numbers of donations. Existing locations such as Malls
could potentially be visited more often, while other clinics could be visited less often
or be removed from the clinic schedule all-together.

Copyright UCT
DRIVERS OF BLOOD DONATION COLLECTION COSTS 48
REFERENCES
Abernethy, M. A., Lillis, A. M., Brownell, P., & Carter, P. (2001). Product diversity
and costing system design choice: field study evidence. Management Accounting
Research , 12, 261–279.
Arnaboldi, M., & Lapsley, I. (2004). Modern Costing Innovations and Legitimation:
A Health Care Study. ABACUS , 40 (1), 1-20.
Bjørnenak, T. (2000). Understanding cost differences in the public sector—a cost
drivers approach. Management Accounting Research , 11, 193–211.
Brierley, J. A. (2008). Toward an Understanding of the Sophistication of Product
Costing Systems. Journal of Management Accounting Research , 20 (Special Issue),
61-78.
Champion, M. (2011, July 5). Introduction to WPBTS. (J. Davids, Interviewer)
Chenhall, R. H., & Langfield-Smith, K. (1998). Adoption and benefits of
management. Management Accounting Research , March, 1–19.
Cooper, R. (1988). The Rise of Activity-Based Costing-Part 1: What is an Activity-
Based Cost System? Journal of Cost Management , Summer, 45-54.
Davidson, J., & Dewsnup, S. (2009). Variable Cost and Incremental Revenue
Estimation in the Blood Industry: An Empirical Study of Lane Memorial Blood Bank.
University of Oregon Economics Honours Thesis .
Homburg, C. (2001). A note on optimal cost driver selection in ABC. Management
Accounting Research , 12, 197–205.
Horngren, C. T., Datar, S. M., Foster, G., Rajan, M., & Ittner, C. (2009). Cost
Accounting: A Managerial Emphasis (13th ed.). New Jersey: Pearson Education, Inc.
Innes, J., & Mitchell, F. (1995). A survey of activity-based costing in the UK’s
largest companies. Management Accounting Research , 6, 137–153.

Copyright UCT
DRIVERS OF BLOOD DONATION COLLECTION COSTS 49
Jacobs, D. A., Silan, M. N., & Clemson, B. A. (1996). An Analysis of Alternative
Locations and Service Areas of American Red Cross Blood Facilities. Interfaces , 26
(3), 40-50.
Kaplan, R. S. (1988). One Cost System Isn't Enough. Harvard Business Review , 61-
66.
Riley, D. (1987). Competitive Cost Based Investment Strategies for Industrial
Companies. In Manufacturing Issues. New York: Booz, Allen, and Hamilton.
Robson, C. (2002). Real World Research (2nd ed.). Oxford: Blackwell.
Saunders, M., Lewis, P., & Thornhill, A. (2009). Research Methods for Business
Students (5th ed.). Harlow: Prentice Hall.
Scherer, F. M. (1980). Industrial Market Structure and Economic Performance (2nd
ed.). New York: Rand McNally.
Schniederjans, M. J., & Garvin, T. (1997). Using the Analytic Hierarchy Process and
multi-objective programming for the selection of cost drivers in activity-based
costing. European Journal of Operational Research , 100, 72-80.
Shank, J. K., & Govindarajan, V. (1993). Strategic Cost Management: The New Tool
for Competitive Advantage. New York: The Free Press.
Tukey, J. W. (1977). Exploratory Data Analysis. Reading, MA: Addison-Wesley.
Western Province Blood Transfusion Service. (2011, April 8). Clinic Report . Cape
Town.
Western Province Blood Transfusion Service. (2010). Annual Report 2009/2010.
Cape Town: Western Province Blood Transfusion Service.
Yin, R. K. (2003). Case Study Research: Design and Method (3rd ed.). London:
Sage.
Zupancic, J. A., Richardson, D. K., O’Brien, B. J., Schmidt, B., & Weinstein, M. C.
(2003). Daily Cost Prediction Model in Neonatal Intensive Care. International
Journal of Technology Assessment in Health Care , 19 (3), 330-338.
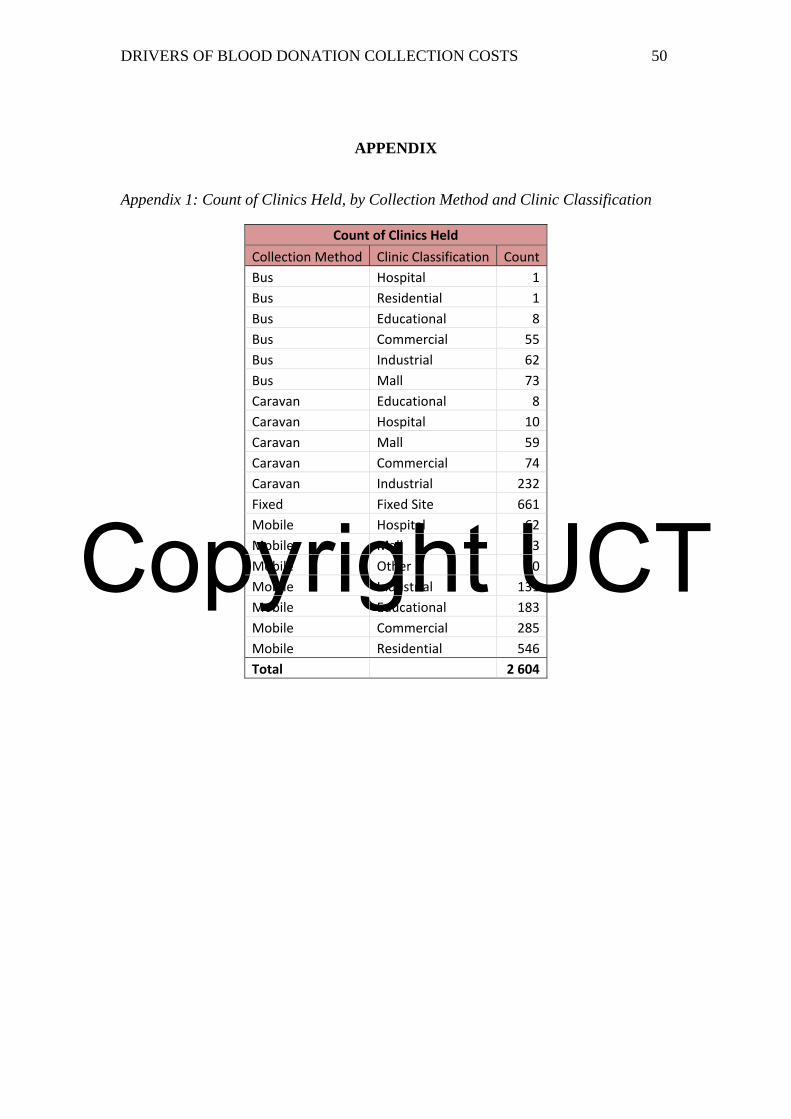
Copyright UCT
DRIVERS OF BLOOD DONATION COLLECTION COSTS 50
APPENDIX
Appendix 1: Count of Clinics Held, by Collection Method and Clinic Classification
Count of Clinics Held
Collection Method Clinic Classification Count
Bus Hospital 1
Bus Residential 1
Bus Educational 8
Bus Commercial 55
Bus Industrial 62
Bus Mall 73
Caravan Educational 8
Caravan Hospital 10
Caravan Mall 59
Caravan Commercial 74
Caravan Industrial 232
Fixed Fixed Site 661
Mobile Hospital 62
Mobile Mall 63
Mobile Other 90
Mobile Industrial 131
Mobile Educational 183
Mobile Commercial 285
Mobile Residential 546
Total 2 604
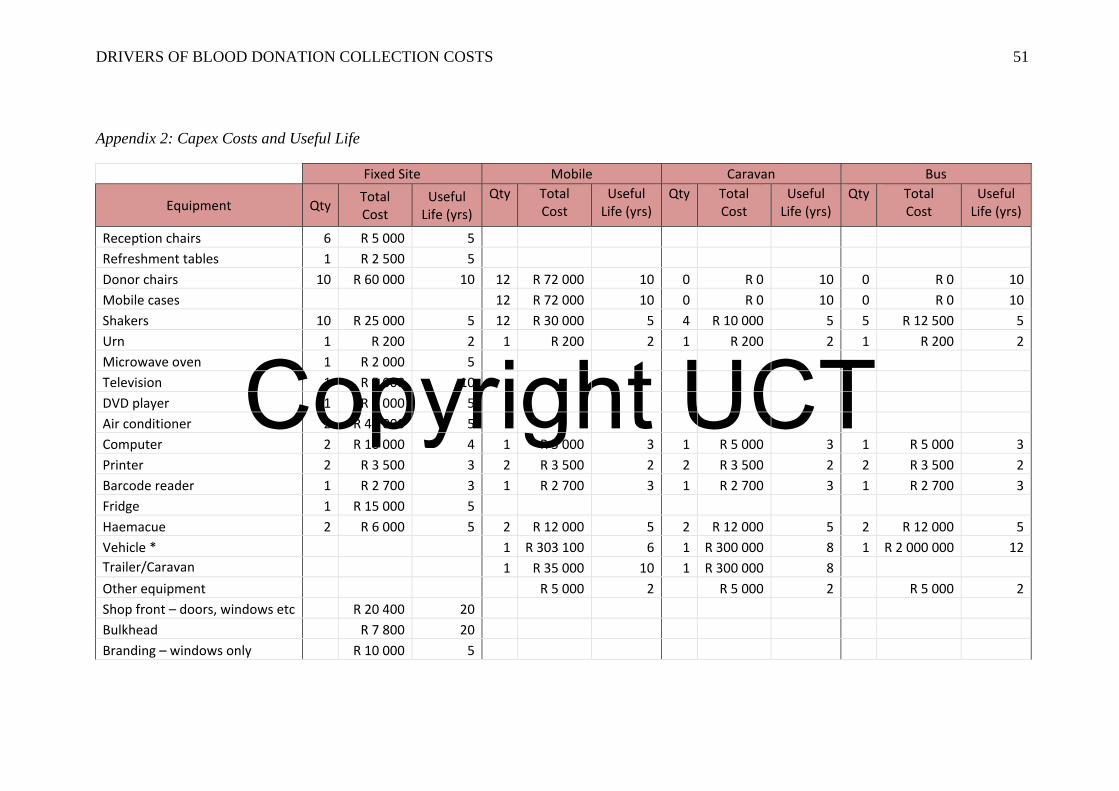
Copyright UCT
DRIVERS OF BLOOD DONATION COLLECTION COSTS 51
Appendix 2: Capex Costs and Useful Life
Fixed Site Mobile Caravan Bus
Equipment QtyTotal Cost
Useful Life (yrs)
Qty Total Cost
Useful Life (yrs)
Qty Total Cost
Useful Life (yrs)
Qty Total Cost
Useful Life (yrs)
Reception chairs 6 R 5 000 5
Refreshment tables 1 R 2 500 5
Donor chairs 10 R 60 000 10 12 R 72 000 10 0 R 0 10 0 R 0 10
Mobile cases 12 R 72 000 10 0 R 0 10 0 R 0 10
Shakers 10 R 25 000 5 12 R 30 000 5 4 R 10 000 5 5 R 12 500 5
Urn 1 R 200 2 1 R 200 2 1 R 200 2 1 R 200 2
Microwave oven 1 R 2 000 5
Television 1 R 5 000 10
DVD player 1 R 2 000 5
Air conditioner 2 R 45 000 5
Computer 2 R 10 000 4 1 R 5 000 3 1 R 5 000 3 1 R 5 000 3
Printer 2 R 3 500 3 2 R 3 500 2 2 R 3 500 2 2 R 3 500 2
Barcode reader 1 R 2 700 3 1 R 2 700 3 1 R 2 700 3 1 R 2 700 3
Fridge 1 R 15 000 5
Haemacue 2 R 6 000 5 2 R 12 000 5 2 R 12 000 5 2 R 12 000 5
Vehicle * 1 R 303 100 6 1 R 300 000 8 1 R 2 000 000 12 Trailer/Caravan 1 R 35 000 10 1 R 300 000 8
Other equipment R 5 000 2 R 5 000 2 R 5 000 2
Shop front – doors, windows etc R 20 400 20
Bulkhead R 7 800 20
Branding – windows only R 10 000 5
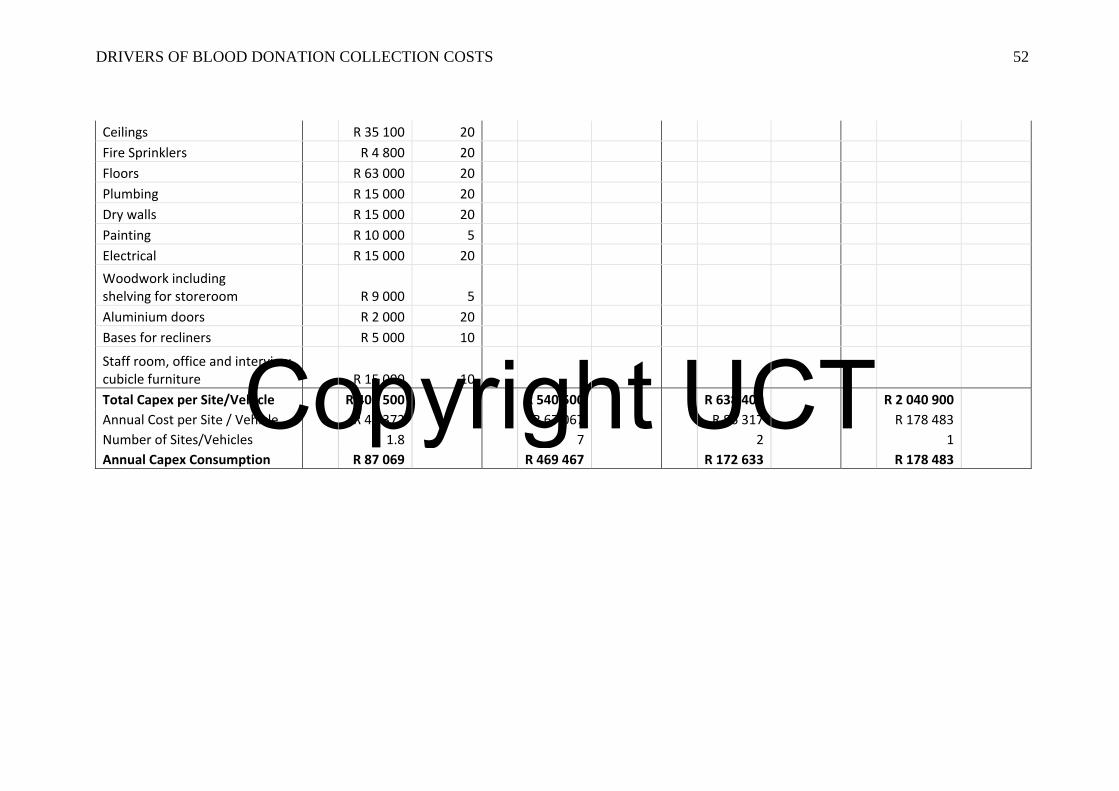
Copyright UCT
DRIVERS OF BLOOD DONATION COLLECTION COSTS 52
Ceilings R 35 100 20
Fire Sprinklers R 4 800 20
Floors R 63 000 20
Plumbing R 15 000 20
Dry walls R 15 000 20
Painting R 10 000 5
Electrical R 15 000 20
Woodwork including shelving for storeroom R 9 000 5
Aluminium doors R 2 000 20
Bases for recliners R 5 000 10
Staff room, office and interview cubicle furniture R 15 000 10
Total Capex per Site/Vehicle R 403 500 R 540 500 R 638 400 R 2 040 900
Annual Cost per Site / Vehicle R 48 372 R 67 067 R 86 317 R 178 483
Number of Sites/Vehicles 1.8 7 2 1
Annual Capex Consumption R 87 069 R 469 467 R 172 633 R 178 483