driving ability index: an instrument for assessing elderly ... · 3 i thank ettore who adores me...
TRANSCRIPT

Ph. D in Land Engineering
Driving Ability Index:
An instrument for assessing elderly people’s performance
ICAR /05
Author: Supervisors:
Claudia Pinna Prof. Dr. Gianfranco Fancello
Prof. Dr. Paolo Fadda
Co – supervisor:
Prof. Dr. Michele Meloni
Ph.D Coordinator:
Prof. Dr. Roberto Deidda
CYCLE XXVII
Final defence academic year 2013-2014

1
To my families of Origin and Destination:
Mamma, Papà, Antonio and Nicola

2
Acknowledgements
It is not easy in a few lines to thank all those who helped in some way to make this thesis
better.
First of all thank you Mom and Dad, I try every day to make them proud, trying to be the
perfect daughter that they deserve. I thank them for being my point of reference, for the values they
have given me. They have always shown a blind trust and been free of uncertainty about what I do,
always encouraging me to keep going my way. I thank them for having borne my character that is
not at all easy, and because they have heartened and encouraged me, especially when I felt down,
always finding the words of comfort that I needed.
I thank my brother Antonio, my angel, that through his smile full of love makes me forget
all my problems and he helps me to see everything from a different point of view, letting me know
what the real priorities are and I thank him especially because he gives meaning to my life.
A special thank you to Nicola, the present that life has given me, because with extreme
patience, he was close to me during these years, and he has always been able to make me smile
even in those moments when I was unbearable. I thank him because he never tried to limit myself
but rather he has always believed in me and he encouraged me in this path, reminding me that I
could do it.
Special thanks to Irma, the sister whom I have chosen, because in these years our friendship
continues to fortify and because I know that I can always turn to her for suggestions and words of
comfort that I need. And I would like to thank her, because it was wonderful to mature together.
I would like to thank the friends of the Saletta: Nensi, Albe and Sco for everything that they
have shared with me, and because as well as being inseparable friends they are a second family for
me, I thank them for the nice evenings spent together, live and with skype .
I thank Andrea that is a colleague and a special friend who has been my companion in
adventure since the time of the "soppalco" and with whom I grew into maturity a lot in of human
and professional terms. I thank him for allowing me to vent even when I was in Newcastle with our
long conversations on Skype.
I thank my Grandmother who always shows me hes pride, even if she just knew that I was
starting the Ph.D. his first response was: "Immoi ti deppis coiai".
I thank my godchildren Daniel and Clara, because they have always been proud of me, and
they have participated in every step of my path and I thank them for their smiles because they have
helped me to overcome many difficult moments.

3
I thank Ettore who adores me unconditionally and who has come here when I needed it most
for me.
I thank my supervisors, Professors Gianfranco Fancello and Paolo Fadda, for including and
accompanying me in a training pathway that began with my thesis and took me up to the
completion of this work, allowing me start my steps in world of Research. I also wish to
communicate my gratitude for giving me the opportunity to realize a learning experience abroad.
I wish to thank Professor Michele Meloni who I had the fortune to know during my PhD,
because he has provided a fundamental contribution to my work and to my professional and human
growth. I thank him for all the precious suggestions and teachings that he has given to me, often
arising in front of a good cup of coffee.
I thank Dr. Amy Guo who was my supervisor during the research phase abroad at the
University of Newcastle, I thank her because this experience was invaluable, and in these three
months together I had the pleasure to know not only a valid researcher but a good friend. I want to
thank Mike and Amy Skye for welcoming me as a family and making me feel at home.
I thank all the components of the group TORG from Newcastle University for the
educational opportunities that I have been given, for the hospitality and for the warm welcome.
I thank all drivers "young at heart" who participated in the research, for showing great
patience and availability during the tests.

4
Ringraziamenti
Non è semplice in poche righe ringraziare tutti coloro che in qualche modo hanno
contribuito a rendere migliore questo lavoro.
Primi tra tutti ringrazio Mamma e Papà, che provo ogni giorno a rendere orgogliosi,
cercando di essere la figlia perfetta che loro meritano. Li ringrazio per essere stati il mio punto di
riferimento, per i valori che mi hanno trasmesso e per aver sempre mostrato per quello che faccio
una fiducia cieca e priva di incertezze, spronandomi sempre ad andare avanti per la mia strada.
Li ringrazio anche per aver sopportato il mio carattere per niente facile e per avermi
rincuorata e incoraggiata soprattutto nei momenti in cui mi sentivo più giù, trovando sempre le
parole di conforto di cui avevo bisogno.
Ringrazio mio fratello Antonio, il mio angelo, che attraverso il suo sorriso colmo d’amore
mi fa dimenticare ogni problema e mi aiuta a vedere tutto sotto un altro punto di vista, facendomi
capire quali sono le vere priorità e lo ringrazio soprattutto perché riesce a dare un significato alla
mia vita.
Un particolare ringraziamento va a Nicola, il regalo che la vita mi ha fatto, perché con
estrema pazienza mi è stato vicino nel corso di questi anni, ed è sempre riuscito a farmi sorridere
anche nei momenti in cui ero insopportabile.
Lo ringrazio perché non ha mai provato a limitarmi ma anzi ha sempre creduto in me e mi
ha incoraggiata in questo percorso, ricordandomi che potevo farcela.
Un ringraziamento particolare va a Irma, la sorella che ho scelto, perché in questi anni la
nostra amicizia continua a fortificarsi e perché so di poter trovare sempre in lei i consigli e le parole
di conforto di cui ho bisogno. E vorrei ringraziarla perché è stato stupendo crescere insieme.
Vorrei ringraziare gli amici della Saletta: Nensi, Albe e Sco per tutto quello che hanno
condiviso con me, e perché oltre che degli amici inseparabili sono per me una seconda famiglia, li
ringrazio per le belle serate passate insieme, dal vivo e su skype.
Ringrazio Andrea che è un collega e un amico speciale che è stato il mio compagno di
avventure già dai tempi del soppalco e col quale sono cresciuta molto dal punto di vista umano e
professionale. Lo ringrazio per avermi permesso di sfogarmi quando ero a Newcastle con le nostre
lunghe conversazioni via skype.

5
Ringrazio mia Nonna che mi dimostra sempre il suo orgoglio, anche se appena ha saputo
che stavo iniziando il dottorato di ricerca la sua prima reazione è stata : “Basta immoi ti deppis
coiai”.
Ringrazio i miei figliocci Daniel e Clara perché sono sempre stati orgogliosi di me e
partecipi in ogni fase del mio percorso e li ringrazio perché col loro sorriso sono riusciti a farmi
superare tanti momenti difficili.
Ringrazio Ettore che mi adora in modo incondizionato e che è arrivato quando ne avevo più
bisogno.
Ringrazio i miei relatori, i Professori Gianfranco Fancello e Paolo Fadda, per avermi inserita
e affiancata in un percorso formativo che è iniziato con la tesi di laurea e mi ha portata fino al
completamento di questo lavoro, facendomi iniziare il mio cammino nel mondo della Ricerca.
Desidero inoltre comunicarli la mia gratitudine per avermi dato la possibilità di realizzare
un’esperienza di studio all’estero.
Desidero ringraziare il Professor Michele Meloni che ho avuto la fortuna di conoscere
durante il mio Dottorato, perché ha apportato un contributo fondamentale al mio lavoro e alla mia
crescita dal punto di vista professionale e umano. Lo ringrazio per tutti i preziosi consigli e
insegnamenti che mi ha saputo dare, spesso scaturiti davanti a una buona tazza di caffè.
Ringrazio la Dr. Amy Guo che è stata il mio supervisore nella fase di ricerca all’estero
nell’Università di Newcastle, la ringrazio perché è stata una esperienza insostituibile lavorare con
lei e in questi tre mesi trascorsi insieme ho avuto il piacere di conoscere non solo una valida
ricercatrice ma una buona amica. Desidero ringraziare Amy Mike e Skye per avermi accolta come
una famiglia ed avermi fatta sentire a casa.
Ringrazio tutti i component del gruppo Torg della Newcastle University per l’opportunità di
formazione che mi è stata concessa, per l’ospitalità e per la calorosa accoglienza.
Ringrazio tutti i conducenti “giovani dentro” che si sono sottoposti ai test, per aver
dimostrato grande pazienza e disponibilità nel corso delle prove.

6
INDEX
Index ......................................................................................................................................... 6
1. Introduction .................................................................................................................... 9
2. Human factors in transportation ................................................................................... 12
3. Background .................................................................................................................. 14
3.1 Aging of the world population .............................................................................. 14
3.2 Mobility related aspects of aging .......................................................................... 17
3.3 Accident risk for older drivers .............................................................................. 18
3.4 Travel habits of older drivers and implications for mobility ................................ 19
3.5 Driving habits and behaviour ................................................................................ 21
3.6 Accidents .............................................................................................................. 21
3.7 Manoeuvres and junctions .................................................................................... 22
3.8 Offences ................................................................................................................ 23
3.9 Road signs ............................................................................................................. 24
3.10 Self-assessment of driving ability ....................................................................... 24
3.11 The cognitive and physical changes caused by aging ......................................... 25
3.11.1 Cognitive abilities ............................................................................................. 25
3.11.1.1. Attention.......................................................................................................... 26
3.11.1.2. Perceptual and visual-spatial skills ............................................................... 27
3.11.1.3. Speed and reaction time ................................................................................. 27
3.11.1.4. Memory ........................................................................................................... 28
3.11.1.5. Mental Status .................................................................................................... 28
3.11.2 Sensory functions ............................................................................................. 29
3.11.3 Physical function and medical conditions ........................................................ 31
3.12 Design strategies to assist older drivers ............................................................... 32
3.13 Licence renewal ................................................................................................... 33
3.14 Driving cessation ................................................................................................. 35
3.14.1. Gender differences in driving cessation .......................................................... 36
3.15 Assessment of fitness to drive ............................................................................. 36
4. Development of a tool to assess driving ability ........................................................... 41
4.1. Work Ability Index ............................................................................................... 41
4.2. Adaptation of the Work Ability Index for calculating Driving Ability Index ..... 43
4.3. Pilot survey ........................................................................................................... 46
5. EXPERIMENT 1: On-road experiments ..................................................................... 54

7
5.1. Research activities in Newcastle upon Tyne ........................................................ 54
5.2. Adaptation of Driving Ability Index to British culture ........................................ 54
5.3. On-road experiments ............................................................................................ 55
5.2.1. Validation of the questionnaire through on-road experiments .......................... 55
5.2.2. Trial Description ................................................................................................ 56
5.2.3. The trial route .................................................................................................... 57
5.2.4. The vehicle used for the tests ............................................................................ 69
5.2.5. The eye tracker .................................................................................................. 70
5.2.6. Operating conditions during tests ...................................................................... 72
5.2.7. Evaluation of driving performance .................................................................... 73
5.2.8. Results of the questionnaire Driving Ability Index: frequency analysis ........... 77
5.2.9. Validation of Driving Ability Index with the Kendall tau test .......................... 97
5.2.10. Influence of the familiarity with the route on driving performance .............. 100
6. EXPERIMENT 2: Driving simulator tests................................................................. 102
6.1. Validation of the questionnaire through driving simulator tests ........................ 102
6.2. Driving simulator ................................................................................................ 102
6.3. Scenario used ...................................................................................................... 104
6.4. Sending the questionnaires ................................................................................. 104
6.5. The sample tested ............................................................................................... 104
6.6. Data obtained through the questionnaire DAI: Frequency Analysis .................. 105
6.7. Calculation of the Driving Ability Index for drivers tested in simulator ........... 108
6.8. Output data of the driving simulator .................................................................. 108
6.9. Comparison of results obtained with questionnaires and in the simulator ......... 110
6.10. Comparison between driving ability on the road and on the simulator ............ 114
7. Data analysis .............................................................................................................. 115
7.1. Variables ............................................................................................................. 115
7.2. Factorial analysis ................................................................................................ 116
7.2.1. Preliminary tests for Factorial analysis ........................................................... 117
7.2.2. Communalities ................................................................................................. 118
7.2.3. Rotation of the factorial axes ........................................................................... 120
7.2.4. Interpretation of the factors ............................................................................. 127
7.2.5. Linear regression ............................................................................................. 134
7.3. Estimation of the relation with a linear regression ............................................. 135
8. Conclusions ................................................................................................................ 139
9. Bibliography............................................................................................................... 141

8
Appendix A Driving Ability Index Questionnaire

9
1. INTRODUCTION
Medical advances are resulting in the increase in life expectancy and the aging of the
population is becoming a general problem. By 2025 it is estimated that over 20% of
Europeans will be 65 or older and the number of over eighty-year olds will rapidly increase
(European Commission, 2014). Older people play an ever more active role in society and
being able to drive is necessary for their mobility needs (Lyman, 2002).
Aging causes the decline of driving related skills, so accident rates are higher for
older drivers. However, being able to use the car motivates older people to maintain an
active life and participate in social activities. When deprived of their driving licence, the
elderly often suffer from isolation and depression so this phenomenon also has social
implications. For these reasons it is necessary to recognize drivers who are potentially risky,
because they no longer have the skills required to drive, from those who are still able to
drive and be independent.
The aim of this study is to develop an easy to manage tool for objectively evaluating
the driving ability of elderly drivers, for identifying the premature signs of any decline in
physical ability and cognitive skills, and for identifying devices best suited to help them to
overcome their deficits and to improve their driving abilities and stay safe behind the wheel
for longer.
The Work Ability Index (WAI) is a tool already known and widely used in
occupational medicine to measure the ability to work and to identify any signs of decline in
work performance. During the PhD research collaborating with occupational physicians
(Cagliari and Milan), we decided to adapt the Work Ability Index for the purpose of
assessing the driving ability of the elderly, proposing the Driving Ability Index (DAI).
The questionnaire in its original form was used to calculate an index that measures
work ability. The contents have been adapted to obtain a score and to categorize ability to
drive into four quality levels: excellent, good, moderate and poor.
In order to adapt the questionnaire a pilot survey was conducted in the city of Cagliari,
involving 54 drivers over the age of 65, with the collaboration of Professor Michele Meloni
and Dr. Luigi Lecca.
Part of the study was conducted in the city of Newcastle upon Tyne in collaboration
with Dr. Amy Weihong Guo. At this stage the questionnaire (Driving Ability Index) was
adapted to British culture and its ability to evaluate and predict driving ability in elderly

10
drivers has been verified. In order to verify the effectiveness of the Driving Ability Index,
road tests on a standard route as proposed by Justiss (2005) were conducted involving 31
drivers and 12 drivers were tested using a driving simulator, so as to compare the
performance obtained in these tests with the results obtained from the questionnaire DAI.
The results obtained with the driving simulator test and in the road tests were
compared with the DAI evaluation, calculated on the basis of the questionnaire responses,
using Kendall’s Tau test. We only found a significant correlation for women drivers, so
using factorial analysis and linear regression techniques the most significant variables have
been identified and a model was estimated to predict driving ability rating on a scale from 0
to 3, which corresponds to a judgment from poor to excellent.
Analyses performed in this study showed that the ability to drive depends on
physical and mental abilities, on driving behaviour and lifestyle. For this reason upon
licence renewal all these elements need to be evaluated and not only one skill as generally
occurs (usually eyesight).
The proposed model explains 70% of the variance in the ability to drive and requires
few input variables to be calculated, so it is easy to apply and may be used for the renewal of
driving licences to identify drivers who may be potentially risky, owing to poor driving
skills.
The model also allows one to identify drivers with moderate driving ability and thus
still able to drive, be it with some difficulty, but who need some kinds of aids. Responses to
item 3 of the questionnaire, that highlights drivers’ medical conditions and physical
impairments, provides indications as to the most suitable in-vehicle aids to help elderly
drivers overcome their deficits and continue to drive safely for longer.
This thesis is divided into eight chapters.
This chapter, the introduction, briefly describes the objective of the research, the
methods applied and the results obtained.
Chapter 2 concerns human factors in transport and the study of the topics aimed at
reducing accidents through the design of human-compatible systems
Chapter 3 describes the background of the study and the results of other studies that
formed the basis of this research. We have addressed the general problems of aging,
diseases typical of old age, driving behaviour of older drivers, driving offences, difficulties

11
when manoeuvring and driving, procedures for licence renewal, gender differences and
techniques for driving ability assessment in the elderly.
In Chapter 4 the adaptation of the work ability index is described and the results of
the pilot survey performed in Cagliari are analysed.
In Chapters 5 and 6 the activities conducted in Newcastle are described. Chapter 5
the road test is described and the results compared with those obtained from the DAI
questionnaire, while Chapter 6 describes the tests conducted with the driving simulator,
comparing these results with the scores obtained in the questionnaire that was distributed
online.
Chapter 7 concerns the factor analysis conducted to identify the latent factors that explain
the ability to drive. By means of multiple linear regression techniques, a model has been
estimated to assess the driving ability of the elderly drivers that ranks driving ability from 0
(poor) to 3 (excellent).
Chapter 8 presents the conclusions, the results of the research and possible future
developments on the basis of the results obtained.

12
2. HUMAN FACTORS IN TRANSPORTATION
Human factors are concerned with the design of systems compatible with the
capabilities, limitations, characteristics and stereotypes of users.
The International Ergonomics Association defines ergonomics or human factors as
follows: “Ergonomics (or human factors) is the scientific discipline concerned with the
understanding of interactions among humans and other elements of a system, and the
profession that applies theory, principles, data and methods to design in order to optimize
human well-being and overall system performance” (International Ergonomics Association,
2014).
The aim of human factor studies is to bring to light those design characteristics and
layout that reduce the risk of accidents caused by a deterioration in driving performance. In
the beginning human characteristics related to physiological aspects (health, attitude) were
addressed, then the analysis was extended to the methods of interaction of man with the
specific working environments (psychophysical aspects and decision - means - environment
- organization).
In active safety, many factors are considered which directly affect the level of safety
of passengers. Other factors affect driver’s performance, so indirectly, as a consequence
they also affect the safety.
One of the factors that most affects safety and also comfort of a transport system is
the compatibility of the required tasks with the characteristics, capabilities and limitations of
drivers. For this reason the human element must be considered a component of the system,
and is a critical feature of all aspects of the design. Thus the human factor must be integrated
into the design of transport systems, as it provides those criteria, parameters and scales of
evaluation of the effects of different design solutions.
Driver performance is the primary cause of accidents, in fact over 80% of accidents
in private and public land transport are caused by human error.
Research on human factors and particularly on active safety, takes into account a
wide range of human reactions that vary according to gender, level of fatigue, culture, social
norms and age, to enable the design of human-compatible systems.
Physical ability and cognitive skills deteriorate with age and mobility needs change.
The aging world population poses real challenges and the design of systems compatible with
the characteristics of elderly drivers and the study of the physical and cognitive abilities
required to drive safely have become important goals in human factor research.

13
Drivers have to manage multiple stimuli from the environment and this input should
be designed so as to be rapidly received and generate the appropriate driver reaction in a
time frame compatible with their physical characteristics.
As these skills decline with age, it is important to identify what characteristics are
required for driving, in order to identify those drivers who are able to drive safely and those
who need to be assisted by means of appropriate in-vehicle devices that can compensate for
their deficits, enabling them to continue to use their vehicle in safe conditions.

14
3. BACKGROUND
3.1 Aging of the world population
The aging of the world’s population is the main demographic trend observed over the
last century. This phenomenon is due to the combined effect of the reduction in fertility and
in birth rates and the increase in life expectancy.
The 2013 World Population Ageing report, produced by the Department of
Economic and Social Affairs Population Division of the United Nations, shows that total
fertility rate has halved over the last 50 years, decreasing from 5.0 children per woman in
1950-1955 to 2.5 children per woman in 2010-2015 (Figure 1). This trend is expected to
continue over the next years to reach an estimated rate of 2.2 children per woman for the
five years 2045-2050.
In most developed countries the reduction in the fertility rate in the last half of the
1900s was greater, dropping from a rate of 2.8 children per woman in 1950-1955 to 1.6 in
2000-2005. However, over the next five years the rate increased slightly to 1.7 children per
woman in 2005-2010. The UN predict a further slight increase for the five years from 2045
to 2050 with a rate of 1.9 children per woman.
This value is still below the substitution level, which is 2.1 children per woman.
The phenomenon has a different trend in the less developed regions, where the fertility rate
was 6.1 children per woman in 1950-1955 to decrease significantly between 1970 and 1990,
to reach a rate of 2.7 in the period 2005-2010. Although the fertility rate in less developed
regions is still well above that of the more developed countries, in the period 2045-2050 it is
expected to decrease further (2.3 children per woman).

15
Figure 1 – Total fertility rate 1950 -2050 – Source : World Population Ageing 2013 report UN.
Birth rate is closely related with fertility rate and population size.
During the twentieth century the number of births in the world increased decade by decade.
The number of births is about 140 million per year and is expected to decline before the end
of the century, reaching 130 million births per year (Figure 2). The combined effect of the
reduction in the number of births and the increase in life expectancy is significantly
changing the shape of the demographic pyramid with a general aging of the population.
The number of births in most developed nations remained stable after declining during most
of the second half of the twentieth century and it is this phenomenon that is at the root of
the aging population in these areas of the world.

16
Figure 2 Annual number of births 1959-2100 – Source : World Population Ageing 2013 report UN.
The increase in average life expectancy is one of the greatest human achievements,
and can be attributed to medical advances and improvement in the quality of life.
Human lifespan will continue to grow worldwide in the coming decades. In 1950 it was 65
years in the more developed countries compared to only 42 years in the less developed
regions. In the period 2010-2015, it is estimated that life expectancy will reach 78 years in
the more developed countries and 68 in the less developed ones, increasing in the period
2045-2050 to 83 and 75 years respectively.
In 2010-2015, globally, people aged 60 will live for another 20 years and for the period
2045-2050 on average for another two years. These data are shown in the following chart
drawn up by the UN (Department of Economic and Social Affairs Population Division UN,
2013).

17
Figure 3 Life expectancy at birth 1950 -2050 – Source : World Population Ageing 2013 report UN.
Figure 4 Life expectancy at age 60 2010-2015, 2020-2015 and 2045-2050 – Source : World Population Ageing 2013
report UN.
3.2 Mobility related aspects of aging
As shown in the previous paragraph individuals older than 65 years are the fastest
growing segment of the population and also tend to stop driving increasingly later. The
opportunity to drive is still one way for seniors to maintain their independence and
participate in social life, especially in rural or remote areas, or where public transport does
not meet their mobility needs. Being able to drive greatly affects the social life of the elderly

18
who are at risk of isolation and depression (Fonda, Wallace, Herzog, 2001). Thus this
problem also has social effects.
Driving requires the ability to understand relevant information and ignore irrelevant
information within complex visual scenes: the speed with which visual information is
processed may be an important factor for successfully managing dangerous situations.
The physical conditions and medical, cognitive and sensory functions of a driver are
factors affecting the ability to drive and therefore influence the likelihood of an accident.
This occurs particularly in old age, because aging causes a decline in many cognitive skills
that are important for executing complex tasks such as driving. With increasing age there is
a greater propensity for disability due to the deterioration of physical and cognitive abilities
and the onset of diseases typical of old age. 54.5% of older people have at least one disease
and 74% of people older than 85 years, have at least one disease or disability (Ficke, 2003).
The cognitive and physical changes of an individual caused by aging can impair the ability
to drive and consequently increase the risk of an accident.
3.3 Accident risk for older drivers
Accident rates are higher for older drivers and increase exponentially for drivers over
the age of 75 (Guerrier, Manivannan, Nair, 1999). Incidents involving older people are
characterized by more serious injuries due to deterioration of their physical condition and
the greater rigidity of their skeletal structure. A recent study estimated that for drivers aged
between 70 and 74 years the likelihood of being killed in an accident is twice that of drivers
aged between 30 and 59, while for 80 year olds the risk is five times greater (Li, Braver,
Chen, 2003). These higher mortality rates are due to the elderly’s physical fragility and
reduced recovery, that make a simple incident, a potential fatal accident.
The fragility of a group of drivers is shown by the difference in their mortality rates
and injury rate. As can be seen from the diagram below, drivers over 75 years old have the
second highest mortality rates; only the youngest group (aged 18 and 19) have a higher
mortality rate. The figure on the left shows the well-known U-shaped pattern of mortality
rates: for young people it is high, decreasing to the minimum value for 40-60 year olds, to
then peak for drivers of over 75. Changes in rates of injury are shown in the figure on the
right; the younger age groups exhibit a similar trend to the previous figure, but this changes
for older drivers. The accident rate is lower than the mortality rate as their physical fragility
means they are more likely to be killed if involved in an accident.

19
Figure 5 Number of driver fatalities and non-fatal injuries– Source : SWOV/ Institute for Road Safety Research
Elderly drivers are often involved in specific types of accidents, in situations such as
junctions, lane changes and moving out of a parking space. This had led to several
prejudices about older drivers.
Not all authors consider the elderly high-risk drivers as their accident rates are
influenced by the reduced mileage driven. Generally, drivers who make longer trips have
lower accident rates per mile than drivers with low mileage. Elderly drivers usually travel
short distances so their accident risk is overestimated (Langford, 2006). It is important to
note that not all elderly drivers are dangerous: on the contrary, they behave very cautiously
and compensate for their physical disadvantages with their experience. This has highlighted
the need to identify which cognitive, sensory, physical and motor factors are enablers for
safe driving, in order to identify older people who are potentially at risk.
3.4 Travel habits of older drivers and implications for mobility
With aging, the way people use the car changes as do their individual mobility needs.
In 2006, young people aged 18 to 29 years numbered 4.025.980 in Italy, due to the aging
population, and by 2016 this age group will have decreased by around 11% (ISTAT). The
oldest group, aged between 55 and 80, will increase by 9%. As a result, motorists are getting
older and as they age they change their lifestyle, using their cars less. In some cases the
elderly find they have to replace their current car with a vehicle more suited to their needs
(CENSIS, 2007).
In Italy, for all age groups, the private car is the means of transport used for almost
all trips (89.1%). Younger drivers use the car most, while with age car use decreases, the
elderly travelling more frequently by urban public transport and walking more (CENSIS,
2007). The over 65 year-olds tend to use public transport even more but to walk less, due to
impaired physical abilities, but in any case more so than the younger age group. However, in

20
the future, elderly drivers needs will be similar to those of 45-65 year olds, due to longer
working lives making the lifestyle of a 75 year old like that of a current 65-year old. The
new demographic changes will transform private mobility. In old age, the approach to
mobility becomes increasingly intermodal, though with aging the inconvenience associated
with the use of public transport increases.
As emerges from the ACI-CENSIS report (2007), the choice to use public transport
is decidedly limited. For older users the reasons are attributable to the lack of comfort of
public transport vehicles (45.3%), the lack of connections that accounts for 38% of
inconvenience and the excessive distance to the bus stop from home is a problem for 14.7%
of users.
Table 1 Ttransportation mode for different age groups in Italy – Source: Aci Censis 2007
Transportation mode
18-29 years old
30-44 years old
45-64 years old
Over 65 years old
Total
Bus/train/metro in urban area 19.7 16.2 20.4 22.40 18.9 Bus/train in suburban area 13.7 9.0 13.4 13.50 12.0 Car 86.3 90.3 87.7 80.4 86.5 Motorbike/scooter 37.8 20.3 6.6 1.00 17.7 Bike 18.5 16.9 18.0 10.4 17.8 On foot 16.5 26.2 33.1 20.3 27.3
The reduction of car use by the elderly is high. As can be seen from the following
table (Report ACI-CENSIS, 2007), on average, in 2006, the car was used 5.0 days weekly,
compared with 5.1 in the previous year. The number of days of use of the car during the
week decreases with age. Drivers aged between 45 and 65 years use the car 4.9 days a week,
while over 64 year-olds drive 4.6 days a week, younger drivers 5.3 days a week.
Table 2 Driving days a week for different age groups in Italy – Source: Aci Censis 2007
Average Age Total
18-29 years 30-44 years 45-64 years over 65 years
Driving days a week 5.3 4.7 4.9 4,6 5.0
In recent years, 23% of Italians use the car less due to the cost of fuel. In the over 65
age group, the rising cost of fuel resulted in a reduction in car use for 27, 5% of
questionnaire respondents. The modal choices of the elderly depend on a growing
environmental awareness and in particular on the need to contain the costs of mobility,
because in the transition to retirement, disposable income is reduced.

21
3.5 Driving habits and behaviour
Compared to younger drivers, older drivers use the car less and travel on average at
lower speeds. From the analysis of accidents and driving behaviour, it appears that older
drivers are more likely to change their driving habits, in order to avoid particularly difficult
situations such as rush hour, night driving or poor road condition, especially the over 75
year-olds.
The elder are aware of their limitations in driving, and are thus prudent and rarely
they commit traffic offences.
To facilitate managing the complex situations that occur when driving, the elderly
reduce their driving speed. When this is not possible, they may be forced to perform
manoeuvres under pressure within time periods that are not compatible with their abilities.
The main changes observed in aging are:
• Reduction in mileage;
• Change of lifestyle and reduction of the use of private vehicles;.
• Decrease of the symbolic value attributed to the car;
• Increased difficulty driving;
• Reduction of driving pleasure (72.2%).
Moreover, they take a lot longer than young drivers to cross junctions (Fancello, 2013).
Changes in the use of the car are also influenced by gender. All aspects analysed appear
much more pronounced for women than for men (CENSIS, 2007).
3.6 Accidents
Several surveys have shown that accidents involving older drivers happen mostly at
junctions. These create particularly difficult situations for elderly drivers, as a large number
of stimuli are involved, obliging them to perform a variety of tasks (controlling the flow of
vehicles and pedestrians, assessing the maneuvering areas etc.). When these actions are
concentrated into a short space of time an overload may occur, resulting in the decline of
mental and physical abilities and in a greater risk of error.
Accidents caused by elderly drivers often occur in the early hours of the morning or late at
night, owing to reduced visibility. However they are rarely involved in accidents caused by
speeding, risky overtaking or driving while intoxicated or generally due to dangerous
behaviour (EU Road Safety, 2011).

22
3.7 Manoeuvres and junctions
Older drivers often find some traffic situations remarkably complex, particularly left turns,
which entail yielding to oncoming traffic, signalized junctions and those regulated by stop
signs (Blomqvist, 2004), merging on a ramp and changing lanes. They also encounter
considerable difficulties driving at night.
To merge from a ramp, drivers need to accelerate in order to adjust their speed to the traffic
flow and find a sufficient gap to enter between vehicles. These tasks require the ability to
estimate the speed of approaching vehicles which is reduced for drivers who have problems
with their vision.
The same abilities are required for left turns where the driver has to yield to oncoming
traffic. Often in this situation elderly drivers, readily cross the junction without giving
priority to vehicles coming from the opposite direction, because they feel they are at risk
waiting in the middle of the junction. The largest number of accidents involving elderly
drivers happen during this manoeuvre.
Changing lanes requires drivers to quickly assess the speed of approaching vehicles. In this
case the task is more complex than in the previous cases, as the only information is that
provided by the rear view and side mirrors. This manoeuvre is less dangerous because it is
optional, and often elderly drivers prefer to avoid changing lanes remaining where they are.
These results emerged in a study (Fancello, 2008) in which the behaviour of older drivers in
Kentucky (USA) and in Sardinia (Italy) has been compared with the aim of bringing to light
any similarities or differences between Italian and American drivers and the motivations that
drove them. These differences could be attributed to driving habits as well as to different
infrastructure, vehicle models and traffic regulations in the two countries. The data were
collected through 235 interviews. Drivers were interviewed about their health conditions and
driving behaviour in specific manoeuvres, such as merging from a ramp, changing lanes,
turning left and driving at night.
The study also showed that older drivers often change their route to the same destination to
avoid complex or potentially hazardous situations.
In a study conducted in 2002 accident data in Kentucky, from 1995 to 1999 were analysed
in order to assess the most difficult manoeuvres and those that are likely to cause accidents.
The database was analysed using logistic regression techniques and the results indicated that
older drivers are more likely than young people to be involved in an accident during specific
maneuvers such as turning left, turning across traffic and changing lanes on high-speed

23
roads. Older men are less dangerous than women and the presence of a passenger in the
vehicle with elderly drivers helps to create a safer driving environment (Chandraratna et al.,
2002).
Another study conducted in 2012, examined the difficulties perceived by elderly drivers
negotiating a roundabout, using eye-tracking techniques. It was found that older drivers
encounter major difficulties at roundabouts due to the large number of stimuli from the
environment, obliging them to select and evaluate their importance. If too many stimuli are
involved this can create an overload. These drivers probably do not fully understand
roundabout rules and look out for cars coming from the right rather than those from the left,
as they do at normal junctions (Pinna, 2011; Fancello et al., 2012).
3.8 Offences
Young people commit far more traffic offences than other road users, especially older
drivers who are unlikely to violate traffic rules (Blomqvist, 2004) and to drive under the
influence of alcohol or drugs. As people become older they tend to obey traffic rules and
regulations more. Table 3 shows the offences committed by ACI members in 2005, divided
by age group. As can be observed older drivers have a more conservative approach than
young people and commit the fewest violations. In particular no one over 65 was found
driving under the influence of alcohol or on the hard shoulder.
Table 3 Offences committed in 2005 by age group (sample ACI, 2006)- Source: ACI CENSIS Report 2007
Offence 18-34
years
old
35-44
years
old
45-54
years
old
55-64
years
old
Over 65
years old
Total
Speeding 40.6 31.7 22.2 30.6 13.2 24.2
Parking in a prohibited space 34.1 36.0 32.0 20.5 17.0 23.6
Seat belt offences 36.7 28.8 22.4 11.6 12.4 16.8
Using a hand-held mobile phone
while driving
23.1 17.9 12.5 10.4 8.9 15.7
Parking alongside another vehicle
or on the pavement
22.1 15.0 13.5 17.8 11.6 12.8
Traffic light offences 19.3 12.4 0.8 9.0 3.5 8.5
Not using indicator 15.7 10.7 9.8 6.5 3.5 8.0

24
U turn 22.9 15.5 3.9 7.7 1.6 7.6
Failure to give way 14.7 14.7 9.8 1.4 5.4 5.9
Overtaking on the right 10.1 9.5 2.9 1.4 3.5 4.7
Driving in pedestrian area 5.5 4.3 1.9 1.5 0.7 2.0
Drink driving 7.3 1.7 2.0 1.3 0.0 1.4
Going the wrong way 1.8 2.6 2.0 1.5 0.7 1.1
Driving on hard shoulder 1.8 1.7 1.0 1.3 0.0 0.8
3.9 Road signs
A 1994 study found that elderly drivers take 34% more time to identify a visual stimulus
than middle aged drivers and 70% more than young drivers (Deward, 1994). This forces
them to slow down to perceive signals that can provide useful information.
55.4% of drivers interviewed in a study in 2006, claimed they had no problems reading road
signs. Note that 19.2% of the respondents encountered difficulties in the perception of
variable message signs and 16.6 % perceiving road marks.
The same sample was asked in what way the perception of traffic signs could be
facilitated. 47.9% of respondents stated it was sufficient to increase the size of the signs
while male drivers believed that larger and better lit signs could improve perception.
Even the reading time required for the perception of variable message signs is
strongly affected by age. Kim (2009) estimated the time needed to perceive messages
according to vehicle speed and driver age.
In 2014, during laboratory tests, drivers were shown a variety of driving scenarios in which
variable message signs appeared. The results indicated that older drivers have longer
reading times than young drivers and this difficulty increases with speed (Fancello, 2014).
3.10 Self-assessment of driving ability
In order to evaluate whether older drivers properly assess their own driving
performance and to determine whether this ability is affected by their cognitive ability, in
2005 tests were conducted on 152 over 65 year-olds. Drivers were first asked to self-
evaluate their driving performance compared to their peers. They then took a cognitive
MMSE test (Mini-Mental State Exam) and a driving simulator test.

25
65% of drivers tested believed they drove better than their peers, while 31.9% judged
themselves to be as capable as their peers. The results showed that 50.0% of those who
thought they drove "a little better" than the others and 52.9% of those who thought they
drove "much better" had a dangerous driving performance.
Drivers who think they drive at least a little 'better than their peers were four times
more dangerous than those who thought they were similar to or worse than other drivers.
There was no significant difference in MMSE between groups with different self-evaluation
(p = 0.76), cognitive ability is not related with the ability to self-assess driving performance
(Freud, 2005).
3.11 The cognitive and physical changes caused by aging
The abilities required for driving are cognitive, sensory and physical and they are
prone to physiological decline due to age (Anstey et al., 2005).
Psycho-gerontology has demonstrated that some skills strengthen with aging. The
intellect can continue to improve in old age, becoming slower but more reflective. Despite it
occurs compensation skills, people's senses change, but with adequate training that takes
into account these characteristics, the capabilities can be maintained.
.
3.11.1 Cognitive abilities
Cognitive abilities include attention, memory, perceptive abilities, reaction speed,
ability to plan and schedule, efficiency and intellectual concentration. All these skills are
required for driving, a complex cognitive task.
In a study conducted in 2011 a multi-factor model was developed to explain the role
played by cognitive and visual skills, using a set of standard tests for assessing driving
ability. Visual acuity and contrast sensitivity were measured. The widely used field of
vision test (UFOV) was performed to measure the visual field, as well as two other tests:
"Hazard Perception Test" (HPT) and "Hazard Change Detection Task" (HCDT) test for
assessing the ability to perceive risky situations.
This study involved 297 drivers between the ages of 65 and 96. Factorial analysis
indicated that cognitive and visual skills explain 83-95% of the variance in driving ability. It
was also found that the ability to drive decreases with age and this decline is due to the

26
deterioration of cognitive abilities such as management and storage of visual-spatial
information, especially in a short space of time (Anstey, 2011).
3.11.1.1. Attention
Attention is a selection process whereby one stimulus is selected over another, thus
filtering out any information irrelevant to the task performed. Selective attention is strongly
affected by aging. Cherry (1953), who pioneered research into selective attention, tried to
understand why just a few, out of a multitude of environmental stimuli, are selected and
others are ignored.
Divided attention is the ability to pay attention to several things at once, this ability
affect crash involvement (McKnight et al., 1999), such as selective attention (De Raedt et al.
2000; McKnight et al., 1999; Marotolli et al. 1998) concerns the selection of stimuli and
divided attention its distribution.
A study by Hasher and Zacks (1988), showed that aging is associated with the
malfunctioning of the attention processes that control access and temporary storage of
information which is not relevant to the activity carried out.
Many studies have shown that with aging the attention has the same accuracy but
the elderly take longer to process information (Abbate, Luzzati, Vergani, 2007).
For several years, research on older drivers was focused exclusively on assessing
visual acuity, but this needs to be analysed simultaneously with cognitive abilities. A study
conducted in 2003 examined the changes in the visual and attention abilities of drivers due
to aging. For this purpose two questionnaires were developed: the first aimed to identify
drivers with a high likelihood of accidents, through the assessment of functional capacity
and the second aimed to identify appropriate strategies to maintain or restore functional
ability.
One of the most interesting results of this study was that using this approach, older
drivers become aware of their difficulties and gradually accept to reduce car use (Gabaude,
2003).

27
3.11.1.2. Perceptual and visual-spatial skills
Perceptual skills include visual perception, perceptual speed and visual-spatial
abilities. The visual search process is influenced by perceptual strategies and these involve
perceptual grouping and the suppression of distractor elements (Davis, Fujawa, Shikano,
2002).
It is possible to assess visual perception by means of the "Movement perception
test". The results of tests conducted in 2000 showed a high correlation with the ability to
drive and with crash involvement (De Raedt et al., 2000; Marotolli, 1998; Stutts, 1998 ).
Perception speed can be measured by identifying a target within a disturbed field
(McKnight et al., 1999).
Visual-spatial skills can be determined using the '"Hooper organisation visual test"
(Marotolli, 1998), the "missing pattern" (McKnight et al., 1999) and the "paper folding test"
(De Raedt et al., 2000). The latter is the most complex and the one that shows the greatest
correlation with driving performance and crash involvement. During this test, the patient is
asked to imagine a piece of paper that has been folded with holes punched at appropriate
points. He has to imagine how the holes are arranged on unfolding the piece of paper (De
Raedt et al., 2000).
3.11.1.3. Speed and reaction time
Processing speed and reaction time are characteristics necessary to successfully
negotiate risky situations that may occur during driving. It is important to choose the right
procedure, but crucial that making the decision and the reaction occur with a sufficiently
short space of time. The elderly react more slowly than young people and in a dangerous
situation this can lead to misjudgement, resulting in response errors. However, older drivers
often compensate for this deficit with driving experience.
The changes due to aging need to be acknowledged and addressed, and appropriate
action taken that considers the needs of older drivers.
Reaction time can be evaluated by means of the "number tracking test" adopted by
Marottoli in 1998.
Processing time plays an important role and indeed speed is a major risk factor
(Skyving, Berg, Laflamme, 2009; Odenheimer et al.1994). In order to manage the complex
situations that occur when driving, the elderly tend drive at slower speeds. When this is not

28
possible, they can be forced to perform maneuvers under pressure, in times that are not
compatible with their capabilities.
The reaction time is the time interval that elapses between the time the brain
perceives a stimulus and the moment the driver takes action. Several tests have been devised
for estimating reaction time such as "Respond to square" and "Respond to brake lights" used
by Mc Knight & Mc Knight, 1999 who demonstrated the strong correlation between
reaction time and accident risk
3.11.1.4. Memory
Memory is the mental function that captures, encodes, stores and retrieves
information acquired during an experience. This is an essential skill in driving (Hu et al.,
1998; Odenheimer et al.1994) drivers need to remember how to use their vehicles, the
meaning of road signs and they must also remember their destination and how to get there
(Colsher, 2003).
Odenheimer (1994) applied the “Wechsler Memory Scale” to assess memory. This
test consists of seven subtests that assess: information, orientation, mental control, logical
memory, repetition of numbers, visual reproduction and the ability to link the concepts.
3.11.1.5. Mental Status
Mental status includes the ability to judge and the ability to reason and can indicate
the presence of symptoms of mental disorders.
The MMSE (Mini Mental State Examination) is a test that evaluates intellectual
function and is able to detect the presence of cognitive impairment, it has been applied in
several studies (Odenheimer et al.1994; Margolis et al., 2002) in order to evaluate if mental
status affect crash involvement.
The test consists of thirty questions concerning seven cognitive domains. Orientation
in time and space, the recording of words, attention and calculation skills, recall and
language skills. These functions depend on the awareness of people's own abilities and
coordination skills.
In the studies examined, no correlation was found between the MMSE results and
accident risk for elderly drivers (Margolis et al., 2002) (Marotolli et al., 1998), though a
correlation did exist with driving performance (Odenheimer et al. 1994).

29
Dementia is not a specific disease, but is a general term that indicates the general
decline in mental abilities (Alzheimer’s Association, 2015), which typically occurs in old
age. Dementia can affect mobility and safety of drivers and there are even more drivers with
dementia; for this reason, in a Cochrane Review, in order to evaluate if driving assessment
facilitates continued driving and if reduces accident in people with dementia, 70 abstract and
41 full text papers have been reviewed. The findings of this study show that there is a lack
of assessment methods in the transport literature for drivers with dementia (Martin, 2013),
3.11.2 Sensory functions
The sense organs are physical structures in the body, which allow interaction with
the surrounding environment. These organs are composed of more or less complex
structures, which are specialized in the reception of stimuli from outside or inside the body.
These stimuli are converted into nerve impulses and transmitted to the central nervous
system. The senses involved in driving are sight, hearing and touch.
3.11.2.1. Sight
Sight allows us to perceive light stimuli from the environment. A large part (90%)
of the information required for driving is visually perceived.. Eyesight is one of the senses
most affected by aging (Kline & Scialfa, 1997). Over 65% of older drivers have problems
with their eyesight. Everyone's vision changes with age: a 60 year-old needs eight times
more light than a 20 year-old to be able to see in the dark.
The eyes are more sensitive to glare and older people have difficulty perceiving
movement at the edge of the visual field, due to a reduction in their field of vision (Crassini
et al., 1988). They also find it slower to adjust focus at different distances (Butler et al.,
1999) and, the minimum duration of fixation needed to identify the details of a road sign
(Dewar et al., 1994). increases with age.
Characteristics that can affect driving behaviour are eye health, visual acuity, range
of useful field of view, colour discrimination, depth perception and contrast sensitivity. Eby
et al. (1998) found that with age a variety of changes to the visual system take place, such as
anatomical changes of the eye that alter visual abilities and reduce the amount of light
reaching the retina. Eye movements are affected by these physiological changes, resulting in
the deterioration of distance and motion perception (Eby, 1998).

30
In 2007, a series of tests was developed for assessing the general health of elderly
drivers, including the "Pelli-Robson Test", which measures contrast sensitivity and the
"Snellen "E" Test" which measures visual acuity (Eby, 2007). It was observed that static
visual acuity, which is necessary to perceive details, decreases with age. Aging also causes
others changes in the eye such as the reduction of muscle tone, which affects focusing near
objects. The sight improves with lighting (Holland, 2001), thus adjustment of road lighting
conditions could facilitate visual perception.
Several researchers have shown that visual acuity is not correlated with accidents in
older drivers (Holland, 2001; Wood, 2002). The reduction in contrast sensitivity may cause
difficulty in the perception of signs (Ball, 1993). Dynamic visual acuity, is the ability to
observe moving objects, and this too decreases with age (Ball & Sekuler, 1986; Burg, 1967).
Some eye diseases are typical of old age such as glaucoma and cataracts. Glaucoma
is a disease that affects the optic nerve and can eventually lead to blindness. In the eye
affected by glaucoma, the outflow of aqueous fluid is impeded, so the liquid accumulates
increasing the intraocular pressure, compressing the optic nerve, Damage to the nerve fibres
results in a progressive alteration of the visual field, which gradually shrinks until it
disappears completely. When the optic nerve fibres are damaged, blind spots (scotomas)
develop in the peripheral part of the visual field impairing vision.
Cataract is the clouding of the crystalline lens and leads to a progressive blurring of
vision. The lens is necessary to focus images on the retina. The most common symptoms
are blurred vision, halos and sensitivity to light and glare (such as headlights of an
oncoming car). The opacity of the crystalline lens may increase the risk of glare; combined
with poor road conditions this may make it difficult for older drivers to perceive road
markings (Holland, 2001). Glare problems in the elderly are associated with poor street
lighting, to the conditions of the road surface which can be minimized by proper road design
(Staplin, Lococo and Byington, 1998).
A study by Owsley et al. (2001) showed that for the elderly suffering with cataracts,
surgery has a positive impact on driving performance.
3.11.2.2. Hearing
The human auditory system allows us to perceive and localize sounds. A sound is a
combination of waves released into the air from a source. The ear receives and translates the
sounds into electrical impulses that are transmitted via the auditory nerve to the brain, where
they are analysed and interpreted. Hearing impairment affects driving performance and the

31
risk of having an accident to a lesser extent than visual problems (Sims et al. 2000, 1998;
Ivers et al. 1999).
For the purpose of analysing driving behaviour in drivers affected by hearing loss, 48
drivers were tested in driving situations with varying degrees of complexity. This study
showed that hearing problems affect driving behaviour only in complex situations
(Thorslund et al., 2013).
3.11.3 Physical function and medical conditions
The physical condition of a driver affects his aptitude to driving (Anstey et al. 2005).
When a driver receives a stimulus, he must choose the proper response and perform the
correct procedure in time, so as to achieve the intended effect.
With aging bone density decreases progressively in both sexes, but more quickly in
women. This process causes an increase in bone fragility and thus the increased risk of
fractures and may also be accompanied by diseases that impair the motor skills required to
drive. Physical factors that can affect driving performance are: functional impairment, falls,
orthostatic hypotension (Margolis et al., 2002), heart disease, arthritis (McGwin et al.,
2000), grip strength (Sims et al.; 2000; 1998), rotation of the neck, shoulder rotation, trunk
rotation, finger rigidity (Marotolli, 1998).
McGwin et al. conducted a study in 2000 that showed the correlation between
accident risk and heart disease and strokes in women and also found arthritis to be a risk
element.
In the studies examined, the most significant risk factors are: orthostatic hypotension (HR =
1.10 to 12.5 mm Hg), falls that occurred in the previous year (HR = 1.5) and the reaction
time of the foot (HR = 1.10 to 0.06 seconds) (Margolis et al., 2002).
Marottoli et al. in 1998, found that the reduced rotation of the neck doubles the risk
of an accident. This impairment causes difficulties for drivers at junctions, as the visual
stimuli required to satisfactorily negotiate the situation are located at the extreme periphery
of the visual field.
Research has also shown that no significant correlation exists between accident risk
and physical factors such as invalidity, trunk or shoulder rotation and grip strength.
Drivers who have physical impairments are more aware of their limitations than
those with cognitive deficits and are often more cautious or stop driving voluntarily.

32
In addition, the physical frailty of older drivers increases their likelihood of suffering
physical damage compared to younger drivers (Evans, 1991; Massie & Campbell, 1993).
For this reason, these drivers are over-represented in fatal and serious accidents (Hauer,
1988; Maycock, 1997).
3.12 Design strategies to assist older drivers
3.12.1 Strategies for road design
Empirical knowledge and the results of many studies have led to a number of
principles and measures being formulated that are useful for all road users but particularly
important for older drivers (Blonqvist, 2004). The infrastructure must be designed so as to
ensure visibility of the roadway and evoke correct expectations and driving behaviour from
road users. In addition, all elements of the road and the environment should interact so as to
give a clear and unequivocal message to the driver; the level of the stimuli must be adapted
to the processing ability of the drivers. The road elements should be sized so as to allow
elderly drivers to perform all the required maneuvers within times compatible with their
capabilities. Road signs should be positioned so as to allow drivers to read the information
in time, process it, select an appropriate strategy and execute it.
3.12.2 Adapting vehicles to the functional limitations of the elderly
Vehicles should be properly adapted to the needs of older drivers and the difficulties
they encounter, caused by the limitations described in the previous paragraphs.
Advanced driver assistance systems can compensate for the limitations of older
drivers and help to reduce the risk of their being involved in accidents. These devices have
various functions:
• draw attention when approaching other vehicles or at junctions;
• controlled driving speed;
• controlled braking (ABS and automatic handbrake)
The interface of advanced driver assistance systems must be properly designed in order to
reduce driver distraction.

33
Other systems that generally reduce severity of injuries, such as airbags or seat belts
may increase the severity of injuries in the elderly. To avoid this, the force of action of the
device is limited and is adapted to their musculoskeletal features. Some examples are:
• Dual-stage airbags: to avoid abrupt contact;
• Active headrests: to minimize whiplash injuries to the neck;
• Side airbags: protect the head and chest in the event of a side collision. These are vital in
accidents caused by left turns, one of the most dangerous manoeuvres for elderly drivers.
3.13 Licence renewal
The assessment of fitness to drive may be required for licence renewal or after
serious injuries that can affect driving ability.
In the 27 European countries, different rules are in force for the renewal of driving
licences, and different practices followed for testing driving skills (CONSOL - European
Commission, 2013).
In some countries such as Finland, after the age of 45, drivers undergo a medical
review every five years, covering general health status and vision. The renewal period for 70
year olds depends on the physician. In Italy a medical review for licence renewal is also
required every five years after the age 50 and every three years for drivers aged 70 and over.
In Germany, renewal does not depend on driver’s age. Belgium and France do not require
driving licences to be renewed. In the United Kingdom, a self-declaration of ability to meet
vision standard is required, and any medical condition that could affect driving must be
reported to the Licensing Agency.
In Denmark, a doctor's certificate is required every two years for drivers aged
between 72 and 79, and every year for those aged 80 and over. In the Netherlands over 70
year-olds are required to renew their licences every 5 years but the frequency can be higher
depending on their health status. In the latter case drivers undergo a medical examination
and an eyesight test. So in Europe there are four types of licenses:
“Licenses of unlimited validity - that means they are valid for the whole life. Unlimited
licensed are issued by Austria, Belgium, Bulgaria, France, Germany, and Poland”.
“Licenses that generally do not require a medical examination to be renewed but only an
administrative procedure (Sweden) and a self-report of medical conditions (UK)”.
“Licenses that require a medical check by (at least) a physician to be renewed with the age of
first assessment at 50 (Italy, Portugal), 60 (Czech Republic, Luxembourg), 65 (Greece,

34
Slovakia) or 70 years (Cyprus, Denmark, Finland, Ireland, Malta, The Netherlands,
Slovenia)”.
“ Licenses that have to be renewed every ten years including a medical examination for all
age groups (Romania), with increasing frequency with increasing age starting at 40
(Hungary), 55 (Lithuania), 60 (Latvia), 65 (Estonia, Spain)”.
(CONSOL - European Commission, 2013).
The distribution of countries with the different type of licenses is shown in the
following figure:
Figure 6 Types of driving licences in Europe – Source : (CONSOL - European Commission, 2013).
In one study procedures for licence renewal and accident rates in older drivers were
compared in Sweden and Finland. In Sweden drivers are not required to renew their driving
licence, while in Finland drivers over seventy have to undergo a medical before their licence
can be renewed. Analysing accident rates, did not reveal any substantial difference in the
number of accidents,. However, a higher rate of mortality was found among older road users
in Finland, probably due to the 'increase in the number of elderly pedestrians who have lost
their driving licence (Blomqvist, 1996).
The opportunity to modify driver licence legislation, covering the validity and
renewal periods, was presented in Europe through the EU- directive 2006/126/EC (EU,
2006), but many countries did not revise their policies.
The European Driving Licence Directive entered into force in 2006, is aimed to
influence road safety in two ways: by introducing questions focused on fitness to drive

35
during theory tests to achieve a licence; and by harmonising medical tests and minimum
standards of physical and mental fitness required to obtain and renew licences (European
Transport Safety Council, 2010).
There is no evidence that age-based controls have any safety benefit and result
considerable costs, but these controls should be seen as a necessary investment, also to
promote public health and disease prevention (CONSOL - European Commission, 2013).
3.14 Driving cessation
Many aspects of driving cessation have been studied in recent decades. The results of
studies conducted in Europe and USA are similar. In North America, drivers stop driving at
an older age than their peers in Europe, around 70 years old, and the consequences are more
severe. This behaviour probably reflects the fact that Americans are more automobile-
dependent.
A cross-sectional study involving 1950 elderly drivers in California, investigated the
motivations that caused them to stop driving. Six reasons were identified. The main reasons
were: health problems (41%), age-related changes (19.4%), problems with licence renewal
(12.2%), "other" (12.1%). Some people stated they did not need a driving licence because
someone else could drive for them (10.8%), and for others the problem was the cost of
vehicle maintenance (4.3%). About 65% of these drivers, who had stopped driving in the
past five years were female and had an average age of 85.5 years old.
It also showed that 2% of drivers stopped driving when they were 60, 18% when
they were 70, 63% were 80 years old, and 17% were 90 years old. (Dellinger, et al, 2001).
A study conducted in 1993, involving 309 drivers investigated a number of factors
associated with driving cessation. The most significant medical conditions were: Parkinson's
disease, stroke, arthritis, hip fracture, eye problems, cataracts, glaucoma and depression
(Marottoli et al., 1993).
A study conducted in the United Kingdom, which involved 108 elderly revealed
other reasons in addition to the health conditions (28.6%), such as the loss of confidence in
their own abilities or other psychological reasons (17.9%) (Brayne et al, 2000).

36
3.14.1. Gender differences in driving cessation
A study conducted by Siren in 2005 reported substantial differences in the behaviour
of older men and women. After the age of 65, women tend increasingly less to renew their
driving licence than their peers of the opposite gender. This is because women feel
themselves unsafe and at risk of error, and for this reason they stop driving when they are
still able to drive. Older men, instead can hardly admit that they are unable to perform an
activity they have done for a long time and in which they have many years of experience,
and considering the importance of driving to the male identity, driving cessation occurs only
when their have severe health problems (Siren, 2005).
With the aim of investigating the reasons behind driving cessation in older women,
an e-mail survey was sent to 2970 Finnish women. The driving history of women who had
given up driving or renewed their licence at the age of 70 was compared. The duration and
level of driving activity were strongly associated with the cessation or continuation of
driving. Ex-drivers had an inactive personal history, while drivers had a personal history of
more active driving. Especially women with an active role decided to stop driving for
reasons similar to those known for older men. The results showed that the cessation of
driving is related to driving habits and not to gender (Siren, 2005).
3.15 Assessment of fitness to drive
The fitness to drive of an older person can be assessed through a medical
examination, upon licence renewal or when a particular health problem arises.
The medical examination does not provide an absolute evaluation of driving ability,
because, it is not just one characteristic that reduces the ability to drive, but this will depend
on the simultaneous decline of a series of mental and physical abilities. For this reason, the
test performed for licence renewal should assess both cognitive skills and physical abilities.
In several studies different techniques have been used in order to evaluate fitness to
drive, such as on-road testing (Carr, 2011; Justiss, 2005; Dobbs, 1998), driving simulator
test (Vaux, 2010; Anderson, 2005), and batteries tests for evaluate mental and physical
abilities (Stav, 2008; Eby, 2007).
In a study conducted in 1999 (McKnight, 1999), the correlation between physical
deficits and driving performance in older drivers was evaluated. The survey involved 407

37
drivers over the age of 62, of which two-thirds were indicated by the agencies responsible
for driving licence renewal for their high accident rate and the others were volunteers.
The abilities of the drivers tested were measured by means of a computer-based test
called APT (Automated Psychophysical Test), which evaluates 22 skills including visual,
attentional, perceptual and psychomotor skills.
Driving performance was measured by means of a road test, which included a series
of specific tasks such as crossing junctions, driving along straight roads and roads with
bends, changing lanes, merging into a traffic stream. Manoeuvres difficult for elderly
drivers, such as judging the gap needed for crossing a traffic stream, selecting a direction
from the information present in road signs and maintaining spatial orientation driving
around a land mark were included in the test.
Psychophysical characteristics and driving performance were evaluated separately
and the correlation with accident rate was determined. The test that measures physical and
mental abilities may be more useful in identifying drivers with high accident risk, compared
to road tests. In addition, the test is more accurate and quick to perform and can be used as a
monitoring tool of age-related functional decline.
In 2007 (Eby et al) developed a battery of tests to evaluate the performance of
drivers in old age, in order to identify any deterioration of driving performance and change
in accident risk.
The tests included in the battery have been chosen according to their reliability for
assessing cognitive and physical abilities and because they were inexpensive and quick to
perform, so as to develop a useful and easy to manage tool.
The battery consists of 17 tests that are used to assess the following aspects: contrast
sensitivity, visual acuity, balance, coordination, strength and reduction of body rigidity,
shoulder flexibility, trunk flexibility, functionality of the central visual field, reaction time,
strength in the hands, physical and mental wellbeing, depth perception, visuospatial abilities,
test for hand coordination and manual dexterity, attention, concentration, executive function,
cognitive function, driving behaviour and opinions regarding driving and demographic
information.
To evaluate the battery of tests processed, a sample of 38 drivers over the age of 65
was analysed.
According to the results obtained in the survey, the assessment battery was found to
be efficient for the assessment of physical and mental status and driving behaviour. These

38
tests are also cheap, easily transportable, and easy to use for drivers and for examiners, even
without medical training.
Stav et al. conducted tests (2008) with the aim to identify a series of tests easy to
manage for driving examiners in the evaluation.
The test sample included 123 drivers over the age of 65 possessing a valid driving
licence. The tests were chosen from a range of tests, considered predictive for risk
assessment and administered to participants in the Older Driver Consensus Conference
(2003). The drivers tested underwent clinical tests to assess their cognitive, visual, motor
skills and they also completed a test to assess their knowledge of traffic rules.
The drivers were also tested on a standard 15 mile driving route of. A score from 0 to 3,
called the Global Rating Scale, was assigned to each driver as follows:
0 Driver unsafe (irreversible).
1 Driver unsafe (but reversible);
2 Driver not dangerous but with restrictions and recommendations;
3 Driver not dangerous in any driving situation.
In order to identify the test or battery of clinical tests that are more predictive of driving
ability, a linear regression analysis was conducted and the best model (R = 0.665, R2 =
0.443) was included. The results of the of contrast sensitivity test, Rapid Pace Walk Test
(physical test for the assessment of motor speed, coordination and balance), assessment of
the visual field and the MMSE score (cognitive test) explain 44% of the observed
variability, in the Global Rating Scale, for assessing driving performance and include the
assessment of visual acuity, cognitive and motor skills. It is important to highlight that
driving is a complex task that requires the simultaneous use of different cognitive, visual
and motor functions. For this reason it is necessary to evaluate simultaneously the
efficiency of different functions.
Risser (2008) assessed the validity of two computer-based batteries of tests developed by
the Expert System Traffic, standardized using road tests. Through these tests, the
performance of the drivers was assessed and they were divided into unsafe or safe drivers.
Two versions of the test battery Expert System Traffic (Sommers, 2005) exist:
Standard and Plus. These evaluate some cognitive abilities such as: level of intelligence,
concentration, stress tolerance and response time, the Plus version also measures visual field
and divided attention.

39
The validity of the test battery has been tested with neural network techniques and
the results indicate that the test batteries are predictive of fitness to drive.
In 1993, a driving test was developed for testing the driving performance of people
who had suffered a traumatic brain injury (n = 35) (Thomas Galski, Bruno, and Ehle, 1992).
Drivers are subjected to clinical trials to evaluate the cognitive and executive functions.
Through an index related to performance on the road, fitness to drive is assessed and
through another index familiarity with the vehicle controls was evaluated.
The tests were evaluated using the dichotomous score 1 if the test was passed and 0 if the
test was failed.
The cognitive measures explained 64% of the variability of the score in the test
drive. Also taking into account the assessment of familiarity with the vehicle controls the
variance explained was 93% (T. Galski, Bruno, and Ehle, 1993).
A study conducted by Justiss (2005) was divided into three different experiments, in
order to develop a method for assessing driving performance.
During the experiment 95 drivers were tested between the ages of 65 and 89 years.
Driving tests were carried out on a 15 mile route of a mean duration of 51.9 minutes (SD =
7.4). Along the route the drivers had to perform 91 maneuvers, such as left and right turns,
changing lane, merging into traffic and the ability to maintain position in the lane and speed
control were also evaluated. Their driving ability was judged according to the "Global
Rating Score". Two examiners were present in the vehicle during the test. They judged the
execution of each maneuver, with a score from 0 to 3, assigning 3 if no error was observed,
2 if one or more errors were observed, 1 if one or more errors requiring verbal warning to
change driving behaviour were observed and 0 if one or more errors were observed which
required physical action on the part of the examiner or violations of traffic rules.
Their cognitive abilities were measured by the Mini Mental Status Exam, their visual
field was measured by the UFVO test and their level of independence in daily activities by
Functional Independence Measure (FIM) and OARS tests. Other elements were measured
regarding the health status such as the level of pain with Jette pain Scale, the level of
depression with the Geriatric Depression Scale (GDS) and the number of medications taken.
It was found that the BTW (behind the wheel) is an effective method to measure driving
performance.
The generalizability of the test in different contexts and different geographic locations has
been studied testing 42 drivers. It was found that there was no significant difference between

40
the scores obtained in the two different paths, but the tests must be performed during
daytime and with a southern climate with minimal rain.
In a study conducted in 2012, the influence of cognitive skills in driving ability was
assessed by comparing the results obtained in the MMSE (Mini-Mental State Exam) and the
standard road test. The MMSE is a test consisting of 11 questions, and it is divided into two
parts. This test is used to measure the orientation, the level of attention and memory, and the
ability to execute the instructions provided by the examiner. Driving performance was
evaluated by a well-known standard test for assessing driving performance in the elderly,
proposed by Justiss in 2005. 168 elderly drivers were tested, twenty of them had Parkinson's
disease. The drivers were all aged over 65 years and all had their driving licence. The results
of this study show that the MMSE is not a complete tool for evaluating driving performance
and must therefore not be used as the only test for the assessment of these skills (Crizzle et
al, 2012).
The absence of illness does not mean to be fit to drive (European Transport Safety Council,
2010), and also recent studies in traffic psychology showed that adequate psychophysical
skills and mental functions are not sufficient for safe driving, and they highlight the
importance of motivational and attitudinal factors in the fitness to drive (Peraaho, 2003,
Rothengatter, 1997).
Hierarchical approaches have been used in several studies, when trying to
conceptualise and explain human behaviour in traffic psychology (Janssen, 1979; Ranney,
1994), but this approach can be used to combine the motivational and attitudinal aspects of
driving behaviour with performance or operations in certain traffic situations (Peraaho,
2003).
From hierarchical approaches derive the “Goals for Driver Education – framework”,
proposed by Hatakka in 2002. The study has been acknowledged within the European traffic
research community, because it gives the guidelines when developing traffic educations for
novice drivers (Peraaho, 2003), and it can also be used during trainings for older people, that
can prolong their driving activity (CONSOL - European Commission, 2013).

41
4. DEVELOPMENT OF A TOOL TO ASSESS DRIVING ABILITY
4.1. Work Ability Index
The Work Ability Index is a widely used tool in the field of occupational medicine
and since its introduction has been translated into 24 languages. This indicator was proposed
in 1998 by Ilmarinen and Tuomi, with the aim of assessing the ability to work and predict its
evolution in the short and in the long run. It also aims to highlight the aspects that can affect
the working ability of an individual.
Figure 7 Role of working ability – Source: Illmarinen, 2006
The Work Ability Index is calculated on the basis of replies to a questionnaire
structured into 7 sections, constructed so as to analyse the following aspects:
1. Current working ability compared with the best time of life (based on the answers
the score can be from 0 to 10);

42
2. working ability according to the needs of the task (based on the answers the score
can vary from 2 to 10);
3. Number of current medical diagnoses, this section includes a list of 51 diseases
and health problems, according to the responses score can range from 1 to 7, and it is
calculated as follows:
At least 5 diseases = 1 pt.
4 diseases = 2 pts.
3 diseases = 3 pts.
2 diseases = 4 pts.
1 disease = 5 pts.
0 disease = 7 pts.
4. reduction of work capacity due to illness estimated by the individual (according to
the responses the score can range from 1 to 6);
5. temporary cessation from work because of illness in the last 12 months (according
to the responses the score can range from 1 to 5);
6. personal assessment of work capacity for the next two years (according to the
responses the score can be 1-4 - 7);
7. Conditions / psychological resources (according to the responses the score can
range from 1 to 5).
Each section contains a number of questions and a score is assigned according to the
response. The weighted sum of the scores totalized in each section represents the Work
Ability Index and its value can range from 7 to 49. On the basis of the score it is possible to
identify the level of working ability. The levels of work ability are:
poor work ability: 7-27 points;
moderate work ability: 28-36 points;
good work ability: 37-43 points;
excellent work ability: 44-49 points.
The score levels chosen for identifying the four levels, ie 27, 36 and 43 points
correspond respectively to 15 °, 50 ° and 85 ° percentile of the distribution of the scores.
For each level of work ability there are several objectives to achieve and they are shown in
the following figure.

43
Score Work ability Goals
7-27 Poor Restore work ability
28-36 Moderate Improve work ability
37-43 Good Support work ability
44-49 Excellent Maintain work ability
Figure 8 Objectives for each work ability level
4.2.Adaptation of the Work Ability Index for calculating Driving Ability Index
Driving like work is a task that requires the use of physical and mental resources and
driving is also a job in numerous sectors, so it was decided to adapt the questionnaire Work
Ability Index, in order to understand the changes that occur with aging and that may affect
the ability to drive.
This phase of the research has been conducted with the Medical Section of the Centralabs
(Centre of Competence for Transport in Sardinia), of Cagliari, under the supervision of
Professor Michele Meloni (Occupational Medical) and with the collaboration of Professor
Giovanni Costa, Department of Clinical Sciences and of the Community, of Milan
Polytechnic, who was responsible for the adaptation of the Work Ability Index in Italian.
Like the Work Ability Index (WAI), the Driving Ability Index (DAI) was calculated on the
basis of responses to a series of questions in a questionnaire.
The questionnaire was appropriately redrafted so as to adapt it to the evaluation of the
ability to drive in general and specifically to identify the changes that occur in old age and
the typical diseases of old age.
The questionnaire consists of the following sections:
1. Current driving ability compared with the best time of life;
2. Driving ability in relation to the requests of the task;
3. Number of current diseases diagnosed by a doctor;
4. Reduction in driving ability due to disease estimated by the individual;
5. Temporary driving cessation for diseases in the last 12 months;
6. Personal prediction of ability to drive for the next two years;
7. Driving activity.
Specifically, all the questions relating to working activities have been modified in
order to analyse the same issues in a driving context.

44
The first part of the questionnaire contains questions about demographic information,
general information about the driver and general information about driving. These questions
in the first draft of the Driving Ability Index questionnaire, as in the Work Ability Index are
not considered for calculating the score. This first part investigates aspects such as age,
fundamental to the study, marital status which is very important especially in women, who,
if married, rarely use the car as driver but only as passenger because usually it is the
husband who drives. As mentioned in previous chapters, for this reason women tend less to
renew their driving licence in old age than their peers of the opposite gender. The gender of
the driver is of fundamental importance. As was found in a study conducted by Blonqvist in
2003, women give up driving the car when it is no longer necessary for them to carry out
functions related to the family, such as taking the children to school. Instead men drive to be
independent. In addition, women tend to stop driving car when they are still able to do so
whereas men typically overestimate their abilities, because they often do not want to admit
that they are no longer able to perform an activity they have done for a long time. More
questions are about education and work that influences health. Other questions are about
smoking, consumption of coffee, alcohol and psychoactive substances and level of
satisfaction with the quality of sleep.
Driving information concerns: the type of licence obtained and year, drivers were
also asked whether they had ever let their licence expire and how long had passed before
renewal, the type of vehicle and year of manufacture. This information particularly affects
the level of injuries in accidents involving elderly drivers, because new vehicles are easier to
check for the presence of devices such as power steering, or automatic gears and they are
built according to the criteria required to dissipate the impact energy on the vehicle and not
on people on board.
In this section, information about smoking and cell phone usage while driving are
required, because they could distract the driver.
Section 3 of the Work Ability Index has been changed, in addition to the diseases
listed some diseases that are particularly disabling for driving were included such as
obstructive sleep apnoea syndrome and others that are typical of old age such as cataracts
and glaucoma.
The main change in the questionnaire is the introduction of section 7 concerning the
task of driving and that has been designed to investigate driving habits, such as frequency of
car use, that has a direct correlation with driving performance. As is known from human
factor studies, practice improves the general level of performance and ensures a slower

45
decline of attention during the task. Questions also include the frequency of seat belt use, as
this only became compulsory in 2006 in Italy. Consequently most older drivers have driven
for years without and wearing a seat belt is not a normal and almost automatic habit as it is
for drivers who instead have recently obtained their driving licence. In this section the
frequency of use of the rear view mirror is also evaluated, as it is indicative of a more
careful driving style.
This section includes questions regarding driving behaviour, such as the number of
offences committed, the time elapsed since the offence, any involvement in accidents and
the nature of the damage. Drivers are also asked whether they have
ever fallen asleep at the wheel, an indication of the level of general well-being.
Other questions are related to the use of medications that can impair their ability to
drive.
In the final part of this section questions related to driving difficulty are included,
such as difficulty in perceiving traffic signs or other difficulties when driving at night.
Night time driving becomes difficult for elderly drivers, due to the slower adaptation
of the eye to changes in the brightness level. In this section drivers are asked if they are
stressed by driving or when merging into traffic in low light conditions,
if they have particular difficulty in perceiving road markings or the guard rail, if they need
to reduce their speed in order to perceive signs when driving at night or if they feel that the
road is poorly lit.
Based on the responses to the questionnaire it is possible to calculate the score that
corresponds to a level of driving ability. For each level a different goal must be achieved.
Score Driving ability Goals
7-27 Poor Restore driving ability
28-36 Moderate Improve driving ability
37-43 Good Support driving ability
44-49 Excellent Maintain driving ability
Figure 9 Objectives for each driving ability level

46
4.3. Pilot survey
During the first phase of drafting and adaptation of the questionnaire, a pilot survey
was conducted in Cagliari (Italy), which allowed to refine the questionnaire in some parts.
The interviews were conducted by Claudia Pinna, Dr. Luigi Lecca and Professor Michele
Meloni, who instructed us how to obtain all the information and in particular with regard to
Section 3, relating to health conditions.
This survey involved 54 elderly drivers, 16 women and 38 men, because women
renew their licence less than men in old age (Siren et al., 2005). They were in possession of
a regular driving licence, and drove regularly at the time of the survey. Drivers have been
randomly selected to be representative of the whole population.
4.3.1. Frequency Analysis
The drivers interviewed were aged between 65 and 84 years old, the average age of
the sample was 70.5 years. The average age of the women interviewed was 71.3, ranging
from 65 to 78 years old, the average age in the sub-sample of men was 70.1, ranging from
65 to 84 years.
The majority of drivers tested were married (70.4%), 12 were widowed (22.2%), two
divorced (3.7%) and one of them was widower and one was single.
As for education that 27.8% had only attended primary school (15 drivers), the same
number had a high school education , 13 drivers had completed middle school (24.1%) and
20.4% had obtained a university degree (11 drivers).
81.5% of drivers were retired, the remaining 10 drivers were still working at the time
of the survey.
48.1% of drivers were ex-smokers, 37% had never smoked and 14.8% (8
individuals) were smokers at the time of the survey. The question concerning the
consumption of alcohol showed that 77.8% of the sample usually drank wine and beer, 11
never consumed alcohol (20.4%), and only one driver frequently drank wine, beer and
spirits.
The great majority of drivers drank between one and three cups of coffee a day
(77.8%), 8 drivers did not drink coffee and 4 drank more than 3 a day.
None of the drivers included in the pilot study had ever taken psychoactive
substances, so this question was omitted from the questionnaire, as better specified in the
following paragraphs.

47
Of the drivers tested 68.5% said they were satisfied with the quality of sleep. This
information is relevant for older drivers, because often with age the quality of sleep is
altered as a result of changes in hormone levels, blood pressure, body temperature, and
alterations in circadian rhythms. These changes often result in early morning and frequent
night-time awakenings. Poor sleep quality is often compensated with frequent short-term
numbness during the day (Klein, 1997).
All drivers tested had a type B licence to drive just cars. Drivers who had obtained a
type B licence before April 26, 1988, could also drive some types of motorcycles, though
nowadays this requires a type A licence. Of the drivers interviewed, the most recent licence
dated to 1988, so all the drivers also had the chance to drive motorcycles.
In addition, during their lifetime 5 drivers had obtained other types of licences to
drive heavy vehicles: 3 possessed a type C licence for driving lorries or vehicles used to
transport goods, one had a type D licence for driving vehicles for passenger transport and 1
had a type E licence, an extension of licences B, C, and D for towing heavy trailers.
The participants had been driving on a regular basis on average for 47.1 years,
ranging from a minimum of 26 to a maximum of 67 years. 92.6% of the drivers had never
let their driving licence expire while four had let their licence expire for a short period (one
for 1-2 months and one who had been suspended for a driving offence for a period of 6
months).
Most of the users drove subcompact cars (63%), 14 (25.9%) regularly used a saloon
car, two of them drove off-road vehicles, two a station wagon, one a small van and one a
sports car.
3 drivers (5.6% of the sample) admitted using a mobile phone while driving.
Of the 8 smokers in the sample 50% smoked while driving, a high risk factor, especially
when driving at night.
Self-assessment of ability to work compared to the best period of one's life is one of
the key elements of the Work Ability Index, indeed the question to which the highest score
is assigned. Similarly, in the Driving Ability Index drivers were asked to rate their driving
ability with a score ranging from 0 to 10. Thirteen drivers (24.1%) gave themselves a score
of 10, five a score of 9 whereas the majority of drivers (35.2%) answered 8; ten respondents
rated their driving ability as 7, four rated their skills sufficient, equal to 6, and three judged
their skills to be inadequate, with a rating of 5.

48
The self-assessment of driving skills continues with the next questions, in which
drivers are asked to assess their physical, mental and cognitive abilities in relation to
driving.
55.6% of drivers (30) stated their physical abilities were good enough for driving,
nineteen drivers felt their physical abilities were very good, whereas only five (9.3 %)
judged their physical fitness as average. None of the respondents rated their physical
abilities as fairly poor or very poor.
However, with respect to cognitive skills, 57.4% of drivers had sufficiently good
abilities, 33.3% (18 drivers) very good and five average cognitive skills. Again none of the
respondents rated their skills as fairly poor or very poor.
The section about diseases is divided into various parts subdivided by type; the
categories indicated are: diseases caused by accidents, muscular-skeletal complaints,
cardiovascular diseases, respiratory disorders, mental, sensory and nervous disorders,
digestive disorders, genitourinary disorders, skin complaints, tumours, endocrine and
metabolic disorders, blood disorders and other illnesses / disorders.
Twelve of the drivers tested had problems caused by accidents, nine of them reported
a disease and three had two problems. Musculoskeletal diseases had been diagnosed in
thirty-two drivers, more than half of the sample (59.26%), most of them (46.88%) only had
one disease, nine had two such diseases, six had three musculoskeletal disorders, and two
drivers had four of these diseases. Twenty-three drivers had cardiovascular disease, fourteen
of them only had one disease, four had two diseases, and five had a single disease in this
category. The most frequent pathology was hypertension.
Nine drivers, had diseases of the respiratory tract, of whom 6 had only one disease,
two had two problems and one had three problems of this type.
Mental and sensory nervous disease were found in 29 drivers; of whom 72.4% (21
drivers) only had one disease, 7 had two diseases and one had three diseases of this type.
Digestive problems were detected in 22 drivers (40.7%), of whom 16 have only one disease,
four have two diseases, one three diseases and one has four diseases in this category.
Only five drivers (9.3% of the sample) reported some kind of skin problem and they
each had only one disease of this type.
7.4% of respondents had benign or malignant tumours. 27.8% had endocrine or
metabolic disorders, and all had only one disease of this type. One driver in the sample had a
blood disorder and one had a deficit at birth. Neither had other illnesses.

49
On the basis of this information the total number of diseases reported by each
respondent was calculated. The maximum number of diseases is observed in driver 16, and
only four drivers (7.4% of the sample) did not have any disease at all.
In the following question, the fourth item, drivers were asked to estimate the
reduction of their driving skills on the basis of health problems. 87% of drivers (47) said
they did not have any trouble, four drivers considered themselves able to drive but had some
difficulties, two said they were sometimes forced to slow down or change the way they
drove and one felt able to drive only for short distances.
Item 5 concerns giving up driving for health reasons over the past year, specifically
drivers were asked how long they had stopped driving because of illness, treatment, medical
examinations or diagnostic tests. 74.1% of drivers (40) had never stopped driving for health
reasons, 11% of them (6 drivers) had been unable to drive for less than 10 days, four drivers
for a period ranging from 10 to 24 days, three drivers for a period ranging from 25 to 99
days and only one stopped for a period ranging from 100 to 365 days.
In item 6 drivers were asked to imagine how they would evaluate their driving ability
in the two years following the interview. 90.7% (49 drivers) were fairly confident while five
said they were not sure they would be able to continue driving two years on.
Item 7 is a section of the questionnaire related to the driving task and includes a series of
questions. 88.9% of drivers said they drive the car daily or at least 3 or 5 days a week, five
drivers (9.3%) use the car every week (ie once or twice a week) and one uses the car
monthly.
Drivers were asked whether they had ever committed a driving offence and how much time
had elapsed since the last offence. 16 drivers (29.6%) had never committed an offence,
thirty-five drivers (64.8%) had committed an offence more than a year ago, while three
drivers had committed an offence in the last year. Only twenty-two drivers stated the reason
for the offence, the most common being a parking offence ( 88.2% of cases), seven drivers
were fined for speeding, two for crossing a red light and once drivers committed the
following offences: "no entry", "failure to indicate", "no seat belt" , "driving with licence
expired " and "parking ticket expired".
85.2% of drivers surveyed had never been involved in an accident, one was involved
in an accident that caused property damage, and seven (13%) were involved in accidents
that damaged property and people.
The majority of drivers (85.2%) always wore their seat belt; three drivers often used
it, two drivers occasionally and three never wore their seat belt under any circumstances.

50
None of the drivers took medicine that affected their ability to drive.
96.3% of drivers had never fallen asleep at the wheel while two had (3.7%). Nearly all
drivers (98.1%) stated they always used the rear-view mirror, only one said he used it often.
68.5% of drivers said they never saw road signs at the last minute, seventeen (31.5%)
admitted they often saw road signs at the last minute.
With regard to the question "Have you given up driving at night because you are
worried about merging into traffic," 38 drivers (70.4%) responded never, 10 (18.5%)
responded often and 6 drivers (11.1%) never drove at night.
43 drivers were not nervous about traffic at night, 11.1% were often nervous drivers
in this circumstance and 5 (9.3%) were always nervous driving at night.
To the question "When driving at night have you often found that the road is not
sufficiently lit?" 20 drivers (37%) responded never, most of them (51.9%) responded often,
and 6 drivers answered always.
41 drivers (75.9%) had no difficulty in perceiving road markings or the guardrail,
nine of them (16.7%) often had some difficulty.
Half of the drivers tested were always forced to slow down at night to read street or
road signs, 20 (37%) reported often having difficulties in this situation, seven (13%) always
had difficulties.
4.3.2. Calculation of Drive Ability Index score in the pilot study
Average DAI for the whole sample is 39.8, corresponding to a "good" ability to
drive. Men scored higher (40.6) than women (37.9), the difference probably being attributed
to the slightly higher average age of the women in the sample
Analysing the scores obtained for different items in the two sub-samples grouped by
gender shows that men have a higher score in Sections 2 and 6, calculated on the basis of
self - assessment of ability to drive at present and in the near future (next two years). Also
Section 7 showed that men have less difficulty in managing situations that occur at the
wheel. than women.
Of the drivers involved in the survey, the driving ability of twelve drivers comprised
of 4 women and 8 men aged between 65 and 75 was "excellent" (22% of the sample). No
drivers aged over 75 were included in this group.
The driving ability of most drivers (54%) is "good". This group includes 24 men and
5 women. The ability to drive is "moderate" in 20% of the drivers interviewed,
corresponding to reduced fitness to drive.
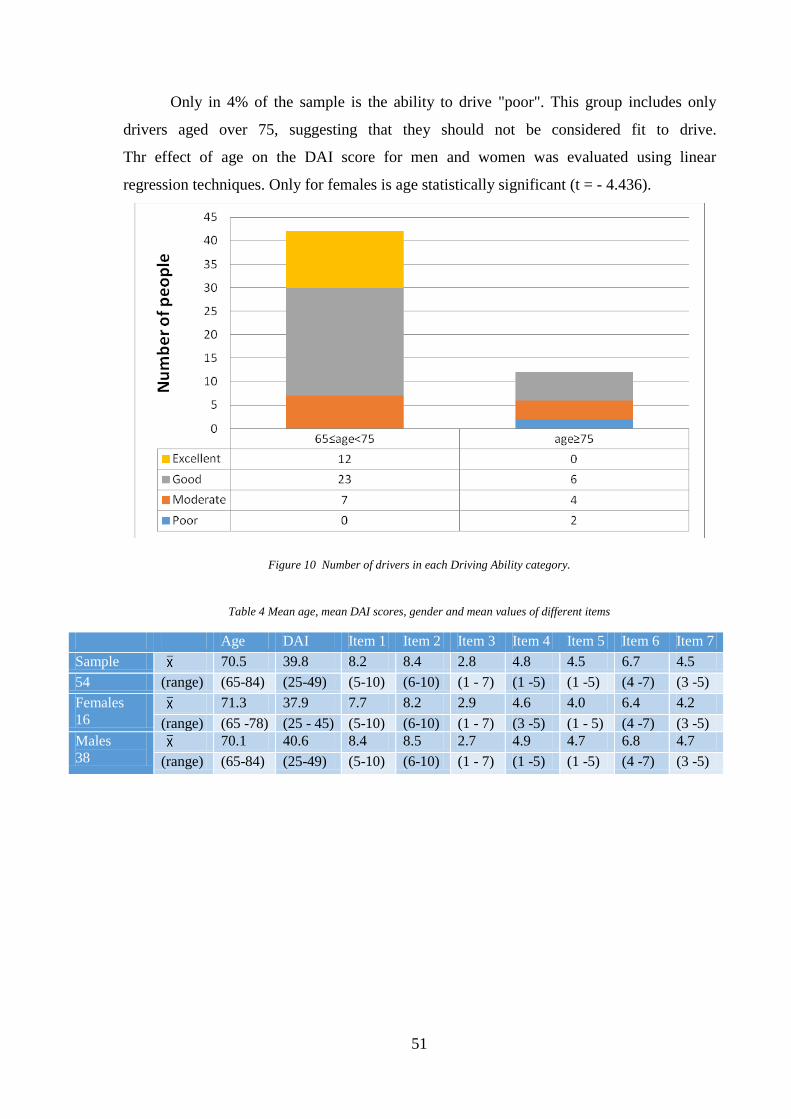
51
Only in 4% of the sample is the ability to drive "poor". This group includes only
drivers aged over 75, suggesting that they should not be considered fit to drive.
Thr effect of age on the DAI score for men and women was evaluated using linear
regression techniques. Only for females is age statistically significant (t = - 4.436).
Figure 10 Number of drivers in each Driving Ability category.
Table 4 Mean age, mean DAI scores, gender and mean values of different items
Age DAI Item 1 Item 2 Item 3 Item 4 Item 5 Item 6 Item 7
Sample 70.5 39.8 8.2 8.4 2.8 4.8 4.5 6.7 4.5
54 (range) (65-84) (25-49) (5-10) (6-10) (1 - 7) (1 -5) (1 -5) (4 -7) (3 -5)
Females
16 71.3 37.9 7.7 8.2 2.9 4.6 4.0 6.4 4.2
(range) (65 -78) (25 - 45) (5-10) (6-10) (1 - 7) (3 -5) (1 - 5) (4 -7) (3 -5)
Males
38 70.1 40.6 8.4 8.5 2.7 4.9 4.7 6.8 4.7
(range) (65-84) (25-49) (5-10) (6-10) (1 - 7) (1 -5) (1 -5) (4 -7) (3 -5)

52
Figure 11 Average Driving Ability Index scores and score for each Item for different age groups.
Table 5 Mean DAI scores and mean values for different items by gender and age
Gender
DAI Item 1 Item
2
Item
3
Item
4
Item
5
Item
6
Item
7 Female
s
Male
s
65≤age<7
5
12 31 40.7 8.3 8.6 2.9 4.8 4.6 6.8 4.6
28% 72% (25-49) (5 -
10) (6-10) (1 - 7) (1 -5) (2 -5) (4 -7) (3 -5)
age≥75
4 7 36.4 7.5 7.7 2.2 4.5 4.1 6.5 4.4
36% 64% (25 -
43) (5 - 9) (6-10) (1 -5) (3 -5) (1 -5) (4 -7) (3 -5)
Table 6 DAI score groups and percentage distribution by gender and age
Sample Females Males
65≤age<75 age≥75 65≤age<75 age≥75
Poor 2 0 1 0 1
4% 0% 6% 0 2.6%
Moderate 11 4 2 3 2
20% 25% 13% 7.9% 5.3%
Good 29 4 1 19 5
54% 25% 6% 50.0% 13.2%
Excellent 12 4 0 8 0
22% 25% 0% 21.1% 0.0%

53
Table 7 Description models
Gender Constant
Subsample R2 Beta t-test t-test
Females 0.584 -0.764 -4.436 6.724
Males 0.022 -0.149 -0.919 5.003
Figure 12 – DAI score and age for males.
Figure 13 – DAI score and age for females.

54
5. EXPERIMENT 1: ON-ROAD EXPERIMENTS
5.1. Research activities in Newcastle upon Tyne
The following part of the research was conducted in collaboration with Dr. Amy Guo
at Newcastle University in the UK.
In this phase, the questionnaire was translated into English, and modified on the
basis of the results of the pilot survey. It was also adapted so as to avoid mistrust and
maximize the level of compliance in British drivers.
To assess the validity of the questionnaire to predict the ability to drive, the tests
were performed either on the university’s driving simulator, or in on-road experiments.
5.2. Adaptation of Driving Ability Index to British culture
The first version of the Driving Ability Index questionnaire was modified according
to the results of the pilot survey and some of the answers that were open-ended responses
have become closed answers. Some changes were made in order to obtain the same
information and maximize the level of response from the British drivers.
The question concerning education, has been adapted to the English system (no
qualifications, GCSE / O-level and equivalents, A levels and equivalents, University
degrees).
The question about alcohol use in the first draft was, "Do you drink alcohol?". This
has been replaced with two questions, the first relating to the frequency of alcohol use,
"How often do you have a drink containing alcohol?" the second to the amount of alcohol
consumed "How many units of alcohol do you drink on a typical day? " in which the
answers are expressed in units).
In a study conducted by Lisa Blonqvist in 2004 it was found that the accident risk of
older drivers is overstated, because older drivers, compared with other age groups that travel
the same annual mileage on average have the same probability of being involved in an
accident.
According to this study two questions related to the daily and annual mileage have been
introduced.

55
Drivers were asked what percentage of mileage driven annually is urban or rural (the
sum of the two percentages is not necessarily 100%).
The question on marital status was very personal, so it was replaced with two
questions which still investigate the same area. The first question asked if the participant
drives mainly on his own or with other people, and the second question instead aims to
know if participants when travelling by car are most often drivers or passengers.
The question on the number of licences held was hard to manage because the categories of
licences have changed several times over the years. This question has been replaced with the
questions "Have you ever driven the following vehicles?" (Possible answers are Motorbike/
Van / mobile home / minibus/ Ambulance / Fire Engine, Sports car, Lorry / bus / Coach) and
with a question relating to driving qualifications "Do you have any driving qualifications
other than the standard DSA driving test?".
Questions about smoking whilst driving or drinking coffee were excluded from the
questionnaire because in the pilot survey they did not appear to be of particular importance.
Questions about the use of psychoactive substances and use of the phone while driving were
also excluded because these activities are against the law and no one would actually give a
truthful answer.
In the final section relating to the driving task “ Have you given up driving at night
because you are worried about merging into traffic?” has been removed as it was covered by
the questions: “have you given up driving at night?” and “Do you worry about merging into
traffic?”.
This section has also been modified. The questions concerning the use of mirrors :-
in the first draft the possible answers were always, often or never, and all the drivers
involved in the pilot survey stated that they always use the mirror. In the second version the
possible answers are: never, only before making particular manoeuvres and every few
minutes.
5.3. On-road experiments
5.2.1. Validation of the questionnaire through on-road experiments
To evaluate the driving ability in the elderly, the test adopted by Justiss in 2005 and
approved by the Elderly drivers Consensus Conference has been used. This test is mentioned

56
in previous chapters, and involves performing some special manoeuvres and crossing
junctions, which are considerably complex for elderly drivers.
This specific on-road test has been chosen in order to evaluate driving performance,
for its generalizability, because it can be applied in different contexts and different
geographic locations, but under certain conditions (during daytime and with minimal rain),
and because it allows to evaluate driving performance in four categories (Justiss, 2005) such
as the Driving Ability Index.
5.2.2. Trial Description
The same instrumented vehicle was used for the on-road experiments. The vast
majority of participants were used to a vehicle with automatic transmission or at least were
familiar with it. The experiment was started by asking the participant to get into the vehicle
to find his/her most comfortable position including finding the right height and back-support
of the seat and the angle of the mirrors. Then they were offered the opportunity to drive the
vehicle until they felt comfortable with it. This practice took place inside a big park
indicated on the map below, owned by Metrocentre, a shopping complex located in
Gateshead, a city near to Newcastle upon Tyne. This park was the start and end points of the
experiment. The trial route is shown in Figure #. The participant was asked to complete the
Driving Ability Index questionnaire upon completing the driving.
Figure 14 Location of Metrocentre car park – Source: metrocentre

57
5.2.3. The trial route
The tests took place on a 5.8 mile (9.33 kilometres) long circular route where there is
a speed limit of 40 miles per hour at the beginning and end of the route, close to the
Metrocentre shopping complex and of 30 miles per hour in residential areas (Dunston and
Whickham). Estimated driving time in compliance with these speed limits was 18 minutes.
The route is shown in the following map.
Figure 15 Test route– Source: googlemaps
As in the studies of Justiss in 2005 and Stav in 2008, the route used here includes
signalized junctions with left and right turns, which prove very complex for older drivers
(similar to left turns in countries with right-hand drive). There are several roundabouts of
varying difficulty, a T-junction and many zebra crossings. There is also a 4-way interchange
in which drivers are obliged to turn right. During the test drivers have to change lanes and
drive through two tunnels, in one of which a lorry and other vehicles cannot pass at the same
time.
Part of the test took place in a residential area where the speed limit is 30 miles per
hour, while the remainder is on non-urban roads where the speed limit is 40 miles per hour.
In order to measure driving ability in older people, the ability to execute manoeuvres
and cross junctions was evaluated.
Along the route, the drivers had to leave the car park and turn right at the 4-way
interchange (Figure 14). Then they had to turn left at the traffic lights (Figure 15) and drive

58
through a tunnel. Next they had to turn left at a three way mini roundabout (Figure 16). then
drive through a tunnel, in which a car and a large vehicle cannot pass together. At this point
the route leads into the urban area.
At a zebra crossing it was checked if drivers paid attention to pedestrians. Drivers
approached the multiple lanes. They crossed the traffic lights in Figures 17 and 18.
After they went straight on the left at the traffic light (figure 19), in a three arms
junction.
They turned on the right in a T junction (figure 20), and after they went straight at
the traffic light in figure 21 and in the figure 22.
There was a quite busy zebra crossing. They followed the route and they went
straight on the right at the traffic light, in a three arms junction (figure 23).
They changed lane (figure 24) before they turned on the right at the traffic, in the
three arms junction showed in figure 25.
They went straight at the two traffic light for pedestrians (figure 26), and they went
straight at the roundabout (four arms) in figure 27. At this point the residential area finishes.
They crossed a tunnel and after they turned on the right in a uncontrolled junction
(figure 28), where there is the buss lane on the left that confuse the drivers.
They changed lane (figure 29) and they turned on the right at the traffic light, in the
four arms junction in the figure 30. They turned on the right at the mini roundabout in figure
31. After that, they turned on the left at the traffic light shown in the figure 32.
They turned on the left at the roundabout (figure 33) for reach the car park where the
test finished.
The junctions are shown in the following figures.

59
Figure 16 Turn on the right at the roundabout – Source: google earth

60
Figure 17 Turn on the right at the traffic light– Source: google earth
Figure 18 Straight on the left at the mini roundabout – Source: google earth

61
Figure 19 Straight on at the traffic light – Source: google earth
Figure 20 Straight on at the traffic light – Source: google earth

62
Figure 21 Straight on at the traffic light – Source: google earth
Figure 22 Turn on at the T junction – Source: google earth

63
Figure 23 Straight on at the traffic light – Source: google earth
Figure 24 Straight on at the traffic light – Source: google earth

64
Figure 25 Straight on the right at the traffic light – Source: google earth
Figure 26 Changing lane – Source: google earth

65
Figure 27 Turn on the right at the traffic light – Source: google earth
Figure 28 Straight on at the traffic light – Source: google earth

66
Figure 29 Straight on at the roundabout – Source: google earth
Figure 30 Turn on right at the marked junction – Source: google earth

67
Figure 31 Changing lane – Source: google earth
Figure 32 Turn on the right at the traffic light – Source: google earth

68
Figure 33 Turn on the left at the mini roundabout – Source: google earth
Figure 34 Turn on the left at the traffic light – Source: google earth

69
Figure 35 Turn on the left at the roundabout – Source: google earth
5.2.4. The vehicle used for the tests
The vehicle used was a Peugeot iOn, a totally electric car with a permanent magnet motor
that delivers 47 kW or 64 hp from 3000 to 6000 rpm. The motor is rear mounted and acts
on the rear wheels. There is also a system for recovering energy during braking.
The car is equipped with an automatic transmission, but with a mode switch lever.

70
Figure 36 Vehicle used for the trials.
5.2.5. The eye tracker
In order to analyze the elements observed by drivers during the test and to verify that
they have paid enough attention to pedestrians and other vehicles during the tests; all
drivers' eye movements were analyzed with an eye tracker.
This tool allows the eye tracking and allows to identify which visual stimuli were observed
and which were neglected during the test and it measures the time required to perceive them.
The instrument consists of three cameras, two of which are indicated in the figure below,
they record the driver and monitor the gazes, the number and the duration of blinks and the
pupil diameter, which have a direct relationship with the level of fatigue.
These cameras measure the number and magnitude of rotation of the neck, this
variable is particularly important for the study of elderly drivers at junctions, because of the
reduction in the amplitude of their visual field, they are forced to make several rotations of
the head in order to perceive the stimuli at the ends of their visual field.
The third camera records the external driving environment and an internal part of the
vehicle (dashboard, rear view mirror and speedometer), this was mounted in the passenger
seat through a metal bracket, so as to be at the same height of the driver's eyes.

71
Figure 37 Camera of the eye tracker
Figure 38 Driver tested inside the vehicle whit the internal cameras

72
Figure 39 Phase of the calibration of the eye tracker
5.2.6. Operating conditions during tests
The road tests were performed during four weeks, from September 15 to October 28
2014, and during these days the meteorological conditions were similar. All tests were
performed during day light hours. The date, time, and weather conditions of the tests are
shown in the following table.
Table 8 Weather conditions during tests- Source: eurometeo
Driver
ID
Date Hour Weather conditions
1 15/09/14 10:00-11:00 Cloudy
2 15/09/14 11:30-12:30 Cloudy
3 16/09/14 10:00-11:00 Cloudy
4 16/09/14 11:30-12:30 Cloudy
5 17/09/14 10:00-11:00 Cloudy
6 17/09/14 11:30-12:30 Cloudy
7 18/09/14 10:00-11:00 Cloudy

73
8 18/09/14 11:30-12:30 Cloudy
9 18/09/14 14:30-15:30 Cloudy
10 22/09/14 10:00-11:00 Mostly cloudy
11 22/09/14 11:30-12:30 Mostly cloudy
12 22/09/14 14:30-15:30 Mostly cloudy
13 24/09/14 11:30-12:30 Partly cloudy partly sunny
14 24/09/14 14:30-15:30 Mostly cloudy
15 25/09/14 10:00-11:00 Cloudy
16 25/09/14 14:30-15:30 Partly cloudy partly sunny
17 26/09/14 10:00-11:00 Mostly cloudy
18 26/09/14 11:30-12:30 Mostly cloudy
19 29/09/14 10:00-11:00 Mostly cloudy
20 29/09/14 11:30-12:30 Mostly cloudy
21 30/09/14 10:00-11:00 Mostly cloudy
22 30/09/14 11:30-12:30 Partly cloudy partly sunny
23 01/10/14 10:00-11:00 Partly cloudy partly sunny
24 01/10/14 14:30-15:30 Cloudy
25 02/10/14 10:00-11:00 Clear
26 27/10/14 10:00-11:00 Partly cloudy partly sunny
27 27/10/14 11:30-12:30 Cloudy
28 27/10/14 14:30-15:30 Cloudy
29 28/10/14 10:00-11:00 Mostly cloudy
30 28/10/14 11:30-12:30 Mostly cloudy
31 28/10/14 14:30-15:30 Cloudy with rain
5.2.7. Evaluation of driving performance
During the tests drivers’ performances have been analysed, on basis of the studies
previously described (Justiss, 2005) a standardized form was filled in for evaluate the
performance of the manoeuvres and to measure the number and the severity of the errors.

74
The execution of the manoeuvres was evaluated with a score ranging from 0 to 3 and
it corresponds to the following ratings:
3 if no error was observed, the driver is not considered dangerous at all times;
2 if one or more errors were observed, the driver is not considered dangerous, but
with restrictions and recommendations;
1 if one or more errors were observed, and if a verbal warning to change the driving
behaviour was necessary, the driver is at high risk (but reversible);
0 if one or more errors were observed, and physical intervention of the examiner was
necessary or if there have been any violations of the road rules, the driver is at high risk
(irreversible).
The table 9 shows the ratings given to each driver based on their driving performance and
mistakes made during the tests.
Table 9 Driving ability evaluation during tests
Driver
ID
Driving
ability
evaluation
Errors
1 3
2 3
3 2 He/ She Stayed
ever in the
central lane on
the roundabout
incorrect approach
and no indicator at
the mini roundabout
4 2 He/ She
Indicated for
turn left in the
park and a car
was arriving

75
5 2 He/ She stayed
ever in the
central lane on
the roundabout
6 0 He/ She
Crossed with
the red traffic
light
when He/ She came
out of the car park
He/ She was running
over a pedestrian
Speeding
7 2 indicator in the
opposite side
going in / and
no indicator
going out every
time crossed a
roundabout
8 3
9 3
10 3
11 3
12 2 incorrect
approach and
no indicator in
the roundabout
He/ She straight on
the traffic light and
not on the left
13 1 He/ She
overtook
cyclist going in
the opposite
lane
He/ She changed
lane without
indicator when he
must straight on
14 3
15 3

76
16 0 NO indicator in the
roundabout
He/ She went out
to the roundabout
in the entry lane
17 0 He/ She was
not able to stop
in the middle
of the junction
He/ She crossed
traffic light when
orange light was
finishing and was in
the middle of the
junction when was
red
He/ She cannot
turn the steering
wheel with a single
rotation, but He/
She performs
many small
movements
18 3
19 3
20 3
21 3
22 2 NO indicator in
the roundabout
He/ She asked the
correct lane because
was going in the bus
lane
23 3
24 1 He/ She
overtook a
lorry in a
curve when
He/ She
couldn't see
behind
Speeding He/ She crossed
with orange and
finished the
manoeuvre with
red light
25 3
26 2 incorrect
approach in the
roundabout

77
27 3
28 3
29 3
30 2 incorrect
approach in the
roundabout
Speeding
31 2 Speeding
5.2.8. Results of the questionnaire Driving Ability Index: frequency analysis
All drivers who have been tested were volunteers, to be eligible for the study, they
were required to be experienced drivers, holding a license for at least 10 years.
The sample tested by road tests and then interviewed with the questionnaire consists
of 31 drivers 28 of them aged between 60 and 86 years, the average age in the sample was
70.39 years (standard deviation of 6.396 years). Three drivers under the age of 60 were
included in the same test, some of them have special certifications that prove their ability to
drive (such as IAM, or licences for the ambulance), these experienced drivers were tested
with the aim to make comparisons between driving performance in both age groups. The
average age of experienced drivers is 55.67 years. In the following, frequency analysis, the
drivers of the two age groups were considered separately.
Figure 40 Drivers tested grouped by age
1 1 1 1 1
2
5
2
1
5
1 1
2
1 1 1 1
0
1
2
3
4
5
6
60 61 62 63 65 66 68 69 70 71 72 74 75 76 82 85 86
Age

78
In the survey five women and twenty-three men were included over the age of 60
years and three men under the age of sixty.
Figure 41 Drivers tested grouped by gender
The majority of elderly drivers tested (46.4%) travel for most of the time with other
people, 25% of them travel sometimes with other persons (drivers 7), 25% travel
occasionally with other people, and only one always travel alone.
The experienced drivers have given different answers, their responses were: Never,
sometimes and most of the time.
Figure 42 Reponses of drivers to the question: “How often do you travel with other people?”
18%
82%
GENDER
F M
4%
25%
25%
46%
HOW OFTEN DO YOU TRAVEL WITH OTHER PEOPLE?
Never Occasional Sometimes Most of the time

79
All drivers involved in the survey are usually drivers of the vehicle and not
passengers, when they travel by car.
92.86% of drivers (26 drivers) are retired and two of them are still working. Among
the experienced drivers only one was still working at the time of the test.
46.4% of drivers surveyed got an academic degree; nine drivers have achieved the
"A levels and equivalents", which corresponds to the “diploma”; three have achieved the
"GCSE / O-level and equivalents", which corresponds to the middle school, and three
answered "no qualification" that corresponds to the primary school.
Among the experienced drivers one has a degree and the other two have "A level or
equivalent".
Figure 43 Education for the driver surveyed
Only one driver included in the survey currently smoke, 67.9% have never smoked
(19 drivers), eight of them are ex-smokers. None of the experienced drivers was smoking at
the time of the study, but two of them are ex-smokers.
11%
11%
32%
46%
EDUCATION
No qualification GCSE/O level and equivalents A levels and equivalents University degree

80
Figure 44 Smoking in the drivers tested
Regarding alcohol consumption, 32.1% of drivers consumes alcohol 2 or 3 times a
week, 25% consume it monthly, 7 of them (22.7%) consume alcohol 4 or more times a
month, two drivers consume alcohol from 2 to 4 times a month and three drivers never
consume alcohol.
Two experienced drivers consume alcohol 2 or 3 times a week, and a driver drinks
alcohol 2 or 4 times a month.
68%
29%
3%
SMOKING
No Ex Smoker Smoker

81
Figure 45 Alcohol consumption
67.9% of the drivers when drinking consume an average of one or two units of
alcohol, six of them consume on average 3 or 4 units and two drivers consume 5 or 6 units.
All experienced drivers consume 3 or 4 units of alcohol.
Figure 46 Quantity of alcohol drank typically
68%
24%
8%
HOW MANY UNITS OF ALCOHOL DO YOU DRINK ON A TYPICAL DAY WHEN YOU ARE DRINKING?
1 or 2 units 3 or 4 units 5 or 6 units

82
It has been evaluated the level of satisfaction with the quality and the amount of sleep they
get, in a scale from 1 (unsatisfied) to 5 (very satisfied); six drivers have declared the highest
satisfaction level. 35.7% (10 drivers) reported a satisfaction level of 4; for 14.3% the degree
of satisfaction is 3, the level 2 was chosen by four drivers, four drivers (14.3%) said they
were unsatisfied and they chose the minimum level (1). The average satisfaction level in the
sample is 3.36 (SD = 1.36). All experienced drivers rated their satisfaction level as 4.
Figure 47 Satisfaction with the quality and amount of sleep
Usually the drivers tested have been driving from a minimum of 31 to a maximum of
61 years, the average value in the sample is 48.26 years. The experienced drivers have been
driving on average from 37.33 years and it ranges from a minimum of 36 to a maximum of
38 years.
Within the sample the average mileage travelled is of 44.21 miles a day (SD = 60.02)
and ranges from a minimum of 5 miles a day to a maximum of 250 miles a day. Drivers
under the age of 75 years travel on average 39.45 miles a day, those aged over 75 travel on
average 61.67 miles a day. The experienced drivers travel on average 23.33 miles a day.
0
2
4
6
8
10
12
1 2 3 4 5
Fre
qu
en
cy
Satisfation with the quality and amount of sleep

83
Figure 48 Mileage travelled a day by drivers tested
The majority of drivers (32.1%) travel annually from 5001 to 8000 miles (from
8048.33 to 12874.75 km); 21.4% travel from 2001 to 5000 miles (from 3220.3 to 8046.72
km), 17.9% travel from 8001 to 10,000 miles (from 12876.36 to 16093.44 km), and eight
drivers travel more than 10,000 miles (16093.44) per year. None of them travels 2000 miles
(3218.67 kilometers) or less per year. The experienced drivers travel a different mileage,
ranging from 5001-8000 to more than 10,000 miles.
Figure 49 Mileage travelled per year by drivers tested
Drivers use their vehicles mainly in urban areas (54.46%) and only 38.21% of the
trips take place in suburban areas or for long trips.
0
1
2
3
4
5
6
7
8
9
10
5 8 10 20 30 35 50 60 70 160 200 250
Fre
qu
en
cy
Miles travelled a day
25%
21%
21%
33%
HOW MANY MILES YOU TRAVEL ON A TYPICAL YEAR?
2001-5000 5001-8000 8001-10000 10000+
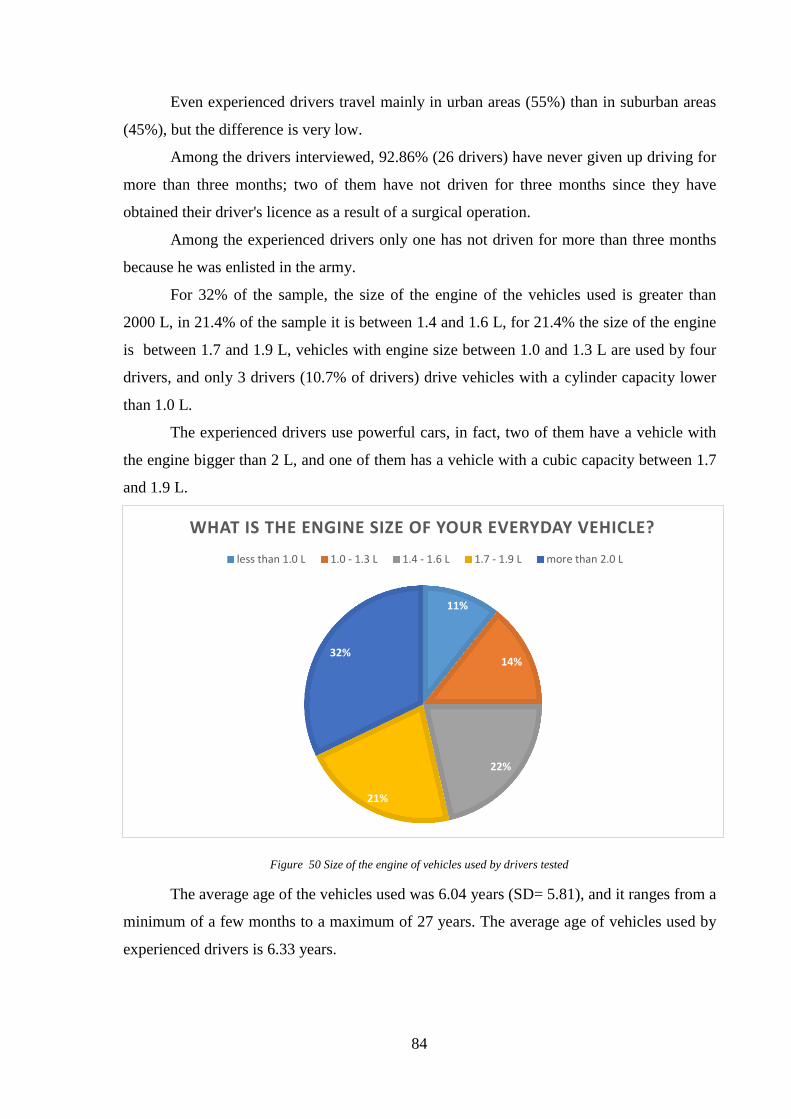
84
Even experienced drivers travel mainly in urban areas (55%) than in suburban areas
(45%), but the difference is very low.
Among the drivers interviewed, 92.86% (26 drivers) have never given up driving for
more than three months; two of them have not driven for three months since they have
obtained their driver's licence as a result of a surgical operation.
Among the experienced drivers only one has not driven for more than three months
because he was enlisted in the army.
For 32% of the sample, the size of the engine of the vehicles used is greater than
2000 L, in 21.4% of the sample it is between 1.4 and 1.6 L, for 21.4% the size of the engine
is between 1.7 and 1.9 L, vehicles with engine size between 1.0 and 1.3 L are used by four
drivers, and only 3 drivers (10.7% of drivers) drive vehicles with a cylinder capacity lower
than 1.0 L.
The experienced drivers use powerful cars, in fact, two of them have a vehicle with
the engine bigger than 2 L, and one of them has a vehicle with a cubic capacity between 1.7
and 1.9 L.
Figure 50 Size of the engine of vehicles used by drivers tested
The average age of the vehicles used was 6.04 years (SD= 5.81), and it ranges from a
minimum of a few months to a maximum of 27 years. The average age of vehicles used by
experienced drivers is 6.33 years.
11%
14%
22%
21%
32%
WHAT IS THE ENGINE SIZE OF YOUR EVERYDAY VEHICLE?
less than 1.0 L 1.0 - 1.3 L 1.4 - 1.6 L 1.7 - 1.9 L more than 2.0 L

85
Eleven drivers have a qualification different from the normal driving licence, some
are members of the IAM and they are drivers of advanced level, one has the licence of
category D1 to drive buses. Two experienced drivers have a driving qualification.
Figure 51 Driving qualification
Usually all drivers tested drive the car; 17 have driven a motorcycle, 23 of them have
diven a van, a minibus or a camper, 21 drivers have driven a sports car, 3 of them have
driven a lorry, a bus or a coach, and only one has driven special vehicles as an ambulance or
a fire engine car. All experienced drivers have driven motorcycle, van, mobile home and
minibuses and one driver has driven all the vehicles listed.
In item 1 were asked drivers to rate their current driving skills, compared to their
best period of life, on a scale from 0 to 10. 53.6% of drivers evaluate their skills as 8; 10.7%
of them judged it as 7, five drivers have evaluated their skills as 10 (only the male drivers
have given this answer, as it is known they tend to overestimate their driving ability), four
drivers have evaluated their skill as 9, and only a driver has given a judgment of 3.
In item 1 the average score for the sample amounts to 8.21. All experienced drivers
rated their performance as 9.
61%
39%
DO YOU HAVE ANY DRIVING QUALIFICATIONS OTHER THAN THE STANDARD DSA DRIVING TEST?
No Yes

86
Figure 52 Item 1 self-evaluation of driving ability compared with the best period of life
In item 2 is asked drivers to assess their physical and cognitive skills in relation to
driving.
With regard to physical abilities most of the drivers (60.7%) said they have very good
physical skills, 28.6% (8 drivers) said they have quite good skills, 10.7% have average
physical skills. Two experienced drivers said they have very good physical skills and one
has quite good physical abilities.
Figure 53 Self-assessment of physical abilities
0
2
4
6
8
10
12
14
16
3 7 8 9 10
Fre
qu
en
cy
Self evaluation of driving skills
11%
28%
61%
HOW DO YOU RATE YOUR CURRENT DRIVING ABILITY IN RELATION TO YOUR PHYSICAL CONDITIONS?
average quite good very good

87
With regard to cognitive abilities, 60.7% of drivers said they have very good skills,
28.6% (8 drivers) said they have quite good mental skills, one driver considers his cognitive
abilities quite poor and another one has very poor mental skills. All experienced drivers
reported to have very good cognitive skills.
Figure 54 Self-assessment of cognitive abilities
Section 3 refers to the number of diseases diagnosed by a doctor, 20 drivers have
musculoskeletal disorders and arthritis is the most common, this disease affects 9 drivers.
The maximum number of musculoskeletal disorders in only one driver is 3; drivers have an
average of 1.03 diseases in this category.
Cardiovascular diseases have been found in 17 drivers, the maximum number of
diseases of this type in only one driver is 3 and the most frequent disease was hypertension;
that affects 12 drivers. The average number of cardiovascular diseases in the sample is 0.71.
8 drivers have cognitive or sensory impairments and none driver has more than 2
diseases in this category. Among these, the most frequent was the loss or impairment of
hearing, that affects 5 drivers. The average number of cognitive or sensory diseases in the
sample is 0.32.
Two drivers have digestive diseases (stones in the liver or gallbladder disorders and
gastritis) and one driver has a genitourinary disease (urinary infection).
Only two drivers have skin complains and they have allergies and eczema; two
drivers have tumours: one is benign and one is malignant to the prostate.
3% 7%
29%
61%
HOW DO YOU RATE YOUR CURRENT DRIVING ABILITY IN RELATION TO YOUR MENTAL CAPABILITY?
quite poor average quite good very good

88
Four drivers have endocrine and metabolic disorders, the maximum number of
diseases in one driver is one, the diseases found in the sample were diabetes, obesity and
thyroid disorders.
Respiratory diseases, blood disorders and deficits at birth were not found in any
driver interviewed.
A driver among experts does not have any disease, one has a musculoskeletal disease
and a cardiac disease, and another has just a musculoskeletal disease.
The maximum number of diseases found among experts drivers is 2.
In item 4 is asked drivers to assess their driving skills in relation to their health,
85.7% of drivers have no difficulties due to diseases, four drivers (14.3%) tend to slow
down or change their driving style due to illness.
None of them answered: "I feel I am no longer able to drive", "I feel I am only able
to drive for short distances," "I Am Able to drive, but it's getting difficult".
The experienced drivers said they have not difficulty driving because of their health
conditions.
Figure 55 Driving skills in relation to health conditions
In item 5 was asked drivers if they abstained from driving due to health problems in
the past year, 92.9% of drivers said that they have never stopped driving because of their
health, two drivers have abstained from driving for less than ten days during the last year.
None of the experienced drivers stopped driving within the last year.
86%
14%
DO YOUR CURRENT HEALTH CONDITIONS MAKE IT DIFFICULT TO DRIVE?
I do not have any difficulties On average I drive slower than I used to

89
Figure 56 Abstention from driving in the last year due to health problems
In item 6 is asked drivers to predict their driving skills over the next two years,
92.9% of drivers believe that they will certainly be able to drive, and two of them have some
doubts about this, in fact they stated that maybe they will be able to drive.
All experienced drivers said they definitely they will drive over the next two years.
Figure 57 Driving ability in the next two years
7%
93%
HAVE YOU HAD TO STOP DRIVING DUE TO HEALTH PROBLEMS (ILLNESS, TREATMENT, VISITS, MEDICAL
TESTS) DURING THE PAST 12 MONTHS?
less than 10 days not at all
93%
7%
DO YOU BELIEVE, GIVEN YOUR CURRENT HEALTH CONDITIONS, THAT YOU WILL BE ABLE TO CONTINUE
DRIVING OVER THE NEXT TWO YEARS?
Definitely Maybe

90
In Section 7, related to the driving activity, it was found that the majority of drivers
(85.7%) drive their vehicle very often (3 or more times a week), four drivers drive often
(once or twice a week). The experienced drivers drive very often (3 or more days a week).
Figure 58 Driving frequency
71.45% of drivers surveyed have committed a driving offense, among them 18 committed it
more than one year before the survey, two have committed the offense within the last year.
All the drivers have committed the same offence: speeding; usually the speed was 10 miles
per hour greater than the speed limit. Only eight drivers have never committed an offense.
Two experienced drivers have committed an offense more than one year ago and one has
never committed an offense.
14%
86%
HOW OFTEN DO YOU DRIVE?
Often (one or two days a week) Very often (3 or more days a week)

91
Figure 59 Driving offence
Among the drivers tested the majority (89.3%) has never been involved in an
accident in the last five years, the remaining three drivers were involved in accidents that
caused damage to vehicles or properties only, but none of them have been involved in
accidents with injury to people. Two experienced drivers have never been involved in an
accident.
Figure 60 Involvement in accidents
89%
11%
HAVE YOU BEEN INVOLVED IN ANY ROAD TRAFFIC ACCIDENT/COLLISION IN THE PAST 5 YEARS?
No Yes with damage to propert only

92
All drivers surveyed said that they use the seat belt and none of them have
undergoing any treatments that affect the alertness or the ability to drive.
17.9% of respondents have fallen asleep driving, it never happened for 82.1% of the
sample. None of the experienced driver have fallen asleep while driving.
Figure 61 Falling asleep
The vast majority of drivers (96.4%) said that they look the rear view mirror once
every few minutes during the drive, only one said that he observe it only during the
execution of some specific manoeuvres.
Figure 62 Use the rear view mirror
82%
18%
HAVE YOU EVER FALLEN ASLEEP BEHIND THE WHEEL?
No Yes
96%
4%
HOW OFTEN DO YOU USE YOUR REAR VIEW MIRROR?
Every few minutes Only before making particular manoeuvres

93
Among the drivers tested, five said that they often see road signs at the last minute, it
never happens to 82.1% of the drivers. None of the experienced drivers see the road signs at
the last minute.
Figure 63 Replies to the question: “Do you often see road signs at the last minute?”
Only one elderly driver has given up driving at night.
Figure 64 Give up driving at night
64.37% of the drivers are not worried merging into traffic during the night, five
drivers are sometimes worried, 2 are often worried and the other three are
always worried in such situation. The experienced drivers reported that they are never
worried when driving at night.
82%
18%
DO YOU OFTEN SEE ROAD SIGNS AT THE LAST MINUTE?
No Yes
96%
4%
HAVE YOU GIVEN UP DRIVING AT NIGHT?
No Yes

94
Figure 65 Worry merging into traffic at night
71.4% of drivers is never nervous or stressed driving at night, four drivers are
sometimes stressed, one is often nervous driving at night and three are always nervous or
stressed when driving at night. The experienced drivers are not nervous or stressed when
driving at night.
Figure 66 Stress or nervousness in night driving
When driving at night, 53.6% of drivers feel that the road is well lit, 17.9% considers
it often well lit, 21.4% feel that the street is only sometimes well lit, two drivers feel that the
64%
18%
7%
11%
WHEN DRIVING AT NIGHT DO YOU WORRY ABOUT MERGING INTO TRAFFIC?
never sometimes often always

95
road lighting is never enough. Two experienced drivers never feel it poorly lit and one said
that the street is sometimes poorly lit.
Figure 67 Replies to the question: “When driving at night do you feel that the road is not sufficiently lit?”
It has been asked drivers if they find difficulty in perceiving road marking (guardrail
or marking) when driving at night, 60.7% said that they have never been in this condition,
nine have sometimes difficulty and two drivers have always difficulty in perceiving road
markings at night.
The experienced drivers reported that they never have trouble seeing the road
markings.
7%
32%
61%
WHEN DRIVING AT NIGHT DO YOU HAVE DIFFICULTY SEEING OR UNDERSTANDING ROAD MARKINGS?
always sometimes never

96
Figure 68 Difficulties to perceive road markings
53.6% of drivers surveyed do not need to slow down to read the signs at night,
32.1% sometimes slow to read the signs, 10.7% of drivers must reduce his speed to read the
signs, and only one said that he often have to slow down to read traffic signs.
None experienced driver must slow down to read the signs.
Figure 69 Need to slow down to read the road signs
Using the responses to the questionnaire, the driving ability score was calculated for
all drivers included in the survey and in the road test. The following figure shows the
evaluations of older drivers (in the graph were not included the experienced drivers, all of
them have an excellent driving ability).
Based on this calculation, 50% of the drivers has a good ability to drive, for 36.36%
the driving ability is excellent (8 drivers), two drivers have a moderate ability to drive and
one has a poor driving ability.
11%
32%
4%
53%
WHEN DRIVING AT NIGHT DO YOU HAVE TO SLOW DOWN TO READ THE ROAD SIGNS OR STREET NAMES?
always sometimes often never

97
Figure 70 Driving ability scores for drivers tested
Based on responses to the questionnaire all three experienced drivers have excellent
driving ability.
5.2.9. Validation of Driving Ability Index with the Kendall tau test
In order to validate the score calculated with the questionnaire, road tests have been
performed and on basis of the severity of the errors committed by drivers during the test,
their driving ability has been assessed.
The evaluation obtained by drivers with the questionnaire have been compared with
that obtained in the road tests through the Kendall tau test. This test proposed by Sir
Maurice Kendall (1907-1983) in 1938, allows assessment of two sets of ranks that can be
ordinal.
Kendall's tau test type b (τb) and c (τc) have been applied, they calculate the
correlation between two sets of measures, taking into account the effect of tied ranks, and
Kendall’s tau c test also considers the effect due to the large number of measures.
The null hypothesis of the test is that there is no correlation between the two series of
data, differently from usual statistical tests, this test works better with a few objects, also
only 4 or 5, and it is not necessary that the data have a Gaussian or Student distribution.

98
The result of the test is the Kendall’s correlation coefficient and it can vary from -1,
for an exact inverse correlation, to\ +1, for a positive correlation, for this coefficient a level
of significance is measured.
The test has been applied to results obtained for the whole sample (31 drivers) and
separately for men (26 drivers) and for women (5 drivers) tested.
The Kendall’s correlation coefficients and significance levels associated with them are
shown in the following table.
Table 10 Kendall’s tau correlation coefficients for whole the sample, men and women
Kendall's tau c Correlation Coefficient Significance
Sample 0,277 0,044
Man 0,257 0,177
Woman 0,720 0,009
Analyzing the data for the entire sample, the results of the tests in the table show
that, the results obtained in the driving tests are poorly correlated with the scores obtained
by the questionnaire, because the correlation coefficient amounts to 0.277, and its
significance level is high, equal to 95.6%.
Considering the men, the correlation coefficient has a lower value (0.257), this
coefficient is not very significant (0.177).
As regards the women included in test, the correlation coefficient is 0.720 and it
shows a good level of correlation between driving performance and the result obtained in the
questionnaire; the significance level is high (0.009).
This analysis shows that only for women the level of driving ability estimated by the
questionnaire reflects their real driving ability.
This result may be due to the greater capacity to self-evaluate that women have,
they sometimes tend to underestimate their abilities, in fact they do not renew their licence
when they are still able to drive safely, and in the questionnaire there are many questions
that require self-evaluation, both in general and in relation to their physical and cognitive
abilities.
In order to analyse the differences between the results obtained in the two groups
categorized by gender, the correlation between the scores obtained in the road test and in the
various items of the questionnaire has been measured. The results are reported in the
following table.

99
Table 11 Results of Kendall’s Tau test
Variables
considered
Road test
evaluation Road test
evaluation Road test
evaluation Road test
evaluation Road test
evaluation Road test
evaluation Road test
evaluation
Item 1 Item 2 Item 3 Item 4 Item 5 Item 6 Item 7
Sam
ple
(3
1)
Kendall's tau c
Correlation
Coefficient 0,122 0,169 0,144 0,225 0,108 0,233 -0,140
Significance 0,411 0,208 0,292 0,152 0,639 0,117 0,287
Men
(2
6) Kendall's tau c
Correlation
Coefficient 0,110 0,158 0,158 0,130 -0,071 0,142 -0,580
Significance 0,527 0,301 0,318 0,394 0,300 0,289 0,701
Wo
men
(5
) Kendall's tau c
Correlation
Coefficient 0,320 0,320 0,120 0,640 0,640 0,640 -0,480
Significance 0,232 0,500 0,709 0,136 0,136 0,136 0,025
The analysis of the correlation coefficients related to item 1 confirms what
previously said: the women have a greater ability to self-assessment (0.320) than for men
(0.110), but for both the correlation is low, as well as for the entire sample (0,122).
Similar results there have been for the second item which is on self-assessment of physical
and mental abilities in relation to driving; correlation coefficient is 0.169 for the whole
sample, it is 0,158 for men and it is 0,320 for women.
Item 3 is related to diseases that affect the driver, the correlation is reduced in all
cases, but it is slightly higher for men (0.158) than for women (0.120), the value for the
entire sample is 0.144.
Item 4 estimates the reduction of driving ability due to health conditions, this
variable is correlated with the assessment obtained in the road test for women (0.64), but
not for men (0,130) and for the entire sample (0.225). This shows that women have a greater
ability to self-evaluate the reduction of their driving skills on the basis of diseases.
The fifth item is relative to abstention from driving for disease in the last year, this variable
is related to the real driving skills for women (0,640) and for men has a low negative value
(-0.071). For the whole sample the coefficient is 0.108.
Item 6 is about the prediction of the driving ability in the next two years, even in this
case, the variable is correlated for women (0,640) and not for men (0.142) and for the entire
sample (0,233). The results of these tests show a greater capacity to self-assess their future
driving skills for woman, compared to their peers of the other gender.

100
The item 7, which is about the driving activity, is negatively correlated with the
ability to driving, for men (-0.580) was more closely related than for women (-0.480), the
value obtained for the whole sample is (-0.140).
5.2.10. Influence of the familiarity with the route on driving performance
During the survey were asked to drivers what is their level of familiarity with the
areas in which the tests were performed which are: Metrocentre, Dunston and Whickham.
Drivers have expressed a level of familiarity by a judgment that ranges from 1 (first time in
the area) to 5 (very familiar) for the three areas crossed.
In all three cases the judgment expressed varied between 1 and 5, the average level
of familiarity is similar for the three areas, it amounts to 3.03 (SD = 1.33) for Metrocentre,
2.71 (SD = 1.3 ) for Dunston and 2.74 (SD = 1.34) for Whickham.
To check if driving performance were influenced by the level of familiarity with the
area, a Kendall'tau test was performed. The test results are shown in the following table.
Table 12 Results of Kendall’s Tau test
Variables considered
Road test
evaluation
Road test
evaluation
Road test
evaluation
Metrocentre Dunston Whickham
Sam
ple
(31)
Kendall's tau c
Correlation Coefficient 0,253 0,144 0,164
Significance 0,26 0,222 0,191
Men
(2
6) Kendall's tau c
Correlation Coefficient 0,225 0,103 0,138
Significance 0,092 0,436 0,332
Wom
en (
5) Kendall's tau c
Correlation Coefficient 0,24 0,24 0,24
Significance 0,443 0,543 0,443
Test results show that in all three cases driving performance are not affected by the
level of familiarity with the area, in fact considering the entire sample, the correlation
coefficient between the driving performance and the level of familiarity with 'Metrocentre

101
area is 0.253, with Dunston is 0.144 and for Whickham is 0.164.
Even if we consider separately the two genders, the result is the same, in fact the correlation
coefficient Kendall is always smaller than 0.24. For this it can be assumed that the results
obtained in the road tests are not affected by familiarity with the areas crossed during
testing.

102
6. EXPERIMENT 2: DRIVING SIMULATOR TESTS
6.1.Validation of the questionnaire through driving simulator tests
In order to assess the ability of Driving Ability index to evaluate driving ability in
older drivers, the results obtained by the questionnaire were compared to the results obtained
in the driving simulator.
These tests were conducted as part of the SIDE project (Social Inclusion through the
Digital Economy), by five researchers, in the group Torg from Newcastle University and a
researcher of Monash University (Australia).
In this study the effect of the device "Intelligent Speed Adaptation" (ISA) for
controlling the driving speed of the vehicle, for elderly drivers, was tested (Guo, 2014). The
elements considered for the evaluation of the driving performance were the ability to control
the speed and to maintain the correct position into the lane.
In this study the performance of the drivers have been evaluated, without ISA device
for controlling the speed and with the device with three different levels of action, but for the
purposes of this thesis only the performance without the ISA device have been considered,
so in normal driving conditions.
6.2.Driving simulator
The driving simulator used have been developed for research purposes by the group
Torg from Newcastle University. The simulator consists of a cabin made of aluminium,
equipped with five LCD displays with high resolution, they are large 50 inch and they are
placed in a circular way around the driving position. In addition, the typical car noise is
reproduced, so as to create an immersive driving environment.
The simulator is equipped with control devices typical of a car, as the steering wheel
with force feedback, the hand brake lever and there are the pedals of the clutch, accelerator
and brake; it is equipped with adjustable seat and safety belt.
Through the three screens placed in front position the three mirrors: left, right and
rear view mirror are displayed. The simulator was set to collect data every 0,1 s.

103
Figure 71 Driving simulator
Figure 72 Cockpit of the driving simulator

104
6.3.Scenario used
Through the simulator the circular path represented in the following figure has been
displayed to drivers, the path consist of seven road segment of different length, for a total
length of 2.35 miles (3.78 km).
Figure 73 Circular path displayed during the test – Source: Guo,2014
6.4.Sending the questionnaires
In order to send and fill in the questionnaire DAI easily, this has been built by a
software, which made it possible to send them via e-mail. The questionnaire was sent to 16
drivers who were tested with driving simulator (5 under the age of 60 years and 13 older)
among these 7 drivers have completed the questionnaire (2 under the age of 60 years and 5
older). Five elderly drivers included in the road tests have been tested with the simulator and
they have completed the questionnaire during the road test.
So twelve drivers (2 under the age of 60 years and 10 older) have been included in
this step of the study.
6.5.The sample tested
To be eligible for the study, the participants were required to be experienced drivers,
holding a license for at least 10 years.

105
Tested sample includes seven men and three women over the age of 60 years and
two young drivers: a man and a woman.
The average age found in the sample is 71.7 years (SD = 7.15), and it varies from a
minimum of 61 to a maximum of 86 years.
6.6.Data obtained through the questionnaire DAI: Frequency Analysis
In this analysis only drivers over sixty years have been included.
The majority of drivers included in the tests (6 drivers) drive very often (three or
more times a week) and four drivers drive often, one or two times a week.
Five drivers drive sometimes with other people; three drivers travel with other people most
of the time and two drivers drive occasionally with other people.
All drivers usually are drivers and not passengers when they travel by car.
Only one driver is still working and nine are retired.
Regarding the education of drivers, only one has not qualification, one has achieved
GCSE / O level and equivalents, three have achieved A levels and equivalents and five have
achieved a university degree.
None of the drivers was smoking at the time of the survey, eight have never smoked
and two are ex smokers.
With regard to alcohol consumption, four drivers drink monthly or less, three drink 2
or 3 times a week, two drivers drink 4 or more times a month and one driver drinks from 2
to 4 times a month; seven drivers consume 1 or 2 units of alcohol usually when they drink,
one driver drinks 3 or 4 units, one driver drinks 5 or 6 units and another driver drinks from 7
to 9 units.
Drivers have expressed the satisfaction level on the quality of their sleep with a scale
that ranges from 1 to 5. Three drivers are very satisfied and they evaluated their sleep as 5,
two have reported a satisfaction level of 4, three have reported a satisfaction level of 3, and
one driver has declared a satisfaction level of 2 and one driver assessed the satisfaction level
as 1. The average level in the sample amounts to 3.5.
The drivers drive on average from 49.6 years (SD = 8.63) and the years of driving
range from a minimum of 31 to a maximum of 62 years. Eight of them have never stopped
driving for more than three months since they obtained the licence and one driver has
stopped driving for 15 weeks due to health problems (broken femur) and one driver stopped
to drive for one year for volunteering.

106
The majority of drivers (7 drivers) travel daily from 5 to 25 miles, two travel less
than 5 miles and one driver travels more than 25 miles.
Three drivers travel annually from 2001 to 5000 miles, four drivers travel from 5001
to 8000 miles and three driver travel from 8001 to 10,000 miles per year. None of them
travels less than 2000 miles or more than 10000 per year.
46.5% of the travel take place in urban areas and 43.05% take place in suburban
area.
The vehicles used by drivers have on average 5.4 years (SD = 4.12) and the older vehicle
dates back to 2001 and the most recent has been purchased in this year.
The drivers drive mostly cars with an engine of small size, four of them have a
vehicle with an engine sized between 1.0 and 1.3 L; three drivers drive vehicles with a
cylinder capacity lower than 1.0 L, two drivers drive a vehicle with an engine sized between
1.7 and 1.9 L, and only one driver drive a vehicle with the engine bigger than 2.0 L.
Only one of the drivers tested achieved the qualification "Advanced Motorist test".
7 of the drivers surveyed have driven a motorcycle; 9 have driven a van, a mobile home or
a minibus, two have driven a lorry or a bus, 7 drivers have driven a sports car and only one
has driven a special vehicle like an ambulance or fire engine car.
In item 1 drivers had to rate their driving ability compared to their best time of life,
the average value for this answer was 7.83 (SD = 0.83).
Five drivers assessed their skills as 8, two drivers evaluated their skills as 7 and other
two drivers assessed their skills as 9, but only one driver has assessed its ability as 6.
The great majority of drivers assessed their physical condition in relation to driving
as quite good (5 drivers), three judged their abilities as very good and two have rated them
as medium.
Regarding mental abilities required for driving, five drivers have assessed them as
quite good four drivers evaluated their skills as very good and only one driver has average
mental skills.
Item 3 relative to medical conditions showed that 8 drivers have musculoskeletal
diseases, the driver who has the most number of diseases of this type has 4 diseases and the
most common disease in this category is arthritis that affects two drivers.
Three drivers have cardiovascular diseases and each of them has only one pathology,
the most frequent is hypertension that affects two drivers.
None driver have respiratory diseases, skin complains, blood problems or other
illnesses.

107
Only one driver has sensory impairments at the sight.
Two drivers have digestive problems and they have gastric or duodenal ulcer,
gallstones or liver and gastritis or duodenitis, irritable bowel syndrome.
Two drivers have genitourinary problems like inflammation of the ovaries and
urinary infections.
A driver has a benign tumour. Two drivers have endocrine or metabolic diseases like
diabetes and thyroid problems.
None of the young drivers tested has health problems.
With respect to item 4, the majority of drivers say they never have any trouble
driving due to their health, only one driver need to slow down and change his driving style
because of health problems.
None of the drivers surveyed in the last year has given up driving for health reasons,
and all drivers predict that they will surely continue to drive in the next two years.
Six drivers drive their vehicle very often (three or more times a week), four drivers
drive often (once or twice a week).
The vast majority of drivers have committed a driving offense (9 out of 10 drivers),
eight of them have committed an offence more than one year ago; one driver committed an
offence within the last 12 months and one driver has never committed an offense.
Nine drivers have never been involved in a road accident in the last five years and
one driver has been involved in an accident, which caused damage to property only.
All drivers stated that they always wear the seat belt while driving and none driver
assumed therapies that affect the alertness.
Among the drivers tested four have fallen asleep while driving.
All drivers surveyed said they use the rear view mirror every few minutes.
Only two drivers have said that they often see road signs at the last minute.
None driver has given up driving at night.
With regard to driving at night, five drivers are not worried when merging into
traffic, four drivers are sometimes worried; only one is often worried when merging into
traffic.
Seven of the drivers surveyed said that they are never nervous or stressed for night
driving, three drivers are sometimes nervous.
As regards the question "When driving at night do you feel that the road in not
sufficiently lit?", five drivers said that they "never" feel the street poorly lit; three drivers

108
answered "sometimes," one driver said "often" and one driver said that he "always " feels
the street not sufficiently lit.
Six drivers have no difficulty to perceive the road markings at night and four drivers
often experience difficulties in perceiving road markings.
Drivers in prevalence (5 drivers) do not need to slow down to read the street names
or road signs during the night, four drivers sometimes have to slow down and one driver
always needs to slow down to read street names.
6.7.Calculation of the Driving Ability Index for drivers tested in simulator
Based on the responses to the questionnaire, the score for each driver was calculated
and the classification in the DAI categories has been obtained.
The results showed that nine drivers have good driving skills and three drivers have
excellent driving skills. These results are showed in the figure below.
Figure 74 DAI score for the drivers tested in the driving simulator
6.8.Output data of the driving simulator
In the study performed by the group TORG with the driving simulator, the
performance of drivers have been evaluated considering their ability to respect the speed
limit and their ability to maintain the correct position within the lane.
In order to evaluate lane - keeping performance, the position of the car inside the
lane has been considered, a ‘0’ value of the lane position represents the centre of the lane. A

109
negative/positive value indicates that the car was on the left/right side of the central line,
respectively. The lane width was 3 m and the vehicle width was 1.6 m. Hence, any value
larger than 0.7 (1.5–0.8) or smaller than −0.7 (−1.5 + 0.8) means that the vehicle was either
over the lane or on the pavement.
To translate the lane-position data into lane-keeping performance a scale of 1– 4 was
applied for the ranking with ‘1’ being the poorest performance and ‘4’ being the best
performance.
To translate the speed data into performance, the same ranking method was applied;
each speed - data greater than 10% of the speed limit has been considered speeding.
Also in this case, on basis of the speed, the scale of 1–4 was adopted for ranking with
‘1’ being the poorest performance and ‘4’ being the best performance.
The results obtained by the drivers are shown in the following table.
Table 13 Output data of the driving simulator
Driver ID Simulator
test Lane Speed
Mean driving performances in
simulator test
1 4 2 3,00
2 2 4 3,00
3 3 1 2,00
4 3 1 2,00
5 1 1 1,00
6 3 3 3,00
7 3 1 2,00
8 4 3 3,50
9 3 1 2,00
10 1 1 1,00
11 1 2 1,50
12 2 1 1,50

110
6.9.Comparison of results obtained with questionnaires and in the simulator
Table 14 Results of Kendall’s Tau b test
Variables considered
Driving ability
score
(questionnaire)
Driving ability
score
(questionnaire)-
Driving ability
score
(questionnaire)
Lane Speed Driving
simulator
performances
Sa
mp
le
(12
)
Kendall's tau b Correlation
Coefficient 0,000 0,054 -0,048
Significance 0,500 0,425 0,431
Men
(8)
Kendall's tau b Correlation
Coefficient -0,301 -0,408 -0,462
Significance 0,194 0,126 0,087
Wom
en
(4)
Kendall's tau b Correlation
Coefficient 0,577 0,894 1.000
Significance 0,159 0,051 0,00
The test results shown in the table above reveals that by analysing the data for the
entire sample, the average result obtained in the simulator test is poorly correlated with the
score obtained through the questionnaire and the negative sign indicates that they have
opposite trends, the correlation coefficient amounts to -0.048 and its significance level is
low (0.431). The DAI score is not correlated with the ability to maintain the position within
the lane (the coefficient is 0) and with the ability to control the speed (the coefficient is
0.054), both tests are not significant (the significance is 0.500 and 0.425 respectively).
Considering only the men, the correlation coefficient between the performances in
the simulator and the DAI score is lower than for the whole sample and it amounts to
-0.462, this coefficient is not significant level (0.087).
Similar results were obtained comparing the ability to maintain the position in the
lane, and the ability to control the speed (-0.301 and -0.408); also in these tests the level of
significance is not good.
For the women included in the tests, the DAI score and the overall score obtained in
the simulator have the same trend, as the coefficient shows, that amounts to 1 and the test

111
result is very significant. Also the coefficient of 0.894 shows a good level of correlation
between the ability to control the speed and the result obtained in the questionnaire and the
coefficient is significant (0.051).
There is high correlation between the ability to control the position in the lane and
the DAI score (coefficient of 0.577) and the test is not particularly significant.
As in the previous experiment, these analyses showed that only for women the
driving ability estimated by the questionnaire reflects their driving skills measured by the
driving simulator.
To know the reason for this difference between the two genders, the correlation
between the different items and the driving performance measured with the simulator has
been evaluated through Kendall's tau b test. The test results are shown in the following table.
Table 15 Results of Kendall’s Tau b test
Variables considered Lane Speed Driving
simulator
performances
Item
1
Sam
ple
Kendall's tau b Correlation Coefficient 0,726 0,326 0,72
Significance 0,00 0,07 0,00
Men
Kendall's tau b Correlation Coefficient 0,759 0,229 0,728
Significance 0,00 0,433 0,00
Wom
en
Kendall's tau b Correlation Coefficient 0,577 0,894 1
Significance 0,157 0 0,00
Item
2
Sam
ple
Kendall's tau b Correlation Coefficient 0,397 0,045 0,281
Significance 0.088 0,852 0,292
Men
Kendall's tau b Correlation Coefficient 0,295 -0,167 0,141
Significance 0,221 0,552 0,657
Wo
men
Kendall's tau b Correlation Coefficient 0,33 0,516 0,577
Significance 0,317 0,157 0,157
Item
3
Sam
ple
Kendall's tau b Correlation Coefficient -0,184 -0,24 -0,266
Significance 0,26 0,346 0,087

112
Men
Kendall's tau b Correlation Coefficient -0,286 -0,416 -0,431
Significance 0,149 0,142 0,005
Wo
men
Kendall's tau b Correlation Coefficient -0,236 0,183 0
Significance 0,564 0,739 1
Item
4
Sam
ple
Kendall's tau b Correlation Coefficient -0,422 -0,368 -0,447
Significance 0,253 0,27 0,251
Men
Kendall's tau b Correlation Coefficient -0,552 -0,445 -0,529
Significance 0,212 0,258 0,212
Wom
en Kendall's tau b Correlation Coefficient * * *
Significance * * *
Item
5
Sam
ple
Kendall's tau b Correlation Coefficient -0,127 0,23 0,000
Significance 0,405 0,283 1,000
Men
Kendall's tau b Correlation Coefficient * * *
Significance * * *
Wom
en Kendall's tau b Correlation Coefficient 0,333 0,516 0,577
Significance 0,317 0,157 0,157
Item
6
Sam
ple
Kendall's tau b Correlation Coefficient * * *
Significance * * *
Men
Kendall's tau b Correlation Coefficient * * *
Significance * * *
Wo
men
Kendall's tau b Correlation Coefficient * * *
Significance * * *
Item
7
Sam
ple
Kendall's tau b Correlation Coefficient 0,416 -0,31 0,222
Significance 0,07 0,13 0,519

113
Men
Kendall's tau b Correlation Coefficient 0,765 -0,27 0,367
Significance 0 0,281 0,046
Wo
men
Kendall's tau b Correlation Coefficient -0,333 -0,516 -0,577
Significance 0,317 0,13 0,157
* It was not possible to calculate the test because all respondents gave the same
answer.
The first item is about the self-assessment of driving ability compared with the best
period of life. For men this is well correlated with the ability to maintain the position in the
lane (0.759) but not with the ability to control the vehicle’s speed (0.229), it is however
correlated with the overall score obtained in the simulator (speed and lane) (0,728), instead
for women, the ability to maintain the position in the lane (0.577) is more related with item
1 than the ability to control the speed (0,894), and the correlation is perfect (coefficient is 1)
with the overall scores obtained on the simulator.
The second item refers to self-assessment of physical and cognitive abilities, this is
poorly correlated with the ability to maintain the position in the lane for both men (0,295)
and women (0.33). Item 2 is poorly correlated with the ability to maintain the speed for
women (0,516) and it has a negative correlation for men (-0, 167), considering the overall
score obtained on the simulator, it has a higher correlation for women (0.577) than for men
(0,141).
Item 3 is about the diseases that affect the driver, this is negatively correlated with
the ability to maintain the position in the lane for both men (-0.286) and women (-0.236).
Item 3 is negatively correlated with the ability to control the speed for men (-0.416) and it is
positive but poorly correlated (0.183) for women.
The fourth item is relative to the reduction in the driving ability due to health
conditions, this has a negative correlation with the ability to maintain position in the lane (-
0.552) and with the ability to control the speed (-0.445) for men, however it was not
possible to estimate the value for women because all four women involved in the survey
gave the same answer.
Item 5 is relative to abstain from driving due to diseases, for women this is poorly
correlated with the ability to maintain the position in the lane (0,333) and to control the
speed (0.516), however it was not possible to calculate correlation coefficients for men.
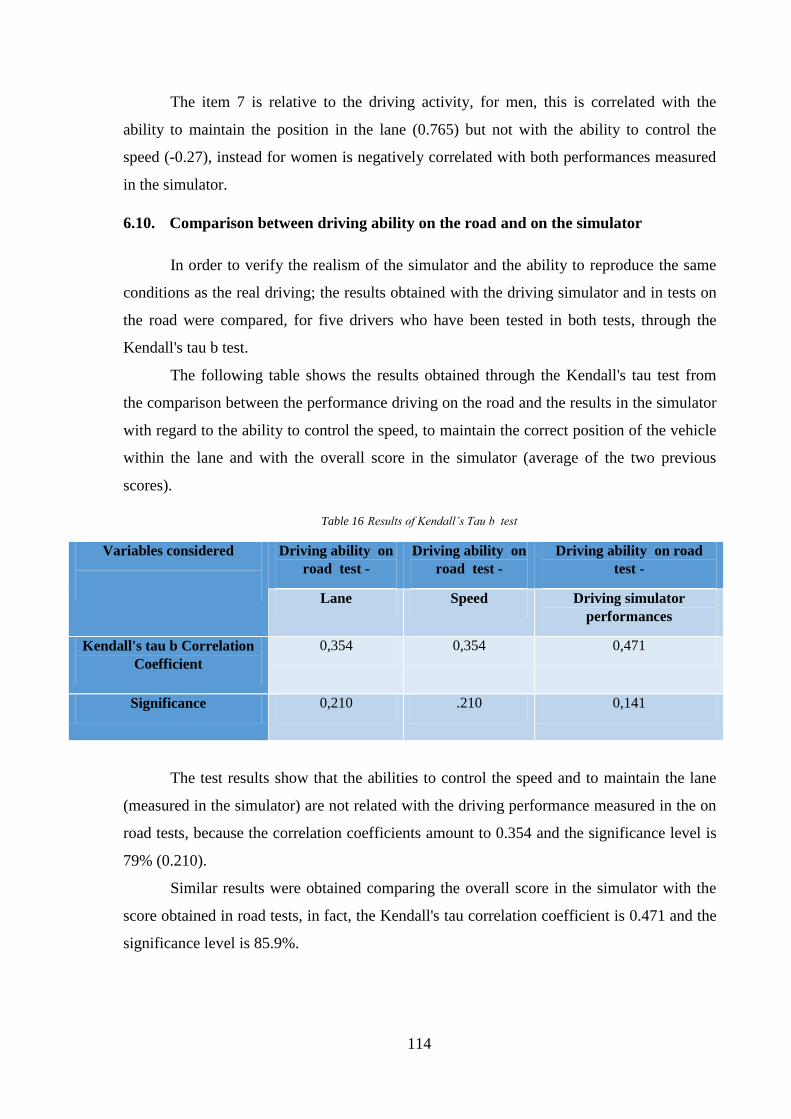
114
The item 7 is relative to the driving activity, for men, this is correlated with the
ability to maintain the position in the lane (0.765) but not with the ability to control the
speed (-0.27), instead for women is negatively correlated with both performances measured
in the simulator.
6.10. Comparison between driving ability on the road and on the simulator
In order to verify the realism of the simulator and the ability to reproduce the same
conditions as the real driving; the results obtained with the driving simulator and in tests on
the road were compared, for five drivers who have been tested in both tests, through the
Kendall's tau b test.
The following table shows the results obtained through the Kendall's tau test from
the comparison between the performance driving on the road and the results in the simulator
with regard to the ability to control the speed, to maintain the correct position of the vehicle
within the lane and with the overall score in the simulator (average of the two previous
scores).
Table 16 Results of Kendall’s Tau b test
Variables considered
Driving ability on
road test -
Driving ability on
road test -
Driving ability on road
test -
Lane Speed Driving simulator
performances
Kendall's tau b Correlation
Coefficient
0,354 0,354 0,471
Significance 0,210 .210 0,141
The test results show that the abilities to control the speed and to maintain the lane
(measured in the simulator) are not related with the driving performance measured in the on
road tests, because the correlation coefficients amount to 0.354 and the significance level is
79% (0.210).
Similar results were obtained comparing the overall score in the simulator with the
score obtained in road tests, in fact, the Kendall's tau correlation coefficient is 0.471 and the
significance level is 85.9%.

115
This may be because in the tests in the simulator only two aspects of driving (keep
the position in the lane and control the speed) were considered. For this reason tests done in
the simulator, were not considered in the subsequent phases of the research.
7. DATA ANALYSIS
7.1. Variables
With the aim to verify the significance of the variables considered in the
questionnaire on the ability to drive and to estimate the weight of each of them, linear
regression techniques have been used.
In the questionnaire, 50 variables were considered, some of which were not included
in the analysis because all drivers have given the same answer, the questions are: "Are you
usually the main driver or the passenger when travelling with others?" in which all drivers
answered "Main driver".
The questions related to diseases affecting drivers are 11 but the variables
"respiratory diseases", "blood diseases" and "other diseases diagnosed by a doctor," have not
been included in the analysis, and it was introduced the variable “total number of diseases”.
Also the question “How often do you wear your seat belt when driving?” has not
been considered because all drivers answered "always", the question “Are you undergoing
treatment that affects your alertness?”, has not been considered because none driver takes
treatments that affect the ability to drive, as well as the question “How often do you use your
rear view mirror?” because all or drivers answered "every few minutes" and only one driver
responded "Only before making Particular manoeuvres", instead by analysing the data
obtained from the eye tracker it was found that some drivers do not use mirrors, although
they have said they always use them.
Some variables have been treated as continuous variables, such as: “Age”,” Years
with full driving licence”, “How many miles you travel on a typical day ?”, “Year of
manufacture of your car”, “How do you rate your current driving skills compared to the best
time of life ?”, "Muscular-skeletal complaints", "cardiovascular diseases", "Mental, nervous
and sensory disorders", "digestive disorders", "genitourinary disorders", "skin complaints",
"Tumours", "endocrine and metabolic disorders", "number of illnesses."
Other variables were considered ordinal variables such as “how often do you have a drink
containing alcohol”, “How many units of alcohol do you drink on a typical day when you

116
are drinking?”, “Approximately how many miles do you drive in a typical year?”, “What
portion of your annual mileage is urban driving”, “What portion of your annual mileage is
interurban driving”, “How often do you drive ?”, “How often do you travel with other
people?”, “What is the engine size of your everyday vehicle?”, “How do you rate your
current driving ability in relation to your physical conditions”, “How do you rate your
current driving ability in relation to your mental capability?”, “Do your current health
conditions make it difficult to drive?”, “Do you believe, given your current health
conditions, that you will be able to continue driving over the next two years?; and the
questions about driving at night: “Do you worry about merging into traffic?”, “Do you feel
stressed or get nervous?”, “Do you feel that the roads are not sufficiently lit?”, “Do you have
difficulty seeing or understanding road markings?”, “Do you have to slow down to read the
road signs or street names?”.
Other variables were coded as dummies, "gender", "Occupation", "smoking", "Do
you have any driving qualifications other than the standard DSA driving test?", "Have you
been involved in any road traffic accidents / collisions in the past 5 years? "," Have you ever
stopped driving for longer than 3 months since you got your full driving licence?”, "Have
you had to stop driving due to health problems during the past 12 months?", "Have you ever
fallen asleep behind the wheel?", "Do you see often the road signs at the last minute?",
"Have you given up driving at night ?”.
The answers to the question "have you ever driven the following vehicles?"
were coded as five dummies.
So the variables included in the analysis were 50 and 31 drivers were tested, for this
reason the survey has produced an indeterminate matrix, so to solve the problem only some
variables have been considered and a factor analysis was performed.
7.2. Factorial analysis
With the aim to identify the latent variables (factors), able to explain the links, the
interrelationships and dependencies between the statistical variables observed,
a factor analysis was performed by the method of principal components.
In the analysis the variables considered in the calculation of the DAI and the variables age,
occupation and number of musculoskeletal diseases.

117
The variables included were the following: age, self-assessment of driving abilities
compared to the best time of life (item 1), the self-assessment of driving abilities in relation
to the physical and mental skills, the total number of diseases, the number of
musculoskeletal diseases, the evaluation of the reduction of their driving skills because of
diseases, abstaining from driving because of the diseases, prediction of their driving abilities
in the following two years, the frequency of driving, the elapsed time from the last offense,
involvement in accidents, the occurrence of falling asleep, identification of signals at the last
minute, abstaining from driving at night, nervousness during night driving, road perception
poorly lit, difficulties in the perception of the delimitations of the road in night driving, need
to slow down to read the signs during night driving, occupation.
7.2.1. Preliminary tests for Factorial analysis
Because one of objectives of the analysis is to obtain factors that explain the
correlations between the variables, these should be interconnected.
The presence of correlation can be tested by the Bartlett test of sphericity
and with the Kaiser-Meyer-Olkin test (KMO).
The Bartlett sphericity test is applied to the correlation matrix, and the null
hypothesis is that the matrix is equal to an identity matrix H0 : R = I .
p = number of variables;
n = number of individuals;
|R| = determinant of the correlation matrix;
The test result is 453,852 and it as a Chi- squared distribution, with 210 degrees of
freedom (
); so the p – value is 0,000, it is possible to reject the null hypothesis, that the
correlation matrix is an identity matrix.
Table 17 Bartlett's Test
Bartlett's Test of
Sphericity
Approx. Chi-Square 453,852
degrees of freedom 210
Significance 0,000

118
The Kaiser-Meyer-Olkin test (KMO) allows comparing the greatness of the observed
correlations than the partial correlations.
rij = correlations;
pij = partial correlations.
Table 18 KMO Test
Test Result
Kaiser-Meyer-Olkin Measure of Sampling Adequacy. 0,526
The result can ranges from 0 to 1 and Kaiser in 1974 suggested that the results of the
KMO test lower than 0.5 are not acceptable.
The test results suggest performing a factorial analysis.
7.2.2. Communalities
The communalities are the sum of the squares of the correlation coefficients between
a variable and the extracted components.
Table 19 Communalities
Communalities
Initial Extraction
How do you rate your current driving skills? 1,000 0,774
How do you rate your current driving ability in relation to your physical
conditions?
1,000 0,847
How do you rate your current driving ability in relation to your mental
capability?
1,000 0,909
Musculoskeletal complains 1,000 0,728
Total number of Diseases 1,000 0,760
Do your current health conditions make it difficult to drive? 1,000 0,824
Have you had to stop driving due to health problems during the past 12
months?
1,000 0,855
Do you believe, given your current health conditions, that you will be able
to continue driving over the next two years?
1,000 0,933

119
How often do you drive? 1,000 0,792
Have you ever been caught committing a driving offence? 1,000 0,716
Have you been involved in any road traffic accidents/collisions in the past
5 years?
1,000 0,650
Have you ever fallen asleep behind the wheel? 1,000 0,442
Do you often see road signs at the last minute? 1,000 0,838
Have you given up driving at night? 1,000 0,843
When driving at night do you worry about merging into traffic? 1,000 0,595
When driving at night do you feel stressed or nervous? 1,000 0,912
When driving at night do you feel that the road is not sufficiently lit 1,000 0,728
When driving at night do you have difficulty seeing or understanding
road markings?
1,000 0,806
Do you have to slow down to read the road signs or street names? 1,000 0,716
Occupation 1,000 0,501
Age 1,000 0,729
In the following table is shown the component matrix obtained without the rotation
of the factorial axes, the variables have been coloured on basis of the factor in which they
have the highest weight.
Table 20 Matrix of components without rotation
Component
1 2 3 4 5 6
Age -0,514 -0,437 -0,341 0,249 -0,306 -0,03
How do you rate your current driving skills? 0,54 0,482 -0,024 0,351 -0,238 0,264
How do you rate your current driving ability in relation to your physical
conditions? 0,59 0,559 -0,305 0,302 -0,042 -0,029
How do you rate your current driving ability in relation to your mental
capability? 0,61 0,514 -0,106 0,503 -0,062 -0,072
musculoskeletal complains -0,068 -0,653 0,276 0,451 0,114 0,071
Total number of Diseases -0,095 -0,603 0,263 0,542 0,023 0,153
Do your current health conditions make it difficult to drive? 0,837 0,203 0,007 0,13 -0,034 0,253
Have you had to stop driving due to health problems during the past 12
months? 0,85 -0,249 -0,112 -0,169 -0,071 -0,158
Do you believe, given your current health conditions, that you will be able
to continue driving over the next two years? 0,726 0,165 0,549 0,074 -0,258 0,074

120
How often do you drive? -0,062 0,207 0,064 0,467 0,305 -0,656
Have you ever been caught committing a driving offence? -0,347 -0,249 -0,667 0,164 -0,092 -0,232
Have you been involved in any road traffic accidents/collisions in the past 5
years? 0,244 0,089 0,087 -0,129 0,732 -0,152
Have you ever fallen asleep behind the wheel? 0,01 0,546 -0,125 -0,139 0,322 -0,074
Do you often see road signs at the last minute? 0,331 -0,15 -0,468 0,005 0,411 0,564
Have you given up driving at night? 0,668 -0,204 0,438 -0,297 -0,16 -0,221
When driving at night do you worry about merging into traffic? -0,712 0,21 0,128 -0,125 0,046 0,097
When driving at night do you feel stressed or nervous? -0,812 0,366 0,237 0,222 -0,11 -0,036
When driving at night do you feel that the road is not sufficiently lit -0,701 0,353 0,203 -0,023 0,056 0,258
When driving at night do you have difficulty seeing or understanding road
markings? -0,845 0,222 0,112 0,145 0,031 0,096
Do you have to slow down to read the road signs or street names? -0,704 0,447 0,113 0,001 -0,059 0,067
Occupation 0,12 -0,208 0,257 0,264 0,536 0,145
7.2.3. Rotation of the factorial axes
By rotation the weights of some factors that were already low in the previous steps
are reduced and the weights that were high in the first stage increase.
Factors rotated were extracted with techniques Varimax, Oblimin, Promax and
Quadrimax.
Below the matrices of the components obtained with the different rotation methods
are shown and the variables have been coloured on basis of the factor in which they have the
highest weight.
Varimax rotation is an orthogonal rotation of the factor axes, that allows
maximising the variance of the squared loadings of a factor on all the variables in a factor
matrix, which has the effect of differentiating the original variables by extracted factor.
The matrix of components is shown below.

121
Table 21 Matrix of components - Rotation Varimax
Component
1 2 3 4 5 6
Age 0,158 -0,227 -0,604 0,337 -0,416 0,012
How do you rate your current driving skills? -0,095 0,82 0,243 -0,074 -0,113 -0,119
How do you rate your current driving ability in relation to your physical conditions? -0,241 0,827 -0,018 -0,307 0,089 0,05
How do you rate your current driving ability in relation to your mental capability? -0,21 0,897 0,091 -0,091 0,086 0,194
Muscular skeletal complains -0,077 -0,16 -0,04 0,83 0,065 0,049
Total number of Diseases -0,002 -0,059 -0,052 0,868 -0,023 0,012
Do your current health conditions make it difficult to drive? -0,485 0,63 0,354 -0,037 0,09 -0,239
Have you had to stop driving due to health problems during the past 12
months? -0,893 0,147 0,173 -0,07 0,007 -0,043
Do you believe, given your current health conditions, that you will be able to
continue driving over the next two years? -0,362 0,42 0,773 0,095 -0,119 0,072
How often do you drive? 0,08 0,209 -0,189 0,069 0,358 0,757
Have you ever been caught committing a driving offence? -0,022 -0,106 -0,817 0,006 -0,177 0,08
Have you been involved in any road traffic accidents/collisions in the past 5
years? -0,164 -0,057 0,118 -0,129 0,765 0,071
Have you ever fallen asleep behind the wheel? 0,184 0,188 0,004 -0,487 0,365 0,047
Do you often see road signs at the last minute? -0,265 0,209 -0,255 0,057 0,389 -0,711
Have you given up driving at night? -0,649 -0,092 0,62 -0,002 -0,076 0,155
When driving at night do you worry about merging into traffic? 0,699 -0,301 -0,051 -0,112 -0,026 0,003
When driving at night do you feel stressed or nervous? 0,892 -0,067 -0,061 0,021 -0,153 0,29
When driving at night do you feel that the road is not sufficiently lit 0,834 -0,137 0,046 -0,078 0,002 -0,076
When driving at night do you have difficulty seeing or understanding road
markings? 0,853 -0,181 -0,178 0,057 -0,046 0,091
Do you have to slow down to read the road signs or street names? 0,806 -0,076 -0,041 -0,198 -0,099 0,099
Occupation -0,022 0,018 0,125 0,437 0,539 -0,059

122
Oblimin rotation is a non-orthogonal (oblique) solution, in which the factors are
allowed to be correlated. This usually results in higher eigenvalues but diminished
interpretability of the factors.
Table 22 Matrix of components Rotation Oblimin
Component
1 2 3 4 5 6
Age -0,241 -0,358 -0,651 -0,354 -0,461 -0,032
How do you rate your current driving skills? 0,212 0,143 0,304 0,836 -0,051 0,122
How do you rate your current driving ability in relation to your physical
conditions? 0,319 0,357 0,072 0,879 0,162 -0,025
How do you rate your current driving ability in relation to your mental
capability? 0,311 0,154 0,173 0,931 0,156 -0,17
Muscular skeletal complains 0,087 -0,844 -0,062 -0,22 0,019 -0,033
Total number of Diseases 0,024 -0,869 -0,079 -0,142 -0,067 -0,006
Do your current health conditions make it difficult to drive? 0,597 0,069 0,451 0,73 0,15 0,287
Have you had to stop driving due to health problems during the past 12
months? 0,914 0,037 0,286 0,304 0,047 0,132
Do you believe, given your current health conditions, that you will be
able to continue driving over the next two years? 0,483 -0,055 0,828 0,513 -0,07 -0,043
How often do you drive? -0,089 -0,053 -0,182 0,192 0,368 -0,75
Have you ever been caught committing a driving offence? -0,082 -0,038 -0,818 -0,179 -0,198 -0,076
Have you been involved in any road traffic accidents/collisions in the
past 5 years? 0,179 0,109 0,155 0,042 0,772 -0,036
Have you ever fallen asleep behind the wheel? -0,172 0,506 0,017 0,224 0,393 -0,06
Do you often see road signs at the last minute? 0,296 -0,071 -0,195 0,246 0,395 0,746
Have you given up driving at night? 0,686 -0,021 0,679 0,056 -0,05 -0,095
When driving at night do you worry about merging into traffic? -0,735 0,125 -0,148 -0,399 -0,061 -0,075
When driving at night do you feel stressed or nervous? -0,907 0,025 -0,174 -0,222 -0,181 -0,382
When driving at night do you feel that the road is not sufficiently lit -0,834 0,114 -0,056 -0,253 -0,027 -0,01

123
When driving at night do you have difficulty seeing or understanding
road markings? -0,883 -0,028 -0,289 -0,333 -0,087 -0,176
Do you have to slow down to read the road signs or street names? -0,822 0,236 -0,135 -0,192 -0,117 -0,184
Occupation 0,07 -0,437 0,129 0,027 0,521 0,076
Promax rotation is an alternative non-orthogonal rotation method (oblique), which is
sometimes used for very large datasets.
Table 23 Matrix of components Rotation Promax
Component
1 2 3 4 5 6
Age 0,277 -0,395 -0,644 0,396 -0,434 0,057
How do you rate your current driving skills? -0,251 0,823 0,368 -0,154 0,009 -0,153
How do you rate your current driving ability in relation to your physical
conditions? -0,342 0,886 0,157 -0,365 0,236 -0,037
How do you rate your current driving ability in relation to your mental
capability? -0,339 0,926 0,258 -0,169 0,208 0,107
Muscularskeletal complains -0,073 -0,228 -0,076 0,842 -0,01 0,029
Total number of Diseases -0,015 -0,162 -0,091 0,87 -0,085 0,006
Do your current health conditions make it difficult to drive? -0,632 0,759 0,528 -0,089 0,206 -0,339
Have you had to stop driving due to health problems during the past 12
months? -0,918 0,353 0,395 -0,047 0,081 -0,188
Do you believe, given your current health conditions, that you will be
able to continue driving over the next two years? -0,528 0,514 0,886 0,021 -0,097 0,031
How often do you drive? 0,104 0,182 -0,171 0,041 0,323 0,706
Have you ever been caught committing a driving offence? 0,125 -0,192 -0,785 0,077 -0,14 0,062
Have you been involved in any road traffic accidents/collisions in the
past 5 years? -0,178 0,103 0,121 -0,137 0,747 -0,013
Have you ever fallen asleep behind the wheel? 0,162 0,244 -0,008 -0,516 0,401 0,041
Do you often see road signs at the last minute? -0,297 0,303 -0,192 0,076 0,497 -0,795
Have you given up driving at night? -0,703 0,085 0,742 -0,006 -0,099 0,083
When driving at night do you worry about merging into traffic? 0,738 -0,431 -0,246 -0,117 -0,102 0,134
When driving at night do you feel stressed or nervous? 0,907 -0,289 -0,263 -0,018 -0,237 0,444
When driving at night do you feel that the road is not sufficiently lit 0,825 -0,291 -0,167 -0,111 -0,063 0,071
When driving at night do you have difficulty seeing or understanding
road markings? 0,889 -0,383 -0,392 0,04 -0,124 0,233

124
Do you have to slow down to read the road signs or street names? 0,818 -0,239 -0,222 -0,229 -0,151 0,241
Occupation -0,073 0,056 0,087 0,416 0,5 -0,107
Quartimax rotation is an orthogonal rotation of the factor axes that minimizes the
number of factors needed to explain each variable.
The matrix of components is shown below.
Table 24 Matrix of components Rotation Quadrimax
Component
1 2 3 4 5 6
Age 0,212 -0,223 -0,594 0,341 -0,406 0,004
How do you rate your current driving skills? -0,161 0,813 0,231 -0,074 -0,124 -0,115
How do you rate your current driving ability in relation to your physical
conditions? -0,284 0,813 -0,04 -0,308 0,079 0,055
How do you rate your current driving ability in relation to your mental
capability? -0,262 0,885 0,07 -0,092 0,076 0,197
Muscular skeletal complains -0,074 -0,167 -0,041 0,828 0,067 0,05
Total number of Diseases -0,006 -0,062 -0,049 0,868 -0,021 0,01
Do your current health conditions make it difficult to drive? -0,553 0,599 0,321 -0,044 0,072 -0,221
Have you had to stop driving due to health problems during the past 12
months? -0,909 0,093 0,116 -0,082 -0,011 -0,01
Do you believe, given your current health conditions, that you will be
able to continue driving over the next two years? -0,43 0,399 0,745 0,089 -0,135 0,092
How often do you drive? 0,099 0,22 -0,188 0,072 0,366 0,748
Have you ever been caught committing a driving offence? 0,042 -0,11 -0,818 0,009 -0,168 0,074
Have you been involved in any road traffic accidents/collisions in the
past 5 years? -0,176 -0,06 0,114 -0,133 0,762 0,073
Have you ever fallen asleep behind the wheel? 0,173 0,203 0,016 -0,485 0,366 0,038
Do you often see road signs at the last minute? -0,294 0,189 -0,263 0,053 0,38 -0,707
Have you given up driving at night? -0,672 -0,129 0,576 -0,012 -0,091 0,186
When driving at night do you worry about merging into traffic? 0,719 -0,258 -0,006 -0,104 -0,012 -0,021
When driving at night do you feel stressed or nervous? 0,909 -0,012 -0,008 0,034 -0,135 0,259
When driving at night do you feel that the road is not sufficiently lit 0,833 -0,086 0,1 -0,068 0,015 -0,105
When driving at night do you have difficulty seeing or understanding
road markings? 0,875 -0,129 -0,124 0,068 -0,028 0,059
Do you have to slow down to read the road signs or street names? 0,817 -0,026 0,009 -0,188 -0,084 0,071
Occupation -0,048 0,019 0,13 0,435 0,537 -0,061

125
Varimax rotation was the technique that produced the best results.
The only factors with eigenvalues greater than one were chosen, and a structure with six
factors was obtained, by which 75.72% of the variance is explained.
Table 25 Total Variance Explained
Component Initial Eigenvalues Extraction Sums of Squared
Loadings
Total % of Variance Cumulative % Total % of Variance
1 6,861 32,674 32,674 6,861 32,674
2 2,990 14,240 46,913 2,990 14,240
3 1,769 8,423 55,337 1,769 8,423
4 1,602 7,627 62,964 1,602 7,627
5 1,487 7,081 70,045 1,487 7,081
6 1,192 5,677 75,722 1,192 5,677
7 ,985 4,692 80,414
8 ,935 4,451 84,866
9 ,769 3,662 88,528
10 ,563 2,680 91,208
11 ,474 2,258 93,466
12 ,335 1,597 95,062
13 ,259 1,235 96,297
14 ,186 ,884 97,182
15 ,174 ,829 98,011
16 ,134 ,638 98,649
17 ,095 ,451 99,100
18 ,073 ,349 99,450
19 ,064 ,303 99,753
20 ,043 ,203 99,956
21 ,009 ,044 100,000

126
Figure 75 Scree plot

127
The following table shows the matrix of components.
Table 26 Matrix of components
Component
1 2 3 4 5 6
Have you had to stop driving due to health problems during the past 12 months? -0,893
Have you given up driving at night? -0,649
When driving at night do you worry about merging into traffic? 0,699
When driving at night do you feel stressed or nervous? 0,892
When driving at night do you feel that the road is not sufficiently lit 0,834
When driving at night do you have difficulty seeing or understanding road markings? 0,853
Do you have to slow down to read the road signs or street names? 0,806
Do your current health conditions make it difficult to drive?
0,63
How do you rate your current driving skills?
0,82
How do you rate your current driving ability in relation to your physical conditions?
0,827
How do you rate your current driving ability in relation to your mental capability?
0,897
Age
-0,604
Do you believe, given your current health conditions, that you will be able to continue
driving over the next two years? 0,773
Have you ever been caught committing a driving offence?
-0,817
Musculoskeletal complains
0,83
Total number of Diseases
0,868
Have you ever fallen asleep behind the wheel?
-0,487
Have you been involved in any road traffic accidents/collisions in the past 5 years?
0,765
Occupation
0,539
How often do you drive?
0,757
Do you often see road signs at the last minute?
-0,711
7.2.4. Interpretation of the factors
The first factor is about the difficulties driving, it explains the 32,67% of the
variance and it includes the variables:
Have you had to stop driving due to health problems during the past 12 months?
Have you given up driving at night?
When driving at night do you worry about merging into traffic?
When driving at night do you feel stressed or nervous?
When driving at night do you feel that the road is not sufficiently lit

128
When driving at night do you have difficulty seeing or understanding road markings?
Do you have to slow down to read the road signs or street names?
The second factor explains the 14,24 % of the variance, it refers to the self-
assessment of driving abilities and it includes the variables:
Do your current health conditions make it difficult to drive?
How do you rate your current driving skills?
How do you rate your current driving ability in relation to your physical
conditions?
How do you rate your current driving ability in relation to your mental
capability?
The third factor refers to the driving conditions current and future, it explains
the 8,42% of the variance and it includes the variables:
Age
Do you believe, given your current health conditions, that you will be able to
continue driving over the next two years?
Have you ever been caught committing a driving offence?
The fourth factor explains the 7,63% of the variance and it is relative to the
health and physical well-being and includes the variables:
Musculoskeletal complains
Total number of Diseases
Have you ever fallen asleep behind the wheel?
The fifth factor refers to the level of activity, it explains the 7,08% of the
variance and involvement in accidents and includes the variables:
Have you been involved in any road traffic accidents/collisions in the past 5
years?
Occupation
The sixth factor refers to driving behaviour, it explains the 5,68% of the
variance and it includes the variables:
How often do you drive?

129
Do you often see road signs at the last minute?
The matrix component allows to write the relationships between variables and factors found:
Age = 0,158 * F1 -0,227 * F2 -0,604 * F3 + 0,337 * F4 -0,416 * F5 + 0,012 * F6
How do you rate your current driving skills? = -0,095 * F1 + 0,82 * F2 + 0,243 * F3
-0,074 * F4 -0,113 * F5 -0,119 * F6
How do you rate your current driving ability in relation to your physical conditions? =
-0,241 * F1 0,827 * F2 -0,018 * F3 -0,307 * F4 + 0,089 * F5 + 0,05 * F6
How do you rate your current driving ability in relation to your mental capability? =
-0,21 * F1 0,897 * F2 + 0,091 * F3 + -0,091 * F4 + 0,086 * F5 + 0,194 * F6
Muscular skeletal complains = -0,077 * F1 -0,16 * F2 -0,04 * F3 + 0,83 * F4
+ 0,065 * F5 + 0,049 * F6
Total number of Diseases = -0,002 * F1 -0,059 * F2 -0,052 * F3 + 0,868 * F4
+ -0,023 * F5 + 0,012 * F6
Do your current health conditions make it difficult to drive? =-0,485 * F1 +0,63 * F2
+ 0,354 * F3 -0,037 * F4 + 0,09 * F5 -0,239 * F6
Have you had to stop driving due to health problems during the past 12 months? =
-0,893 * F1 + 0,147 * F2 + 0,173 * F3 + -0,07 * F4 + 0,007 * F5 + -0,043 *
F6
Do you believe, given your current health conditions, that you will be able to continue
driving over the next two years? = -0,362 * F1 + 0,42 * F2 + 0,773 * F3 + 0,095 * F4
-0,119 * F5 + 0,072 * F6
How often do you drive? = 0,08 * F1 + 0,209 * F2 + -0,189 * F3 + 0,069 * F4
+ 0,358 * F5 + 0,757 * F6
Have you ever been caught committing a driving offence? = -0,022 * F1 -0,106 * F2
+ -0,817 * F3 + 0,006 * F4 + -0,177 * F5 + 0,08 * F6
Have you been involved in any road traffic accidents/collisions in the past 5 years? =
-0,164 * F1 -0,057 * F2 + 0,118 * F3 + -0,129 * F4 + 0,765 * F5 + 0,071 * F18
Have you ever fallen asleep behind the wheel? = 0,184 * F1 0,188 * F2 + 0,004 * F3
+ -0,487 * F4 + 0,365 * F5 + 0,047 * F6

130
Do you often see road signs at the last minute? = -0,265 * F1 0,209 * F2 + -0,255 * F3
+ 0,057 * F4 + 0,389 * F5 + -0,711 * F6
Have you given up driving at night? =0,649 * F1 -0,092 * F2 + 0,62 * F3 + -0,002 * F4
+ -0,076 * F5 + 0,155 * F6
When driving at night do you worry about merging into traffic? = 0,699 * F1 -0,301 * F2
-0,051 * F3 -0,112 * F4 -0,026 * F5 + 0,003 * F6
When driving at night do you feel stressed or nervous? = 0,892 * F1 -0,067 * F2
-0,061 * F3 + 0,021 * F4 -0,153 * F5 + 0,29 * F6
When driving at night do you feel that the road is not sufficiently lit? = 0,834 * F1
-0,137 * F2 + 0,046 * F3 -0,078 * F4 + 0,002 * F5 -0,076 * F6
When driving at night do you have difficulty seeing or understanding road markings? =
0,853 * F1 -0,181 * F2 -0,178 * F3 + 0,057 * F4 + -0,046 * F5 + 0,091 * F6
Do you have to slow down to read the road signs or street names? = 0,806 * F1
-0,076 * F2 + -0,041 * F3 + -0,198 * F4 + -0,099 * F5 + 0,099 * F6
Occupation = -0,022 * F1 0,018 * F2 + 0,125 * F3 + 0,437 * F4 + 0,539 * F5
-0,059 * F6

131
The relationships between factors and variables are:
Factor 1 = 0,158 * Age + -0,095 * How do you rate your current driving skills? -0,241 * How do you
rate your current driving ability in relation to your physical conditions? + -0,21 * How do you rate your current driving ability in
relation to your mental capability? -0,077 * Muscular skeletal complains + -0,002 * Total number of Diseases -0,485 *
Do your current health conditions make it difficult to drive? -0,893 * Have you had to stop driving due to health problems during
the past 12 months? -0,362 * Do you believe, given your current health conditions, that you will be able to continue driving over the next
two years? + 0,08 * How often do you drive? -0,022 * Have you ever been caught committing a driving offence? -0,164 *
Have you been involved in any road traffic accidents/collisions in the past 5 years? = + 0,184 * Have you ever fallen asleep
behind the wheel? -0,265 * Do you often see road signs at the last minute? -0,649 * Have you given up driving at night? +
0,699 * When driving at night do you worry about merging into traffic? + 0,892 * When driving at night do you feel
stressed or nervous? + 0,834 * When driving at night do you feel that the road is not sufficiently lit? + 0,853 *When driving
at night do you have difficulty seeing or understanding road markings?+ 0,806 *Do you have to slow down to read the road signs or street names?
-0,022 * Occupation
Factor 2 = -0,227 * Age + 0,82 * How do you rate your current driving skills? + 0,827 * How do
you rate your current driving ability in relation to your physical conditions? + 0,897 * How do you rate your current driving ability in
relation to your mental capability? -0,16 * Muscular skeletal complains -0,059 * Total number of Diseases + 0,63 *
Do your current health conditions make it difficult to drive? + 0,147 * Have you had to stop driving due to health problems
during the past 12 months? + 0,42 * Do you believe, given your current health conditions, that you will be able to continue driving
over the next two years? + 0,209 * How often do you drive? -0,106 * Have you ever been caught committing a driving
offence? -0,057 * Have you been involved in any road traffic accidents/collisions in the past 5 years? + 0,188 * Have you ever
fallen asleep behind the wheel? + 0,209 * Do you often see road signs at the last minute? -0,092 * Have you given up driving at
night? -0,301 * When driving at night do you worry about merging into traffic? -0,067 * When driving at night do you feel stressed or
nervous? -0,137 * When driving at night do you feel that the road is not sufficiently lit? -0,181 *When driving at night do you have
difficulty seeing or understanding road markings? -0,076 *Do you have to slow down to read the road signs or street names? + 0,018 *
Occupation
Factor 3 = -0,604 * Age + 0,243 * How do you rate your current driving skills? -0,018 * How do
you rate your current driving ability in relation to your physical conditions? + 0,091 * How do you rate your current driving ability in

132
relation to your mental capability? -0,04 * Muscular skeletal complains - 0,052 * Total number of Diseases + 0,354 *
Do your current health conditions make it difficult to drive? + 0,173 * Have you had to stop driving due to health problems during
the past 12 months? + 0,773 * Do you believe, given your current health conditions, that you will be able to continue driving over the
next two years? -0,189 * How often do you drive? -0,817 * Have you ever been caught committing a driving offence? +
0,118 * Have you been involved in any road traffic accidents/collisions in the past 5 years? + 0,004 * Have you ever
fallen asleep behind the wheel? + -0,255 * Do you often see road signs at the last minute? + 0,62 * Have you given
up driving at night? -0,051 * When driving at night do you worry about merging into traffic? -0,061 * When driving at night do you
feel stressed or nervous? + 0,046 * When driving at night do you feel that the road is not sufficiently lit? - 0,178 * When
driving at night do you have difficulty seeing or understanding road markings? - 0,041 * Do you have to slow down to read the road signs
or street names? + 0,125 * Occupation
Factor 4 = 0,337 * Age - 0,074 * How do you rate your current driving skills? -0,307 * How do you rate your
current driving ability in relation to your physical conditions? - 0,091 * How do you rate your current driving ability in relation to your
mental capability? + 0,83 * Muscular skeletal complains + 0,868 * Total number of Diseases - 0,037 * Do your
current health conditions make it difficult to drive? - 0,07 * Have you had to stop driving due to health problems during the past 12
months? + 0,095 * Do you believe, given your current health conditions, that you will be able to continue driving over the next
two years? + 0,069 * How often do you drive? + 0,006 * Have you ever been caught committing a driving offence? -
0,129 * Have you been involved in any road traffic accidents/collisions in the past 5 years? - 0,487 * Have you ever fallen asleep
behind the wheel? + 0,057 * Do you often see road signs at the last minute? - 0,002 * Have you given up driving at night?
-0,112 * When driving at night do you worry about merging into traffic? + 0,021 * When driving at night do you feel
stressed or nervous? - 0,078 * When driving at night do you feel that the road is not sufficiently lit? + 0,057 *When driving
at night do you have difficulty seeing or understanding road markings? - 0,198 *Do you have to slow down to read the road signs or street names?
0,437 * Occupation
Factor 5 = -0,416 * Age - 0,113 * How do you rate your current driving skills? + 0,089 * How do you
rate your current driving ability in relation to your physical conditions? + 0,086 * How do you rate your current driving ability in
relation to your mental capability? + 0,065 * Muscular skeletal complains - 0,023 * Total number of Diseases +
0,09 * Do your current health conditions make it difficult to drive? + 0,007 * Have you had to stop driving due to
health problems during the past 12 months? - 0,119 * Do you believe, given your current health conditions, that you will be able to

133
continue driving over the next two years? + 0,358 * How often do you drive? - 0,177 * Have you ever been caught
committing a driving offence? + 0,765 * Have you been involved in any road traffic accidents/collisions in the past 5 years?
+ 0,365 * Have you ever fallen asleep behind the wheel? + 0,389 * Do you often see road signs at the last
minute? - 0,076 * Have you given up driving at night? - 0,026 * When driving at night do you worry about merging
into traffic? - 0,153 * When driving at night do you feel stressed or nervous? + 0,002 * When driving at night do you
feel that the road is not sufficiently lit? - 0,046 *When driving at night do you have difficulty seeing or understanding road markings? - 0,099
*Do you have to slow down to read the road signs or street names? + 0,539 * Occupation
Factor 6 = 0,012 * Age - 0,119 * How do you rate your current driving skills? + 0,05 * How do
you rate your current driving ability in relation to your physical conditions? + 0,194 * How do you rate your current driving ability
in relation to your mental capability? + 0,049 * Muscular skeletal complains + 0,012 * Total number of Diseases -
0,239 * Do your current health conditions make it difficult to drive? - 0,043 * Have you had to stop driving due to health problems
during the past 12 months? + 0,072 * Do you believe, given your current health conditions, that you will be able to continue driving
over the next two years? + 0,757 * How often do you drive? + 0,08 * Have you ever been caught committing a
driving offence? + 0,071 * Have you been involved in any road traffic accidents/collisions in the past 5 years? + 0,047 *
Have you ever fallen asleep behind the wheel? - 0,711 * Do you often see road signs at the last minute? + 0,155 *
Have you given up driving at night? + 0,003 * When driving at night do you worry about merging into traffic? +
0,29 * When driving at night do you feel stressed or nervous? - 0,076 * When driving at night do you feel that the road is
not sufficiently lit? + 0,091 *When driving at night do you have difficulty seeing or understanding road markings? + 0,099 * Do
you have to slow down to read the road signs or street names? - 0,059 * Occupation

134
7.2.5. Linear regression
The factors so obtained have been used for the construction of a linear regression
relation in order to predict the ability to drive on the road.
The estimated relation does not have a good level of general adaptation as shown by
the R2=0, 571, so about 57% of the variability observed in the ability to drive is explained
through the six factors included in the model.
R is 0.756 and it represents the correlation coefficient between the observed value of
the dependent variable and the predicted value based on the regression model.
The analysis of variance is used to test the null hypothesis that there is no linear
relationship in the population between the dependent variable and the independent variables,
that all the partial regression coefficient are 0, and that the population value for multiple R2
is 0.
The ratio of the mean squares is 5.331, the observed significance level is less than
0,001, so the null hypothesis can be rejected.
Among the variables included in the regression only the factors 2 and 3, which are
related to self-assessment of driving abilities and current and future driving conditions, are
very significant (t-test> 1.96), while the other factors included have a significance level
lower than the 54.7%, and the constant is very significant (t-test = 17.908).
The coefficients related to each factor are shown in the following table.
Table 27 Parameter estimated in the linear regression
Coefficient unstandardized Standardized Coefficients t-test
T Beta
(Constant) 2,290 17,908
Factor 1 - 0,010 -0,011 -0,079
Factor 2 0,275 0,283 2,116
Factor 3 0,668 0,687 5,137
Factor 4 -0,099 -0,102 -0,762
Factor 5 -0,009 -0,009 -0,066
Factor 6 0,095 0,097 0,728
Given the low level of general adaptation of the model and the reduced level of
significance of the variables, the model estimated by the factors is not is not sufficient to
predict the ability to drive, for this reason another model was estimated by linear regression
techniques.

135
7.3. Estimation of the relation with a linear regression
To estimate the relation, all the variables listed in the previous paragraph have been
considered, and to avoid the problem of the indeterminate matrix, the estimation was done
with SPSS software through the stepwise technique (criterion for entry or removal of
variables are the probabilities of F, respectively, 0.05 and 0.10) after some iterations the less
significant variables and the variable with a coefficient with incorrect sign were excluded.
The best relation includes five variables which are:
Age (continuous variable);
Occupation (Dummy variable coded as 0 = retired, 1 = he/she is still
working);
Do you believe, given your current health conditions, that you will be able to
continue driving over the next two years? (Ordinal variable whose responses
were coded as such: 1 = Highly unlikely, 2 = Not sure, 3 = Maybe, 4 =
Definitely);
Have you been Involved in any road traffic accidents / collisions in the past 5
years? (Dummy variable coded as 0 = no, 1 = yes);
Number of muscular skeletal complaints (continuous variable).
Driving Ability= -0,049 * Age + 1,737*Driving in the next two years -1,013 *Accident +
0,919* Occupation - 0,270*Number of musculoskeletal complains -0,830

136
Table 28 Parameter estimated in the linear regression
Unstandardized
Coefficients
Standardized
Coefficients
t-test
T Beta
(Constant) -0,830 -0,286
Age -0,049 -0,381 -2,636
Do you believe, given
your current health
conditions, that you
will be able to continue
driving over the next
two years?
1,737 0,446 3,389
Have you been
involved in any road
traffic
accidents/collisions in
the past 5 years? Have
you been involved in
any road traffic
accidents/collisions in
the past 5 years?
-1,013 -0,355 -2,941
Occupation 0,919 0,284 2,427
Number of Muscular
skeletal complains
-0,270 -0,273 -2,290
The model has a good level of general adaptation as R2 = 0, 693 shows, then about
70% of the variability observed in the ability to drive is explained through the five variables
included in the model.
R is 0.832 and it represents the correlation coefficient between the observed value of
the dependent variable and the predicted value based on the regression model.
The analysis of variance is used to test the null hypothesis that there is no linear
relationship in the population between the dependent variable and the independent variables,
that all of the partial regression coefficient are 0, and that the population value for multiple
R2 is 0. The ratio of the mean squares is 11,276, the observed significance level is less than
0,0005, so the null hypothesis can be rejected.
All variables included in the model are highly significant (t-test> 1.96), the constant
is not significant (t-test = 0.286).
The variable Age has a negative coefficient that amounts to -0,049, so age negatively
affects driving performance, and it is very significant because the t-test is -2.636.

137
The coefficient associated with the variable "Driving in the next two years" is 1,737,
then the prediction of driving skills in the next two years reflects the current driving
capability. This coefficient is significantly different from zero (the t-test is 3.389).
The accident involvement is very significant, because the t-test amounts to -2.941,
and the regression coefficient is negative and is -1.013, in fact, this dummy variable is
included in the model only in the event of accident involvement and has a negative influence
on the ability to drive.
Even the variable "Occupation" is a dummy variable, and it is considered in the
model only if the driver is still working, the coefficient associated with this variable is 0.919
and has a high level the significance (t-test = 2.427).
The variable "Number of Muscular skeletal complains" has a negative coefficient
equal to -0.270, in fact, if the number of musculoskeletal diseases grows as driving ability
decreases; because for drivers that have musculoskeletal diseases is more difficult to use the
vehicle controls, and also check the stimuli present in the environment is difficult because
the rotations of the head required to control junctions and in reverse manoeuvres are difficult
to perform. This variable is very significant as shown by the t-test that amounts to -2.290.
Table 29 Parameter estimated in the linear regression
Driving
Ability
Age Number of Muscular
skeletal complains
Driving
ability in
next two
years
Accident Occupation
Driv
ing
Ab
ilit
y Pearson Correlation 1 -0,586 -0,289 0,629 -0,117 0,243
Sign. (1-tailed)
0,000 0,057 0,000 0,266 0,094
Ag
e
Pearson Correlation -0,586 1 0,225 -0,515** -0,349* -0,131
Sign. (1-tailed) 0,000
0,111 0,002 0,027 0,241
Nu
mb
er o
f
Mu
scu
larsk
ele
tal
com
pla
ins Pearson Correlation -0,289 0,225 1 0,009 -0,013 0,215
Sign. (1-tailed) 0,057 0,111
0,481 0,473 0,123
Driv
ing
ab
ilit
y
in n
ext
two
yea
rs
hea
lth
c
on
dit
ion
sth
aty
o
uw
illb
e
ab
l
Pearson Correlation 0,629 -0,515 0,009 1 0,101 0,086
Sign. (1-tailed) 0,000 0,002 0,481
0,294 0,323
Accid
en
t
Pearson Correlation -0,117 -0,349 -0,013 0,101 1 0,199
Sign. (1-tailed) 0,266 0,027 0,473 0,294
0,141
Occ
up
ati
on
Pearson Correlation 0,243 -0,131 0,215 0,086 0,199 1
Sign. (1-tailed) 0,094 0,241 0,123 0,323 0,141

138
The table above is the matrix of "Pearson correlation coefficients" for all variables
included in the model, these suggest that the independent variables included in the model are
not related to each other, the highest correlation coefficient between the variables present
amounted to 0,515 between the variables "age" and "driving ability in next two years".

139
8. CONCLUSIONS
With the increase in life expectancy, the elderly have a more active role in society and tend
to use the car for their journeys. Being able to drive ensures their independence and
participation in social life, but with aging many of the physical abilities and cognitive skills
required for driving deteriorate. For this reason in the present study an easy to manage tool,
has been developed, which have been adapted from a context other than the field of driving,
and it may be used to assess fitness to drive in elderly people and also to identify the main
signs of decline in those skills needed to drive a car.
The proposed relation, estimated using multiple linear regression techniques,
explains 70% of the variance in ability to drive. It is also simple to apply and requires a
limited amount of input information, so it may be used when renewing driving licenses to
identify elderly people with poor driving skills, who may put others and themselves at risk
every time they get behind the wheel.
Batteries of tests rather than single tests are most commonly used in driver
assessment so, the advantage of the test proposed in this thesis is that it is a single test with
simple questions making it easy for the driver to answer and complete.
The Driving Ability Index questionnaire also identifies drivers with moderate driving
ability and therefore still able to drive, though with some difficulty. These drivers could
benefit from in-car assistance systems, which are suitable for the compensating for the
deficits indicated in section 3 of the questionnaire.
For example, automatic transmission reduces the stress on the lower limbs and
especially on the left leg, while in the case of cervical spine disorders or limited neck
mobility the reversing camera can be useful as it allows drivers to perform the manoeuvers
without rotating the head. Adaptive cruise control systems are radar sensors that detect the
presence of obstacles around the vehicle allowing the driver to perceive what happens at
360° in real time. These devices also provide automatic braking or adjust speed
automatically to match the traffic conditions. These instruments allow drivers to perceive
stimuli present in the edges of the visual field and to reduce the mental workload, which can
be helpful for elderly drivers who usually have a reduced field of vision and are slower to
process information, especially if they have sensory impairments.
The last part of the questionnaire contains questions that investigate the difficulties
experienced in night driving. It could be recommended that people who encounter major
problems only drive during daylight, as happens in Australia.

140
For the elderly with moderate driving skills the hypothesis of restricting car use to
within a certain distance from home could be considered, so as to prevent isolation and
ensure participation in social life.
The results of the proposed linear regression and factorial analysis indicated that the
ability to drive depends on age, physical abilities and cognitive skills, self-assessment of
current and future driving ability and on driving behaviour and habits. Thus, for license
renewal it is not sufficient to verify just one physical ability (usually eyesight) as often
happens.
Using the estimated model we propose a useful and easy to manage tool, that can
also be used for the renewal of driving licences, making it possible to identify elderly drivers
who may be at risk or would benefit from in-car assistance systems.
In the self-assessment of driving skills marked differences were found in the two
genders. Women tend to underestimate their own driving skills compared to their peers of
the opposite gender. For this reason, future research could focus on extending the same
experiment to include a greater number of women, in order to estimate separately the
answers to the questionnaire for the two genders.

141
9. BIBLIOGRAPHY
Publications of the author
Pinna C., Analisi sperimentale della precezione visiva in età senile, Tesi di Laurea
2011.
Fancello G., Pinna C. and Fadda P. 2012.“The vision of roundabout by elderly
drivers” , in Neville A. Stanton (eds) “Advances in Human Aspects of Road and Rail
Transportation” CRC Press Taylor & Francis Group ISBN 13: 978-0-9796435-5-2; ISBN 10:
0-9796435-5-4.
Fancello G., Pinna C. and Fadda P 2014. “Percezione visiva dei pannelli a
messaggio variabile: stima di un modello di previsione dei tempi di lettura” in
“Segnaletica e informazione per il miglioramento della sicurezza” Quaderno n°9 EGAF.
ISBN: 978 – 88- 8482 – 566 -7.
Meloni M., Pinna C., Lecca L., Fancello G., Del Rio A. Setzu D., Costa G. and
Fadda P 2014. “Driving Ability Index (DAI) for assessing elderly people’s performance”
Advances in Human Aspects of Transportation: Part III, ISBN: 978-1-4951-2099-2 , Neville
Stanton, Steve Landry, Giuseppe Di Bucchianico and Andrea Vallicelli
Fancello G., Pinna C. and Fadda P. “ Visual perception of the roundabout in old
age”, 19th International Conference on Urban Transport and the Environment, Urban
Transport 2013, Wessex Institute of Technology, Kos, Greece, 29 - 31 May, 2013; WIT
Transactions on the Built Environments (ISSN: 1746-4498, Digital ISSN: 1743-3509).
Fancello G., Pinna C. and Fadda P. “Modelos de conducción en los conductores
ancianos” XVI Congreso Argentino de Vialidad y Transito, Cordoba, Argentina, 22-
26/10/2012.

142
Publications
Abbate, C., Luzzatti, C., Vergani, C., 2007. Matrix test: speed and accuracy of visual
search in aging. G. Gerontol 55: 11-20.
Anderson SW, Rizzo M, Shi Q, Uc EY, Dawson JD. 2005. Cognitive Abilities Related
to Driving Performance in a Simulator and Crashing on the Road. Proceedings of the
Third International Driving Symposium on Human Factors in Driver Assessment, Training
and Vehicle Design; 2005 Jun 27-30; Rockport (ME). 2005.
Anstey K.J., Horswill M, S., Wood J.M., Hatherly C. 2011. The role of cognitive and
visual abilities as predictors in the Multifactorial Model of Driving Safety, Accident
Analysis and Prevention . 2012 Mar;45:766-74. doi: 10.1016/j.aap.2011.10.006. Epub 2011
Nov 30.
Anstey K. J., Wood J, Lord S, Walker J.G., 2005. Cognitive, sensory and physical
factors enabling driving safety in older adults, Clinical Psychology Review 25 (2005) 45-
65.
Ball, K. Owsley, C., Sloane, M.E., Roenken D.L., 1993. Visual attention problems as
a predictor of vehicle crashes in older drivers. Invest Ophthalmol Vis Sci; 34:3110–23.
Barbaranelli C., D’Olimpio F., 2007. Analisi dei dati con SPSS I Le analisi di base,
Edizioni Universitarie di Lettere economia e Diritto.
Barbaranelli C., 2006. Analisi dei dati con SPSS II Le analisi multivariate, Edizioni
Universitarie di Lettere economia e Diritto.
Burg, A., 1967. The relationship between vision test scores and driving record:
General findings. Report 67-24. Department of Engineering, University of California, Los
Angeles.
Burns, P.C., 1999. Navigation and the mobility of older drivers, The Journal of
Gerontology, 54 (1), pp. S49–S55.

143
Butler, K.M., Zacks, R.T., Henderson, J.M., 1999. Suppression of reflexive saccades
in younger and older adults: age comparison on an antisaccade task. Memory Cognit, 27(4):
584-591.
Carr DB, Barco PP,Wallendorf MJ, Snellgrove CA, Ott BR. Predicting road test
performance in drivers with dementia. Journal of the American Geriatrics Society
2011;59(11): 2112–7
Castro, C., Horberry, T., 2004, The Human Factors of Transport Signs, CRC Press
Taylor & Francis Group ISBN: 0-415-31086.
Ciampicacigli R., 2007 .L’Italia invecchia al volante, Censis.
Chandraratna S., Michell L., Stamatiadis N., 2002. Evaluation of the transportation
safety needs of older drivers. Dept. of Civil Engineering, University of Kentucky.
Colsher P.L., Wallace R.B., 1993. Geriatric assessment and driver functioning.
Clinics in Geriatric Medicine. 1993;9(2):365-375.
Comrey A.L., Lee H. B., 1995. Introduzione all’analisi fattoriale, Edizioni
Universitarie di Lettere economia e Diritto.
CONSOL – Road safety in the ageing society –, Siren A., Haustein S., Meng A., Bell
D., Pokriefke E., Lang B., Medina K.F., Gabaude C., Marin –Lamellet C., Monterde I Bort
H., Strnadova Z., 2013 Driving Licensing Legislation – Final report September 2013 ( co-
founded by the European Commission).
Crassini B., Brown, B., Bowman, K.,1998. Age related changes in contrast
sensitivity in central and peripheral retina. Perception, 17: 315-332.
Crizzle A.M., Classen, S., Uc, E. 2012. Parkinson’s disease and driving: An evidence
based review. Neurology, 79, 2067-2074.

144
Daigneault G., Joly P., Frigon J.Y., 2002. Previous convictions or accidents and
the risk of subsequent accidents of older drivers, Accident Analysis and Prevention, 34,
257-261.
Davis E.T., Fujawa G., Shikano ., 2002. Perceptual processing and search efficiency
of young and older adults in simple-feature search task: a staircase approach.
Psychological Sciences, Vol.57B: 324-337.
Department of Economic and Social Affairs Population Division of the United
Nations, 2013. World population ageing; 2013.
De Raedt R., Ponjaert-Kristoffersen I., 2000. The relationship between
cognitive/neuropsychological factors and car driving performance in older adults, Journal
of the American Geriatrics Society
Dewar, R.E., Kline, D.W., Swanson, H.A., 1994. Age differences in the
comprehension of traffic sign symbols. Transp. Res. Rec., 1456:1-10.
Dewar, R.E., Kline, D.W., Swanson, H.A., 1994. Symbol signing design for older
drivers. Final Report. Federal Highway Administration.
Dobbs, B. M., 2005. Medical Conditions and Driving: A Review of the Literature.
Dobbs AR. Evaluating the driving competence of dementia patients. Alzheimer
Disease and Associated Disorders 1997;11 Suppl 1:8–12.
Eby, D.W., Trombley, D.A.,Molnar, L.J., Shope, J.T., 1998. The assessment of older
drivers’ capabilities: a review of the literature. UMTRI technical report. Transportation
research Institute, Université du Michigan, Ann Arbor, États-Unis.
Eby, D.W., 2007. Development and pilot testing of an assessment battery for older
drivers.

145
European Transport Safety Council, 2010. Preventing Road Accidents and Injuries
for the Safety of Employees – Fitness to drive.
Evans, L. (1991). Traffic Safety and the Driver. New York, NY: Van Nostrand
Reinhold.
Fancello, G., Stamatiadis N., Pani E., Fadda P.,Wilkinson, 2008. Are Older Drivers
different in the Us And Italy?, "Urban Transport XIV" Conference Proceedings.
Ficke, R. 2003. Aging and Disability: Implications for Transportation Research.
Paper presented at the Transportation Research Board Annual 2003.
Fonda, S. J., Wallace, R. B. & Herzog, A. R., 2001. Changes in driving patterns and
worsening depressive symptoms among older adults. Journal of Gerontology: Social
Sciences, 56, 343–351.
Freund B.,∗, Colgrove L., Burke B., McLeod R., 2005, Self-rated driving
performance among elderly drivers referred for driving evaluation, Accident Analysis
and Prevention 37 (2005) 613–618
Gabaude ., 2003. Exploration of the visual and attentional abilities of elderly drivers
Benefits and techniques, Recherche Transports Securite, Volume 81, October 2003, pp. 165-
176(12).
Gabrieli JDE, Brewer JB, Vaidya CJ. Memory. In: Goetz CG, Pappert EJ, eds. 2003,
Textbook of Clinical Neurology, 1st Ed. W.B. Saunders Company, 1999:56-69. Available at:
http://www.mdconsult.com. Accessed January 23.
Galski, T. , Bruno, RL and Ehle, HT 1992. Driving after Cerebral Damage: A Model
with Implications for Evaluation. Am. J. Occup. Ther. Vol. 46 , pp. 324-332.
Galski T, Bruno RL, Ehle HT. 1993. Prediction of behind-the-wheel driving
performance in patients with cerebral brain damage: a discriminant function analysis. Am
J Occup Ther. 1993 May;47(5):391-6.

146
Guerrier, J.H., Manivannan, P., Nair, S., 1999. The role of working memory, field
dependence, visual search, and reaction time in the left turn performance of older female
drivers. Applied Ergonomics, 30, 109–119, 1999.
Hakamies-Blomqvist L., 2004. Older drivers – a review, VTI rapport 497a.
Hakamies-Blomqvist L., Anu Siren 2003. Deconstructing a gender difference:
Driving cessation and personal, driving history of older women Journal of Safety Research
34 (2003) 383– 388.
Hakamies-Blomqvist, L, Johansson, K & Lundberg, C. 1996. Medical screening of
older drivers as a traffic safety measure – a comparative Finnish-Swedish evaluation study.
Journal of the American Geriatrics Society. 44: 650-653
Hasher, L., Zacks, R.T., 1988.Working memory, comprehension and aging: a review
and a new view. In: Bower, G.H. (Ed.), The psychology of learning and motivation, Vol. 22.
Academic Press, NewYork, États-Unis, pp. 193–225.
Hauer, E. 1988. The safety of older persons at intersections. Special Report 218:
Transportation in an Aging Society: Improving Mobility and Safety for Older Persons,
Volume 2. Washington, DC: Transportation Research Board.
Hatakka, M., Keskinen, E., Gregersen, N. P., Glad, A. & Hernetkoski, K. 2002. From
control of the vehicle to personal self-control; broadening the perspectives to driver education.
Transportation Research, Part F, 201-215.
Hills, B.L., 1980, Vision, visibility and perception in driving. Perception, 9, 183-
216.
Holland, C.A. 2001 Older Drivers: A review. DfT Research Report No.25,
http://www.dft.gov.uk/stellent/groups/dft_rdsafety/documents/page/dft_rdsafety_504602.hcsp
Hu P.S., Trumble D.A., Foley D.J., Eberhard J.W., Wallace R.B. 1998. Crash risks of
older drivers: A panel data analysis, Accident Analysis and Prevention, 30 (1998), pp. 569–
581

147
International Ergonomics Association. What is Ergonomics. Website. Retrieved 17
March 2014.
Ivers R.Q., Mitchell P., Cumming R.G., 1999. Sensory impairment and driving: The
Blue Mountains Eye Study, American Journal of Public Health, 89 (1999), pp. 85–87.
Jang, R.W., Man-Son-Hing M, Molnar F.J., Hogan D.B., Marshall S.C., Auger J,
Graham I.D., Bitensky N.K., Tomlinson J., , Kowgier M.E., Naglie G., 2007, Family
Physicians’ Attitudes and Practices Regarding Assessments of Medical Fitness to Drive in
Older Persons.
Janssen, W.H., 1979. Routeplanning en geleiding: Een Literatuurstudie. Report IZF
1979 V.13. Soesterburg: Institute for Perception TNO, Holland.
Justiss M., 2005. Development of a behind-the-wheel driving performance
assessment for older adults, PhD Thesis, University of Florida.
Kim, T., Oh C., Yeon J.Y., Kim, S., 2009. Estimation of message reading time for
Variable Message Signs, Dept. of Advanced Transportation Research, The Korea Transport
Institute, 88th Annual Meeting of the Transportation Research Board (TRB), Washington.
Klein DC, Coon SL, Roseboom PH, Weller JL, Bernard M, Gastel JA, Zatz M, Iuvone
PM, Rodriguez IR, Bégay V, Falcón J, Cahill GM, Cassone VM, Baler R. The melatonin
rhythm-generating enzyme: molecular regulation of serotonin N-acetyltransferase in the
pineal gland. Recent Prog Horm Res. 1997;52:307-57;
Kline, D.W., Scialfa, C.T., Sensory and perceptual functioning: basic research and
human factors implications, 1997.
Li, G.H., Braver, E.R., & Chen, L.H., Fragility versus excessive crash involvement
as determinants of high death rates per vehicle-mile of travel among older drivers. Accident
Analysis and Prevention, 35: 227–235, 2003.

148
Langford J, Methorst R, Hakamies-Blomqvist L., Older drivers do not have a high
crash risk--a replication of low mileage bias, 2006
Lee H. C., Cameron D., Lee A.H., 2003. Assessing the driving performance of older
adult drivers: on-road versus simulated driving, Accident Analysis and Prevention, 35, 797-
803.
Lyman S., Ferguson S. A., Braver E. R, Williams A. F., 2002, Older driver
involvements in police reported crashes and fatal crashes: trends and projections, Injury Prevention, 8:116–120.
Margolis, K. L., Kerani, R. P., McGovern, P., Songer, T., Cauley, J. A., & Ensrud, K.
E. 2002. Risk factors for motor vehicle crashes in older women. The Journals of
Gerontology. Series A, Biological Sciences and Medical Sciences, 57(3), M186−M191.
Marottoli, R. A., Richardson, E. D., Stowe, M. H., Miller, E. G., Brass, L. M., Cooney
Jr., L. M., et al. 1998. Development of a test battery to identify older drivers at risk for self-
reported adverse driving events. Journal of the American Geriatric Society, 46, 562–568.
Marshall S.C., 2011, The Role of Reduced Fitness to Drive Due to Medical
Impairments in Explaining Crashes Involving Older Drivers, Traffic Injury Prevention,
9: 4, 291-298.
Martin A.J., Marottoli R, O’Neill D. 2013. Driving assessment for mantaining
mobility and safety in drivers with dementia (Review). The Cochrane Collaboration 2013.
http://thecochranelibrary.com – Wiley.
Massie, D. L., & Campbell, K. L. 1993. Analysis of Accident Rates by Age, Gender,
and Time of Day Based on the 1990 Nationwide Personal Transportation Survey. Report No.
UMTRI-93–7. Ann Arbor, MI: University of Michigan Transportation Research Institute.
Maycock, G. 1997. The Safety of Older Car Users in the European Union.
Basingstoke, UK: Foundation for Road Safety Research.

149
McGwin G Jr, Sims RV, Pulley L, Roseman JM, 2000. Relations among chronic
medical conditions, medications, and automobile crashes in the elderly: a population-based
case-control study, American journal of epidemiology, 2000 Sep 1;152(5):424-31.
McKnight J. A., McKnight S.A., Multivariate analysis of age related driver ability
and performance deficits, Accident Analysis and Prevenction, 1999.
Metzner, J.L., Dentino, A.N., Godarrd, S.L., Hay, L.H., Linnoila, M., 1993.
Impairment of driving and psychiatric illness, Journal of Neuropsychiatry, 5, pp 211-220.
Naumann R. B., Dellinger A.M., Kresnow M., 2011. Driving self-restriction in high-
risk conditions: how do older drivers compare to others?. Journal of safety research 42: 67-71.
Odenheimer, G. L., Beaudet, M., Jette, A. M., Albert, M. S., Grande, L., & Minaker,
K. L. 1994. Performance-based driving evaluation of the elderly driver: Safety, reliability,
and validity. Journal of Gerontology: Medical Sciences, 49, M153–M159.
Owsley, C. Ball, K., 1991. Identifying correlates of accident involvement for the
older driver. Human Factors, 33, 583-595, 1991.
Owsley C., B.T. Stalvey, J. Wells, M.E. Sloane, G. McGwin Jr., 2001. Visual risk
factors for crash involvement in older drivers with cataract, Archives of Ophthalmology,
119 (2001), pp. 881–887
Owsley C., Stalvey B.T., Phillips J.M., 2003. The efficacy of an educational
intervention in promoting self-regulation among high-risk older drivers, Accident Analysis
and Prevention, 35, 393-400.
Parker D.; McDonald L.; Rabbit P; Sutcliff P., 2003.Older drivers and road safety:
the acceptability of a range of intervention measures, Accident analysis and prevention,
vol.35, n 5,pp.805-810.
Peraaho M., Keskinen E., Hatakka M., 2003. Driver competence in a hierarchical
prospective; implications for driver education. University of Turku, Traffic Research.

150
Ranney, T. 1994. Models of driving behavior: A review of their evolution, Accident
Analysis & Prevention, Vol. 26, 733-750.
Rothengatter, T. 1997. Editorial preface. Applied psychology, Vol. 46 (3), 221-222.
Sims R.V., McGwin G. Jr., Allman R.M., Ball K., Owsley C., 2000. Exploratory
study of incident vehicle crashes among older drivers; Journals of Gerontology. Series A,
Biological Sciences and Medical Sciences, 55 (2000), pp. M22–M27
Sims R.V., Owsley C., Allman R.M., Ball K., Smoot T.M., 1998. A preliminary
assessment of the medical and functional factors associated with vehicle crashes by older
adults, Journal of the American Geriatrics Society, 46 (1998), pp. 556–561
Siren A, Hakamies-Blomqvist L. 2005. Sense and sensibility. a narrative study of
older women's car driving. Transportation Research Part F: Traffic Psychology and
Behaviour 8(3).
Sivak, M., 1996. The information that drivers useis it indeed 90% visual?,
Perception, 25, pp. 1081–1089, 1996.
Sekuler, R., & Ball, K. 1986. Visual localization: age and practice. Journal of the
Optic Society of America, 3, 864-867.
Skyving M., Berg H.Y., Laflamme L., 2009. Older drivers’involvement in fatal
RTCs. Do crashes fatal to them differ from crashes involving them but fatal to others?.
Safety Science, 47: 640-646
Sommer, M., Arendasy, M., Hansen, H.-D., & Schuhfried, G. 2005. Personalauswahl
mit Hilfe von statistischen Methoden der Urteilsbildung am Beispiel der Flugpsychologie.
Untersuchungen des Psychologischen Dienstes der Bundeswehr, 40, 39-64.
Staplin, L., Lococo, K. & Byington, S. 1998 Older Driver Highway Design
Handbook. FHWA-RD-97-135.Department of Transportation, Federal Highway
Administration, Washington, DC.

151
Staplin, L., Lococo, K. H., Gish, K. W., Decina, L.E. 2003. Model Driver Screening
and Evaluation Program. Volume 2: Maryland Pilot Older Driver Study. Washington, D.C.:
National Highway and Traffic Safety Administration. Retrieved October 15, 2003
Stav B. W., Justiss D.M., McCarthy P.D., Mann W.C, Lanford N.D., Predictability of
clinical assessments for driving performance, Journal of Safety Research 39, 2008.
Stutts J.C., Stewart J.R., Martell C. 1998. Cognitive test performance and crash risk
in an older driver population. Accident Analysis and Prevention, 30 (1998), pp. 337–346
Thorslund B., Peters B., Lidestam B., Lyxell B., 2013. Cognitive workload and
driving behaviour in persons with hearing loss, Transportation research Part F, Volume 21,
November 2013, Pages 113–121.
Tuomi K, Ilmarinen J, Jahkola A, Katajarinne L, Tulkki A. 1998. Work Ability Index
(2nd Edition). Helsinki: Finnish Institute of Occupational Health.
Vaa, T., 2003. Impairment,diseases, age and their relative risks of accident
involvement: Results from meta-analysis, 2003.
Vaux LM, Ni R, Rizzo M, Uc EY, Andersen GJ. Detection of imminent collisions by
drivers with Alzheimer’s disease and Parkinson’s disease: a preliminary study. Accident;
Analysis and Prevention 2010;42(3):852–8.
Weihong Guo A., Blythe P., Edwards S., Pavkova K., Brennan D., 2013, Effect of
intelligent speed adaptation technology on older drivers’ driving performance, IET
Intelligent Transport Systems, doi: 10.1049/iet-its.2013.0136.
Wood, J. 2002. Age and visual impairment decrease driving performance as
measured on a closed-road circuit. Human Factors, 44, 482-494.

152
Legislation
Directive 2006/126/EC of the European Parliament and of the Council of 20
December 2006 on driving licences.
Commission Directive 2009/113/EC of 25 August 2009 amending Directive
2006/126/EC of the European Parliament and of the Council on driving licences.
Sitography
http://ec.europa.eu/transport/road_safety/users/eldery-drivers/index_en.htm
http://www.polisonnografia.it/disturbi_anziano.php
http://www.ncbi.nlm.nih.gov/pubmed/9238858
http://w3.uniroma1.it/chemo/heritage/correlazione/rslide33.html
http://www.dica33.it/terza-et%C3%A0-patologie/terza-et%C3%A0-00197.htm
http://www.neuropsicologia.it/content/view/78/90/
http://it.wikipedia.org/wiki/Mini_Mental_State_Examination
http://www.transport- research.info/web/projects/project_details.cfm
http://ec.europa.eu/transport/road_safety/users/eldery-drivers/index_it.htm
http://www.iapb.it/news2.php?id=772
http://ec.europa.eu/transport/road_safety/users/eldery-drivers/index_it.htm
http://www.alz.org/aaic/ (Alzheimer's Association)
http://www.cieca.eu/template_page.asp?pag_id=32&lng_iso=EN (International
commission for driver testing)
http://en.wikipedia.org/wiki/Factor_analysis.

1
1. Occupation: _______________________________ Age _____ Gender ______
2. Education:
a. No qualification
b. GCSE/O level and equivalents
c. A levels and equivalents
d. University degrees
3. Smoking: a. No (go to Q6) b. Ex-smoker (go to Q6) c. Yes (go to Q5)
4. If you answered “yes” to Q4, how many cigarettes do you smoke on a typical day? _____
5. How often do you have a drink containing alcohol? Please tick ONE only.
a. Never
b. Monthly or less
c. 2 to 4 times a month
d. 2 to 3 times a week
e. 4 or more times a week
6. How many units of alcohol do you drink on a typical day when you are drinking? Please
tick ONE only (* one pint of beer or a medium size glass of wine is about 2 units).
a. 1 or 2 units
b. 3 or 4 units
c. 5 or 6 units
d. 7 to 9 units
e. 10 or more units
7. How satisfied are you with the quality and amount of sleep you get?
From 5 “Very satisfied” to 1 “very unsatisfied” 1 2 3 4 5
8. Approximately how many miles do you drive on a typical day? _________________
9. Approximately how many miles do you drive in a typical year? Please tick ONE only.
a. 0-2,000
b. 2,001-5,000
c. 5,001-8,000
d. 8,001-10,000
e. 10,001+
What portion of your annual mileage is urban driving _______________%
What portion of your annual mileage is interurban driving____________%
10. How often do you drive? Please tick ONE only.
a. Occasionally (a few days a year but less than one day a month)
b. Sometimes (a few days a month but less than one day a week)
c. Often (one or two days a week)
d. Very often (3 or more days a week)
11. How often do you travel with other people?
a. Never b. Occasional c. Sometimes d. Most of the time e. All the time

2
12. Are you usually the main driver or the passenger when travelling with others?
a. Main driver b. Passenger
13. What is the engine size of your everyday vehicle? Please tick ONE only.
a. Less than 1.0L c. 1.4-1.6L e. 2.0L+
b. 1.0-1.3L d. 1.7-1.9L
14. Year of manufacture of your car ________________
15. Do you have any driving qualifications other than the standard DSA driving test?
If yes, please specify:
_________________________________________________________________
16. Have you ever driven the following vehicles? Please tick ALL that apply.
a. Motorbike c. Van/mobile home/minibus e. Ambulance/Fire Engine
b. Sports car d. Lorry/bus/Coach
17. Have you been involved in any road traffic accidents/collisions in the past 5 years? Please
tick ALL that apply
a. No c. Yes with damage to property only
b. Yes with injury to people (e.g. driver, passenger, pedestrian, or cyclist).
18. Have you ever been caught committing a driving offence? Please tick ONE only.
a. Never c. within the past 12 month
b. b. more than 12 months ago d. within the past 30 days
if you have choose b, c or d, please give the details of the offence: __________________
________________________________________________________________________
19. How do you rate your current driving skills refers to ‘your best period of life?
0 1 2 3 4 5 6 7 8 9 10
*A response of ‘0’ means ‘totally unable to drive’.
*A response of ‘10’ means ‘your peak driving performance’.
20. How do you rate your current driving ability in relation to your physical conditions?
1 2 3 4 5
Very poor Quite poor Average Quite good Very good
21. How do you rate your current driving ability in relation to your mental capability?
1 2 3 4 5
Very poor Quite poor Average Quite good Very good
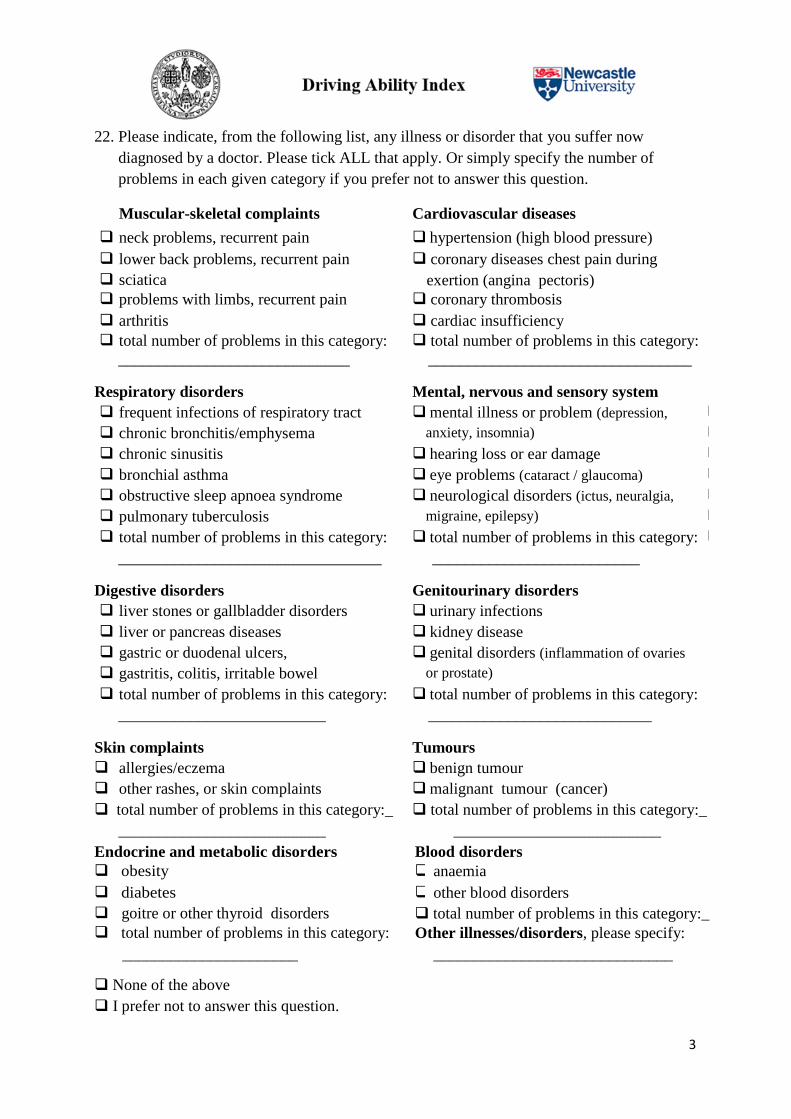
3
22. Please indicate, from the following list, any illness or disorder that you suffer now
diagnosed by a doctor. Please tick ALL that apply. Or simply specify the number of
problems in each given category if you prefer not to answer this question.
Muscular-skeletal complaints Cardiovascular diseases
neck problems, recurrent pain hypertension (high blood pressure)
lower back problems, recurrent pain coronary diseases chest pain during
exertion (angina pectoris) sciatica
problems with limbs, recurrent pain coronary thrombosis
arthritis
cardiac insufficiency
total number of problems in this category:
please specify:
total number of problems in this category:
_____________________________ _________________________________
Respiratory disorders Mental, nervous and sensory system
disorders
frequent infections of respiratory tract
(tonsillitis)
mental illness or problem (depression,
anxiety, insomnia)
chronic bronchitis/emphysema
chronic sinusitis hearing loss or ear damage
bronchial asthma eye problems (cataract / glaucoma)
obstructive sleep apnoea syndrome neurological disorders (ictus, neuralgia,
migraine, epilepsy)
pulmonary tuberculosis
total number of problems in this category: total number of problems in this category:
pleasefy: disorders
_________________________________ __________________________
Digestive disorders Genitourinary disorders
liver stones or gallbladder disorders urinary infections
liver or pancreas diseases kidney disease
gastric or duodenal ulcers, genital disorders (inflammation of ovaries
or prostate)
gastritis, colitis, irritable bowel
total number of problems in this category: total number of problems in this category:
system
__________________________ ____________________________
Skin complaints Tumours
allergies/eczema benign tumour
other rashes, or skin complaints malignant tumour (cancer)
total number of problems in this category:_ total number of problems in this category:_
__________________________ __________________________
Endocrine and metabolic disorders Blood disorders
obesity anaemia
diabetes other blood disorders
goitre or other thyroid disorders total number of problems in this category:_
total number of problems in this category: Other illnesses/disorders, please specify:
______________________
_
_
_
_
_
_
_
_
______________________________
None of the above
I prefer not to answer this question.

4
23. Do your current health conditions make it difficult to drive?
a. I feel I am no longer able to drive
b. I feel I am only able to drive for short distances
c. On average I drive slower than I used to.
d. I am able to drive, but it’s getting difficult
e. I do not have any difficulties
24. Have you had to stop driving due to health problems during the past 12 months? Please
tick ONE only.
a. Not at all b. <10 days c. 10-24 days d. 25-99 days e. 100+ days
25. Have you ever stopped driving for longer than 3 months since you got your full driving
license?
a No b. Yes. Please specify how long and the reason ____________________
26. Do you believe, given your current health conditions, that you will be able to continue
driving over the next two years? Please tick ONE only.
a. Highly unlikely b. Not sure c. Maybe d. Definitely
27. How often do you wear your seat belt when driving? Please tick ONE only.
a. Never b. Sometimes c. Most of the time d. Always
28. Are you undergoing any treatment that affects your alertness?
a. No b. Yes
29. Have you ever fallen asleep behind the wheel?
a. No b. Yes
30. How often do you use your rear view mirror?
a. Never b. only before making particular manoeuvres c. every few minutes
31. Do you often see the road signs at the last minute?
a. No b. Yes
32. Have you given up driving at night?
a. No b. Yes
33. If you have answered ‘No’ to Q32, please indicate how you feel about driving at night.
Do you worry about merging into traffic? Never Sometimes Often Always
Do you feel stressed or get nervous? Never Sometimes Often Always
Do you feel that the roads are not sufficiently lit? Never Sometimes Often Always
Do you have difficulty seeing or understanding road
markings?
Never Sometimes Often Always
Do you have to slow down to read the road signs or
street names?
Never Sometimes Often Always
THANK YOU!