driving behaviour of a sample of young romanian drivers
TRANSCRIPT
Procedia - Social and Behavioral Sciences 33 (2012) 697 – 701
Available online at www.sciencedirect.com
1877-0428 © 2012 Published by Elsevier B.V. Selection and/or peer-review under responsibility of PSIWORLD2011doi:10.1016/j.sbspro.2012.01.211
ProcediaSocial and Behavioral Sciences Procedia - Social and Behavioral Sciences 00 (2011) 000–000
www.elsevier.com/locate/procedia
PSIWORLD 2011
Driving behaviour of a sample of young Romanian drivers Alexandra Gheorghiua,b,*, Corneliu Havârneanub
aLaboratoire de Psychologie EA 4139, Bordeaux 2, Place Victoire, Bordeaux 33000, France bFacultatea de Psihologie si Stiinte ale Educatiei, Universitatea Al.I.Cuza, 3, Toma Cozma, Iasi - 700554, Romania
Abstract
Young driver behaviour is a subject of great interest due to the high number of car crashes and deaths. This study aims to describe the driving behaviour of a sample of young Romanian drivers from the perspective of the generic error modelling system taxonomy. We used the Romanian version of Driver Behaviour Questionnaire (Reason,1990) on a sample of 815 drivers aged between 18 and 25 years. The overall results indicate that young drivers perceive certain aberrant behaviours as being less risky than they are and that it exists is a significant need to educate them regarding security behaviours on roads. © 2011 Published by Elsevier Ltd. Selection and peer-review under responsibility of PSIWORLD 2011
Keywords: young drivers; Drivers Behaviour Questionnaire; driving behaviour;
1. Introduction
Young drivers have received a significant level of interest within international road safety literature (af Wahlberg, 2011; Brookhuis, De Waard, Steyvers, & Bijsterveld, 2011). In 2008, in Europe, from all road fatalities, 16.86% represent people aged 18 to 24. According to the European Road Safety Observatory, the driver and passenger fatalities rates for 18 to 24 years olds are higher than those in any other age groups ("Traffic Safety Basic Facts 2010 Young People," 2011). Many researchers have tried to explain why young drivers have this elevated crash risk. They consider that the lack of experience in combination with an intentional risk taking behaviour and youthfulness of age may explain why they experience such a greater risk on roads (Wundersitz, 2007). Therefore, assessing driver behaviour is a priority and one of the most used instruments is the Driver Behaviour Questionnaire (Reason, Manstead, Stradling, Baxter, & Campbell, 1990). Based on the generic error modelling system taxonomy created by Reason (1993), this
* Alexandra Gheorghiu. Tel.: +4-744-341-931; E-mail address: [email protected]
© 2012 Published by Elsevier B.V. Selection and/or peer-review under responsibility of PSIWORLD2011

698 Alexandra Gheorghiu and Corneliu Havârneanu / Procedia - Social and Behavioral Sciences 33 (2012) 697 – 701A.Gheorghiu et.al / Procedia - Social and Behavioral Sciences 00 (2011) 000–000
questionnaire was validated in many countries, including Romania (Havarneanu, Gheorghiu, & Hohn, 2010). The driving behaviour can be classified with the help of two concepts: errors and violations, that according to Reason (Reason, 1993), are completely different because their underlying processes are completely different. Errors are involuntary actions, while violations are voluntary. Errors can be divided in slips, lapses and mistakes. Slips represent attentional failures, while lapses concern memory failures. The mistakes are more complex, because they concern planning and/or estimation failures. Violations are deliberate deviations from the rules considered to be necessary when operating with a potentially dangerous system (Reason, 1993). The factorial structure identified by Reason and his colleagues in 1990 was replicated by other authors but with some differences. For example Ozkan found a four factor structure comprising aggressive violations which didn’t exist in the original British factorial structure (Ozkan, Lajunen, & Summala, 2006). Overall, the main distinction between errors and violation was always replicated (Havarneanu, et al., 2010; Ozkan, Lajunen, Chliaoutakis, Parker, & Summala, 2006).
The young drivers’ population has certain particularities. They report more errors and violations than older drivers, have a lesser ability to refrain from committing violations (Ozkan, Lajunen, & Summala, 2006), feel less guilt in committing aberrant behaviour and don’t consider those behaviours as being very dangerous (Havarneanu & Gheorghiu, 2010). According to a recent meta-analysis, both errors and violations are valid predictors for self-reported accidents, but violations are a better predictor for young drivers (de Winter & Dodou, 2010).
2. Method
2.1. Sample
The sample has 815 drivers aged from 18 to 25 years (M=23.12, SD=1.44). Four hundred and fifty five of all participants are males and 362 females. They possess a driving license for at least 1 year and 7 years the most (M=4.57, SD=2.00). They drove between 500 and 250000.0 km, in average 12838.21 km with a standard deviation of 21893.27. They report having, since their licensure, 149 active accidents, 105 passive accidents and had received a total of 440 contraventions.
2.2. Measures
We used a translated version of the Drivers Behaviour Questionnaire, validated on a large Romanian sample in 2010 (Havarneanu, et al., 2010). The questionnaire has 4 scales: the first scale evaluates the self-reported behaviour, the second scale targets the potential danger they expose themselves by realizing those behaviours, the third one evaluates the guilt that they would feel and the fourth one the degree of punishment that they would apply to another driver that would realize those behaviors.
3. Results
3.1. Analysis of item response on each scale
For the first scale, the self-reported behaviour, the subjects offered low ratings, usually answering that they almost never performed the behaviours (M=1.04, SD=0.48). This pattern is not unusual for drivers, being already observed in Romania and also around the world (Gras, Sullman, Cunill, Aymerich, & Font-
699Alexandra Gheorghiu and Corneliu Havârneanu / Procedia - Social and Behavioral Sciences 33 (2012) 697 – 701A.Gheorghiu et.al / Procedia - Social and Behavioral Sciences 00 (2011) 000–000
Mayolas, 2006; Havarneanu & Gheorghiu, 2010). Young drivers admit that they over-speed (M=2.66,SD=1.32), but they don’t admit that they make errors (mistakes, slips or lapses).
The mean score for the second scale, that asks the subject to estimate the probability of a car crash when certain behaviour is realised, is significantly higher than the mean for the first scale (t (814) = -45.75 p<0.000) being 2.30 (SD=0.61). With respect to this scale, young drivers are aware that driving under influence can lead to car crashes (M=3.93, SD=1.28) but they fail to categorize speeding as being dangerous (M=2.40, SD=1.19).
The third scale, that evaluates the guilt, has higher scores that the two previous scales (t (814) = - 35.03, p< 0.000 compared to the first scale and t (814) = -3.495, p<0.000 to the second), with a mean of 2.40 (SD=0.93). Similar to the previous scale, the greatest amount of guilt is felt for driving under influence () but not for over-speeding (M=2.44, SD=1.55).
The fourth and final scale, evaluates the degree of punishment. As expected, the mean is significantly higher than all the previous ones, 3.38 (SD=0.72) (t(814) = - 70.556; p<0.000 compared to the first scale, t(814) =- 45.327; p<0.000 to the second and t(814) = - 32.169; p<0.000 to the third). The subjects would impose a more severe punishment for a driver that fails to stop at a red light (M=4.64, SD=0.87) than for one that drives under the influence (M=4.55, SD=1.01) or over-speeds (M=3.46, SD=0.87).
3.2. Gender, accidents and contraventions differences
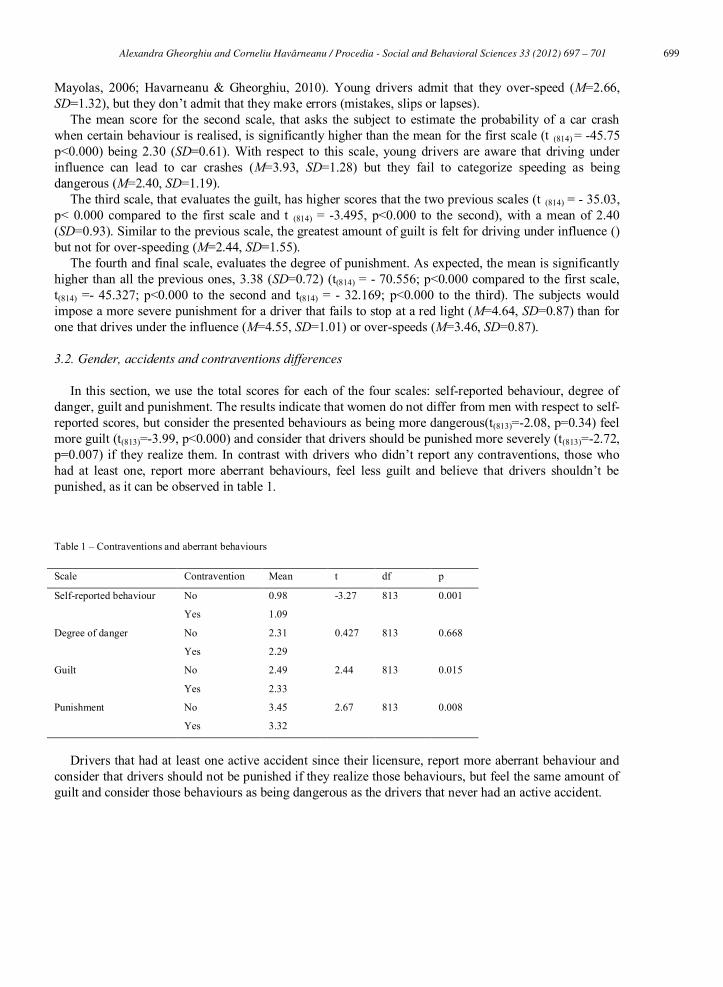
In this section, we use the total scores for each of the four scales: self-reported behaviour, degree of danger, guilt and punishment. The results indicate that women do not differ from men with respect to self-reported scores, but consider the presented behaviours as being more dangerous(t(813)=-2.08, p=0.34) feel more guilt (t(813)=-3.99, p<0.000) and consider that drivers should be punished more severely (t(813)=-2.72, p=0.007) if they realize them. In contrast with drivers who didn’t report any contraventions, those who had at least one, report more aberrant behaviours, feel less guilt and believe that drivers shouldn’t be punished, as it can be observed in table 1.
Table 1 – Contraventions and aberrant behaviours
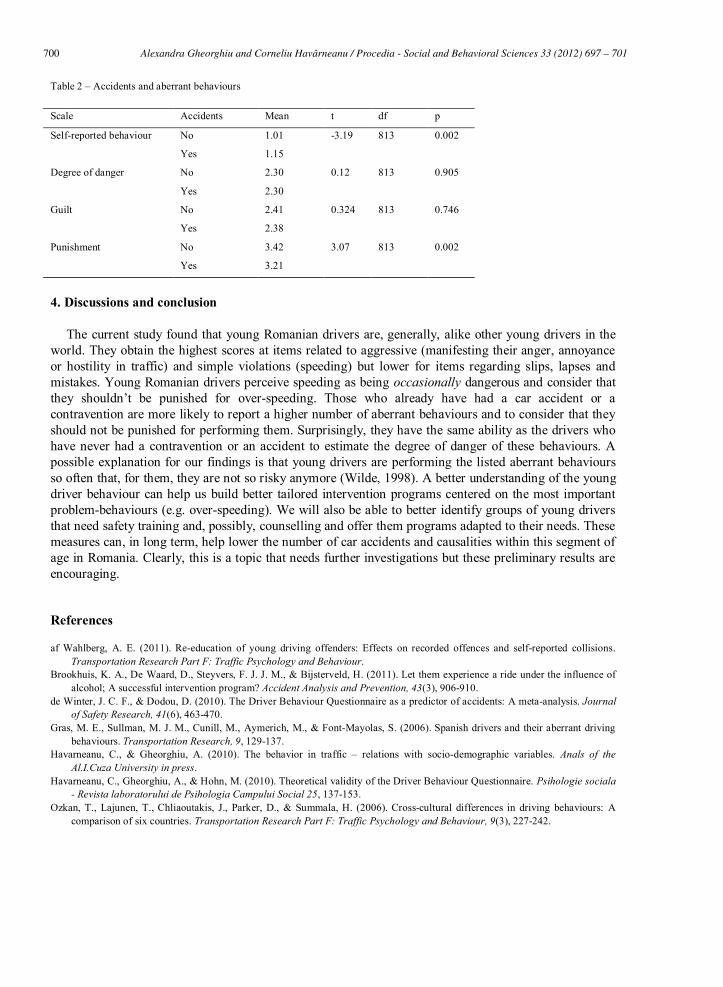
Drivers that had at least one active accident since their licensure, report more aberrant behaviour and consider that drivers should not be punished if they realize those behaviours, but feel the same amount of guilt and consider those behaviours as being dangerous as the drivers that never had an active accident.
Scale Contravention Mean t df p
Self-reported behaviour No 0.98 -3.27 813 0.001
Yes 1.09
Degree of danger No 2.31 0.427 813 0.668
Yes 2.29
Guilt No 2.49 2.44 813 0.015
Yes 2.33
Punishment No 3.45 2.67 813 0.008
Yes 3.32
700 Alexandra Gheorghiu and Corneliu Havârneanu / Procedia - Social and Behavioral Sciences 33 (2012) 697 – 701A.Gheorghiu et.al / Procedia - Social and Behavioral Sciences 00 (2011) 000–000
Table 2 – Accidents and aberrant behaviours
Scale Accidents Mean t df p
Self-reported behaviour No 1.01 -3.19 813 0.002
Yes 1.15
Degree of danger No 2.30 0.12 813 0.905
Yes 2.30
Guilt No 2.41 0.324 813 0.746
Yes 2.38
Punishment No 3.42 3.07 813 0.002
Yes 3.21
4. Discussions and conclusion
The current study found that young Romanian drivers are, generally, alike other young drivers in the world. They obtain the highest scores at items related to aggressive (manifesting their anger, annoyance or hostility in traffic) and simple violations (speeding) but lower for items regarding slips, lapses and mistakes. Young Romanian drivers perceive speeding as being occasionally dangerous and consider that they shouldn’t be punished for over-speeding. Those who already have had a car accident or a contravention are more likely to report a higher number of aberrant behaviours and to consider that they should not be punished for performing them. Surprisingly, they have the same ability as the drivers who have never had a contravention or an accident to estimate the degree of danger of these behaviours. A possible explanation for our findings is that young drivers are performing the listed aberrant behaviours so often that, for them, they are not so risky anymore (Wilde, 1998). A better understanding of the young driver behaviour can help us build better tailored intervention programs centered on the most important problem-behaviours (e.g. over-speeding). We will also be able to better identify groups of young drivers that need safety training and, possibly, counselling and offer them programs adapted to their needs. These measures can, in long term, help lower the number of car accidents and causalities within this segment of age in Romania. Clearly, this is a topic that needs further investigations but these preliminary results are encouraging.
References
af Wahlberg, A. E. (2011). Re-education of young driving offenders: Effects on recorded offences and self-reported collisions. Transportation Research Part F: Traffic Psychology and Behaviour.
Brookhuis, K. A., De Waard, D., Steyvers, F. J. J. M., & Bijsterveld, H. (2011). Let them experience a ride under the influence of alcohol; A successful intervention program? Accident Analysis and Prevention, 43(3), 906-910.
de Winter, J. C. F., & Dodou, D. (2010). The Driver Behaviour Questionnaire as a predictor of accidents: A meta-analysis. Journalof Safety Research, 41(6), 463-470.
Gras, M. E., Sullman, M. J. M., Cunill, M., Aymerich, M., & Font-Mayolas, S. (2006). Spanish drivers and their aberrant driving behaviours. Transportation Research, 9, 129-137.
Havarneanu, C., & Gheorghiu, A. (2010). The behavior in traffic – relations with socio-demographic variables. Anals of the Al.I.Cuza University in press.
Havarneanu, C., Gheorghiu, A., & Hohn, M. (2010). Theoretical validity of the Driver Behaviour Questionnaire. Psihologie sociala - Revista laboratorului de Psihologia Campului Social 25, 137-153.
Ozkan, T., Lajunen, T., Chliaoutakis, J., Parker, D., & Summala, H. (2006). Cross-cultural differences in driving behaviours: A comparison of six countries. Transportation Research Part F: Traffic Psychology and Behaviour, 9(3), 227-242.

701Alexandra Gheorghiu and Corneliu Havârneanu / Procedia - Social and Behavioral Sciences 33 (2012) 697 – 701A.Gheorghiu et.al / Procedia - Social and Behavioral Sciences 00 (2011) 000–000
Ozkan, T., Lajunen, T., & Summala, H. (2006). Driver Behaviour Questionnaire: a follow-up study. Accident; analysis and prevention, 38(2), 386-395.
Reason, J. (1993). L'erreur humaine (J.-M. Hoc, Trans.): Presse Universitaire de France. Reason, J., Manstead, A., Stradling, S., Baxter, J., & Campbell, K. (1990). Errors and violations on the roads: a real distinction?
Ergonomics, 33(10), 1315 - 1332. Traffic Safety Basic Facts 2010 Young People. (2011). Retrieved june 2011 Wilde, G. J. S. (1998). Risk homeostasis theory: an overview. Injury Prevention, 4(2), 89-91. Wundersitz, L. (2007). Characteristics identifying young drivers at a higher risk of crashing. Unpublished Thesis (PhD), The
University of Adelaide.